city of cape town submission on edir
DESCRIPTION
City of Cape Town Submission on EDIR. Challenges, Successes and Proposals 27/07/2012. Content. Background Challenges, Successes (Cape Town) Alternate models Proposals. 1. 2. 4. 3. 7. 8. 5. 10. 6. 11. 12. 9. 15. 14. 16. 13. 17. 18. 19. 20. 23. 26. 22. 25. 27. 28. - PowerPoint PPT PresentationTRANSCRIPT
City of Cape TownSubmission on EDIR
Challenges, Successes and Proposals
27/07/2012

Content
1. Background
2. Challenges, Successes (Cape Town)
3. Alternate models
4. Proposals

1. Background
1
2
3
4
56
789
1011 12
1314
1516
1718
19 2022 23
24 25
26
27 28
2930
31 32 33 3435
36373839
40 41 424344 45 46 47484950
515253
M
54
5556

2. Challenges, Successes
Challenges EDIR was to address
1.Electricity tariffs
2.Ageing networks and capital requirements
3.Ageing skilled workforce
4.Importance/impact on Local Government finances
5.Legislative environment

2.1 Electricity tariffs
Rand difference in bills between equivalent CT and Eskom consumers in CT metro becoming significantIncreasingly serious developmental and societal impacts

2.1 Electricity tariffs
Increasing IBT cross subsidies are unsustainableAbility to cross subsidize within the tariff is limited by customer base.National re-look at level, targeting and source of subsidy within IBT
New alternative technologies undermine ability to cross subsidize
Impact of IBT on resellers leading to pressure on municipalities to take over responsibility for metering end users in, for example, sectional title schemes

2.1 Customer Mix and Subsidies
• Within the tariff Eskom can subsidize residential customers with a relatively small impact on Commercial and Industrial customers.
• For every R1/kWh of subsidy given to Eskom residential customers, C&I customers need to contribute 4.93c/kWh
• For the City, this figure is 67.2c/kWh

2.1 Bulk Subsidy & Surcharge
Cross-subsidy in the municipal bulk tariff (to other Eskom customers)Removal of this cross subsidy in review of municipal tariffs
Eskom’s CT customers don’t pay for street-lightingEskom’s CT customers don’t contribute to City for other services (municipal surcharge)These services are beneficial to EDI and customers – roads, traffic services, fire & emergency servicesMunicipal Surcharge be introduced for Eskom customers
All CT metro customers supplied directly by same distributor

2.1 Comparative impact of 10% surcharge on Eskom’s CT customers
R -
R 200.00
R 400.00
R 600.00
R 800.00
R 1,000.00
R 1,200.00
R 1,400.00
Small Residential Large Residential
City
Eskom
Eskom +10%

R -
R 1,000,000.00
R 2,000,000.00
R 3,000,000.00
R 4,000,000.00
R 5,000,000.00
R 6,000,000.00
Large Commercial/Industrial Very Large Commercial/Industrial
City
Eskom
Eskom +10%
2.1 Comparative impact of 10% surcharge on Eskom’s CT customers

2.2 Ageing networks and capital requirements
National Infrastructure backlog
(R27bn+R2.5bn pa EDIH 2008)
Valuation of assets
Implementation of Enterprise Asset Management (EAM) on SAP Plant Maintenance Module
R100m pa MV switchgear programme
On-going ability to raise and recover capital through ring-fenced Electricity Services and tariffs
Capex requirements determined through EAM

2.2 Ageing networks and capital requirements
Infrastructure investment
Capital requirements for electrification not covered by grant funding
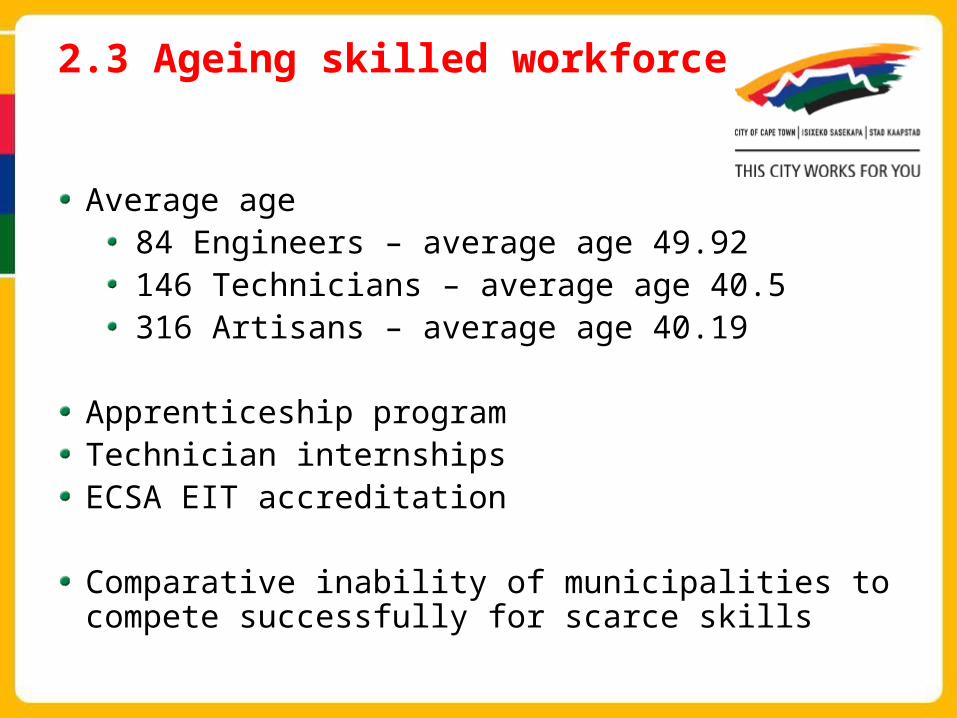
2.3 Ageing skilled workforce
Average age84 Engineers – average age 49.92146 Technicians – average age 40.5316 Artisans – average age 40.19
Apprenticeship programTechnician internshipsECSA EIT accreditation
Comparative inability of municipalities to compete successfully for scarce skills
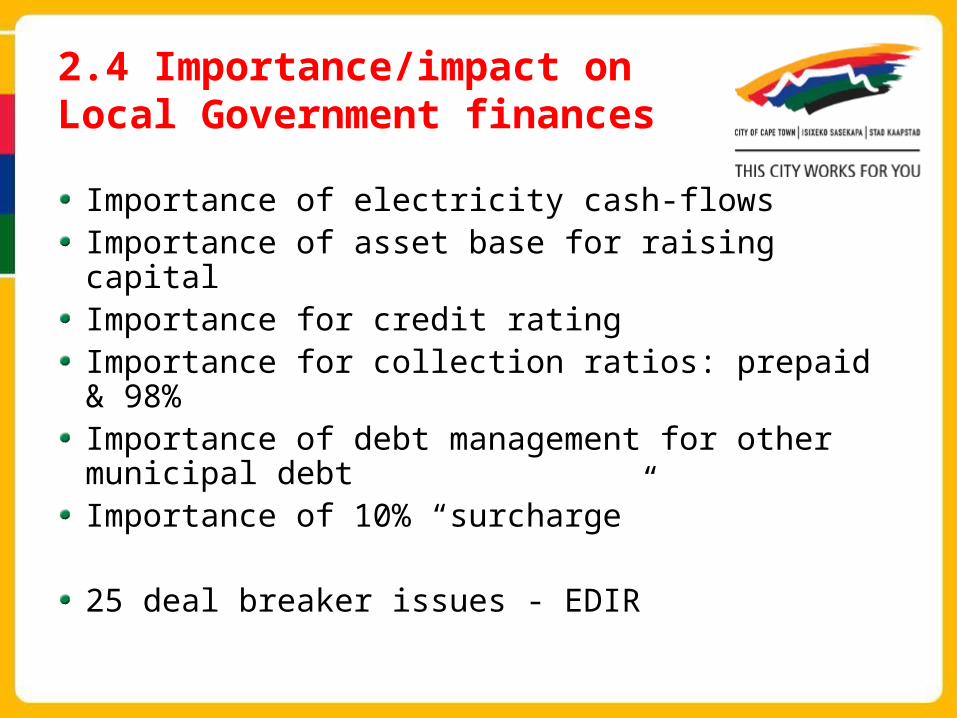
2.4 Importance/impact on Local Government finances
Importance of electricity cash-flowsImportance of asset base for raising capitalImportance for credit ratingImportance for collection ratios: prepaid & 98%Importance of debt management for other municipal debtImportance of 10% “surcharge”
25 deal breaker issues - EDIR

2.5 Legislative environment
Electricity reticulation is an exclusive Local Government power and function (Constitution of SA)
Tariff approval (Nersa vs Council)
Approval timeframes
Eskom has not signed SDA with municipalities
RRM vs NT chart of accounts

3. Alternate EDIR models
Note National Planning Commission model
In current form, Eskom and most metros have best chance for sustainability
Can smaller munic’s be allowed to fail?
Should electricity distribution be excised from all munics except metros?
Should there be consolidation within metro’s?
What about Energy Intensive Users
Constitution of SA

4. Proposals on Way Forward
National re-look at level, targeting and source of subsidyNT, DoE, SALGA, NERSA
Removal of Eskom cross subsidy in review of Eskom bulk tariffs for municipalities
NERSA
Municipal Surcharge be introduced for Eskom customersDPE to compel ESKOM to enter into SDAs with municipalities
NT to introduce norms as per S8.1 of MFPFA.
Consider municipal take over of Eskom distribution in metros.
Capex requirements determined through EAM

Thank you

2.6 Losses & vandalism
Energy used in distributing electricity to end users (technical losses) should be compensated for in tariffsNon technical losses – estimations, metering faults, electricity theftRevenue ProtectionVandalism and infrastructure theftCost of replacement and un-served electricityCopperheads (metro police)

Eskom Acc City Acc % Diff R Diff Eskom Acc City Acc % Diff R DiffSmall Residential 240kWh per month 77.29R 76.65R -1% -0.65R 142.67R 145.89R 2% 3.21R Large Residential 1000kWh per month 330.30R 330.83R 0% 0.53R 1 023.08R 1 262.02R 23% 238.94R Small Commercial 4500kWh per month 1 205.49R 1 597.26R 32% 391.77R 4 174.91R 5 235.78R 25% 1 060.88R
60000kWh per month170kVA per month
350000kWh per month880kVA per month
Very Large Commercial/Industrial 1 165 610.46R 1 163 129.36R 0% -2 481.10R 4 238 383.22R 4 938 205.33R 17% 699 822.12R
2005/06 2012/13
Medium Commercial/Industrial
Large Commercial/Industrial
12 393.66R 17 663.65R 43% 5 269.98R 43 670.38R 60 919.30R
DataCustomer Group
39% 17 248.92R
65 696.92R 89 695.75R 37% 23 998.83R 234 267.48R 309 362.00R 32% 75 094.52R