city of corona - water.ca.gov · city of corona urban water management plan table of contents page...
TRANSCRIPT


City of Corona
URBAN WATER MANAGEMENT PLAN
FINAL
APRIL 2012

City of Corona
Urban Water Management Plan
TABLE OF CONTENTS
Page No.
April 2012 i pw://Carollo/Documents/Client/CA/Corona/8567A00/Deliverables/TOC_LOA (F)
CHAPTER 1 - INTRODUCTION ................................................................................................. 1-1 1.1 PURPOSE ....................................................................................................................... 1-1 1.2 BACKGROUND ............................................................................................................... 1-1
1.2.1 Urban Water Management Planning Act ............................................................. 1-1 1.2.2 Previous Urban Water Management Plan ........................................................... 1-2
1.3 COORDINATION WITH APPROPRIATE AGENCIES .................................................... 1-3 1.4 PUBLIC PARTICIPATION AND PLAN ADOPTION ........................................................ 1-3 1.5 REPORT ORGANIZATION ............................................................................................. 1-5
CHAPTER 2 ‐ SERVICE AREA .................................................................................................. 2-1 2.1 LOCATION ...................................................................................................................... 2-1 2.2 LAND USE ....................................................................................................................... 2-1 2.3 POPULATION.................................................................................................................. 2-4 2.4 CLIMATE ......................................................................................................................... 2-6
CHAPTER 3 - WATER SUPPLY ................................................................................................ 3-1 3.1 SUPPLY OVERVIEW ...................................................................................................... 3-1 3.2 DISTRIBUTION SYSTEM AND STORAGE .................................................................... 3-3 3.3 IMPORTED WATER ........................................................................................................ 3-4 3.4 SURFACE WATER .......................................................................................................... 3-6 3.5 GROUNDWATER ............................................................................................................ 3-6
3.5.1 Bedford Subbasin ................................................................................................ 3-8 3.5.2 Coldwater Subbasin ............................................................................................. 3-8 3.5.3 Temescal Basin ................................................................................................... 3-9 3.5.4 Groundwater Levels and Historical Trends .......................................................... 3-9 3.5.5 Sources of Recharge and Discharge ................................................................. 3-10 3.5.6 Groundwater Pumping ....................................................................................... 3-10 3.5.7 Basin Overdraft .................................................................................................. 3-12
3.6 DESALINATED WATER ................................................................................................ 3-12 3.6.1 Seawater Desalination ....................................................................................... 3-13 3.6.2 Brackish Water and/or Groundwater Desalination ............................................. 3-13
3.7 RECLAIMED WATER .................................................................................................... 3-13
CHAPTER 4 - RECLAIMED WATER ......................................................................................... 4-1 4.1 COLLECTION AND TREATMENT SYSTEMS ................................................................ 4-1 4.2 CURRENT RECLAIMED WATER USES ........................................................................ 4-3 4.3 POTENTIAL USES AND PROJECTED DEMAND .......................................................... 4-4 4.4 INCENTIVES AND PLANNING ....................................................................................... 4-5

Page No.
ii April 2012 pw://Carollo/Documents/Client/CA/Corona/8567A00/Deliverables/TOC_LOA (F)
CHAPTER 5 - WATER DEMAND AND CONSERVATION ........................................................ 5-1 5.1 WATER CONSERVATION .............................................................................................. 5-1
5.1.1 Water Conservation Target Methods per SBx7-7 ................................................ 5-1 5.1.2 City’s Water Conservation Targets ...................................................................... 5-2 5.1.3 Demand Projections with Water Conservation .................................................... 5-5
5.2 PAST, CURRENT, AND PROJECTED WATER USE ..................................................... 5-7 5.2.1 Historical Water Use ............................................................................................ 5-7 5.2.2 Per-Capita Consumption ...................................................................................... 5-8 5.2.3 Projected Water Use ............................................................................................ 5-9
5.3 WATER DELIVERIES ...................................................................................................... 5-9 5.4 NEW DEVELOPMENT PROJECTS .............................................................................. 5-12 5.5 LOW INCOME HOUSING ............................................................................................. 5-13
CHAPTER 6 - BEST MANAGEMENT PRACTICES .................................................................. 6-1 6.1 BEST MANAGEMENT PRACTICES ............................................................................... 6-1
6.1.1 BMP 1 - Water Survey Programs ......................................................................... 6-4 6.1.2 BMP 2 - Residential Plumbing Retrofit ................................................................. 6-4 6.1.3 BMP 3 - System Water Audits, Leak Detection, and Repair ................................ 6-5 6.1.4 BMP 4 - Metering with Commodity Rates for All New Connections and Retrofit of
Existing Connections ........................................................................................... 6-6 6.1.5 BMP 5 - Large Landscape Conservation Programs and Incentives .................... 6-6 6.1.6 BMP 6 - High-Efficiency Washing Machine Rebate Program .............................. 6-7 6.1.7 BMP 7 - Public Information Programs .................................................................. 6-7 6.1.8 BMP 8 - School Education Program .................................................................... 6-9 6.1.9 BMP 9 - Conservation Programs for Commercial, Industrial, and Institutional
Accounts .............................................................................................................. 6-9 6.1.10 BMP 10 - Wholesale Agency Programs ............................................................. 6-10 6.1.11 BMP 11 - Conservation Pricing .......................................................................... 6-11 6.1.12 BMP 12 - Water Conservation Coordinator ....................................................... 6-13 6.1.13 BMP 13 - Water Waste Prohibition .................................................................... 6-13 6.1.14 BMP 14 - Residential Ultra-Low-Flush Toilet Replacement Programs .............. 6-13
6.2 WATER CONSERVATION IMPLEMENTATION PLAN ................................................. 6-13
CHAPTER 7 - WATER RELIABILITY PLANNING ..................................................................... 7-1 7.1 OVERVIEW OF WATER SUPPLY RELIABILITY ............................................................ 7-2
7.1.1 Imported Water Supply Reliability ........................................................................ 7-2 7.1.2 Groundwater Supply Reliability ............................................................................ 7-2 7.1.3 Reclaimed Water Supply Reliability ..................................................................... 7-3
7.2 FUTURE SUPPLY PROJECTS AND PROGRAMS ........................................................ 7-3 7.2.1 Projects Planned by MWDSC .............................................................................. 7-3 7.2.2 Projects Planned by WMWD ................................................................................ 7-4 7.2.3 Projects Planned by the City of Corona ............................................................... 7-5
7.3 FACTORS RESULTING IN INCONSISTENCY OF SUPPLY .......................................... 7-5 7.3.1 Legal …………………………………………………………………………………..7-6 7.3.2 Environmental ...................................................................................................... 7-7 7.3.3 Water Quality ....................................................................................................... 7-7 7.3.4 Climatic ................................................................................................................ 7-7
7.4 SUPPLY RELIABILITY .................................................................................................... 7-7

Page No.
April 2012 iii pw://Carollo/Documents/Client/CA/Corona/8567A00/Deliverables/TOC_LOA (F)
7.4.1 Supply Reliability of Current Sources ................................................................ 7-11 7.4.2 Demand Variations ............................................................................................ 7-12
7.5 SUPPLY AND DEMAND COMPARISON ...................................................................... 7-13 7.5.1 Average Year ..................................................................................................... 7-13 7.5.2 Single Dry Year .................................................................................................. 7-17 7.5.3 Multiple Dry Years .............................................................................................. 7-19
7.6 TRANSFER AND EXCHANGE OPPORTUNITIES ....................................................... 7-23 7.7 WATER QUALITY IMPACTS ON SUPPLY ................................................................... 7-24
7.7.1 Local Groundwater Quality ................................................................................ 7-24 7.7.2 Imported Water Quality ...................................................................................... 7-24
7.8 OPPORTUNITIES FOR DESALINATED WATER ......................................................... 7-25 7.8.1 City of Corona Desalination Opportunities ......................................................... 7-25 7.8.2 Groundwater Desalination ................................................................................. 7-25 7.8.3 Seawater Desalination ....................................................................................... 7-26 7.8.4 MWDSC’s Desalination Program ....................................................................... 7-26
CHAPTER 8 - WATER SHORTAGE CONTINGENCY PLAN .................................................... 8-1 8.1 STAGES OF ACTIONS ................................................................................................... 8-1
8.1.1 Water Shortage Stages and Reduction Objectives .............................................. 8-2 8.2 PROHIBITIONS, CONSUMPTION REDUCTION METHODS, AND PENALTIES .......... 8-3
8.2.1 Mandatory Prohibitions on Water Wasting ........................................................... 8-4 8.2.2 Water Reduction Stage Triggering Mechanisms ................................................. 8-6 8.2.3 Excessive Use Penalties ...................................................................................... 8-7 8.2.4 Review Process ................................................................................................... 8-8
8.3 WATER SHORTAGE CONTINGENCY ORDINANCE/RESOLUTION ............................ 8-8 8.4 REVENUE AND EXPENDITURE IMPACTS/MEASURES TO OVERCOME IMPACTS . 8-9 8.5 ACTIONS DURING A CATASTROPHIC INTERRUPTION ............................................. 8-9 8.6 REDUCTION MEASURING MECHANISM .................................................................... 8-10
LIST OF APPENDICES APPENDIX A – REFERENCES APPENDIX B – PUBLIC REVIEW AND ADOPTION MATERIALS APPENDIX C – URBAN WATER MANAGEMENT PLAN ACT APPENDIX D – GROUNDWATER BASIN INFORMATION APPENDIX E – 2010 WATER QUALITY REPORT APPENDIX F – ORDINANCES AND RESOLUTIONS APPENDIX G – BMP ACTIVITY REPORTS 2005-2010 APPENDIX H – SUPPLY RELIABILITY EQUATIONS

Page No.
iv April 2012 pw://Carollo/Documents/Client/CA/Corona/8567A00/Deliverables/TOC_LOA (F)
LIST OF TABLES Table ES.1 Population Projections ...................................................................................... ES-1 Table ES.2 Demand Projections .......................................................................................... ES-4 Table ES.3 Demand Projections with and without Water Conservation .............................. ES-5 Table 1.1 Coordination with Appropriate Agencies .............................................................. 1-4 Table 2.1 Land Use Categories ........................................................................................... 2-2 Table 2.2 Historic Population ............................................................................................... 2-5 Table 2.3 Population Projections ......................................................................................... 2-5 Table 2.4 Climate Characteristics ........................................................................................ 2-7 Table 3.1 Current and Projected Water Supply ................................................................... 3-3 Table 3.2 Capacity of Imported Water Connections ............................................................ 3-5 Table 3.3 Amount of Groundwater Pumped by the City of Corona .................................... 3-11 Table 3.4 Amount of Groundwater to be Pumped by the City of Corona ........................... 3-11 Table 3.5 Opportunities for Desalinated Water .................................................................. 3-13 Table 4.1 Wastewater Collection and Treatment ................................................................. 4-2 Table 4.2 Water Reclamation Facilities ............................................................................... 4-2 Table 4.3 Disposal of Non-Reclaimed Wastewater ............................................................. 4-3 Table 4.4 2005 UWMP Projected 2010 Reclaimed Water Use Compared to 2010 ............. 4-4 Table 4.5 Reclaimed Water Demand Projections ................................................................ 4-5 Table 4.6 Comparison of Reclaimed and Potable Rates ..................................................... 4-6 Table 5.1 Base Period Ranges ............................................................................................ 5-2 Table 5.2 Base Daily Per Capita Water Use – 10 Year Range ............................................ 5-4 Table 5.3 Base Daily Per Capita Water Use – 5 Year Range .............................................. 5-4 Table 5.4 Demand Projections ............................................................................................. 5-5 Table 5.5 Historical Water Use ............................................................................................ 5-8 Table 5.6 Demand Projections ............................................................................................. 5-9 Table 5.7 Water Demand Projections ................................................................................ 5-10 Table 5.8 Low Income Projected Water Demands ............................................................ 5-14 Table 6.1 BMP Naming Changes ........................................................................................ 6-3 Table 6.2 Demand Management Measures ......................................................................... 6-3 Table 6.3 Single Family Device Distribution ........................................................................ 6-5 Table 6.4 Multi-Family Device Distribution ........................................................................... 6-5 Table 6.5 High-Efficiency Washing Machine Rebates ......................................................... 6-7 Table 6.6 Residential Tiered Rate Structure ...................................................................... 6-11 Table 6.7 Commercial, Industrial, Institutional & Government Rate Structure ................... 6-11 Table 6.8 Reclaimed Rate Structure .................................................................................. 6-12 Table 7.1 MWDSC’s Current and Planned Supply Programs .............................................. 7-4 Table 7.2 Factors Resulting in Inconsistency of Supply ...................................................... 7-6 Table 7.3 Basis of Water Year Data .................................................................................... 7-8 Table 7.4 Supply Reliability – Historical Conditions ........................................................... 7-10 Table 7.5 Supply Reliability – Current Water Sources ....................................................... 7-11 Table 7.6 MWDSC Retail Demands for Average, Single, and Multiple Dry Years ............ 7-12 Table 7.7 City of Corona Projected Average Year Water Demands .................................. 7-13 Table 7.8 MWDSC Projected Average Year Supplies ....................................................... 7-14 Table 7.9 MWDSC Projected Average Year Supply as Percentage of Demand ............... 7-14 Table 7.10 Comparison of Supply and Demands Under a Normal Year ............................. 7-15 Table 7.11 Supply and Demand Comparison – Normal Year .............................................. 7-16 Table 7.12 Comparison of Supply and Demands under a Single Dry Year ......................... 7-17

Page No.
April 2012 v pw://Carollo/Documents/Client/CA/Corona/8567A00/Deliverables/TOC_LOA (F)
Table 7.13 Supply and Demand Comparison – Single Dry Year ......................................... 7-18 Table 7.14 Comparison of Supply and Demands under Multiple Dry Years ........................ 7-19 Table 7.15 Supply and Demand Comparison – Multiple Dry Year No. 1 ............................. 7-20 Table 7.16 Supply and Demand Comparison – Multiple Dry Year No. 2 ............................. 7-21 Table 7.17 Supply and Demand Comparison – Multiple Dry Year No. 3 ............................. 7-22 Table 7.18 Water Transfer and Exchange Opportunities ..................................................... 7-23 Table 7.19 Desalination Opportunities for the City of Corona .............................................. 7-25 Table 7.20 MWDSC Desalination Project Opportunities ...................................................... 7-26 Table 8.2 City Ordinances and Resolutions for Water Shortage Measures ........................ 8-1 Table 8.1 Water Shortage Stages and Reduction Objectives .............................................. 8-3
LIST OF FIGURES Figure ES.1 Historical and Projected Population ............................................................. ES-2 Figure ES.2 2010 Water Supply Breakdown ...................................................................... ES-3 Figure ES.3 Past and Projected Water Use (with conservation) ..................................... ES-5 Figure 2.1 Service Area Map ............................................................................................... 2-3 Figure 2.2 Historical and Projected Population ................................................................ 2-6 Figure 3.1 City Water Supplies for 2010 ............................................................................ 3-2 Figure 3.2 Groundwater Basins Underlying Service Area ............................................... 3-7 Figure 5.1 Historical Consumption .................................................................................... 5-3 Figure 5.2 Projected Water Demands with and without Conservation ........................... 5-6 Figure 5.3 Number of Accounts by Account Type (3-year average) ............................. 5-11 Figure 6.1 Projected Water Demands with and without Conservation ......................... 6-14 Figure 6.2 Water Conservation Methods ......................................................................... 6-15 Figure 7.1 Historical Per-Capita Consumption Variation ................................................. 7-9


April 2012 - a - pw://Carollo/Documents/Client/CA/Corona/8567A00/Deliverables/TOC_LOA (F)
LIST OF ABBREVIATIONS
Abbreviation Description
AB Assembly Bill
ADD
AWWA
Average Day Demand
American Water Works Association
af Acre Feet
AFY Acre Feet per Year
BMP Best Management Practices
BPS Booster Pumping Station
CCWC Corona City Water Company
CDR Center for Demographic Research
CIMIS California Irrigation Management Information System
CLIA
CRA
Certified Landscape Irrigation Auditors
Colorado River Aqueduct
CRWQCB California Regional Water Quality Control Board
DMMs Demand Management Measures
DOF Department of Finance
DPH Department of Public Health
du/ac Dwelling Units per Acre
DWR Department of Water Resources
EPA Environmental Protection Agency
ETo Evapotranspiration
EVMWD Elsinore Valley Municipal Water District
FAR Floor Area Ratio
FY Fiscal Year
gpcd Gallons per Capita per Day
gpm Gallons per Minute
GWMP Groundwater Management Plan
hcf Hundred Cubic Feet
HGL Hydraulic Grade Line
HOA Home Owners’ Association
ICADSP Integrated Chino – Arlington Desalter System Project
IRP Integrated Resource Plan
MAF Million Acre Feet

- b - April 2012 pw://Carollo/Documents/Client/CA/Corona/8567A00/Deliverables/TOC_LOA (F)
LIST OF ABBREVIATIONS
Abbreviation Description
MCL Maximum Contaminant Level
MFR Multi-Family Residential
MG Million Gallons
mgd Million Gallons per Day
mg/l Milligrams per Liter
MOU Memorandum of Understanding
MWDSC Metropolitan Water District of Southern California
NPDES National Pollutant Discharge Elimination System
RUWMP Regional Urban Water Management Plan
RW Recycled Water
RWMP Recycled Water Master Plan
RWQCB Regional Water Quality Control Board
SAWPA Santa Ana Watershed Project Authority
SB Senate Bill
SCAG Southern California Association of Governments
SDP Seawater Desalination Project
SFR Single Family Residential
SOI Sphere of Influence
SWP State Water Project
TDS Total Dissolved Solids
ULF Ultra Low Flush
UWMP Urban Water Management Plan
UWMPA Urban Water Management Planning Act
WCS Water Code Section
WMP Water Master Plan
WMWD Western Municipal Water District
WRF Water Reclamation Facility
WRCC Western Regional Climate Center
WRCOG Western Regional Council of Governments
WSA Water Supply Assessment
WSDM Water Surplus AND Drought Management
WSRP Water Shortage Response Plan

April 2012 - c - pw://Carollo/Documents/Client/CA/Corona/8567A00/Deliverables/TOC_LOA (F)
LIST OF ABBREVIATIONS
Abbreviation Description
WTP Water Treatment Plant

- d - April 2012 pw://Carollo/Documents/Client/CA/Corona/8567A00/Deliverables/TOC_LOA (F)
DWR Table Index
DWR Table DWR Name
Report Table Number
1 Coordination with Appropriate Agencies 1.1 2 Population — Current and Projected 2.3 3 Water Deliveries — Actual, 2005 5.7 4 Water Deliveries — Actual, 2010 5.7 5 Water Deliveries — Projected, 2015 5.7 6 Water Deliveries — Projected, 2020 5.7 7 Water Deliveries — Projected 2025, 2030, and 2035 5.7 8 Low-Income Projected Water Demands Section 5.4 9 Sales to Other Water Agencies Not Applicable
10 Additional Water Uses and Losses 5.7 11 Total Water Use 3.1, 5.6, and 5.712 Retail Agency Demand Projections Provided to Wholesale Suppliers 3.1 13 Base Period Ranges 5.1 14 Base Daily Per Capita Water Use — 10- to 15-Year Range 5.2 15 Base Daily Per Capita Water Use — 5-Year Range 5.3 16 Water Supplies — Current and Projected 3.1 17 Wholesale Supplies — Existing and Planned Sources of Water 3.1 18 Groundwater — Volume Pumped 3.3 19 Groundwater — Volume Projected to Be Pumped 3.4 20 Transfer and Exchange Opportunities 7.18 21 Reclaimed Water — Wastewater Collection and Treatment 4.1 22 Reclaimed Water — Non-Recycled Wastewater Disposal 4.3 23 Reclaimed Water — Potential Future Use 4.5 24 Reclaimed Water — 2005 UWMP Use Projection Compared to
2010 Actual 4.4
25 Methods to Encourage Reclaimed Water Use Section 4.4 26 Future Water Supply Projects Not Applicable 27 Basis of Water Year Data 7.3 28 Supply Reliability — Historic Conditions 7.4 29 Factors Resulting in Inconsistency of Supply 7.2 30 Water Quality — Current and Projected Water Supply Impacts Not Applicable 31 Supply Reliability — Current Water Sources 7.5 32 Supply and Demand Comparison — Normal Year 7.7 – 7.11 33 Supply and Demand Comparison — Single Dry Year 7.12 – 7.13 34 Supply and Demand Comparison — Multiple Dry-Year Events 7.14 – 7.17 35 Water Shortage Contingency — Rationing Stages to Address Water
Supply Shortages 8.1
36 Water Shortage Contingency — Mandatory Prohibitions Section 8.3.1 37 Water Shortage Contingency — Consumption Reduction Methods Section 8.3.1 38 Water Shortage Contingency — Penalties and Charges Section 8.3.3

April 2012 ES-1 pw://Carollo/Documents/Client/CA/Corona/8567A00/Deliverables/ES (F)
Executive Summary
2010 URBAN WATER MANAGEMENT PLAN
This executive summary provides an overview of the content included in the City of Corona’s (City) 2010 Urban Water Management Plan (UWMP). The purpose of the UWMP is to maintain efficient use of urban water supplies, continue to promote conservation programs and policies, ensure that sufficient water supplies are available for future beneficial use, and provide a mechanism for response during drought conditions. This report, which was prepared in compliance with the California Water Code, and as set forth in the guidelines and format established by the Department of Water Resources, constitutes the City's 2010 UWMP.
As required by the Urban Water Management Plan Act (Act), this document has been prepared with the participation of the public and in coordination with appropriate agencies. Specific coordination and participation details are included in Chapter 1.
Since the 2005 UWMP was prepared, several pieces of legislation have amended the Act. While all the applicable legislation is discussed in more detail in Chapter 1, the most notable of these is the 2009 Water Conservation Act (also known as SBx7-7) mandating a per-capita reduction in water consumption of 20 percent by the year 2020.
The City’s service area is located in the northwestern portion of Riverside County and encompasses approximately 39 square miles. Small portions of the City are provided water service directly by Western Municipal Water District (WMWD) and the City also provides water service to the communities of Coronita and El Cerrito.
The City’s land use is primarily residential, with smaller portions of commercial and industrial. The City is approaching build out, with about 9 percent vacant land.
As is expected from nearing build-out conditions, the City’s population growth over the past 5 years has slowed significantly as compared to growth seen in the previous two decades. The City’s 2010 population was just over 150,000. The City’s water service area consists of about 5,000 more people in addition to the City’s population. It is anticipated that the City’s service area population will grow to nearly 165,000 by 2035. The population projections are shown in Table ES.1 and depicted graphically along with historical population in Figure ES.1.
Table ES.1 Population Projections
2010 UWMP Projected Years 2015 2020 2025 2030 2035
City Population 153,335 155,819 158,421 161,370 164,558
Notes: Source: WRCOG Population Projections (RCCDR, 2010)

City of Corona 2010 URBAN WATER MANAGEMENT PLAN
ES-2 April 2012 pw://Carollo/Documents/Client/CA/Corona/8567A00/Deliverables/ES (F)
Figure ES.1 Historical and Projected Population
The City's potable or drinking water system supplies are groundwater and raw and treated imported water. A separate reclaimed water system is available for landscape irrigation and some industrial and dual plumbing uses. Over the past 5 years, just over half of the City’s potable water supplies were pumped from groundwater sources. Imported water accounts for the balance of the City’s potable water supplies. The City also supplies about 9 percent of its overall water from reclaimed water sources.
Figure ES.2 shows the breakdown in supplies for calendar year 2010 after incorporating reclaimed water.
0
20,000
40,000
60,000
80,000
100,000
120,000
140,000
160,000
180,000
1990 1995 2000 2005 2010 2015 2020 2025 2030 2035
Cit
y P
op
ula
tio
n
Year
DOF Historical Population Estimates WRCOG Population Projection

City of Corona 2010 URBAN WATER MANAGEMENT PLAN
April 2012 ES-3 pw://Carollo/Documents/Client/CA/Corona/8567A00/Deliverables/ES (F)
Figure ES.2 2010 Water Supply Breakdown
The City pumps groundwater from the Temescal, Bedford, and Coldwater subbasins. The City’s imported water supplier is Western Municipal Water District (WMWD), a member of Metropolitan Water District of Southern California (MWDSC). MWDSC’s imported water originates from the Colorado River Aqueduct and the State Water Project (SWP) and the City’s geographic location allows it to obtain imported water from both of these sources.
Water demands served by the City are primarily residential, with commercial, industrial, and institutional comprising approximately 21 percent of total usage. As of 2010, the City maintains approximately 41,354 water meters serving about 30,532 acre-feet of potable water annually. As of 2010 the City also maintains 199 reclaimed water meters and delivers approximately 3,300 acre-feet of reclaimed water, with plans to expand the system. The City’s potable per-capita consumption rate for the selected baseline, averaged across all account types, is about 265 gallons per day per person (gpcd). Table ES.2 presents the demand projections through planning year 2035 incorporating potable water conservation associated with the Water Conservation Act of 2009.
Temescal45%
Bedford0%
Coldwater9%
State Water Project
2%
Colorado River35%
Reclaimed Water9%
Imported Water37%
Groundwater53%
ReclaimedWater
9%

City of Corona 2010 URBAN WATER MANAGEMENT PLAN
ES-4 April 2012 pw://Carollo/Documents/Client/CA/Corona/8567A00/Deliverables/ES (F)
Table ES.2 Demand Projections
Year Demand with Conservation
(AFY) Population(1) Per Capita Consumption
(gpcd)
2010 44,331 149,622 265
2015 40,888 153,335 238
2020 36,934 155,819 212
2025 37,551 158,421 212
2030 38,250 161,370 212
2035 39,005 164,558 212
Notes: 1. Population Projections from Table 2.2.
The Water Conservation Act of 2009 requires a per-capita reduction in water demand to a target per-capita demand based on the City’s historic per-capita water demands. Details of this calculation are provided in Chapter 5. The City’s baseline per-capita demand is calculated to be 265 gpcd. The interim target per-capita demand for Year 2015 is 238 gpcd, while the City’s Year 2020 Target is 212 gpcd.
With reductions in per-capita water conservation (associated with the Water Conservation Act of 2009 requirement), it is anticipated that the projected water demands will decrease from 44,331 AFY in 2010 to 39,005 AFY in 2035. The projected water demand with conservation is presented along with historical demands in Figure ES.3.
As shown in Figure ES.3, the years 2008 and 2009 saw dramatic decreases in total consumption, which also significantly reduced the per-capita consumption rate, most likely due to a combination of factors such as weather, the economic downturn, and water conservation efforts by City through implementation of the new reclaimed water system. Based on discussions with City staff it was decided to use the selected baseline per-capita water use (265 gpcd), which represents demand without conservation efforts, rather than the 2009 water consumption (228 gpcd) as a basis for future demand projections, which were calculated by multiplying the projected populations by the per-capita water use. As a result of this more conservative planning assumption, the starting point of the projected demands in 2010 is much higher than the 2009 number.
Note that reclaimed water demands are not included in the demand projections shown in Figure ES.3. Reclaimed water demands will be deducted from gross water usage as potable water offsets. This will be discussed in further detail in Chapter 5.

City of Corona 2010 URBAN WATER MANAGEMENT PLAN
April 2012 ES-5 pw://Carollo/Documents/Client/CA/Corona/8567A00/Deliverables/ES (F)
Figure ES.3 Past and Projected Water Use (with conservation)
For comparison, demand projections with and without the targets associated with the Water Conservation Act of 2009 are shown Table ES.3. Table ES.3 includes projected population based on Western Riverside Council of Governments (WRCOG) integrated growth forecast which is in turn based on the Southern California Association of Governments (SCAG) integrated growth forecast.
Table ES.3 Demand Projections with and without Water Conservation
Year WRCOG
Population(1)
Water Demand (AFY)
Without Conservation With Conservation
2010 149,622 44,331 44,331
2015 153,335 45,431 40,888
2020 155,819 46,167 36,934
2025 158,421 46,938 37,551
2030 161,370 47,812 38,250
2035 164,558 48,757 39,005
Notes: 1. Population Projections from Chapter 2.
0
10,000
20,000
30,000
40,000
50,000
60,000
1990 1995 2000 2005 2010 2015 2020 2025 2030 2035 2040
Ac
re F
ee
t pe
r Y
ea
r
Year
Projections with and without Conservation
Water Demand with Conservation Water Demand without Conservation Historical Use

City of Corona 2010 URBAN WATER MANAGEMENT PLAN
ES-6 April 2012 pw://Carollo/Documents/Client/CA/Corona/8567A00/Deliverables/ES (F)
As listed in Table ES.3, the water conservation requirements of the Water Conservation Act of 2009 reduce the projected water demand for year 2020 from 46,167 AFY to 36,934 AFY, a decrease of 9,233 acre-feet. Note that the offsets associated with the development of the reclaimed water system are anticipated to reduce this difference by 6,873 AFY.
As a member of the California Urban Water Conservation Council (CUWCC) and signatory of its Memorandum of Understanding (MOU), the City realizes the importance of the Best Management Practices (BMPs) to ensure a reliable future water supply. The City is committed to implementing water conservation and water reclamation programs to maximize sustainability in meeting future water needs for its customers.
Two aspects of supply reliability are considered in this UWMP. The first relates to immediate service needs and is primarily a function of the availability and adequacy of the supply facilities. The second aspect is climate-related, and involves the availability of water during mild or severe drought periods. Chapter 7 provides a detailed look at the water supply reliability during drought periods.
Based on the supply and demand comparison presented in Chapter 7, it can be concluded that the City has sufficient supplies available to meet both potable and reclaimed water demands through 2035 under average, single dry year, and multiple dry year conditions.
To respond to potential water supply shortages, the City implemented stages, actions, and prohibitions to be invoked during declared water shortages in Ordinance 2962. This plan is an important document that explains how the City will reduce demands during periods of reduced supply. In addition, the City has also implemented several ordinances and resolutions related to promoting and implementing water conservation within its service area. For example, the City has implemented a water budget based tiered rate structure to penalize excessive usage of water. Details of the Water Shortage Response Plan (WSRP) and the related ordinances and resolutions are provided in Chapter 8.

April 2012 1-1 pw://Carollo/Documents/Client/CA/Corona/8567A00/Deliverables/Ch01 (F)
Chapter 1
INTRODUCTION
1.1 PURPOSE
The California Water Code requires urban water suppliers within the state to prepare and adopt Urban Water Management Plans (UWMPs) for submission to the California Department of Water Resources (DWR). The UWMPs, which must be filed every 5 years, must satisfy the requirements of the Urban Water Management Planning Act (UWMPA) of 1983 including amendments that have been made to the Act. The UWMPA requires urban water suppliers servicing 3,000 or more connections, or supplying more than 3,000 acre-feet (af) of water annually, to prepare an UWMP.
The purpose of the UWMP is to maintain efficient use of urban water supplies, continue to promote conservation programs and policies, ensure that sufficient water supplies are available for future beneficial use, and provide a mechanism for response during drought conditions. This report, which was prepared in compliance with the California Water Code, and as set forth in the guidelines and format established by DWR, constitutes the City of Corona’s (City) 2010 UWMP.
1.2 BACKGROUND
1.2.1 Urban Water Management Planning Act
In 1983, State Assembly Bill (AB) 797 modified the California Water Code Division 6, by creating the UWMPA. Several amendments to the original UWMPA, which were introduced since 1983, have increased the data requirements and planning elements to be included in the 2005 and 2010 UWMPs.
Initial amendments to the UWMPA required that total projected water use be compared to water supply sources over the next 20 years, in 5-year increments. Recent DWR guidelines also suggest projecting through a 25-year planning horizon to maintain a 20-year timeframe until the next UWMP update has been completed and for use in developing Water Supply Assessments.
Other amendments require that UWMPs include provisions for reclaimed water use, demand management measures, and a water shortage contingency plan, set forth therein. Reclaimed water was added in the reporting requirements for water usage and figures prominently in the requirements for evaluation of alternative water supplies, when future projections predict the need for additional water supplies. Each urban water purveyor must coordinate the preparation of the water shortage contingency plan with other urban water purveyors in the area, to the extent practicable. Each water supplier must also describe their water demand management measures that are being implemented, or scheduled for implementation.

City of Corona 2010 URBAN WATER MANAGEMENT PLAN
1-2 April 2012 pw://Carollo/Documents/Client/CA/Corona/8567A00/Deliverables/Ch01 (F)
In addition to the UWMPA and its amendments, there are several other regulations that are related to the content of the UWMP. In summary, the key relevant regulations are:
AB 1420: Requires implementation of demand management measures (DMMs)/best management practices (BMPs) to qualify for water management grants or loans.
AB 1465: Requires water suppliers to describe opportunities related to reclaimed water use and stormwater recapture to offset potable water use.
Amendments Senate Bill (SB) 6101, and SB 2212, which became effective beginning January 1, 2002, require counties and cities to consider information relating to the availability of water to supply new large developments by mandating the preparation of further water supply planning3 and Water Supply Assessments4.
SB 1087: Requires water suppliers to report single family residential (SFR) and multi-family residential (MFR) projected water use for planned lower income units separately.
Amendment SB 3185 requires the UWMP to describe the opportunities for development of desalinated water, including but not limited to, ocean water, brackish water, and groundwater, as long-term supply.
AB 1056 requires urban water suppliers to submit their UWMPs to the California State Library.
SBx7-7: Requires development and use of new methodologies for reporting population growth estimates, base per capita use, and water conservation, and requires meeting the developed water conservation targets in order to qualify for water management grants and loans. This water bill also extended the 2010 UWMP adoption deadline for retail agencies to July 1, 2011.
SB 1478: This bill was signed on September 23, 2010 and extends the 2010 UWMP deadline for wholesale agencies, such as the Metropolitan Water District of Southern California (MWDSC), to July 1, 2011, as SBx7-7 did for retail agencies.
The UWMPA is included for reference in Appendix C.
1.2.2 Previous Urban Water Management Plan
Pursuant to the UWMPA, the City previously prepared an UWMP in 2005, which was approved and adopted by the Corona City Council on November 16, 2005. Following adoption, the 2005 UWMP was submitted to DWR on December 21, 2005. The City
1 Costa, 2001 2 Daucher, 2001 3 Daucher 4 Costa 5 Alpert, 2004 6 Wiggins, 2004

City of Corona 2010 URBAN WATER MANAGEMENT PLAN
April 2012 1-3 pw://Carollo/Documents/Client/CA/Corona/8567A00/Deliverables/Ch01 (F)
previously prepared UWMPs in 1997 and 2000. This 2010 UWMP report serves as an update to the 2005 UWMP.
1.3 COORDINATION WITH APPROPRIATE AGENCIES The UWMPA requires that the UWMP identify the water agency’s coordination with appropriate nearby agencies.10620 (d) (2) Each urban water supplier shall coordinate the preparation of its plan with other appropriate agencies in the area, including other water suppliers that share a common source, water management agencies, and relevant public agencies, to the extent practicable.
While preparing the 2010 UWMP, the City coordinated its efforts with relevant agencies to ensure that the data and issues discussed in the plan are presented accurately. Table 1.1 summarizes how the UWMP preparation was coordinated with relevant agencies in the area.
1.4 PUBLIC PARTICIPATION AND PLAN ADOPTION
The UWMPA requires that the UWMP show the water agency solicited public participation.
10642. Each urban water supplier shall encourage the active involvement of diverse social, cultural, and economic elements of the population within the service area prior to and during the preparation of the plan. Prior to adopting a plan, the urban water supplier shall make the plan available for public inspection and shall hold a public hearing thereon. Prior to the hearing, notice of the time and place of hearing shall be published … After the hearing, the plan shall be adopted as prepared or as modified after the hearing.
In accordance with the UWMPA, the City held a public hearing and adopted the 2010 UWMP on June 15, 2011. A copy of the adopting resolution and resolution of intent to adopt are included in Appendix B. The hearing provided an opportunity for the City’s customers, residents, employees, and diverse socio-economic population to learn and ask questions about the current and future water supply of the City. Required information, per the UWMPA and SBx7-7, was provided at this hearing.
Two successive weeks prior to adoption; a notice of the public hearing was published in the local newspaper, notifying interested parties that the draft 2010 UWMP was available for review (Appendix B). The City will send one copy of its 2010 UWMP to the California DWR and one copy to the California State Library. These documents will be sent within 30 days of adoption. The City will send an electronic copy of its 2010 UWMP to the cities and counties within which it provides water no later than 60 days from filing with the DWR. The City will make their 2010 UWMP available for public review no later than 30 days from filing with the DWR.

1-4 A
pril 2012 pw
://Carollo/D
ocuments/C
lient/CA/C
orona/8567A00/Deliverables/C
h01 (F)
City of C
orona2010
UR
BA
N W
ATER
MA
NA
GEM
ENT P
LAN
Table 1.1 Coordination with Appropriate Agencies
Coordinating Agencies Par
tici
pat
ed in
D
evel
op
ing
th
e P
lan
Co
mm
ente
d
on
th
e D
raft
Att
end
ed
Pu
blic
M
eeti
ng
s
Was
Co
nta
cted
fo
r A
ssis
tan
ce
Was
Sen
t a
C
op
y o
f th
e
Dra
ft P
lan
Was
Sen
t a
N
oti
ce o
f
Inte
nti
on
to
Ad
op
t
No
t In
volv
ed/
No
t In
form
ed
Western MWD
China Basin Water Master
Department of Public Health
Elsinore Valley Municipal Water District
Inland Empire Waterkeeper
Jurupa Community Services District
Lee Lake Water District
County of Orange
Orange County Water District
County of Riverside
Santa Ana Regional Water Quality Control Board
Santa Ana Watershed Project Authority
City of Norco
City of Riverside

City of Corona 2010 URBAN WATER MANAGEMENT PLAN
April 2012 1-5 pw://Carollo/Documents/Client/CA/Corona/8567A00/Deliverables/Ch01 (F)
1.5 REPORT ORGANIZATION
The UWMP contains eight chapters, followed by appendices that provide supporting documentation for the information presented in the report. The chapters are briefly described below:
Executive Summary
Chapter 1 - Introduction. This chapter presents the purpose of this UWMP, describes the efforts of the City to coordinate the preparation of the UWMP with appropriate nearby agencies, and discusses the measures used to solicit public participation in the UWMP.
Chapter 2 - Service Area. This chapter presents a description of the City’s water service area and various aspects of the area served including climate, population, and other demographic factors.
Chapter 3 – Water Sources. This chapter presets a description of the agency’s existing and future water supply sources for the next 25 years. The description of water supplies includes information on the groundwater usage such as water rights, determination if the basin is in overdraft, adjudication decree, and other relevant information.
Chapter 4 – Reclaimed Water. This chapter includes information on the City’s existing reclaimed water system and usage, as well as the projected expansion of reclaimed water use per the most recent Reclaimed Water Master Plan prepared in 2010.
Chapter 5 – Water Use. This chapter presents the quantity of water supplied to the agency’s customers including a breakdown by user classification.
Chapter 6 – Water Conservation. This chapter is broken into two parts:
Part I includes a description of the City’s Best Management Practices (BMPs) for water conservation. This includes programs which are currently implemented or scheduled for implementation.
Part II describes the City’s planned efforts to meet the SBx7-7 water conservation targets.
Chapter 7 – Reliability of Supply. In this chapter, the UWMP addresses the reliability of the agency’s water supplies. This

City of Corona 2010 URBAN WATER MANAGEMENT PLAN
1-6 April 2012 pw://Carollo/Documents/Client/CA/Corona/8567A00/Deliverables/Ch01 (F)
includes supplies that are vulnerable to seasonal or climatic variations. In addition, there is an analysis of supply availability in a single dry year and in multiple dry years.
Chapter 8 – Water Shortage Contingency Plan. This chapter includes an urban water shortage contingency analysis that includes stages of action to be undertaken in the event of water supply shortages; a water shortage contingency ordinance; prohibitions, consumption reduction methods and penalties; an analysis of revenue and expenditure impacts and measures to overcome these impacts; actions to be taken during a catastrophic interruption; and a mechanism for measuring water use reduction.

April 2012 2-1 pw://Carollo/Documents/Client/CA/Corona/8567A00/Deliverables/Ch02 (F)
Chapter 2
SERVICE AREA
The UWMPA requires that the UWMP include a description of the water purveyor’s service area and various aspects of the area served including climate, population, and other demographic factors.
10631. A plan shall be adopted in accordance with this chapter and shall do all of the following:
10631. (a) Describe the service area of the supplier, including current and projected population, climate, and other demographic factors affecting the supplier's water management planning. The projected population estimates shall be based upon data from the state, regional, or local service agency population projections within the service area of the urban water supplier and shall be in 5-year increments to 20 years or as far as data is available.
2.1 LOCATION
The City of Corona’s water service area is located in the northwestern portion of Riverside County (County) and includes the unincorporated communities of El Centro, Coronita, and parts of Temescal Canyon. The City’s water service area encompasses approximately 39 square miles. As shown on Figure 2.1, neighboring cities include Riverside to the northeast and Norco to the north. The eastern portion of the service area is generally bounded by the unincorporated County including the unincorporated community of Home Gardens. The southern and western portions of the service area are bounded by the Cleveland National Forest and other County lands. Prado Flood Control Basin is located adjacent the City’s northwest corner.
The area is divided by several Southern California highways, providing access into the City from all directions. The Riverside Freeway (SR-91) runs east and west and the Corona Freeway (I-15) runs north and south through the City. Major local roads include Lincoln Avenue, Main Street, and Fullerton Avenue in the north-south direction; and Ontario Avenue, Sixth Street and Railroad Street in the east-west direction.
2.2 LAND USE
The City’s land use is primarily residential, with smaller portions of commercial and industrial. The City is mostly built out, with about 9 percent vacant land. The county lands that lie within the water service area are composed primarily of residential and open space. A breakdown of the General Plan land use categories and vacant land is provided in Table 2.1.

City of Corona 2010 URBAN WATER MANAGEMENT PLAN
2-2 April 2012 pw://Carollo/Documents/Client/CA/Corona/8567A00/Deliverables/Ch02 (F)
Table 2.1 Land Use Categories
Land Use
Developed Area
(acres)
Vacant Area(1) (acres)
Total Area
(acres)Percentage
of Total
Residential Estate (ER) 1,472 459 1,931 7.7% Low-Density Residential (LDR) 4,468 155 4,623 18.4% Low-Medium-Density Residential (LMDR) 1,095 0 1,095 4.4% Medium-Density-Residential (MDR) 1,168 20 1,188 4.7% High-Density Residential (HDR) 560 71 631 2.5%
Subtotal - Residential 8,762 706 9,468 37.7% Commercial Office Professional (OP) 111 3 114 0.5% General/Community Commercial (GC) 921 19 940 3.7% Mixed Use (MU1, MU2, MUD) 410 234 644 2.6%
Subtotal - Commercial 1,442 255 1,697 6.8% Industrial Light Industry (LI) 956 191 1,147 4.6% General Industry (GI) 1,434 77 1,511 6.0%
Subtotal - Industrial 2,390 268 2,659 10.6% Open Space and Agricultural Agricultural/Rural Residential (AG) 505 0 505 2.0% Open Space(2) (OS, OS/G, OS/R) 3,163 0 3,163 12.6%
Subtotal - Open Space and Agricultural 3,668 0 3,668 14.6% Other School (S) 453 0 453 1.8% Utility (U) 113 0 113 0.4% Railroad (R/R, RR2) 251 453 704 2.8% Other (FS, I, P, UDR, and blank) 390 2 392 1.6%
Subtotal - Other 1,207 455 1,662 6.6% Not Included in General Plan GIS Layer (Streets)
5,971 0 5,971 23.8%
TOTAL 23,441 1,684 25,125 100.0% Percentage of Total 93% 7%
Notes: Source: City General Plan Land Use and Vacant Land GIS layers (COC, 2010) 1. Vacant Area in each Land Use classification calculated through spatial intersection with City’s Vacant Land
GIS layer. Vacant land outside the City boundary was excluded. 2. While 113 acres of vacant land fell within the OS/G General Plan Land Use designation, this land was
assumed to be fully developed (as non-developed open space would misrepresent the vacant land percentage calculation).
As shown in Table 2.1, residential land use accounts for about half of the City with the balance made up of about 9 percent commercial, 14 percent industrial, 20 percent open space and agricultural, and 9 percent other.

Western MWD
City of Riverside
Lake Mathews
Riverside Fwy
Riverside
Norco
El Cerrito
Home GardensWoodcrest
Cleveland National Forest
Prado FloodControl Basin
Lee Lakes
Orange County Riverside County
San BernardinoCounty
RIMP
AU AV
RIVER RD
S LIN
COLN
AV
RAILROAD ST
E FOOTHIL L PY
FULLERTON AV
TEMESCAL CANYON RD
W SIXTH ST
N MCKINLEY ST
GREEN RIVER RD
W ONTARIO AV
W FOOTHILL PY
N LINC
OLN A
V
N SM
ITH AV
CORYDON ST
E G RA ND BL
E ONTARIO AVN
JOY S
T
RIDGELINE DR
VIA DEL R IO
NORCO HILLS RD
EAG L E GLEN PY
E PARKR I DGE AV
PROMENADE AV
S MAI
N ST
Figure 2.1Location and Service Area Map
2010 Urban Water Management Plan City of Corona
0 1 2 30.5Miles
LegendCity BoundaryBodies of WaterCounty BoundaryFreewayMajor RoadsWater Service Area
FILEN
AME:
pw:\\P
HX-P
OP-P
W.Ca
rollo.
local:
Carol
lo\Do
cume
nts\C
lient\
CA\C
orona
\8567
A00\D
ata\G
IS\Fi
gure_
2_1-S
ervice
_Area
.mxd
DATE
: 6/7/
2011
MWD
Lee Lake
Agencies Providing water Service within City BoundaryCity Provides Water Service Outside City Boundary

City of Corona 2010 URBAN WATER MANAGEMENT PLAN
2-4 April 2012 pw://Carollo/Documents/Client/CA/Corona/8567A00/Deliverables/Ch02 (F)
Note that the Open Space category in Table 2.1 includes both irrigated areas, such as parks, and non-irrigated areas, such as preserved natural open space. As shown in Table 2.1, based on the City boundary, the City’s total area is 25,125 acres.
2.3 POPULATION
As is expected from nearing build-out conditions, the City’s population growth over the past 5 years has slowed significantly as compared to growth seen in the previous two decades. Since the 2005 UWMP, the City’s population has increased by about 5,000 people. For comparison, the City grew by about 20,000 people during the previous 5-year period (between 2000 and 2005). The City’s population is currently estimated at approximately 150,416, as shown along with 20 years of historical data in Table 2.2.
While the City boundary does not coincide exactly with the City service area, analysis of census block population data shows that there is a difference of less than 5 percent between the two areas’ population. Furthermore, little growth is projected to take place in the areas that overlap between the service area and City boundary. For this reason, historical City population figures as well as City population projections are used in place of service area calculations.
The City retails water to some areas outside the City boundary, including Lee Lakes, El Cerrito, and other unincorporated areas of Riverside County. Some areas within the City boundary are served by other water retailers, including the City of Riverside and the retail division of Western Municipal Water District.
Based on discussions with City staff, the population of the City’s water service area is approximately 5,000 greater than the City population. The City’s 1995 Water Master Plan (WMP) estimated the population served outside the City at about 10,000 people, with very little growth estimated since 1989. Based on the 2000 Census, 4,590 of this population is associated with the unincorporated community of El Cerrito. It is estimated that about 5,000 people within the City are served by other water purveyors whose service areas extend into the City boundary.

City of Corona 2010 URBAN WATER MANAGEMENT PLAN
April 2012 2-5 pw://Carollo/Documents/Client/CA/Corona/8567A00/Deliverables/Ch02 (F)
Table 2.2 Historic Population
Year Population(1) Year Population(1)
1990 75,943 2000 124,966
1991 80,913 2001 129,723
1992 86,850 2002 134,694
1993 90,985 2003 138,616
1994 93,232 2004 143,947
1995 96,099 2005 144,603
1996 100,146 2006 145,295
1997 105,743 2007 145,848
1998 112,148 2008 146,620
1999 118,493 2009 148,770
2010 150,416(2)
Notes: Source: California Department of Finance (DOF, 2000), (DOF, 2010). 1. This data is presented graphically on Figure 2.2. 2. The estimated 2010 population based on DOF E-4 population estimates was 150,416. Based on 2010
population projections from WRCOG, the City’s population would be 149,622. For consistency with population projections, the latter will be used for demand projections. Note that the City’s population was estimated as 152,374 in the 2010 Census; however, for consistent implementation of SBx7-7, DWR directs agencies to use data from the 2000 census.
As shown in Table 2.2, the City’s population grew from 75,943 in 1990 to 149,622 in 2010, almost doubling in size with an increase of 98 percent.
As shown in Table 2.3, the significant growth over the last two decades has decreased, with only 3,000 people anticipated to be added between 2010 and 2015 and similar growth thereafter. This reduced growth trend can be seen on Figure 2.2, which graphically depicts the population projections from Table 2.3 along with historical data from Table 2.2.
Table 2.3 Population Projections
2010 UWMP Projected Years 2015 2020 2025 2030 2035
City Population 153,335 155,819 158,421 161,370 164,558
Notes: Source: WRCOG Population Projections (RCCDR, 2010)
Population projections are shown from 2015 to 2035. The projected population for 2035 is 164,558, which is 9 percent higher than the current 2010 service area population of 149,622. This yields an average yearly growth rate of 0.4 percent during the planning period. The UWMP uses the Western Regional Council of Governments (WRCOG) City Population Projection for further data analysis and projections. WRCOG is a sub-region

City of Corona 2010 URBAN WATER MANAGEMENT PLAN
2-6 April 2012 pw://Carollo/Documents/Client/CA/Corona/8567A00/Deliverables/Ch02 (F)
within the Southern California Association of Governments (SCAG). As such, WRCOG uses SCAG population projection data for its estimates.
Figure 2.2 Historical and Projected Population
As shown on Figure 2.2, City population is expected to increase, but more gradually than in the past.
2.4 CLIMATE
The climate in the City is typical of Southern California with generally mild temperatures, minimal days below freezing, and approximately 330 days of sunshine per year. Table 2.4 summarizes the standard monthly average evapotranspiration (ETo) rates, rainfall, and temperature. The City’s average monthly temperature ranges from 48.3 to 78.2 degrees Fahrenheit (degrees F), with an annual average temperature of 63.25 degrees F. The daily extreme low and high temperatures have been measured to be 22 degrees F and 118 degrees F, respectively. ETo averages a total of 56.37 inches per year. The average annual temperature is 63.3 degrees F.
0
20,000
40,000
60,000
80,000
100,000
120,000
140,000
160,000
180,000
1990 1995 2000 2005 2010 2015 2020 2025 2030 2035
Cit
y P
op
ula
tio
n
Year
DOF Historical Population Estimates WRCOG Population Projection

City of Corona 2010 URBAN WATER MANAGEMENT PLAN
April 2012 2-7 pw://Carollo/Documents/Client/CA/Corona/8567A00/Deliverables/Ch02 (F)
Table 2.4 Climate Characteristics
Month
Standard Monthly Average ETo(1)
(inches)
Monthly Average Rainfall(2) (inches)
Monthly Average Temperature(2) (degrees F)
Average Minimum Maximum
January 2.49 2.61 52.5 39.7 65.3
February 2.91 2.62 54. 5 41.2 67.7
March 4.16 2.00 56.7 42.8 70.5
April 5.27 0.98 60.3 45.7 74.9
May 5.94 0.26 64.6 49.9 79.3
June 6.56 0.04 69.6 53.7 85.5
July 7.22 0.02 75.0 57.7 92.3
August 6.92 0.09 75.3 58.3 92.2
September 5.35 0.25 72.4 55.6 89.1
October 4.05 0.55 65.9 50.2 81.6
November 2.94 1.14 58.9 44.3 73.5
December 2.56 2.15 53.6 40.4 66.8
Annual 56.37 12.71 63.3 48.3 78.2
Notes: 1. Source: California Irrigation Management Information System (CIMIS) data recorded between 1985 and 2010
(CIMIS, 2010). 2. Source: Western Regional Climate Center (WRCC) monthly average rainfall and temperature data recorded
between July 1908 and July 1988 (WRCC, 1988).
As shown in Table 2.4, the historical annual average precipitation is approximately 12.71 inches. Records show that the monthly precipitation has been as high as 17 inches and as low as 0 inches. Most of the rainfall occurs during the period of November through April.


April 2012 3-1 pw://Carollo/Documents/Client/CA/Corona/8567A00/Deliverables/Ch03 (F)
Chapter 3
WATER SUPPLY
The UWMPA requires that the UWMP include a description of the agency’s existing and future water supply sources for the next 25 years. This section includes an overview of the City’s supplies along with projections of usage of each source of supply followed by a detailed discussion on each supply source. This detailed discussion includes information on imported water supplies, reclaimed water supplies, groundwater supply facilities, and the groundwater basin, such as water rights, determination of whether the basin is in overdraft, adjudication decree, and other information from the groundwater management plan (as available).
10631. A plan shall be adopted in accordance with this chapter and shall do all of the following:
10631 (b) Identify and quantify, to the extent practicable, the existing and planned sources of water available to the supplier over the same 5-year increments described in subdivision (a) [to 20 years or as far as data is available]. If groundwater is identified as an existing or planned source of water available to the supplier, all of the following information shall be included in the plan:
10631 (b) (1) A copy of any groundwater management plan adopted by the urban water supplier…
10631 (b) (2) A description of any groundwater basin or basins from which the urban water supplier pumps groundwater. For those basins for which a court or board has adjudicated the rights to pump groundwater…For basins that have not been adjudicated, information as to whether the department has identified the basin or basins as overdrafted…
10631 (b) (3) A detailed description and analysis of the location, amount, and sufficiency of groundwater pumped by the urban water supplier for the past 5 years. The description and analysis shall be based on information that is reasonably available, including, but not limited to, historic records.
10631 (b) (4) A detailed description and analysis of the amount and location of groundwater that is projected to be pumped by the urban water supplier. The description and analysis shall be based on information that is reasonably available, including, but not limited to, historic use records.
3.1 SUPPLY OVERVIEW
The City's potable or drinking water system supplies are groundwater and raw and treated imported water. A separate reclaimed water system is available for landscape irrigation and some industrial and dual plumbing uses. The City pumps groundwater from the Temescal, Bedford, and Coldwater subbasins. The City’s imported water supplier is Western Municipal Water District (WMWD), a member of MWDSC. MWDSC’s imported water originates from the Colorado River Aqueduct (CRA) and the State Water Project (SWP).

City of Corona 2010 URBAN WATER MANAGEMENT PLAN
3-2 April 2012 pw://Carollo/Documents/Client/CA/Corona/8567A00/Deliverables/Ch03 (F)
The total supplies for the City over the previous 5 years averaged 41,528 acre-feet per year (AFY), not including reclaimed water. In 2010, 19,218 AF came from groundwater sources (excluding treatment losses) and 13,427 AF from imported water supplies (excluding wheeled supply to Norco). Figure 3.1 shows the breakdown in supplies after incorporating reclaimed water.
Figure 3.1 City Water Supplies for 2010
Between 1990 and 2004, the City’s local groundwater supply met about 40 percent of the overall demand with the remaining 60 percent met by imported water. These numbers vary from year to year depending upon weather conditions and groundwater recharge rates1. Future demand projections assume an even split between groundwater and imported water, as the City has expressed this ratio as a planning goal. This will be supplemented through the use of reclaimed water as well. The anticipated sources for projected future supply are shown in Table 3.1 through the planning horizon of 2035.
1 WMP, 2005a
Temescal45%
Bedford0%
Coldwater9%
State Water Project
2%
Colorado River35%
Reclaimed Water9%
Imported Water37%
Groundwater53%
ReclaimedWater
9%

City of Corona 2010 URBAN WATER MANAGEMENT PLAN
April 2012 3-3 pw://Carollo/Documents/Client/CA/Corona/8567A00/Deliverables/Ch03 (F)
Table 3.1 Current and Projected Water Supply
Supply Source
Annual Supply(1,2) (AFY)
2010(3) 2015 2020 2025 2030 2035
Imported Water (WMWD) 13,427 20,444 18,467 18,775 19,125 19,503
Groundwater 19,218 20,444 18,467 18,775 19,125 19,503
Total Potable 32,645 40,888 36,934 37,551 38,250 39,005
Reclaimed Water 3,308 5,222 6,873 6,873 6,873 6,873
Total 35,953 46,110 43,807 44,423 45,123 45,879
Notes: 1. Based on discussions with City staff and the 2008 GWMP, the City’s supply goal is to maintain a potable
supply mix of 50 percent groundwater and 50 percent imported water. 2. The projected supply is based on projected demands which incorporate required water conservation targets
associated with the Water Conservation Act of 2009. This will be discussed in greater detail in Chapter 5.
3. Historical data is used for 2010. Note that, since water usage was reduced in 2010, for conservative planning purposes water demand projections are not based on 2010 usage. Demand projections will be discussed in further detail in Chapter 5.
The growth in demands associated with the supply projection is discussed in Chapter 5. As shown, groundwater and imported water demand projections remain constant relative to each other, declining in consumption in order to reach the Water Conservation Act of 2009 target for 2020 and then resuming a growth trend due to normal population growth.
3.2 DISTRIBUTION SYSTEM AND STORAGE
The City presently provides municipal water service to nearly 154,627 people through approximately 44,330 domestic service connections to a service area of approximately 39 square miles. This area includes approximately 32 square miles within the City’s municipal area, and 7 square miles within the City’s Sphere Of Influence (SOI) in Riverside County.
Treated imported water from MWDSC is delivered via a single imported water connection to the City’s Mills Transmission Pipeline. Untreated imported water from MWDSC is delivered to the City via three imported water connections on MWDSC’s Lower Feeder, the City’s Lester Water Treatment Plant (WTP), Sierra del Oro WTP, and Green River WTP2.
The City maintains 25 active groundwater wells, 7 supplying the Temescal Desalter, 18 directly supplying the potable water distribution system, and 2 that are inactive.
The City's potable water distribution system consists of 535 miles of pipeline forming six primary pressure zones that serve elevations varying from a low point at 430 feet (Zone 1) in the Green River area to a high point of 1,520 feet (Zone 6) in South Corona. 2 IRWMP, 2008

City of Corona 2010 URBAN WATER MANAGEMENT PLAN
3-4 April 2012 pw://Carollo/Documents/Client/CA/Corona/8567A00/Deliverables/Ch03 (F)
Pressures to City customers vary from about 40 pounds per square inch (psi) to 150 psi. Water is delivered to the various pressure zones by 16 domestic water booster pump stations (BPS)3.
The City operates 16 potable reservoirs ranging in size from 0.5 million gallons (MG) to 6 MG with a total capacity of 43.3 MG. The city operates six blending stations. These stations blend high nitrate Temescal Basin groundwater with high quality imported water and Temescal Desalter product water to lower nitrates and total dissolved solids (TDS). The blended water meets the regulatory standards of the Environmental Protection Agency (EPA) and California Department of Public Health (DPH). The City’s pressure zones are interconnected between reservoirs and supply sources by major transmission mains, ranging in size from 12 inches to 36 inches in diameter, and BPS. Distribution pipelines in the City’s potable water distribution system generally range in size from 2 inches to 12 inches in diameter and are used to distribute water to residential developments and industrial and commercial users.
3.3 IMPORTED WATER
10631 (k). Urban water suppliers that rely upon a wholesale agency for a source of water, shall provide the wholesale agency with water use projections from that agency for that source of water in 5-year increments to 20 years or as far as data is available. The wholesale agency shall provide information to the urban water supplier for inclusion in the urban water supplier’s plan that indentifies and quantifies, to the extent practicable, the existing and planned sources of water as required by subdivision (b), available from the wholesale agency to the urban water supplier over the same 5-year increments, and during various water year types in accordance with subdivision (c). An urban water supplier may rely upon water supply information provided by the wholesale agency in fulfilling the plan information requirements of subdivisions (b) and (c), including, but not limited to, ocean water, brackish water, and groundwater, as a long-term supply.
The City's imported water is supplied by MWDSC and purchased through WMWD, a member agency of MWDSC. The City’s imported water supply consists of treated water supplied via the Mills Pipeline from MWDSC’s Henry J. Mills filtration plant and untreated water via the Lower Feeder.
The Lower Feeder supplies raw imported water to the City's Lester and Sierra del Oro WTPs through metered turnouts WR-19, WR-33, and WR-29, respectively. The Mills Pipeline delivers treated imported water directly to the City through metered turnout WR-244. The Green River WTP is currently inactive, but was connected to the MWD Lower Feeder via WR-29. The capacities of each of the City’s imported water connections are listed in Table 3.2 on the following page.
3 WMP, 2005a 4 IRWMP, 2008

3-5 A
pril 2012pw
://Carollo/D
ocuments/C
lient/CA/C
orona/8567A00/Deliverables/C
h03 (F)
City of C
orona 2010
UR
BA
N W
ATER
MA
NA
GEM
ENT P
LAN
Table 3.2 Capacity of Imported Water Connections
Imported Water Connection Feeder
Feeder Type
Imported Water Source City WTP
Design Capacity(1)
Treatment or Effective Capacity
(mgd) (cfs) (mgd)
WR-19(2) Lower Feeder Raw CRA Lester WTP 25.9 40 30.0
WR-24 Mills Pipeline Treated SWP 6.5 10 6.5(2)
WR-29 3.2 5 0.0(4)
WR-33(5) Lower Feeder Raw CRA SDO WTP 9.7 15 9.0
Total 45.3 70 45.5
Notes: 1. Design Capacities provided by City staff. 2. Connection WR-19 includes two connections, WR-19A and WR-19B, totaling 40 cfs. However, WR-Lester WTP has a firm capacity of 25 mgd and a peak
capacity of 30 mgd, limiting the effective capacity of the connection. 3. City allotted capacity is 10 cfs and City of Norco allotted capacity is 9 cfs, above which an excess flow charge is applied. 4. Connection not currently used since a WTP is not in service. 5. Sierra del Oro WTP has a firm capacity of 6 mgd and a peak capacity of 9 mgd, limiting the effective capacity of the connection.

City of Corona 2010 URBAN WATER MANAGEMENT PLAN
April 2012 3-6 pw://Carollo/Documents/Client/CA/Corona/8567A00/Deliverables/Ch03 (F)
As shown in Table 3.2, the City’s effective imported water capacity is 45.5 mgd, including 6.5 mgd of treated imported water capacity and 39.0 mgd of untreated imported water capacity. As noted in Table 3.2, one of the City’s three treatment plants, the Green River WTP connected to WR-29, is currently inactive.
3.4 SURFACE WATER
The City treats imported water at three water treatment plants (one of which is currently inactive) and treats groundwater at the Temescal Desalter Plant; however, the City does not receive any local surface water sources.
3.5 GROUNDWATER
As discussed in the 2008 Groundwater Management Plan (GWMP) (Appendix D), the City’s service area overlays the Temescal, Bedford, and Coldwater subbasins. The Temescal subbasin is a DWR-defined subbasin of the Upper Santa Ana Valley Groundwater Basin5, bounded on the north by the Chino subbasin and the south by the Elsinore Groundwater Basin. Two additional subbasins underlie the City’s service area – the Bedford and Coldwater subbasins. The GWMP mentions that the Bedford and Coldwater subbasins were historically considered a part of the Elsinore Groundwater Basin, but are not DWR-defined subbasins. Figure 3.2 shows the extents of the Temescal subbasin and the approximate locations of the Bedford and Coldwater subbasins.
The City’s groundwater supplies are pumped from the Temescal, Bedford, and Coldwater subbasins. The City has 25 groundwater wells consisting of 20 wells in the Temescal subbasin (7 of which feed the Temescal Desalter) and 5 wells in the Coldwater subbasin, (2 of which are inactive6).
In the past decade the City has strived to increase the production of local water relative to imported water. In 2000, water from the all of the basins composed 33 percent of total production. Since 2006, this percentage has varied between 53 and 62 percent. As noted in the 2008 GWMP, “Looking forward, Corona would like to maintain an approximate 50 percent groundwater allocation for their water supply by year 2020”7.
The three subbasins from which the City extracts groundwater are not adjudicated, as defined by DWR. Therefore, there are no defined legal pumping rights for the City. While there is no formal legal adjudication of the basins, a memorandum of agreement concerning water production from the Coldwater subbasin went into effect December 1, 2008
5 DWR, 2003 6 GMP, 2008 7 GMP, 2008

COLDWATER(NOT SHOWN)
BEDFORD(NOT SHOWN)
SANTA ANA MOUNTAINS
SANTA ANA RIVER
SANTA ANA NARROWS
LA SIERRA HILLS
EL SOBRANTE HILLS
Riverside
Norco
El Cerrito
Home GardensWoodcrest
Orange County Riverside County
San BernardinoCounty
RIMP
AU AV
RIVER RD
S LIN
COLN
AV
RAILROAD ST
E FOOTHIL L PY
FULLERTON AV
TEMESCAL CANYON RD
W SIXTH ST
N MCKINLEY ST
GREEN RIVER RD
W ONTARIO AV
W FOOTHILL PY
N LINC
OLN A
V
N SM
ITH AV
CORYDON ST
E G RA ND BL
E ONTARIO AV
N JO
Y ST
RIDGELINE DR
VIA DEL RIO
NORCO HILLS RD
EAGL E GLEN PY
E PARKR I DGE AV
PROMENADE AV
S MAIN
ST
TEMESCAL SUBBASIN
CHINO SUBBASIN
RIVERSIDE-ARLINGTONSUBBASIN
ELSINOREBASIN
COASTAL PLAIN OF ORANGE COUNTY
LAKE MATHEWS
Figure 3.2Groundwater Basins
Underlying Service Area2010 Urban Water Management Plan
City of Corona
0 1 2 30.5Miles
LegendGroundwater Basins
CHINOELSINORETEMESCALCOASTAL PLAIN OF ORANGE COUNTYRIVERSIDE-ARLINGTONBodies of WaterFreewayMajor RoadsWater Service Area
FILEN
AME:
pw:\\P
HX-P
OP-P
W.Ca
rollo.
local:
Carol
lo\Do
cume
nts\C
lient\
CA\C
orona
\8567
A00\D
ata\G
IS\Fi
gure_
2_1-S
ervice
_Area
.mxd
DATE
: 5/3/
2011
Groundwater Basin Source: DWR CERES Ground Water Basins (1997)

City of Corona 2010 URBAN WATER MANAGEMENT PLAN
April 2012 3-8 pw://Carollo/Documents/Client/CA/Corona/8567A00/Deliverables/Ch03 (F)
(Appendix D). The agreement arose because a groundwater well (Trilogy Well), constructed by Elsinore Valley Municipal Water District (EVMWD), was not located in accordance with terms of a previous legal agreement established in 1963.
The new agreement ensures that the City and the EVMWD will be allowed to pump sufficient water from the Coldwater subbasin to meet their respective requirements and to maximize the sustainable use of the Coldwater subbasin as a water supply. According to the agreement, an operating committee will annually determine the amount of groundwater that can be safely extracted from the Coldwater subbasin8.
3.5.1 Bedford Subbasin
The Bedford subbasin is located south of the Temescal subbasin in Temescal Canyon between the Santa Ana Mountains and the El Sobrante Hills. The basin covers an area of approximately 10 square miles with an alluvial depth ranging from 30 to 200 feet. Groundwater within the basin tends to flow northwest into the Temescal subbasin.
The City has abandoned one potable well in the Bedford subbasin, Well No. 4, and has two non-potable wells that can be used to supplement reclaimed water from the water reclamation facility (WRF). Between 2007 and 2009, an average of just under 300 afy was supplied by the non-potable wells. The City currently does not use the non-potable wells for a continuous source of supply, but they can supplement the reclaimed water system when necessary. With additional treatment, the City may use the wells as a potable supply source in the future.
Other extractors from the basin have been EVMWD and Foothill Properties. EVMWD extracted 616 AF from four wells in 1993, and Foothill Properties extracted 887 AF from three wells in 1993. According to the 2008 GWMP, the City may plan to re-drill this source for future use9.
3.5.2 Coldwater Subbasin
The City acquired the rights to the surface flows of Coldwater Canyon in 1964 when it purchased the assets of the Corona City Water Company (CCWC). To meet DPH requirements, the surface flow is spread in percolation ponds and extracted by the City’s three Glen Ivy area wells in the Coldwater subbasin.
The Coldwater subbasin is located southwest of the Bedford subbasin and the Temescal Wash. The basin encompasses an area of approximately 2.6 square miles and lies within the structural graben between the Santa Ana Mountains to the west and the El Sobrante Hills to the east. The Coldwater subbasin is bound by the North Glen Ivy Fault to the northeast. The North Glen Ivy Fault behaves as an effective barrier to groundwater flow and
8 DWP, 2009 9 GMP, 2008

City of Corona 2010 URBAN WATER MANAGEMENT PLAN
April 2012 3-9 pw://Carollo/Documents/Client/CA/Corona/8567A00/Deliverables/Ch03 (F)
prevents migration of groundwater from the Coldwater subbasin into the Temescal Wash. Groundwater levels throughout the basin typically respond rapidly to precipitation and recharge because of the high permeability and limited groundwater storage within this basin.
The City and EVMWD are the two major extractors of groundwater from the Coldwater subbasin. The City currently operates three wells in the Coldwater subbasin. Future production from the Coldwater subbasin is projected to remain static through the year 203010.
3.5.3 Temescal Basin
The Temescal subbasin encompasses an area of approximately 26 square miles bound by the Santa Ana River, La Sierra Hills, El Sobrante Hills and the Santa Ana Mountains. Typical depths for the City’s wells in the Temescal subbasin range from 180 to 480 feet. Groundwater quality of these wells typically does not meet the EPA and DPH maximum contaminant levels (MCL) for nitrate (45 mg/L). The shallow basin groundwater typically has levels of nitrates ranging from 4.0 to 110 mg/L, some of which require treatment and/or blending to meet regulatory requirements.
3.5.4 Groundwater Levels and Historical Trends
The groundwater subbasins underlying the City have undergone significant changes since groundwater development began in the early 1900s. Since that time, the groundwater subbasins have supported a variety of uses including extensive agricultural irrigation (especially citrus), industrial demand from mining and citrus packaging, and increasing urban use. Early agricultural activities in the subbasins were supplemented by diversions of surface water imported into the basin. Agricultural reliance on groundwater increased through the 1940s and 1950s, peaking in the early 1960s but continuing into the 1970s. Increasing urban use has replaced most of that early agricultural demand11.
Groundwater pumping has varied over time and by subbasin. In the late 1940s, the total amount of groundwater pumping in the subbasins was about 20,000 AFY. That amount increased to between 25,000 AFY and 32,000 AFY from the late 1950s to the mid-1970s. Total groundwater pumping decreased to below 20,000 AFY in the 1980s and early 1990s due to a decrease in agricultural irrigation, but has increased to about 25,000 AFY in recent years due to municipal pumping. Most of the pumping occurred in Temescal subbasin. Production in Coldwater subbasin has been less than 25 percent in recent years. Bedford subbasin production is relatively minor and currently is only used to supplement the reclaimed water system when necessary.
Total production exceeded 15,000 AFY in Temescal subbasin from 1951 to 1978 in support of agriculture irrigation with peak production occurring from 1959 through 1964. Production 10 WMP, 2005a 11 GMP, 2008

City of Corona 2010 URBAN WATER MANAGEMENT PLAN
3-10 April 2012 pw://Carollo/Documents/Client/CA/Corona/8567A00/Deliverables/Ch03 (F)
declined to below 10,000 AFY by 1979 and averaged about 9,419 AFY over the next 17 years (1979-1996). During this time, agricultural pumping had significantly declined, but municipal pumping had not yet increased. Since 2002, pumping has exceeded 20,000 AFY for the first time since the 1960s peak irrigation totals.
Total production in Coldwater subbasin typically ranges from less than 3,000 AFY to more than 10,000 AFY. Since 1980, production has averaged 7,018 AFY.
Production from Bedford subbasin is significantly less than in Temescal or Coldwater subbasins. Since 1947, Bedford production has ranged from 373 AFY to 4,658 AFY and has declined slightly over time with decreasing agriculture land use12. The City has not supplied its potable water system from the Bedford subbasin since 2000. The City has two non-potable wells which supplement the reclaimed water system from the Bedford subbasin, but currently does not rely upon these for continuous use.
3.5.5 Sources of Recharge and Discharge
The Temescal subbasin receives runoff and recharge from almost 14,000 acres of uplands in the adjacent Santa Ana Mountains. Watersheds contributing runoff from the east are almost as large, but contribute less runoff because of lower elevations and corresponding precipitation.
Temescal Wash is lined through most of the Corona city limits. The only unlined portion in Temescal subbasin is the 1.5-mile area where the wash emerges from Temescal Canyon. This area is characterized by high groundwater, likely the result of infiltration of stream flow and relatively fine-grained surficial deposits. Other than limited infiltration in this narrow section of the subbasin, Temescal Wash does not contribute significant natural recharge to the Temescal subbasin. However, the City operates three WRFs, two of which provide percolation to groundwater in the Temescal subbasin via wastewater discharge ponds. Volume typically ranges between 4,000 and 10,000 AFY13.
Watersheds contributing runoff to Coldwater subbasin and Bedford subbasin cover 9,525 acres and 11,858 acres, respectively, more than three times the area of the subbasin. Although the watershed contributing runoff to Bedford subbasin is more than 2,000 acres larger than the Coldwater watershed, the Coldwater subbasin receives more runoff due to the higher watershed elevations.
3.5.6 Groundwater Pumping
The City’s annual amount of groundwater pumped by subbasin since the 2005 UWMP is presented in Table 3.3.
12 GMP, 2008 13 GMP, 2008

City of Corona 2010 URBAN WATER MANAGEMENT PLAN
April 2012 3-11 pw://Carollo/Documents/Client/CA/Corona/8567A00/Deliverables/Ch03 (F)
Table 3.3 Amount of Groundwater Pumped by the City of Corona
Basin Name
Historical Groundwater Pumped from Basin (AFY)
2006 2007 2008 2009 2010
Temescal Subbasin 21,248 20,093 22,297 20,444 17,664
Bedford Subbasin(1) 151(1) 253(1) 268(1) 326(1) 258(1)
Coldwater Subbasin 3,725 3,517 2,027 3,101 3,131
Total Potable Groundwater Supply(2)
24,973 23,610 24,324 23,545 20,795
% of Total Water Supply(2) 57.3% 53.1% 59.5% 62.1% 54.1% Notes: 1. Supply from Bedford Subbasin is via non-potable wells supplying the reclaimed water system; thus, the
quantity from Bedford Subbasin is not included in the potable water total. 2. Excludes reclaimed water and supply from non-potable wells in Bedford Subbasin.
As shown in Table 3.3, the amount of groundwater pumped in the Temescal and Coldwater subbasins has remained fairly consistent over the last 5 years. As mentioned previously, the City does not plan to rely on non-potable wells in the Bedford subbasin in future years.
Table 3.4 breaks down the groundwater supply projections presented in Table 3.1 by basin.
Table 3.4 Amount of Groundwater to be Pumped by the City of Corona
Basin Name
Annual Groundwater Pumped from Basin(1) (AFY)
2010(3) 2015 2020 2025 2030 2035
Temescal Subbasin(2) 17,664 17,413 15,730 15,992 16,290 16,612
Bedford Subbasin 0 0 0 0 0 0
Coldwater Subbasin 3,131 3,031 2,737 2,783 2,835 2,891
Total 20,795 20,444 18,467 18,775 19,125 19,503Notes: 1. Based on the City’s supply strategy outlined in the GWMP, supply from groundwater sources is anticipated
to be 50 percent of the potable water supply. The supply projections shown here incorporate water conservation targets mandated by the Water Conservation Act of 2009. Treatment losses associated with the Temescal Desalter are not included for future years.
2. As is discussed in Section 3.5.7, the GWMP recommended average pumping of 12,000 AFY in the Temescal Subbasin to prevent overdraft. It is anticipated that the City’s efforts at recharging the Temescal Subbasin will enable the projected groundwater pumping in excess of 12,000 AFY.
3. Historical data is presented for 2010. Note that the 2010 total shown in this table is the total flow extracted from the groundwater basin and is greater than the supply shown in Table 3.1 due to flows associated with CWF 19 and 22 and treatment losses associated with the Temescal Desalter.
As shown in Table 3.4, the amount of groundwater pumped is anticipated to be fairly consistent through the planning horizon. These estimates are based on the ratio of water pumped from each basin from 2006 to 2009. It is anticipated that the pumping beyond the identified subbasin balance, discussed below, will be resolved through groundwater recharge. As was shown in Table 3.1 and further discussed in Chapter 5, demand is projected to decline until 2020 in order to meet state conservation goals, and then resume a growth trend.

City of Corona 2010 URBAN WATER MANAGEMENT PLAN
3-12 April 2012 pw://Carollo/Documents/Client/CA/Corona/8567A00/Deliverables/Ch03 (F)
3.5.7 Basin Overdraft
From 1990 through 2004, Coldwater subbasin experienced overdraft conditions with an estimated loss of about 20,000 AF of groundwater storage over the 15-year period. However, the water balance indicates that conditions were improving at the end of the 1990 to 2004 period because of decreased pumping rates in the subbasin (data provided in the GWMP indicated a slight decline in precipitation over the same period). The City is working with other subbasin pumpers to control overdraft conditions through pumping limitations. The GWMP discusses an evaluation of enhanced recharge in Coldwater subbasin.
The water balance in Temescal subbasin indicates that overdraft conditions occurred in the last 3 years of the 1990 to 2004 period as average pumping increased from about 10,000 AFY to almost 20,000 AFY. Furthermore, the City will continue to rely on the groundwater subbasin for a substantial amount of its water supply. This indicates that control of overdraft conditions through pumping limitations alone may be unrealistic. As such, the City has identified numerous strategies for managing groundwater while maintaining groundwater production.
The GWMP identified water balances that would provide a preliminary assessment for the operational range of the subbasins. The GWMP concluded that, assuming no other significant changes in the water balance, average pumping totals of about 12,000 AFY in Temescal subbasin would result in no significant loss of groundwater storage. For the Coldwater subbasin, the GWMP concluded average pumping totals around 4,500 AFY also indicate no significant loss of groundwater storage14.
3.6 DESALINATED WATER
10631. A plan shall be adopted in accordance with this chapter and shall do all of the following:
10631 (i) Describe the opportunities for development of desalinated water, including, but not limited to, ocean water, brackish water, and groundwater, as a long term supply.
The UWMPA requires that the UWMP address the opportunities for development of desalinated water, including ocean water, brackish water and groundwater. Table 3.5 summarizes the City’s current projects and future opportunities for desalinated water.
14 GMP, 2008

City of Corona 2010 URBAN WATER MANAGEMENT PLAN
April 2012 3-13 pw://Carollo/Documents/Client/CA/Corona/8567A00/Deliverables/Ch03 (F)
Table 3.5 Opportunities for Desalinated Water
Sources of Water Existing Desalinated Water Opportunities for Desalinated Water
Ocean Water None None
Brackish Ocean Water None None
Brackish Groundwater Temescal Desalter ICADSP
Other None None
As summarized in Table 3.5, there is no opportunity for ocean water desalination directly by the City, but the City currently operates a groundwater desalination plant.
3.6.1 Seawater Desalination
At this time it is neither practical nor economically feasible for the City to implement a seawater desalination program. However, the City could provide financial assistance to other purveyors in exchange for water supplies. A discussion of MWDSC’s regional efforts to support desalinated water is included in the Chapter 7 along with the discussion of supply reliability.
3.6.2 Brackish Water and/or Groundwater Desalination
The City currently desalinates groundwater through its Temescal Basin Desalter Treatment Plant/Facility. The City developed its Temescal Desalter to offset demand on MWDSC’s imported water supplies. Construction of the desalter was completed in 2001. The Temescal Desalter is located in the northern part of the City adjacent to the City’s Corporation Yard and according to the City’s 2005 Water Master Plan, has a total rated capacity of 15 mgd. The Temescal Desalter has increased supply reliability, controlled costs, and made better use of scarce resources. The Temescal Desalter serves to reduce nitrate and TDS levels in local groundwater to meet drinking water quality standards (nitrate) and wastewater discharge standard (TDS).
The City has met with the Santa Ana Watershed Project Authority (SAWPA) to investigate participation in the Integrated Chino – Arlington Desalter System Project (ICADSP) to purchase water when the project is implemented. SAWPA estimates that up to 18,000 AFY may be available to participating agencies once the ICADSP is completed.
3.7 RECLAIMED WATER
In 2006, the City began serving reclaimed water to its customers from WRF 3. The City currently provides reclaimed water from two WRFs, WRF 1 and WRF 3. Based on billing records, the reclaimed water distribution system served 199 accounts in 2010, using a total of 3,308 AF. The City’s reclaimed water distribution system currently consists of approximately 40 miles of pipeline with two gravity storage reservoirs, one pumped storage

City of Corona 2010 URBAN WATER MANAGEMENT PLAN
3-14 April 2012 pw://Carollo/Documents/Client/CA/Corona/8567A00/Deliverables/Ch03 (F)
reservoir, four booster pump stations, and two pressure reducing stations15. Additional details about the City’s reclaimed water system can be found in Chapter 4.
15 RWMP, 2010
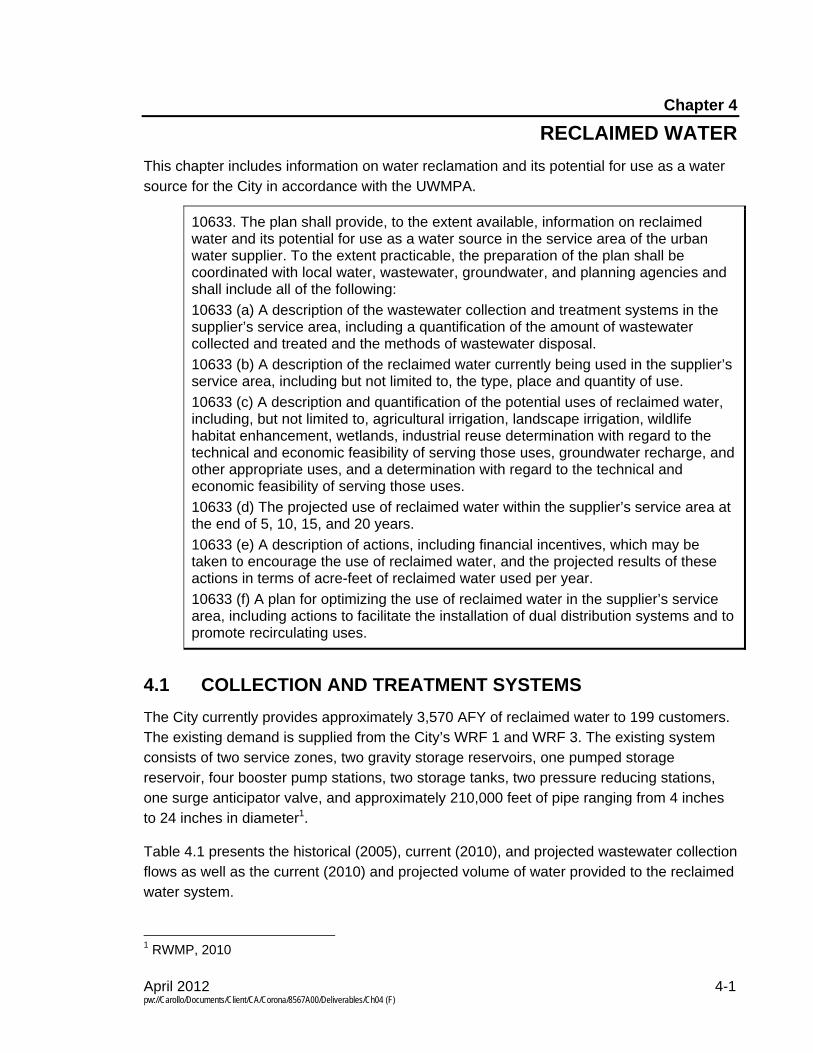
April 2012 4-1 pw://Carollo/Documents/Client/CA/Corona/8567A00/Deliverables/Ch04 (F)
Chapter 4
RECLAIMED WATER
This chapter includes information on water reclamation and its potential for use as a water source for the City in accordance with the UWMPA.
10633. The plan shall provide, to the extent available, information on reclaimed water and its potential for use as a water source in the service area of the urban water supplier. To the extent practicable, the preparation of the plan shall be coordinated with local water, wastewater, groundwater, and planning agencies and shall include all of the following:
10633 (a) A description of the wastewater collection and treatment systems in the supplier’s service area, including a quantification of the amount of wastewater collected and treated and the methods of wastewater disposal.
10633 (b) A description of the reclaimed water currently being used in the supplier’s service area, including but not limited to, the type, place and quantity of use.
10633 (c) A description and quantification of the potential uses of reclaimed water, including, but not limited to, agricultural irrigation, landscape irrigation, wildlife habitat enhancement, wetlands, industrial reuse determination with regard to the technical and economic feasibility of serving those uses, groundwater recharge, and other appropriate uses, and a determination with regard to the technical and economic feasibility of serving those uses.
10633 (d) The projected use of reclaimed water within the supplier’s service area at the end of 5, 10, 15, and 20 years.
10633 (e) A description of actions, including financial incentives, which may be taken to encourage the use of reclaimed water, and the projected results of these actions in terms of acre-feet of reclaimed water used per year.
10633 (f) A plan for optimizing the use of reclaimed water in the supplier’s service area, including actions to facilitate the installation of dual distribution systems and to promote recirculating uses.
4.1 COLLECTION AND TREATMENT SYSTEMS
The City currently provides approximately 3,570 AFY of reclaimed water to 199 customers. The existing demand is supplied from the City’s WRF 1 and WRF 3. The existing system consists of two service zones, two gravity storage reservoirs, one pumped storage reservoir, four booster pump stations, two storage tanks, two pressure reducing stations, one surge anticipator valve, and approximately 210,000 feet of pipe ranging from 4 inches to 24 inches in diameter1.
Table 4.1 presents the historical (2005), current (2010), and projected wastewater collection flows as well as the current (2010) and projected volume of water provided to the reclaimed water system.
1 RWMP, 2010

City of Corona 2010 URBAN WATER MANAGEMENT PLAN
4-2 April 2012 pw://Carollo/Documents/Client/CA/Corona/8567A00/Deliverables/Ch04 (F)
Table 4.1 Wastewater Collection and Treatment
Type of Wastewater 2005(AFY)
2010(AFY)
2015(AFY)
2020(AFY)
2025 (AFY)
2030(AFY)
2035(AFY)
Wastewater collected & treated in service area(1)
13,395 14,315 15,235 16,155 17,075 17,994 18,914Volume that meets reclaimed water standard(2)
65(3) 3,308 5,222 6,873 6,873 6,873 6,873
Notes: 1. Collection and treatment figures were generated by linearly interpolating flow projections for 2003 and 2035
from the SMP2. 2. The 2010 reclaimed water volume is from billing data. Future reclaimed water volume is based on the
anticipated plans for expansion discussed in the 2010 RWMP3. Based on discussions with City staff, it is anticipated that expansion of the reclaimed water system as discussed in the 2010 RWMP will occur by 2020 and further expansion will not be necessary. Note that only the amount of flow projected for use in the reclaimed water system is shown here. Some of the non-reclaimed wastewater discharged to percolation ponds and the Temescal Creek are treated to tertiary treatment standards as will be discussed later.
3. Based on average demand of Butterfield Park. The City supplied Butterfield Park with reclaimed water prior to the rest of the reclaimed water system as a part of a pilot project.
The projections of wastewater flow shown in Table 4.1 are derived from the City’s 2005 Sewer Master Plan4. The projections were generated by linearly interpolating flow projections for 2003 and 2035 from the SMP. The 2010 reclaimed water volume is from the City’s current Reclaimed Water Master Plan (RWMP)5. For 2010, approximately 25 percent of wastewater collected in the City was supplied to the reclaimed water system.
Table 4.2 shows the capacity of the City’s WRFs and provides anticipated future expansion capacities based on the 2010 RWMP.
Table 4.2 Water Reclamation Facilities
Water Reclamation
Facility
Flow (mgd)
Current Plant Capacity
Current Tertiary Filter Rating
Future Plant Capacity
Future Tertiary Filter Rating
1 11.5 9.0 15.5 15.5
2 3.0 - 6.0 3.0
3 1.0 1.0 5.0 5.0
Total 15.5 10.0 26.5 23.6
Notes: 1. The plant capacities and anticipated future plant capacities are from the 2010 RWMP6.
There are currently plans for both tertiary treatment capacity and total treatment capacity to be expanded in the future. While only two of the three WRFs are currently capable of
2 SMP, 2005c 3 RWMP, 2010 4 SMP, 2005c 5 RWMP, 2010 6 RWMP, 2010

City of Corona 2010 URBAN WATER MANAGEMENT PLAN
April 2012 4-3 pw://Carollo/Documents/Client/CA/Corona/8567A00/Deliverables/Ch04 (F)
providing tertiary treatment to wastewater, all three facilities are planned to have a tertiary filter rating in the future.
The City has commissioned a study to examine capital and operational costs for existing and expanded plant capacity. That study will make recommendations as to whether the City should continue to operate three plants or revise expansion plans to operate only two. However, expansion of reclaimed water production would be consistent with that total capacity planned.
Table 4.3 presents the current and projected disposal of non-reclaimed wastewater.
Table 4.3 Disposal of Non-Reclaimed Wastewater
Method of Disposal
Treatment Level
Annual Discharge Flow (AFY)
2010 2015 2020 2025 2030 2035
Percolation Ponds
Secondary 6,225 - - - - -
Percolation Ponds
Tertiary - 8,961 8,961 8,961 8,961 8,961
Temescal Creek
Tertiary 3,063 5,495 5,495 5,495 5,495 5,495
Total 9,288 14,457 14,457 14,457 14,457 14,457
Notes: 1. Data provided by City
As shown in Table 4.3, annual discharge flow for disposal of wastewater is projected to remain relatively constant. This is mostly due to projected increases in reclaimed water use in the City.
Wastewater from City WRFs that is not sent to the reclaimed water distribution system is discharged to percolation ponds. During periods of low irrigation demand, the City’s WRFs discharge tertiary treated water to Temescal Creek.
4.2 CURRENT RECLAIMED WATER USES
The City currently provides reclaimed water for irrigation uses and occasional use for construction waters. Reclaimed water customers include golf courses, parks, landscape maintenance districts, schools, dual plumbing, agriculture, and freeway landscaping.
The City’s existing reclaimed water demands are 3,570 AFY. The City expanded its reclaimed water system significantly, increasing the number of customer accounts to 199 in 2010 since initially constructing its reclaimed water distribution system in 2006.
As is common with reclaimed water systems primarily supplying landscape irrigation demands, the high demand months are typically June through August. The low demand

City of Corona 2010 URBAN WATER MANAGEMENT PLAN
4-4 April 2012 pw://Carollo/Documents/Client/CA/Corona/8567A00/Deliverables/Ch04 (F)
months are typically December through February. Due to the reclaimed water system’s recent expansion, the monthly variation for the past few years is not representative of typical seasonal variation (since many new customers were being brought on-line at different times of the year)7.
Table 4.4 presents a comparison of the 2005 UWMP projected reclaimed water use for 2010, from actual 2010 use.
Table 4.4 2005 UWMP Projected 2010 Reclaimed Water Use Compared to 2010
User Type Treatment Level
Reclaimed Water (AFY)
2010 Projection from 2005 UWMP
2010 Actual Use(1)
Agricultural Tertiary - 59.7
Landscape(2) Tertiary 7,842 3,248.0
Dual Plumbing Tertiary - 0.3
Total 7,842 3,308.0 Notes: 1. Based on 2010 billing records. For the dual plumbing customer, typical annual usage is estimated as
0.5 afy (customer came online part way through 2010). 2. Landscape irrigation for commercial, government, City, and HOA uses are consolidated under landscape
irrigation.
As shown in Table 4.4, in 2010 the City’s reclaimed water system served a total of 3,308 AFY of reclaimed water demands; whereas it had been projected in 2005 that the reclaimed system would provide 7,842 AFY by 2010.
Since the 2005 UWMP, the City completed the 2010 RWMP, which performed a market assessment, quantifying potential reclaimed water demands. The 2010 RWMP provides an existing system demand of 3,570 AFY, which will be used as the existing system demand in this study (for purposes of establishing potable offsets for reclaimed water).
4.3 POTENTIAL USES AND PROJECTED DEMAND
The City undertook a reclaimed water market assessment as a part of its 2010 RWMP to determine future reclaimed water demands and identify areas of the City that could be economically served reclaimed water. Based on the recommendations of the 2010 RWMP, the projected reclaimed water demand is 6,873 AFY. The City anticipates that expansion of the reclaimed water system to serve the potential demand would occur by 2020. The reclaimed water projections are presented in Table 4.5.
7 RWMP, 2010

City of Corona 2010 URBAN WATER MANAGEMENT PLAN
April 2012 4-5 pw://Carollo/Documents/Client/CA/Corona/8567A00/Deliverables/Ch04 (F)
Table 4.5 Reclaimed Water Demand Projections
User Type(1) Treatment
Level
Projected Reclaimed Water Demand(2) (AFY)
2010(3) 2015 2020 2025 2030 2035
Agricultural Tertiary 59.7 60 60 60 60 60
Landscape(4) Tertiary 3,248.0 5,161 6,812 6,812 6,812 6,812
Dual Plumbing Tertiary 0.3 1 1 1 1 1
Total 3,308.0 5,222 6,873 6,873 6,873 6,873Notes: 1. The 2010 RWMP only identified irrigation demands. However, the City currently supplies a dual plumbing
customer and reclaimed water hydrants. Agricultural irrigation was assumed to remain relatively consistent. Dual plumbing was assumed to follow a similar percentage as is currently used. Hydrants are assumed to have negligible demand and are not listed. It is anticipated that cooling water could also be a potential reclaimed water use type; however, since no specific customers were identified, usage is not listed separately in this table.
2. Future reclaimed water volume is based on the anticipated plans for expansion discussed in the 2010 RWMP8. Based on discussions with City staff, it is anticipated that expansion of the reclaimed water system as discussed in the 2010 RWMP will occur by 2020 and further expansion beyond this will not be necessary.
3. Historic demand, not a projection. Reclaimed water demand in 2010 is from billing data. Note that an existing system demand of 3,570 AFY will be used as the existing system demand for establishing potable offsets.
4. Landscape irrigation for commercial, government, City, and HOA uses are consolidated under landscape irrigation.
4.4 INCENTIVES AND PLANNING
The City’s plans for expansion of its reclaimed water system were updated in the 2010 RWMP. Based on the demand projections in the RWMP, the City’s future reclaimed water system is anticipated to provide an average of 6,873 AFY of reclaimed water to 455 customers. This expansion was based on the market assessment described above and reflects customer interest in the supply. The primary incentive provided to future customers is a higher level of reliability of the supply.
Additionally, the reclaimed rate structure offers a fiscal incentive through a less expensive rate per unit compared to the residential outdoor water rate and the commercial, industrial, institutional and government water rate. As shown in Table 4.6, currently reclaimed water is approximately 68 percent of the cost of potable water per unit of the outdoor residential or commercial rate. At higher levels of usage, reclaimed water rates are progressively lower.
8 RWMP, 2010

City of Corona 2010 URBAN WATER MANAGEMENT PLAN
4-6 April 2012 pw://Carollo/Documents/Client/CA/Corona/8567A00/Deliverables/Ch04 (F)
Table 4.6 Comparison of Reclaimed and Potable Rates
Tier Basis of Tier
Potable Commercial
Rate ($/hcf)
Reclaimed Rate
($/hcf)
Percent of Potable Commercial Rate in Same
Tier
Water Budget - $2.04 $1.39 68% Inefficient Tier 1% to 20% over
Water Budget $2.78 $2.08 75%
Excessive Tier 21% to 40% over Water
Budget
$5.56 $2.78 50%
Wasteful Tier Above 40% over Water
Budget
$10.19 $4.16 41%
This pricing structure offers an economic reward for customers who utilize the reclaimed water system.
The 2010 RWMP also outlines further improvements for the tertiary treatment capacity and storage capacity as well as distribution system improvements, including laying an additional 23 miles of pipeline. Two new pump stations are also currently planned, to bring the City’s total number of reclaimed pump stations up to six.

April 2012 5-1 pw://Carollo/Documents/Client/CA/Corona/8567A00/Deliverables/Ch05 (F)
Chapter 5
WATER DEMAND AND CONSERVATION
The UWMPA requires that the UWMP demonstrate that sufficient water supplies will be available to meet the next 25 years of projected water demands.
10608.20. (a) (1) Each urban retail water supplier shall develop urban water use targets and an interim urban water use target by July 1, 2011. Urban retail water suppliers may elect to determine and report progress toward achieving these targets on an individual or regional basis, as provided in subdivision (a) of Section 10608.28, and may determine the targets on a fiscal year or calendar year basis. (2) It is the intent of the Legislature that the urban water use targets described in subdivision (a) cumulatively result in a 20-percent reduction from the baseline daily per capita water use by December 31, 2020
This chapter will discuss the water conservation baseline and targets associated with the Water Conservation Act of 2009. Historical demand data will then be presented, followed by demand projections and a discussion of anticipated development projects.
5.1 WATER CONSERVATION
5.1.1 Water Conservation Target Methods per SBx7-7
The Water Conservation Act of 20091, enacted November 2009, is the new law governing water conservation in California. This law requires that all water suppliers increase water use efficiency with the overall goal to decrease per-capita consumption within the state by 20 percent by 2020. The bill requires that DWR develop certain criteria, methods, and standard reporting forms through a public process that can be used by water suppliers to establish their baseline water use and determine their water conservation goals. DWR provided four different methods to establish water conservation targets. These four methods can be summarized as follows:
Method 1 – Baseline Reduction Method. The 2020 water conservation target of this method is defined as a 20-percent reduction of average per-capita demand during a 10-year continuous baseline period that should end between 2004 and 2010.
Method 2 – Efficiency Standard Method. The 2020 water conservation target of this method is based on calculating efficiency standards for indoor use separately from outdoor use for residential sectors and an overall reduction of 10 percent for commercial, industrial, and institutional (CII) sectors. The aggregated total of the efficiency standards in each area is then used to create a conservation target.
1 SBx7-7

City of Corona 2010 URBAN WATER MANAGEMENT PLAN
5-2 April 2012 pw://Carollo/Documents/Client/CA/Corona/8567A00/Deliverables/Ch05 (F)
Method 3 – Hydrologic Region Method. This method uses the ten regional urban water use targets for the state. Based on the water supplier’s location within one of these regions, a static water use conservation target for both 2015 and 2020 is assigned.
Method 4 – BMP-Based Method. This method uses previous BMPs of a supplier in order to establish a conservation target for 2020. Depending on how aggressively the water supplier has pursued water reduction and conservation in the past, a new conservation target for 2020 will be assigned.
5.1.2 City’s Water Conservation Targets
Method 1 establishes baseline per-capita water consumption in gpcd based on historical population and historical demand. Any 10-year consecutive period between 1995 and 2010 can be selected to establish the baseline per-capita demand for the water supplier using the average per-capita consumption in gpcd from that 10-year period. If an agency uses 10 percent or more reclaimed water in year 2008, the baseline value can also be determined with a 15-year consecutive period between 1990 and 2010. As shown in Table 5.1, the City’s reclaimed water usage was just under the 8 percent criteria in 2008. Thus, the baseline period must be 10 years in length and end between 2004 and 2010.
Table 5.1 Base Period Ranges
Base Parameter Value Units
Water Deliveries 2008 total water deliveries 42,213 AF 2008 total volume of delivered reclaimed water 3,040 AF 2008 reclaimed water as a percent of total deliveries
7 %
10-Year Base Period Number of years in base period 10 years Year beginning base period range 1996 Year ending base period range 2005
5-Year Base Period Number of years in base period 5 years Year beginning base period range 2005 Year ending base period range 2009
The baseline value is then reduced by 20 percent to determine the year 2020 conservation target. The intermediate target for year 2015 is the mid-point value between the baseline and year 2010 target values.
In addition to the 10-year baseline period, a 5-year period needs to be selected in any year ending no earlier than 2007 to determine the minimum required reduction in water use. The selected 10-year and 5-year base period ranges are summarized in Table 5.1.
Table 5.1 shows the characteristics of the 10- and 5-year period selected as the baselines for the City in meeting the Water Conservation Act of 2009.

City of Corona 2010 URBAN WATER MANAGEMENT PLAN
April 2012 5-3 pw://Carollo/Documents/Client/CA/Corona/8567A00/Deliverables/Ch05 (F)
The City’s historical water consumption for the period 1995 through 2010 is shown on Figure 5.1. This figure also depicts the minimum and maximum 10-year baseline values. As shown, the 10-year period with the highest baseline consumption starts in 1996 and ends in 2005.
Figure 5.1 Historical Consumption
As shown on Figure 5.1, although the yearly per-capita demands vary significantly between 1995 and 2009, the high and low averages are relatively close in value. Although more recent per-capita demand values show a decline compared to previous years, the historical baselines are both close to 264 gpcd.
Table 5.2 shows the City population, total volume of consumption, and the per-capita consumption of the selected 10-year baseline period, from 1996 to 2005. The average per-capita consumption during this period was 265 gpcd. Based on Method 1, a 20-percent reduction from this baseline period determines the City’s 2020 conservation target at 212 gpcd.
220
230
240
250
260
270
280
290
1994 1996 1998 2000 2002 2004 2006 2008 2010
Pe
r-C
ap
ita
De
ma
nd
(GP
CD
)
Year
Low GPCD (263) Annual GPCD High GPCD (265)

City of Corona 2010 URBAN WATER MANAGEMENT PLAN
5-4 April 2012 pw://Carollo/Documents/Client/CA/Corona/8567A00/Deliverables/Ch05 (F)
Table 5.2 Base Daily Per Capita Water Use – 10 Year Range
Population Daily System Gross
Water Use (mgd) Annual Daily Per Capita
Water Use (gpcd)
Base Period
Sequence Calendar
Year
Year 1 1996 100,146 27.2 271
Year 2 1997 105,743 29.2 276
Year 3 1998 112,148 27.4 244
Year 4 1999 118,493 28.8 243
Year 5 2000 124,966 34.1 273
Year 6 2001 129,723 33.1 255
Year 7 2002 134,694 38.6 286
Year 8 2003 138,616 38.5 278
Year 9 2004 143,947 38.4 267
Year 10 2005 144,603 36.4 252
Average N/A 125,308 33.2 264.5 Notes: 1. Historic population data are taken from Chapter 2, based on DWR methodology.
Table 5.3 shows the population, total volume of consumption, and the per-capita consumption of a 5-year baseline period. The 5-year baseline value is used to determine the minimum required reduction in water use.
Table 5.3 Base Daily Per Capita Water Use – 5 Year Range
Population Daily System Gross
Water Use (mgd) Annual Daily Per Capita
Water Use (gpcd)
Base Period
Sequence Year
Calendar
Year 1 2003 138,616 38.5 278
Year 2 2004 143,947 38.4 267
Year 3 2005 144,603 36.4 252
Year 4 2006 145,295 38.9 268
Year 5 2007 145,848 39.7 272
Average 143,662 38.4 267.3
As shown in Table 5.3, the average consumption in the period 2003 through 2007 was 267 gpcd. The minimum per-capita consumption for year 2020 is defined as 95 percent of this value, reflecting a minimum water conservation of 5 percent. This equates to a minimum water conservation target of 254 gpcd.
As the water conservation target from the 10-year baseline period (212 gpcd) is lower than the minimum water conservation target (254 gpcd), the City’s water conservation targets are as follows:

City of Corona 2010 URBAN WATER MANAGEMENT PLAN
April 2012 5-5 pw://Carollo/Documents/Client/CA/Corona/8567A00/Deliverables/Ch05 (F)
Year 2015 Target: 238 gpcd (10-percent reduction).
Year 2020 Target: 212 gpcd (20-percent reduction).
5.1.3 Demand Projections with Water Conservation
Table 5.4 presents City demand projections (“Water Demand without Conservation”) based on the baseline per-capita demand of 265 gpcd described in Section 5.1.2 and the population projections discussed in Chapter 2.
Table 5.4 also shows the demand projections incorporating the water conservation targets associated with the Water Conservation Act of 2009 (“Water Demand with 20x2020 Conservation”). This represents the demand the City is required to meet based on the mandated water conservation targets assuming the population growth discussed in Chapter 2.
As discussed in Chapter 4, the City has made significant efforts in development of its reclaimed water (RW) system over the past five years and plans to expand its reclaimed water system over the next decade. Since the demand in the 2010 RWMP consisted of existing potable customers, it is anticipated that the growth in reclaimed water demands will offset potable water demands. In addition, the selected baseline period (1996 through 2005) reflects per-capita demands prior to development of the City’s reclaimed water system. Thus, it is assumed that the entire projected reclaimed water demand be deducted as a potable offset since the baseline per-capita demand does not reflect any reclaimed water usage. The potable offset from reclaimed water is shown in Table 5.4 (“Potable Offsets from RW”) along with the resulting demand projections with the potable offsets deducted (“Water Demand without Conservation with RW Offset”).
Table 5.4 Demand Projections
Year Population(1)
Water Demand without
Conservation (AFY)(2)
Water Demand with
20x2020 Conservation
(AFY)
Potable Offsets
from RW (AFY)(3)
Water Demand without
Conservation with RW Offset
(AFY)(4)
2010 149,622 44,331 44,331 3,570 40,761 2015 153,335 45,431 40,888 5,222 40,209 2020 155,819 46,167 36,934 6,873 39,294 2025 158,421 46,938 37,551 6,873 40,065 2030 161,370 47,812 38,250 6,873 40,939 2035 164,558 48,757 39,005 6,873 41,884 Notes: 1. Population projections are taken from Chapter 2, based on SCAG / WRCOG population projections. 2. Before reclaimed water offsets 3. See Table 4.1 in Chapter 4 4. Water Demand Without Conservation minus Potable Offsets from reclaimed water

City of Corona 2010 URBAN WATER MANAGEMENT PLAN
5-6 April 2012 pw://Carollo/Documents/Client/CA/Corona/8567A00/Deliverables/Ch05 (F)
As shown in Table 5.4, without conservation factored in, the City’s demand is projected to reach almost 50,000 AFY by 2035. However, incorporating water conservation targets reveal that future demand will be lower than this initial estimate. The Water Conservation Act of 2009 requires a 20% reduction from the historic baseline, reducing the projected demand of 46,167 AFY to 36,934 AFY in 2020. Even without conservation efforts, project reclaimed water use will lower potable demand projections to the Demand without Conservation with RW Offset shown above.
Year 2015 serves as an interim point, with projected per-capita consumption between the current usage amount and the 2020 conservation target.
Note that demands shown for year 2010 were based on the same projection as the rest of the demand projection years which reflects historic trends over the last several years. The actual water demand in 2010 was 32,645 af, significantly lower than the projected demand for 2010. Some of this decreased demand is believed to be due to water conservation as well as weather and economic downturn.
Some reduction is already accounted for by the reclaimed water values shown in Table 5.4. In 2020, reclaimed water use is projected to reach 6,873 af, which will reduce potable water demand by the same amount. Further conservation will be necessary however. The following section discusses the various BMPs available for the City’s to achieve this reduction in water use.
Figure 5.2 Projected Water Demands with and without Conservation
0
10,000
20,000
30,000
40,000
50,000
60,000
1990 1995 2000 2005 2010 2015 2020 2025 2030 2035 2040
Ac
re F
ee
t pe
r Y
ea
r
YearWater Demand with Conservation Water Demand without Conservation Historical Use
The 2010 discrepancy due to historic production versus demand projection methodology. Projected 2010 demand values shown for conservative planning purposes

City of Corona 2010 URBAN WATER MANAGEMENT PLAN
April 2012 5-7 pw://Carollo/Documents/Client/CA/Corona/8567A00/Deliverables/Ch05 (F)
5.2 PAST, CURRENT, AND PROJECTED WATER USE
The UWMPA requires that the UWMP identify the quantity of water supplied to the agency’s customers including a breakdown by user classification.
UWMPA:
10631. A plan shall be adopted in accordance with this chapter and shall do all of the following:
10631 (b) (3) A detailed description and analysis of the location, amount, and sufficiency of groundwater pumped by the urban water supplier for the past five years. The description and analysis shall be based on information that is reasonably available, including, but not limited to, historic records.
10631 (e) (1) Quantify, to the extent records are available, past and current water use, over the same 5-year increments described in subdivision (a), and projected water use, identifying the uses among water use sectors including, but not necessarily limited to, all of the- following uses:
(A) Single-family residential; (B) Multi-family; (C) Commercial; (D) Industrial; (E) Institutional and governmental; (F) Landscape; (G) Sales to other agencies; (H) Saline water intrusion barriers, groundwater recharge, or conjunctive use, or any combination thereof; and (I) Agricultural.
(2) The water use projections shall be in the same 5-year increments to 20 years or as far as data is available.
Water demands served by the City are primarily from residential land uses, with commercial, industrial, and institutional uses comprising approximately 19 percent of total usage between 2007 and 2009. As of 2010, the City maintains approximately 41,354 water meters.
5.2.1 Historical Water Use
Water demands (or water use) represent water that leaves the distribution system through metered or unmetered connections or at pipe joints (leaks) or breaks. Water demands occur throughout the distribution system based on the number and type of consumers in each location. Annual historical water demands within the City’s service area between 1994 and 2009 are presented in Table 5.5 along with population and per capita demand.
Water demands shown in Table 5.5 are based on fiscal year consumption figures provided by the City. The annual population was obtained from the California Department of Finance (DOF). It reflects historical population within the City. As discussed in Section 2.3, the water distribution system service area has a population of the approximately 5,000 additional people when compared to the City boundary.

City of Corona 2010 URBAN WATER MANAGEMENT PLAN
5-8 April 2012 pw://Carollo/Documents/Client/CA/Corona/8567A00/Deliverables/Ch05 (F)
Table 5.5 Historical Water Use
Year Demand (AFY) Population(1)
Per Capita Consumption
(gpcd)
1994 25,635 93,232 245
1995 26,402 96,099 245
1996 30,408 100,146 271
1997 32,746 105,743 276
1998 30,662 112,148 244
1999 32,262 118,493 243
2000 38,152 124,966 273
2001 37,084 129,723 255
2002 43,176 134,694 286
2003 43,131 138,616 278
2004 43,011 143,947 267
2005 40,794 144,603 252
2006 43,606 145,295 268
2007 44,460 145,848 272
2008 40,865 146,620 249
2009 37,914 148,770 228
Average 29,515 101,447 260
Notes: 1. Historic population estimates were obtained from the California Department of Finance2,3 for the City.
As shown in Table 5.5, the City’s demands increased over the last 16 years, growing from 25,000 AFY to more than 40,000 AFY, while the population has increased dramatically over the same time period, from about 90,000 to almost 150,000.
5.2.2 Per-Capita Consumption
Per-capita demands are calculated by dividing the total system demands by the City’s population. The resulting number is the average number of gallons consumed, per person, per day for that year. Annual per-capita demands are included in Table 5.5. Over the last 16 years, the per-capita consumption has ranged between 220 and 290 gpcd. As shown, the City’s average per-capita demand over the last 16 years was 260 gpcd.
2 DOF, 2000 3 DOF, 2010

City of Corona 2010 URBAN WATER MANAGEMENT PLAN
April 2012 5-9 pw://Carollo/Documents/Client/CA/Corona/8567A00/Deliverables/Ch05 (F)
5.2.3 Projected Water Use
Demand projections based on estimates of population growth over the next 25 years and the water conservation targets discussed previously are shown in Table 5.6. The per-capita consumption targets are included for reference. Note that 2010 is included as a projection demand. As discussed previously, actual 2010 demand was 32,645 AFY. The projected demand of 44,331 AFY is included in this table for conservative planning purposes.
Table 5.6 Demand Projections
Year
Demand(1)
(AFY) Population(2) With County(3)
(+5,000) Per Capita
Consumption (gpcd)
2010(4) 44,331 149,622 154,622 265
2015 40,888 153,335 158,335 238
2020 36,934 155,819 160,819 212
2025 37,551 158,421 163,421 212
2030 38,250 161,370 166,370 212
2035 39,005 164,558 169,558 212
Notes: 1. Demand projections are based on water conservation targets associated with the Water Conservation Act of
2009. 2. Population projections from discussion in Chapter 2.
3. As discussed in Section 2.3, the water distribution system service area has a population of the approximately 5,000 additional people when compared to the City boundary. This population is associated with unincorporated areas of Riverside County.
4. Demand shown for 2010 is a projected demand based on the baseline per-capita usage, and does not reflect historical usage in 2010.
As shown in Table 5.6, the City’s demands are anticipated to decrease in years 2015 and 2020 as the City meets the required water demand targets associated with the Water Conservation Act of 2009. Over this time, the mandated reduction in demand outpaces the growth of population. After 2020, it is assumed that the per-capita demand will remain consistent with the water conservation target, and overall demand will increase with population growth.
5.3 WATER DELIVERIES
The City classifies meters within its potable water distribution system into the following categories: single-family residential (SFR), multi-family residential (MFR), commercial, industrial, institutional, landscape, and reclaimed water. The current and projected water deliveries from Table 5.6 broken down by sector are presented in Table 5.7. Historical demand from 2005 is also included in Table 5.7 for comparison.

5-10 A
pril 2012 pw
://Carollo/D
ocuments/C
lient/CA/C
orona/8567A00/Deliverables/C
h05 (F)
City of C
orona 2010
UR
BA
N W
ATER
MA
NA
GEM
ENT P
LAN
Table 5.7 Water Demand Projections
Use
2005 2010 2015 2020 2025 2030 2035
# o
f ac
cou
nts
(1)
Dem
and
(A
FY
)
# o
f ac
cou
nts
(1)
Dem
and
(2) (A
FY
)
# o
f ac
cou
nts
(1)
Dem
and
(A
FY
)
# o
f ac
cou
nts
(1)
Dem
and
(A
FY
)
# o
f ac
cou
nts
(1)
Dem
and
(A
FY
)
# o
f ac
cou
nts
(1)
Dem
and
(A
FY
)
# o
f ac
cou
nts
(1)
Dem
and
(A
FY
)
SFR 32,822 24,127 35,014 26,219 36,553 24,183 37,145 21,844 37,766 22,209 38,469 22,622 39,229 23,069
MFR 1,693 2,858 1,806 3,105 1,886 2,864 1,916 2,587 1,948 2,630 1,984 2,679 2,024 2,732
Commercial 2,066 3,863 2,204 4,198 2,301 3,872 2,338 3,498 2,377 3,556 2,421 3,622 2,469 3,694
Industrial 929 1,493 991 1,622 1,035 1,496 1,052 1,351 1,069 1,374 1,089 1,399 1,111 1,427
Institutional 190 2,540 202 2,760 211 2,546 215 2,300 218 2,338 222 2,382 227 2,429
Landscape 879 3,843 937 4,177 978 3,852 994 3,480 1,011 3,538 1,030 3,604 1,050 3,675
Agricultural(3) 0 31 0 33 0 31 0 28 0 28 0 29 0 29
Other – Water Loss (5%)(4) 2,040 2,217 2,044 1,847 1,878 1,912 1,950
Total 38,579 40,794 41,155 44,331 42,964 40,888 43,660 36,934 44,389 37,551 45,215 38,250 46,109 39,005Notes: 1. Total number of accounts shown is tied to population for each projected year. Account type data based on customer type breakdown from 2010. 2. Demand shown for 2010 is a projected demand based on the baseline per-capita usage, and does not reflect historical usage in 2010. 3. Agricultural accounts totaled zero in 2010, as these accounts are being transitioned to reclaimed accounts. Average agricultural demand from 2007-2009
extended into the future for conservative planning purposes. 4. Water loss represents the unmetered water amount (production – consumption) which is assumed to be 5 percent.

City of Corona 2010 URBAN WATER MANAGEMENT PLAN
April 2012 5-11 pw://Carollo/Documents/Client/CA/Corona/8567A00/Deliverables/Ch05 (F)
Reclaimed water offsets are not included in conservation projections used in Table 5.7. See the discussion in Section 5.1.3 for more details on reclaimed water offsets and the projected demands.
The City does not have any unmetered accounts and is planning to continue installing meters for all future accounts. Water losses within the City’s distribution system are estimated at 5 percent (based on historical data) and listed as unmetered deliveries.
While the City does not wholesale water to other agencies, the City of Norco obtains wholesale water from WMWD which is wheeled through the City’s potable water distribution system. This amount is not included in City demands.
As shown in Table 5.7, projected water usage is slated to decrease in order to meet 2020 conservation targets. The decrease in demand is a product of projections which take future conservation goals into account. While projected demands are calculated to decrease in order to meet conservation goals, projected account numbers are tied to population growth. Accounts are therefore projected to continue increasing at a normal rate along with population growth despite the drop in demand. It is important to note that this assumption implies that future water consumption will be due to a decrease in usage per account, rather than a system wide reduction of total accounts.
The breakdown of the number of accounts by account type for the year 2010 is depicted graphically on Figure 5.3.
Figure 5.3 Number of Accounts by Account Type (3-year average)
As shown on Figure 5.3, residential uses comprise the majority of accounts, with single family residential representing 85 percent and multi-family representing 4 percent of total account distribution. Landscape comprises 2 percent of the City’s accounts, commercial
Single Family Residential
85%
Multi‐Family Residential
4%Commercial
5%
Industrial3%
Institutional1%
Landscape2%

City of Corona 2010 URBAN WATER MANAGEMENT PLAN
5-12 April 2012 pw://Carollo/Documents/Client/CA/Corona/8567A00/Deliverables/Ch05 (F)
comprises 5 percent, while institutional and industrial are 1 percent and 3 percent, respectively. Agriculture comprises less than 1 percent of total accounts. These percentages were used to project the number of accounts by type shown in Table 5.7. The total number of accounts for each projected year was determined by using the average account-to-demand ratio for the average of years 2007, 2008, and 2009. This ratio was applied to non-conservation water demand for all projected years.
5.4 NEW DEVELOPMENT PROJECTS
The UWMPA requires that the UWMP identify future major developments within the agency’s service area that would require water supply planning.
10910. (a) Any city or county that determines that a project, as defined in Section 10912, is subject to the California Environmental Quality Act (Division 13 (commencing with Section 21000) of the Public Resources Code) under Section 21080 of the Public Resources Code shall comply with this part.
10912. For the purpose of this part, the following terms have the following meanings:
10912 (a) “Project” means any of the following:
(1) A proposed residential development of more than 500 dwelling units. (2) A proposed shopping center or business establishment employing more than
1,000 persons or having more than 500,000 square feet of floor space. (3) A proposed commercial office building employing more than 1,000 persons or
having more than 250,000 square feet of floor space. (4) A proposed hotel or motel, or both, having more than 500 rooms. (5) A proposed industrial, manufacturing or processing plant, or industrial park
planned to house more than 1,000 persons, occupying more than 40 acres of land, or having more than 650,000 square feet of floor area.
(6) A mixed-use project that includes one or more of the projects specified in this subdivision.
(7) A project that would demand an amount of water equivalent to, or greater than, the amount of water required by a 500 dwelling unit project.
City staff identified the Arantine Hills as the major development planned within its service area.
The Arantine Hills Specific Plan is entirely located within the City water supply service area. A Water Supply Assessment (WSA) for the Arantine Hills Specific Plan was prepared in September 20104. The City would serve water to the proposed local and master planned facilities. The water distribution systems would be designed to satisfy the water requirements for residential, commercial, recreational, landscaping and fire-fighting purposes associated with the development.
4 WSA, 2010

City of Corona 2010 URBAN WATER MANAGEMENT PLAN
April 2012 5-13 pw://Carollo/Documents/Client/CA/Corona/8567A00/Deliverables/Ch05 (F)
The proposed project would create a master-planned community that includes a balanced residential, commercial and mixed-use development, as well as open space/recreation uses. The project entails approximately 130 acres of residential development providing 1,621 detached and attached single-family homes and multi-family dwellings, 38 acres of general commercial land uses, 39 acres of mixed-use development with a total of 451 mixed-use residential units, 37 acres of open space, and 15 acres of park land. The proposed project would integrate these land uses through construction of public and private streets and pedestrian/bike trail circulation system. The proposed project has a water demand of approximately 709 AFY. According to the WSA, the development will include 35 acres of high-density residential housing with an estimated 621 high-density dwelling units.
To reduce the proposed project’s demand for potable water, an extension of the existing reclaimed water distribution system in the neighboring Eagle Glen development would provide reclaimed water for landscape irrigation in street rights-of-way, open space, slopes and parks, street parkways, entry monuments, fuel modification areas, as well as in commercial and industrial areas within the project. The City will have more than sufficient supplies of reclaimed water to meet the anticipated needs of the proposed project, a maximum demand of 294 AFY for all exterior irrigation.
5.5 LOW INCOME HOUSING
The UWMPA requires that the UWMP identify low income housing developments within the agency’s service area and develop demand projections for those units.
10631.1(a). The water use projections required by Section 10631 shall include projected water use for single-family and multifamily residential housing needed for lower income households, as defined in Section 50079.5 of the Health and Safety Code, as identified in the housing element of any city, county, or city and county in the service area of the supplier
The Housing Element of the City’s General Plan provides information on Regional Housing Needs Allocation Progress (RHNA). This element of the update contains plans to construct low and very low income housing units by 2014. A total of 1,379 of these low income dwelling units are in construction or remain to be built before the 2014 deadline.
As shown in Table 5.8, assuming the 1,379 dwelling units reflect the SCAG defined average of 3.19 people per dwelling unit, the projected 2020 per capita water usage of 212 gpcd, would result in a total of 1,045 AFY of low income housing water consumption in the year 2020. Using the interim target of 238 gpcd, the 2015 low income housing water consumption would be 1,173 AFY.

City of Corona 2010 URBAN WATER MANAGEMENT PLAN
5-14 April 2012 pw://Carollo/Documents/Client/CA/Corona/8567A00/Deliverables/Ch05 (F)
Table 5.8 Low Income Projected Water Demands
Demand (AFY)
2015 2020 2025 2030 2035
Low Income Housing 1,173 1,045 1,045 1,045 1,045 Notes: (1) Based on planned low income housing development as described in the City’s General Plan. The General
Plan projects housing needs through 2014.

April 2012 6-1 pw://Carollo/Documents/Client/CA/Corona/8567A00/Deliverables/Ch06 (F)
Chapter 6
BEST MANAGEMENT PRACTICES
6.1 BEST MANAGEMENT PRACTICES
The City is a signatory to the Memorandum of Understanding (MOU) regarding urban water conservation in California and is, therefore, a member of the California Urban Water Conservation Council (CUWCC). The City became a signatory to the MOU on March 3, 1996 and submits bi-annual reports to the CUWCC outlining progress towards implementing the 14 BMPs in the MOU. BMPs are conservation practices that have been identified by the CUWCC: conferences, BMP workshops, free publications, research regarding water management practices, leadership on water legislation and networking with other agencies and special interest groups, for example.
The City has, in good faith, tried to address and comply with all of the BMP targets listed in the CUWCC MOU except BMP Number 10, which applies only to wholesale agencies and is not reported in this plan.
BMP signatories can submit their most recent BMP Report with their UWMP to address the urban water conservation issues in the UWMPA. The City’s BMP Reports for 2005 through 2010 are included in Appendix G.
As a member of CUWCC and signatory of its MOU, the City realizes the importance of the BMPs to ensure a reliable future water supply. The City is committed to implementing water conservation and water reclamation programs to maximize sustainability in meeting future water needs for its customers.
Corona’s previous UWMP provided information regarding the City’s conservation measures already in place and those that would improve the efficiency of water use within the City.

City of Corona 2010 URBAN WATER MANAGEMENT PLAN
6-2 April 2012 pw://Carollo/Documents/Client/CA/Corona/8567A00/Deliverables/Ch06 (F)
UWMPA:
10631 (f) Provide a description of the supplier’s water demand management measures. This description shall include all of the following: (1) A description of each water demand management measure that is currently
being implemented, or scheduled for implementation, including the steps necessary to implement any proposed measures, including, but not limited to, all of the following: (A) Water survey programs for single-family residential and multifamily
residential customers. (B) Residential plumbing retrofit. (C) System water audits, leak detection, and repair. (D) Metering with commodity rates for all new connections and retrofit of
existing connections. (E) Large landscape conservation programs and incentives. (F) High-efficiency washing machine rebate programs. (G) Public information programs. (H) School education programs. (I) Conservation programs for commercial, industrial, and institutional
accounts. (J) Wholesale agency programs. (K) Conservation pricing. (L) Water conservation coordinator. (M) Water waste prohibitions. (N) Residential ultra-low-flush toilet replacement programs.

City of Corona 2010 URBAN WATER MANAGEMENT PLAN
April 2012 6-3 pw://Carollo/Documents/Client/CA/Corona/8567A00/Deliverables/Ch06 (F)
Table 6.1 BMP Naming Changes
Old BMP Number and Name New BMP Category
BMP 1 - Water Survey Programs Programmatic: Residential BMP 2 - Residential Plumbing Retrofit Programmatic: Residential BMP 3 - Water System Audits Foundational: Utility Operations – Water
Loss Control BMP 4 - Metering with Commodity Rates Foundational: Utility Operations – Metering
BMP 5 - Landscape Irrigation Programs Programmatic: Landscape
BMP 6 - Washing Machine Rebate Program Programmatic: Residential
BMP 7 - Public Information Program Foundational: Education – Public Information Program
BMP 8 - School Education Program Foundational: Education – School Education Programs
BMP 9 - Commercial, Industrial, and Institutional Conservation Programs
Programmatic: Commercial, Industrial, and Institutional
BMP 10 - Wholesale Agency Programs Foundational: Utility Operations – Operations
BMP 11 - Conservation Pricing Foundational: Utility Operations – Pricing
BMP 12 - Water Conservation Coordinator Foundational: Utility Operations – Operations
BMP 13 - Water Waste Prohibition Foundational: Utility Operations – Operations
BMP 14 - Ultra-Low-Flush Toilet Replacement Programmatic: Residential Table 6.2 Demand Management Measures
Demand Management Measure ImplementedPlanned for
ImplementationNot
Applicable
BMP 1 - Water Survey Programs
BMP 2 - Residential Plumbing Retrofit
BMP 3 - Water System Audits
BMP 4 - Metering with Commodity Rates
BMP 5 - Landscape Irrigation Programs
BMP 6 - Washing Machine Rebate Program
BMP 7 - Public Information Program
BMP 8 - School Education Program
BMP 9 - Commercial, Industrial, and Institutional Conservation Programs
BMP 10 - Wholesale Agency Programs
BMP 11 - Conservation Pricing
BMP 12 - Water Conservation Coordinator
BMP 13 - Water Waste Prohibition
BMP 14 - Ultra-Low-Flush Toilet Replacement

City of Corona 2010 URBAN WATER MANAGEMENT PLAN
6-4 April 2012 pw://Carollo/Documents/Client/CA/Corona/8567A00/Deliverables/Ch06 (F)
6.1.1 BMP 1 - Water Survey Programs
This program consists of offering water audits to single-family and multi-family residential customers. The City has conducted over 3,000 residential audits since 2009, and is currently on track to meet this BMP. The service is advertised online, at community events, in bill stuffers, and in newsletters. Audits include reviewing water usage history with the customer, identifying leaks inside and outside the home, and recommending improvements.
Upon request, one of the City’s two full time Certified Landscape Irrigation Auditors (CLIA) will perform on-site inspection of residences, landscapes, and businesses for potential leaks. During the check-up, the technician provides the customer with a graph that shows the customer’s water use history for the past year, along with the water budget. The technician checks the water meter for leaks, confirms (upon request) that the estimated landscape area used to calculate the water budget is accurate, reviews the controller settings, and operates the irrigation controller to check the irrigation system for broken sprinklers and coverage issues. The technician makes minor adjustments to align sprinkler heads, provides the customer with recommendations or repairs that are required, and sets the irrigation controller. Technicians also perform minor repairs for the irrigation system during follow-up visits, such as replacing irrigation valves. In addition, the technician provides customers with a list of rebates that are available for water efficient devices, and offers free water saving devices to customers, including toilet dye tabs, bucket and sponges, 5-minute shower timers, hose nozzles, kitchen and bathroom faucet aerators, and low-flow showerheads. Technicians provide customers with a written document containing recommendations for improvements. The check-up appointment provides the opportunity to educate customers about the importance of using water efficiently.
6.1.2 BMP 2 - Residential Plumbing Retrofit
This program consists of distributing physical devices to reduce the amount of water used or to limit the amount of water that can be served to the customer. In accordance with State law, low-flow fixtures have been required on all new construction since 1978. In addition, State legislation enacted in 1990 requires all new buildings after January 1, 1992 to install Ultra-Low-Flush Toilets (ULFT). The City of Corona began their Residential Plumbing Retrofit program in 1998, and markets the program through quarterly newsletters mailed in utility bills, bill stuffers, public education events, the City’s website, and the City’s e-newsletter, the InnerCircle.
Several studies suggest that water use savings resulting from miscellaneous interior retrofit fixtures can range between 25 and 65 gpd per housing unit. The studies also suggest that installation of retrofit fixtures in older single-family homes tend to produce more savings, while newer multi-family homes tend to produce fewer savings per housing unit. Actual installation data from the last five years can be found in Table 6.3 and Table 6.4.

City of Corona 2010 URBAN WATER MANAGEMENT PLAN
April 2012 6-5 pw://Carollo/Documents/Client/CA/Corona/8567A00/Deliverables/Ch06 (F)
Table 6.3 Single Family Device Distribution
Report Year Showerheads Faucet Aerators
2005/2006 578 -
2007/2008 1350 1150
2009/2010 1,409 1,311
Notes: 1. Data from City’s BMP reports
Table 6.4 Multi-Family Device Distribution
Report Year Showerheads Faucet Aerators
2005/2006 500 -
2007/2008 1130 1200
2009/2010 226 350
Notes: 1. Data from City’s BMP reports
Assuming a current total saturation of approximately 70 percent for both single and multi-family accounts, one would estimate current water savings within the City at 1,373 AFY from single family conservation, and 71 AFY from multi-family conservation, yielding a total of 1,444 AFY for BMP 2. If the City were to increase total residential account saturation to 80 percent, further water conservation could be achieved. Retrofitting an additional 3,500 single-family accounts and 180 multi-family accounts would likely decrease use by approximately 205 AFY, or 2 percent of the 9,233 AF reduction in 2020.
6.1.3 BMP 3 - System Water Audits, Leak Detection, and Repair
A water audit is a process of accounting for water use throughout a water system in order to quantify unmetered water usage. Unaccounted-for water is the difference between metered production and metered usage on a system-wide basis.
In past years, the City has contracted a leak detection program out to third party groups. Currently, the City has a contract with Hughes Utility Service Group for its Leak Detection Program. The City’s Operations Division determines the areas to be tested, and the Hughes group completes the observations and determines if there is a leak. As of September 7, 2011, the City also has a contract with ADS Environmental Services to perform a two-phase water audit. The first phase of the audit is a Prescreening Water Audit, which will be used to develop information about the overall water supply input, verifiable water uses, and identify unbilled, unmetered water use, and leakage. This information will be used in Phase 2, which is a Bottom-Up Analysis of the system. This will include a standard water audit and water balance, in compliance with the CUWCC foundational BMP for water loss. The audit will be performed per the American Water Works Association (AWWA) M36 Manual of

City of Corona 2010 URBAN WATER MANAGEMENT PLAN
6-6 April 2012 pw://Carollo/Documents/Client/CA/Corona/8567A00/Deliverables/Ch06 (F)
Practice – Water Audits and Loss Control Programs. The City expects the audit to be concluded by December 31, 2012.
Based on water loss calculations for year 2007 through 2009, the water losses (or unmetered water deliveries) within the City’s distribution system were estimated at 5 percent. As this is at the low end of the typical water loss spectrum that ranges from 5 to 10 percent, this program does not provide opportunities to substantially decrease the per-capita water use.
The City completed the AWWA Water Audit using the AWWA Water Audit Software for 2010 as part of BMP compliance. A copy of the completed worksheet is located at the end of Appendix G. The City sent two staff members to be trained on the water loss software on October 13-14, 2010, in Oxnard, California.
The City’s water audit data validity score was 63 out of a possible 100. The three priority areas for attention listed were volume from the City’s own sources, water exported and billed metered water.
6.1.4 BMP 4 - Metering with Commodity Rates for All New Connections and Retrofit of Existing Connections
This BMP requires water meters for all new connections and billing by volume of use, as well as establishment of a program for retrofitting any existing unmetered connections.
All connections within the City are metered and customers are billed according to the amount of water used. As the City continues to install meters at all its new connections, this program will not provide foreseeable water conservation opportunities.
6.1.5 BMP 5 - Large Landscape Conservation Programs and Incentives
This BMP calls for agencies to start assigning reference evapotranspiration (ETo) based water budgets to accounts with dedicated irrigation meters and to provide water use audits to accounts with mixed use meters.
The City went to a tiered rate and water budget system in April 2010. Each dedicated landscape meter receives a water budget based on estimated or measured landscape area, daily ETo information, plant factor and irrigation efficiency factor. Customers that go over budget receive a bill that shows charges for inefficient, excessive and wasteful use at higher rates than the water budget rate. The bill also features a graph to illustrate the customer’s water budget in relation to water use. In addition, a separate mailer is sent to accounts that are in the excessive or wasteful tiers to offer assistance from the Water Resources group. Assistance includes offering free landscape check-ups by CLIAs, to help inspect the irrigation system and make recommendations for water savings and adjustments to irrigation controllers, as well as notifying the customer that rebates are available on water saving devices, and offering measurements of the landscaped area to confirm that the water budget is accurate. The City also offers the incentive of a variance

City of Corona 2010 URBAN WATER MANAGEMENT PLAN
April 2012 6-7 pw://Carollo/Documents/Client/CA/Corona/8567A00/Deliverables/Ch06 (F)
program for finding and fixing leaks, which provides added incentive for customers to make repairs and get some financial relief on penalty charges.
The City currently serves 937 accounts with dedicated irrigation meters. Assuming that each of these landscape customers could conserve approximately two thirds of one AFY through more efficient watering techniques and ETo sensors, the City could potentially save 325 AFY by implementing landscape conservation programs with 50 percent of landscaping customers. This would result in 4 percent of the 9,233-AF reduction needed in 2020.
6.1.6 BMP 6 - High-Efficiency Washing Machine Rebate Program
The City offers rebates to customers on high efficiency clothes washers (HECWs) in conjunction with both its wholesale agency, WMWD, and regional wholesaler, MWDSC. The City met the coverage requirement for the 2005/2006 BMP reporting period for HECW rebate programs; 690 rebates were issued prior to July 1, 2004, averaging $77 per rebate.
Table 6.5 High-Efficiency Washing Machine Rebates
Year Rebate Amount Number of Rebates Awarded
2007 $110 284
2008 $110 216
2009 $135 239
2010 $150 370
Notes: 1. Rebate data from City’s BMP reports
Table 6.5 shows the rebate amount and number of machines provided by the City for 2007 through 2010. The CUWCC estimates that high efficiency washing machines save a typical family of four more than 8,000 gallons of water per year. Since 2007, it is estimated that by replacing these machines, over 60 acre-feet of water has been saved.
High-efficiency washing machines typically use 15 to 25 gallons less water per load than typical washers. If the City were to achieve 55-percent saturation of the single-family residential customers, the City would potentially add approximately 13,650 HECWs. At an average of one load per day and 22 gallons of water savings per load, this program could potentially contribute 8,000 gallons per year of water savings per customer. With 55-percent saturation of the single-family sector, this would result in over 335 AFY of conservation, or 4 percent of the 9,233 AF reduction in 2020.
6.1.7 BMP 7 - Public Information Programs
The City’s Water Resources staff attends many public outreach events each year. In 2010, the City attended over 40 events in its service area, including landscape classes for residents. Many of these events were done in cooperation with other businesses and entities such as the Corona Public Library, the Corona Norco Unified School District, the City’s Public Works Department and the local Chamber of Commerce. At these public

City of Corona 2010 URBAN WATER MANAGEMENT PLAN
6-8 April 2012 pw://Carollo/Documents/Client/CA/Corona/8567A00/Deliverables/Ch06 (F)
outreach events, City staff provides a variety of written materials on conservation, including copies of newsletters, pamphlets, rebate information, tips, and services available to City customers. The City also provides free water saving devices, including 5-minute shower timers, toilet dye-tabs for leak detection, hose nozzles, buckets and sponges for car washing, faucet aerators and low-flow showerheads. Finally, event participants are also able to sign up for a free landscape check-up.
The City sponsors and participates in the Temescal Wash Clean-up, an event involving volunteers, including local high school environmental science students. The effort helps to provide information to participants about the importance of keeping our waterways clean while removing several tons of trash and debris from the wash that would normally pollute local rivers and the ocean. Information regarding conservation is provided to participants.
In 2010, the City conducted 12 landscape classes on drip irrigation, parkway design, slope design, retrofitting existing planter beds, water-wise plants, and English Cottage Gardens. Class participants received information on available programs, such as turf removal rebate programs, and water saving devices and information.
Events attended by the City in 2010 include: City Farmer’s Market, Day of the Child Event, Chamber of Commerce Mega Mixer, Chad Zeller Memorial Walk, Book-A-Palooza, Corona Public Safety Day 2010, Chamber of Commerce Business Expo, Senior Center Fair, Cancer Walk, Summerfest, Prado View Fall Festival, St. Edwards Church and School Fall Festival, Take-A-Hike Event, Temescal Wash-Clean-up, Lion’s Club Pancake Breakfast, Red Ribbon Family Fun Festival, and the Metrolink Toy Train Event.
The City’s events are advertised through quarterly newsletters, the City’s website calendar of events, through an e-newsletter from the City called “the InnerCircle,” bill stuffers and through the other entities that are putting on events.
In addition, the City has a citywide street banner program. Street banners are installed on major streets through the City and display messages regarding the need to conserve water and ways to conserve. The City has over 200 street banners throughout the City.
In 2011, the City provided 11 landscape classes to its customers. Class topics covered information on landscape alternatives to the traditional grass front yards, and included classes on creating outdoor living spaces, creating habitat, edible landscape design, ornamental grasses, irrigation 101, container plantings, drip irrigation, sand-set pavers, and designing outdoor spaces. Class participants receive information on available programs, such as turf removal rebate programs, and water saving devices and information.
The City became an EPA WaterSense partner in 2011, and utilizes information provided through the EPA to promote water savings and events. The City provided information on the WaterSense Fix-A-Leak Week to customers through e-newsletter and on website, and will do so going forward, too.

City of Corona 2010 URBAN WATER MANAGEMENT PLAN
April 2012 6-9 pw://Carollo/Documents/Client/CA/Corona/8567A00/Deliverables/Ch06 (F)
6.1.8 BMP 8 - School Education Program
This BMP requires water suppliers to implement a school education program that includes providing educational materials and instructional assistance.
In 2009 and 2010, the City provided school assemblies in partnership with WMWD for six separate schools in the City’s service area. These were school wide assemblies that taught students about the water cycle, where their water comes from, the importance of using water efficiently, ways that students could help save water, and how students can do their part to keep our waterways clean to help protect our water supplies. In 2009, through the Abracadabra Program in partnership with WMWD, 4,500 children were reached at the Susan B. Anthony Elementary School, Lincoln Alternative Elementary School, Coronita Elementary School, and Wilson Elementary School. In 2010 the two schools that received a ZunZun Water Conservation Education Assembly were Prado View Elementary and Eisenhower Elementary. These assemblies each reached over 2,000 elementary school children. In 2009, the City also participated in a student art contest for fifth grade students, as part of MWDSC’s “Water is Life” poster contest.
In 2009 the City provided a $4,000 environmental restoration grant to a local high school environmental science teacher. The grant allowed the teacher to involve 50 public high school students in various projects that enhanced and protected the local Santa Ana Watershed. Grant tasks included measuring water quality, learning about local watershed and biodiversity, and conservation of water resources. The grant also enabled students to take a tour of the City’s water and sewer treatment plant. In 2010, the City developed a Water Use Efficiency Grant for local educators. In 2010, the City awarded $5,500 in funds to two local teachers for projects that helped students tour local water and sewer treatment plants and produce public education videos by students on the importance of water conservation. The City plans to continue supporting such projects in the future.
The City is currently working with the Riverside-Corona Resource Conservation District (RCRCD) to provide age-appropriate education to individual classrooms upon request from a teacher. RCRCD has curriculum on water and conservation based on the California Department of Education’s Science Framework for California Public Schools. The City is also continuing to sponsor the MWDSC “Water is Life” poster contest, and plans to do so in future years.
6.1.9 BMP 9 - Conservation Programs for Commercial, Industrial, and Institutional Accounts
The City provides free landscape check-ups to businesses within the City in order to provide information and recommendations on ways to reduce waste and save water. This program is similar to the residential program. In prior years, the City has utilized the RCRCD to provide free landscape audits to its commercial accounts. The City currently has two Water Resource Technicians that have become Certified Landscape Irrigation Auditors (CLIA). The City intends to utilize these staff to provide commercial landscape audits to

City of Corona 2010 URBAN WATER MANAGEMENT PLAN
6-10 April 2012 pw://Carollo/Documents/Client/CA/Corona/8567A00/Deliverables/Ch06 (F)
provide more in-depth, detailed landscape audits to commercial accounts. The City is also in the process of developing a detailed report to provide to commercial accounts about water savings recommendations, incorporating information on available rebates. These services will continue to be marketed through the local Chamber of Commerce business directory, on the City’s website, and at other business outreach events.
The City provides rebates to commercial customers through WMWD and MWDSC’s commercial Save-A-Buck rebate program. In 2010 the rebate program had no participants, so in 2011 the City mailed post cards to all commercial accounts in order to inform them about the available rebates. 2011 saw an increase in the redemption of commercial rebates compared to previous years.
In 2010, the City partnered with WMWD to offer a $1 per square foot rebate to businesses removing 5,000 square feet or more of turf. A total of $50,000 is available for this pilot program. In 2011, one rebate for $10,000 was issued for 13,525 square feet of turf removed.
The City is planning to secure a contract with an environmental engineering firm in order to provide commercial water audits on an as-needed basis to commercial customers who utilize water in a manufacturing process.
The City received a grant from the Bureau of Reclamation in 2011 to assist in developing a Water Use Efficiency Master Plan. As part of this plan, the City intends to identify the most common types of businesses in the City and develop programs and best management practices for water savings.
The City has plans to expand its existing reclaimed water system. Local business customers that front existing reclaimed water distribution lines will be actively targeted to convert to reclaimed water use for landscaping. Beginning in 2012, the City will work to develop financing programs to assist commercial customers with reclaimed water retrofits, as well as to utilize new efficiency funding programs through the Western Riverside Council of Governments (WRCOG).
The City is planning to continue to implement additional CII programs in the future. Currently, the City has approximately 3,000 CII accounts. Assuming that the City has the potential to reach 300 new CII customers by year 2020, and that each customer would, on average, save 2 AFY per program, the total savings of the CII program would generate approximately 600 AFY of water conservation, which is about 6.5 percent of the 9,233 AFY water conservation goal for year 2020.
6.1.10 BMP 10 - Wholesale Agency Programs
This BMP applies to wholesale agencies and defines a wholesaler’s role in terms of financial, technical, and programmatic assistance to its retail agencies implementing BMPs.

City of Corona 2010 URBAN WATER MANAGEMENT PLAN
April 2012 6-11 pw://Carollo/Documents/Client/CA/Corona/8567A00/Deliverables/Ch06 (F)
The City is not a wholesale agency, so this BMP does not apply.
6.1.11 BMP 11 - Conservation Pricing
The City adopted a budget-based, tiered water rate system in April of 2010 which charges users based on the volume of water consumed with rates per unit increasing after the budget is exceeded. The rate structure, summarized in Table 6.6, Table 6.7, and Table 6.8 below with March 2011 rates, differs between residential, commercial, industrial, institutional and government rates, and reclaimed water rates. These sector based rates are in addition to a flat readiness to serve charge which is based on service pipe diameter.
Table 6.6 Residential Tiered Rate Structure
Tier Rate per Unit Basis for Tier
Indoor Budget $1.85 Efficient indoor water use
Outdoor Budget $2.04 Efficient outdoor water use
Inefficient Use $2.78 1% to 20% over water budget
Excessive Use $5.56 21% to 40% over water budget
Wasteful Use $10.19 More than 40% over water budget
Notes: 1. Applies to Residential Customers only. 2. Rates effective March 1, 2011. Further information available on Corona website.
Table 6.7 Commercial, Industrial, Institutional & Government Rate Structure
Tier Rate per Unit Basis for Tier
Water Budget $2.04 Efficient water use
Inefficient Use $2.78 1% to 20% over water budget
Excessive Use $5.56 21% to 40% over water budget
Wasteful Use $10.19 More than 40% over water budget
Notes: 1. Outdoor budget for dedicated meters; applies to CII and Government Customers only. 2. Rates effective March 1, 2011. Further information available on Corona website.

City of Corona 2010 URBAN WATER MANAGEMENT PLAN
6-12 April 2012 pw://Carollo/Documents/Client/CA/Corona/8567A00/Deliverables/Ch06 (F)
Table 6.8 Reclaimed Rate Structure
Tier Rate per Unit Basis for Tier
Water Budget $1.39 Efficient indoor water use
Inefficient Use $2.08 1% to 20% over water budget
Excessive Use $2.78 21% to 40% over water budget
Wasteful Use $4.16 More than 40% over water budget
Notes: 1. Applies to Reclaimed Customers only. 2. Rates effective March 1, 2011. Further information available on Corona website.
The residential indoor budget is meant to account for the water a person will use indoors. It is based on assumptions involving how much water an average person will use indoors during a typical day. The City assumes an average of 60 gallons per person per day, an average of four people per home, and bills based on the number of days in the billing cycle. This quantity of water, 7,200 gallons or 10 units (where a unit is 100 cubic feet), is the residential indoor water budget. As shown in Table 6.6, using water in excess of this budget results in an increased cost per unit of water as soon as the budget is exceeded.
The residential outdoor budget is intended to account for the water a person will use outdoors. It is calculated by taking into account landscaped area, evapotranspiration, and irrigation efficiency. The landscaped area is estimated based on GIS analysis of data from the county assessor. (By assuming averages for each of these variables, a 5,000 square foot lot for example, the City calculates an outdoor residential use of 36 units. Again, using water in excess of these budget results in an increased cost per unit.)
The water use for commercial, industrial, institutional, and government users applies to water use among these user types. The water budget is calculated by taking an average of the last three years of water use. Each year, this average is recalculated to determine the new water budget for structure accounts, while the budget for dedicated irrigation accounts remains the same.
Reclaimed use applies to reclaimed water users, and rates for reclaimed water usage are lower in price than the rates for potable usage. However, the same rate structure still applies. The reclaimed water rate is structured this way in order to incentivize its use as an alternative to potable water. As shown in Table 6.6, Table 6.7, and Table 6.8, the City clearly incentivizes the use of reclaimed water while discouraging going past one’s designated water budget.

City of Corona 2010 URBAN WATER MANAGEMENT PLAN
April 2012 6-13 pw://Carollo/Documents/Client/CA/Corona/8567A00/Deliverables/Ch06 (F)
6.1.12 BMP 12 - Water Conservation Coordinator
The City of Corona currently has two Conservation Coordinators who are responsible for coordinating and expanding the City’s water conservation program and providing residents with useful water conservation information.
6.1.13 BMP 13 - Water Waste Prohibition
Water waste is also addressed in the City’s water shortage contingency plan outlined in Chapter 13.26 of the Corona Municipal Code and amended in Ordinance 2962 (see Appendix F).
Violation of any of the City’s water conservation provisions is a misdemeanor subject to imprisonment in the county jail for not more than thirty days or a fine not to exceed $1,000, or both. These prohibitions are further discussed in Chapter 8.
6.1.14 BMP 14 - Residential Ultra-Low-Flush Toilet Replacement Programs
State legislation requires the installation of efficient plumbing in new construction and, effective in 1994, requires that only ultra low-flush toilets (ULFTs) be sold in California.
The program used by the City is managed through MWDSC’s residential SoCal WaterSmart program. Rebates are marketed through quarterly newsletters mailed in utility bills, bill stuffers, through public education events, the City’s website, and the City e-newsletter, the InnerCircle. The City continues to provide an incentive through this program, even though MWDSC and WMWD no longer do so. The City plans to continue providing this $50 incentive to residential customers to promote the replacement of older toilets with ULFTs.
The CUWCC estimates that a family of four would save about 3,000 gallons per year by installing 1.28 gpf HETs instead of 1.6 ULFTs. The City estimates water savings to be approximately five AFY for the 2009 and 2010 rebates, and that these toilets will save roughly three AFY going forward.
In 2012, the City will collaborate with WMWD to install HETs for multi-family residential customers. The City has committed $50,000 towards this direct install program, and anticipates replacing over 600 toilets with ULFTs. The City has contacted multi-family accounts to survey them as to their current GPF toilets, and is targeting those complexes that have toilets using more than 1.6 gpf on site.
6.2 WATER CONSERVATION IMPLEMENTATION PLAN
The BMP’s currently implemented by the City have been effective in reducing water consumption, but further efforts will need to be made to reach the 2020 water conservation target. As discussed in Section 6.1.9, part of this effort will involve development of a Water

City of Corona 2010 URBAN WATER MANAGEMENT PLAN
6-14 April 2012 pw://Carollo/Documents/Client/CA/Corona/8567A00/Deliverables/Ch06 (F)
Use Efficiency Master Plan, made possible by a grant from the Bureau of Reclamation. The City’s historic per capita and future projections are shown on Figure 6.1.
Figure 6.1 Projected Water Demands with and without Conservation
The conservation and non-conservation projections diverge rapidly after 2010, revealing the conservation that the City will need to achieve by year 2020. The potential effect of current BMP programs by 2020 is shown on Figure 6.1. This value is listed as potential because it is based on the assumption that currently implemented BMPs will continue to be practiced and will have an effect on the City’s water consumption. A breakdown of the potential water conservation amounts by BMP as described in the previous sections is graphically presented on Figure 6.2.

City of Corona 2010 URBAN WATER MANAGEMENT PLAN
April 2012 6-15 pw://Carollo/Documents/Client/CA/Corona/8567A00/Deliverables/Ch06 (F)
Figure 6.2 Water Conservation Methods
As shown on Figure 6.2, the current BMP programs will only account for 1,468 AF of the 9,233 AFY of conservation needed to reach the 36,934 AF target in 2020, which equates to about 16 percent of the total water conservation goal. This figure, however, only accounts for 5 of the 13 BMPs (discounting BMP 10) which the City can use to reduce water consumption. BMP’s such as school education, water surveying and other such methods remain viable strategies to reduce consumption as well.
The increased use of reclaimed water will also be instrumental in the City’s conservation efforts. The 6,873 AF of reclaimed water projected to be used in 2020 will reduce potable water use and account for approximately 74 percent what the City will need to conserve.
In addition, the City will continue to target waste through the City’s tiered rate and water budget system, in particular providing programs to customers to encourage water savings outdoors. In addition to efforts documented with the BMPs, the City has received grants in the past to install weather-based irrigation timers and currently offers rebates for residential and commercial turf removal projects. It is anticipated the City will continue these efforts.
To achieve the necessary amount of further water conservation, the City should prioritize its efforts towards expanding its large scale BMP programs to result in large conservation gains. Continued support of residential retrofits is also essential because of the City’s largely residential customer base. Finally, although some BMPs do not result in as tangible of conservation savings, school and public education programs will provide much needed support as the City strives to meet its 2020 conservation target.
BMP 2, 205 AFY, 2%
BMP 5, 325 AFY, 4%
BMP 6, 335 AFY, 4%
BMP 9, 600 AFY, 7%
BMP 14, 3 AFY, <1%
Potable Offsets for Reclaimed Water, 6,873
AFY, 74%
Further Conservation, 892
AFY, 10%
Total 2020 Conservation:9,233 AF


April 2012 7-1 pw://Carollo/Documents/Client/CA/Corona/8567A00/Deliverables/Ch07 (F)
Chapter 7
WATER RELIABILITY PLANNING
The UWMPA requires that the UWMP address the reliability of the agency’s water supplies. This includes supplies that are vulnerable to seasonal or climatic variations. In addition, an analysis must be included to address supply availability in a single dry year and in multiple dry years.
10631. A plan shall be adopted in accordance with this chapter and shall do all of the following:
10631 (c) Describe the reliability of the water supply and vulnerability to seasonal or climatic shortage, to the extent practicable.
10631 (c) For any water source that may not be available at a consistent level of use, given specific legal, environmental, water quality, or climatic factors, describe plans to replace that source with alternative sources or water demand management measures, to the extent practicable.
10631 (c) Provide data for each of the following: (1) An average water year, (2)
A single dry water year, (3) Multiple dry water years.
10632. The plan shall provide an urban water shortage contingency analysis which includes each of the following elements which are within the authority of the urban water supplier:
10632 (b) An estimate of the minimum water supply available during each of the next 3-water years based on the driest 3-year historic sequence for the agency’s water supply.
The UWMPA also requires that the UWMP include information on the quality of water supplies and how this affects management strategies and supply reliability.
10634. The plan shall include information, to the extent practicable, relating to the quality of existing sources of water available to the supplier over the same 5-year increments as described in subdivision (a) of Section 10631 and the manner in which water quality affects management strategies and supply reliability.
Finally, the UWMPA lays out an approximate methodology for how suppliers should make the dry year supply and demand comparisons, and what information needs to be presented.
10635 (a) Every urban water supplier shall include, as part of its urban water management plan, an assessment of the reliability of its water service to its customers during normal, dry, and multiple dry water years. This water supply and demand assessment shall compare the total water supply sources available to the water supplier with the total projected water use over the next 20 years, in 5-year increments, for a normal water year, a single dry water year, and multiple dry water years. The water service reliability assessment shall be based upon the information compiled pursuant to Section 10631, including available data from the state, regional, or local agency population projections within the service area of the urban water supplier.

City of Corona 2010 URBAN WATER MANAGEMENT PLAN
7-2 April 2012 pw://Carollo/Documents/Client/CA/Corona/8567A00/Deliverables/Ch07 (F)
7.1 OVERVIEW OF WATER SUPPLY RELIABILITY
The City faces many of the same water supply issues as other water purveyors in Southern California. Drought, climatic challenges, water conveyance, environmental regulation, and competition for water from outside the region all force changes in water deliveries and the timing of those deliveries.
As discussed in Chapter 3, the City’s water supply consists primarily of three sources: imported water, groundwater, and reclaimed water. In 2009, the City received approximately 52 percent of its total water from local groundwater sources, 31 percent from the Colorado River and 9 percent from the SWP, and 8 percent from reclaimed water. The following sections outline and summarize the supply reliability of these three sources. Reliability is described first in a general, conceptual sense, then projected demands for the three sources are compared against supply projections, to numerically estimate and determine the City’s total supply reliability.
7.1.1 Imported Water Supply Reliability
Although the City purchases its water from WMWD, the water is ultimately imported to the region by MWDSC. For this reason, when examining imported water supply reliability it is most important to consider the reliability estimates given by MWDSC. Moreover, at the time of the writing of this report, MWDSC offers the most comprehensive and up-to-date estimates of imported water supply reliability.
Because of competing needs and uses associated with these water resources, MWDSC has undertaken a number of planning efforts during the past 15 years. Some of the most recent documents include the 2010 Integrated Water Resources Plan update, the Water Surplus and Drought Management Plan, the Water Supply Allocation Plan, and the Long-term Conservation Plan. These documents were reviewed for the purpose of preparing the City’s 2010 UWMP.
MWDSC’s customers receive water from three different sources. The first is from the customer’s own local resources (such as ground or surface water) while the remaining is imported from two sources: the Colorado River (via the CRA), and the Sacramento-San Joaquin River Delta via the SWP. The City receives water from both the Colorado River and the SWP.
7.1.2 Groundwater Supply Reliability
Groundwater supplies are considered a reliable supply source since they are not significantly impacted by short term droughts. However, the basin must be replenished in years with excess rainfall in order to maintain the supply in drought years. Hence, in extended droughts, levels within the groundwater basin may fall as the basin is not replenished through natural inflows.

City of Corona 2010 URBAN WATER MANAGEMENT PLAN
April 2012 7-3 pw://Carollo/Documents/Client/CA/Corona/8567A00/Deliverables/Ch07 (F)
As discussed in Chapter 3 and the 2008 GWMP, the City’s supply target is to obtain approximately 50 percent of its potable water supply from groundwater. The City has made efforts in the past to decrease its reliance on imported water by additional pumping and development of its groundwater resources.
7.1.3 Reclaimed Water Supply Reliability
As discussed in Chapter 4, the City owns and operates three WRFs, for a total capacity of 15 mgd. Treated effluent which is not used for landscaping or dual plumbing is discharged to Temescal Creek or to percolation ponds. Reclaimed water is generally considered to be a reliable water supply since the WRFs provide effluent regardless of climatic conditions. It is not likely that drought conditions would have a significant effect on the City’s ability to utilize reclaimed water.
7.2 FUTURE SUPPLY PROJECTS AND PROGRAMS
The three agencies who bear primary responsibility for providing water supplies to the City are MWDSC, WMWD, and the City itself. This section outlines the future supply projects and programs planned by these three agencies.
7.2.1 Projects Planned by MWDSC
As described in its Regional UWMP, MWDSC plans to meet its supply reliability goal through the following programs:
Surface water storage programs related to the SWP and Colorado River.
Colorado River water management programs.
SWP management programs.
Central Valley/SWP storage and transfer programs.
Water conservation.
Development of local supplies (such as the desalter).
Water reclamation projects.
Ocean desalination programs.
Groundwater banking programs in Southern California region (Riverside - Corona Feeder).
The implementation approach and the achievements to-date for each of these programs are discussed in detail in Chapter 3 of MWDSC’s Regional UWMP. The projected increase in supply availability due to these programs under average year conditions is summarized in Table 7.1.

City of Corona 2010 URBAN WATER MANAGEMENT PLAN
7-4 April 2012 pw://Carollo/Documents/Client/CA/Corona/8567A00/Deliverables/Ch07 (F)
Table 7.1 MWDSC’s Current and Planned Supply Programs
Program Description 2015 (AFY)
2020 (AFY)
2025 (AFY)
2030 (AFY)
2035 (AFY)
Current Programs
In-Region Storage and Programs 685,000 931,000 1,076,000 964,000 830,000
California Aqueduct 1,550,000 1,629,000 1,763,000 1,733,000 1,734,000
Colorado River Aqueduct 1,250,000 1,250,000 1,250,000 1,250,000 1,250,000
Capability of Current Programs 3,485,000 3,810,000 4,089,000 3,947,000 3,814,000
Under Development
In-Region Storage and Programs 206,000 306,000 336,000 336,000 336,000
California Aqueduct 382,000 383,000 715,000 715,000 715,000
Colorado River Aqueduct 187,000 187,000 187,000 182,000 182,000
Capability of Planned Programs 588,000 689,000 1,051,000 1,051,000 1,051,000
Supply Increase
Total (AFY) 4,073,000 4,499,000 5,140,000 4,998,000 4,865,000
Total (%) +17% +18% +26% +27% +28% Notes: 1. Source: Table 2-11 from MWDSC RUWMP (MWDSC, 2010).
7.2.2 Projects Planned by WMWD
At this time, WMWD has outlined plans for over 90 projects which range in scale from regional to local, but all of which provide some benefit to the City. These projects fall primarily into the following categories:
Conveyance.
Conjunctive Management and Groundwater Storage.
Reclaimed Municipal Water.
Flood Control.
Groundwater and Aquifer Remediation.
Matching Water Quality to Use.
Pollution Prevention.
Recharge Area Protection.
Urban Runoff Management.
A more complete list and outline of future projects can be found in WMWD’s Integrated Regional Water Management Plans and 2010 UWMP.

City of Corona 2010 URBAN WATER MANAGEMENT PLAN
April 2012 7-5 pw://Carollo/Documents/Client/CA/Corona/8567A00/Deliverables/Ch07 (F)
7.2.3 Projects Planned by the City of Corona
The following projects have been planned to enhance the operations and reliability of the City’s water infrastructure:
New Water Wells.
Replacement Water Wells.
Rincon Groundwater Treatment Project.
Wellhead Treatment for Wells 7 and 17.
El Sobrante Groundwater Treatment Project.
Groundwater Blending Program.
Improvement of Groundwater Quality/Quantity Monitoring Program.
Coldwater Subbasin Enhanced Recharge Program.
Recharge Basins within Oak Avenue Detention Basin.
Recharge Basins within Main Street Detention Basin.
Upgradient Injection Wells.
Reclaimed Water Injection Wells.
Reclaimed Water Zone 3 to Zone 2 Interconnect.
Lincoln and Cota Street Percolation Ponds Maintenance Program.
Lee Lake Water District’s Discharge to Bedford Subbasin.
WWTP 2 and 1A Upgrade to Tertiary.
Implementation of the identified projects will allow the City to maintain and expand its water supply and distribution infrastructure, increasing supply reliability and reliability of its water and reclaimed water distribution systems.
7.3 FACTORS RESULTING IN INCONSISTENCY OF SUPPLY
There are a variety of factors that can impact water supply reliability. Factors impacting the City’s supply sources are indicated with a “” in Table 7.2. A brief discussion on each of these factors is provided below.

City of Corona 2010 URBAN WATER MANAGEMENT PLAN
7-6 April 2012 pw://Carollo/Documents/Client/CA/Corona/8567A00/Deliverables/Ch07 (F)
Table 7.2 Factors Resulting in Inconsistency of Supply
Water Supply Sources
Specific Source Name L
imit
atio
n
Qu
anti
fica
tio
n
Leg
al
En
viro
nm
enta
l
Wat
er Q
ual
ity
Clim
atic
Ad
dit
ion
al
Info
rmat
ion
Imported Wholesaler - - -
Groundwater Temescal Basin - - - - -
Groundwater Coldwater Subbasin - - - - -
Reclaimed Water Reclaimed - - - - - -
7.3.1 Legal
Although WMWD is the City’s direct wholesaler, imported supply reliability for the entire region ultimately lies with MWDSC. MWDSC’s primary purpose is to provide a supplemental supply of water for domestic and municipal uses at wholesale rates to its member public agencies. MWDSC’s principal sources of water are the SWP and the Colorado River. The Colorado River was MWDSC’s original source of water after the organization’s establishment in 1928 and MWDSC has a legal entitlement to receive water from the Colorado River under a permanent service. MWDSC also imports significant amounts of water from the SWP, which is owned and operated by the California Department of Water Resources (DWR). In 1960, MWDSC signed a contract with DWR. MWDSC is one of 29 agencies that have long-term contracts for water service from DWR, and is the largest agency in terms of the number of people it serves (19.1 million), the share of SWP water that it has contracted to receive (approximately 46 percent), and the percentage of total annual payments made to DWR by agencies with contracts (approximately 60 percent in 2008). The longevity and importance of these legal arrangements with MWDSC’s largest suppliers indicate that, while water importation is frequently litigious, MWDSC has shown a continuous ability to procure water from these supplies, and will continue to do so in the future.
The issue of legality also affects the City’s ability to draw water from the Coldwater Subbasin. While not affected by the water quality issues of the Temescal Basin, the Coldwater Subbasin has small volume and has faced recharge issues in the past, necessitating a regional agreement as to the subbasin’s usage, included in Appendix D. Most of the production has been by the City and EVMWD, the only municipal pumpers in the subbasin. The City acquired the rights to the surface flows of Coldwater Canyon in 1964 when it purchased the assets of the CCWC. To meet DPH requirements, the surface flow is now spread in percolation ponds and extracted by the City’s three Glen Ivy area wells in the Coldwater Subbasin. The initial native safe yield identified in the agreement is 3,300 AFY,

City of Corona 2010 URBAN WATER MANAGEMENT PLAN
April 2012 7-7 pw://Carollo/Documents/Client/CA/Corona/8567A00/Deliverables/Ch07 (F)
and the City’s share of this is 64 percent, or 2,112 AFY. The safe yield is recalculated every five years. In addition, the agreement allows the additional pumping of return flows by the City from the previous fiscal year.
7.3.2 Environmental
Given the fragile state of many of California’s ecosystems, environmental concerns inevitably arise during the water planning process. The delicacy of these systems can, in turn, cause a lack of supply due to the enforcement of environmental legislation. The recent legal actions involving the Endangered Species Act in the Delta are an example of the clash between environmental concerns and water supply. Once again, the environmental issues which impact supply reliability for the City are primarily dealt with by MWDSC. In June 2007, MWDSC’s Board approved a Delta Action Plan that provides a framework for staff to pursue actions with other agencies and stakeholders to build a sustainable Delta and reduce conflicts between water supply conveyance and the environment. MWDSC continues to develop principles to help achieve its mission to provide adequate and reliable supplies of high-quality water in an environmentally and economically responsible way.
7.3.3 Water Quality
Elevated nitrate concentrations have been documented in the Temescal Subbasin since at least the 1950s. Water quality data indicate nitrate concentrations ranging from 0.3 to 124 mg/L. This requires the use of the Temescal Desalter for the City to utilize groundwater from Temescal Basin. More on how water quality issues affect supply can be found in Section 7.8.
7.3.4 Climatic
MWDSC’s service area encompasses three major climate zones, while MWDSC’s water sources are drawn from an immense area. The Colorado River watershed is over 246,000 square miles while the SWP draws from about 32,000 square miles. Due to these geographic considerations, climate change will add many new uncertainties to the challenges of planning, and irrespective of the debate associated with the sources and cause of increasing concentrations of greenhouse gasses, changes in weather will significantly affect water supply planning. MWDSC intends to explore opportunities to continually increase efficiency, join the California Climate Action Registry, support environmental practices, develop solar power at some of their WTFs, and pursue renewable water and energy programs that promote sustainability. Given that climatic pressures will unarguably affect supply reliability, continual attention to this issue will be necessary on the part of MWDSC.
7.4 SUPPLY RELIABILITY
There are two aspects of supply reliability that can be considered. The first relates to immediate service needs and is primarily a function of the availability and adequacy of the

City of Corona 2010 URBAN WATER MANAGEMENT PLAN
7-8 April 2012 pw://Carollo/Documents/Client/CA/Corona/8567A00/Deliverables/Ch07 (F)
supply facilities. The second aspect is climate-related, and involves the availability of water during mild or severe drought periods. This section compares water supplies and demands during three water scenarios: normal water year, single dry water year, and multiple dry water years. These scenarios are defined as follows.
Normal Year: The normal year is a year in the historical sequence that most closely represents median runoff levels and patterns. The supply quantities for this condition are derived from historical average yields.
Single Dry Year: This is defined as the year with the minimum useable supply. The supply quantities for this condition are derived from the minimum historical annual yield.
Multiple Dry Years: This is defined as the three consecutive years with the minimum useable supply. Water systems are more vulnerable to these droughts of long duration, because they deplete water storage reserves in local and state reservoirs and in groundwater basins. The supply quantities for this condition are derived from the minimum historical three consecutive years’ annual average yields.
In the last few years, the City’s potable water supply has shifted to be relatively evenly divided between water imported from WMWD and local groundwater. In identifying historic supply reliability conditions throughout dry year and multiple dry year events, the chosen years are consistent with the years in MWDSC’s 2010 RUWMP. As summarized in Table 7.3, MWDSC has identified 1977 as the single driest year since 1922 and the years 1990 through 1992 as the driest multiple years over that same period. These years represent the years in which the least amount of imported water was available from MWDSC.
Table 7.3 Basis of Water Year Data
Water Year Type Base Year(s)
Average Water Year 1993
Single Dry Water Year 1977
Multiple Dry Water Years 1990 - 1992
Sources: Regional UWMP1 for single and multi dry years, and historical consumption and population data provided by City for average year.
The regional UWMP does not identify a particular year that would represent average demand conditions. To determine the average demand year, the City’s historical per capita water usage was evaluated. By normalizing water consumption with population and thus expressing consumption in gpcd, the increase in demands due to growth is eliminated. The
1 MWDSC, 2010

City of Corona 2010 URBAN WATER MANAGEMENT PLAN
April 2012 7-9 pw://Carollo/Documents/Client/CA/Corona/8567A00/Deliverables/Ch07 (F)
historical per capita consumption during the 1989 through 2010 period is shown on Figure 7.1. As shown, the average consumption in the period was 261 gpcd. As the per capita consumption in 1993 was 262 gpcd and the closest to the 21-year average of 261 gpcd, this year was selected to represent average year conditions.
Figure 7.1 Historical Per-Capita Consumption Variation
Supply reliability for these historical conditions is presented in Table 7.4. The total amount of imported water in MWDSC’s drought years is less than during average year conditions. The total demand in 1992 (third dry year) is only approximately 85 percent of the average year 1993.
200
220
240
260
280
300
320
1989 1992 1995 1998 2001 2004 2007 2010
Co
ns
um
pti
on
(gp
cd
)
YearAnnual GPCD Baseline '89-'09 (261 GPCD)
Maximum gpcd 305
Average gpcd 261
+17%

City of Corona 2010 URBAN WATER MANAGEMENT PLAN
7-10 April 2012 pw://Carollo/Documents/Client/CA/Corona/8567A00/Deliverables/Ch07 (F)
Table 7.4 Supply Reliability – Historical Conditions
Water Supply Source Average Year
(1993) Single Dry Year
(1977)
Multiple Dry Years
1990 1991 1992
Imported (AFY) 12,798 3,255 17,501 15,541 13,903
% of Normal 100% 25% 137% 121% 109%
Groundwater (AFY) 13,951 7,889 8,451 6,587 8,957
% of Normal 100% 57% 61% 47% 64%
Reclaimed N/A N/A N/A N/A N/A
% of Normal N/A N/A N/A N/A N/A
Total (AFY) 26,749 11,144 25,953 22,128 22,860
% of Normal 100% 42% 97% 83% 85%
Notes: Source: Historical production records provided by City
Due to this decrease in demand in this 3-year period, it was considered not realistic to use this period as the basis for future multiple dry year planning. Instead, the year with the maximum per-capita usage was selected to project future demands during single and multiple dry years. This provided a more conservative approach to drought planning. As shown on Figure 7.1, the maximum per-capita use in the 21-year period was 305 gpcd, which is 17 percent higher than the average consumption of 261 gpcd.
This method differs from the single and multiple dry year demand projections presented in MWDSC’s 2010 Regional UWMP, but provides a more conservative planning basis.

City of Corona 2010 URBAN WATER MANAGEMENT PLAN
April 2012 7-11 pw://Carollo/Documents/Client/CA/Corona/8567A00/Deliverables/Ch07 (F)
7.4.1 Supply Reliability of Current Sources
The supply reliability of the City’s current water sources is summarized in Table 7.5. The data in Table 7.5 was generated by using MWDSC supply data to project supply values for imported water from 2011 to 2013. The projection assumes that groundwater will be utilized fully, while imported water will be used to meet the remaining potable demand. Reclaimed water supply is assumed to be limited by the current capacity of reclaimed water facilities, but not utilized fully due to lower demand.
Table 7.5 Supply Reliability – Current Water Sources
Supply Source Normal Year
Supply
Multiple Dry Year Water Supply
2011 2012 2013
Projected Supply as a % of Demand During Multiple Dry Years(1) 100% 115% 98% 114%
Imported Water Supply(2) 23,021 26,511 22,232 25,495
Groundwater Supply(3) 23,021 19,531 23,084 19,095
Reclaimed Water Supply(4) 11,201 11,201 11,201 11,201
Total Supply 57,244 57,244 56,518 55,792
Demands
Imported Water 23,021 22,658 22,295
Groundwater(3) 23,021 22,658 22,295
Reclaimed Water(6) 4,553 4,939 5,324
Total Demand 50,595 50,255 49,914
% of Year 2010(5) 114% 113% 113%
Notes: 1. From Table 13 of Appendix H. Normal year based on 2011.
2. Calculated by multiplying the imported water demand with the imported water supply (%) from Row 1. Normal year based on 2011.
3. Groundwater demands are established at 50% of total potable demands. Groundwater supply calculated as balance of potable demands. Potable demands estimated by linearly phasing demand between 2010 and 2015 and applying a 5.5% dry year factor. Normal year based on 2011.
4. Reclaimed water supply determined as tertiary treatment capacity in 2010
5. Year 2010 deliveries were 44,331 AFY.
6. Reclaimed water demands are not projected to offset potable demands in conservation projections since water conservation projections are targets that are independent of any potable water demand projections, which would be subject to further offsets. Reclaimed water demands represent an interpolation of 2010 usage and 2015 projected usage, multiplied by the drought demand factor.
As shown in Table 7.5, supply is projected to exceed demand under drought conditions for current water sources through 2013.

City of Corona 2010 URBAN WATER MANAGEMENT PLAN
7-12 April 2012 pw://Carollo/Documents/Client/CA/Corona/8567A00/Deliverables/Ch07 (F)
7.4.2 Demand Variations
The demand projections shown in Table 7.6 were obtained from the MWD-MAIN Water Use Forecasting System (MWD-Main), which is based on forecasts taken from the SCAG 2007 Regional Transportation Plan and the SANDAG Series 12: 2050 Regional Growth Forecast.
Table 7.6 MWDSC Retail Demands for Average, Single, and Multiple Dry Years
Retail Municipal and Industrial Demand
2015 (AFY)
2020 (AFY)
2025 (AFY)
2030 (AFY)
2035 (AFY)
Average Year (AFY) 4,978,000 5,170,000 5,330,000 5,491,000 5,627,000
Single Dry Year (AFY) 5,000,000 5,194,000 5,354,000 5,515,000 5,653,000
Multiple Dry Year (AFY) 5,004,000 5,232,000 5,409,000 5,572,000 5,715,000
Single Dry Year Increase(1) 0.4% 0.5% 0.5% 0.4% 0.5%
Multiple Dry Year Increase(1) 0.5% 1.2% 1.5% 1.5% 1.6%
Notes: 1. As percentage of Average Year Conditions. Source: Tables 2-6, 2-7, and 2-8 of Regional UWMP2.
As shown in Table 7.6, the MWDSC’s RUWMP shows that the single and multiple dry year retail municipal and industrial demands only increased between 0.4 and 1.6 percent. This is a very low estimate of demand increases, which typically involve a projected increase of at least 5 percent. Demand variations due to dry year conditions are anticipated to be less noticeable in the much larger service area of MWDSC than in the City’s service area because:
MWDSC’s customers may experience different levels of extreme dry weather within different portions of its large service area,
MWDSC’s service area includes many urban regions with very limited outdoor demands, making those areas less sensitive to weather variations, and
MWDSC’s service area includes more industrial and other non-residential demands that are not sensitive to weather.
In other words, the City’s demands are expected to increase more during hydrological dry years than MWDSC’s demand as the entire area would experience extreme dry weather conditions at the same time and because the primarily residential character with plentiful outdoor usage makes demands more weather dependent. Therefore, it was decided to use the City’s historical demands normalized for population (per-capita consumption), as shown on Figure 7.1, as a basis for projecting the demand increase during single and multiple dry years. This means that 1990 was chosen as the base year for both single and multiple dry year projections and that the average demands for these years were increased by 17 percent.
2 MWDSC, 2010

City of Corona 2010 URBAN WATER MANAGEMENT PLAN
April 2012 7-13 pw://Carollo/Documents/Client/CA/Corona/8567A00/Deliverables/Ch07 (F)
7.5 SUPPLY AND DEMAND COMPARISON
The UWMPA requires that the UWMP demonstrate that sufficient water supplies be available to meet the next 25 years of projected water demands.
7.5.1 Average Year
The projected average year demands and supplies compared in 5-year increments are presented in Table 7.7 through Table 7.17. This comparison consists of a number of steps described below.
Table 7.7 City of Corona Projected Average Year Water Demands
Description 2015 2020 2025 2030 2035
Projected Average Year Demand (AFY) 40,888 36,934 37,551 38,250 39,005
Increase Compared to 2010(1) (AFY) (3,443) (7,397) (6,781) (6,082) (5,326)
Increase Compared to 2010 -8% -17% -15% -14% -12%
Demand as % of 2010 Demand 92% 83% 85% 86% 88%
Notes: Based on a 2010 Average Year Demand of 44,331 AFY.
First, the projected average year demands for 2015 through 2020 were compared with the year 2010 demands. As shown, the projected demands for the entire planning period are projected to remain below the year 2010 demand. This decrease reflects the SBX7-7 water conservation targets combined with limited growth potential within the City. This trend is discussed in more detail later.
Secondly, the average year supplies from MWDSC for 2015 through 2020 are compared with the year 2010 supplies. This comparison only includes the current supply programs operated by MWDSC, such as the existing in-region storage programs, the SWP via the California Aqueduct, and the Colorado River Aqueduct. For conservative planning purposes, the capacities of the new programs that are under development are not included in the summary presented in Table 7.8. It should be noted that the average year supply for 2010 was obtained from the 2005 Regional UWMP as this information was not presented in the 2010 Plan. As shown, there has been a significant increase in the estimated supply capacity between year 2010 (2.7 million acre feet (maf)) and 2015 (3.5 maf).

City of Corona 2010 URBAN WATER MANAGEMENT PLAN
7-14 April 2012 pw://Carollo/Documents/Client/CA/Corona/8567A00/Deliverables/Ch07 (F)
Table 7.8 MWDSC Projected Average Year Supplies
Description 2015 2020 2025 2030 2035
Average Year Supply(1) (AFY) 3,485,000 3,810,000 4,089,000 3,947,000 3,814,000
Increase Compared to 2010(2) (AFY) 817,000 1,142,000 1,421,000 1,279,000 1,146,000
Increase Compared to 2010 31% 43% 53% 48% 43%
Supply as % of 2010 Supply 131% 143% 153% 148% 143%
Notes: 1. Based on current supply programs as listed in Table 2-11 from 2010 Regional UWMP. 2. Based on projected supply capacity of 2,668,000 AFY obtained from 2005 Regional UWMP.
Subsequently, projected MWDSC supplies and demands were compared under average year conditions. As shown in Table 7.9, the projected supplies are substantially greater (174 to 181 percent) than the projected demands through the planning horizon of 2035. This reflects a combination of increased water conservation efforts by the member agencies as well as an increase in supplies.
Table 7.9 MWDSC Projected Average Year Supply as Percentage of Demand
Description 2015 2020 2025 2030 2035
Average Year Supply(1) (AFY) 3,485,000 3,810,000 4,089,000 3,947,000 3,814,000
Average Year Demand(2) (AFY) 2,006,000 1,933,000 1,985,000 2,049,000 2,106,000
MWDSC Supply as % of Demand 174% 197% 206% 193% 181%
Notes: 1. Based on current supply programs as listed in Table 2-11 from 2005 Regional UWMP. 2. Based on total demands on Metropolitan as listed in Table 2-11 from 2010 Regional UWMP.
The last step to determine imported water supply and demand involves the comparison of the relative increase in the City’s demand with the relative increase in MWDSC supplies. This comparison is presented in Table 7.10. As shown, the imported water supplies are projected to increase substantially more (81 to 121 percent) than the City’s demands. This difference indicates that it is reasonable to expect that MWDSC would have sufficient supplies available to accommodate the City’s projected demands under average year conditions as WMWD would get its proportional share of the increased supplies as one of MWDSC’s 26 member agencies.

City of Corona 2010 URBAN WATER MANAGEMENT PLAN
April 2012 7-15 pw://Carollo/Documents/Client/CA/Corona/8567A00/Deliverables/Ch07 (F)
Table 7.10 Comparison of Supply and Demands Under a Normal Year
Row Description 2015 2020 2025 2030 2035
1 City of Corona Demand Increase as % of 2010 Demand (from Table 7.7)
92% 83% 85% 86% 88%
2 MWDSC Supply Increase as % of 2010 Supply (from Table 7.8)
131% 143% 153% 148% 143%
3 MWDSC Supply as % of Demand (from Table 7.9)
174% 197% 206% 193% 181%
4 Difference MWD Supply Increase and City of Corona Demand Increase (Row 3 – Row 1)
81% 114% 121% 106% 93%
Groundwater supply and demand projections are based on a few simpler assumptions. For future supply projections, the groundwater supply was assumed to be equal to currently existing well capacity. The assumption is made that pumping beyond the recommended levels in the 2008 GWMP will be made possible through groundwater recharge. Groundwater demand projections are determined by taking the total demand for the City and assuming that 50 percent will be satisfied with local groundwater. This production goal is based on the 2008 GWMP3.
Although the amount of groundwater stored within the groundwater basins will decrease during single or multiple dry year events due to lack of recharge, the 2008 GWMP does not plan for reduced groundwater supplies for the City’s groundwater basins. As such, groundwater supply is assumed to remain constant over the projected timeframe.
The ratios presented in Table 7.10 were used to project the imported water supply availability for each planning year. By combining the imported water supplies with the other supply sources, the total available supply capacity is calculated. The available supplies were then compared with projected demands to determine if the City has sufficient water supplies available to meet future demand under average year conditions. This summary is presented in Table 7.11. While reclaimed water cannot be used to meet potable demands, it has been included in the supply reliability models in order to examine the City’s total supply mix.
As discussed above, the imported water supplies shown in Table 7.11 are based on the amount of supply MWDSC has available as a percentage of normal year demands. While hydraulic capacity of the imported water connections and treatment capacity may exceed the imported water supply shown, it is anticipated that MWDSC’s available supply of imported water will be the limiting factor in the City’s imported water supply.
3 GWMP, 2008

City of Corona 2010 URBAN WATER MANAGEMENT PLAN
7-16 April 2012 pw://Carollo/Documents/Client/CA/Corona/8567A00/Deliverables/Ch07 (F)
The reclaimed water supply shown in Table 7.11 is based on the treatment capacity of the City’s WRFs. It is anticipated that the treatment capacity of the WRFs will be the limiting factor in the quantity of reclaimed water supply available.
Table 7.11 Supply and Demand Comparison – Normal Year
Water Sources 2015 2020 2025 2030 2035
Supply
Projected Supply as a % of Demand During a Normal Year(1) 174% 197% 206% 193% 181%
Imported Water Supply(2) 35,517 36,399 38,676 36,840 35,320
Groundwater Supply 24,921 24,921 24,921 24,921 24,921
Reclaimed Water Supply(4) 11,201 14,952 14,952 14,952 14,952
Total Supply 71,640 76,272 78,549 76,713 75,192
% of Normal Year 100% 100% 100% 100% 100%
Demands
Imported Water (AFY) 20,444 18,467 18,775 19,125 19,503
Groundwater(3) (AFY) 20,444 18,467 18,775 19,125 19,503
Reclaimed Water(6) (AFY) 5,222 6,873 6,873 6,873 6,873
Total Demand (AFY) 46,110 43,807 44,424 45,123 45,878
% of Year 2010(5) (AFY) 104% 99% 100% 102% 103%
Difference Supply - Demand 25,529 32,465 34,125 31,591 29,314
Difference as % of Supply 36% 43% 43% 41% 39%
Difference as % of Demand 55% 74% 77% 70% 64%
Notes: 1. From Table 7.9. 2. Calculated by multiplying the imported water demand with the imported water supply (%) from Row 1. 3. Groundwater demands are established at 50% of total potable demands. 4. Reclaimed water supply for 2015 is determined by tertiary treatment capacity in 2010; a portion of available wastewater flows were
used for year 2020 and thereafter. 5. Year 2010 deliveries were 44,331 AFY. 6. Reclaimed water demands are not projected to offset potable demands in conservation projections since water conservation
projections are targets that are independent of any potable water demand projections which would be subject to further offsets.
As shown in Table 7.11, it is projected that the City has sufficient supplies available to meet both potable and reclaimed water demands through 2035 under average year conditions with a supply surplus ranging from 55 to 77 percent of the projected demands. Although the reclaimed water supply of 14,952 AFY cannot be used to meet potable demands, removing the 8,000 AFY difference between reclaimed water supply and demand does not affect the conclusion that sufficient supplies are available to meet potable demands.

City of Corona 2010 URBAN WATER MANAGEMENT PLAN
April 2012 7-17 pw://Carollo/Documents/Client/CA/Corona/8567A00/Deliverables/Ch07 (F)
7.5.2 Single Dry Year
As described in the previous section, the projected average year potable and reclaimed water demands were increased by 17 percent to estimate water demands during dry years. The projected imported water supplies were obtained from MWDSC’s Regional 2010 UWMP. The projected single dry year demands and supplies compared in 5-year increments are presented in Table 7.12 and Table 7.13. Details on the calculations of the values presented in this table are included in Appendix H.
Table 7.12 Comparison of Supply and Demands under a Single Dry Year
Row Description 2015 2020 2025 2030 2035
1 City of Corona Demand Increase as % of 2010 Demand
108% 97% 99% 101% 103%
2 MWDSC Supply Increase as % of 2010 Supply 86% 98% 105% 99% 95%
3 MWDSC Supply as % of Demand 113% 129% 135% 125% 116%
4 Difference MWD Supply Increase and City of Corona Demand Increase (Row 3 – Row 1)
6% 31% 36% 25% 13%
Notes: Details on the calculations in each row are included in Appendix H.
Similar to the normal year, the imported water supplies shown in Table 7.13 are based on the amount of supply MWDSC anticipates having available in a single dry year as a percentage of normal year demands. While hydraulic capacity of the imported water connections and treatment capacity may exceed the imported water supply shown, it is anticipated that MWDSC’s available supply of imported water will be the limiting factor in the City’s imported water supply.
Similar to the normal year, the reclaimed water supply shown in Table 7.13 is based on the treatment capacity of the City’s WRFs. It is anticipated that the treatment capacity of the WRFs will be the limiting factor in the quantity of reclaimed water supply available and that the single year drought will have a limited impact on the quantity of wastewater available for use in the reclaimed water system.
Note that the reclaimed water demands are anticipated to increase in a single dry year similar to potable water demands. It is expected that the decreased rainfall associated with a single dry year will require additional irrigation demands.

City of Corona 2010 URBAN WATER MANAGEMENT PLAN
7-18 April 2012 pw://Carollo/Documents/Client/CA/Corona/8567A00/Deliverables/Ch07 (F)
Table 7.13 Supply and Demand Comparison – Single Dry Year
Water Sources 2015 2020 2025 2030 2035
Supply
Projected Supply as a % of Demand During a Single Dry Year(1) 113% 129% 135% 125% 116%
Imported Water Supply(2) 27,009 27,739 29,644 27,961 26,408
Groundwater Supply(3) 24,921 24,921 24,921 24,921 24,921
Reclaimed Water Supply(4) 11,201 14,952 14,952 14,952 14,952
Total Supply 63,131 67,612 69,517 67,834 66,281
% of Normal Year 88% 89% 89% 88% 88%
Demands
Imported Water 23,865 21,557 21,917 22,325 22,766
Groundwater(3) 23,865 21,557 21,917 22,325 22,766
Reclaimed Water(6) 6,096 8,023 8,023 8,023 8,023
Total Demand 53,826 51,137 51,857 52,673 53,555
% of Year 2010(5) 121% 115% 117% 119% 121%
Difference Supply - Demand 9,305 16,475 17,660 15,161 12,726
Difference as % of Supply 15% 24% 25% 22% 19%
Difference as % of Demand 17% 32% 34% 29% 24% Notes: 1. From Table 7.9. 2. Calculated by multiplying the imported water demand with the imported water supply (%) from Row 1. 3. Groundwater demands are established at 50% of total potable demands. 4. Reclaimed water supply for 2015 is determined by tertiary treatment capacity in 2010; a portion of available wastewater flows were
used for year 2020 and thereafter. 5. Year 2010 deliveries were 44,331 AFY. 6. Reclaimed water demands are not projected to offset potable demands since the projected demands are based on 20x2020 per-
capita targets, which already incorporate water conservation and offsets. Note that the City could work to convert more customers to reclaimed water during a drought year, but this effort would take time to implement.
As shown in Table 7.12, imported water supply availability is projected to increase more (6 to 36 percent) than City’s demands. This difference indicates that, similar to average year conditions, it is reasonable to expect that MWDSC would have sufficient supplies available to accommodate projected demands under single dry year conditions as the City would receive its proportional share of increased supplies.
The ratios presented in Table 7.12 were used to project imported water supply availability for each planning year. By combining imported water supplies with other supply sources, total available supply availability was calculated. The available supplies were then compared with projected demands to determine if the City has sufficient water supplies available to meet future demands under single dry year conditions. This summary is presented in Table 7.13.

City of Corona 2010 URBAN WATER MANAGEMENT PLAN
April 2012 7-19 pw://Carollo/Documents/Client/CA/Corona/8567A00/Deliverables/Ch07 (F)
As shown in Table 7.13, it is projected that the City has sufficient supplies available to meet both potable and reclaimed water demands through 2035 under single dry year conditions with a total supply surplus ranging from 17 to 34 percent of the projected demands. Although the reclaimed water supply of 14,952 cannot be used to meet potable demands, removing the 7,000 AFY difference between reclaimed water supply and reclaimed water demand does not affect the conclusion that sufficient supplies are available to meet demands.
7.5.3 Multiple Dry Years
The projected average year potable and reclaimed water demands were increased by 17 percent to estimate water demands during both single and multiple dry years. Projected imported water supplies were obtained from MWDSC’s Regional 2010 UWMP. The projected multiple dry year demands and supplies were compared in 5-year increments in Table 7.14 through Table 7.17. Details on the calculations of the values presented in this table are included in Appendix H.
Table 7.14 Comparison of Supply and Demands under Multiple Dry Years
Row Description 2015 2020 2025 2030 2035
1 City of Corona Demand Increase as % of 2010 Demand
108% 97% 99% 101% 103%
2 MWDSC Supply Increase as % of 2010 Supply 86% 92% 96% 94% 92%
3 MWDSC Supply as % of Demand 101% 110% 110% 105% 101%
4 Difference MWD Supply Increase and City Demand Increase(2) (Row 3 – Row 1)
-7% 13% 12% 4% -2%
Notes: 1. Details on the calculations in each row are included in Appendix H.
2. These percentages apply to the imported water component of the City’s supply mix. See Tables 7.14, 7.15, and 7.16 for the other components.
The data in Table 7.14 shows an important change in supply values. As a percent of demand, the imported water supplies are projected to increase less (-7 to +13 percent) than City demands. This difference indicates that City demands on imported water in a multiple dry year scenario might outpace MWDSC’s growth in supply. As this difference is based on percentage growth however, it is important to consider the absolute values presented in the tables below.
The ratios presented in Table 7.14 are used to project the imported water supply availability for each planning year. By combining the imported water supplies with the other supply sources, the total available supply capacity is calculated. The available supplies are then compared with the projected demands to determine if the City has sufficient water supplies available to meet future demand under multiple dry year conditions. This summary is presented in Table 7.15 (Dry Year 1), Table 7.16 (Dry Year 2), and Table 7.17 (Dry Year 3).

City of Corona 2010 URBAN WATER MANAGEMENT PLAN
7-20 April 2012 pw://Carollo/Documents/Client/CA/Corona/8567A00/Deliverables/Ch07 (F)
Table 7.15 Supply and Demand Comparison – Multiple Dry Year No. 1
Water Sources 2015 2020 2025 2030 2035
Supply
Projected Supply as a % of Demand During Multiple Dry Years(1) 101% 110% 110% 105% 101%
Imported Water Supply(2) 23,993 23,813 24,192 23,470 22,918
Groundwater Supply(3) 24,921 24,921 24,921 24,921 24,921
Reclaimed Water Supply(4) 11,201 14,952 14,952 14,952 14,952
Total Supply 60,115 63,686 64,065 63,343 62,791
% of Normal Year 84% 83% 82% 83% 84%
Demands
Imported Water 23,865 21,557 21,917 22,325 22,766
Groundwater(3) 23,865 21,557 21,917 22,325 22,766
Reclaimed Water(6) 6,096 8,023 8,023 8,023 8,023
Total Demand 53,826 51,137 51,857 52,673 53,555
% of Year 2010(5) 121% 115% 117% 119% 121%
Difference Supply - Demand 6,290 12,549 12,208 10,670 9,236
Difference as % of Supply 10.5% 20% 19% 17% 14.7%
Difference as % of Demand 11.7% 25% 24% 20% 17.2%
Notes: 1. From Table 7.9. 2. Calculated by multiplying the imported water demand with the imported water supply (%) from Row 1. 3. Groundwater demands are established at 50% of total potable demands. 4. Reclaimed water supply for 2015 is determined by tertiary treatment capacity in 2010; a portion of available wastewater flows were
used for year 2020 and thereafter. 5. Year 2010 deliveries were 44,331 AFY. 6. Reclaimed water demands are not projected to offset potable demands in conservation projections since water conservation
projections are targets that are independent of any potable water demand projections which would be subject to further offsets.
Similar to the single-dry year, the imported water supplies shown in Table 7.15, Table 7.16, and Table 7.17 are based on the amount of supply MWDSC anticipates having available in multiple dry years as a percentage of normal year demands. While hydraulic capacity of the imported water connections and treatment capacity may exceed the imported water supply shown, it is anticipated that MWDSC’s available supply of imported water will be the limiting factor in the City’s imported water supply.

City of Corona 2010 URBAN WATER MANAGEMENT PLAN
April 2012 7-21 pw://Carollo/Documents/Client/CA/Corona/8567A00/Deliverables/Ch07 (F)
Table 7.16 Supply and Demand Comparison – Multiple Dry Year No. 2
Water Sources 2016 2021 2026 2031 2036
Supply Projected Supply as a % of Demand During Multiple Dry Years(1) 101% 110% 110% 105% 101% Imported Water Supply(2) 23,529 23,893 24,282 23,563 23,008 Groundwater Supply(3) 24,921 24,921 24,921 24,921 24,921 Reclaimed Water Supply(4) 11,201 14,952 14,952 14,952 14,952 Total Supply 59,651 63,766 64,155 63,436 62,881 % of Normal Year 83% 84% 82% 83% 84%
Demands Imported Water 23,403 21,629 21,999 22,413 22,856 Groundwater(3) 23,403 21,629 21,999 22,413 22,856 Reclaimed Water(6) 6,096 8,023 8,023 8,023 8,023 Total Demand 52,903 51,281 52,020 52,850 53,735 % of Year 2010(5) 119% 116% 117% 119% 121%
Difference Supply - Demand 6,749 12,485 12,135 10,587 9,146 Difference as % of Supply 11.3% 20% 19% 17% 14.5% Difference as % of Demand 12.8% 24% 23% 20% 17.0% Notes: 1. See footnotes listed in Table 7.15.
Similar to the single dry year, reclaimed water supplies are based on the treatment capacity of the City’s WRFs. It is anticipated that the treatment capacity of the WRFs will be the limiting factor in the quantity of reclaimed water supply available and that the multiple year drought will have a limited impact on the quantity of wastewater available for use in the reclaimed water system. Note that the reclaimed water demands are anticipated to increase in multiple dry years similar to potable water demands. It is expected that the decreased rainfall associated with a multiple dry year scenario will require additional irrigation demands.
As discussed in Section 0, historically demands have decreased in later years of a multiple dry year scenario due to the mandatory conservation efforts associated with a drought. However, for conservative planning purposes, demands are assumed to continue to be elevated in each year of the drought due to the decreased precipitation and associated increase in irrigation requirements.

City of Corona 2010 URBAN WATER MANAGEMENT PLAN
7-22 April 2012 pw://Carollo/Documents/Client/CA/Corona/8567A00/Deliverables/Ch07 (F)
Table 7.17 Supply and Demand Comparison – Multiple Dry Year No. 3
Water Sources 2017 2022 2027 2032 2037
Supply Projected Supply as a % of Demand During Multiple Dry Years(1) 101% 110% 110% 105% 101% Imported Water Supply(2) 23,065 23,972 24,372 23,656 23,099 Groundwater Supply(3) 24,921 24,921 24,921 24,921 24,921 Reclaimed Water Supply(4) 11,201 14,952 14,952 14,952 14,952 Total Supply 59,187 63,845 64,245 63,529 62,972 % of Normal Year 83% 84% 82% 83% 84%
Demands Imported Water 22,942 21,701 22,080 22,501 22,946 Groundwater(3) 22,942 21,701 22,080 22,501 22,946 Reclaimed Water(6) 6,096 8,023 8,023 8,023 8,023 Total Demand 51,980 51,425 52,184 53,026 53,915 % of Year 2010(5) 117% 116% 118% 120% 122%
Difference Supply - Demand 7,208 12,420 12,062 10,503 9,057 Difference as % of Supply 12.2% 19% 19% 17% 14.4% Difference as % of Demand 13.9% 24% 23% 20% 16.8% Notes: 1. See footnotes listed in Table 7.15.
As shown in Table 7.15 through Table 7.17, the projected demands for each source are lower than the projected supplies in each year of a 3-year multiple dry year period.
As with normal year and dry year scenarios, the reclaimed water supply cannot be used to meet potable demands, but even after removing the 7,000 AFY of surplus of reclaimed supply (the difference between reclaimed water supply and reclaimed water demand), sufficient potable water supplies are available to meet potable demands in all 3 years of the multiple dry year scenario. In the projected year with the least supply surplus, year 2015 as the first year in multiple dry year sequence, there is 6,290 AFY of surplus including reclaimed water. After deducting the 5,106 AFY surplus of reclaimed water, there is still a surplus of 1,184 AFY when comparing potable supplies to potable demands. In that scenario, the potable surplus is still 2 percent greater than the potable demand.
Although the increase in demands outstrips MWDSC’s growth in supply as a percentage, MWDSC is still projected as being able to meet the total volume of potable water needed by the City. In several of the multiple dry year scenarios, MWDSC supply capability will be taxed within a few hundred acre feet of its availability, but in all cases demands will be met. It should be noted that these dry year demand summaries include two key conservative planning assumptions as discussed in the methodology.
The projected available supply from MWDSC only includes the existing supply programs and does not include the programs that are currently under development that are estimated

City of Corona 2010 URBAN WATER MANAGEMENT PLAN
April 2012 7-23 pw://Carollo/Documents/Client/CA/Corona/8567A00/Deliverables/Ch07 (F)
to increase the imported water supplies by 17 to 39 percent, depending on the planning year and hydrologic conditions (see Table 7.1). It should be noted that these planned programs increase the total available imported water supply relatively more during single and multiple dry years than during average years.
Both potable water and reclaimed water demands during single and multiple dry years are assumed to increase by 17 percent, which represents the maximum per capita demand increase in the period 1990 through 2009.
Based on the positive supply surplus shown in this section and the two conservative planning assumptions listed above, it can be concluded that the City has sufficient supplies available to meet both potable and reclaimed water demands through 2035 under average, single dry year, and multiple dry year conditions.
7.6 TRANSFER AND EXCHANGE OPPORTUNITIES
Regional water transfer and exchange opportunities were provided by the 2005 UWMP and Integrated Regional Water Management Plan.
Table 7.18 Water Transfer and Exchange Opportunities
Source Water Transfer
Transfer or Exchange
Short Term or Long Term
Proposed Volume (AFY)
City of Riverside Transfer Short Term 2,210
Lee Lake Water District Transfer Short Term -
EVMWD Transfer Short Term 5,000
Western Riverside Corona Feeder
Transfer Short Term -
Riverside Gage Canal Transfer Short Term -
SAWPA Transfer Short Term 18,100
Total 25,310
As shown, the City is planning multiple short term transfer projects with regional partners. However, the City is not anticipating any long term transfer projects or opportunities at this time.

City of Corona 2010 URBAN WATER MANAGEMENT PLAN
7-24 April 2012 pw://Carollo/Documents/Client/CA/Corona/8567A00/Deliverables/Ch07 (F)
7.7 WATER QUALITY IMPACTS ON SUPPLY
10634. The plan shall include information, to the extent practicable, relating to the quality of existing sources of water available to the supplier over the same 5-year increments as described in subdivision (a) of Section 10631 and the manner in which water quality affects management strategies and supply reliability.
7.7.1 Local Groundwater Quality
The groundwater in the City’s region tends to be highly mineralized. TDS concentrations in the Coldwater and Bedford subbasins are generally lower and range from 300 to 650 mg/L. The average TDS range for the Temescal Basin is much higher, ranging from 307 to 1,950 mg/L.
Elevated nitrate concentrations have been documented in the Temescal Subbasin since at least the 1950s. Water quality data indicate nitrate concentrations ranging from 0.3 to 124 mg/L. Although the average nitrate concentration in the subbasin is 41 mg/L, nitrate concentrations in 28 of the 72 subbasin wells do not meet the primary MCL standard of 45 mg/L for drinking water. This is what necessitates the use of the Temescal Desalter for the City to utilize groundwater from the Temescal Basin. The highest nitrate concentrations are associated with wells at the Arlington Gap where concentrations of groundwater entering Temescal Subbasin exceed 100 mg/L. Elevated nitrate concentrations are also generally located along Temescal Wash and on the western alluvial fan. Groundwater quality in City wells typically does not meet federal or state drinking water standards for nitrate (45 mg/L). Nitrate concentrations measured in the City production wells typically range from 4.0 to 110 mg/L. Most wells will continue to require treatment and/or blending to meet regulatory requirements.
In the Coldwater Subbasin, groundwater nitrate concentrations for six water supply wells range from 0.4 to 6.5 mg/L, significantly below the MCL. Although data were generally unavailable for the Bedford Subbasin, DWR reports historical elevated nitrate and sulfate concentrations in the area; however, one recent sample from a Bedford Subbasin well indicated a relatively low nitrate (as N) concentration of 1.2 mg/L4.
It is anticipated that the City will continue to depend on groundwater as a reliable water supply source; however, with the current treatment and desalination capabilities water supply changes due to water quality are not expected.
7.7.2 Imported Water Quality
The City’s imported water is supplied by MWD through WMWD. Details of MWDSC’s water quality can be found in its 2010 RUWMP.
4 GWMP, 2008

City of Corona 2010 URBAN WATER MANAGEMENT PLAN
April 2012 7-25 pw://Carollo/Documents/Client/CA/Corona/8567A00/Deliverables/Ch07 (F)
7.8 OPPORTUNITIES FOR DESALINATED WATER
10631. A plan shall be adopted in accordance with this chapter and shall do all of the following:
10631 (i) Describe the opportunities for development of desalinated water, including, but not limited to, ocean water, brackish water, and groundwater, as a long term supply.
The UWMPA requires that the UWMP address the opportunities for development of desalinated water, including ocean water, brackish water, and groundwater. The opportunities for the City and MWDSC are described separately below.
7.8.1 City of Corona Desalination Opportunities
As summarized in Table 7.19, there are no future opportunities for further desalination.
Table 7.19 Desalination Opportunities for the City of Corona
Sources of Water Future Opportunities for Desalinated Water
Ocean Water None
Brackish Ocean Water None
Brackish Groundwater Already in Place
Other None
7.8.2 Groundwater Desalination
As mentioned in Chapter 3, while the Coldwater Subbasin provides relatively high quality water, the Temescal Basin does not meet the EPA and DHS MCL’s for nitrate (45 mg/L). The shallow basin groundwater typically has high levels of nitrate (4.0 to 110 mg/L) that require treatment and/or blending to meet regulatory requirements.
The Temescal Desalter is located in the northern part of the City and has a total rated capacity of 15 mgd. The Temescal Desalter serves to reduce nitrate and TDS levels in local groundwater to meet drinking water quality standards (nitrate) and wastewater discharge standard (TDS).
Additional desalination efforts include the Integrated Chino – Arlington Desalter System Project (ICADSP). The City is considering purchasing water when the project is implemented. It is estimated that up to 18,000 AFY may be available once the ICADSP is completed. The City does not currently have other opportunities or needs for groundwater desalination.

City of Corona 2010 URBAN WATER MANAGEMENT PLAN
7-26 April 2012 pw://Carollo/Documents/Client/CA/Corona/8567A00/Deliverables/Ch07 (F)
7.8.3 Seawater Desalination
It is neither practical nor economically feasible to implement a seawater desalination program at this time. Due to geographic placement of the City’s service area, it would not be cost effective to pump desalinated water from the ocean.
7.8.4 MWDSC’s Desalination Program
Although the City has not identified any specific project opportunities for desalination of seawater at this time, other desalination projects developed by MWDSC within the region indirectly benefit the City. The recent efforts to develop and implement desalination by MWDSC as described in its regional 2010 UWMP are summarized below.
MWDSC’s Seawater Desalination Program (SDP) was created in 2001 to encourage the development of seawater desalination by local agencies and was modeled after the Local Resources Program (LRP). Like the LRP, it offers sliding-scale incentives to member and local agencies that proceed up to $250/acre-foot of produced supplies. The incentive is designed to accelerate the development of expensive local supply projects by member agencies by lowering their cost. MWDSC has entered into four SDP agreements, while a fifth potential agreement with the Los Angeles Department of Water and Power (LADWP) that could potentially produce up to 28,000 AFY, is currently on hold. In addition, there are currently three other desalination projects under development by local agencies within MWDSC’s service area outside the SDP. The desalination projects are summarized in Table 7.20. The potential capacity of all these combined projects range from 270,000 to 422,000 AFY.
Table 7.20 MWDSC Desalination Project Opportunities
Project Name MemberAgency
Capacity (AFY)
Status N/A
Long Beach Seawater Desalination Project(1) LBWD 10,000 Pilot Study
South Orange Coastal Ocean Desalination Project(1) MWDOC 16,000-28,000 Pilot Study
Carlsbad Seawater Desalination Project(1) SDCWA 56,000 Permitting
West Basin Seawater Desalination Project(1) WBMWD 20,000 Pilot Study
LADWP Seawater Desalination Project LADWP 28,000 Unknown
Huntington Beach Seawater Desalination Project MWDOC 56,000 Permitting
Camp Pendleton Seawater Desalination Project SDCWA 56,000-168,000 Planning
Rosarito Beach Seawater Desalination Feasibility Study SDCWA 28,000-56,000 Feasibility Study
Notes: 1. These SDPs have executed incentive agreements with MWDSC.
To promote the development of local seawater desalination projects, MWDSC provides regional facilitation by supporting member agency projects during permit hearings and other proceedings, coordinating responses to potential legislation and regulations, and working

City of Corona 2010 URBAN WATER MANAGEMENT PLAN
April 2012 7-27 pw://Carollo/Documents/Client/CA/Corona/8567A00/Deliverables/Ch07 (F)
with the member agencies to resolve related issues, such as greenhouse gas emission standards and seawater intake regulations, that could impact the projects. MWDSC has also formed a special committee to find additional ways to promote potential projects and explore opportunities for developing regional seawater desalination supplies.


April 2012 8-1 pw://Carollo/Documents/Client/CA/Corona/8567A00/Deliverables/Ch08.doc (F)
Chapter 8
WATER SHORTAGE CONTINGENCY PLAN
The UWMPA requires that the UWMP include an urban water shortage contingency analysis that includes stages of action to be undertaken in the event of water supply shortages; a draft water shortage contingency resolution or ordinance; prohibitions, consumption reduction methods and penalties; an analysis of revenue and expenditure impacts and measures to overcome these impacts; actions to be taken during a catastrophic interruption; and a mechanism for measuring water use reduction.
This chapter references several relevant ordinances and resolutions related to water conservation. These ordinances and resolutions are represented in Table 8.1 and provided in Appendix F for reference.
Table 8.1 City Ordinances and Resolutions for Water Shortage Measures
Ordinance or Resolution Number Date Objective of Legislation
Ordinance 2962 7 January 2009 Details the adoption, implementation and enforcement of the City’s water conservation program.
Ordinance 2996 1 July 2009 Amends City watering restrictions.
Ordinance 3025 17 February 2010 Implements a budget-based, tiered structure for water rates.
Notes: Copies are available in Appendix F.
8.1 STAGES OF ACTIONS
The UWMPA requires that the UWMP include an urban water shortage contingency analysis that addresses specified issues.
10632. The plan shall provide an urban water shortage contingency analysis, which includes each of the following elements, which are within the authority of the urban water supplier:
10632 (a) Stages of action to be undertaken by the urban water supplier in response to water supply shortages, including up to a 50-percent reduction in water supply and an outline of specific water supply conditions which are applicable to each stage.

City of Corona 2010 URBAN WATER MANAGEMENT PLAN
8-2 April 2012 pw://Carollo/Documents/Client/CA/Corona/8567A00/Deliverables/Ch08.doc (F)
8.1.1 Water Shortage Stages and Reduction Objectives
The City has invested considerable effort and capital in developing a diverse water supply to ensure redundancy and flexibility in dealing with supply interruptions.
Historically, the City has responded to water shortages through implementation of conservation measures. In 1991, the City adopted a resolution for a program of voluntary reduction of nonessential uses of water to reduce consumption by 15 percent during the multiple year drought at the time. In addition, the City implemented penalty rates during a water shortage emergency.
Currently, Chapter 13.26 of the Corona Municipal Code, as amended by Ordinance 2962 (included in Appendix F), details the City’s current water conservation rules and water shortage contingency plan. The stages and their objectives can be found in Table 8.2.

City of Corona 2010 URBAN WATER MANAGEMENT PLAN
April 2012 8-3 pw://Carollo/Documents/Client/CA/Corona/8567A00/Deliverables/Ch08.doc (F)
Table 8.2 Water Shortage Stages and Reduction Objectives
Stage Description Objectives
1 Normal Water Supply
Applies during periods when the City is able to meet all of the water demands of its customers.
In effect at all times unless the City Council otherwise declares that another water conservation stage is in effect.
2 Minimum Water Shortage
Applies during periods when a reasonable probability exists that the City will not be able to meet all of the water demands of its customers.
Water customers shall reduce their water consumption by 10 to 15 percent of a base year consumption amount.
3 Moderate Water Shortage
Applies during periods when the City will not be able to meet all of the water demands of its customers.
The objective of the measures undertaken in Water Conservation Stage 3 is to reduce water system consumption within the City by 16to 20 percent as determined and recommended by the General Manager.
All water conservation and drought response measures of Water Conservation Stages 1 and 2 shall be in full force and effect during Water Conservation Stage 3.
4 Severe Water Shortage
Applies during periods when the City will not be able to meet all of the water demands of its customers.
The objective of the measures undertaken in Water Conservation Stage 4 is to reduce water consumption within the City by 21 to 40 percent as determined and recommended by the General Manager.
5 Critical Water Shortage
The objective of the measures undertaken in Water Conservation Stage 5 is to reduce water consumption by 40 percent or more as determined and recommended by the General Manager.
All water conservation and drought response measures of Water Conservation Stages 1, 2, 3, and 4 shall be in full force and effect during Water Conservation Stage 5.
Notes: The list of actions undertaken in each stage is provided in Section 8.2.1.
As shown in Table 8.2, the water shortage stages include consideration of water shortages up to Stage 5, a Critical Water Shortage, which includes reductions in water consumption by 40 percent or more.
8.2 PROHIBITIONS, CONSUMPTION REDUCTION METHODS, AND PENALTIES
The UWMPA requires that the UWMP include an urban water shortage contingency analysis that addresses methods to reduce consumption.

City of Corona 2010 URBAN WATER MANAGEMENT PLAN
8-4 April 2012 pw://Carollo/Documents/Client/CA/Corona/8567A00/Deliverables/Ch08.doc (F)
10632. The plan shall provide an urban water shortage contingency analysis, which includes each of the following elements, which are within the authority of the urban water supplier:
10632 (d) Additional, mandatory prohibitions against specific water use practices during water shortages, including, but not limited to, prohibiting the use of potable water for street cleaning.
10632 (e) Consumption reduction methods in the most restrictive stages. Each urban water supplier may use any type of consumption reduction methods in its water shortage contingency analysis that would reduce water use, are appropriate for its area, and have the ability to achieve a water use reduction consistent with up to a 50-percent reduction in water supply.
10632 (f) Penalties or charges for excessive use, where applicable.
8.2.1 Mandatory Prohibitions on Water Wasting
The City’s reduction methods used to meet the goals presented in Table 8.2 are as follows:
Stage 1 – Normal Water Supply:
- All normal water efficiency programs and water conservation regulations of the City, including the City’s landscape design guidelines for commercial and industrial developments may be adopted.
- Allowing water to drain onto adjacent properties or streets due to excessive irrigation or leaks is prohibited.
- Failing to repair a water leak is prohibited.
- Using water to wash down outdoor surfaces such as sidewalks, driveways, parking areas, and tennis courts (except for safety or sanitation hazards) is prohibited.
Stage 2 – Minimum Water Shortage:
- Lawns or ground covers may be watered and landscaping may be irrigated for a maximum of 20 minutes per station per day three days per week (reclaimed water use permitted at any time).
- All open hoses shall be equipped with automatic, positive, shut-off nozzles.
- All swimming pools, spas, ponds, and fountains shall be equipped with re-circulating pumps.
- All plumbing leaks, improperly adjusted sprinklers, or other water conduits/fixtures that require repair or adjustment shall be corrected to the satisfaction of the City.
- No person shall use water to wash down sidewalks, driveways, parking areas, tennis courts, patios, or other paved or hard surface areas, except to alleviate immediate fire or sanitation hazards.
- No person shall allow water to leave his or her property by drainage onto adjacent properties or public or private roadways or streets due to excessive irrigation and/or uncorrected leaks.

City of Corona 2010 URBAN WATER MANAGEMENT PLAN
April 2012 8-5 pw://Carollo/Documents/Client/CA/Corona/8567A00/Deliverables/Ch08.doc (F)
- The washing of automobiles, trucks, trailers, boats, airplanes and other types of mobile equipment, is permitted at any time with a hand-held bucket or a hand-held hose equipped with an automatic, positive, shut-off nozzle for quick rinses. Washing may be done at any time on the immediate premises of a commercial car wash or commercial service station, or by a mobile car wash or on-site car wash using high pressure washing equipment.
- Use of water from fire hydrants shall be limited to fire fighting, related activities, or other activities necessary to maintain the health, safety, and welfare of the public.
- All restaurants are prohibited from serving water to their patrons except when specifically requested by the patrons.
- Construction operations receiving water from a construction meter or water truck shall not use water unnecessarily for any purpose other than those required by regulatory agencies.
Stage 3 – Moderate Water Shortage:
- All water conservation and drought response measures of Water Conservation Stages 1 and 2 shall be in full force and effect during Water Conservation Stage 3, with irrigation reduced from three days per week to two days per week.
- Water customers shall reduce their water consumption by 16 to 20 percent, as determined and recommended by the General Manager, from the base year consumption.
- The overfilling of swimming pools and spas is prohibited. The filling or refilling of ponds, streams, and artificial lakes is prohibited.
- The operation of any ornamental fountain or similar structure is prohibited except for short periods of time to prevent damage.
- The number of new construction meters shall not exceed the number of currently authorized meters removed from service. A new meter shall be issued only when an old meter is returned. Construction projects requiring water from a construction meter or a water truck shall not use water unnecessarily for any purposes other than those required by 11 regulatory agencies. Construction projects requiring water for new landscapes shall adhere to the designated days and watering windows.
Stage 4 – Moderate Water Shortage:
- All water conservation and drought response measures of Water Conservation Stages 1, 2 and 3 shall be in full force and effect during Water Conservation Stage 4, with irrigation reduced from two days per week to one day per week.
- Irrigation of landscaping shall be limited to supporting minimal survival of trees and shrubs (reclaimed water shall not be permitted to run into city streets or the City storm water conveyance system).

City of Corona 2010 URBAN WATER MANAGEMENT PLAN
8-6 April 2012 pw://Carollo/Documents/Client/CA/Corona/8567A00/Deliverables/Ch08.doc (F)
- The washing of automobiles, trucks, trailers, boats, airplanes and other types of mobile equipment is prohibited. Washing is permitted at any time on the immediate premises of a commercial car wash.
- The use of water for cooling mists is prohibited.
- The use of water for commercial, manufacturing, or processing purposes shall be reduced in volume by an amount determined by the City Council and/or as recommended by the General Manager.
- No new construction meters will be issued. Construction water shall not be used for earth work, road construction purposes, dust control, compaction, or trenching jetting. Construction projects necessary to maintaining the health, safety, and welfare of the public, as determined by the City, are exempt from these regulations.
Stage 5 – Critical Water Shortage:
- All water conservation and drought response measures of Water Conservation Stages 1, 2, 3 and 4 shall be in full force and effect during Water Conservation Stage 5.
- All outdoor watering and irrigation of lawns and ground cover, and landscaping is prohibited.
- Provided the City Council has declared a water shortage emergency pursuant to California Water Code sections 350 et seq., the City shall not allow any new connections to the water system during Water Conservation Stage 5.
8.2.2 Water Reduction Stage Triggering Mechanisms
The mechanisms which trigger the City’s reduction methods presented in Table 8.2 are as follows:
Stage 1:
- In effect at all times, unless another stage has been declared.
Stage 2:
- A regional water supply shortage exists and a regional public outreach campaign is being implemented asking or requiring all persons to reduce water use.
- Groundwater wells are inoperable or unusable.
- Alternative water supplies are limited or unavailable.
- Groundwater levels or groundwater quality is approaching levels which may require augmentation of the groundwater basin or other actions necessary to protect the groundwater basin.
Stage 3:
- A regional water supply shortage exists and a regional public outreach campaign is being implemented asking or requiring all persons to reduce water use.

City of Corona 2010 URBAN WATER MANAGEMENT PLAN
April 2012 8-7 pw://Carollo/Documents/Client/CA/Corona/8567A00/Deliverables/Ch08.doc (F)
- Groundwater wells are inoperable or unusable.
- Alternative water supplies are limited or unavailable.
- Groundwater levels or groundwater quality is approaching levels which may require augmentation of the groundwater basin or other actions necessary to protect the groundwater basin.
Stage 4:
- A regional water supply shortage exists and a regional public outreach campaign is being implemented asking or requiring all persons to reduce water use.
- Groundwater wells are inoperable or unusable.
- Alternative water supplies are limited or unavailable.
- Groundwater levels or groundwater quality is approaching levels, which may require augmentation of the groundwater basin or other actions necessary to protect the groundwater basin.
- A major failure of any supply or distribution facility, whether temporary or permanent, occurs in the water distribution system of the State, the Metropolitan Water District of Southern California, the Western Municipal Water District, or City water facilities.
Stage 5:
- A regional water supply shortage exists and a regional public outreach campaign is being implemented asking or requiring all persons to reduce water use.
- Groundwater wells are inoperable or unusable.
- Alternative water supplies are limited or unavailable.
- Groundwater levels or groundwater quality is approaching levels which may require augmentation of the groundwater basin or other actions necessary to protect the groundwater basin.
- A major failure of any supply or distribution facility, whether temporary or permanent, occurs in the water distribution system of the State, the Metropolitan Water District of Southern California, the Western Municipal Water District, or City water facilities.
8.2.3 Excessive Use Penalties
According to the Corona Municipal Code, a violation of any of the prohibitions shall be a misdemeanor subject to imprisonment in the county jail for not more than thirty days or by fine not to exceed $1,000, or, by both, as provided in California Water Code section 377.
The City can alternatively seek injunctive relief in the Superior Court or take enforcement action, including discontinuing or appropriately limiting water service to any customer, for violations to Chapter 13.26 of the Corona Municipal Code.

City of Corona 2010 URBAN WATER MANAGEMENT PLAN
8-8 April 2012 pw://Carollo/Documents/Client/CA/Corona/8567A00/Deliverables/Ch08.doc (F)
According to Ordinance 2962 located in Appendix F, the General Manager or his or her designee shall serve an invoice for costs upon the person or responsible person who is subject to a notice of violation, a cease and desist order, or an administrative compliance order. An invoice for costs shall be immediately due and payable to the City. If any person or responsible person fails to either pay the invoice for costs or appeal successfully the invoice for costs in accordance with this Chapter 13.26, then the City may institute collection proceedings. The invoice for costs may include reasonable attorneys’ fees.
The City shall impose any other penalties or regulatory fees, as fixed from time to time by resolution of the City Council, for a violation or enforcement of Chapter 13.26. Fees and charges may include costs for a visiting water conservation specialist, or other City staff, cost of monitoring, inspection, and surveillance, cost of enforcing compliance, cost of reinitiating service, and the cost of processing any fees necessary to carry out the provisions of the City’s water conservation regulatory program.
8.2.4 Review Process
Consideration of written applications for relief from compliance (“relief”) regarding the regulations and restrictions on water use set forth in this chapter 13.26 may be made by the City.
Written applications for relief shall be accepted, and may be granted or denied, by the approving authority at his or her sole discretion.
8.3 WATER SHORTAGE CONTINGENCY ORDINANCE/RESOLUTION
According to the UWMPA, the UWMP is required to include an urban water shortage contingency analysis that includes a draft water shortage contingency resolution or ordinance.
UWMPA:
10632. The plan shall provide an urban water shortage contingency analysis, which includes each of the following elements, which are within the authority of the urban water supplier:
10632 (h) A draft water shortage contingency resolution or ordinance.
The City’s water shortage contingency plan is established in Ordinance 2962, included in Appendix F. The restrictions were amended in Ordinance 2996, also included in Appendix F.

City of Corona 2010 URBAN WATER MANAGEMENT PLAN
April 2012 8-9 pw://Carollo/Documents/Client/CA/Corona/8567A00/Deliverables/Ch08.doc (F)
8.4 REVENUE AND EXPENDITURE IMPACTS/MEASURES TO OVERCOME IMPACTS
According to the UWMPA, the UWMP is required to include an urban water shortage contingency analysis that addresses the financial impacts from reduced water sales.
10632. The plan shall provide an urban water shortage contingency analysis, which includes each of the following elements, which are within the authority of the urban water supplier:
10632 (g) An analysis of the impacts of each of the actions and conditions described in subdivisions (a) to (f), inclusive, on the revenues and expenditures of the urban water supplier, and proposed measures to overcome those impacts, such as the development of reserves and rate adjustments.
10632 (g) An analysis of the impacts of each of the proposed measures to overcome those revenue and expenditure impacts, such as the development of reserves and rate adjustments.
The majority of operating costs for most water agencies are fixed rather than a function of the amount of water sold. As a result, when significant conservation programs are undertaken, as is necessary during a water shortage, it is frequently necessary to raise water rates because the revenue generated is based on lower total consumption while the revenue required is basically fixed.
It is anticipated that the City will determine the extent of any revenue and expenditure imbalance as well as proposed measures to overcome impacts to City revenues and expenditure imbalances at the time the water shortage has started. Some possible actions the City can take include utilizing reserves or raising rates in event of a sustained water shortage. On a longer term basis, reductions in water demands, especially peak demands, can delay the need to develop costly new water sources in growing communities. Therefore, to help offset some lost revenues, expansion projects can be delayed.
8.5 ACTIONS DURING A CATASTROPHIC INTERRUPTION
The UWMPA requires that the UWMP include an urban water shortage contingency analysis that addresses a catastrophic interruption of water supplies.
10632. The plan shall provide an urban water shortage contingency analysis, which includes each of the following elements, which are within the authority of the urban water supplier:
10632 (c) Actions to be undertaken by the urban water supplier to prepare for, and implement during, a catastrophic interruption of water supplies including, but not limited to, a regional power outage, an earthquake, or other disaster.

City of Corona 2010 URBAN WATER MANAGEMENT PLAN
8-10 April 2012 pw://Carollo/Documents/Client/CA/Corona/8567A00/Deliverables/Ch08.doc (F)
The forth and fifth water shortage stages of the City’s water shortage contingency plan indicate catastrophic interruption as a triggering mechanism. In the event of a catastrophic interruption, the City would proceed directly to a stage four or stage five water shortage.
8.6 REDUCTION MEASURING MECHANISM
10632. The plan shall provide an urban water shortage contingency analysis, which includes each of the following elements, which are within the authority of the urban water supplier:
10632 (i) A mechanism for determining actual reductions in water use pursuant to the urban water shortage contingency analysis.
The City’s water system currently has water meters on all production sources and customer connections. These meters record the amount of water consumed at each location. Customer consumption totals are tallied on a bi-monthly basis for billing purposes. The City will monitor City water consumption during a shortage more closely by reviewing water production records on a frequent basis to determine if water use is actually being reduced. In addition, the City can also periodically review customer consumption patterns to determine if water use is declining.