city of miami, florida of grants administration 931,100 72,755 142,357 788,743 non-departmental...
TRANSCRIPT
City of Miami, Florida
Monthly Financial Report November 2013
Prepared by City of Miami Staff

TABLE OF CONTENTS
Section 1 – General Fund 1
Financial Update – General Fund ................................................................................................................ 1-1
Annual Budget vs. Year to Date (YTD) Actual ........................................................................................... 1-2
Month-to-Month Comparison ...................................................................................................................... 1-3
Prior YTD vs. Current YTD ......................................................................................................................... 1-4
Section 2 – Internal Service Funds 2
Financial Update – Internal Service Funds ................................................................................................. 2-1
Combining Balance Sheet ............................................................................................................................. 2-2
Combining Statement of Revenues, Expenditures, and Changes in Fund Balance ................................ 2-3
Section 3 – Special Revenue Funds 3
Financial Update – Special Revenue Funds ................................................................................................ 3-1
Non-Reimbursable Expenditures of Grant Programs ............................................................................... 3-3
Combining Balance Sheet ............................................................................................................................. 3-4
Combining Statement of Revenues, Expenditures, and Changes in Fund Balance ................................ 3-9
Section 4 – Debt Service Funds 4
Financial Update – Debt Service Funds ...................................................................................................... 4-1
Combining Balance Sheet – Summary ........................................................................................................ 4-2
Combining Balance Sheet – Detail ............................................................................................................... 4-3
Combining Statement of Revenues, Expenditures, and Changes in Fund Balance - Summary ............ 4-7
Combining Statement of Revenues, Expenditures, and Changes in Fund Balance - Detail ................... 4-9
Section 5 – Capital Project Funds 5
Financial Update – Capital Project Funds .................................................................................................. 5-1
Combining Balance Sheet ............................................................................................................................. 5-4
Combining Statement of Revenues, Expenditures, and Changes in Fund Balance ................................ 5-7
Section 6 – Cash Position 6
Financial Update – Cash Position for all City of Miami Funds ................................................................ 6-1
Cash Position – All Funds ............................................................................................................................. 6-2
Section 7 – Investments 7
Financial Update – Investment Portfolio..................................................................................................... 7-1
Portfolio – Interest Income ........................................................................................................................... 7-2
Portfolio – Details .......................................................................................................................................... 7-3
Total Investments Outstanding .................................................................................................................... 7-4
Section 8 – Cash Payments Received on Major Accounts Receivables 8
Financial Update – Accounts Receivable ..................................................................................................... 8-1
Cash Payments Received and Aging on Major Accounts Receivables ..................................................... 8-2

Section 1 – General Fund
Financial Update – General Fund
Annual Budget vs. Year to Date (YTD) Actual
Month-to-Month Comparison
Prior YTD vs. Current YTD

1 - 1
Financial Update – General Fund Fiscal Year 2014 - For the Month of November
Property Tax revenues make up 36.67% of General
Fund collected revenue. As of November 30, 2013
property taxes collected were $23,165,941. The
majority of property tax revenue is collected during
the months of December through February. To
achieve the annual budget of $225,733,400, an
additional $202.57 million needs to be collected.
Property Tax Revenues Collected Compared to
Annual Budget - Cumulative Collection Rate
Month FY 12 FY 13
October 0.00 0.00
November 8.17% 10.26%
December 36.72%
January 76.29%
February 76.66%
March 80.77 %
April 82.86%
May 88.97%
June 91.21%
July 94.72%
August 94.72%
Franchise Fee collections make up 5.71% of the
General Fund revenues collected, totaling
$3,605,125. To achieve the annual budget of
$99,191,900, an additional $95.59 million will need
to be collected. Franchise fees are collected on
electric, cable, telephone, gas services, local option
gas tax and community service taxes.
Business Tax Receipts (BTR) and Other Licenses
& Permits represent 24.80% of revenues collected.
As of November 30, 2013, licensing and permitting
revenues collected totaled $15,663,650. To achieve
the annual budget of $43,633,500, an additional
$27.97 million needs to be collected. Many of these
revenues are billed and collected on an annual basis.
Business Tax Receipts represents 20% of the total
licensing and permitting budget.
Intergovernmental Revenues make up 6.90% of
collected revenues. As of November 30, 2013,
intergovernmental revenues collected totaled
$4,356,066. To achieve the annual budget, an
additional $42.76 million needs to be collected. The
majority of these revenues come from sales tax, state
shared revenues and grants. State Shared Revenues
represents the largest share of Intergovernmental
Revenues.
Charges for Service is the second largest revenue
source of the General Fund making up 26.00% of
revenues collected. As of November 30, 2013,
charges for services collected totaled $16,431,717.
To achieve the annual budget an additional $76.76
million needs to be collected. The largest component
of this category is the solid waste fee. The solid
waste charges are billed on the annual property tax
bill; therefore, the majority of these fees are
collected during the months of December through
February.
Fines and Forfeitures is one of the smallest
revenue sources of the General Fund, representing
0.32% of the revenues collected. As of November
30, 2013, collections totaled $200,432. Court fines
are the largest component of this revenue line item.
Interest Revenues are budgeted at $1,000,000. This
is approximately 0.19% of total budgeted revenues.
It includes gains and losses on the City’s
Investments. Due to fluctuations in the Market as of
November 30th, 2013 the City has suffered a loss of
$1,436,470.
Other Revenues include miscellaneous receipts that
cannot be categorized with another line item. It
represents 1.87% revenues collected. Other revenues
collected totaled $1,181,221.
Total General Fund expenditures are $67,317,187
which represents 13.88% of the annual budget of
$484,954,300 million. The City continues to monitor
departmental budgetary compliance.
BTR,
Licensing &
Permits 24.80%
Charges for
Services
26.00%
Interest
-2.27%
Property
Tax
36.67%
Other
1.87%
Franchise
5.71%
Fines
0.32%
Intergov't
6.90%
Transfer In
0.00%
General Fund Revenues Collected

Current Year to Date Year to Date
Budget** Month Actual* Actual* Variance
Revenues:
Property Tax 225,733,400 23,165,941 23,165,941 202,567,459
Franchise and Other Taxes*** 99,191,900 3,579,574 3,605,125 95,586,775
Business Tax Receipts 43,633,500 (288,795) 15,663,650 27,969,850
Fines and Forfeitures 4,019,200 80,460 200,432 3,818,768
Intergovernmental 47,112,200 3,256,190 4,356,066 42,756,134
Charges for Services 93,194,300 9,066,220 16,431,717 76,762,583
Interest 1,000,000 692,676 (1,436,470) 2,436,470
Other 11,018,100 459,628 1,181,221 9,836,879
Total Revenues 524,902,600 40,011,895 63,167,682 461,734,918
Expenditures:
Mayor 957,200 71,315 143,668 813,532
Board of Commissioners 2,489,100 181,419 398,189 2,090,911
Office of City Manager 2,924,700 245,823 485,671 2,439,029
Office of NET 3,376,000 248,106 507,732 2,868,268
Office of Code Enforcement 4,533,700 367,778 803,557 3,730,143
Office of City Clerk 1,508,500 101,196 220,778 1,287,722
Office of Civil Service 370,900 23,730 51,346 319,554
Office of Auditor General 1,078,200 80,305 162,595 915,605
Office of Communication 1,049,600 93,594 184,760 864,840
Office of City Attorney 6,104,600 447,924 890,582 5,214,018
Office of Equal Opportunity & Diversity Programs 329,400 28,115 56,000 273,400
Budget 1,755,600 141,006 284,395 1,471,205
Employee Relations 3,566,700 260,181 534,513 3,032,187
Finance 8,010,800 551,642 1,135,453 6,875,347
Capital Improvements Administration 5,157,200 394,694 586,278 4,570,922
Information Technology 8,544,100 581,985 1,162,754 7,381,346
Purchasing 1,567,000 119,230 242,606 1,324,394
Total General Government 53,323,300 3,938,043 7,850,879 45,472,421
Building 9,282,500 659,886 1,361,741 7,920,759
Planning 5,820,800 389,745 813,766 5,007,034
Total Planning and Development 15,103,300 1,049,631 2,175,507 12,927,793
General Service Administration 21,124,700 1,449,919 2,983,953 18,140,747
Public Works 16,351,400 1,641,081 2,315,153 14,036,247
Solid Waste 27,568,500 1,767,152 3,293,031 24,275,469
Total Public Works 65,044,600 4,858,152 8,592,136 56,452,464
Fire 99,634,700 9,113,191 16,650,477 82,984,223
Police 168,720,600 13,324,710 26,636,187 142,084,413
Total Public Safety 268,355,300 22,437,901 43,286,664 225,068,636
Public Facilities 6,465,400 467,125 832,101 5,633,299
Parks and Recreation 29,118,500 2,161,540 4,049,613 25,068,887
Risk Management 12,646,300 815,653 1,159,834 11,486,466
Risk - Group Benefits 317,900 25,721 (787,736) 1,105,636
Total Other 48,548,100 3,470,039 5,253,813 43,294,287
Office of Grants Administration 931,100 72,755 142,357 788,743
Non-Departmental 33,648,600 2,454,566 (29,602) 33,678,202
Total Non-Departmental 34,579,700 2,527,321 112,755 34,466,945
GESE & FIPO - 23,471 45,433 (45,433)
Total Expenditures 484,954,300 38,304,557 67,317,187 417,637,113
Revenues Over (Under) Expenditures 39,948,300 1,707,338 (4,149,505) 44,097,805
Operating transfers in*** - - - -
Operating transfers out (39,948,300) - - (39,948,300)
Other Financing Sources/(Uses) (39,948,300) - - (39,948,300)
Total Revenues Over/(Under) Expenditures - 1,707,338 (4,149,505) 4,149,505
* Unaudited, As adjusted through November 30, 2013
**Amounts obtained from Budget Dept
City of Miami
Monthly Financial Statement - General Fund Only
Annual Budget vs. YTD Actual
Year to Date November 30, 2013
1 - 2

Year to Date Year to Date
Budget Actual* Budget Actual* Budget Actual % Change
Revenues:
Property Tax 225,733,400 - 225,733,400 23,165,941 - 23,165,941 0%
Franchise and Other Taxes 99,191,900 25,551 99,191,900 3,605,125 - 3,579,574 14010%
Business Tax Receipts 43,633,500 15,952,446 43,633,500 15,663,650 - (288,796) -2%
Fines and Forfeitures 4,019,200 119,971 4,019,200 200,432 - 80,461 67%
Intergovernmental 47,112,200 1,099,877 47,112,200 4,356,066 - 3,256,189 296%
Charges for Services 93,194,300 7,365,497 93,194,300 16,431,717 - 9,066,220 123%
Interest 1,000,000 (2,129,146) 1,000,000 (1,436,470) - 692,676 -33%
Other 11,018,100 721,593 11,018,100 1,181,221 - 459,628 64%
Total Revenues 524,902,600 23,155,787 524,902,600 63,167,682 - 40,011,893
Expenditures:
Mayor 957,200 72,353 957,200 143,668 - 71,315 99%
Board of Commissioners 2,489,100 216,771 2,489,100 398,189 - 181,418 84%
Office of City Manager 2,924,700 239,849 2,924,700 485,671 - 245,822 102%
Office of NET 3,376,000 259,626 3,376,000 507,732 - 248,106 96%
Office of Code Enforcement 4,533,700 435,779 4,533,700 803,557 - 367,778 84%
Office of City Clerk 1,508,500 119,582 1,508,500 220,778 - 101,196 85%
Office of Civil Service 370,900 27,616 370,900 51,346 - 23,730 86%
Office of Auditor General 1,078,200 82,290 1,078,200 162,595 - 80,305 98%
Office of Communication 1,049,600 91,166 1,049,600 184,760 - 93,594 103%
Office of City Attorney 6,104,600 442,658 6,104,600 890,582 - 447,924 101%
Office of Equal Opportunity & Diversity Programs 329,400 27,885 329,400 56,000 - 28,115 101%
Budget 1,755,600 143,389 1,755,600 284,395 - 141,006 98%
Employee Relations 3,566,700 274,333 3,566,700 534,513 - 260,180 95%
Finance 8,010,800 583,811 8,010,800 1,135,453 - 551,642 94%
Capital Improvement Administration 5,157,200 191,584 5,157,200 586,278 - 394,694 206%
Information Technology 8,544,100 580,769 8,544,100 1,162,754 - 581,985 100%
Purchasing 1,567,000 123,376 1,567,000 242,606 - 119,230 97%
Total General Government 53,323,300 3,912,836 53,323,300 7,850,879 - 3,938,042
Building 9,282,500 701,856 9,282,500 1,361,741 - 659,885 94%
Planning 5,820,800 424,021 5,820,800 813,766 - 389,745 92%
Total Planning and Development 15,103,300 1,125,877 15,103,300 2,175,507 - 1,049,630
General Service Administration 21,124,700 1,534,034 21,124,700 2,983,953 - 1,449,919 95%
Public Works 16,351,400 674,072 16,351,400 2,315,153 - 1,641,081 243%
Solid Waste 27,568,500 1,525,878 27,568,500 3,293,031 - 1,767,153 116%
Total Public Works 65,044,600 3,733,984 65,044,600 8,592,136 - 4,858,152
Fire 99,634,700 7,537,286 99,634,700 16,650,477 - 9,113,191 121%
Police 168,720,600 13,311,477 168,720,600 26,636,187 - 13,324,710 100%
Total Public Safety 268,355,300 20,848,763 268,355,300 43,286,664 - 22,437,901
Public Facilities 6,465,400 364,976 6,465,400 832,101 - 467,125 128%
Parks and Recreation 29,118,500 1,888,073 29,118,500 4,049,613 - 2,161,540 114%
Risk Management 12,646,300 344,182 12,646,300 1,159,834 - 815,652 237%
Risk - Group Benefits 317,900 (813,456) 317,900 (787,736) - 25,720 -3%
Total Other 48,548,100 1,783,774 48,548,100 5,253,813 - 3,470,038
Office of Grants Administration 931,100 69,603 931,100 142,357 - 72,754 105%
Non-Departmental 33,648,600 (2,484,168) 33,648,600 (29,602) - 2,454,566 -99%
Total Non-Departmental 34,579,700 (2,414,565) 34,579,700 112,755 - 2,527,320
GESE & FIPO - 21,961 - 45,433 - 23,472 107%
Total Expenditures 484,954,300 29,012,630 484,954,300 67,317,187 - 38,304,555
Revenues Over (Under) Expenditures 39,948,300 (5,856,843) 39,948,300 (4,149,505) - 1,707,338
Operating transfers in - - - - - - 0%
Operating transfers out (39,948,300) - (39,948,300) - - - 0%
Other Financing Sources/(Uses) (39,948,300) - (39,948,300) - - -
Total Revenues Over/(Under) Expenditures - (5,856,843) - (4,149,505) - 1,707,338
* Unaudited, As adjusted through November 30, 2013
October 2013 November 2013 Variance
City of Miami
Monthly Financial Statement - General Fund Only
Comparative October 2013 to November 2013
1 - 3

Year to Date Year to Date
Budget Actual* Budget Actual* Budget Actual % Change
Revenues:
Property Tax 217,631,200 17,771,451 225,733,400 23,165,941 8,102,200 5,394,490 30%
Franchise and Other Taxes 97,870,700 7,458,504 99,191,900 3,605,125 1,321,200 (3,853,379) -52%
Business Tax Receipts 40,294,100 10,413,587 43,633,500 15,663,650 3,339,400 5,250,064 50%
Fines and Forfeitures 4,400,200 (36,725) 4,019,200 200,432 (381,000) 237,157 -646%
Intergovernmental 44,984,600 2,093,955 47,112,200 4,356,066 2,127,600 2,262,111 108%
Charges for Services 87,997,000 15,182,293 93,194,300 16,431,717 5,197,300 1,249,424 8%
Interest 800,000 332,928 1,000,000 (1,436,470) 200,000 (1,769,398) -531%
Other 9,201,200 1,490,540 11,018,100 1,181,221 1,816,900 (309,320) -21%
Total Revenues 503,179,000 54,706,534 524,902,600 63,167,682 21,723,600 8,461,148
Expenditures:
Mayor 883,500 142,179 957,200 143,668 (73,700) (1,489) -1%
Board of Commissioners 2,416,100 382,679 2,489,100 398,189 (73,000) (15,510) -4%
Office of City Manager 2,847,000 410,715 2,924,700 485,671 (77,700) (74,956) -18%
Office of NET 3,495,800 544,032 3,376,000 507,732 119,800 36,300 7%
Office of Code Enforcement 4,417,300 760,630 4,533,700 803,557 (116,400) (42,927) -6%
Office of City Clerk 1,455,500 191,319 1,508,500 220,778 (53,000) (29,460) -15%
Office of Civil Service 393,700 64,859 370,900 51,346 22,800 13,514 21%
Office of Auditor General 1,071,400 139,465 1,078,200 162,595 (6,800) (23,130) -17%
Office of Communication 924,900 124,679 1,049,600 184,760 (124,700) (60,082) -48%
Office of City Attorney 5,768,800 929,864 6,104,600 890,582 (335,800) 39,281 4%
Office of Equal Opportunity & Diversity Programs 314,200 54,150 329,400 56,000 (15,200) (1,850) -3%
Budget 1,535,400 251,086 1,755,600 284,395 (220,200) (33,309) -13%
Employee Relations 3,087,800 437,385 3,566,700 534,513 (478,900) (97,129) -22%
Finance 7,743,200 1,006,701 8,010,800 1,135,453 (267,600) (128,752) -13%
Capital Improvement Administration 3,906,000 (60,273) 5,157,200 586,278 (1,251,200) (646,552) 1073%
Information Technology 11,034,100 1,808,064 8,544,100 1,162,754 2,490,000 645,310 36%
Purchasing 1,440,300 222,889 1,567,000 242,606 (126,700) (19,717) -9%
Total General Government 52,735,000 7,410,422 53,323,300 7,850,879 (588,300) (440,457)
Building 7,632,700 1,037,337 9,282,500 1,361,741 (1,649,800) (324,404) -31%
Planning 4,683,800 766,958 5,820,800 813,766 (1,137,000) (46,809) -6%
Total Planning and Development 12,316,500 1,804,295 15,103,300 2,175,507 (2,786,800) (371,212)
General Service Administration 20,519,900 3,036,810 21,124,700 2,983,953 (604,800) 52,857 2%
Public Works 16,907,700 2,217,251 16,351,400 2,315,153 556,300 (97,901) -4%
Solid Waste 26,852,500 3,878,607 27,568,500 3,293,031 (716,000) 585,576 15%
Total Public Works 64,280,100 9,132,668 65,044,600 8,592,136 (764,500) 540,532
Fire 99,639,800 13,737,665 99,634,700 16,650,477 5,100 (2,912,812) -21%
Police 155,723,000 26,723,966 168,720,600 26,636,187 (12,997,600) 87,779 0%
Total Public Safety 255,362,800 40,461,631 268,355,300 43,286,664 (12,992,500) (2,825,033)
Public Facilities 5,873,600 668,946 6,465,400 832,101 (591,800) (163,155) -24%
Parks and Recreation 29,002,100 4,046,664 29,118,500 4,049,613 (116,400) (2,949) 0%
Risk Management 13,183,200 1,680,076 12,646,300 1,159,834 536,900 520,241 31%
Risk - Group Benefits 382,300 (225,326) 317,900 (787,736) 64,400 562,409 -250%
Total Other 48,441,200 6,170,360 48,548,100 5,253,813 (106,900) 916,547
Office of Grants Administration 833,100 130,952 931,100 142,357 (98,000) (11,405) -9%
Non-Departmental 32,594,100 2,313,062 33,648,600 (29,602) (1,054,500) 2,342,664 101%
Total Non-Departmental 33,427,200 2,444,014 34,579,700 112,755 (1,152,500) 2,331,259
GESE & FIPO 657,600 85,095 - 45,433 657,600 39,663 47%
-
Total Expenditures 467,220,400 67,508,486 484,954,300 67,317,187 (17,733,900) (191,298.32)
Revenues Over (Under) Expenditures 35,958,600 (12,801,952) 39,948,300 (4,149,505) 3,989,700 8,269,850
Operating transfers in 69,900 - - - (69,900) - 0%
Operating transfers out (36,028,500) - (39,948,300) - (3,919,800) - 0%
Other Financing Sources/(Uses) (35,958,600) - (39,948,300) - (3,989,700) -
Total Revenues Over/(Under) Expenditures - (12,801,952) - (4,149,505) - 8,269,850
* Unaudited, As adjusted through November 30, 2013
Favorable (Unfavorable)
City of Miami
Monthly Financial Statement - General Fund Only
Comparative November 2012 to November 2013
Current Year MTD vs Prior Year MTD
November 2012 November 2013 Year to Year Variance
1 - 4

Section 2 –
Internal Service Funds
Financial Update – Internal Service Funds
Combining Balance Sheet
Combining Statement of Revenues, Expenditures, and
Changes in Fund Balance

2 - 1
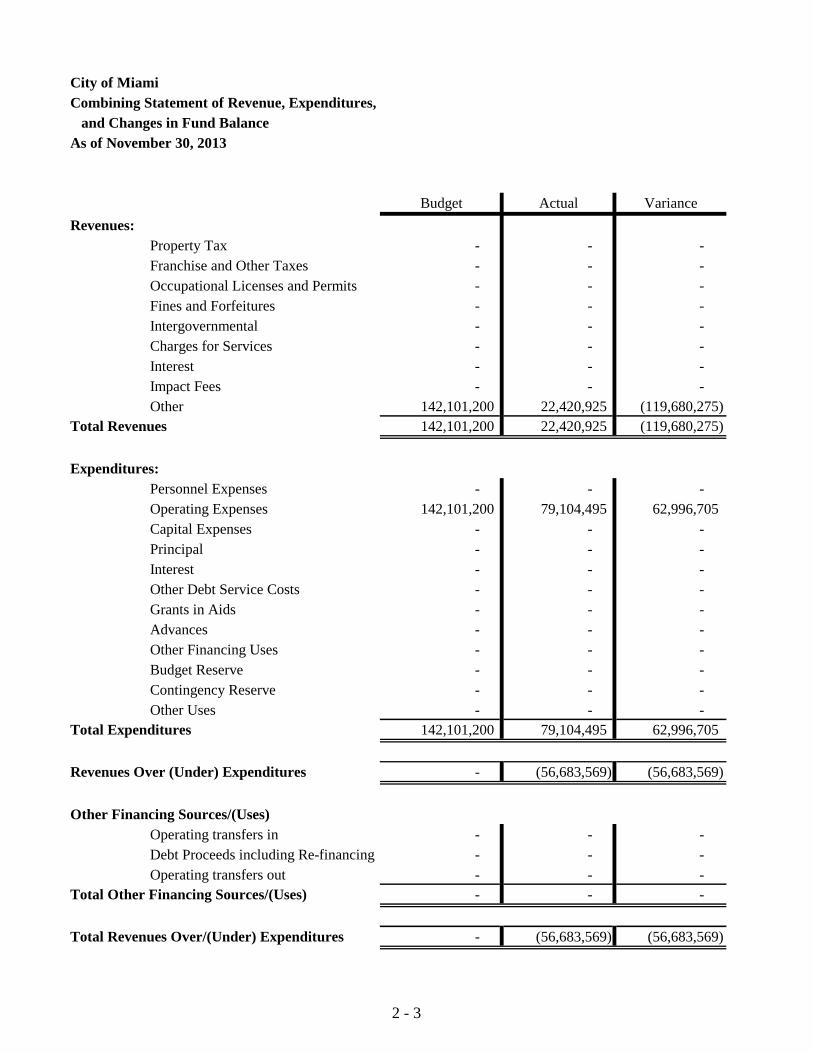
Financial Update - Internal Service Funds
Fiscal Year 2014 – For the Month of November
Services provided to other City funds are budgeted and accounted separately in the
Internal Service Fund. The City’s Internal Service fund is used to provide a central
financing mechanism and self-insurance reserve for the payments relating to
employee health insurance, worker’s compensation and pension costs.
As of November 30, 2013, the department has collected $22.4 million of the
expected $142.1 million for the fiscal year and has expenditures in the amount of
$79.1 million of the expected $142.1 million.

City of Miami
Combining Balance Sheets
Internal Service Fund
As of November 30, 2013
Actual
Assets
103000 Cash With Fiscal Agent -
104000 Equity In Pooled Cash (55,581,390)
115000 Accounts Receivable 56,933
115090 Unbilled Receivable -
117000 Allowance For Uncollectible (20,686)
135000 Interest And Dividends Recei -
137000 Market Gain/Loss Investments -
151900 Investments-Non_Current -
155000 Prepaid -
Total Assets (55,545,143)
Liabilities and Fund Balance
Liabilities:
202000 Accounts Payable (369,516)
205000 Contracts Payable -
205100 Retainage Payable -
214000 Accrued Expenditure Payable -
216000 Accrued Wages Payable 138,195
223000 Deferred Revenue -
223100 Deferred Revenue-PnG -
239900 Other Long-Term Liabilities (915,251)
Total Liabilities (1,146,573)
Fund Balance (Deficit):
305000 Fund Balance-Reserved for En -
315000 Fund Balance-Unreserved 56,691,715
Total Fund Balance (Deficit) 56,691,715
Total Liabilities and Fund Balance 55,545,143
2 - 2
City of Miami
Combining Statement of Revenue, Expenditures,
and Changes in Fund Balance
As of November 30, 2013
Budget Actual Variance
Revenues:
Property Tax - - -
Franchise and Other Taxes - - -
Occupational Licenses and Permits - - -
Fines and Forfeitures - - -
Intergovernmental - - -
Charges for Services - - -
Interest - - -
Impact Fees - - -
Other 142,101,200 22,420,925 (119,680,275)
Total Revenues 142,101,200 22,420,925 (119,680,275)
Expenditures:
Personnel Expenses - - -
Operating Expenses 142,101,200 79,104,495 62,996,705
Capital Expenses - - -
Principal - - -
Interest - - -
Other Debt Service Costs - - -
Grants in Aids - - -
Advances - - -
Other Financing Uses - - -
Budget Reserve - - -
Contingency Reserve - - -
Other Uses - - -
Total Expenditures 142,101,200 79,104,495 62,996,705
Revenues Over (Under) Expenditures - (56,683,569) (56,683,569)
Other Financing Sources/(Uses)
Operating transfers in - - -
Debt Proceeds including Re-financing - - -
Operating transfers out - - -
Total Other Financing Sources/(Uses) - - -
Total Revenues Over/(Under) Expenditures - (56,683,569) (56,683,569)
2 - 3

Section 3 –
Special Revenue Funds
Financial Update – Special Revenue Fund
Non-Reimbursable Expenditures of Grant Program
Combining Balance Sheet
Combining Statement of Revenues, Expenditures, and
Changes in Fund Balance

3 - 1
Financial Update – Special Revenue Fund
Fiscal Year 2014 – For the Month of November
Staff has completed the reconciliation of the Special Revenue Funds (SRF). Through this process,
the following Special Revenue Funds have been defined and will be reported in the
Comprehensive Annual Financial Report (CAFR).The following are the SRF as of November 30,
2013:
Community Development Services
Community Redevelopment Area (CRA – OMNI)
Community Redevelopment Area (CRA – SEOPW)
Community Redevelopment Area (CRA – MIDTOWN)
Homeless
Economic Development & Planning Services
Fire Rescue Services
NET Offices
Parks and Recreation Services
Police Services
Law Enforcement Trust Fund
Public Works Services
City Clerk Services
Miami Ballpark Facilities
Emergency Funds
Community Development Services – SHIP
Community Development Services – Section 8 Voucher
General Special Revenue
Department Improvement Initiatives
Transportation and Transit
Public Facilities
Liberty City
Virginia Key
Civilian Investigative Panel

3 - 2
Revenues
Special revenue funds are used to account for the proceeds of specific revenue sources that are
legally restricted to expenditure for specified purpose. The primary sources of revenues for the
special revenues fund of the City of Miami consist of taxes, grants, assessments, and fees. As of
November 30, 2013, year to date revenues were $13,242,753.56. The revenues by fund are
depicted in the following chart:
As revealed by the chart, Community Redevelopment Area (CRA-SEOPW), Community
Development and Fire, contribute approximately 95% of total revenues for the City’s special
revenue funds. These funds show revenues of $6,368,258; $4,827,321; and $1,382,144,
respectively.
Grant Revenues
The City receives the majority of its grant revenues from the Department of Housing and Urban
Development (HUD). The Community Development Block Grant (CDBG) and Housing
Opportunities for People with Aids (HOPWA) are the largest programs currently administered by
the City. As of November 30, 2013, the City received CDBG and HOPWA revenues of
approximately $937,576 and $2,367,766 respectively.
CRA-OMNI 2%
CRA-SEOPW 48%
CD 37%
Fire 10%
Public Facilities 4%
General Special Revenue
-13%
Parks 2%
Police 1%
Law Enf. Trust Fund 1%
Public Works 2%
Dept Improv 2%
Virginia Key Beach Park 1%
Miami Ballpark Parking Facilities
1% Section 8
2%
Revenues by Fund

3 - 3
Expenditures
The expenditures for the SRF were $10,503,919 as of November 30, 2013. Community
Development, Fire Department, and Police Department funds have the highest expenditures within
the SRF. These funds represent approximately 69% of total expenditures as demonstrated below:
Non-Reimbursable Expenditures of Grant Programs
The Finance Department is responsible for reporting expenses incurred which are not reimbursable
under grant programs per the Financial Integrity Principles, Chapter 18 of the Code of the City of
Miami.
For the month ending November 30, 2013, there are no non-reimbursable expenditures reported.
CRA-OMNI 4%
CRA-SEOPW 9%
CD 43%
Homeless 2%
Fire 18%
General Special Revenue
0%
Parks 3%
Police 8%
Dept Improvement 2%
Transportation & Transit
3%
Miami Ballpark Parking Facilities
2%
Section 8 4%
Expenditures by Fund

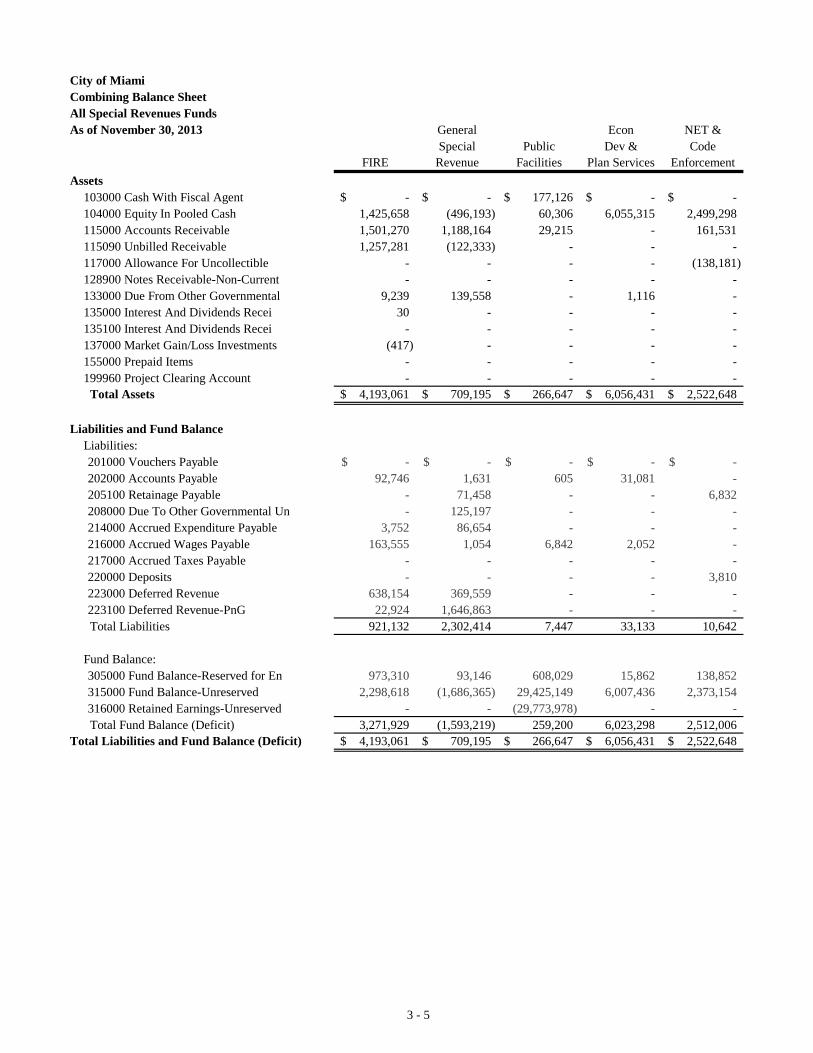
City of Miami
Combining Balance Sheet
All Special Revenues Funds
As of November 30, 2013
Community
OMNI MIDTOWN SEOPW Development Homeless
Assets
103000 Cash With Fiscal Agent -$ -$ -$ 377,612$ -$
104000 Equity In Pooled Cash 18,014,817 (6,999) 34,877,351 7,854,367 (437,955)
115000 Accounts Receivable 821,793 - - 1,823,395 468,314
115090 Unbilled Receivable 347,422 - - 1,496,870 5,813
117000 Allowance For Uncollectible - - - (673,832) -
128900 Notes Receivable-Non-Current - - - 1,794 -
133000 Due From Other Governmental - - - - -
135000 Interest And Dividends Recei 9,309 - 14,069 398 -
135100 Interest And Dividends Recei - - - 3,953 -
137000 Market Gain/Loss Investments (96,859) - (181,995) (5,391) -
155000 Prepaid Items - - - - -
199960 Project Clearing Account - - - - -
Total Assets 19,096,482$ (6,999)$ 34,709,426$ 10,879,165$ 36,171$
Liabilities and Fund Balance
Liabilities:
201000 Vouchers Payable -$ -$ -$ -$ -$
202000 Accounts Payable (31,081) - 542,222 1,117,500 83
205100 Retainage Payable 299,104 - 228,483 15,036 -
208000 Due To Other Governmental Un - - (3,287) 659,832 -
214000 Accrued Expenditure Payable 6,563 - 2,765 22,343 419
216000 Accrued Wages Payable - - - 88,010 49,290
217000 Accrued Taxes Payable - - 140 - -
220000 Deposits - - - 1,845,842 -
223000 Deferred Revenue 6,609 - - 558,082 182
223100 Deferred Revenue-PnG - - - 716 -
Total Liabilities 281,195 - 770,323 4,307,359 49,973
Fund Balance:
305000 Fund Balance-Reserved for En 4,589,215 - 3,845,368 2,727,905 11,164
315000 Fund Balance-Unreserved 14,226,072 (6,999) 29,829,247 3,833,456 (24,966)
316000 Retained Earnings-Unreserved - - 264,488 10,445 -
Total Fund Balance (Deficit) 18,815,287 (6,999) 33,939,103 6,571,806 (13,802)
Total Liabilities and Fund Balance (Deficit) 19,096,482$ (6,999)$ 34,709,426$ 10,879,165$ 36,171$
3 - 4
City of Miami
Combining Balance Sheet
All Special Revenues Funds
As of November 30, 2013
Assets
103000 Cash With Fiscal Agent
104000 Equity In Pooled Cash
115000 Accounts Receivable
115090 Unbilled Receivable
117000 Allowance For Uncollectible
128900 Notes Receivable-Non-Current
133000 Due From Other Governmental
135000 Interest And Dividends Recei
135100 Interest And Dividends Recei
137000 Market Gain/Loss Investments
155000 Prepaid Items
199960 Project Clearing Account
Total Assets
Liabilities and Fund Balance
Liabilities:
201000 Vouchers Payable
202000 Accounts Payable
205100 Retainage Payable
208000 Due To Other Governmental Un
214000 Accrued Expenditure Payable
216000 Accrued Wages Payable
217000 Accrued Taxes Payable
220000 Deposits
223000 Deferred Revenue
223100 Deferred Revenue-PnG
Total Liabilities
Fund Balance:
305000 Fund Balance-Reserved for En
315000 Fund Balance-Unreserved
316000 Retained Earnings-Unreserved
Total Fund Balance (Deficit)
Total Liabilities and Fund Balance (Deficit)
General Econ NET &
Special Public Dev & Code
FIRE Revenue Facilities Plan Services Enforcement
-$ -$ 177,126$ -$ -$
1,425,658 (496,193) 60,306 6,055,315 2,499,298
1,501,270 1,188,164 29,215 - 161,531
1,257,281 (122,333) - - -
- - - - (138,181)
- - - - -
9,239 139,558 - 1,116 -
30 - - - -
- - - - -
(417) - - - -
- - - - -
- - - - -
4,193,061$ 709,195$ 266,647$ 6,056,431$ 2,522,648$
-$ -$ -$ -$ -$
92,746 1,631 605 31,081 -
- 71,458 - - 6,832
- 125,197 - - -
3,752 86,654 - - -
163,555 1,054 6,842 2,052 -
- - - - -
- - - - 3,810
638,154 369,559 - - -
22,924 1,646,863 - - -
921,132 2,302,414 7,447 33,133 10,642
973,310 93,146 608,029 15,862 138,852
2,298,618 (1,686,365) 29,425,149 6,007,436 2,373,154
- - (29,773,978) - -
3,271,929 (1,593,219) 259,200 6,023,298 2,512,006
4,193,061$ 709,195$ 266,647$ 6,056,431$ 2,522,648$
3 - 5

City of Miami
Combining Balance Sheet
All Special Revenues Funds
As of November 30, 2013
Assets
103000 Cash With Fiscal Agent
104000 Equity In Pooled Cash
115000 Accounts Receivable
115090 Unbilled Receivable
117000 Allowance For Uncollectible
128900 Notes Receivable-Non-Current
133000 Due From Other Governmental
135000 Interest And Dividends Recei
135100 Interest And Dividends Recei
137000 Market Gain/Loss Investments
155000 Prepaid Items
199960 Project Clearing Account
Total Assets
Liabilities and Fund Balance
Liabilities:
201000 Vouchers Payable
202000 Accounts Payable
205100 Retainage Payable
208000 Due To Other Governmental Un
214000 Accrued Expenditure Payable
216000 Accrued Wages Payable
217000 Accrued Taxes Payable
220000 Deposits
223000 Deferred Revenue
223100 Deferred Revenue-PnG
Total Liabilities
Fund Balance:
305000 Fund Balance-Reserved for En
315000 Fund Balance-Unreserved
316000 Retained Earnings-Unreserved
Total Fund Balance (Deficit)
Total Liabilities and Fund Balance (Deficit)
Civilian
Investigative Public
Parks Police LETF Panel Works
-$ -$ -$ -$ -$
1,869,096 1,952,965 2,202,221 94,591 3,412,933
97,968 1,899,540 8 - -
14,674 45,687 - - -
(31,746) (4,062) (8) - -
- - - - -
- (3,127) - - -
1 4,611 556 - 430
(0.42) - - - -
- (45,103) (15,654) - (5,691)
- - - - -
- - - - -
1,949,993$ 3,850,511$ 2,187,123$ 94,591$ 3,407,672$
-$ 3,595$ -$ -$ -$
14,865 2,568 4,733 417 -
(0) - - - -
- - - - -
2,786 560 - - -
52,280 154,297 - 7,688 -
- - - - -
- - 112,413 - -
26 172,224 - - -
8,154 - - - -
78,112 333,245 117,145 8,106 -
416,243 720,000 213,809 42,165 8,283
1,455,639 2,797,266 1,856,169 44,320 3,399,389
- - - - -
1,871,882 3,517,266 2,069,977 86,485 3,407,672
1,949,993$ 3,850,511$ 2,187,123$ 94,591$ 3,407,672$
3 - 6

City of Miami
Combining Balance Sheet
All Special Revenues Funds
As of November 30, 2013
Assets
103000 Cash With Fiscal Agent
104000 Equity In Pooled Cash
115000 Accounts Receivable
115090 Unbilled Receivable
117000 Allowance For Uncollectible
128900 Notes Receivable-Non-Current
133000 Due From Other Governmental
135000 Interest And Dividends Recei
135100 Interest And Dividends Recei
137000 Market Gain/Loss Investments
155000 Prepaid Items
199960 Project Clearing Account
Total Assets
Liabilities and Fund Balance
Liabilities:
201000 Vouchers Payable
202000 Accounts Payable
205100 Retainage Payable
208000 Due To Other Governmental Un
214000 Accrued Expenditure Payable
216000 Accrued Wages Payable
217000 Accrued Taxes Payable
220000 Deposits
223000 Deferred Revenue
223100 Deferred Revenue-PnG
Total Liabilities
Fund Balance:
305000 Fund Balance-Reserved for En
315000 Fund Balance-Unreserved
316000 Retained Earnings-Unreserved
Total Fund Balance (Deficit)
Total Liabilities and Fund Balance (Deficit)
Dept.
City Improve Transp Liberty Virgina Key
Clerk Initiatives & Transit City Beach Park
-$ -$ -$ -$ 10,808$
465,404 2,224,483 17,430,165 180,122 92,023
650 419,527 1,060,000 - 3,787
- 66,895 - - -
(650) (346,585) - - (3,787)
- - - - -
- - - - -
- - - 62 7
- - - - -
- - - (849) (128)
- - - - -
- - - - -
465,404$ 2,364,321$ 18,490,165$ 179,335$ 102,710$
-$ -$ -$ -$ -$
- 48,725 - 463 280
- - 20,481 - -
- - - - -
- 1,130 185,704 - -
1,555 32,940 14,151 102 -
- - - - -
- - - - -
- 919 1,060,000 7,500 -
- - - 4,000 -
1,555 83,714 1,280,336 12,065 280
37,230 699,822 333,633 1,972 50,622
426,619 1,580,784 16,876,197 165,299 51,809
- - - - -
463,849 2,280,607 17,209,829 167,270 102,430
465,404$ 2,364,321$ 18,490,165$ 179,335$ 102,710$
3 - 7

City of Miami
Combining Balance Sheet
All Special Revenues Funds
As of November 30, 2013
Assets
103000 Cash With Fiscal Agent
104000 Equity In Pooled Cash
115000 Accounts Receivable
115090 Unbilled Receivable
117000 Allowance For Uncollectible
128900 Notes Receivable-Non-Current
133000 Due From Other Governmental
135000 Interest And Dividends Recei
135100 Interest And Dividends Recei
137000 Market Gain/Loss Investments
155000 Prepaid Items
199960 Project Clearing Account
Total Assets
Liabilities and Fund Balance
Liabilities:
201000 Vouchers Payable
202000 Accounts Payable
205100 Retainage Payable
208000 Due To Other Governmental Un
214000 Accrued Expenditure Payable
216000 Accrued Wages Payable
217000 Accrued Taxes Payable
220000 Deposits
223000 Deferred Revenue
223100 Deferred Revenue-PnG
Total Liabilities
Fund Balance:
305000 Fund Balance-Reserved for En
315000 Fund Balance-Unreserved
316000 Retained Earnings-Unreserved
Total Fund Balance (Deficit)
Total Liabilities and Fund Balance (Deficit)
Miami Total
Ballpark Emergency Special
Facilities Funds CD-Ship CD-Sect8 Revenue
-$ -$ -$ -$ 565,546$
1,274,600 2,160,527 217,919 192,499 103,518,545
- - - - 9,475,161
- - - - 3,112,307
- - - - (1,198,851)
- - - - 1,794
- - - - 243,754
- - 180 - 29,653
- - - - 3,952
- - (2,239) - (354,326)
- - - - -
- - - - -
1,274,600$ 2,160,527$ 215,860$ 192,499$ 115,397,537$
-$ -$ -$ -$ 3,595$
- 1,535 - 134,944 1,963,317
- 3,182 - - 644,576
- - - - 781,742
- - - - 312,675
- - - - 573,815
- - - - 140
- - - - 1,962,065
- - - - 2,813,255
- - - (19,447) 1,663,210
- 4,716 - 115,497 10,718,389
465,338 17,864 0.10 193 16,010,024
809,262 2,137,947 215,860 76,808 118,168,170
- - - - (29,499,045)
1,274,600 2,155,811 215,860 77,001 104,679,149
1,274,600$ 2,160,527$ 215,860$ 192,499$ 115,397,537$
3 - 8

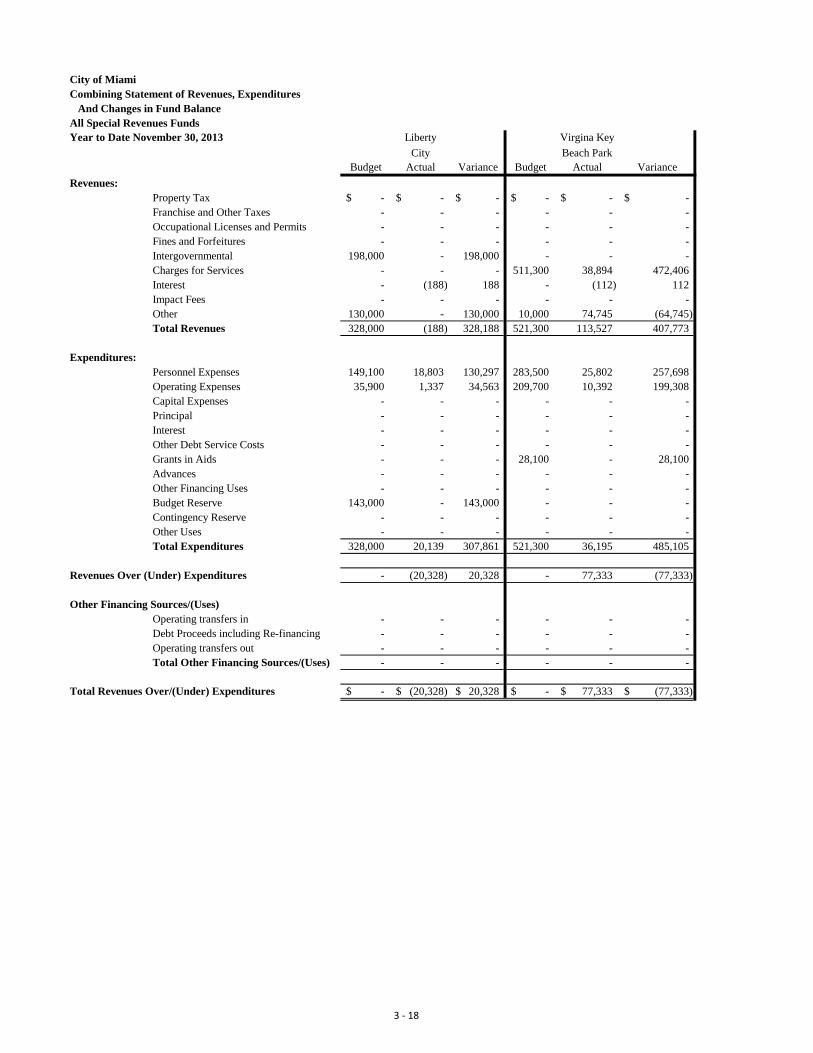
City of Miami
Combining Statement of Revenues, Expenditures
And Changes in Fund Balance
All Special Revenues Funds
Year to Date November 30, 2013
OMNI MIDTOWN
Budget Actual Variance Budget Actual Variance
Revenues:
Property Tax 31,413,400$ -$ 31,413,400$ 3,391,300$ -$ 3,391,300$
Franchise and Other Taxes - - - - - -
Occupational Licenses and Permits - - - - - -
Fines and Forfeitures - - - - - -
Intergovernmental - 347,422 (347,422) - - -
Charges for Services - - - - - -
Interest - (20,501) 20,501 - - -
Impact Fees - - - - - -
Other - 1,000 (1,000) - - -
Total Revenues 31,413,400 327,920 31,085,480 3,391,300 - 3,391,300
Expenditures:
Personnel Expenses - 1,155 (1,155) - - -
Operating Expenses 4,170,300 449,540 3,720,760 3,361,900 3,000 3,358,900
Capital Expenses 18,708,900 18,520 18,690,380 - - -
Principal - - - - - -
Interest - - - - - -
Other Debt Service Costs - - - - - -
Grants in Aids 2,843,000 577 2,842,423 - - -
Advances - - - - - -
Other Financing Uses - - - - - -
Budget Reserve 100,000 - 100,000 - - -
Contingency Reserve - - - - - -
Other Uses - - - - - -
Total Expenditures 25,822,200 469,792 25,352,408 3,361,900 3,000 3,358,900
Revenues Over (Under) Expenditures 5,591,200 (141,871) 5,733,071 29,400 (3,000) 32,400
Other Financing Sources/(Uses)
Operating transfers in - - - - - -
Debt Proceeds including Re-financing - - - - - -
Operating transfers out (5,591,200) - (5,591,200) (29,400) - (29,400)
Total Other Financing Sources/(Uses) (5,591,200) - (5,591,200) (29,400) - (29,400)
Total Revenues Over/(Under) Expenditures -$ (141,871)$ 141,871$ -$ (3,000)$ 3,000$
3 - 9

City of Miami
Combining Statement of Revenues, Expenditures
And Changes in Fund Balance
All Special Revenues Funds
Year to Date November 30, 2013
Revenues:
Property Tax
Franchise and Other Taxes
Occupational Licenses and Permits
Fines and Forfeitures
Intergovernmental
Charges for Services
Interest
Impact Fees
Other
Total Revenues
Expenditures:
Personnel Expenses
Operating Expenses
Capital Expenses
Principal
Interest
Other Debt Service Costs
Grants in Aids
Advances
Other Financing Uses
Budget Reserve
Contingency Reserve
Other Uses
Total Expenditures
Revenues Over (Under) Expenditures
Other Financing Sources/(Uses)
Operating transfers in
Debt Proceeds including Re-financing
Operating transfers out
Total Other Financing Sources/(Uses)
Total Revenues Over/(Under) Expenditures
Community
SEOPW Development
Budget Actual Variance Budget Actual Variance
12,231,300$ -$ 12,231,300$ -$ -$ -$
- - - - - -
- - - - - -
- - - - - -
80,200 3,991 76,209 50,527,800 4,511,539 46,016,261
- - - - - -
- (39,814) 39,814 - 13,066 (13,066)
- - - - - -
28,623,300 6,404,081 22,219,219 3,366,000 302,717 3,063,283
40,934,800 6,368,258 34,566,542 53,893,800 4,827,321 49,066,479
1,414,500 140,843 1,273,657 4,742,700 479,352 4,263,348
7,020,100 618,451 6,401,649 262,200 194,171 68,029
6,304,500 14,456 6,290,044 - 4,388 (4,388)
- - - - - -
- - - - - -
- - - - - -
26,070,300 225,765 25,844,535 50,467,600 3,903,804 46,563,796
- - - - - -
- - - - - -
320,100 - 320,100 - - -
- - - - - -
- - - - - -
41,129,500 999,515 40,129,985 55,472,500 4,581,715 50,890,785
(194,700) 5,368,742 (5,563,442) (1,578,700) 245,607 (1,824,307)
729,400 - 729,400 1,578,700 - 1,578,700
- - - - - -
(534,700) - (534,700) - - -
194,700 - 194,700 1,578,700 - 1,578,700
-$ 5,368,742$ (5,368,742)$ -$ 245,607$ (245,607)$
3 - 10

City of Miami
Combining Statement of Revenues, Expenditures
And Changes in Fund Balance
All Special Revenues Funds
Year to Date November 30, 2013
Revenues:
Property Tax
Franchise and Other Taxes
Occupational Licenses and Permits
Fines and Forfeitures
Intergovernmental
Charges for Services
Interest
Impact Fees
Other
Total Revenues
Expenditures:
Personnel Expenses
Operating Expenses
Capital Expenses
Principal
Interest
Other Debt Service Costs
Grants in Aids
Advances
Other Financing Uses
Budget Reserve
Contingency Reserve
Other Uses
Total Expenditures
Revenues Over (Under) Expenditures
Other Financing Sources/(Uses)
Operating transfers in
Debt Proceeds including Re-financing
Operating transfers out
Total Other Financing Sources/(Uses)
Total Revenues Over/(Under) Expenditures
Homeless Fire
Budget Actual Variance Budget Actual Variance
-$ -$ -$ -$ -$ -$
- - - - - -
- - - - - -
- - - - - -
1,979,126 1,930 1,977,196 14,404,829 1,378,928 13,025,901
- - - - 1,108 (1,108)
- - - - (92) 92
- - - - - -
- - - 10,837,300 2,200 10,835,100
1,979,126 1,930 1,977,196 25,242,129 1,382,144 23,859,985
1,650,900 181,876 1,469,024 9,843,965 1,309,444 8,534,521
715,026 19,215 695,811 2,870,498 242,388 2,628,110
- - - 11,184,066 387,816 10,796,250
- - - - - -
- - - - - -
- - - - - -
- - - - 498 (498)
- - - - - -
- - - - - -
- - - 2,972,700 - 2,972,700
- - - - - -
- - - - - -
2,365,926 201,091 2,164,835 26,871,229 1,940,146 24,931,083
(386,800) (199,160) (187,640) (1,629,100) (558,002) (1,071,098)
386,800 - 386,800 1,629,100 - 1,629,100
- - - - - -
- - - - - -
386,800 - 386,800 1,629,100 - 1,629,100
-$ (199,160)$ 199,160$ -$ (558,002)$ 558,002$
3 - 11

City of Miami
Combining Statement of Revenues, Expenditures
And Changes in Fund Balance
All Special Revenues Funds
Year to Date November 30, 2013
Revenues:
Property Tax
Franchise and Other Taxes
Occupational Licenses and Permits
Fines and Forfeitures
Intergovernmental
Charges for Services
Interest
Impact Fees
Other
Total Revenues
Expenditures:
Personnel Expenses
Operating Expenses
Capital Expenses
Principal
Interest
Other Debt Service Costs
Grants in Aids
Advances
Other Financing Uses
Budget Reserve
Contingency Reserve
Other Uses
Total Expenditures
Revenues Over (Under) Expenditures
Other Financing Sources/(Uses)
Operating transfers in
Debt Proceeds including Re-financing
Operating transfers out
Total Other Financing Sources/(Uses)
Total Revenues Over/(Under) Expenditures
General Special Public
Revenue Facilities
Budget Actual Variance Budget Actual Variance
-$ -$ -$ -$ -$ -$
- - - - - -
- - - - - -
- - - - - -
800,700 (1,769,195) 2,569,895 - 1,450 (1,450)
- - - 7,132,300 558,555 6,573,745
- - - - - -
- - - - - -
100,000 - 100,000 75,000 (93) 75,093
900,700 (1,769,195) 2,669,895 7,207,300 559,911 6,647,389
28,100 13,919 14,181 492,500 33,340 459,160
863,600 38,237 825,363 3,805,800 (215,495) 4,021,295
- (48,218) 48,218 - - -
- - - - - -
- - - - - -
- - - - - -
- - - - - -
- - - - - -
- - - - - -
9,000 - 9,000 - - -
- - - - - -
- - - - - -
900,700 3,938 896,762 4,298,300 (182,156) 4,480,456
- (1,773,133) 1,773,133 2,909,000 742,067 2,166,933
- - - 3,410,200 - 3,410,200
- - - - - -
- - - (6,319,200) (465,465) (5,853,735)
- - - (2,909,000) (465,465) (2,443,535)
-$ (1,773,133)$ 1,773,133$ -$ 276,602$ (276,602)$
3 - 12

City of Miami
Combining Statement of Revenues, Expenditures
And Changes in Fund Balance
All Special Revenues Funds
Year to Date November 30, 2013
Revenues:
Property Tax
Franchise and Other Taxes
Occupational Licenses and Permits
Fines and Forfeitures
Intergovernmental
Charges for Services
Interest
Impact Fees
Other
Total Revenues
Expenditures:
Personnel Expenses
Operating Expenses
Capital Expenses
Principal
Interest
Other Debt Service Costs
Grants in Aids
Advances
Other Financing Uses
Budget Reserve
Contingency Reserve
Other Uses
Total Expenditures
Revenues Over (Under) Expenditures
Other Financing Sources/(Uses)
Operating transfers in
Debt Proceeds including Re-financing
Operating transfers out
Total Other Financing Sources/(Uses)
Total Revenues Over/(Under) Expenditures
Econ. Dev. & Code
Plan Services Enforcement
Budget Actual Variance Budget Actual Variance
-$ -$ -$ -$ -$ -$
- - - - - -
15,000 12,000 3,000 - - -
- - - - 550 (550)
- - - - - -
1,350,400 7,970 1,342,430 300,000 50,990 249,010
- - - - 206 (206)
- - - - - -
5,684,300 - 5,684,300 2,008,000 - 2,008,000
7,049,700 19,970 7,029,730 2,308,000 51,746 2,256,254
399,500 8,875 390,625 - - -
- - - - 13,550 (13,550)
- - - 225,000 (4,985) 229,985
- - - - - -
- - - - - -
- - - - - -
- - - - - -
- - - - - -
- - - - - -
6,724,200 - 6,724,200 2,083,000 - 2,083,000
- - - - - -
- - - - - -
7,123,700 8,875 7,114,825 2,308,000 8,565 2,299,435
(74,000) 11,095 (85,095) - 43,181 (43,181)
74,000 - 74,000 - - -
- - - - - -
- - - - - -
74,000 - 74,000 - - -
-$ 11,095$ (11,095)$ -$ 43,181$ (43,181)$
3 - 13

City of Miami
Combining Statement of Revenues, Expenditures
And Changes in Fund Balance
All Special Revenues Funds
Year to Date November 30, 2013
Revenues:
Property Tax
Franchise and Other Taxes
Occupational Licenses and Permits
Fines and Forfeitures
Intergovernmental
Charges for Services
Interest
Impact Fees
Other
Total Revenues
Expenditures:
Personnel Expenses
Operating Expenses
Capital Expenses
Principal
Interest
Other Debt Service Costs
Grants in Aids
Advances
Other Financing Uses
Budget Reserve
Contingency Reserve
Other Uses
Total Expenditures
Revenues Over (Under) Expenditures
Other Financing Sources/(Uses)
Operating transfers in
Debt Proceeds including Re-financing
Operating transfers out
Total Other Financing Sources/(Uses)
Total Revenues Over/(Under) Expenditures
Parks Police
Budget Actual Variance Budget Actual Variance
-$ -$ -$ -$ -$ -$
- - - - - -
48,600 - 48,600 - - -
- - - - - -
1,353,700 137,363 1,216,337 5,891,141 92,145 5,798,996
216,400 26,852 189,548 761,000 42,243 718,757
- - - - (10,131) 10,131
- - - - - -
1,645,400 58,894 1,586,506 13,816,200 - 13,816,200
3,264,100 223,109 3,040,991 20,468,341 124,257 20,344,084
1,180,700 247,943 932,757 8,194,100 720,427 7,473,673
1,286,600 41,068 1,245,532 2,015,155 99,629 1,915,526
404,600 8,233 396,367 1,206,186 - 1,206,186
- - - - - -
- - - - - -
- - - - - -
31,200 - 31,200 - - -
- - - - - -
- 270 (270) - - -
- - - 10,641,300 - 10,641,300
- - - - - -
- - - - - -
2,903,100 297,513 2,605,587 22,056,741 820,056 21,236,685
361,000 (74,404) 435,404 (1,588,400) (695,799) (892,601)
139,000 - 139,000 2,058,400 - 2,058,400
- - - - - -
(500,000) - (500,000) (470,000) - (470,000)
(361,000) - (361,000) 1,588,400 - 1,588,400
-$ (74,404)$ 74,404$ -$ (695,799)$ 695,799$
3 - 14

City of Miami
Combining Statement of Revenues, Expenditures
And Changes in Fund Balance
All Special Revenues Funds
Year to Date November 30, 2013
Revenues:
Property Tax
Franchise and Other Taxes
Occupational Licenses and Permits
Fines and Forfeitures
Intergovernmental
Charges for Services
Interest
Impact Fees
Other
Total Revenues
Expenditures:
Personnel Expenses
Operating Expenses
Capital Expenses
Principal
Interest
Other Debt Service Costs
Grants in Aids
Advances
Other Financing Uses
Budget Reserve
Contingency Reserve
Other Uses
Total Expenditures
Revenues Over (Under) Expenditures
Other Financing Sources/(Uses)
Operating transfers in
Debt Proceeds including Re-financing
Operating transfers out
Total Other Financing Sources/(Uses)
Total Revenues Over/(Under) Expenditures
Civil Investigative
LETF Panel
Budget Actual Variance Budget Actual Variance
-$ -$ -$ -$ -$ -$
- - - - - -
- - - - - -
1,290,900 159,561 1,131,339 - - -
- - - 564,000 - 564,000
- 237 (237) - - -
- (3,509) 3,509 - - -
- - - - - -
1,800,000 - 1,800,000 - - -
3,090,900 156,289 2,934,611 564,000 - 564,000
- 45,154 (45,154) 546,000 33,651 512,349
- 8,090 (8,090) 193,000 23,720 169,280
- - - 3,200 - 3,200
- - - - - -
- - - - - -
- - - - - -
- - - - - -
- - - - - -
- - - - - -
3,090,900 - 3,090,900 - - -
- - - - - -
- - - - - -
3,090,900 53,244 3,037,656 742,200 57,371 684,829
- 103,045 (103,045) (178,200) (57,371) (120,829)
- - - 178,200 - 178,200
- - - - - -
- - - - - -
- - - 178,200 - 178,200
-$ 103,045$ (103,045)$ -$ (57,371)$ 57,371$
3 - 15

City of Miami
Combining Statement of Revenues, Expenditures
And Changes in Fund Balance
All Special Revenues Funds
Year to Date November 30, 2013
Revenues:
Property Tax
Franchise and Other Taxes
Occupational Licenses and Permits
Fines and Forfeitures
Intergovernmental
Charges for Services
Interest
Impact Fees
Other
Total Revenues
Expenditures:
Personnel Expenses
Operating Expenses
Capital Expenses
Principal
Interest
Other Debt Service Costs
Grants in Aids
Advances
Other Financing Uses
Budget Reserve
Contingency Reserve
Other Uses
Total Expenditures
Revenues Over (Under) Expenditures
Other Financing Sources/(Uses)
Operating transfers in
Debt Proceeds including Re-financing
Operating transfers out
Total Other Financing Sources/(Uses)
Total Revenues Over/(Under) Expenditures
Public City
Works Clerk
Budget Actual Variance Budget Actual Variance
-$ -$ -$ -$ -$ -$
- - - - - -
- - - - - -
- - - - - -
- - - - - -
400,000 243,097 156,903 75,000 19,551 55,449
- (1,262) 1,262 - - -
- - - - - -
3,256,200 - 3,256,200 367,800 5,123 362,677
3,656,200 241,835 3,414,365 442,800 24,674 418,126
- - - 244,200 6,807 237,393
1,342,000 - 1,342,000 4,000 15,192 (11,192)
- - - - - -
- - - - - -
- - - - - -
- - - - - -
- - - - - -
- - - - - -
- - - - - -
2,314,200 - 2,314,200 337,500 - 337,500
- - - - - -
- - - - - -
3,656,200 - 3,656,200 585,700 21,999 563,701
- 241,835 (241,835) (142,900) 2,674 (145,574)
- - - 142,900 - 142,900
- - - - - -
- - - - - -
- - - 142,900 - 142,900
-$ 241,835$ (241,835)$ -$ 2,674$ (2,674)$
3 - 16

City of Miami
Combining Statement of Revenues, Expenditures
And Changes in Fund Balance
All Special Revenues Funds
Year to Date November 30, 2013
Revenues:
Property Tax
Franchise and Other Taxes
Occupational Licenses and Permits
Fines and Forfeitures
Intergovernmental
Charges for Services
Interest
Impact Fees
Other
Total Revenues
Expenditures:
Personnel Expenses
Operating Expenses
Capital Expenses
Principal
Interest
Other Debt Service Costs
Grants in Aids
Advances
Other Financing Uses
Budget Reserve
Contingency Reserve
Other Uses
Total Expenditures
Revenues Over (Under) Expenditures
Other Financing Sources/(Uses)
Operating transfers in
Debt Proceeds including Re-financing
Operating transfers out
Total Other Financing Sources/(Uses)
Total Revenues Over/(Under) Expenditures
Dept. Improve. Transp
Initiatives & Transit
Budget Actual Variance Budget Actual Variance
-$ -$ -$ -$ -$ -$
- - - - - -
- - - - - -
75,000 39,189 35,811 - - -
3,218,000 159,738 3,058,262 14,275,100 3,231 14,271,869
- - - - - -
- 14,000 (14,000) - - -
- - - - - -
1,285,900 3,500 1,282,400 1,505,700 - 1,505,700
4,578,900 216,427 4,362,474 15,780,800 3,231 15,777,569
2,121,900 142,196 1,979,704 798,500 68,409 730,091
1,837,000 83,599 1,753,401 15,500 179,573 (164,073)
- - - 9,500 42,305 (32,805)
- - - - - -
- - - - - -
- - - - - -
554,200 5,000 549,200 - - -
- - - - - -
- - - - - -
1,356,300 - 1,356,300 4,251,000 - 4,251,000
- - - - - -
- - - - - -
5,869,400 230,795 5,638,605 5,074,500 290,287 4,784,213
(1,290,500) (14,368) (1,276,132) 10,706,300 (287,056) 10,993,356
1,290,500 - 1,290,500 - - -
- - - - - -
- - - (10,706,300) - (10,706,300)
1,290,500 - 1,290,500 (10,706,300) - (10,706,300)
-$ (14,368)$ 14,368$ -$ (287,056)$ 287,056$
3 - 17
City of Miami
Combining Statement of Revenues, Expenditures
And Changes in Fund Balance
All Special Revenues Funds
Year to Date November 30, 2013
Revenues:
Property Tax
Franchise and Other Taxes
Occupational Licenses and Permits
Fines and Forfeitures
Intergovernmental
Charges for Services
Interest
Impact Fees
Other
Total Revenues
Expenditures:
Personnel Expenses
Operating Expenses
Capital Expenses
Principal
Interest
Other Debt Service Costs
Grants in Aids
Advances
Other Financing Uses
Budget Reserve
Contingency Reserve
Other Uses
Total Expenditures
Revenues Over (Under) Expenditures
Other Financing Sources/(Uses)
Operating transfers in
Debt Proceeds including Re-financing
Operating transfers out
Total Other Financing Sources/(Uses)
Total Revenues Over/(Under) Expenditures
Liberty Virgina Key
City Beach Park
Budget Actual Variance Budget Actual Variance
-$ -$ -$ -$ -$ -$
- - - - - -
- - - - - -
- - - - - -
198,000 - 198,000 - - -
- - - 511,300 38,894 472,406
- (188) 188 - (112) 112
- - - - - -
130,000 - 130,000 10,000 74,745 (64,745)
328,000 (188) 328,188 521,300 113,527 407,773
149,100 18,803 130,297 283,500 25,802 257,698
35,900 1,337 34,563 209,700 10,392 199,308
- - - - - -
- - - - - -
- - - - - -
- - - - - -
- - - 28,100 - 28,100
- - - - - -
- - - - - -
143,000 - 143,000 - - -
- - - - - -
- - - - - -
328,000 20,139 307,861 521,300 36,195 485,105
- (20,328) 20,328 - 77,333 (77,333)
- - - - - -
- - - - - -
- - - - - -
- - - - - -
-$ (20,328)$ 20,328$ -$ 77,333$ (77,333)$
3 - 18

City of Miami
Combining Statement of Revenues, Expenditures
And Changes in Fund Balance
All Special Revenues Funds
Year to Date November 30, 2013
Revenues:
Property Tax
Franchise and Other Taxes
Occupational Licenses and Permits
Fines and Forfeitures
Intergovernmental
Charges for Services
Interest
Impact Fees
Other
Total Revenues
Expenditures:
Personnel Expenses
Operating Expenses
Capital Expenses
Principal
Interest
Other Debt Service Costs
Grants in Aids
Advances
Other Financing Uses
Budget Reserve
Contingency Reserve
Other Uses
Total Expenditures
Revenues Over (Under) Expenditures
Other Financing Sources/(Uses)
Operating transfers in
Debt Proceeds including Re-financing
Operating transfers out
Total Other Financing Sources/(Uses)
Total Revenues Over/(Under) Expenditures
Miami Ballpark Emergency
Parking Facilities Funds
Budget Actual Variance Budget Actual Variance
-$ -$ -$ -$ -$ -$
- - - - - -
- - - - - -
- - - - - -
- - - - - -
5,397,000 71,764 5,325,236 - - -
- - - - - -
- - - - - -
100,000 - 100,000 100,000 - 100,000
5,497,000 71,764 5,425,236 100,000 - 100,000
- - - - - -
2,872,300 250,000 2,622,300 - 418 (418)
- - - - - -
- - - - - -
- - - - - -
- - - - - -
- - - - - -
- - - - - -
- - - - - -
- - - 100,000 - 100,000
- - - - - -
- - - - - -
2,872,300 250,000 2,622,300 100,000 418 99,582
2,624,700 (178,236) 2,802,936 - (418) 418
- - - - - -
- - - - - -
(2,624,700) - (2,624,700) - - -
(2,624,700) - (2,624,700) - - -
-$ (178,236)$ 178,236$ -$ (418)$ 418$
3 - 19

City of Miami
Combining Statement of Revenues, Expenditures
And Changes in Fund Balance
All Special Revenues Funds
Year to Date November 30, 2013
Revenues:
Property Tax
Franchise and Other Taxes
Occupational Licenses and Permits
Fines and Forfeitures
Intergovernmental
Charges for Services
Interest
Impact Fees
Other
Total Revenues
Expenditures:
Personnel Expenses
Operating Expenses
Capital Expenses
Principal
Interest
Other Debt Service Costs
Grants in Aids
Advances
Other Financing Uses
Budget Reserve
Contingency Reserve
Other Uses
Total Expenditures
Revenues Over (Under) Expenditures
Other Financing Sources/(Uses)
Operating transfers in
Debt Proceeds including Re-financing
Operating transfers out
Total Other Financing Sources/(Uses)
Total Revenues Over/(Under) Expenditures
CD-Ship CD-Section8
Budget Actual Variance Budget Actual Variance
-$ -$ -$ -$ -$ -$
- - - - - -
- - - - - -
- - - - - -
- - - 1,850,000 260,499 1,589,501
- - - - - -
- (496) 496 - - -
- - - - - -
246,700 37,821 208,879 - - -
246,700 37,325 209,375 1,850,000 260,499 1,589,501
- - - 147,600 - 147,600
- - - 2,400 351 2,049
- - - - - -
- - - - - -
- - - - - -
- - - - - -
246,700 - 246,700 1,700,000 391,072 1,308,928
- - - - - -
- - - - - -
- - - - - -
- - - - - -
- - - - - -
246,700 - 246,700 1,850,000 391,422 1,458,578
- 37,325 (37,325) - (130,923) 130,923
- - - - - -
- - - - - -
- - - - - -
- - - - - -
-$ 37,325$ (37,325)$ -$ (130,923)$ 130,923$
3 - 20

City of Miami
Combining Statement of Revenues, Expenditures
And Changes in Fund Balance
All Special Revenues Funds
Year to Date November 30, 2013
Revenues:
Property Tax
Franchise and Other Taxes
Occupational Licenses and Permits
Fines and Forfeitures
Intergovernmental
Charges for Services
Interest
Impact Fees
Other
Total Revenues
Expenditures:
Personnel Expenses
Operating Expenses
Capital Expenses
Principal
Interest
Other Debt Service Costs
Grants in Aids
Advances
Other Financing Uses
Budget Reserve
Contingency Reserve
Other Uses
Total Expenditures
Revenues Over (Under) Expenditures
Other Financing Sources/(Uses)
Operating transfers in
Debt Proceeds including Re-financing
Operating transfers out
Total Other Financing Sources/(Uses)
Total Revenues Over/(Under) Expenditures
Total Special Revenues
Budget Actual Variance
47,036,000$ -$ 47,036,000$
- - -
63,600 12,000 51,600
1,365,900 199,300 1,166,600
95,142,596 5,129,039 90,013,557
16,143,400 1,061,261 15,082,139
- (48,834) 48,834
- - -
74,957,800 6,889,987 68,067,813
234,709,296 13,242,753 221,466,543
32,237,765 3,477,993 28,759,772
32,882,979 2,076,425 30,806,554
38,045,952 422,515 37,623,437
- - -
- - -
- - -
81,941,100 4,526,716 77,414,384
- - -
- 270 (270)
34,443,200 - 34,443,200
- - -
- - -
219,550,996 10,503,919 209,047,077
15,158,300 2,738,834 12,419,466
11,617,200 - 11,617,200
- - -
(26,775,500) (465,465) (26,310,035)
(15,158,300) (465,465) (14,692,835)
-$ 2,273,369$ (2,273,369)$
3 - 21

Section 4 –
Debt Service Funds
Financial Update – Debt Service Funds
Combining Balance Sheet – Summary
Combining Balance Sheet – Detail
Combining Statement of Revenues, Expenditures, and
Changes in Fund Balance
4 - 1
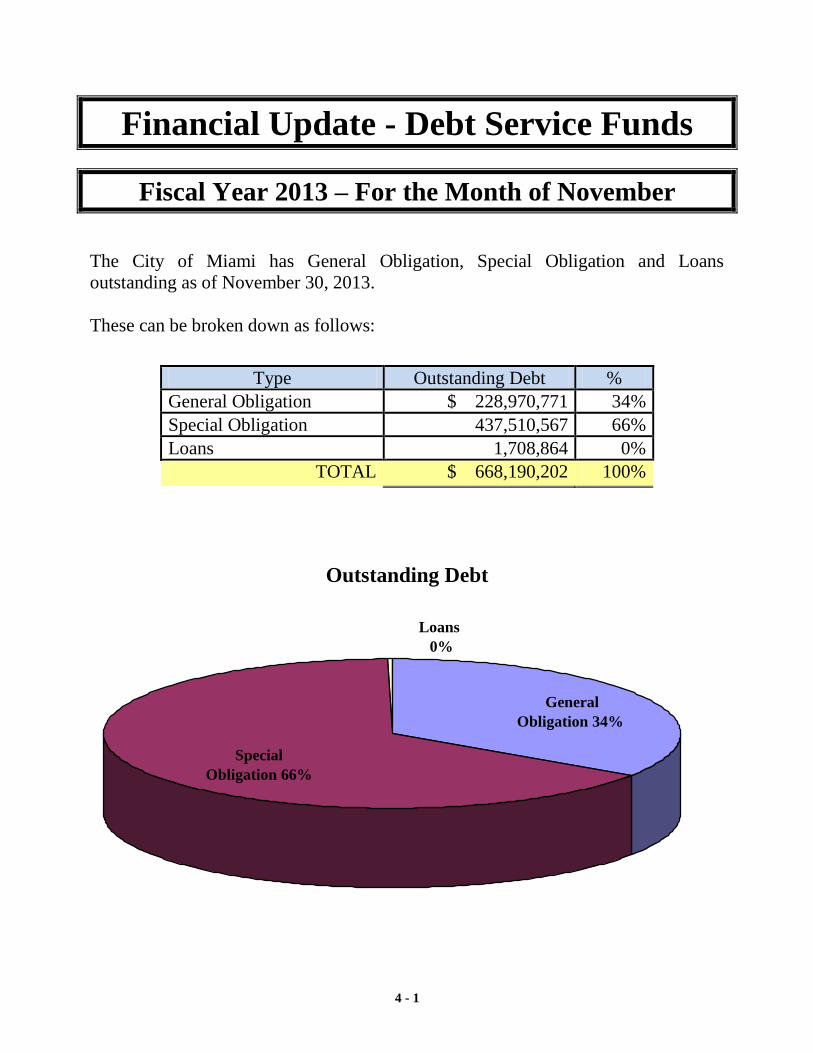
Financial Update - Debt Service Funds
Fiscal Year 2013 – For the Month of November
The City of Miami has General Obligation, Special Obligation and Loans
outstanding as of November 30, 2013.
These can be broken down as follows:
Outstanding Debt
Loans
0%
Special
Obligation 66%
General
Obligation 34%
Type Outstanding Debt %
General Obligation $ 228,970,771 34%
Special Obligation 437,510,567 66%
Loans 1,708,864 0%
TOTAL $ 668,190,202 100%

City of Miami
Combining Balance Sheet - Summary
All Debt Funds
As of November 30, 2013
General Special CRA Other Total
Obligation Obligation Special Debt
Bonds Bonds Obligation Service
Assets
103000 Cash With Fiscal Agent 6,228,754$ 22,440,169$ -$ 28,668,923$
104000 Equity In Pooled Cash (274,017) (10,361,027) 6,259 (10,628,785)
104001 Equity In Pooled Cash-Restri - 20,950,982 - 20,950,982
115000 Accounts Receivable 991,460 - - 991,460
128900 Notes Receivable-Non-Current - 17,781,187 - 17,781,187
Total Assets 6,946,197$ 50,811,312$ 6,259$ 57,763,768$
Liabilities and Fund Balance
Liabilities:
202000 Accounts Payable -$ -$ -$ -$
223000 Deferred Revenue 991,460 17,781,187 - 18,772,647
Total Liabilities 991,460 17,781,187 - 18,772,647
Fund Balance (Deficit)
305000 Fund Balance-Reserved for En - - - -
315000 Fund Balance-Unreserved 5,954,737 33,030,125 6,259 38,991,120
Total Fund Balance (Deficit) 5,954,737 33,030,125 6,259 38,991,120
Total Liabilities and Fund Balance 6,946,197$ 50,811,312$ 6,259$ 57,763,768$
4 - 2

City of Miami
Combining Balance Sheet - Detail
All Debt Funds
As of November 30, 2013
GOB Total SOB
2002 GOB GOB Refinance
HD Various Funds 2002A
Assets
103000 Cash With Fiscal Agent -$ 6,228,754$ 6,228,754$ 185,987$
104000 Equity In Pooled Cash 246,967 (520,984) (274,017) (185,884)
104001 Equity In Pooled Cash-Restri - - - -
115000 Accounts Receivable - 991,460 991,460 -
128900 Notes Receivable-Non-Current - - - -
Total Assets 246,967$ 6,699,230$ 6,946,197$ 103$
Liabilities and Fund Balance
Liabilities:
202000 Accounts Payable -$ -$ -$ -$
223000 Deferred Revenue - 991,460 991,460 -
Total Liabilities - 991,460 991,460 -
Fund Balance (Deficit)
305000 Fund Balance-Reserved for En - - - -
315000 Fund Balance-Unreserved 246,967 5,707,770 5,954,737 103
Total Fund Balance (Deficit) 246,967 5,707,770 5,954,737 103
Total Liabilities and Fund Balance 246,967$ 6,699,230$ 6,946,197$ 103$
4 - 3

City of Miami
Combining Balance Sheet - Detail
All Debt Funds
As of November 30, 2013
Assets
103000 Cash With Fiscal Agent
104000 Equity In Pooled Cash
104001 Equity In Pooled Cash-Restri
115000 Accounts Receivable
128900 Notes Receivable-Non-Current
Total Assets
Liabilities and Fund Balance
Liabilities:
202000 Accounts Payable
223000 Deferred Revenue
Total Liabilities
Fund Balance (Deficit)
305000 Fund Balance-Reserved for En
315000 Fund Balance-Unreserved
Total Fund Balance (Deficit)
Total Liabilities and Fund Balance
SOB SOB Series 2007 SOB SOB
Refinance Str & Sidewalks Parking Garage Parking Garage
2002C Improvement 2010A 2010B
79,087$ 5,318,094$ -$ 0$
(2,523,121) (428,401) 2,142,113 323,224
2,694,450 5,870,698 4,028,023 801,888
- - - -
- - - -
250,416$ 10,760,391$ 6,170,135$ 1,125,113$
-$ -$ -$ -$
- - - -
- - - -
- - - -
250,416 10,760,391 6,170,135 1,125,113
250,416 10,760,391 6,170,135 1,125,113
250,416$ 10,760,391$ 6,170,135$ 1,125,113$
4 - 4

City of Miami
Combining Balance Sheet - Detail
All Debt Funds
As of November 30, 2013
Assets
103000 Cash With Fiscal Agent
104000 Equity In Pooled Cash
104001 Equity In Pooled Cash-Restri
115000 Accounts Receivable
128900 Notes Receivable-Non-Current
Total Assets
Liabilities and Fund Balance
Liabilities:
202000 Accounts Payable
223000 Deferred Revenue
Total Liabilities
Fund Balance (Deficit)
305000 Fund Balance-Reserved for En
315000 Fund Balance-Unreserved
Total Fund Balance (Deficit)
Total Liabilities and Fund Balance
SOB SOB SOB SOB
Miami Tunnel Jungle Isd 1987 JLK Bonds
2012 Loan Convention 10/02 - 9/05
-$ -$ 7,113,548$ 21,272$
26,641 - - 58
2,149,075 - - 1,750,975
- - - -
- 17,781,187 - -
2,175,716$ 17,781,187$ 7,113,548$ 1,772,305$
-$ -$ -$ -$
- 17,781,187 - -
- 17,781,187 - -
- - - -
2,175,716 - 7,113,548 1,772,305
2,175,716 - 7,113,548 1,772,305
2,175,716$ 17,781,187$ 7,113,548$ 1,772,305$
4 - 5

City of Miami
Combining Balance Sheet - Detail
All Debt Funds
As of November 30, 2013
Assets
103000 Cash With Fiscal Agent
104000 Equity In Pooled Cash
104001 Equity In Pooled Cash-Restri
115000 Accounts Receivable
128900 Notes Receivable-Non-Current
Total Assets
Liabilities and Fund Balance
Liabilities:
202000 Accounts Payable
223000 Deferred Revenue
Total Liabilities
Fund Balance (Deficit)
305000 Fund Balance-Reserved for En
315000 Fund Balance-Unreserved
Total Fund Balance (Deficit)
Total Liabilities and Fund Balance
SOB Total Total
Pension & SOB SOB Debt
Comp Abs Funds CRA Service
9,722,182$ 22,440,169$ -$ 28,668,923$
(9,715,657) (10,361,027) 6,259 (10,628,785)
3,655,873 20,950,982 - 20,950,982
- - - 991,460
- 17,781,187 - 17,781,187
3,662,398$ 50,811,312$ 6,259$ 57,763,768$
-$ -$ -$ -$
- 17,781,187 - 18,772,647
- 17,781,187 - 18,772,647
- - - -
3,662,398 33,030,125 6,259 38,991,120
3,662,398 33,030,125 6,259 38,991,120
3,662,398$ 50,811,312$ 6,259$ 57,763,768$
4 - 6

City of Miami
Combining Statement of Revenues, Expenditures
And Changes in Fund Balance - Summary
All Debt Funds
As of November 30, 2013
General Obligation Special Obligation
Bonds Bonds
Budget Actual Variance Budget Actual Variance
Revenues:
Property Tax 25,382,800$ 2,479,640$ 22,903,160$ -$ -$ -$
Franchise and Other Taxes - - - - - -
Occupational Licenses and Permits - - - - - -
Fines and Forfeitures - - - - - -
Intergovernmental - - - 3,000,000 250,000 2,750,000
Charges for Services - - - - - -
Interest - 2 (2) - 60 (60)
Impact Fees - - - - - -
Other 1,099,100 - 1,099,100 - - -
Total Revenues 26,481,900 2,479,642 24,002,258 3,000,000 250,060 2,749,940
Expenditures:
Personnel Expenses - - - - - -
Operating Expenses 208,500 - 208,500 6,500 - 6,500
Capital Expenses - - - - - -
Principal 11,592,600 - 11,592,600 12,861,200 2,195,000 10,666,200
Interest 13,780,800 - 13,780,800 28,463,500 249,125 28,214,375
Other Debt Service Costs - - - - - -
Grants in Aids - - - - - -
Advances - - - - - -
Other Financing Uses - - - - - -
Budget Reserve 900,000 - 900,000 - - -
Contingency Reserve - - - - - -
Other Uses - - - - - -
Total Expenditures 26,481,900 - 26,481,900 41,331,200 2,444,125 38,887,075
Revenues Over (Under) Expenditures - 2,479,642 (2,479,642) (38,331,200) (2,194,065) (36,137,135)
Other Financing Sources/(Uses):
Operating transfers in - - - 38,331,200 465,465 37,865,735
Debt Proceeds including Re-financing - - - - - -
Operating transfers out - - - - - -
Total Other Financing Sources/(Uses) - - - 38,331,200 465,465 37,865,735
Total Revenues Over/(Under) Expenditures -$ 2,479,642$ (2,479,642)$ -$ (1,728,600)$ 1,728,600$
4 -7

City of Miami
Combining Statement of Revenues, Expenditures
And Changes in Fund Balance - Summary
All Debt Funds
As of November 30, 2013
Revenues:
Property Tax
Franchise and Other Taxes
Occupational Licenses and Permits
Fines and Forfeitures
Intergovernmental
Charges for Services
Interest
Impact Fees
Other
Total Revenues
Expenditures:
Personnel Expenses
Operating Expenses
Capital Expenses
Principal
Interest
Other Debt Service Costs
Grants in Aids
Advances
Other Financing Uses
Budget Reserve
Contingency Reserve
Other Uses
Total Expenditures
Revenues Over (Under) Expenditures
Other Financing Sources/(Uses):
Operating transfers in
Debt Proceeds including Re-financing
Operating transfers out
Total Other Financing Sources/(Uses)
Total Revenues Over/(Under) Expenditures
CRA Other Special
Obligation Bonds Total Debt Service
Budget Actual Variance Budget Actual Variance
-$ -$ -$ 25,382,800$ 2,479,640$ 22,903,160$
- - - - - -
- - - - - -
- - - - - -
- - 3,000,000 250,000 2,750,000
- - - - - -
- - - - 62 (62)
- - - - - -
- - 1,099,100 - 1,099,100
- - - 29,481,900 2,729,702 26,752,198
- - - - - -
- 215,000 - 215,000
- - - -
- 24,453,800 2,195,000 22,258,800
- 42,244,300 249,125 41,995,175
- - - - - -
- - - - - -
- - - - - -
- - - - - -
- - - 900,000 - 900,000
- - - - - -
- - - - - -
- - - 67,813,100 2,444,125 65,368,975
- - - (38,331,200) 285,577 (38,616,777)
- - 38,331,200 465,465 37,865,735
- - - - - -
- - - - - -
- - - 38,331,200 465,465 37,865,735
-$ -$ -$ -$ 751,042$ (751,042)$
4 -8

Combining Statement of Revenues, Expenditures
And Changes in Fund Balance - Summary
All Debt Funds
As of November 30, 2013 GOB 2007A Refunding GOB 2007B HD2
Budget Actual Variance Budget Actual Variance
Revenues:
Property Tax 5,242,700$ -$ 5,242,700$ 2,499,600$ -$ 2,499,600$
Franchise and Other Taxes - - - - - -
Occupational Licenses and Permits - - - - - -
Fines and Forfeitures - - - - - -
Intergovernmental - - - - - -
Charges for Services - - - - - -
Interest - - - - - -
Impact Fees - - - - - -
Other - - - - - -
Total Revenues 5,242,700 - 5,242,700 2,499,600 - 2,499,600
Expenditures:
Personnel Expenses - - - - - -
Operating Expenses - - - - - -
Capital Expenses - - - - - -
Principal 160,000 - 160,000 - - -
Interest 5,082,700 - 5,082,700 2,499,600 - 2,499,600
Other Debt Service Costs - - - - - -
Grants in Aids - - - - - -
Advances - - - - - -
Other Financing Uses - - - - - -
Budget Reserve - - - - - -
Contingency Reserve - - - - - -
Other Uses - - - - - -
Total Expenditures 5,242,700 - 5,242,700 2,499,600 - 2,499,600
Revenues Over (Under) Expenditures - - - - - -
Other Financing Sources/(Uses)
Operating transfers in - - - - - -
Debt Proceeds including Re-financing - - - - - -
Operating transfers out - - - - - -
Total Other Financing Sources/(Uses) - - - - - -
Total Revenues Over/(Under) Expenditures -$ -$ -$ -$ -$ -$
4 - 9

Combining Statement of Revenues, Expenditures
And Changes in Fund Balance - Summary
All Debt Funds
As of November 30, 2013
Revenues:
Property Tax
Franchise and Other Taxes
Occupational Licenses and Permits
Fines and Forfeitures
Intergovernmental
Charges for Services
Interest
Impact Fees
Other
Total Revenues
Expenditures:
Personnel Expenses
Operating Expenses
Capital Expenses
Principal
Interest
Other Debt Service Costs
Grants in Aids
Advances
Other Financing Uses
Budget Reserve
Contingency Reserve
Other Uses
Total Expenditures
Revenues Over (Under) Expenditures
Other Financing Sources/(Uses)
Operating transfers in
Debt Proceeds including Re-financing
Operating transfers out
Total Other Financing Sources/(Uses)
Total Revenues Over/(Under) Expenditures
GOB 2002 HD GOB 2009 HD3
Budget Actual Variance Budget Actual Variance
7,331,700$ -$ 7,331,700$ 3,508,400$ -$ 3,508,400$
- - - - - -
- - - - - -
- - - - - -
- - - - - -
- - - - - -
- - - - - -
- - - - - -
- - - - - -
7,331,700 - 7,331,700 3,508,400 - 3,508,400
- - - - - -
- - - - - -
- - - - - -
4,022,600 - 4,022,600 1,305,000 - 1,305,000
3,309,100 - 3,309,100 2,203,400 - 2,203,400
- - - - - -
- - - - - -
- - - - - -
- - - - - -
- - - - - -
- - - - - -
- - - - - -
7,331,700 - 7,331,700 3,508,400 3,508,400
- - - - - -
- - - - - -
- - - - - -
- - - - - -
- - - - - -
-$ -$ -$ -$ -$ -$
4 - 10

Combining Statement of Revenues, Expenditures
And Changes in Fund Balance - Summary
All Debt Funds
As of November 30, 2013
Revenues:
Property Tax
Franchise and Other Taxes
Occupational Licenses and Permits
Fines and Forfeitures
Intergovernmental
Charges for Services
Interest
Impact Fees
Other
Total Revenues
Expenditures:
Personnel Expenses
Operating Expenses
Capital Expenses
Principal
Interest
Other Debt Service Costs
Grants in Aids
Advances
Other Financing Uses
Budget Reserve
Contingency Reserve
Other Uses
Total Expenditures
Revenues Over (Under) Expenditures
Other Financing Sources/(Uses)
Operating transfers in
Debt Proceeds including Re-financing
Operating transfers out
Total Other Financing Sources/(Uses)
Total Revenues Over/(Under) Expenditures
GOB Various GOB Total
Budget Actual Variance Budget Actual Variance
6,800,400$ 2,479,640$ 4,320,760$ 25,382,800$ 2,479,640$ 22,903,160$
- - - - - -
- - - - - -
- - - - - -
- - - - - -
- - - - - -
- 2 (2) - 2 (2)
- - - - - -
1,099,100 - 1,099,100 1,099,100 - 1,099,100
7,899,500 2,479,642 5,419,858 26,481,900 2,479,642 24,002,258
- - - - - -
208,500 - 208,500 208,500 - 208,500
- - - - - -
6,105,000 - 6,105,000 11,592,600 - 11,592,600
686,000 - 686,000 13,780,800 - 13,780,800
- - - - - -
- - - - - -
- - - - - -
- - - - - -
900,000 - 900,000 900,000 - 900,000
- - - - - -
- - - - - -
7,899,500 - 7,899,500 26,481,900 - 26,481,900
- 2,479,642 (2,479,642) - 2,479,642 (2,479,642)
- - - - - -
- - - - - -
- - - - - -
- - - - - -
-$ 2,479,642$ (2,479,642)$ -$ 2,479,642$ (2,479,642)$
4 - 11

Combining Statement of Revenues, Expenditures
And Changes in Fund Balance - Summary
All Debt Funds
As of November 30, 2013
Revenues:
Property Tax
Franchise and Other Taxes
Occupational Licenses and Permits
Fines and Forfeitures
Intergovernmental
Charges for Services
Interest
Impact Fees
Other
Total Revenues
Expenditures:
Personnel Expenses
Operating Expenses
Capital Expenses
Principal
Interest
Other Debt Service Costs
Grants in Aids
Advances
Other Financing Uses
Budget Reserve
Contingency Reserve
Other Uses
Total Expenditures
Revenues Over (Under) Expenditures
Other Financing Sources/(Uses)
Operating transfers in
Debt Proceeds including Re-financing
Operating transfers out
Total Other Financing Sources/(Uses)
Total Revenues Over/(Under) Expenditures
SOB Refinance 2002A SOB Refinance 2002C
Budget Actual Variance Budget Actual Variance
-$ -$ -$ -$ -$ -$
- - - - - -
- - - - - -
- - - - - -
- - - - - -
- - - - - -
- 0 (0) - - -
- - - - - -
- - - - - -
- 0 (0) - - -
- - - - - -
- - - - - -
- - - - - -
2,605,000 - 2,605,000 2,195,000.00 2,195,000 -
744,000 - 744,000 454,400 249,125 205,275
- - - -
- - - - - -
- - - - - -
- - - - - -
- - - - - -
- - - - - -
- - - - - -
3,349,000 - 3,349,000 2,649,400 2,444,125 205,275
(3,349,000) 0 (3,349,000) (2,649,400) (2,444,125) (205,275)
3,349,000 3,349,000 2,649,400 2,649,400
- - - - - -
- - - - - -
3,349,000 - 3,349,000 2,649,400 - 2,649,400
-$ 0$ (0)$ -$ (2,444,125)$ 2,444,125$
4 - 12

Combining Statement of Revenues, Expenditures
And Changes in Fund Balance - Summary
All Debt Funds
As of November 30, 2013
Revenues:
Property Tax
Franchise and Other Taxes
Occupational Licenses and Permits
Fines and Forfeitures
Intergovernmental
Charges for Services
Interest
Impact Fees
Other
Total Revenues
Expenditures:
Personnel Expenses
Operating Expenses
Capital Expenses
Principal
Interest
Other Debt Service Costs
Grants in Aids
Advances
Other Financing Uses
Budget Reserve
Contingency Reserve
Other Uses
Total Expenditures
Revenues Over (Under) Expenditures
Other Financing Sources/(Uses)
Operating transfers in
Debt Proceeds including Re-financing
Operating transfers out
Total Other Financing Sources/(Uses)
Total Revenues Over/(Under) Expenditures
SOB Street & SOB
Sidewalks Improv Parking Garage 2010A
Budget Actual Variance Budget Actual Variance
-$ -$ -$ -$ -$ -$
- - - - - -
- - - - - -
- - - - - -
- - - 2,160,000 180,000 1,980,000
- - - - - -
- 59 (59) - - -
- - - - - -
- - - - - -
- 59 (59) 2,160,000 180,000 1,980,000
- - - - - -
- - - - - -
- - - - - -
2,660,000 - 2,660,000 - - -
6,847,700 - 6,847,700 4,403,400 - 4,403,400
- - - - - -
- - - - - -
- - - - - -
- - - - - -
- - - - - -
- - - - - -
- - - - - -
9,507,700 - 9,507,700 4,403,400 - 4,403,400
(9,507,700) 59 (9,507,759) (2,243,400) 180,000 (2,423,400)
9,507,700 - 9,507,700 2,243,400 2,243,400
- - - - - -
- - - - - -
9,507,700 - 9,507,700 2,243,400 - 2,243,400
-$ 59$ (59)$ -$ 180,000$ (180,000)$
4 - 13

Combining Statement of Revenues, Expenditures
And Changes in Fund Balance - Summary
All Debt Funds
As of November 30, 2013
Revenues:
Property Tax
Franchise and Other Taxes
Occupational Licenses and Permits
Fines and Forfeitures
Intergovernmental
Charges for Services
Interest
Impact Fees
Other
Total Revenues
Expenditures:
Personnel Expenses
Operating Expenses
Capital Expenses
Principal
Interest
Other Debt Service Costs
Grants in Aids
Advances
Other Financing Uses
Budget Reserve
Contingency Reserve
Other Uses
Total Expenditures
Revenues Over (Under) Expenditures
Other Financing Sources/(Uses)
Operating transfers in
Debt Proceeds including Re-financing
Operating transfers out
Total Other Financing Sources/(Uses)
Total Revenues Over/(Under) Expenditures
SOB SOB
Parking Garage 2010B Miami Tunnel 2012
Budget Actual Variance Budget Actual Variance
-$ -$ -$ -$ -$ -$
- - - - - -
- - - - - -
- - - - - -
840,000 70,000 770,000 - - -
- - - - - -
- - - - - -
- - - - - -
- - - - - -
840,000 70,000 770,000 - - -
- - - - - -
- - - -
- - - - - -
- - - - - -
1,221,300 - 1,221,300 2,148,200 - 2,148,200
- - - -
- - - - - -
- - - - - -
- - - - - -
- - - - -
- - - - - -
- - - - - -
1,221,300 - 1,221,300 2,148,200 - 2,148,200
(381,300) 70,000 (451,300) (2,148,200) - (2,148,200)
381,300 381,300 2,148,200 2,148,200
- - - - -
- - - - - -
381,300 - 381,300 2,148,200 - 2,148,200
-$ 70,000$ (70,000)$ -$ -$ -$
4 - 14

Combining Statement of Revenues, Expenditures
And Changes in Fund Balance - Summary
All Debt Funds
As of November 30, 2013
Revenues:
Property Tax
Franchise and Other Taxes
Occupational Licenses and Permits
Fines and Forfeitures
Intergovernmental
Charges for Services
Interest
Impact Fees
Other
Total Revenues
Expenditures:
Personnel Expenses
Operating Expenses
Capital Expenses
Principal
Interest
Other Debt Service Costs
Grants in Aids
Advances
Other Financing Uses
Budget Reserve
Contingency Reserve
Other Uses
Total Expenditures
Revenues Over (Under) Expenditures
Other Financing Sources/(Uses)
Operating transfers in
Debt Proceeds including Re-financing
Operating transfers out
Total Other Financing Sources/(Uses)
Total Revenues Over/(Under) Expenditures
SOB 1987 JLK SOB Bonds
Convention 10/02-9/05
Budget Actual Variance Budget Actual Variance
-$ -$ -$ -$ -$ -$
- - - - - -
- - - - - -
- - - - - -
- - - - - -
- - - - - -
- - - - 0 (0)
- - - - - -
- - - - - -
- - - - 0 (0)
- - - - - -
- - - - - -
- - - - - -
731,200 - 731,200 - - -
4,816,200 - 4,816,200 3,886,000 - 3,886,000
- - - - - -
- - - - - -
- - - - - -
- - - - - -
- - - - - -
- - - - - -
- - - - - -
5,547,400 - 5,547,400 3,886,000 - 3,886,000
(5,547,400) - (5,547,400) (3,886,000) 0 (3,886,000)
5,547,400 465,465 5,081,935 3,886,000 - 3,886,000
- - - -
- - - - - -
5,547,400 465,465 5,081,935 3,886,000 - 3,886,000
-$ 465,465$ (465,465)$ -$ 0$ (0)$
4 - 15

Combining Statement of Revenues, Expenditures
And Changes in Fund Balance - Summary
All Debt Funds
As of November 30, 2013
Revenues:
Property Tax
Franchise and Other Taxes
Occupational Licenses and Permits
Fines and Forfeitures
Intergovernmental
Charges for Services
Interest
Impact Fees
Other
Total Revenues
Expenditures:
Personnel Expenses
Operating Expenses
Capital Expenses
Principal
Interest
Other Debt Service Costs
Grants in Aids
Advances
Other Financing Uses
Budget Reserve
Contingency Reserve
Other Uses
Total Expenditures
Revenues Over (Under) Expenditures
Other Financing Sources/(Uses)
Operating transfers in
Debt Proceeds including Re-financing
Operating transfers out
Total Other Financing Sources/(Uses)
Total Revenues Over/(Under) Expenditures
SOB Pensions SOB HUD SEOPW/
& Comp Absences Winwood
Budget Actual Variance Budget Actual Variance
-$ -$ -$ -$ -$ -$
- - - - - -
- - - - - -
- - - - - -
- - - - - -
- - - - - -
- - - - - -
- - - - - -
- - - - - -
- - - - - -
- - - - - -
6,500 - 6,500 - - -
- - - - - -
4,670,000 - 4,670,000 -
3,942,300 - 3,942,300 -
- - - -
- - - - - -
- - - - - -
- - - - - -
- - - - - -
- - - - - -
- - - - - -
8,618,800 - 8,618,800 - - -
(8,618,800) - (8,618,800) - - -
8,618,800 - 8,618,800 - - -
- - - - - -
- - - - - -
8,618,800 - 8,618,800 - - -
-$ -$ -$ -$ -$ -$
4 - 16

Combining Statement of Revenues, Expenditures
And Changes in Fund Balance - Summary
All Debt Funds
As of November 30, 2013
Revenues:
Property Tax
Franchise and Other Taxes
Occupational Licenses and Permits
Fines and Forfeitures
Intergovernmental
Charges for Services
Interest
Impact Fees
Other
Total Revenues
Expenditures:
Personnel Expenses
Operating Expenses
Capital Expenses
Principal
Interest
Other Debt Service Costs
Grants in Aids
Advances
Other Financing Uses
Budget Reserve
Contingency Reserve
Other Uses
Total Expenditures
Revenues Over (Under) Expenditures
Other Financing Sources/(Uses)
Operating transfers in
Debt Proceeds including Re-financing
Operating transfers out
Total Other Financing Sources/(Uses)
Total Revenues Over/(Under) Expenditures
SOB Total SOB CRA
Budget Actual Variance Budget Actual Variance
- - - -$ -$ -$
- - - - - -
- - - - - -
- - - - - -
3,000,000 250,000 2,750,000 - -
- - - - - -
- 60 (60) - - -
- - - - - -
- - - - -
3,000,000 250,060 2,749,940 - - -
- - - - - -
6,500 - 6,500 - -
- - - - - -
12,861,200 2,195,000 10,666,200 -
28,463,500 249,125 28,214,375 -
- - - - - -
- - - - - -
- - - - - -
- - - - - -
- - - - - -
- - - - - -
- - - - - -
41,331,200 2,444,125 38,887,075 - - -
(38,331,200) (2,194,065) (36,137,135) - - -
38,331,200 465,465 37,865,735 -
- - - - - -
- - - - - -
38,331,200 465,465 37,865,735 - - -
-$ (1,728,600)$ 1,728,600$ -$ -$ -$
4 - 17

Combining Statement of Revenues, Expenditures
And Changes in Fund Balance - Summary
All Debt Funds
As of November 30, 2013
Revenues:
Property Tax
Franchise and Other Taxes
Occupational Licenses and Permits
Fines and Forfeitures
Intergovernmental
Charges for Services
Interest
Impact Fees
Other
Total Revenues
Expenditures:
Personnel Expenses
Operating Expenses
Capital Expenses
Principal
Interest
Other Debt Service Costs
Grants in Aids
Advances
Other Financing Uses
Budget Reserve
Contingency Reserve
Other Uses
Total Expenditures
Revenues Over (Under) Expenditures
Other Financing Sources/(Uses)
Operating transfers in
Debt Proceeds including Re-financing
Operating transfers out
Total Other Financing Sources/(Uses)
Total Revenues Over/(Under) Expenditures
Total Debt Service
Budget Actual Variance
25,382,800$ 2,479,640$ 22,903,160$
- - -
- - -
- - -
3,000,000 250,000 2,750,000
- - -
- 62 (62)
- - -
1,099,100 - 1,099,100
29,481,900 2,729,702 26,752,198
- - -
215,000 - 215,000
- - -
24,453,800 2,195,000 22,258,800
42,244,300 249,125 41,995,175
- - -
- - -
- - -
- - -
900,000 - 900,000
- - -
- - -
67,813,100 2,444,125 65,368,975
(38,331,200) 285,577 (38,616,777)
38,331,200 465,465 37,865,735
- - -
- - -
38,331,200 465,465 37,865,735
-$ 751,042$ (751,042)$
4 - 18

Section 5 –
Capital Project Funds
Financial Update – Capital Project Funds
Combining Balance Sheet
Combining Statement of Revenues, Expenditures, and
Changes in Fund Balance

5 - 1
Financial Update – Capital Projects Funds
Fiscal Year 2014 - For the Month of November
Capital project funds are used to account for financial resources to be used for the acquisition or
construction of major capital facilities and infrastructure. The financial resources of capital projects
funds come from several different sources including general obligation bonds, state and federal
government grants, and appropriations from the general or special revenue funds.
The City of Miami has ten capital project funds, as follows:
General Government - To account for the acquisition or construction of major capital facilities that
support the City’s police, fire, computers, communications, and general government operations.
Community Redevelopment Agency - To account for the acquisition or construction of
major capital facilities for community redevelopment in the defined Community Redevelopment
Area.
Public Safety - To account for the acquisition or construction of major capital facilities that support
the City of Miami’s Police and Fire Operations.
Street and Sidewalks - To account for expenditures incurred for street, sidewalks, and other traffic
related projects.
Sanitary Sewers - To account for expenditures incurred for the construction of sanitary sewers.
Storm Sewers - To account for expenditures incurred for the construction of storm sewers.
Solid Waste - To account for the acquisition of equipment or facility maintenance associated with
the collection and removal of solid waste.
Public Facilities - To account for the acquisition or construction of major capital facilities for public
use such as marinas and stadiums.
Parks & Recreation - To account for the acquisition, rehabilitation, or construction of major capital
facilities for cultural and recreational activities such parks, elderly and youth day care centers.
Disaster Recovery - To account for revenue received from the Federal Emergency Management
Agency, insurance, and other agencies as reimbursements for citywide disasters in the areas of debris
removal, roads and bridges, buildings and equipment, parks, marinas, stadiums, and other measures
of relief.
Mass Transit – To account for the expenditures related to mass transit.
Transportation and Transit – To account for the expenditures related to transportation projects

5 - 2
Revenues
As of November 30, 2013, the total revenues for the capital projects funds were $5,657,903
General Government fund makes up the greater source of revenues consisting of a total of
$5,490,173. This fund represents approximately 98% of total revenues, as demonstrated below:
General Government
98%
Parks & Recreation
2%
Revenues by Fund
Expenditures
Total capital projects fund expenditures as of November 2013 were $3,042,089. Parks &
Recreation, Street & Sidewalks, and Storm Sewers funds make up 74% of total expenditures for CIP.
The chart below depicts capital projects expenditures by fund as of November 2013.
General Government
10%
Public Safety4%
SanitarySewers
8%
Storm Sewers13%
Street &Sidewalks &
Bonds29%
SolidWaste
1%
Public Facilities3%
Parks & Recreation
32%
Expenditures by Fund

5 - 3
Homeland Defense / Neighborhood Improvement Bond Program
During the 2005 fiscal year, the City authorized new issue of limited ad valorem tax bonds in the
amount of $255 million for the purpose of capital improvement projects. As of November 2013, the
city has $155 million issued and outstanding, and all have already been appropriated. The following
chart details the total expenditures, as follows:
The expenditures of bond proceeds for the construction of various capital improvements projects for
November, 2013 were $585,294.45.

City of Miami
Combining Balance Sheet
All Capital Projects Funds
As of November 30, 2013
General Public Sanitary Storm
Government CRA Safety Sewers Sewers
Assets
103000 Cash With Fiscal Agent -$ -$ (1)$ -$ -$
104000 Equity In Pooled Cash 61,423,366 1,813 12,407,474 17,256,201 9,875,468
115000 Accounts Receivable 1,212,142 - 65,522 - 437,487
115090 Unbilled Receivable - - (40,171) - (118,573)
117000 Allowance For Uncollectible (826,659) - - - -
133000 Due From Other Governmental - - 40,171 - -
135000 Interest And Dividends Recei 21,132 - - 4,125 -
137000 Market Gain/Loss Investments (157,961) - - - -
151900 Investments-Non-Current - - - - -
Total Assets 61,672,022$ 1,813$ 12,472,995$ 17,260,326$ 10,194,381$
Liabilities and Fund Balance
Liabilities:
202000 Accounts Payable 125,876 - 26,030 233,461 -
205000 Contracts Payable - - - - -
205100 Retainage Payable 264,673 - 372,980 23,346.10 869,419
214000 Accrued Expenditure Payable 23,499 - 183,521 - 314,341
216000 Accrued Wages Payable - - - - -
223000 Deferred Revenue 491,113 - 10,613,851 - 153,206
223100 Deferred Revenue-PnG - - - - -
Total Liabilities 905,161 - 11,196,383 256,807.06 1,336,966
Fund Balance:
305000 Fund Balance-Reserved for En 3,081,961 - 1,229,976 1,955,520 2,405,188
315000 Fund Balance-Unreserved 58,364,126 1,813 2,319 15,047,999 6,227,346
316000 Retained Earnings-Unreserved - - - - -
Total Fund Balance 61,446,087 1,813 1,232,296 17,003,519 8,632,534
Total Liabilities and Fund Balance 62,351,248$ 1,813$ 12,428,679$ 17,260,326$ 9,969,500$
5 - 4

City of Miami
Combining Balance Sheet
All Capital Projects Funds
As of November 30, 2013
Assets
103000 Cash With Fiscal Agent
104000 Equity In Pooled Cash
115000 Accounts Receivable
115090 Unbilled Receivable
117000 Allowance For Uncollectible
133000 Due From Other Governmental
135000 Interest And Dividends Recei
137000 Market Gain/Loss Investments
151900 Investments-Non-Current
Total Assets
Liabilities and Fund Balance
Liabilities:
202000 Accounts Payable
205000 Contracts Payable
205100 Retainage Payable
214000 Accrued Expenditure Payable
216000 Accrued Wages Payable
223000 Deferred Revenue
223100 Deferred Revenue-PnG
Total Liabilities
Fund Balance:
305000 Fund Balance-Reserved for En
315000 Fund Balance-Unreserved
316000 Retained Earnings-Unreserved
Total Fund Balance
Total Liabilities and Fund Balance
Streets
Sidewalks & Solid Public Transportion
Bonds Waste Facilities Parks and Transit
-$ -$ -$ -$ -$
59,181,775 702,655 23,737,629 14,904,352 19,396,878
1,248,369 29,469 1,706,091 606,704 -
2,800 - 260 197,078 -
(103,671) (27,977) (1,344,651) - -
- - - 27,655 -
94,888 - - - -
(47,915) - (1,347) - -
1 - - - -
60,376,247$ 704,146$ 24,097,983$ 15,735,789$ 19,396,878$
206,385 19,904 30,511 (215,083) -
- - - (10,986) -
863,689 - 585,420 465,697 -
764,392 - 36,597 68,502 -
1,830 - - - -
351,032 - 488,079 75,992 -
97 - 6,781 - -
2,187,425 19,904 1,147,387 384,122 -
12,674,496 555,839 9,004,172 5,898,709 -
45,737,899 128,403 13,053,148 8,767,591 19,396,878
- - 893,079 51,960 -
58,412,395 684,242 22,950,399 14,718,260 19,396,878
60,599,820$ 704,146$ 24,097,786$ 15,102,382$ 19,396,878$
5 - 5
City of Miami
Combining Balance Sheet
All Capital Projects Funds
As of November 30, 2013
Assets
103000 Cash With Fiscal Agent
104000 Equity In Pooled Cash
115000 Accounts Receivable
115090 Unbilled Receivable
117000 Allowance For Uncollectible
133000 Due From Other Governmental
135000 Interest And Dividends Recei
137000 Market Gain/Loss Investments
151900 Investments-Non-Current
Total Assets
Liabilities and Fund Balance
Liabilities:
202000 Accounts Payable
205000 Contracts Payable
205100 Retainage Payable
214000 Accrued Expenditure Payable
216000 Accrued Wages Payable
223000 Deferred Revenue
223100 Deferred Revenue-PnG
Total Liabilities
Fund Balance:
305000 Fund Balance-Reserved for En
315000 Fund Balance-Unreserved
316000 Retained Earnings-Unreserved
Total Fund Balance
Total Liabilities and Fund Balance
Total
Disaster Mass Capital
Recovery Transit Projects
-$ -$ (1)$
1,137,476 (96,089) 219,928,997
12,683 95,440 5,413,906
- 0 41,394
- - (2,302,957)
- - 67,825
- - 120,145
- - (207,222)
- - 1
1,150,159$ (649)$ 223,062,089$
- - 427,084
- - (10,986)
26,949 - 3,472,174
- - 1,390,853
- - 1,830
1,895,593 79,146 14,148,011
- - 6,878
1,922,542 79,146 19,435,844
75,577 18,157 36,899,597
(847,854) (97,952) 165,781,716
(106) - 944,932
(772,383) (79,795) 203,626,245
1,150,159$ (649)$ 223,062,089$
5 - 6

City of Miami
Combining Statement of Revenues, Expenditures
And Changes in Fund Balance
All Capital Projects
As of November 30, 2013
General Public Sanitary Storm
Government CRA Safety Sewers Sewers
Revenues:
Property Tax -$ -$ -$ -$ -$
Franchise and Other Taxes - - - -
Occupational Licenses and Permits - - - -
Fines and Forfeitures - - - -
Intergovernmental 15,000 - 3,976 -
Charges for Services - - - - -
Interest (23,085) - - -
Impact Fees 5,487,613 - - - -
Other 10,645 - - - -
Total Revenues 5,490,173 - 3,976 - -
Expenditures:
Personnel Expenses 125 - - - -
Operating Expenses 240,538 - 11,913 - -
Capital Expenses 72,367 - 102,559 233,532 387,771
Principal - - - - -
Interest - - - - -
Other Debt Service Costs - - - - -
Grants in Aids - - - - -
Advances - - - - -
Other Financing Uses - - - - -
Budget Reserve - - - - -
Contingency Reserve - - - - -
Other Uses - - - - -
Total Expenditures 313,030 - 114,472 233,532 387,771
Revenues Over (Under) Expenditures 5,177,143 - (110,496) (233,532) (387,771)
Other Financing Sources/(Uses):
Operating transfers in - -
Debt Proceeds including Re-financing - - - - -
Operating transfers out - - - - -
Total Other Financing Sources/(Uses) - - - - -
Total Revenues Over/(Under) Expenditures 5,177,143$ -$ (110,496)$ (233,532)$ (387,771)$
5-7

City of Miami
Combining Statement of Revenues, Expenditures
And Changes in Fund Balance
All Capital Projects
As of November 30, 2013
Government
Revenues:
Property Tax
Franchise and Other Taxes
Occupational Licenses and Permits
Fines and Forfeitures
Intergovernmental
Charges for Services
Interest
Impact Fees
Other
Total Revenues
Expenditures:
Personnel Expenses
Operating Expenses
Capital Expenses
Principal
Interest
Other Debt Service Costs
Grants in Aids
Advances
Other Financing Uses
Budget Reserve
Contingency Reserve
Other Uses
Total Expenditures
Revenues Over (Under) Expenditures
Other Financing Sources/(Uses):
Operating transfers in
Debt Proceeds including Re-financing
Operating transfers out
Total Other Financing Sources/(Uses)
Total Revenues Over/(Under) Expenditures
Street
Sidewalks Solid Public Transportation
& Bonds Waste Facilities Parks
-$ -$ -$ -$
- - - -
- - - -
- (27) - -
2,703 - 20,980 106,159
- - - 13,070
20,554 - 307 -
- - - -
- 8 - -
23,257 (19) 21,287 119,230
5,026 - 1,421 1,487
4,753 24,406 27,267 252
869,315 - 75,768 983,589
- - - -
- - - -
- - - -
- - - -
- - - -
- - - -
- - - -
- - - -
- - - -
879,094 24,406 104,457 985,327
(855,837) (24,425) (83,170) (866,098)
- - - -
- - - -
- - - -
(855,837)$ (24,425)$ (83,170)$ (866,098)$
5-8

City of Miami
Combining Statement of Revenues, Expenditures
And Changes in Fund Balance
All Capital Projects
As of November 30, 2013
Government
Revenues:
Property Tax
Franchise and Other Taxes
Occupational Licenses and Permits
Fines and Forfeitures
Intergovernmental
Charges for Services
Interest
Impact Fees
Other
Total Revenues
Expenditures:
Personnel Expenses
Operating Expenses
Capital Expenses
Principal
Interest
Other Debt Service Costs
Grants in Aids
Advances
Other Financing Uses
Budget Reserve
Contingency Reserve
Other Uses
Total Expenditures
Revenues Over (Under) Expenditures
Other Financing Sources/(Uses):
Operating transfers in
Debt Proceeds including Re-financing
Operating transfers out
Total Other Financing Sources/(Uses)
Total Revenues Over/(Under) Expenditures
Total
Transportation Disaster Mass Capital
and Transit Recovery Transit Projects
-$ -$ -$ -$
- - -
- - - -
- - - (27)
- 148,818
- - - 13,070
- - - (2,224)
- - - 5,487,613
- - 10,653
- - - 5,657,903
- - 8,059
- - 309,129
- - 2,724,901
- - -
- - - -
- - - -
- - - -
- - - -
- - - -
- - - -
- - - -
- - - -
- - - 3,042,089
- - - 2,615,815
- -
- - - -
- - -
- - - -
-$ -$ -$ 2,615,815$
5-9

Section 6 –
Cash Position
Financial Update – Cash Position for all City of Miami Funds
Cash Position – All Funds

6-1
Financial Update – Cash Position for all Funds
Fiscal Year 2014 – For the Month of November
As of November 30, 2013 the City of Miami had a balance of cash in the bank of $369,477,397. This balance of
cash represents funds that are restricted, encumbered and appropriated along with other funds that are available
for general operations of the City.
Of the total balance of cash in the bank, the following amounts are restricted and cannot be used for General
Fund operations:
Special Revenue of $102,722,230. Special revenues are specific revenue sources that are legally restricted
for expenditure for particular purposes. Examples include Storm Water Fee, Miami-Dade Tourist Tax, etc.
Debt Service of $10,322,197. Debt Service funds represents those dollars that are required to be set aside to
pay interest and principal on bonds outstanding.
Capital projects of $219,928,997. Capital Projects represent those dollars that have been appropriated for
specific capital construction projects.
Trust and Agency of $0.0 Trust and Agency funds represent those dollars that are legally restricted for
expenditures. Example: Elected Officials Retirement Trust.
Some of the cash in the bank is already “encumbered”. Encumbered funds represent those funds that have been
set aside to pay outstanding invoices. The amount encumbered as of November 30, 2013 is $0.00.
In addition, some of the cash in the bank is classified as deposits refundable or deferred items that cannot be
used. The amount of these funds as of November 30, 2013 is $15,495,220.
The remaining amount of the total balance of cash in the bank as of November 30, 2013 that is available for
General Fund Operations is $36,503,853.
Cash Balance as of 11-30-13
0
50
100
150
200
250
Gen Fund Spec Rev Debt Serv Cap Proj
FY-2013
FY-2014

City of Miami
Cash Position
All Funds
As of November 30, 2013
DESCRIPTION 11/1/2013 12/1/2013 Variance
GENERAL LEDGER CASH BALANCE 81,012,879$ 66,553,714$ (14,459,165)$
LESS: O/S CHECKS AND PAYROLL LIABILITIES (5,975,020) (4,869,813) 1,105,207
PLUS: OPERATING INVESTMENT PORTFOLIO 271,993,469 307,793,496 35,800,026
TOTAL POOLED CASH 347,031,329$ 369,477,397$ 22,446,068$
RESTRICTED CASH
SPECIAL REVENUE 94,292,654$ 102,722,230$ 8,429,576$
DEBT SERVICE 14,570,142 10,322,197 (4,247,945)
CAPITAL PROJECTS 220,224,794 219,928,997 (295,797)
TRUST & AGENCY - - -
GENERAL FUND CASH AVAIABLE FOR OPERATION 17,943,618$ 36,503,853$ 18,560,234$
LESS: GENERAL FUND ENCUMBRANCES - - -
LESS: GENERAL FUND DEPOSITS REFUNDABLE (6,058,827) (6,210,716) (151,889)
LESS: GENERAL FUND DEFERRED ITEMS (9,284,504) (9,284,504) -
LESS: GENERAL FUND DESIGNATIONS
- -
- -
- -
NON SPENDABLE (3,523,499) (4,806,948)
ASSIGNED (50,403,318) (50,403,318)
TOTAL GENERAL FUND DESIGNATIONS (53,926,817) (55,210,266) (1,283,449)
TOTAL GENERAL FUND CASH AVAILABLE NET OF OBLIGATIONS (51,326,529)$ (34,201,633)$ 17,124,896$
6 - 2

Section 7 –
Investments
Financial Update – Investment Portfolio
Portfolio – Interest Income
Portfolio – Details
Total Investments Outstanding

7 - 1
Financial Update – Investment Portfolio
Fiscal Year 2014 - For the Month of November
The City of Miami’s Investment Portfolio is in compliance with the City’s Adopted Investment
Policy. The investment portfolio is comprised of the following:
US Treasury 0.00% 0.0000%
US Instruments/Agnecy 88.37% 0.8814%
Commercial Paper 11.63% 0.0667%
As of November 30, 2013 the rate of return was 0.8412%.
The largest portion of the portfolio, 88.37%, is invested in US Federal Instruments, which are
comprised of US Government Agencies including FHLB, FHLMC, FNMA, and FFCB.
Monthly yields for FY 2014 are as follows:
Investment Yield Treasury 1 Yr to 3 Yr Yield % Variance
October 2013 0.8814 0.5800 0.3014
Nov-13 0.8412 0.5600 0.2801
Total 0.8608 0.0570 0.2910

City of Miami
Investment Portfolio
Interest Income
As of November 30, 2013
A comparison of actual interest income for the two months ended November 30, 2013
is represented as follows:
Interest
Budgeted Earned Cumulative % of Budget
General Fund
Oct-13 1,500,000 186,215 186,215 12.41%
Nov-13 183,073 369,287 12.20%
Totals 1,500,000 369,287 24.62%
Special Revenue Fund
Oct-13 4,621 4,621
Nov-13 5,482 10,103
Totals - 10,103
Projection of General Fund Interest Income for FY 2013 - 2014
Cash Interest Monthly Interest Monthly Interest Monthly Cumulative
Month Balance Rate City Portfolio Non Gen Fund Total Total
Actual YTD 368,845 442 369,287
December 230,637,000 0.4000% 76,879 1,000 77,879 447,166
January 295,637,000 0.4000% 98,546 1,000 99,546 546,712
February 295,637,000 0.4000% 98,546 1,000 99,546 646,257
March 297,637,000 0.4000% 99,212 1,000 100,212 746,470
April 288,537,000 0.4000% 96,179 1,000 97,179 843,649
May 298,537,000 0.4000% 99,512 1,000 100,512 944,161
June 283,537,000 0.4000% 94,512 1,000 95,512 1,039,673
July 263,537,000 0.4000% 87,846 1,000 88,846 1,128,519
August 234,565,000 0.4000% 78,188 1,000 79,188 1,207,707
September 184,565,000 0.4000% 61,522 1,000 62,522 1,270,229
1,259,787 10,442 900,942
7-2

City of Miami
Cash Management Pool
Portfolio Characteristics
As of November 30, 2013
% of Portfolio Maturity
Actual Maximum Actual Maximum
Book Month During By Month During By Curr. Mon.
Investment Vehicle Value Market End Year Policy End Year Policy Rate of Return
Government Obilgations:
T Notes - - 0.00% 0.00% 100% 0 mos. 0 mos. 60 mos. 0.000%
T Bills - - 0.00% 0.00% 100% 0 mos. 0 mos. 60 mos. 0.000%
Government Obilgations - - 0.00% 0.000%
Federal Instruments:
FHLB 78,778,873 78,150,251 25.61% 28.98% 100% 56 mos. 57 mos. 60 mos. 0.8673%
FHLMC 51,491,795 50,821,695 16.73% 18.95% 100% 52 mos. 53 mos. 60 mos. 0.9603%
FNMA 83,130,586 82,593,019 27.01% 30.55% 100% 54 mos. 55 mos. 60 mos. 0.8278%
FFCB 58,550,000 57,789,738 19.02% 21.52% 100% 54 mos. 55 mos. 60 mos. 0.9073%
Federal Instruments 271,951,255 269,354,702 88.37% 0.8814%
Money Market: Treasury - - 0.00% 0.00% 100% mos. mos. 9 mos. 0.000%
State Board of Administration - - 0.00% 0.00% 100% mos. mos. 9 mos. 0.000%
Commercial Paper: 35,798,784 35,797,155 11.63% 11.63% 35% 1 mos. 1 mos. 9 mos. 0.0667%
Totals 307,750,039 305,151,857 100.00% 0.8412%
7 - 3

City of Miami
Investment Portfolio
Total Investments Outstanding
As of November 30, 2013
Original Accrued Total Cost
Date of CUSIP Coupon Call Maturity Par Cost of Interest of Interest
Purchase NUMBER Rate Date Date Value Investment Purchased Investment Receivable Book Value
U.S. GOVT. AGENCIES
6/28/2012 F12 3136G0NE7 1.150% 6/28/2017 860,000.00 860,000.00 - 860,000.00 4,203.25 860,000.00
9/25/2012 F80 3135G0PB3 0.500% 9/25/2015 800,000.00 800,000.00 - 800,000.00 733.33 800,000.00
11/5/2012 SO 3136G03Z2 0.500% 10/30/2017 7,000,000.00 7,000,000.00 486.11 7,000,000.00 3,013.89 7,000,000.00
11/5/2012 SO2 3136G03Z2 0.500% 10/30/2017 4,000,000.00 4,000,000.00 277.78 4,000,277.78 1,722.22 4,000,000.00
11/5/2012 SO2 3136G03Z2 0.500% 10/30/2017 7,200,000.00 7,200,000.00 500.00 7,200,500.00 3,100.00 7,200,000.00
11/8/2012 3135G0QW6 1.000% 11/8/2017 3,665,000.00 3,665,000.00 - 3,665,000.00 2,341.53 3,665,000.00
11/21/2012 3136G04S7 0.750% 2/21/2017 10,000,000.00 10,000,000.00 - 10,000,000.00 20,833.33 10,000,000.00
11/21/2012 SO2 3136G04S7 0.750% 2/21/2017 14,200,000.00 14,200,000.00 14,200,000.00 29,583.33 14,200,000.00
3/27/2013 3136G1GD5 1.100% 3/27/2018 10,000,000.00 10,000,000.00 - 10,000,000.00 19,555.56 10,000,000.00
3/28/2013 3136G1GZ6 1.000% 3/28/2018 10,000,000.00 10,000,000.00 - 10,000,000.00 17,500.00 10,000,000.00
4/30/2013 3136G1KD0 1.010% 4/30/2018 10,000,000.00 9,995,000.00 - 9,995,000.00 8,611.11 9,995,586.11
5/23/2013 F80 3135G0XD0 1.000% 5/21/2018 3,665,000.00 3,665,000.00 203.61 3,665,203.61 1,018.06 3,665,000.00
5/23/2013 F81 3135G0XD0 1.000% 5/21/2018 1,745,000.00 1,745,000.00 96.94 1,745,096.94 484.72 1,745,000.00
FNMA NOTES 27.01% 83,135,000.00 83,130,000.00 1,564.44 83,131,078.33 112,700.33 83,130,586.11
10/11/2012 3133EA4H8 0.820% 7/11/2017 4,400,000.00 4,400,000.00 - 4,400,000.00 14,031.11 4,400,000.00
10/11/2012 F60 3133EA4H8 0.820% 7/11/2017 10,000,000.00 10,000,000.00 - 10,000,000.00 31,888.89 10,000,000.00
10/11/2012 B3 3133EA4H8 0.820% 7/11/2017 5,600,000.00 5,600,000.00 - 5,600,000.00 17,857.78 5,600,000.00
3/12/2013 3133ECHS6 1.030% 3/12/2018 10,000,000.00 10,000,000.00 - 10,000,000.00 22,602.78 10,000,000.00
3/14/2013 3133ECJ39 1.050% 3/14/2018 10,000,000.00 10,000,000.00 - 10,000,000.00 22,458.33 10,000,000.00
4/25/2013 F83 3133ECMM3 0.600% 4/25/2017 2,700,000.00 2,700,000.00 - 2,700,000.00 1,620.00 2,700,000.00
4/25/2013 F85 3133ECMM3 0.600% 4/25/2017 2,150,000.00 2,150,000.00 - 2,150,000.00 1,290.00 2,150,000.00
5/8/2013 SO2 3133ECNY6 0.950% 5/8/2018 13,700,000.00 13,700,000.00 - 13,700,000.00 8,315.14 13,700,000.00
FEDERAL FARM CREDIT BK NOTES 19.02% 58,550,000.00 58,550,000.00 - 58,550,000.00 120,064.03 58,550,000.00
1/8/2013 3134G32S8 0.750% 6/27/2017 5,000,000.00 5,000,000.00 1,145.83 5,001,145.83 16,041.67 5,000,000.00
1/10/2013 3134G32Y5 0.920% 12/28/2017 10,000,000.00 9,993,000.00 3,000.00 9,996,000.00 38,250.00 9,991,795.30
1/30/2013 3134G34K3 1.000% 1/30/2018 10,000,000.00 10,000,000.00 - 10,000,000.00 33,611.11 10,000,000.00
3/4/2013 3134G33B4 1.000% 1/11/2018 10,000,000.00 10,000,000.00 14,722.22 10,014,722.22 38,888.89 10,000,000.00
3/26/2013 3134G36H8 1.000% 3/26/2018 10,000,000.00 10,000,000.00 - 10,000,000.00 18,055.56 10,000,000.00
4/2/2013 313463Z29 1.000% 12/11/2017 6,500,000.00 6,500,000.00 20,041.67 6,520,041.67 30,694.44 6,500,000.00 FHLMC NOTES 16.73% 51,500,000.00 51,493,000.00 38,909.72 51,531,909.72 175,541.67 51,491,795.30
9/27/2012 31338OP27 0.870% 9/27/2017 15,000,000.00 15,000,000.00 15,000,000.00 23,200.00 15,000,000.00
9/27/2012 SO 313380P27 0.870% 9/27/2017 5,000,000.00 5,000,000.00 - 5,000,000.00 7,733.33 5,000,000.00
10/24/2012 F79 313380WR4 0.850% 7/24/2017 4,030,000.00 4,030,000.00 4,030,000.00 12,084.40 4,030,000.00
1/8/2013 313381PK5 0.770% 6/27/2017 5,000,000.00 5,000,000.00 1,176.39 5,001,176.39 16,469.44 5,000,000.00
1/25/2013 313381RY3 0.700% 1/25/2017 10,000,000.00 10,000,000.00 - 10,000,000.00 24,500.00 10,000,000.00
2/14/2013 3133826J7 0.050% 8/14/2017 10,000,000.00 10,000,000.00 - 10,000,000.00 14,861.11 10,000,000.00
3/27/2013 313382EH2 1.000% 12/27/2017 15,000,000.00 15,000,000.00 - 15,000,000.00 101,666.67 15,000,000.00
3/27/2013 313382HE6 1.000% 12/27/2017 10,000,000.00 10,000,000.00 - 10,000,000.00 17,777.78 10,000,000.00
6/13/2013 F12 313381NL5 1.160% 7/10/2018 4,800,000.00 4,743,696.00 23,664.00 4,767,360.00 21,808.00 4,748,873.38
FHLB NOTES 25.61% 78,830,000.00 78,773,696.00 24,840.39 78,798,536.39 240,100.73 78,778,873.38
TOTAL U.S. GOVT AGENCIES 88.37% 272,015,000.00 271,946,696.00 65,314.55 272,011,524.44 648,406.76 271,951,254.79
COMMERCIAL PAPER 360 DAYS BASIS
11/19/2013 F60 89233GZP4 0.060% 12/23/2013 3,700,000.00 3,699,790.33 - 3,699,790.33 - 3,699,864.33
11/19/2013 F70 89233GZJ8 0.050% 12/18/2013 900,000.00 899,963.75 - 899,963.75 - 899,978.75
11/19/2013 B3 30229AZP7 0.070% 12/23/2013 5,000,000.00 4,999,669.44 - 4,999,669.44 - 4,999,786.11
11/19/2013 B3 36959HZL4 0.070% 12/20/2013 4,500,000.00 4,499,728.75 - 4,499,728.75 - 4,499,833.75
11/19/2013 B3 36959HZK6 0.070% 12/19/2013 10,000,000.00 9,999,416.67 - 9,999,416.67 - 9,999,650.00
11/19/2013 MPG 89233GZH2 0.060% 12/17/2013 9,700,000.00 9,699,547.33 - 9,699,547.33 - 9,699,741.33
11/19/2013 MR 30229AZK8 0.070% 7/17/2013 2,000,000.00 1,999,883.33 - 1,999,883.33 - 1,999,930.00
TOTAL COMMERCIAL PAPER 11.63% 35,800,000.00 35,797,999.60 - 35,797,999.60 - 35,798,784.27
GRAND TOTAL U.S. GOVT TREAS, AGENCIES, SBA
AND COMMERCIAL PAPER 100.00% 307,815,000.00 307,744,695.60 65,314.55 307,809,524.04 648,406.76 307,750,039.06
B Securities for GOB 2002
Effective 08-02-05, the yield on bond investments can not be greater than the yield restriction of 4.936%
7 - 4

Section 8 – Cash Payments Received on Major
Accounts Receivables
Financial Update – Accounts Receivable
Cash Payments Received and Aging on Major Accounts
Receivable

8-1
Financial Update – Accounts Receivable
Fiscal Year 2014 - For the Month of November
The City currently records receivables when they are billed. The major receivables consist of
the different categories shown below, of which Business Tax Receipts represents 33% and
Certificate of Use represents 32%. The City of Miami billed the Certificate of Use for FY14
early in July-2013 for a total of $6,592,301.60. The Burglar Alarm for FY14 was billed in
August 8, 2013 for a total of $700,395.00. The Business Tax Receipts for FY14 were billed
early in July-2013 for a total of $7,510,026.50. All other major receivables are billed
throughout the year. The graph below depicts the percentage of each major category of
receivables (billings net of adjustments and cash receipts) as of November 30, 2013.

Accounts Accounts
Receivable YTD Receivable
Description Type 10/1/2013
Billings Net of
Adjustments Oct-13 Nov-13 Dec-13 Jan-14 Feb-14 Mar-14 YTD 11/30/2013
Trash Citation Lien- Code Enf. AL09 199,023.91 4,050.00 (3,561.64) (749.44) (4,311.08) 198,762.83
Code Enf. Board-Hearing Fee
Monthly Revolving AL38 1,085,600.26 67,475.74 (27,043.83) (15,447.38) (42,491.21) 1,110,584.79
Code Enforcement Ticketing AL82 538,428.34 57,837.50 (16,725.00) (8,690.00) (25,415.00) 570,850.84
Trash Citation Lien Solid Waste Dept. AL9A 421,007.06 15,514.53 (10,661.28) (4,255.83) (14,917.11) 421,604.48
Burglar Alarms BA11 247,375.87 83,650.60 (78,166.10) (41,413.83) (119,579.93) 211,446.54
Cert of Use/Supp Waste CU01 3,030,925.46 153,167.67 (544,535.03) (275,674.52) (820,209.55) 2,363,883.58
Business Tax Receipts BTR01 3,391,749.02 132,067.74 (857,299.61) (239,059.16) (1,096,358.77) 2,427,457.99
Totals 8,914,109.92 513,763.78 (1,537,992.49) (585,290.16) - - - - (2,123,282.65) 7,304,591.05
* The YTD Billing column represents any new licenses and adjustments for the current fiscal year
Receivable Aging Type Amount Under 30 30-59 60-89 90-119 120 & Over
Trash Citation Lien- Code Enf. AL09 198,762.83 1,626.77 525.00 - 903.42 195,707.64
Code Enf. Board-Hearing Fee
Monthly Revolving AL38 1,110,584.79 109,616.23 6,223.58 5,459.83 4,535.02 984,750.13
Code Enforcement Ticketing AL82 570,850.84 56,737.50 - 49,827.50 24,937.50 439,348.34
Trash Citation Lien Solid Waste Dept. AL9A 421,604.48 8,094.76 7,703.18 7,296.56 9,521.01 388,988.97
Burglar Alarms BA11 211,446.54 - 734.50 187,432.04 - 23,280.00
Cert of Use/Supp Waste CU01 2,363,883.58 8,414.35 6,040.53 1,389,666.58 - 959,762.12
Business Tax Receipts BTR01 2,427,457.99 - 4,528.11 1,413,676.20 - 1,009,253.68
Totals 7,304,591.05 184,489.61 25,754.90 3,053,358.71 39,896.95 4,001,090.88
Note:
1) City of Miami's Reserve Policy is to fully reserve all receivables that are 60 Days or older.
Aging Report
Collection
Collections
City of Miami
Cash Payments Received and Aging on Major Account Receivables
As of November 30, 2013
8__2_Cash_Payments_Received_on_Major_AR_11-13