city of north lauderdale, florida
TRANSCRIPT

City of North Lauderdale, Florida
Comprehensive Annual Financial Report Fiscal Year Ended September 30, 2013
PREPARED BY
THE FINANCE DEPARTMENT STEVEN CHAPMAN II, FINANCE DIRECTOR
SENDIE RYMER, CONTROLLER


City of North Lauderdale, Florida Comprehensive Annual Financial Report Fiscal Year Ended September 30, 2013
Table of Contents
INTRODUCTORY SECTION PAGELetter of transmittal i – iiiCertificate of achievement ivOrganizational chart vList of principal officials vi
FINANCIAL SECTION
Independent auditor’s report 1 – 2Management’s discussion and analysis 3 – 13Basic financial statements: Government-wide financial statements:
Statement of net position 14 Statement of activities 15 –16
Fund financial statements: Governmental funds:
Balance sheet 17 – 18 Reconciliation of governmental funds balance sheet to the statement of net position 19 Statement of revenues, expenditures, and changes in fund balances 20 – 21 Reconciliation of the statement of revenues, expenditures, and changes in fund balances of of governmental funds to the statement of activities 22 Statement of revenues, expenditures, and changes in fund balances – budget to actual – general fund 23 – 24 Statement of revenues, expenditures, and changes in fund balance – budget to actual – special revenue funds – fire/rescue fund 25 Statement of revenues, expenditures, and changes in fund balance – budget to actual – special revenue funds - North Lauderdale Water Control District Fund 26Proprietary funds:
Statement of net position 27 Reconciliation of the statement of net position – proprietary funds to the statement of net position 28 Statement of revenues, expenses, and changes in net position 29 Reconciliation of the statement of revenues, expenses, and changes in net position to the statement of activities 30 Statement of cash flows 31 – 32Fiduciary fund:
Statement of fiduciary net position 33 Notes to financial statements 34 – 55
Required Supplementary Information (unaudited): Schedule of funding progress 56 Schedule of employer contributions 57
Table of Contents
FINANCIAL SECTION (CONTINUED) PAGESupplementary Information: Combining and individual fund statements and schedules: Nonmajor governmental funds: Combining balance sheet 58 Combining statement of revenues, expenditures and changes in fund balances 59 Internal service funds: Combining statement of net position 60 Combining statement of revenues, expenses, and changes in net position 61 Combining statement of cash flows 62-63 Statement of changes in assets and liabilities – agency fund 64 Schedule of revenues, expenditures and changes in fund balance – budget to actual –
65 special revenue funds – parks and recreation fund Schedule of revenues, expenditures and changes in fund balance – budget to actual – debt service fund 66
STATISTICAL SECTION Schedule 1 – Net position by components 67Schedule 2 – Change in net position 68–69Schedule 3 – Governmental activities tax revenues by source 70Schedule 4 – Fund balance of governmental funds 71Schedule 5 – Changes in fund balance of governmental funds 72–73Schedule 6 – Assessed value and estimated actual value of taxable property 74Schedule 7 – Property tax rates – direct and overlapping governments 75Schedule 8 – Principal property taxpayers 76Schedule 9 – Property tax levies and collections 77Schedule 10 – Ratio of outstanding debt by type 78Schedule 11 – Ratio of general bonded debt outstanding 79Schedule 12 – Direct and overlapping governmental activity debt 80Schedule 13 – Legal debt margin information 81Schedule 14 – Pledged revenue coverage 82Schedule 15 – Demographic and economic statistics 83Schedule 16 – Principal employers 84Schedule 17 – Full-time equivalent city government employees by function 85Schedule 18 – Operating indicators by function 86-87Schedule 19 – Capital assets by function 88
COMPLIANCE SECTIONIndependent auditor’s report on internal control over financial reporting and on compliance and other matters based on an audit of financial statements performed in accordance with Government Auditing Standards
89-90
Management letter pursuant to the rules of the Auditor General of the State of Florida 91-92
Independent auditor’s report on compliance for each major program and on internal control over compliance required by OMB Circular A-133 93-94
Schedule of expenditures of federal awards 95Notes to schedule of expenditures of federal awards 96Schedule of findings and questioned costs - federal awards 97

i
701 Southwest 71st Avenue, North Lauderdale, Florida 33068-2395 954-722-0900 • Fax 954-720-2151 • www.nlauderdale.org
March 18, 2014 To the Honorable Mayor, City Commissioners and Citizens of the City of North Lauderdale, Florida The Finance Department is pleased to submit the Comprehensive Annual Financial Report (“CAFR”) of the City of North Lauderdale, Florida (the “City”), for the fiscal year ended September 30, 2013. The report fulfills the state requirements that all general-purpose local governments publish a complete set of audited financial statements. In addition to meeting legal requirements, the report presents full financial disclosure. This philosophy is demonstrated by the informative financial analysis provided herein. Management assumes full responsibility for the completeness and reliability of all of the information contained in this report, based upon a comprehensive internal control framework that is designed for this purpose. Because the cost of internal controls should not outweigh their benefits, the City’s comprehensive framework of internal controls has been designed to provide reasonable rather than absolute assurance that the financial statements are free of any material misstatements. The City’s September 30, 2013 financial statements have been audited by a firm of certified public accountants licensed in the State of Florida. Their independent auditor report contains an unmodified opinion and is presented as the first component of the financial section of this report. The independent audit of the City’s financial statements included the federally mandated “Single Audit” designed to meet the special needs of federal grantor agencies. The standards governing Single Audit engagements require the independent auditor to report not only on the fair presentation of the financial statements, but also on the City’s internal controls and compliance with legal requirements, with special emphasis on internal controls and legal requirements involving the administration of federal awards. These reports are available in the final section of this report. Management’s Discussion and Analysis (“MD&A”) provides a narrative introduction, overview and analysis to accompany the basic financial statements. This letter of transmittal is designed to complement MD&A and should be read in conjunction with it. The City’s MD&A can be found immediately following the independent auditor’s report. North Lauderdale at a Glance
The City was incorporated on July 15, 1963 and is located in northwestern Broward County (the “County”), Florida, 8 miles northwest of Fort Lauderdale. The City was developed as a full service municipality serving a largely suburban residential community. Over the past few years, the City has annexed adjacent unincorporated properties into its municipal boundaries, bringing the City’s total land area and population to approximately 5.5 square miles and 41,000 residents, respectively. With the exception of a few remaining undeveloped parcels, the City has essentially reached build-out. Future growth of the City is unlikely due to the City’s geographic location within the County and the reality that there is no remaining unincorporated areas left to annex.
MAYOR VICE MAYOR Jack Brady Jerry Graziose
COMMISSIONER COMMISSIONER Gary Frankel David G. Hilton
COMMISSIONER CITY MANAGER Rich Moyle Ambreen Bhatty
CITY ATTORNEY CITY CLERK Samuel S. Goren Patricia Vancheri

ii

iii

iv

v
CITY OF NORTH LAUDERDALE, FLORIDA
Organizational Chart As of September 30, 2013

vi
CITY OF NORTH LAUDERDALE, FLORIDA
List of Principal Officials As of September 30, 2013 Title Name Mayor (At Large) Jack Brady Vice Mayor (District B) Jerry Graziose Commissioner (District A) Gary Frankel Commissioner (District C) Rich Moyle Commissioner (District D)
David G. Hilton
City Manager Ambreen Bhatty City Attorney Samuel S. Goren City Clerk Patricia Vancheri Assistant City Manager Vacant Community Development Director Tammy Reed-Holguin Finance Director Steven Chapman II Human Resource Manager Jennifer Yarmitzky Fire Chief Rodney Turpel Parks and Recreation Director Michael Sargis Police Chief/Public Safety Director William Jackson Public Works Director Mike Shields

2700 North Military Trail � Suite 350
Boca Raton, Florida 33431 (561) 994-9299 � (800) 299-4728 Fax (561) 994-5823 www.graucpa.com
INDEPENDENT AUDITOR’S REPORT
Honorable Mayor, City Commissioners and City Manager City of North Lauderdale, Florida
Report on the Financial Statements
We have audited the accompanying financial statements of the governmental activities, the business-type activities, each major fund, and the aggregate remaining fund information of the City of North Lauderdale, Florida (the “City”) as of and for the fiscal year ended September 30, 2013, and the related notes to the financial statements, which collectively comprise the City’s basic financial statements as listed in the table of contents.
Management’s Responsibility for the Financial Statements Management is responsible for the preparation and fair presentation of these financial statements in accordance with accounting principles generally accepted in the United States of America; this includes the design, implementation, and maintenance of internal control relevant to the preparation and fair presentation of financial statements that are free from material misstatement, whether due to fraud or error.
Auditor’s Responsibility Our responsibility is to express opinions on these financial statements based on our audit. We conducted our audit in accordance with auditing standards generally accepted in the United States of America and the standards applicable to financial audits contained in Government Auditing Standards, issued by the Comptroller General of the United States. Those standards require that we plan and perform the audit to obtain reasonable assurance about whether the financial statements are free from material misstatement.
An audit involves performing procedures to obtain audit evidence about the amounts and disclosures in the financial statements. The procedures selected depend on the auditor’s judgment, including the assessment of the risks of material misstatement of the financial statements, whether due to fraud or error. In making those risk assessments, the auditor considers internal control relevant to the entity’s preparation and fair presentation of the financial statements in order to design audit procedures that are appropriate in the circumstances, but not for the purpose of expressing an opinion on the effectiveness of the entity’s internal control. Accordingly, we express no such opinion. An audit also includes evaluating the appropriateness of accounting policies used and the reasonableness of significant accounting estimates made by management, as well as evaluating the overall presentation of the financial statements.
We believe that the audit evidence we have obtained is sufficient and appropriate to provide a basis for our audit opinions.
OpinionsIn our opinion, the financial statements referred to above present fairly, in all material respects, the respective financial position of the governmental activities, the business-type activities, each major fund, and the aggregate remaining fund information of the City, as of September 30, 2013, and the respective changes in financial position, and, where applicable, cash flows thereof and the respective budgetary comparison for the General Fund, Fire/Rescue and North Lauderdale Water Control District Funds for the fiscal year then ended in accordance with accounting principles generally accepted in the United States of America.

2
Other Matters
Required Supplementary Information
Accounting principles generally accepted in the United States of America require that the management’s discussion and analysis and the schedules of funding progress and employers contributions be presented to supplement the basic financial statements. Such information, although not a part of the basic financial statements, is required by the Governmental Accounting Standards Board, who considers it to be an essential part of financial reporting for placing the basic financial statements in an appropriate operational, economic, or historical context. We have applied certain limited procedures to the required supplementary information in accordance with auditing standards generally accepted in the United States of America, which consisted of inquiries of management about the methods of preparing the information and comparing the information for consistency with management’s responses to our inquiries, the basic financial statements, and other knowledge we obtained during our audit of the basic financial statements. We do not express an opinion or provide any assurance on the information because the limited procedures do not provide us with sufficient evidence to express an opinion or provide any assurance.
Other Information
Our audit was conducted for the purpose of forming opinions on the financial statements that collectively comprise the City’s basic financial statements. The introductory section, combining and individual nonmajor fund financial statements, budgetary comparison schedules and statistical section, are presented for purposes of additional analysis and are not a required part of the basic financial statements. The schedule of expenditures of federal awards is presented for purposes of additional analysis as required by U.S. Office of Management and Budget Circular A-133, Audits of States, Local Governments, and Non-Profit Organizations, and is also not a required part of the basic financial statements.
The combining and individual nonmajor fund financial statements, the schedules of revenues, expenditures, and changes in fund balances-budget to actual special revenue funds-parks and recreation and debt service funds, and the schedule of expenditures of federal awards are the responsibility of management and were derived from and relate directly to the underlying accounting and other records used to prepare the basic financial statements. Such information has been subjected to the auditing procedures applied in the audit of the basic financial statements and certain additional procedures, including comparing and reconciling such information directly to the underlying accounting and other records used to prepare the basic financial statements or to the basic financial statements themselves, and other additional procedures in accordance with auditing standards generally accepted in the United States of America. In our opinion, the combining and individual nonmajor fund financial statements, the schedules of revenues, expenditures, and changes in fund balances-budget to actual special revenue funds-parks and recreation and debt service funds, and the schedule of expenditures of federal awards are fairly stated in all material respects in relation to the basic financial statements as a whole.
The introductory and statistical sections have not been subjected to the auditing procedures applied in the audit of the basic financial statements and, accordingly, we do not express an opinion or provide any assurance on them.
Other Reporting Required by Government Auditing Standards In accordance with Government Auditing Standards, we have also issued our report dated March 18, 2014, on our consideration of the City’s internal control over financial reporting and on our tests of its compliance with certain provisions of laws, regulations, contracts, grant agreements and other matters. The purpose of that report is to describe the scope of our testing of internal control over financial reporting and compliance and the results of that testing, and not to provide an opinion on internal control over financial reporting or on compliance. That report is an integral part of an audit performed in accordance with Government Auditing Standards in considering the City’s internal control over financial reporting and compliance.
March 18, 2014 �

3
Management’s Discussion and Analysis The purpose of financial reporting is to provide financial statements readers with information that will help them make decisions about the entity. The following narrative overview and analysis of the City of North Lauderdale’s (“City”) financial activities for the fiscal year ended September 30, 2013 has been prepared by City management for the readers’ benefit. We encourage readers to consider the information presented herein in conjunction with the Letter of Transmittal, which can be found on pages i through iii of this report.
Financial Highlights
� The assets of the City exceeded its liabilities at the close of the most recent fiscal year by $106,483,510 (net position). Of this amount, $59,057,605 is unrestricted and may be utilized to meet the City’s ongoing obligations to citizens and creditors.
� The City’s total net position increased by $5,634,316. The increase is primarily attributable to
various operational savings resulting from cost containment measures that the City’s Administration has been implementing over the last several years.
� At the close of the most recent fiscal year, the City’s governmental funds reported combined ending
fund balances of $38,771,163. Approximately $27,145,191 is unassigned General Fund balance and is available for spending at the City’s discretion. The City Commission has assigned $2,450,000 for emergencies, $750,000 for future capital projects, and $7,311 for scholarships.
� During the fiscal year the City’s total governmental activity debt (excluding compensated absences) had a net decrease from the prior year of ($508,875) or approximately (11%). This decrease was due to the payment of scheduled debt service for the 2003 Capital Improvement Refunding Bonds.
Overview of the Financial Statements This discussion and analysis are intended to serve as an introduction to the City’s basic financial statements. These financial statements are comprised of three components; 1) government-wide financial statements, 2) fund financial statements and 3) notes to the financial statements. This report also contains other supplementary information in addition to the basic financial statements themselves. Government-wide Financial Statements The government-wide financial statements are designed to provide readers with a broad overview of the City’s finances in a manner similar to a private-sector business. The statement of net position presents information on all of the City’s assets, liabilities, and deferred inflows/outflows of resources, with the difference reported as net position. Over time, increases or decreases in net position may serve as a useful indicator of whether the City’s financial position is improving or deteriorating. The statement of activities presents information showing how the City’s net position changed during the most recent fiscal year. All changes in net position are reported as soon as the underlying event giving rise to the change occurs, regardless of the timing of related cash flows. Thus, revenues and expenses are reported in this statement from some items that will only result in cash flows in future fiscal periods (e.g., uncollected taxes and earned but unused vacation leave).

4
Overview of the Financial Statements (Continued) Both government-wide financial statements distinguish functions of the City that are principally supported by taxes and intergovernmental revenues (governmental activities) from other functions that are intended to recover all or a significant portion of their costs through user fees and charges (business-type activities). The governmental activities of the City include general government, public safety, community development, physical environment, streets, parks and recreation, and interest. The business-type activities of the City include water and sewer utilities and storm-water management operations. The government-wide financial statements include not only the City itself (the primary government), but also the legally separate North Lauderdale Water Control District. Financial information for this component unit is blended with the financial information presented for the primary government itself, since the governing body of the District and that of the City’s are one in the same – the City Commission. The Housing Authority of the City of North Lauderdale, Inc. (“Authority”), a discretely presented component unit, had no balances or activity during the most recent fiscal year. Fund Financial Statements A fund is a grouping of related accounts that is used to maintain control over resources that have been segregated for specific activities or objectives. The City, like other state and local governments, uses fund accounting to ensure and demonstrate compliance with finance-related legal requirements. These financial statements report the City’s operations in greater detail than the government-wide financial statements. All of the City’s funds can be divided into three categories: governmental funds, proprietary funds and fiduciary funds.
Governmental funds are used to account for essentially the same functions reported as governmental activities in the government-wide financial statements. However, unlike the government-wide financial statements, governmental fund financial statements focus on near-term inflows and outflows of spendable resources, as well as on balances of spendable resources available at the end of the fiscal year. Such information may be useful in evaluating a government’s near-term financing requirement. Because the focus of governmental funds is narrower than the government-wide financial statements, it is useful to compare the information presented for governmental funds with similar information presented for governmental activities in the government-wide financial statements. By doing so, readers may better understand the long-term impact of the City’s near-term financing decisions. The governmental fund balance sheet and the governmental fund statement of revenues, expenditures and changes in fund balances provide a reconciliation to facilitate this comparison between governmental funds and governmental activities. The City maintains several individual governmental funds. Information is presented separately in the governmental fund balance sheet and in the governmental fund statement of revenues, expenditures and changes in fund balances for the major funds which include the General Fund, the Fire/Rescue Special Revenue Fund, the North Lauderdale Water Control District Special Revenue Fund, the Debt Service Fund and the Capital Projects Fund. Data from the other governmental funds are combined into a single, aggregated presentation. Individual fund data for each of these non-major governmental funds is provided in the form of combining statements presented immediately following the notes to the financial statements. The City prepares and adopts appropriated budgets for all of its governmental and proprietary fund types, except the Police Education Special Revenue Fund, the Law Enforcement Special Revenue Fund, the Grants Special Revenue Fund, and the Capital Projects Fund.
5
Overview of the Financial Statements (Continued) Fund Financial Statements
A budgetary comparison statement has been provided for the General Fund, the Fire/Rescue Special Revenue Fund and the North Lauderdale Water Control District Special Revenue Fund in the Fund Financial Statements section of this report. Additionally, a budgetary comparison schedule has been provided for the Recreation Special Projects Special Revenue Fund and the Debt Service Fund in the Combining and Individual Fund Statements and Schedules section of this report. These are presented to demonstrate compliance with the budget. They compare the actual amount to the budgeted amount as well as the original adopted budget to the final budget.
Proprietary funds provide the same type of information as the government-wide financial statements, only in more detail. The City maintains the following different types of proprietary funds:
� The Enterprise Funds are used to report the same functions presented as business-type activities in the government-wide financial statements. The City uses Enterprise Funds to account for its water and sewer utilities and storm-water management operations. The City’s proprietary fund financial statements provide separate information for the water and sewer utilities operation because it is considered to be a major fund.
� Internal Service Funds are an accounting device used to accumulate and allocate costs internally
among the City’s various functions. The City uses internal service funds to account for its vehicle maintenance, information technology and insurance operations. Because these services benefit both the governmental and business-type functions, they have been included within governmental activities and business-type activities in the government-wide financial statements based on the applicable usage. The three internal services funds are aggregated and combined into a single column for presentation in the proprietary fund financial statements. Individual fund data for the internal service funds is provided in the form of combining statements are presented immediately following the notes to the financial statements.
Fiduciary funds are used to account for resources held in a trust or as an agent by the City for others. Fiduciary funds are not reflected in the government-wide financial statements because the resources of those funds are not available to support the City’s own programs. The accounting used for fiduciary funds is much like that used for proprietary funds. The City only has one agency fund, the Police Explorer Agency Fund. The Notes to the Financial Statements provide additional information that is essential to a full understanding of the data provided in the government-wide and fund financial statements.
In addition to the basic financial statements and accompanying notes, this report also contains Other Information. The information includes certain required supplementary information. In addition, the combining statements referred to above are presented immediately following the required supplementary information.
Government-wide Financial Analysis
Net Position As noted earlier, over time, net position may serve as a useful indicator of a government’s financial position. At the close of the most recent fiscal year the City’s assets exceeded its liabilities by $106,483,510. The following table summarizes the City’s net position at September 30, 2013 and 2012 and is followed by a comparative analysis between the two years.

6
Government-wide Financial Analysis (Continued)
Net Position (Continued)
2013 2012 2013 2012 2013 2012
Current and other assets 46,210,710$ 44,423,893$ 21,993,519$ 18,798,645$ 68,204,229$ 63,222,538$ Capital assets 33,329,872 33,804,457 14,305,201 14,083,183 47,635,073 47,887,640
Total assets 79,540,582 78,228,350 36,298,720 32,881,828 115,839,302 111,110,178
Noncurrent liabilities 6,028,347 6,193,687 113,579 110,469 6,141,926 6,304,156 Other liabilities 1,536,498 1,928,741 1,677,368 2,028,087 3,213,866 3,956,828
Total liabilities 7,564,845 8,122,428 1,790,947 2,138,556 9,355,792 10,260,984
Net position:Net investment in capital assets 29,370,533 29,336,243 14,305,201 14,083,183 43,675,734 43,419,426 Restricted 3,750,171 3,607,006 - - 3,750,171 3,607,006 Unrestricted 38,855,033 37,162,673 20,202,572 16,660,089 59,057,605 53,822,762
Total net position 71,975,737$ 70,105,922$ 34,507,773$ 30,743,272$ 106,483,510$ 100,849,194$
City of North Lauderdale, FloridaNet Position
TotalBusiness-type
ActivitiesGovernmental
Activities
Of the City’s net position, approximately 41% reflects its investment in capital assets (e.g., land, buildings, equipment and infrastructure), net of accumulated depreciation and less any outstanding debt used to construct or acquire those assets. These capital assets are used to provide citizen services and are therefore not available for future spending. Although the City’s investment in its capital assets is reported net of related debt, the resources needed to repay this debt must be provided from other sources, since the capital assets themselves cannot be used to liquidate these liabilities. The restricted portion of the City’s net position, $3,750,171 or approximately 4% represents resources that are subject to external restrictions on how they may be used. The remaining balance of $59,057,605 or approximately 55% is unrestricted and may be used to meet the City’s ongoing obligations to citizens and creditors. As of the end of both the current and prior fiscal year, the City reported an increase in its unrestricted net position, both for the government as a whole, as well as for its separate governmental and business-type activities. For governmental activities, there was an increase in net position of $1,869,815 or approximately 3% from the prior fiscal year resulting primarily from various operational savings resulting from cost containment measures that the City’s Administration has been implementing over the last several years For business-type activities, there was an increase in net position of $3,764,501 or approximately 12% from the prior fiscal year resulting primarily from various operational savings resulting from cost containment measures that the City’s Administration has been implementing over the last several years.

7
Government-wide Financial Analysis (Continued) Net Position (Continued) Changes in Net Position The following table summarizes the City’s changes in net position for the fiscal years ended September 30, 2013 and 2012 and is followed by a comparative analysis between the two years.
Revenues: 2013 2012 2013 2012 2013 2012Program revenues:
Charges for services 12,923,236$ 11,405,275$ 12,056,579$ 12,395,192$ 24,979,815$ 23,800,467$ Operating grants and contributions 2,588,430 686,303 - - 2,588,430 686,303 Capital grants and contributions 62,421 116,124 600,388 - 662,809 116,124
General revenues:Property taxes 6,789,514 7,154,480 - - 6,789,514 7,154,480 Utility taxes 2,421,234 3,546,402 - - 2,421,234 3,546,402 Franchise taxes 2,373,523 2,509,174 - - 2,373,523 2,509,174 Grants and contributions not restricted to specific programs 4,067,481 4,174,950 - - 4,067,481 4,174,950 Interest income 22,325 205,817 2,110 115,816 24,435 321,633 Other 25,759 - - - 25,759 -
Total revenues 31,273,923 29,798,525 12,659,077 12,511,008 43,933,000 42,309,533
Expenses:General government 3,600,906 3,242,231 - - 3,600,906 3,242,231 Public safety 14,084,825 13,442,631 - - 14,084,825 13,442,631 Community development 2,163,929 1,918,200 - - 2,163,929 1,918,200 Physical environment 3,556,925 2,220,793 - - 3,556,925 2,220,793 Streets 1,784,419 1,711,434 - - 1,784,419 1,711,434 Parks and recreation 4,017,915 3,955,195 - - 4,017,915 3,955,195 Interest on debt 195,189 623,976 - - 195,189 623,976 Water and sewer - - 8,146,215 8,522,861 8,146,215 8,522,861 Stormwater - - 748,361 630,768 748,361 630,768
Total expenses 29,404,108 27,114,460 8,894,576 9,153,629 38,298,684 36,268,089 Change in net position 1,869,815 2,684,065 3,764,501 3,357,379 5,634,316 6,041,444 Net position, beginning 70,105,922 67,421,857 30,743,272 27,385,893 100,849,194 94,807,750 Net position, ending 71,975,737$ 70,105,922$ 34,507,773$ 30,743,272$ 106,483,510$ 100,849,194$
City of North Lauderdale, FloridaChanges in Net Position
TotalBusiness-type
ActivitiesGovernmental
Activities
Governmental Activities – Governmental activities increased the City’s net position by $1,869,815 representing approximately 33% of the total increase in the City’s net position. General revenues of the City exceeded program costs as the City continues to experience operational savings resulting from cost containment measures that the City’s Administration has been implementing over the last several years.

8
Government-wide Financial Analysis (Continued)
Changes in Net Position - Governmental Activities (Continued)
Charges for services38%
Operating grants and
contributions2%
Capital grants and
contributions 1%
Property taxes24%
Utility taxes8%
Franchise taxes8%
Grants and contributions not
restricted to specific programs
14%
Interest income and other revenues
1%
Revenues by SourceGovernmental Activities
Charges for services
Operating grants and contributions
Capital grants and contributions
Property taxes
Utility taxes
Franchise taxes
Grants and contributions not restricted tospecific programs
Interest income and other revenues
-
2,000,000
4,000,000
6,000,000
8,000,000
10,000,000
12,000,000
14,000,000
16,000,000
Generalgovernment
Public safety Communitydevelopment
Physicalenvironment
Streets Parks andrecreation
Interest
Expenses and Program RevenuesGovernmental Activities
Expenses Program Revenues
9
Government-wide Financial Analysis (Continued)
Changes in Net Position - (Continued)
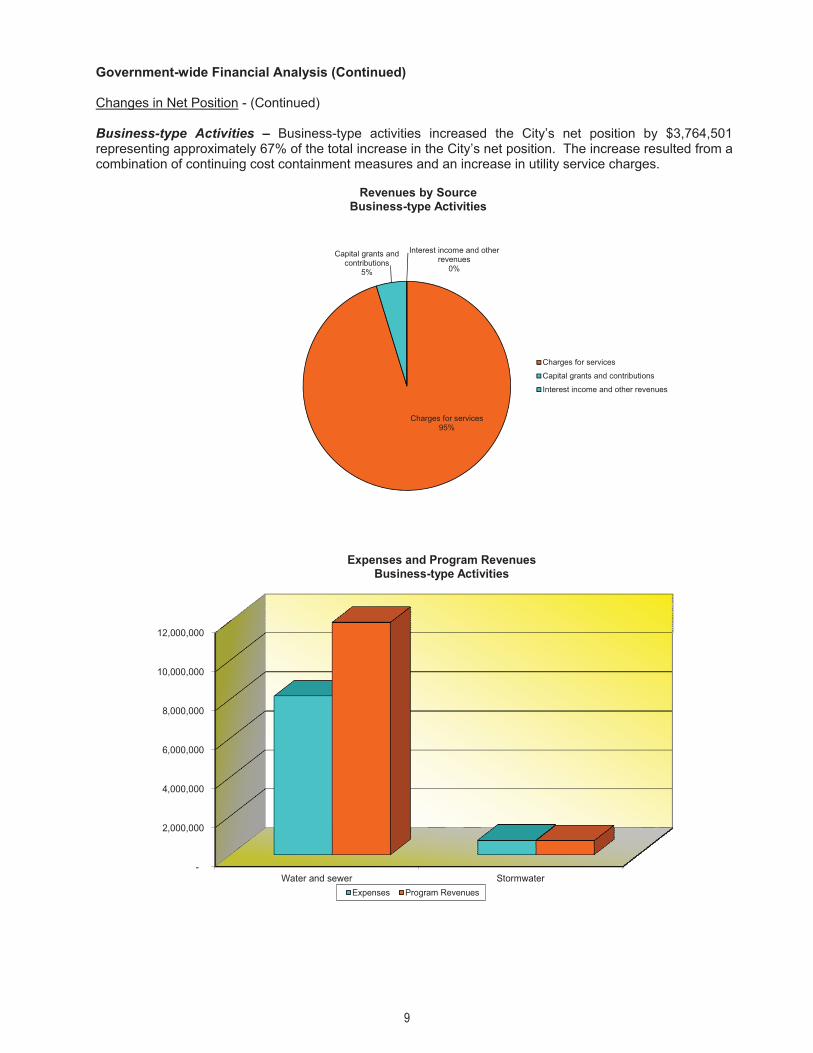
Business-type Activities – Business-type activities increased the City’s net position by $3,764,501 representing approximately 67% of the total increase in the City’s net position. The increase resulted from a combination of continuing cost containment measures and an increase in utility service charges.
Charges for services95%
Capital grants and contributions
5%
Interest income and other revenues
0%
Revenues by SourceBusiness-type Activities
Charges for services
Capital grants and contributions
Interest income and other revenues
-
2,000,000
4,000,000
6,000,000
8,000,000
10,000,000
12,000,000
Water and sewer Stormwater
Expenses and Program RevenuesBusiness-type Activities
Expenses Program Revenues

10
Financial Analysis of the Individual Major Funds As noted earlier, the City uses fund accounting to ensure and demonstrate compliance with finance-related legal requirements. Governmental Funds – The focus of the City’s governmental funds is to provide information on near-term inflows, outflows and balances of spendable resources. Such information is useful in assessing the City’s financing requirements. In particular, unreserved fund balance may serve as a useful measure of a government’s net resources available for spending at the end of the fiscal year. At the close of the most recent fiscal year, the City’s governmental funds reported combined ending fund balances of $38,771,163, an increase of $1,858,481 or approximately 5% from prior fiscal year. $27,145,191 of this total amount constitutes unassigned fund balance, which is available for spending at the City’s discretion. The remainder of fund balance is either restricted, committed, or assigned to indicate that it is 1) restricted for particular purposes, 2) committed for particular purposes, or 3) assigned for particulate purposes. The General Fund is the City’s main operating fund. At the end of the current fiscal year, the General Fund’s unassigned fund balance was $27,145,191 while the total fund balance reached $30,352,502. As a measure of the General Fund’s liquidity, it may be useful to compare both unreserved fund balance and total fund balance to total fund expenditures.
The fund balance of the City’s General Fund increased by $2,458,448 from the prior fiscal year resulting primarily from unanticipated revenue streams combined with various operational savings resulting from cost containment measures that the City’s Administration has been implementing over the last several years. The fund balance of the City’s Fire/Rescue Special Revenue Fund, a major fund, decreased by ($50,105) due to the spending of resources for public safety operating expenditures. The fund balance of the North Lauderdale Water Control District Special Revenue Fund, a major fund, increased by $122,303 due to the excess in revenue of special assessments for exempt properties which is funded by the General Fund and the containment of costs. The fund balance of the Debt Service Fund, a major fund, decreased by ($5,433) due to the use of resources for debt costs. The fund balance of the Capital Projects Fund, a major fund, decreased by ($668,452) due to the spending of resources for ongoing capital projects. Proprietary Funds – The City’s proprietary funds provide the same type of information found in the government-wide financial statements, but in more detail. At the close of the most recent fiscal year, unrestricted net position for the Utilities Fund and the Stormwater Fund totaled $17,841,202 (an increase of $3,461,355) and $1,919,653 (an increase of $40,055) respectively. Other factors concerning the finances of both of these funds have already been addressed in the discussion of the City’s business-type activities.
11
General Fund Budgetary Highlights For fiscal year 2013, the general fund budget was amended to increase revenues by $1,350,000 and increase expenditures by $1,350,000, excluding transfers. The budget was amended to provide for the recognition of solid waste assessment and services. The general fund 2013 budget was also amended for interdepartmental re-allocations to decrease general government and increase public safety by $16,000. Actual results were greater than the final amended budget, excluding transfers. These results can be attributed to the following:
� Unanticipated revenue streams including higher than anticipated building permit and code enforcement fines.
� Various operational savings resulting from cost containment measures that the City’s Administration has been implementing over the last several years. These cost containment measures range from freezing vacant positions, consolidating positions, reducing operational hours in various programs, agreeing to lease the school facility, utilizing conservative methods for utilities expenditures, and repairs and maintenance.
Capital Assets and Debt Administration
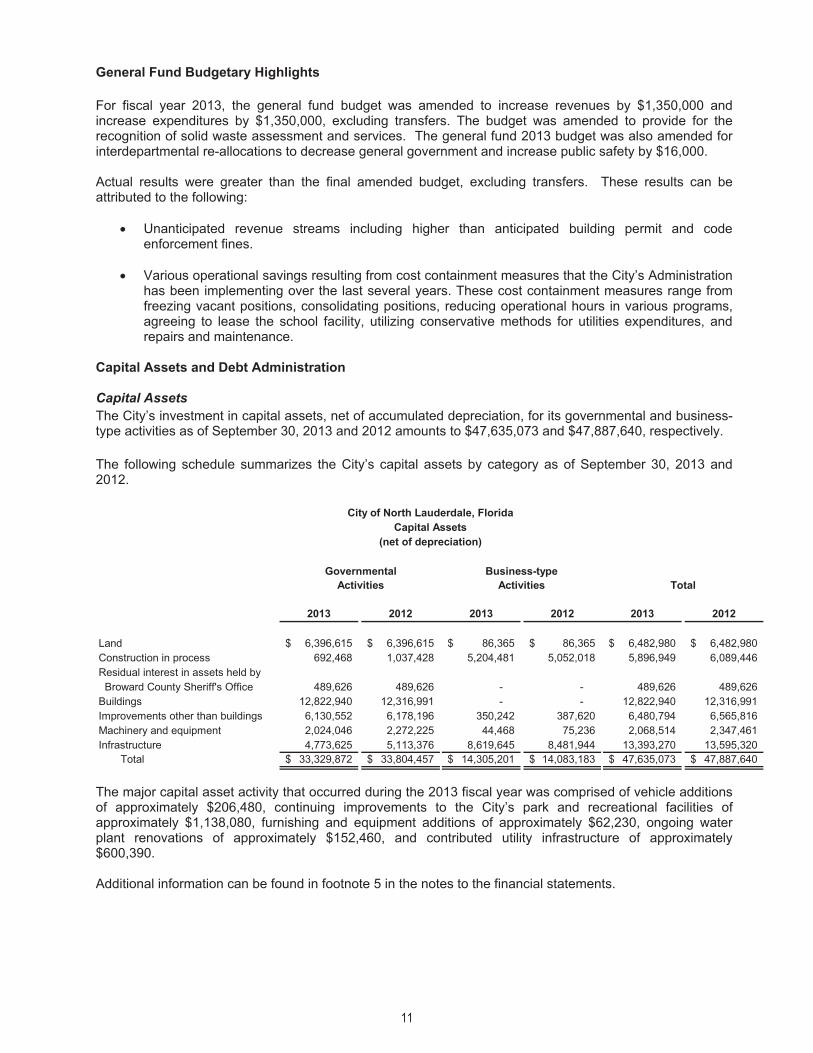
Capital Assets The City’s investment in capital assets, net of accumulated depreciation, for its governmental and business-type activities as of September 30, 2013 and 2012 amounts to $47,635,073 and $47,887,640, respectively.
The following schedule summarizes the City’s capital assets by category as of September 30, 2013 and 2012.
2013 2012 2013 2012 2013 2012
Land 6,396,615$ 6,396,615$ 86,365$ 86,365$ 6,482,980$ 6,482,980$ Construction in process 692,468 1,037,428 5,204,481 5,052,018 5,896,949 6,089,446 Residual interest in assets held by Broward County Sheriff's Office 489,626 489,626 - - 489,626 489,626 Buildings 12,822,940 12,316,991 - - 12,822,940 12,316,991 Improvements other than buildings 6,130,552 6,178,196 350,242 387,620 6,480,794 6,565,816 Machinery and equipment 2,024,046 2,272,225 44,468 75,236 2,068,514 2,347,461 Infrastructure 4,773,625 5,113,376 8,619,645 8,481,944 13,393,270 13,595,320
Total 33,329,872$ 33,804,457$ 14,305,201$ 14,083,183$ 47,635,073$ 47,887,640$
Governmental Activities
Business-type Activities
City of North Lauderdale, FloridaCapital Assets
(net of depreciation)
Total
The major capital asset activity that occurred during the 2013 fiscal year was comprised of vehicle additions of approximately $206,480, continuing improvements to the City’s park and recreational facilities of approximately $1,138,080, furnishing and equipment additions of approximately $62,230, ongoing water plant renovations of approximately $152,460, and contributed utility infrastructure of approximately $600,390. Additional information can be found in footnote 5 in the notes to the financial statements.

12
Capital Assets and Debt Administration (Continued)
Long-term Debt At September 30, 2013, the City had $3,959,339 in outstanding debt related to the 2003 Capital Improvement Revenue Refunding Bonds secured by specified revenue sources.
2013 2012 2013 2012 2013 2012
Refunding bonds 3,959,339$ 4,468,214$ -$ -$ 3,959,339$ 4,468,214$ Total 3,959,339$ 4,468,214$ -$ -$ 3,959,339$ 4,468,214$
Governmental Activities Total
City of North Lauderdale, FloridaLong-term Liabilities
Business-type Activities
The City’s debt decreased from the prior fiscal year by ($508,875) or approximately (11%). This decrease was due to the payment of scheduled debt service for the 2003 Bonds. Additional information can be found in footnote 8 in the notes to the financial statements. Economic Factors and Next Year’s Budget A large part of the City’s strategic planning and annual budget process involves Commission and staff workshops. During these workshops, the City’s past and current operations are reviewed in detail and discussions are held regarding the City’s future vision for operations including staffing, facilities and public services. In addition to the City’s operations, initiatives for major capital expenditures are discussed at length. Long range goals, economic factors, staffing implications and available financial resources assist the Commission in prioritizing their goals and objectives for the coming fiscal year. In developing the fiscal year 2014 Budget and Capital Improvement Program, the following economic factors were considered:
� Between 2009 and 2012 the City experienced a tremendous reduction in property value, the impact of which will continue to be felt throughout the City for some time. Additionally, due to the unstable financial market and the reduction in consumer spending, intergovernmental revenue (including sales tax allocations and shared revenue) and interest rates on investments have not increased. City Administration will continue its innovative and proactive fiscal practices that have enabled the City to weather the effects of the recession.
� The City’s operating millage rate will be 7.6078 mils and the debt millage rate is 0.000 mils.
� The City’s Solid Waste special assessment rate for residential units remained at $216.02 per year.
� In fiscal year 2011 the City’s Fire/Rescue Special Assessment program had a rate analysis conducted. The study’s resulting rate table is being implemented over a five-year-period beginning in fiscal year 2012 and continuing through fiscal year 2016. The assessment for the fiscal year 2014 is the third year of the five-year plan.
� The City would continue to pay cash (rather than finance) vehicles and certain capital projects
whenever feasible.
� A utility rate study was completed in fiscal year 2007 to ensure that the utility revenue keeps pace with the continually changing needs and costs of essential service. After performing a thorough analysis of the Utility Fund’s operational and capital requirements, the engineers recommended a 5% annual increase. Water and sewer utility rates were revised in March 2011 and have not been increased.

13
Requests for Information These financial statements are designed to provide citizens, taxpayers, customers, investors and creditors with a general overview of the City’s finances and to demonstrate the City’s accountability. If you should have any questions pertaining to the information presented in this report or would like additional information, please contact the Finance Department located at 701 SW 71st Avenue, North Lauderdale, Florida 33068-2395.

This page intentionally left blank.

14
City of North Lauderdale, Florida
Statement of Net Position September 30, 2013
Governmental Business-type Activities Activities Total
AssetsCash and equity in pooled cash 15,902,246$ 6,669,553$ 22,571,799$ Investments 27,005,375 12,865,914 39,871,289 Accounts receivable, net of allowances 3,293,325 1,355,278 4,648,603 Due from other governmental units 9,764 - 9,764 Restricted assets:
Cash, cash equivalents, and investments - 1,102,774 1,102,774 Capital assets not being depreciated:
Land 6,396,615 86,365 6,482,980 Construction in progress 692,468 5,204,481 5,896,949 Residual interest in equipment 489,626 - 489,626
Capital assets, net of accumulated depreciation:Buildings 12,822,940 - 12,822,940 Improvements other than buildings 6,130,552 350,242 6,480,794 Machinery and equipment 2,024,046 44,468 2,068,514 Infrastructure 4,773,625 8,619,645 13,393,270
Total assets 79,540,582 36,298,720 115,839,302
Liabilities and Net PositionLiabilities:
Accounts payable and other liabilities 1,153,459 564,830 1,718,289 Due to other governmental units - 9,764 9,764 Contracts payable 158,252 - 158,252 Accrued interest 86,198 - 86,198 Unearned revenue 138,589 - 138,589 Payable from restricted assets - 1,102,774 1,102,774
Noncurrent liabilities:Due within one year:
Compensated absences 62,360 - 62,360 Bonds payable 533,332 - 533,332
Due in more than one year:Compensated absences 1,212,648 113,579 1,326,227 Net Other Post Employment Benefit obligation 794,000 - 794,000 Bonds payable 3,426,007 - 3,426,007
Total liabilities 7,564,845 1,790,947 9,355,792
Net position:Net investment in capital assets 29,370,533 14,305,201 43,675,734 Restricted for:
Fire rescue 2,396,440 - 2,396,440 Water Control District 892,385 - 892,385 Police education 11,937 - 11,937 Law enforcement 303,063 - 303,063 Grants 146,346 - 146,346
Unrestricted 38,855,033 20,202,572 59,057,605 Total net position 71,975,737$ 34,507,773$ 106,483,510$
Primary Government
See Notes to Financial Statements

15
City of North Lauderdale, Florida
Statement of Activities Fiscal Year Ended September 30, 2013
Charges Operating Capitalfor Grants and Grants and
Function/Program Expenses Services Contributions ContributionsPrimary government: Governmental activities:
General government 3,600,906$ 6,752,084$ -$ -$ Public safety 14,084,825 4,233,652 59,291 - Community development 2,163,929 912,723 424,658 62,421 Physical environment 3,556,925 585,468 143 - Streets 1,784,419 - 2,104,338 - Parks and recreation 4,017,915 439,309 - - Interest 195,189 - - - Total government activities 29,404,108 12,923,236 2,588,430 62,421
Business-type activities:Water and sewer 8,146,215 11,333,236 - 600,388 Stormwater 748,361 723,343 - - Total business-type activities 8,894,576 12,056,579 - 600,388 Total primary government 38,298,684$ 24,979,815$ 2,588,430$ 662,809$
General revenues:Property taxesUtility taxesFranchise taxesGrants and contributions not restricted to specific programsInterest income Miscellaneous revenues
Total general revenues Change in net positionNet position, beginningNet position, ending
Program Revenues
See Notes to Financial Statements

16
Governmental Business-typeActivities Activities Total
3,151,178$ -$ 3,151,178$ (9,791,882) - (9,791,882)
(764,127) - (764,127) (2,971,314) - (2,971,314)
319,919 - 319,919 (3,578,606) - (3,578,606)
(195,189) - (195,189) (13,830,021) - (13,830,021)
- 3,787,409 3,787,409 - (25,018) (25,018) - 3,762,391 3,762,391
(13,830,021) 3,762,391 (10,067,630)
6,789,514 - 6,789,514 2,421,234 - 2,421,234 2,373,523 - 2,373,523
4,067,481 - 4,067,481 22,325 2,110 24,435 25,759 - 25,759
15,699,836 2,110 15,701,946 1,869,815 3,764,501 5,634,316
70,105,922 30,743,272 100,849,194 71,975,737$ 34,507,773$ 106,483,510$
Primary Government
Net (Expense) Revenue and Changes in Net Position

17
City of North Lauderdale, Florida
Balance Sheet Governmental Funds September 30, 2013
North Lauderdale
Water ControlGeneral Fire/Rescue District
Fund Fund FundAssetsCash and equity in pooled cash 10,899,864$ 199,987$ 819,724$ Investments 19,142,151 336,510 72,661Accounts receivable, net of allowances
for uncollectible accounts 1,144,947 1,973,504 - Due from other governmental units 9,764 - -
Total assets 31,196,726$ 2,510,001$ 892,385$
Liabilities and Fund BalancesLiabilities:
Accounts payable and other liabilities 705,635$ 113,561$ -$ Contracts payable - - - Unearned revenue 138,589 - -
Total liabilities 844,224 113,561 -
Fund balances:Restricted for:
Fire rescue - 2,396,440 - Water Control District - - 892,385 Police education - - - Law enforcement - - - Grants - - -
Committed for:Debt service - - -
Assigned to: Future capital projects 750,000 - - Capital projects - - - Contingencies 2,450,000 - - Scholarships 7,311 - -
Unassigned 27,145,191 - - Total fund balances 30,352,502 2,396,440 892,385 Total liabilities and fund balances 31,196,726$ 2,510,001$ 892,385$
Major Funds
See Notes to Financial Statements

18
Debt Capital Other TotalService Projects Nonmajor GovernmentalFund Fund Funds Funds
32,847$ 1,764,982$ 132,622$ 13,850,026$ 55,339 2,973,574 223,438 22,803,673
- - 174,874 3,293,325 - - - 9,764
88,186$ 4,738,556$ 530,934$ 39,956,788$
-$ -$ 69,588$ 888,784$ - 158,252 - 158,252 - - - 138,589 - 158,252 69,588 1,185,625
- - - 2,396,440 - - - 892,385 - - 11,937 11,937 - - 303,063 303,063 - - 146,346 146,346
88,186 - - 88,186
- - - 750,000 - 4,580,304 - 4,580,304 - - - 2,450,000 - - - 7,311 - - - 27,145,191
88,186 4,580,304 461,346 38,771,163 88,186$ 4,738,556$ 530,934$ 39,956,788$
Major Funds

19
City of North Lauderdale, Florida
Reconciliation of Governmental Funds Balance Sheet to the Statement of Net Position September 30, 2013
Total fund balance - governmental fund 38,771,163$
Amounts reported for governmental activities in the statement ofnet position are different because:
The cost of capital assets acquired is reported as an expenditurein the governmental funds. The statement of net position includes those capital assets, net of accumulated depreciation among the assets of the government as a whole.
Cost of capital assets 66,656,313 Accumulated depreciation (33,326,441) 33,329,872
Liabilities not payable from current available resources are notreported as fund liabilities in governmental fund financial statements. All liabilities, both current and long-term, are reported in the government-wide financial statements.
Accrued interest (86,198) Long-term liabilities (3,959,339) Compensated absences (1,250,747) (5,296,284)
Net Other Post Employment Benefit assets/obligations resultingfrom overfunding/underfunding are not reported in the funds as they are not payable from current available resources. (794,000)
Internal service funds are used by management to charge thecost of vehicle maintenance, information technology, andinsurance to individual funds. The assets and liabilities of theInternal Service Fund are included in governmental activitiesin the statement of net position. 5,964,986
Net position of governmental activities 71,975,737$
See Notes to Financial Statements

This page intentionally left blank.

20
City of North Lauderdale, Florida
Statement of Revenues, Expenditures, and Changes in Fund Balances Governmental Funds Fiscal Year Ended September 30, 2013
NorthLauderdale
Water ControlGeneral Fire/Rescue District
Fund Fund FundRevenues:
Taxes 10,364,850$ -$ -$ Franchise taxes 2,373,523 - - Licenses and permits 750,529 - - Intergovernmental 5,016,757 23,267 - Charges for services 3,371,437 862,845 - Special assessments 1,406,607 3,303,010 621,082 Fines and forfeitures 692,817 - - Interest income 16,099 1,108 1,521 Other revenues 1,475,613 1,436 2,112
Total revenues 25,468,232 4,191,666 624,715
Expenditures:Current:
General government 2,903,749 - - Public safety 8,534,548 5,339,928 - Community development 1,780,235 - - Physical environment 2,920,799 - 552,654Streets 998,102 - - Parks and recreation 3,408,809 - -
Capital outlay - - - Debt service:
Principal - - - Interest - - - Total expenditures 20,546,242 5,339,928 552,654 Excess (deficiency) of revenues over expenditures 4,921,990 (1,148,262) 72,061
Other financing sources (uses):Transfers in - 1,098,157 50,242Transfers out (2,463,542) - -
Total other financing sources (uses) (2,463,542) 1,098,157 50,242 Net change in fund balances 2,458,448 (50,105) 122,303
Fund balances, beginning 27,894,054 2,446,545 770,082
Fund balances, ending 30,352,502$ 2,396,440$ 892,385$
Major Funds
See Notes to Financial Statements

21
Debt Capital Other Total Service Projects Nonmajor GovernmentalFund Fund Funds Funds
960$ -$ -$ 10,365,810$ - - - 2,373,523 - - - 750,529 - - 546,511 5,586,535 - - 378,384 4,612,666 - - - 5,330,699 - - 44,529 737,346 24 1,669 121 20,542
- 15,000 - 1,494,161 984 16,669 969,545 31,271,811
6,417 - - 2,910,166 - - 71,727 13,946,203 - - 377,004 2,157,239 - - - 3,473,453 - - - 998,102 - - 450,178 3,858,987 - 1,285,121 68,916 1,354,037
508,875 - - 508,875 206,268 - - 206,268 721,560 1,285,121 967,825 29,413,330
(720,576) (1,268,452) 1,720 1,858,481
715,143 600,000 - 2,463,542 - - - (2,463,542)
715,143 600,000 - -
(5,433) (668,452) 1,720 1,858,481
93,619 5,248,756 459,626 36,912,682
88,186$ 4,580,304$ 461,346$ 38,771,163$
Major Funds

22
City of North Lauderdale, Florida
Reconciliation of the Statement of Revenues, Expenditures, and Changes in Fund Balances of Governmental Funds to the Statement of Activities Fiscal Year Ended September 30, 2013 Net change in fund balances - total governmental funds 1,858,481$
Amounts reported for governmental activities in the statement of activities are differentbecause:
Capital assets are reported in the governmental fund as expenditures. However, in the statement of activities, the cost of certain of those assets is eliminated and capitalized as capital assets. 1,397,022
Repayment of long-term liabilities are reported as expenditures in the governmental funds, but such repayments reduce liabilities in the statement of net position andare eliminated from the statement of activities. 508,875
Internal Service Funds are used by management to charge the costs of VehicleMaintenance, Information Technology, and Insurance to individual funds. The netrevenue of certain activities of Internal Service Funds is reported with governmentalactivities. 223,744
Any net increase or decrease in Internal Service Fund position associated with non-operating items should not be eliminated in the process of consolidation. Theseamounts would be added to the statement of activities. 2,110
Expenses reported in the statement of activities that do not require the use of currentfinancial resources are not reported as expenditures in the governmental funds. The details of the differences are as follows:
Change in accrued interest 11,080 Change in compensated absences (138,356) Change in Other Post Employment Benefit obligation (207,000) Depreciation of capital assets (1,786,141)
Change in net position of governmental activities 1,869,815$
See Notes to Financial Statements

This page intentionally left blank.

23
City of North Lauderdale, Florida
Statement of Revenues, Expenditures, and Changes in Fund Balances – Budget to Actual General Fund Fiscal Year Ended September 30, 2013
Variance withFinal Budget-
Actual PositiveOriginal Final Amounts (Negative)
Revenues:Property taxes 6,737,997$ 6,737,997$ 6,788,554$ 50,557$ Utility taxes 3,588,973 3,588,973 3,576,296 (12,677) Franchise taxes 2,688,478 2,688,478 2,373,523 (314,955) Licenses and permits 567,000 567,000 750,529 183,529 Intergovernmental 4,282,187 4,282,187 5,016,757 734,570 Charges for services 3,306,248 3,306,248 3,371,437 65,189 Special assessments - 1,350,000 1,406,607 56,607 Fines and forfeitures 445,000 445,000 692,817 247,817 Interest income 221,000 221,000 16,099 (204,901) Other revenues 698,048 698,048 1,475,613 777,565
Total revenues 22,534,931 23,884,931 25,468,232 1,583,301
Expenditures:General Government:
City commission 422,283 422,283 357,560 64,723 City manager 427,798 427,798 407,534 20,264 City attorney 278,585 278,585 274,417 4,168 City clerk 354,281 354,281 265,392 88,889 Human resources 419,737 419,737 285,564 134,173 Finance 914,405 914,405 825,421 88,984 Other 575,976 575,976 487,861 88,115 Contingency 267,152 251,152 - 251,152
Total general government 3,660,217 3,644,217 2,903,749 740,468
Public safety:BSO police contract 8,193,667 8,193,667 8,182,204 11,463 Crossing guard contract 325,000 341,000 352,344 (11,344)
Total public safety 8,518,667 8,534,667 8,534,548 119
Community development:Operating 1,291,930 1,291,930 1,270,585 21,345 Code compliance 576,483 576,483 509,650 66,833
Total community development 1,868,413 1,868,413 1,780,235 88,178
Public works:Physical environment:
Building maintenance 956,043 956,043 1,005,937 (49,894) Facility maintenance 10,000 10,000 146,993 (136,993) Canal maintenance 476,361 476,361 422,710 53,651 Solid waste and recycling - 1,350,000 1,345,159 4,841
Total physical environment 1,442,404 2,792,404 2,920,799 (128,395)
Budgeted Amounts
See Notes to Financial Statements

24
City of North Lauderdale, Florida
Statement of Revenues, Expenditures, and Changes in Fund Balances – Budget to Actual General Fund Fiscal Year Ended September 30, 2013 (Continued)
Variance withFinal Budget-
Actual PositiveOriginal Final Amounts (Negative)
Streets:Personnel services 386,184 386,184 397,008 (10,824) Other current expenditures 744,247 744,247 601,094 143,153
Total street maintenance 1,130,431 1,130,431 998,102 132,329 Total public works 2,572,835 3,922,835 3,918,901 3,934
Parks and recreation:Parks 2,202,099 2,202,099 2,231,968 (29,869) Recreation 844,431 844,431 789,061 55,370 Aquatics 404,727 404,727 387,780 16,947
Total parks and recreation 3,451,257 3,451,257 3,408,809 42,448
Total expenditures 20,071,389 21,421,389 20,546,242 875,147
Excess of revenues over expenditures 2,463,542 2,463,542 4,921,990 2,458,448
Other financing sources (uses):Transfers out (2,463,542) (2,463,542) (2,463,542) -
Total other financing sources (uses) (2,463,542) (2,463,542) (2,463,542) -
Net change in fund balance -$ -$ 2,458,448 2,458,448$
Fund balance, beginning 27,894,054
Fund balance, ending 30,352,502$
Budgeted Amounts
See Notes to Financial Statements
25
City of North Lauderdale, Florida
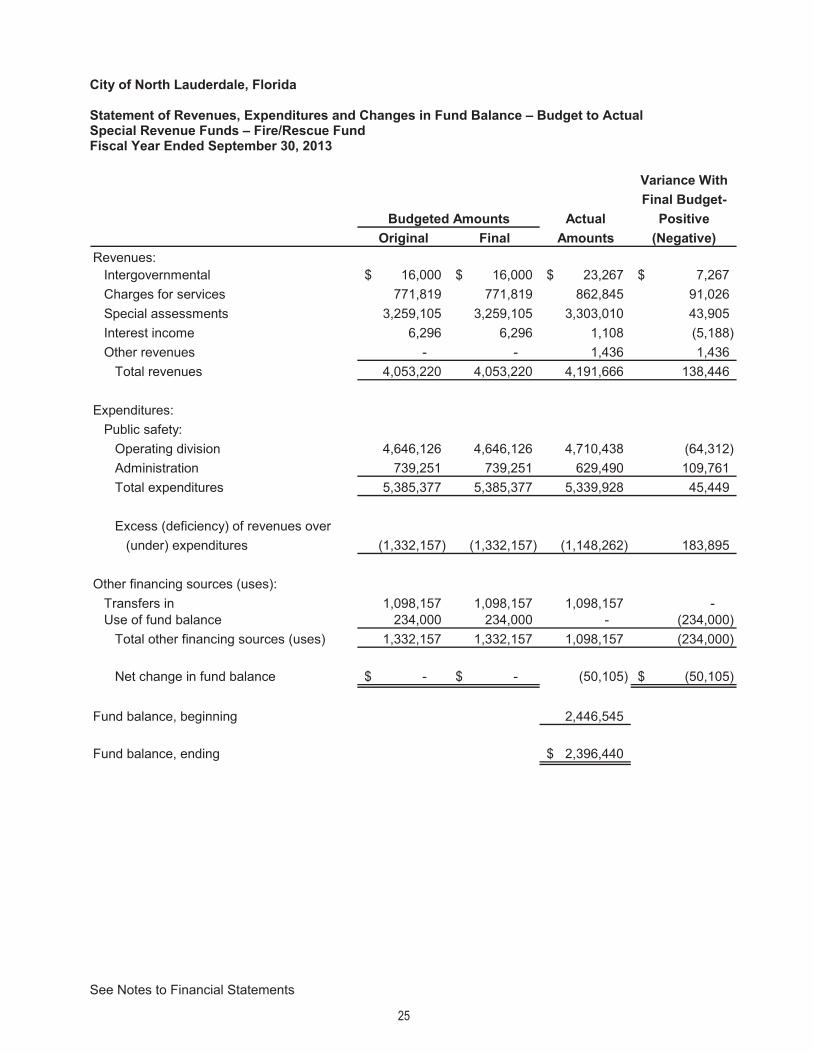
Statement of Revenues, Expenditures and Changes in Fund Balance – Budget to Actual Special Revenue Funds – Fire/Rescue Fund Fiscal Year Ended September 30, 2013
Variance WithFinal Budget-
Actual PositiveOriginal Final Amounts (Negative)
Revenues:Intergovernmental 16,000$ 16,000$ 23,267$ 7,267$ Charges for services 771,819 771,819 862,845 91,026 Special assessments 3,259,105 3,259,105 3,303,010 43,905 Interest income 6,296 6,296 1,108 (5,188) Other revenues - - 1,436 1,436
Total revenues 4,053,220 4,053,220 4,191,666 138,446
Expenditures:Public safety:
Operating division 4,646,126 4,646,126 4,710,438 (64,312) Administration 739,251 739,251 629,490 109,761 Total expenditures 5,385,377 5,385,377 5,339,928 45,449
Excess (deficiency) of revenues over(under) expenditures (1,332,157) (1,332,157) (1,148,262) 183,895
Other financing sources (uses):Transfers in 1,098,157 1,098,157 1,098,157 - Use of fund balance 234,000 234,000 - (234,000)
Total other financing sources (uses) 1,332,157 1,332,157 1,098,157 (234,000)
Net change in fund balance -$ -$ (50,105) (50,105)$
Fund balance, beginning 2,446,545
Fund balance, ending 2,396,440$
Budgeted Amounts
See Notes to Financial Statements

26
City of North Lauderdale, Florida
Statement of Revenues, Expenditures and Changes in Fund Balance – Budget to Actual Special Revenue Funds - North Lauderdale Water Control District Fund Fiscal Year Ended September 30, 2013
Variance withFinal Budget-
Actual PositiveOriginal Final Amounts (Negative)
Revenues:Special assessments 604,505$ 604,505$ 621,082$ 16,577$ Interest income 3,000 3,000 1,521 (1,479) Miscellaneous - - 2,112 2,112
Total revenues 607,505 607,505 624,715 17,210
Expenditures:Physical environment:
Contractual services 553,798 553,798 540,298 13,500 Administration fee - - 12,356 (12,356) Contingency 103,949 103,949 - 103,949
Total expenditures 657,747 657,747 552,654 105,093
Excess (deficiency) of revenues over (under) expenditures (50,242) (50,242) 72,061 122,303
Other financing sources (uses):Transfers in 50,242 50,242 50,242 -
Total other financing sources (uses) 50,242 50,242 50,242 -
Net change in fund balance -$ -$ 122,303 122,303$
Fund balance, beginning 770,082
Fund balance, ending 892,385$
Budgeted Amounts
See Notes to Financial Statements

27
City of North Lauderdale, Florida
Statement of Net Position Proprietary Fund September 30, 2013
Major Fund InternalUtilities Nonmajor Service
Fund Fund Total FundsAssetsCurrent Assets
Cash and equity in pooled cash 5,510,086$ 717,750$ 6,227,836$ 2,493,942$ Investments 11,656,675 1,209,239 12,865,914 4,201,702 Restricted cash, cash equivalents and investments Customer deposits 1,102,774 - 1,102,774 - Accounts receivable, net of allowances for uncollectible accounts 1,307,347 47,931 1,355,278 -
Total current assets 19,576,882 1,974,920 21,551,802 6,695,644 Capital Assets
Land 86,365 - 86,365 - Buildings 296,910 - 296,910 - Improvements 694,899 - 694,899 53,767 Machinery, equipment, furnishings and other 595,987 31,497 627,484 873,961 Infrastructure 19,521,715 2,986,744 22,508,459 - Construction in progress 5,204,481 - 5,204,481 -
Total capital assets 26,400,357 3,018,241 29,418,598 927,728 Less accumulated depreciation (12,854,430) (2,258,967) (15,113,397) (808,751)
Net capital assets 13,545,927 759,274 14,305,201 118,977 Total assets 33,122,809 2,734,194 35,857,003 6,814,621
LiabilitiesCurrent Liabilities Accounts payable and other liabilities 545,386 19,444 564,830 264,675 Due to other governmental units 9,764 - 9,764 - Accrued compensated absences - - - 19,337 Payable from restricted assets 1,102,774 - 1,102,774 -
Total current liabilities 1,657,924 19,444 1,677,368 284,012 Long-Term Liabilities
Accrued compensated absences 77,756 35,823 113,579 4,924 Total long-term liabilities 77,756 35,823 113,579 4,924 Total Liabilities 1,735,680 55,267 1,790,947 288,936
Net PositionNet investment in capital assets 13,545,927 759,274 14,305,201 118,977 Unrestricted 17,841,202 1,919,653 19,760,855 6,406,708
Total net position 31,387,129$ 2,678,927$ 34,066,056$ 6,525,685$
Enterprise FundsBusiness-type Activities -
See Notes to Financial Statements

28
City of North Lauderdale, Florida
Reconciliation of the Statement of Net Position - Proprietary Fund to the Statement of Net Position September 30, 2013
Total net position - Proprietary Fund Financial Statements 34,066,056$
Internal service funds are used by management to charge thecost of Vehicle Maintenance, Information Technology, andInsurance to individual funds. The portion attributable to business-type activities is reflected here and the residualassets and liabilities are included in governmental activitiesin the statement of net position. 441,717
Net position of business-type activities 34,507,773$
See Notes to Financial Statements

29
City of North Lauderdale, Florida
Statement of Revenues, Expenses and Changes in Net Position Proprietary Funds Fiscal Year Ended September 30, 2013
Major Fund InternalUtilities Nonmajor Service
Fund Fund Total FundsOperating revenues:
Charges for services:Water sales 5,434,953$ -$ 5,434,953$ -$ Sewer sales 5,898,283 - 5,898,283 - Other sales and services - 723,343 723,343 1,700,938
Total operating revenues 11,333,236 723,343 12,056,579 1,700,938
Operating expenses:Personnel 718,995 495,098 1,214,093 254,491 Other operating expenses 4,754,788 188,719 4,943,507 1,095,358 General and administrative 2,247,216 - 2,247,216 - Depreciation 463,323 67,510 530,833 86,273
Total operating expenses 8,184,322 751,327 8,935,649 1,436,122
Operating income / (loss) 3,148,914 (27,984) 3,120,930 264,816
Nonoperating revenues (expenses):Interest income 1,580 530 2,110 1,785 Miscellaneous revenue - - - 325
Total nonoperating revenues (expenses) 1,580 530 2,110 2,110
Income before contributions and transfers 3,150,494 (27,454) 3,123,040 266,926
Capital contributions 600,388 - 600,388 -
Change in net position 3,750,882 (27,454) 3,723,428 266,926
Total net position, beginning 27,636,247 2,706,381 30,342,628 6,258,759 Total net position, ending 31,387,129$ 2,678,927$ 34,066,056$ 6,525,685$
Business-type Activities -Enterprise Funds
See Notes to Financial Statements

30
City of North Lauderdale, Florida
Reconciliation of the Statement of Revenues, Expenses and Changes in Net Position Proprietary Funds to the Statement of Activities Fiscal Year Ended September 30, 2013
Change in net position - Proprietary Fund Financial Statements 3,723,428$
Internal Service Funds are used by management to charge the costs of VehicleMaintenance, Information Technology, and Insurance to individual funds. Theportion of the net revenue attributable to business-type activities is reflected here. 41,073
Change in net position of business-type activities 3,764,501$
See Notes to Financial Statements

31
City of North Lauderdale, Florida
Statement of Cash Flows Proprietary Funds Fiscal Year Ended September 30, 2013
Major Fund InternalUtilities Nonmajor Service
Fund Fund Total FundsCash Flows From Operating Activities
Receipts from customers and users 11,192,552$ 723,645$ 11,916,197$ 1,700,938$ Payments to suppliers (7,268,471) (177,764) (7,446,235) (990,872) Payments to employees (715,884) (495,099) (1,210,983) (256,312)
Net cash provided by operating activities 3,208,197 50,782 3,258,979 453,754
Cash Flows From Noncapital Financing ActivitiesMiscellaneous - - - 325
Net cash provided by (used in) noncapitaland related financing activities - - - 325
Cash Flows From Capital and Related FinancingActivities
Purchase of capital assets (152,463) - (152,463) (807) Net cash provided by (used in) capital
and related financing activities (152,463) - (152,463) (807)
Cash Flows From Investing ActivitiesSale of investments (9,715,149) (968,976) (10,684,125) (3,402,319) Purchase of investments 8,492,335 1,050,924 9,543,259 3,496,540 Interest received 1,580 530 2,110 1,785
Net cash provided by (used in) investing activities (1,221,234) 82,478 (1,138,756) 96,006
Net increase in cash and equityin pooled cash 1,834,500 133,260 1,967,760 549,278
Cash and equity in pooled cash, beginning 4,778,360 584,490 5,362,850 1,944,664
Cash and equity in pooled cash, ending 6,612,860$ 717,750$ 7,330,610$ 2,493,942$
Reconciliation to the statement of net position:Cash and equity in pooled cash 5,510,086$ 717,750$ 6,227,836$ 2,493,942$ Restricted assets, cash 1,102,774 - 1,102,774 -
6,612,860$ 717,750$ 7,330,610$ 2,493,942$
Business-type Activities -Enterprise Funds
See Notes to Financial Statements

32
City of North Lauderdale, Florida
Statement of Cash Flows Proprietary Funds Fiscal Year Ended September 30, 2013 (Continued)
Major Fund InternalUtilities Nonmajor Service
Fund Fund Total FundsReconciliation of Operating Income to Net
Cash Provided By Operating ActivitiesOperating income 3,148,914$ (27,984)$ 3,120,930$ 264,816$
Adjustments to reconcile operating income to net cash provided by operating activities: Depreciation 463,323 67,510 530,833 86,273
Changes in assets and liabilities:(Increase)/decrease in accounts receivable (45,483) 302 (45,181) - (Increase)/decrease in prepaid items - - - 135,430 (Decrease)/increase in accounts payable
and other liabilities (230,315) 10,954 (219,361) (30,944) (Decrease)/increase in retainage payable (45,915) - (45,915) - (Decrease)/increase in interfund payable 9,764 - 9,764 - (Decrease)/increase in compensated absences 3,110 - 3,110 (1,821) (Decrease)/increase in payables from
restricted assets (95,201) - (95,201) - Total adjustments 59,283 78,766 138,049 188,938 Net cash provided by (used in) operating activities 3,208,197$ 50,782$ 3,258,979$ 453,754$
Noncash investing, capital or financing items:Contribution of water and sewer improvements 600,388$ -$ -$
Business-type Activities -Enterprise Funds
See Notes to Financial Statements

33
City of North Lauderdale, Florida
Statement of Fiduciary Net Position Fiduciary Funds September 30, 2013
Police ExplorerAgency Fund
AssetsCash and equity in pooled cash 723$ Investments 1,214
Total assets 1,937$
LiabilitiesOther liabilities 1,937
Total liabilities 1,937$
See Notes to Financial Statements

34
CITY OF NORTH LAUDERDALE, FLORIDA NOTES TO FINANCIAL STATEMENTS
Note 1. Summary of Significant Accounting Policies The City of North Lauderdale, Florida (the “City”) was incorporated on July 15, 1963, under the provisions of Chapter 63-1675 Laws of Florida. The City operates under a commission/city manager form of government. The City provides the following full range of municipal services to its residents including: police and fire protection; street construction and maintenance; building, licensing and code compliance; parks and recreation facilities and activities; water, wastewater, canal maintenance, and stormwater services; public records and general administrative services. The Comprehensive Annual Financial Report (the “CAFR”) of the City includes all funds and component units. The financial statements of the City have been prepared to conform with accounting principles generally accepted in the United States of America (“GAAP”) as applicable to state and local governments. The Governmental Accounting Standards Board (“GASB”) is the accepted standard-setting body for establishing governmental accounting and financial reporting principles. Significant accounting and reporting policies and practices used by the City are described below. A. Reporting Entity The accompanying financial statements present the government and its component units, entities for which the government is considered to be financially accountable. Blended component units, although legally separate entities, are, in substance, part of the City’s operation. Each discretely presented component unit is reported in a separate column in the government-wide financial statements (see Note below for description) to emphasize that it is legally separate from the government. Blended component unit: The North Lauderdale Water Control District (the “District”) serves all the citizens of the City and is governed by a board comprised of the City’s elected five-member Commission. The rates for user charges and bond issuance authorizations, when applicable, are approved by the City Commission. The District is reported as a special revenue fund. Discretely presented component unit: The Housing Authority of the City of North Lauderdale, Inc. (the “Authority”) was created by the City in 1994 as a legally separate entity. Members of the Authority’s five member governing body are appointed by the City’s elected five-member Commission. Funding for the Authority is provided solely from the City’s General Fund. The Authority was formed to promote the increase of affordable standard housing within the City for persons of lower income. During fiscal year 2013, the Authority had no balances or activity. Accordingly, no financial statements are included in this document or available in any separate financial statements. B. Government-Wide and Fund Financial Statements
The basic financial statements include both government-wide (based on the City as a whole) and fund financial statements. The government-wide financial statements (i.e., the statement of net position and the statement of changes in net position) report information on all activities of the primary government and its component units, excluding fiduciary funds. For the most part, the effect of interfund activity, with the exception of those that are immaterial, has been eliminated from these statements. Interfund services provided and used are not eliminated in the process of consolidation. Governmental activities, which normally are supported by taxes and intergovernmental revenues, are reported separately from business-type activities, which rely to a significant extent on fees and charges for support. Likewise, the primary government is reported separately from certain legally separate component units for which the primary government is financially accountable.

CITY OF NORTH LAUDERDALE, FLORIDA NOTES TO FINANCIAL STATEMENTS
(Continued)
35
Note 1. Summary of Significant Accounting Policies (Continued) B. Government-Wide and Fund Financial Statements (Continued) The government-wide statement of activities demonstrates the degree to which the direct expenses of a given function or segment is offset by program revenues. Direct expenses are those that are clearly identifiable with a specific function or segment. Program revenues include: 1) charges to customers or applicants who purchase, use or directly benefit from goods, services or privileges provided by a given function or segment 2) grants and contributions that are restricted to meeting the operating requirements of a particular function or segment and 3) grants and contributions that are restricted to meeting capital requirements of a particular function or segment. Taxes and other items not included among program revenues are reported instead as general revenues. The net cost (by function or business-type activity) is normally covered by general revenue (property taxes, sales taxes, franchise taxes, intergovernmental revenues, interest income, etc.). The City applies eligible expenses against available restricted resources before the use of unrestricted resources. Separate fund based financial statements are provided for governmental funds, proprietary funds and fiduciary funds. Major individual governmental funds and major individual enterprise funds are reported as separate columns in the fund financial statements. GASB Statement No. 34 sets forth minimum criteria (percentage of assets, liabilities, revenues or expenditures/expenses of either fund category for the governmental and enterprise combined or funds that management deems major) for the determination of major funds. The nonmajor funds are combined in a column in the fund financial statements. The nonmajor funds are detailed in the combining section of the statements. Internal service funds, which traditionally provide services primarily to other funds of the government, are presented in the summary form as part of the proprietary fund financial statements. Because the principal users of the internal services are the City’s governmental activities, financial statements of internal service funds are consolidated into the governmental activities and business type activities columns when presented at the government-wide level. To the extent possible, the cost of these services is reflected in the appropriate functional activity, (e.g., General Government, Public Safety, etc.). The City’s fiduciary fund is presented in the fund financial statements by type. Since by definition these assets are being held for the benefit of a third party (other local governments, individuals, pension participants, etc.) and cannot be used to address activities or obligations of the government, these funds are not incorporated into the government-wide financial statements. The City has one agency fund. The government-wide focus is more on the sustainability of the City as an entity and the change in aggregate financial position resulting from the activities of the fiscal period. The focus of the fund financial statements is on the major individual funds of the governmental and business-type categories, (by category) and the component units. Each presentation provides valuable information that can be analyzed and compared to enhance the usefulness of the information. The following major governmental funds are used by the City: General Fund – This fund is used to account for all financial transactions, except those required to be accounted for and reported in another fund. Revenue is derived primarily from property taxes, utility taxes, franchise taxes, state and federal distributions and other governmental revenue. Fire/Rescue Fund – This fund is used to account for revenues and expenditures related to the operation of the City’s fire/rescue services. These services are funded primarily through a combination of non-ad valorem special assessment revenue and transfers from the City’s General Fund.

CITY OF NORTH LAUDERDALE, FLORIDA NOTES TO FINANCIAL STATEMENTS
(Continued)
36
Note 1. Summary of Significant Accounting Policies (Continued) B. Government-Wide and Fund Financial Statements (Continued)
North Lauderdale Water Control District Fund – This fund is used to account for the construction and maintenance of roads and canals that provide and control surface water flow within the District’s boundaries. When House Bill 1875 became law on May 30, 1997, the City’s five Commissioners became the District’s Board of Supervisors. Accordingly, the District became a Dependent Special District, as defined in Florida Statutes 189 and a blended component unit of the City. Debt Service Fund – This fund is used to account for and report financial resources that are restricted, committed, or assigned to expenditure for principal and interest on all City debt other than proprietary debt. Capital Projects Fund – This fund is used to account for the acquisition and construction of major capital facilities other than those financed by proprietary funds and trust funds. Other Governmental Funds – These funds are a summarization of all of the nonmajor governmental funds. The following major proprietary fund is used by the City: Utilities Fund – This fund is used to account for the income and expenses of operating the City’s water and sewer utilities system. Receipts are restricted by bond indenture and may only be used for costs associated with operating the water and sewer system and for debt service on its bonds so that system revenues meet or exceed system expenses. Other Proprietary Funds – The nonmajor proprietary fund is the Stormwater Management Fund. Additionally, the government reports the following fund types: Internal Service Funds – These funds are used to account for the financing of goods or services provided by one department or agency to other departments or agencies of the City, on a cost reimbursement basis. The City operates three internal service funds: the Vehicle Maintenance Fund, the Information Technology Fund and the Insurance Fund. Fiduciary Fund – This fund is used to account for assets held in a trust or as an agent by the City for others. The City operates an agency fund for the Police Explorer Program. C. Measurement Focus and Basis of Accounting Basis of accounting refers to when revenues, expenditures or expenses are recognized in the accounts and reported in the financial statements. Basis of accounting relates to the timing of the measurements made, regardless of the measurement focus applied. The government-wide financial statements are reported using the economic resources measurement focus and the accrual basis of accounting, as are the proprietary funds financial statements. Agency Funds are reported using the accrual basis of accounting. However, they report only assets and liabilities and as such, do not have a measurement focus. Revenues are recorded when earned and expenses are recorded when a liability is incurred, regardless of the timing of related cash flows. Property taxes are recognized as revenues in the year when an enforceable lien exists and when levied. Grants and similar items are recognized as revenues as soon as all eligibility requirements imposed by the provider have been met.

CITY OF NORTH LAUDERDALE, FLORIDA NOTES TO FINANCIAL STATEMENTS
(Continued)
37
Note 1. Summary of Significant Accounting Policies (Continued) C. Measurement Focus and Basis of Accounting (Continued) Governmental fund financial statements are reported using the current financial resources measurement focus and the modified accrual basis of accounting. Revenues are recognized as soon as they are both measurable and available. Revenues are considered to be available when they are collectible within the current period or soon enough thereafter to pay liabilities of the current period. For this purpose, the government considers revenues to be available if they are collected within 60 days of the end of the current fiscal period. Expenditures generally are recorded when a liability is incurred. However, debt service expenditures, as well as expenditures related to compensated absences and claims and judgments, are recorded only when paid from expendable available financial resources. Property taxes, franchise taxes, licenses and interest associated with the current fiscal period are all considered to be susceptible to accrual and have been recognized as revenues of the current fiscal period. Revenue received in advance of fiscal year to which they apply is presented as unearned on the balance sheet. Licenses and permits, charges for services, fines and forfeitures, contributions and miscellaneous revenues are considered measurable and available when cash is received by the government. Investment earnings are recorded as earned since they are measurable and available. Proprietary fund-type operating statements present increases (e.g., revenues) and decreases (e.g., expenses) in net total position. Proprietary funds distinguish operating revenues and expenses from nonoperating items. Operating revenues and expenses generally result from providing services and producing and delivering goods in connection with a proprietary fund’s principal ongoing operations. The principal operating revenues of the City’s Utilities and Stormwater Management Funds are charges to customers for sales and services. Operating expenses for the enterprise funds and internal services funds include the cost of sales and services, administrative expenses and depreciation on capital assets. All revenues and expenses not meeting this definition are reported as nonoperating revenues and expenses. The private sector standards of accounting and financial reporting issued prior to December 1, 1989, generally are followed in both the government-wide and proprietary fund financial statements to the extent that those standards do not conflict with or contradict guidance of GASB. Governments also have the option of following subsequent private sector guidance for their business-type activities and enterprise funds, subject to the same limitation. The government has elected not to follow subsequent private sector guidance. D. New Accounting Standards Adopted During fiscal year 2013, the City adopted three new accounting standards as follows: GASB Statement No. 61, The Financial Reporting Entity: Omnibus This Statement modifies certain requirements for inclusion of component units in the financial reporting entity. This Statement also amends the criteria for reporting component units as if they were part of the primary government (that is, blending) in certain circumstances. This Statement also clarifies the reporting of equity interests in legally separate organizations. GASB Statement No. 62, Codification of Accounting and Financial Reporting Guidance Contained in Pre-November 30, 1989 FASB and AICPA Pronouncements
This Statement incorporates into the GASB’s authoritative literature certain guidance that previously could only be found in certain FASB and AICPA pronouncements issued on or before November 30, 1989 and eliminates the selection to apply post-November 30, 1989 FASB pronouncements that do not conflict with or contradict GASB pronouncements.

CITY OF NORTH LAUDERDALE, FLORIDA NOTES TO FINANCIAL STATEMENTS
(Continued)
38
Note 1. Summary of Significant Accounting Policies (Continued) D. New Accounting Standards Adopted (Continued) GASB Statement No. 63, Financial Reporting of Deferred Outflows of Resources, Deferred Inflows of Resources, and Net Position
This Statement provides financial reporting guidance for deferred outflows of resources and deferred inflows of resources and identifies net position as the residual of all other elements presented in a statement of financial position. This Statement amends the net asset reporting requirements by incorporating deferred outflows of resources and deferred inflows of resources (previously reported as assets and liabilities) into the definitions of the required components of the residual measure and by renaming that measure as net position, rather than net assets. E. Cash, Equity in Pooled Cash and Investments The City’s cash and cash equivalents are considered to be cash on hand and demand deposits. Cash of individual funds, except for those funds or accounts that must be segregated for legal or other reasons, is combined to form a pool of cash. Interest earned as a result of pooling is distributed to the appropriate fund based on the average pooled cash balance of each fund during the period. The balances for “cash” reflected in the financial statements of each individual fund represent that fund’s allocated share of the pooled cash account. In addition, cash overdrafts of individual funds, which represent loans to other funds, have been reclassified as interfund payables/receivables for financial statement purposes. The City adopted an investment policy to establish guidelines for the efficient management of its cash reserves. Section VII of the investment policy identifies permitted instruments as follows:
a) The Florida Local Government Surplus Trust Funds (administered by the State Board of Administration);
b) Direct obligations of the U.S. Government and obligations guaranteed by the U.S. Government, and securities guaranteed by a federally sponsored corporation that is backed by the U.S. Treasury;
c) Certificates of deposit or savings accounts in state-certified qualified public depositories; d) Commercial paper or bankers acceptances of any United States Company that is rated at least “P-
1” by Moody’s or “A-1” by Standard & Poor’s rating agency; e) Money market funds registered with the Securities and Exchange Commission; f) Repurchase agreements with 102% collateralization.
The City records all interest revenue related to investment activities in the respective funds and reports investments at fair value. F. Inventories and Prepaid Amounts Inventories of governmental funds are recorded as expenditure when consumed rather than when purchased. Expenditures for insurance and other administrative expenses extending over more than one accounting period are accounted for as prepaid expenses and allocated between accounting periods.

CITY OF NORTH LAUDERDALE, FLORIDA NOTES TO FINANCIAL STATEMENTS
(Continued)
39
Note 1. Summary of Significant Accounting Policies (Continued)
G. Capital Assets Government-Wide and Proprietary Funds: Capital assets purchased or acquired are carried at historical cost or estimated historical cost. Contributed capital assets are recorded at estimated fair value at the time received. Public domain (infrastructure) capital assets consisting of roads, sidewalks, signage, lighting systems, curbs, water mains and lines, canals, sewer lines and drainage systems have been recorded at estimated historical cost. Capital assets are defined by the government as assets with an initial, individual cost of more than $5,000 and an estimated useful life in excess of one year. Major outlays for capital assets and improvements are capitalized as projects are constructed. Interest incurred during the construction phase of capital assets of business-type activities is included as part of the capitalized value of the assets constructed. Capital assets of the primary government, as well as the component units, are depreciated using the straight-line method over the following estimated useful lives:
YearsBuildings 50Improvements other than buildings 20 - 40Equipment 4 - 10Drainage improvements/canals 50 - 75Streets/roads/curbs 25 - 50Water/sewer lines/mains/plant 50System infrastructure 20 - 50
Governmental funds: Amounts incurred for the acquisition of capital assets are reported as fund expenditures. Depreciation expense is not reported within the fund financial statements. H. Unearned Revenue Governmental funds report revenue recognition in connection with resources that have been received, but not yet earned. I. Compensated Absences Employees are granted compensated absence pay for vacation leave in varying amounts based on length of service. Vacation leave is accrued as a liability when benefits are earned by the employees, that is, the employees have rendered services that give rise to the liability and it is probable that the City will compensate the employees, now or upon termination or retirement. Sick leave is accrued as a liability to the extent it is probable that the benefits will result in termination payments, rather than be taken as absences due to illness or other contingencies, and is based on length of service and date of hire. Compensated absences are accrued when incurred in the government-wide and proprietary fund financial statements. A liability for these amounts is reported in the governmental funds only if they have matured. For the governmental funds, compensated absences are liquidated by the fund in which employees are compensated.

CITY OF NORTH LAUDERDALE, FLORIDA NOTES TO FINANCIAL STATEMENTS
(Continued)
40
Note 1. Summary of Significant Accounting Policies (Continued)
J. Long-Term Obligations In the government-wide financial statements, long-term debt and other long-term obligations are reported as liabilities in the statement of net position. Bond premiums and discounts are deferred and amortized ratably over the life of the Bonds. Bonds payable are reported net of applicable premiums or discounts. Bond issuance costs are expensed when incurred. In the fund financial statements, governmental fund types recognize premiums and discounts, as well as bond issuance costs, during the current period. The face amount of debt issued is reported as other financing sources. Premiums received on debt issuances are reported as other financing sources while discounts on debt issuances are reported as other financing uses. Issuance costs, whether or not withheld from the actual debt proceeds received, are reported as debt service expenditures. K. Deferred Outflows/Inflows of Resources The statement of net position reports, as applicable, a separate section for deferred outflows of resources. Deferred outflows of resources represent a consumption of net position that applies to future reporting period(s) and so will not be recognized as an outflow of resources (expense/expenditure) until that time. The statement of net position reports, as applicable, a separate section for deferred inflows of resources. Deferred inflows of resources represent an acquisition of net position that applies to future reporting period(s) and so will not be recognized as an inflow of resources (revenue) until that time. L. Fund Equity/Net Position In the fund financial statements, governmental funds report fund balances according to the following classifications:
Non-spendable fund balance – Amounts that are (a) not in spendable form or (b) legally or contractually required to be maintained intact. Examples of nonspendable fund balance include inventories, prepaid amounts, and the corpus (or principal) of a permanent fund. The City has classified prepaid items as nonspendable. Restricted fund balance – Amounts that can be spent only for specific purposes stipulated by external resource providers such as grantors, contributors, or laws and regulations. Committed fund balance – Amounts that can be used only for the specific purposes determined by a formal action (resolution or ordinance) of the City’s highest level of decision-making authority (City Commission). Commitments may be changed or lifted only by the City Commission taking the same formal action that imposed the constraint originally. Assigned fund balance – Amounts intended to be used for specific purposes that are neither considered restricted nor committed. Assignments of fund balance may be made by management based upon the direction of the City Commission annually through the budget process. Unassigned fund balance – Amount of remaining fund balance within the general fund that has not been assigned to other funds and that has not been restricted, committed, or assigned to specific purposes. Unassigned fund balance may also include negative balances for any governmental fund if expenditures exceed amounts restricted, committed, or assigned for those specific purposes.
The City first uses committed fund balance, followed by assigned fund balance and then unassigned fund balance when expenditures are incurred for purposes for which amounts in any of the unrestricted fund balance classifications could be used.

CITY OF NORTH LAUDERDALE, FLORIDA NOTES TO FINANCIAL STATEMENTS
(Continued)
41
Note 1. Summary of Significant Accounting Policies (Continued)
L. Fund Equity/Net Position (Continued)
Net position is the difference between assets and deferred outflows of resources less liabilities and deferred inflows of resources. Net position in the government-wide financial statements are categorized as net investment in capital assets, restricted or unrestricted. Net investment in capital assets represents net position related to infrastructure and property, plant and equipment. Restricted net position represents the assets restricted by the City’s Bond covenants or other contractual restrictions. Unrestricted net position consists of the net position not meeting the definition of either of the other two components. M. Property Tax Revenue Recognition Ad valorem taxes are based on the assessed values, determined by the Broward County Property Appraiser, as of January 1 of each year. Property taxes are levied on October 1 of each year and due as of November 1 (lien date) of each year. Broward County collects the taxes and remits the funds to the City, less a collection fee. Taxes may be paid upon receipt of such notice by Broward County, with a discount rate of four percent (4%) if paid in November, three percent (3%) if paid in December, two percent (2%) if paid in January, and one percent (1%) if paid in February. Revenue is recognized at the time monies are received from the County. At September 30 unpaid delinquent taxes are recorded as receivable and include an applicable allowance for estimated uncollectible accounts. The combined millage rate levied by the City for the fiscal year ended September 30, 2013 was 7.6078. N. Use of Estimates The preparation of financial statements in conformity with accounting principles generally accepted in the United States requires management to make estimates and assumptions that affect the reported amounts of assets and liabilities, and disclosure of contingent assets and liabilities at the date of the financial statements, and the reported amounts of revenues and expenditures during the reporting period. Actual results could differ from those estimates. Note 2. Budget Information The City prepares and adopts appropriated budgets for all of its governmental and proprietary fund types, except the Police Education, the Law Enforcement and the Grants Special Revenue Funds, and the Capital Projects Fund. Budgets are monitored at the activity level within each department; however, the legal level of budgetary control is at the department level. The City Manager has the authority to transfer amounts within department functions, however, only the City Commission can legally transfer amounts between departments and amend the original adopted budget. Annual budgets are legally adopted on a basis consistent with GAAP, except for compensated absences in the governmental funds and principal payments in the proprietary funds. Compensated absence liabilities expected to be liquidated with expendable available resources are accrued as earned as opposed to being expended when paid. Principal payments on long-term debt within the proprietary funds are applied to outstanding liabilities in the financial statement as opposed to being expended on a budgetary basis. The City established the following budgetary procedures reflected in the financial statements:
Not later than 75 days before the end of each fiscal year, the City Manager submits to the City Commission a proposed operating budget for the fiscal year commencing on October 1. The budget proposal is made available for inspection in the Office of the City Clerk for a period of at least ten days preceding the proposal of an ordinance adopting the budget. Additionally the adopted budget is made available to the public on the City’s website.

CITY OF NORTH LAUDERDALE, FLORIDA NOTES TO FINANCIAL STATEMENTS
(Continued)
42
Note 2. Budget Information (Continued)
Prior to October 1, the budget is legally enacted through passage of an ordinance.
Encumbrance accounting, under which purchase orders and other commitments for the expenditure of funds are recorded in order to reserve that portion of the applicable appropriation, is employed as an extension of formal budget integration in all funds. Unexpended appropriations lapse at year-end; however, unexpended capital appropriations are simultaneously added to and re-appropriated in the subsequent year’s approved budget. Note 3. Deposits and Investments Deposits: Deposits consist of interest and noninterest-bearing demand accounts. All of the City’s deposits are entirely insured by federal depository insurance or collateralized by the multiple financial institution collateral pool pursuant to Florida Statutes, Chapter 280, Florida Security for Public Deposits Act. Under the Act, all qualified public depositories are required to pledge eligible collateral having a market value equal to or greater than the average daily or monthly balance of all public deposits, times the depository’s collateral pledging level. Investments: The City’s investments were held as follows at September 30, 2013:
Maturities Fair Value Credit RiskWells Fargo Advantage 100% Treasury Money Market Fund
Weighted average of the fund portfolio: 53 days 1,190,300$ S&P AAAm
Federal Home Loan Bank June 27, 2017 1,964,786 Moody's AAA
Federal Farm Credit Bank June 18, 2015 2,049,260 Moody's AAA
Federal Farm Credit Bank September 19, 2016 1,914,012 Moody's AAA
Federal Farm Credit Bank December 19, 2016 1,981,344 Moody's AAA
Federal Farm Credit Bank March 13, 2017 990,206 Moody's AAA
Federal Home Loan Mortgage Corporation July 30, 2014 3,021,669 Moody's AAA
Federal Home Loan Mortgage Corporation September 22, 2014 3,017,022 Moody's AAA
Federal Home Loan Mortgage Corporation September 4, 2015 1,000,417 Moody's AAA
Federal Home Loan Mortgage Corporation January 13, 2017 3,006,372 Moody's AAA
Federal Home Loan Mortgage Corporation September 29, 2017 991,501 Moody's AAA
Federal Home Loan Mortgage Corporation January 16, 2018 2,459,748 Moody's AAA
Federal National Mortgage Association February 27, 2015 3,005,418 Moody's AAA
Federal National Mortgage Association March 28, 2016 997,547 Moody's AAA
Federal National Mortgage Association April 29, 2016 994,958 Moody's AAA
Federal National Mortgage Association September 28, 2016 1,014,515 Moody's AAA
Federal National Mortgage Association February 8, 2018 1,466,462 Moody's AAA
Federal National Mortgage Association March 28, 2018 979,787 Moody's AAA
United States Treasury Notes December 15, 2014 2,002,188 Moody's AAA
United States Treasury Notes December 15, 2015 2,492,773 Moody's AAAInvestment in Local Government Surplus Funds Trust Fund (Florida PRIME)
Weighted average of the fund portfolio: 44 days 3,090,136 S&P AAAm
Investment in Fund B Surplus Funds Trust Fund Weighted average life of the fund: 4.04 years 242,082 Not rated
39,872,503

CITY OF NORTH LAUDERDALE, FLORIDA NOTES TO FINANCIAL STATEMENTS
(Continued)
43
Note 3. Deposits and Investments (Continued)
Investments (Continued):The State Board of Administration’s Local Government Surplus Funds Trust Fund Investment Pool (“Pool”) was restructured on December 4, 2007 into two separate pools. Pool A consisted of all money market appropriate assets, which was approximately 86% of Pool assets. Pool B consisted of assets that have either defaulted on a payment, paid more slowly than expected, and/or had any significant credit and liquidity risk, which was approximately 14% of Pool assets. At the time of the restructuring, all current pool participants had their existing balances proportionately allocated into Pool A and Pool B and certain restrictions were implemented. On December 21, 2007, Standard and Poor's Ratings Services assigned its "AAAm" principal stability fund rating to Pool Fund A. Pool Fund B is not rated by any nationally recognized statistical rating agency. Pool A has been subsequently renamed as Florida PRIME and Pool B has subsequently been renamed as Fund B Surplus Funds Trust Fund (“Fund B”). There are two options for accounting and reporting for money market investment pools either “2a-7 like” or fluctuating net asset value (“NAV”). “2a-7 like” pool is an external investment pool that is not registered with the Securities and Exchange Commission (“SEC”) as an investment company, but nevertheless has a policy that it will, and does, operate in a manner consistent with the SEC’s Rule 2a-7 of the Investment Company Act of 1940, which comprises the rules governing money market funds. Thus, the pool operates essentially as a money market fund. Rule 2a-7 is the rule that allows money market funds to use amortized cost to maintain a constant NAV of $1.00 per share, provided that such funds meet certain conditions. Florida PRIME is considered a 2a7-like fund and the City has reported its investment in Florida PRIME at the same value as the pooled shares allocated to the City. Fund B is accounted for as a fluctuating NAV pool and the fair value factor for September 30, 2013 was 1.13262284. The City has multiplied its account balance by the factor to determine the investment balance to be reported. Due to the nature of the securities in fund B, the weighted average of maturity is not available. The weighted average life of the fund is estimated at 4.04 years. Additional information regarding Florida PRIME and Fund B may be obtained from the State Board of Administration. Credit risk – Credit risk is generally the risk that an issuer of an investment will not fulfill its obligation to the holder of the investment. This is measured by the assignment of a rating by a nationally recognized statistical rating organization. Investment ratings by investment type are included in the preceding summary of investments. The City has no formal policy for managing credit risk.
Custodial credit risk – Custodial credit risk is the risk that, in the event of the failure of the counterparty, the City will not be able to recover the value of the investments or collateral securities that are in the possession of an outside party. The City maintains a list of authorized dealers that are eligible to provide investment services. The dealers are selected based on their credit worthiness, and all must qualify under Security and Exchange commission Rule 15C-1 (Uniform net Capital Rule). The investments are not evidenced by securities that exist in physical or book entry form.
Concentration of credit risk – Concentration of credit risk is the risk of loss attributed to the magnitude of an investment in a single issuer. The City limits concentration of credit risk through diversification. The investment policy has established maximum exposure parameters for each investment type. Interest rate risk – Interest rate risk is the risk that changes in interest rates will adversely affect the fair value of an investment in debt securities. To control this risk, the City limits the maturities of investments from five to fifteen years depending on the type of investment, unless the investment can be matched with a specific cash flow requirement.

CITY OF NORTH LAUDERDALE, FLORIDA NOTES TO FINANCIAL STATEMENTS
(Continued)
44
Note 4. Receivables Receivables for the fiscal year ended September 30, 2013 for the City’s major and nonmajor governmental funds in the aggregate, including the applicable allowances for uncollectible accounts, are as follows:
OtherGeneral Fire/Rescue Nonmajor
Fund Fund Funds TotalAccounts receivable 411,955$ 10,040,592$ 138$ 10,452,685$ Taxes 501,594 - - 501,594 Intergovernmental 360,347 - 174,736 535,083 Gross receivables 1,273,896 10,040,592 174,874 11,489,362 Allowance (128,949) (8,067,088) - (8,196,037) Net 1,144,947$ 1,973,504$ 174,874$ 3,293,325$
Receivables for the fiscal year ended September 30, 2013 for the City’s major and nonmajor business-type activities are as follows:
Utilities NonmajorFund Fund Total
Accounts receivable 1,741,813$ 47,931$ 1,789,744$ Allowance (434,466) - (434,466)Net 1,307,347$ 47,931$ 1,355,278$
Accounts receivable on the statement of net position are shown net of an allowance for uncollectible accounts. Management determines the allowance based on a review of accounts and their knowledge of the creditors and their ability to pay. Note 5. Capital Assets Capital asset activity for the fiscal year ended September 30, 2013 was as follows:
Additions RetirementsBeginning and and EndingBalance Transfers Transfers Balance
Governmental activities:Capital assets, not being depreciated:
Land 6,396,615$ -$ -$ 6,396,615$ Construction in progress 1,037,428 672,816 (1,017,776) 692,468 Residual interest in assets held by
Broward County Sheriff's Office 489,626 - - 489,626 Total capital assets, not being depreciated 7,923,669 672,816 (1,017,776) 7,578,709
Capital assets, being depreciated:Buildings 17,984,733 - 966,793 18,951,526 Improvements other than buildings 13,090,959 418,158 42,022 13,551,139 Machinery and equipment 7,272,475 315,816 (231,712) 7,356,579 Infrastructure 19,218,360 - - 19,218,360 Total capital assets being depreciated 57,566,527 733,974 777,103 59,077,604
Less accumulated depreciation for:Buildings (5,667,742) (460,844) - (6,128,586) Improvements other than buildings (6,912,763) (507,824) - (7,420,587) Machinery and equipment (5,000,250) (563,995) 231,712 (5,332,533) Infrastructure (14,104,984) (339,751) - (14,444,735) Total accumulated depreciation (31,685,739) (1,872,414) 231,712 (33,326,441) Total capital assets, being depreciated, net 25,880,788 (1,138,440) 1,008,815 25,751,163 Governmental activities capital assets, net 33,804,457$ (465,624)$ (8,961)$ 33,329,872$

CITY OF NORTH LAUDERDALE, FLORIDA NOTES TO FINANCIAL STATEMENTS
(Continued)
45
Note 5. Capital Assets (Continued) In connection with an agreement with the Broward County Sheriff’s Office (“BSO”) to provide police services to the City (see Note 13), the City transferred certain vehicles and equipment with a book value of $489,626 to BSO for its operation and use. These assets which are included under capital assets as “Residual interest in assets held by Broward County Sheriff’s Office” are not being depreciated since the City has a reversionary interest in the transferred assets. The North Lauderdale Water Control District maintains property, equipment and infrastructure with a cost of $4,464,848 and accumulated depreciation of $1,337,789 as of September 30, 2013. Net property, equipment and infrastructure in the amount of $3,127,059 are included in capital assets being depreciated. Included in the buildings classification above, is a school building which is currently being leased as discussed in further detail in Note 15. The cost of the building is $7,412,016. During the current fiscal year, the City sold certain real property to Habitat for Humanity (“Habitat”) for $50,000 to be used to construct residential properties. The terms of the sale included a repurchase agreement which allows the City to repurchase the property for the same purchase price if Habitat fails to obtain a certificate of occupancy for the properties within 730 days of the purchase date.
Additions RetirementsBeginning and and EndingBalance Transfers Transfers Balance
Business-type activities:Capital assets, not being depreciated:
Land 86,365$ -$ -$ 86,365$ Construction in progress 5,052,018 152,463 - 5,204,481 Total capital assets, not being depreciation 5,138,383 152,463 - 5,290,846
Capital assets, being depreciated:Buildings 296,910 - - 296,910 Improvements other than buildings 694,899 - - 694,899 Machinery and equipment 627,484 - - 627,484 Infrastructure 21,908,071 600,388 - 22,508,459 Total capital assets being depreciated 23,527,364 600,388 - 24,127,752
Less accumulated depreciation for:Buildings (296,910) - - (296,910) Improvements other than buildings (307,279) (37,378) - (344,657) Machinery and equipment (552,248) (30,768) - (583,016) Infrastructure (13,426,127) (462,687) - (13,888,814) Total accumulated depreciated (14,582,564) (530,833) - (15,113,397) Total capital assets, being depreciated, net 8,944,800 69,555 - 9,014,355 Business-type activities capital assets, net 14,083,183$ 222,018$ -$ 14,305,201$
During the current fiscal year, the City accepted the dedication of water and sewer improvements totaling $600,388 for the new Wal-Mart facility.

CITY OF NORTH LAUDERDALE, FLORIDA NOTES TO FINANCIAL STATEMENTS
(Continued)
46
Note 5. Capital Assets (Continued)
Depreciation expense was charged to function/programs of the primary government as follows: Governmental activities:
General government 363,300$ Public safety 319,541 Community development 31,079 Highways and streets, including depreciation of general infrastructure assets 806,443 Physical environment 73,589 Culture and recreation 192,189 Capital assets held by the government's internal service funds are charged
to various functions based on their usage of the assets 86,273 Total depreciation expense, governmental activities 1,872,414$
Business-type activities:Utilities 463,323$ Stormwater 67,510
Total depreciation expense, business-type activities 530,833$
Note 6. Interfund Transactions
Interfund transfers for the year ended September 30, 2013 are as follows:
Transfers TransfersIn Out
General Fund -$ 2,463,542$ Fire/Rescue Special Revenue Fund 1,098,157 - Water Control District Fund 50,242 - Debt Service Fund 715,143 - Capital Projects Fund 600,000 -
2,463,542$ 2,463,542$
Transfers are used to (1) move revenues from the fund that statute or budget requires collecting them to the fund that statute or budget requires to expend them and (2) move receipts restricted to debt service from the funds collecting the receipts to the debt service fund as debt service payments become due. Note 7. Restricted Assets/Payable from Restricted Assets
Restricted assets include cash and cash equivalents that are restricted for the payment of customer security deposits recorded in the Utilities Fund in the aggregate amount of $1,102,774. Note 8. Long-Term Liabilities
At September 30, 2013, long-term liabilities consisted of the following for governmental activities: 2004 General Obligation Bonds: In June 2004, the City issued $4,500,000 General Obligation Bonds, which bear interest at rates ranging from 2.5% to 5.0%. The 2004 Bonds were issued by the City for the purpose of providing the funds required to pay for the construction of a Public Safety Fire Rescue Complex. During the prior fiscal year, the City defeased the 2004 General Obligation Bonds. Accordingly, certain funds were placed in an escrow account for the purpose of paying the debt service. As a result, the Bonds are considered defeased and the liability has been removed from the governmental activities. The balance of the defeased Bonds at September 30, 2013 was $3,410,000.

CITY OF NORTH LAUDERDALE, FLORIDA NOTES TO FINANCIAL STATEMENTS
(Continued)
47
Note 8. Long-Term Liabilities (Continued)
2003 Capital Improvement Bonds – Refunding: In April 2003, the City authorized the issuance of Capital Improvement Revenue Refunding Bonds. The Bonds were used to refund the 1999 Capital Improvement Bonds and the 2002A and 2002B Capital Improvement Bonds. There were three separate Bonds issued. The first Bond was issued in the amount of $8,076,000 (Series 2003A) with a term of 16 years and bears interest at a rate of 4.75%. The second Bond was issued in the amount of $898,000 (Series 2003B) with a term of seven years and bears interest at a rate of 3.18%. The third Bond was issued in the amount of $3,592,000 (Series 2003C) with a term of seven years and bears interest at a rate of 3.67%. All of the Bonds are subject to mandatory redemption and are secured by an irrevocable pledge of non-ad valorem revenues. For the Series 2003A Bond, the principal and interest is to be paid semiannually on each April 15 and October 15 through 2019. The Series 2003B and C Bonds were paid in full on August 15, 2010.
Pledged Revenues - Non-ad valorem revenues were projected to produce 100% of the debt service requirements over the life of the bonds. Total principal and interest remaining on the bonds is $4,648,434, payable through 2020. For the current year, principal and interest paid and total non-ad valorem revenues were $715,143 and $10,656,940, respectively.
Annual debt service requirements for the 2003 Capital Improvement Refunding Bonds are as follows:
Year Ending September 30, Principal Interest Total
2014 533,332$ 181,810$ 715,142$ 2015 558,966 156,176 715,142 2016 585,833 129,309 715,142 2017 613,990 101,152 715,142 2018 643,501 71,641 715,142
2019-2020 1,023,717 49,007 1,072,724 3,959,339$ 689,095$ 4,648,434$
The City is in compliance with the requirements of the Bond Indenture at September 30, 2013. The City had the following changes in long-term liabilities for the year ended September 30, 2013 for governmental activities:
Beginning Ending Due Within
Balance Additions Payments Balance One Year
Bonds:2003 Capital Improvement Bonds,
Series 2003A 4,468,214$ -$ (508,875)$ 3,959,339$ 533,332$
Other Outstanding Debt:Compensated Absences 1,138,473 882,000 (745,465) 1,275,008 62,360
Total Long-Term Liabilities 5,606,687$ 882,000$ (1,254,340)$ 5,234,347$ 595,692$
For governmental activities, compensated absences are generally liquidated by the General Fund. The following is a summary of changes in long-term liabilities for the year ended September 30, 2013 for business-type activities:
Beginning Ending Due WithinBalance Additions Payments Balance One Year
Compensated Absences 110,469$ 94,102$ (90,992)$ 113,579$ -$ Total Long-Term Liabilities 110,469$ 94,102$ (90,992)$ 113,579$ -$

CITY OF NORTH LAUDERDALE, FLORIDA NOTES TO FINANCIAL STATEMENTS
(Continued)
48
Note 9. Defined Contribution Pension Plan All permanent full-time employees are covered by a defined contribution pension plan with vesting requirements varying between two and six years. The plan was established, and the provisions of the plan, including contribution rates, may be amended by Resolution of the City Commission. At September 30, 2013, there were 104 plan members. Non-vested pension forfeitures, classified as investments with pension agent, are restricted by the plan and may only be used toward the City’s payment of its future pension contributions. The plan is administered by ICMA Retirement Corporation. In a defined contribution plan, benefits depend solely on amounts contributed to the plan plus investment earnings. The City’s policy is to fund the annual pension costs in the annual budget. The City has no fiduciary responsibility for the plan and therefore does not report the balances or activities in its financial statements. The City’s contributions to the plan range from 13% to 25% of each eligible employee’s regular pay. These contribution percentages are determined by group classification. The general employees are required to contribute 5% of their base pay.
The City’s total payroll in fiscal year 2013 was approximately $4,481,388 (excluding firefighters not covered by this plan). The City’s contributions were calculated using wages subject to pension contributions (covered payroll) in the amount of approximately $4,220,365. The City and general employees made their respective contributions during the fiscal year. The amount contributed by the City for the fiscal year ended September 30, 2013 was approximately $609,448. General employees contributed approximately $ 211,018 during fiscal year ended September 30, 2013.
Note 10. Deferred Compensation Plan
The City offers its employees a deferred compensation plan created in accordance with Internal Revenue Code, Section 457. The plan, available to all City employees, permits them to defer a portion of their salary until future years. In January 1997, the City executed a Trust Agreement with its plan agent transferring plan assets into a trust account for the sole and exclusive benefit of City employees. Except for the plan provisions related to loans, the deferred compensation is not available to the employees until termination, retirement, death or unforeseeable emergency. The plan is administered by ICMA Retirement Corporation. Except for the plan provisions related to loans, the City has no fiduciary responsibility for the plan and therefore, the City does not report the balances and activities in its financial statements. Note 11. Florida Retirement System
On November 1, 2003, the City’s full-time firefighters joined the statewide Florida Retirement System (“FRS”). FRS is a state-administered retirement system that is a multiple-employer cost sharing defined benefit plan. All rates, benefits and amendments are established by the State of Florida through its legislative body. The FRS has various classes of memberships. The City’s firefighters fall under the Special Risk Class. All certified firefighters/paramedics and certified firefighters/emergency medical technicians are covered by this class. Members become vested after 6 years of service and are eligible for retirement at age 55 or after 25 years of service. Such benefit, payable monthly for life, is based on the number of years of credited service, multiplied by 3% of the average of the member’s five highest years of earnings. If a member is vested but has not reached normal retirement age of 55, early retirement can be taken. The amount of the retirement benefit will be reduced 5% for each year the retirement date precedes the normal retirement age.

CITY OF NORTH LAUDERDALE, FLORIDA NOTES TO FINANCIAL STATEMENTS
(Continued)
49
Note 11. Florida Retirement System (Continued) Eligible FRS members may elect to participate in the Deferred Retirement Option Program (“DROP”). The DROP allows an employee to retire and defer their monthly retirement benefit to an interest-bearing account, for up to a maximum of sixty months and to continue employment with the City. When the DROP period ends, the employee must terminate employment. At that time, the employee will receive payment of the accumulated DROP benefits and direct receipt, thereafter, of the FRS monthly retirement benefit. Contributions to FRS are made by the City as a percentage of covered payroll. Employees are required to contribute 3% of their base pay. As of July 2012, the City’s required contribution rate for employees was 14.9% and increased to 19.06% as of July 2013. At September 30, 2013, the City had 42 employees participating in the FRS and none participating in the DROP. The contribution requirements of covered payroll and actual contributions made for the last three fiscal years were as follows:
2011 2012 2013Contributions requirements 534,334$ 368,731$ 430,952$
Contributions made (100%) 534,334 368,731 430,952
Total covered payroll 2,349,999 2,584,660 2,727,272
Percentage of contributionto total payroll 22.74% 14.27% 15.80%
Fiscal Year Ended September 30,
The FRS issues an annual report including a statement of financial condition, historical and statistical information and an actuarial report. A copy can be obtained from the State of Florida, Division of Retirement, Research, Education and Policy Section, 2639-C North Monroe Street, Tallahassee, Florida 32399-1560 or from their website at www.myfrs.com. Note 12. Post-Employment Benefits Other Than Pensions
Pursuant to Section 112.081, Florida Statutes, the City is required to permit eligible retirees and their eligible dependents to participate in the City’s health insurance program at a cost to the retiree that is no greater than the cost at which coverage is available for active employees. The City does not provide retirees with any subsidy for this benefit.
Based on GASB Statement 45 which sets forth the guidelines and a future implementation timetable for reporting and disclosure of Other Post-Employment Benefits (“OPEB”), the City had an actuary calculate future funding requirements for fiscal year 2013. The actuary’s estimate, using the projected unit credit cost method, included other actuarial assumptions as classified below. The City elected to implement the provisions of GASB 45 prospectively.
Plan Description The City provides a single employer defined benefit health care plan. The plan allows its employees and their beneficiaries, at their own cost and until the attainment of age 65, to continue to obtain health, dental and other insurance benefits upon retirement. The benefits of the plan conform to Florida Statutes, which are the legal authority of the plan. The plan has no assets and does not issue a separate financial report.

CITY OF NORTH LAUDERDALE, FLORIDA NOTES TO FINANCIAL STATEMENTS
(Continued)
50
Note 12. Post-Employment Benefits Other Than Pensions (Continued)
Actuarial Methods and Assumptions The actuarial valuation of the calculation of OPEB involves estimates of the value of reported amounts and assumptions about the probability of events in the future. Amounts determined regarding the funded status of the plan and the annual required contributions of the employer are subject to continual revision as actual results are compared to past expectations and new estimates are made about the future. The required schedule of funding progress presented as required supplementary information is designed to provide multi-year trend information to show whether the actuarial value of plan assets is increasing or decreasing over time relative to the actuarial accrued liability for benefits. However, the City has not contributed assets to the plan at this time and has elected to fund the plan on a pay-as-you go method.
Projections of benefits are based on the substantive plan (the plan as understood by the employer and plan members) and include the types of benefits in force at the valuation date and the pattern of sharing benefit costs between the City and the plan members to that point. Actuarial calculations reflect a long-term perspective and employ methods and assumptions that are designed to reduce short-term volatility in actuarial accrued liabilities and the actuarial value of assets. Significant methods and assumptions were as follows:
Actuarial valuation date January 1, 2014Actuarial cost method Projected unit creditAmortization method Level-dollar paymentRemaining amortization period 15-year open periodAsset valuation method UnfundedActuarial assumptions:
Investment rate of return 3% per annum *Healthcare cost trend rate(s):
Select rates 7.00% for 2014 graded
Ultimate rate
* Includes inflation at 2.50% per annum
Insurance Premiums
to 5.5% for 2017
5.00% per annum
Funding Policy The City does not directly make a contribution to the plan on behalf of retirees. Retirees and their beneficiaries pay the same group rates as are charged to the City for active employees by its healthcare provider. However, the City’s actuaries, in their actuarial valuation, calculate an offset to the cost of these benefits as an Employer Contribution, based upon an implicit rate subsidy. This offset equals the total age-based costs paid by the City or its active employees for coverage of the retirees and their dependents for the year net of the retiree’s own payments for the year. Annual OPEB cost and Net OPEB obligation The annual OPEB cost is calculated based on the annual required contribution of the employer, an amount actuarially determined in accordance with GASB Statement No. 45. The annual required contribution represents a level of funding that, if paid on an ongoing basis, is projected to cover normal cost each year and to amortize any unfunded actuarial liabilities over a period not to exceed twenty years.

CITY OF NORTH LAUDERDALE, FLORIDA NOTES TO FINANCIAL STATEMENTS
(Continued)
51
Note 12. Post-Employment Benefits Other Than Pensions (Continued) Annual OPEB cost and Net OPEB obligation (Continued) The annual OPEB Cost for the City for the current fiscal year and the related information is as follows:
Required contribution rates:Employer Pay-as-you-goPlan members N/A
Normal cost 184,000$ Interest on Net OPEB Obligation 18,000 Amortization 107,000 Adjustment to the ARC (48,000) Annual OPEB cost 261,000 Contributions made * (53,000) Interest on contributions (1,000) Increase in net OPEB obligation 207,000 Net OPEB obligation - beginning of year 587,000 Net OPEB obligation - end of year 794,000$
*The $53,000 represents an actuarial estimate only and does not represent a physical contribution.
Trend information gives an indication of the progress made in accumulating sufficient assets to pay benefits when due. Three year information for the fiscal years ended September 30 is presented as follows:
2013 $ 261,000 20% $ 794,000 2012 219,000 11% 587,000 2011 217,000 11% 392,000
Net OPEB Obligation/
(Asset)Fiscal Year Ended
September 30,Annual OPEB
Cost
Percentage of OPEB
Cost Contributed
Funded Status and Funding Progress The funded status of the plan as of January 1, 2014 valuation date, the most recent actuarial valuation date, was as follows:
Actuarial UAAL as a Actuarial Accrued Unfunded Percentage
Actuarial Value of Liability AAL Funded Covered of CoveredValuation Assets (AAL) (UAAL) Ratio Payroll Payroll
Date (1) (2) (2)-(1) (1/2) (3) ((2-1)/3)
January 1, 2014 -$ 1,491,000$ 1,491,000$ 0% 7,918,000$ 18.8%

CITY OF NORTH LAUDERDALE, FLORIDA NOTES TO FINANCIAL STATEMENTS
(Continued)
52
Note 13. Commitments and Contingencies Inter-local agreement: The Utilities fund is a party to a large user agreement with Broward County (the “County”) for wastewater disposal. The City is responsible for all construction, operation and maintenance of facilities up to the point of connection with the County system. Under the agreement, the City pays the County for wastewater transmission, treatment and disposal services on a monthly basis. The monthly charges include operation and maintenance, repair and replacement and debt service. The charges for operation and maintenance are based on actual flow and debt service charges are computed based on the ratio of reserved capacity of facility usage by the City to the total usage by all customers or users. The County imposes a penalty charge to customers exceeding their reserved treatment capacity for three consecutive months. During fiscal year 2003, the City purchased .4 MGD of additional sanitary sewer capacity from Broward County to avoid any such penalties. In addition, a surcharge, limited to a maximum of 10% on each monthly bill, is assessed in order to contribute to a repair and replacement fund maintained by the County. Expenditures totaled approximately $2,275,195 related to the agreement for the fiscal year ended September 30, 2013. Litigation: On July 2, 2013, the Interlocal Agreement between Broward County and twenty-six (26) municipalities addressing the regional solid waste disposal system operated under and through the Broward County Resource Recovery Board (“RRB") expired. Some of the municipalities, including the City, (“Plaintiff municipalities”) initiated a lawsuit on or about June 28, 2013, seeking the distribution of the solid waste disposal system assets held by Broward County. The judge ordered full and complete compliance with the government conflict resolution requirements under Chapter 164, Florida Statutes. Accordingly, Broward County passed Resolution 2013-665, on August 13, 2013, providing temporary protection to all RBB assets. The Plaintiff municipalities are now participating in mandatory Chapter 164, Florida Statutes conflict resolutions procedures. Additionally, Broward Country is requesting the eight (8) unnamed RRB member municipalities (not included in the litigation) be included in the conflict resolution proceedings. The City intends to continue to vigorously pursue this matter. The City is also a defendant in various lawsuits incidental to its operations. Although the outcome of these lawsuits is not presently determinable, it is the opinion of the City Attorney that resolution of these matters will not have a material adverse effect on the financial condition of the City. Agreement to provide police services: The City has an agreement with BSO to provide police services to the City. The agreement expires in September 2016 and requires monthly payments of approximately $690,957 from October 1, 2011 through September 2016, with increases up to 5% and 9% per year, for certain categories of expenses, thereafter through the end of the agreement. Under the agreement, BSO has assumed the obligation for accrued compensated absences relating to police officers of the City as of the effective date of the agreement and will administer and make retirement plan contributions on behalf of such employees. See Note 5 for assets transferred to BSO under the agreement. Agreement to provide Utilities plant services: In December 2006, the City entered an agreement with U.S. Water Services to provide operation and maintenance services for the City’s Utilities plant. In October 2007, the agreement was amended to expand the scope of services to include customer service and billing. Fees for services are subject to annual increases and adjustments for certain categories of expenses. The contract expired on September 30, 2010 and was extended for a term of three (3) years. City expenditures totaled approximately $1,564,610 related to the agreement for the fiscal year ended September 30, 2013. Subsequent to September 30, 2013, the City entered into a new agreement with US Water for operations, maintenance and billing services. The agreement is for a term of five (5) years with an option for one (1) five (5) year renewal. Construction Contracts: As of September 30, 2013, the City had open contracts for several ongoing projects. For the open and pending contracts, the City estimates approximately $414,000 will be paid during fiscal year 2014.

CITY OF NORTH LAUDERDALE, FLORIDA NOTES TO FINANCIAL STATEMENTS
(Continued)
53
Note 14. Risk Management The City is exposed to various risks of loss related to torts; theft of, damage to and destruction of assets; errors and omissions; injuries to employees and natural disasters. During fiscal year 1995, the City established an Insurance Internal Service Fund (the “Insurance Fund”) to account for and finance its insurance costs and uninsured risks of loss. The City is still held financially responsible for a pro-rated portion of all claims incurred prior to February 28, 1995 as part of the Broward Risk Management Association risk pool. Under the current program provided by the Florida League of Cities, the Insurance Fund purchased first dollar commercial insurance coverage for worker’s compensation claims. The City also purchases group health, dental, life and disability insurance coverage for its employees. The Insurance Fund provides coverage up to a $25,000 maximum for each general liability and $2,500 for each property damage claim for the policy year ended September 30, 2013. The City purchases commercial insurance for claims in excess of coverage above the individual claim aggregate (presently $1 million) and for all other risk losses.
Settled claims did not exceed this commercial coverage during the last three fiscal years. All funds of the City participate in the program and make payments to the Insurance Fund based on management’s estimate of amounts needed to pay the full cost of commercial insurance premiums, current year claims and payments to a reserve for catastrophe losses. The total net position balance was $4,206,265 at September 30, 2013. A liability for claims incurred but not reported is recognized when it is probable that a liability has been incurred at the date of the financial statements and the amount of loss can be reasonably estimated. Changes in the Insurance Fund’s claims liability are as follows:
Balance at Claims and Balance atFiscal Year Ended Beginning of Changes in Claim End ofSeptember 30, Fiscal Year Estimates Payments Fiscal Year
2011 215,394$ 3,214$ (20,962)$ 197,646$ 2012 197,646 11,365 (29,764) 179,247 2013 179,247 12,500 (21,220) 170,527
Management has elected to keep the liability at $215,394 to remain conservative.
Note 15. Operating Leases
On May 18, 2010, the City entered into a 20 year lease agreement with Somerset Academy, Inc., for the purpose of operating a charter school. The lease agreement has three additional five year renewal options. Minimum future rental payments on this lease as of September 30, 2013 are as follows:
Fiscal Annual Year Ended Minimum
September 30, Payments2014 795,000$
The agreement calls for minimum monthly rentals of $33,333 with fixed increases in the first four years. Beginning in years 2014 through 2019 the annual rent shall be increased each July 1, of each year but not decreased by the Consumer Price Index for all Urban Consumers for the Miami-Fort Lauderdale area for the prior year, calculated using May over May index figures. The lessee has the option to purchase the property for the fair market value from the City at any time during the lease term and during any renewal periods thereafter. For the fiscal year ended September 30, 2013, rental income received from the lease was approximately $664,000.

CITY OF NORTH LAUDERDALE, FLORIDA NOTES TO FINANCIAL STATEMENTS
(Continued)
54
Note 16. Pronouncements Issued, But Not Yet Adopted GASB Statement No. 65, Items Previously Reported as Assets and Liabilities
This Statement establishes accounting and financial reporting standards that reclassify, as deferred outflows of resources or deferred inflows of resources, certain items that were previously reported as assets and liabilities and recognizes, as outflows of resources or inflows of resources, certain items that were previously reported as assets and liabilities. The provisions of this Statement are effective for financial statements for periods beginning after December 15, 2012. GASB Statement No. 66, Technical Corrections—2012—an amendment of GASB Statements No. 10 and No. 62 The objective of this Statement is to improve accounting and financial reporting for a governmental financial reporting entity by resolving conflicting guidance that resulted from the issuance of two pronouncements, Statements No. 54, Fund Balance Reporting and Governmental Fund Type Definitions, and No. 62, Codification of Accounting and Financial Reporting Guidance Contained in Pre-November 30, 1989 FASB and AICPA Pronouncements. The provisions of this Statement are effective for financial statements for periods beginning after December 15, 2012. GASB Statement No. 67, Financial Reporting for Pension Plans—an amendment of GASB Statement No. 25 The objective of this Statement is to improve financial reporting by state and local governmental pension plans. This Statement results from a comprehensive review of the effectiveness of existing standards of accounting and financial reporting for pensions with regard to providing decision-useful information, supporting assessments of accountability and interperiod equity, and creating additional transparency. This Statement replaces the requirements of Statements No. 25, Financial Reporting for Defined Benefit Pension Plans and Note Disclosures for Defined Contribution Plans, and No. 50, Pension Disclosures, as they relate to pension plans that are administered through trusts or equivalent arrangements (hereafter jointly referred to as trusts) that meet certain criteria. The requirements of Statements 25 and 50 remain applicable to pension plans that are not administered through trusts covered by the scope of this Statement and to defined contribution plans that provide postemployment benefits other than pensions. This Statement is effective for financial statements for fiscal years beginning after June 15, 2013. GASB Statement No. 68, Accounting and Financial Reporting for Pensions—an amendment of GASB Statement No. 27
The primary objective of this Statement is to improve accounting and financial reporting by state and local governments for pensions. It also improves information provided by state and local governmental employers about financial support for pensions that is provided by other entities. This Statement results from a comprehensive review of the effectiveness of existing standards of accounting and financial reporting for pensions with regard to providing decision-useful information, supporting assessments of accountability and interperiod equity, and creating additional transparency. This Statement replaces the requirements of Statement No. 27, Accounting for Pensions by State and Local Governmental Employers, as well as the requirements of Statement No. 50, Pension Disclosures, as they relate to pensions that are provided through pension plans administered as trusts or equivalent arrangements (hereafter jointly referred to as trusts) that meet certain criteria. The requirements of Statements 27 and 50 remain applicable for pensions that are not covered by the scope of this Statement. Statement No. 67, Financial Reporting for Pension Plans, revises existing standards of financial reporting for most pension plans. This Statement and Statement 67 establish a definition of a pension plan that reflects the primary activities associated with the pension arrangement—determining pensions, accumulating and managing assets dedicated for pensions, and paying benefits to plan members as they come due. This Statement is effective for fiscal years beginning after June 15, 2014.

CITY OF NORTH LAUDERDALE, FLORIDA NOTES TO FINANCIAL STATEMENTS
(Continued)
55
Note 16. Pronouncements Issued, But Not Yet Adopted (Continued) GASB Statement No. 69, Government Combinations and Disposals of Government Operations The objective of this Statement is to improve accounting and financial reporting for U.S. state and local governments’ combinations and disposals of government operations by providing guidance specific to the situations and circumstances encountered within the governmental environment. This Statement is effective for periods beginning after December 15, 2013. GASB Statement No. 70, Accounting and Financial Reporting for Nonexchange Financial Guarantees
The objective of this Statement is to enhance comparability of financial statements among governments by requiring consistent reporting by those governments that extend nonexchange financial guarantees and by those governments that receive nonexchange financial guarantees. This Statement also will enhance the information disclosed about a government’s obligations and risk exposure from extending nonexchange financial guarantees and requires disclosures about obligations that are issued with this type of financial guarantee. This Statement is effective for periods beginning after June 15, 2013.
GASB Statement No. 71, Pension Transition for Contributions Made Subsequent to the Measurement Date
The objective of this Statement is to address an issue regarding application of the transition provisions of Statement No. 68, Accounting and Financial Reporting for Pensions. The issue relates to amounts associated with contributions, if any, made by a state or local government employer or nonemployer contributing entity to a defined benefit pension plan after the measurement date of the government’s beginning net pension liability. The provisions of this Statement are required to be applied simultaneously with the provisions of Statement 68 which is effective for fiscal years beginning after June 15, 2014.
The City’s management has not yet determined the effect these Statements will have on the City’s financial statements.

56
City of North Lauderdale, Florida
Required Supplementary Information
Schedule of Funding Progress September 30, 2013 (Unaudited)
Other Post-Employment Benefits
Actuarial UAAL as a Actuarial Accrued Unfunded Percentage
Actuarial Value of Liability AAL Funded Covered of CoveredValuation Assets (AAL) (UAAL) Ratio Payroll Payroll
Date (1) (2) (2)-(1) (1/2) (3) ((2-1)/3)
October 1, 2008 -$ 468,000$ 468,000$ 0% 5,314,000$ 8.8%January 1, 2012 - 1,096,000 1,096,000 0% 6,381,000 17.2%January 1, 2014 - 1,491,000 1,491,000 0% 7,918,000 18.8%

57
City of North Lauderdale, Florida
Required Supplementary Information
Schedule of Employer Contributions September 30, 2013 (Unaudited) Other Post-Employment Benefits
Fiscal Annual Year Ended Required %
September 30, Contribution Contributed
2013 291,000$ 19%2012 239,000 10%2011 227,000 11%2010 217,000 6%2009 112,000 0%
Employer Contributions

City of North Lauderdale, Florida
Supplementary Information
Nonmajor Governmental Funds
Special Revenue Funds Special revenue funds are used to account for and report the proceeds of specific revenue sources that are restricted or committed to expenditure for specified purposes other than debt service or capital projects Police Education Fund – This fund is used to account for revenues pursuant to Florida Statute 943.25 that allows municipalities to assess an additional two dollars in criminal matters for the purpose of criminal justice education and training for police officers. Law Enforcement Fund – This fund is used to account for assets acquired pursuant to the “Florida Contraband Forfeiture Act.” Proceeds may only be expended for law enforcement purposes that are not considered to be normal operating expenditures. The Grants Special Revenue Fund – This fund is used to account for all Federal, State, and local grants awarded to the City. As such, the fund is a self-balancing fund and does not accumulate a fund balance each year and all expenditures are offset by the applicable revenue from the granting agency. Recreation Special Projects Fund – This fund is used to account for the receipts and disbursements for special projects that are coordinated by the Parks and Recreation Department.

58
City of North Lauderdale, Florida
Supplementary Information
Combining Balance Sheet Nonmajor Governmental Funds September 30, 2013
Parks TotalPolice Law and Nonmajor
Education Enforcement Grants Recreation GovernmentalAssets Fund Fund Fund Fund Funds
Cash and equity in pooled cash 4,445$ 114,789$ 13,388$ -$ 132,622$ Investments 7,492 193,391 22,555 - 223,438 Accounts receivable - - 174,736 138 174,874
Total assets 11,937$ 308,180$ 210,679$ 138$ 530,934$
Liabilities and Fund BalancesLiabilities:
Accounts payable and other liabilities -$ 5,117$ 64,333$ 138$ 69,588$
Total liabilities - 5,117 64,333 138 69,588
Fund balances:Restricted for:
Law enforcement - 303,063 - - 303,063 Police education 11,937 - - - 11,937 Grants - - 146,346 - 146,346
Unassigned - - - - - Total fund balances 11,937 303,063 146,346 - 461,346
Total liabilities and fund balances 11,937$ 308,180$ 210,679$ 138$ 530,934$
Special Revenue Funds

59
City of North Lauderdale, Florida
Supplementary Information
Combining Statement of Revenues, Expenditures and Changes in Fund Balance Nonmajor Governmental Funds Fiscal Year Ended September 30, 2013
Parks TotalPolice Law and Nonmajor
Education Enforcement Grants Recreation GovernmentalFund Fund Fund Fund Funds
Revenues:Intergovernmental -$ -$ 544,011$ 2,500$ 546,511$ Charges for services - - - 378,384 378,384 Fines and forfeitures - 44,529 - - 44,529 Interest income - 74 - 47 121
Total revenues - 44,603 544,011 380,931 969,545 Expenditures:
Current:Public safety - 13,777 57,950 - 71,727 Community development - - 377,004 - 377,004 Parks and recreation - - - 450,178 450,178
Capital outlay - 6,618 62,298 - 68,916 Total expenditures - 20,395 497,252 450,178 967,825
Excess (deficiency) of revenuesover (under) expenditures - 24,208 46,759 (69,247) 1,720
Fund balances, beginning 11,937 278,855 99,587 69,247 459,626
Fund balances, ending 11,937$ 303,063$ 146,346$ -$ 461,346$
Special Revenue Funds

This page intentionally left blank.

City of North Lauderdale, Florida
Supplementary Information
Internal Service Funds
Internal service funds are used to account for the financing of goods or services provided by one department or agency to other departments or agencies of the City, on a cost reimbursement basis. Vehicle Maintenance Fund – This fund is used to account for the accumulation and allocation of costs associated with the acquisition and maintenance of the City’s vehicle fleet and the maintenance of light and heavy equipment. Information Technology Fund – This fund is used to account for the accumulation and allocation of costs associated with electronic data processing. Insurance Fund – This fund is used to account for the accumulation and allocation of costs associated with, but not limited to, general liability, automobile, property and workers’ compensation premiums.

60
City of North Lauderdale, Florida
Supplementary Information
Combining Statement of Net Position Internal Service Funds September 30, 2013
Vehicle InformationMaintenance Technology Insurance
Assets Fund Fund Fund TotalCurrent Assets
Cash and equity in pooled cash 505,718$ 339,428$ 1,648,796$ 2,493,942$ Investments 852,016 571,856 2,777,830 4,201,702
Total current assets 1,357,734 911,284 4,426,626 6,695,644
Capital AssetsImprovements other than buildings - 53,767 - 53,767 Machinery, equipment, furnishings and other - 873,961 - 873,961 Less accumulated depreciation - (808,751) - (808,751)
Net capital assets - 118,977 - 118,977 Total assets 1,357,734$ 1,030,261$ 4,426,626$ 6,814,621$
Liabilities and Net PositionCurrent Liabilities
Accounts payable and other liabilities 8,233$ 36,081$ 220,361$ 264,675$ Accrued compensated absences - 19,337 - 19,337
Total current liabilities 8,233 55,418 220,361 284,012
Long-Term LiabilitiesAccrued compensated absences - 4,924 - 4,924
Total long-term liabilities - 4,924 - 4,924 Total liabilities 8,233 60,342 220,361 288,936
Net PositionNet investment in capital assets - 118,977 - 118,977 Unrestricted 1,349,501 850,942 4,206,265 6,406,708
Total net position 1,349,501$ 969,919$ 4,206,265$ 6,525,685$

61
City of North Lauderdale, Florida
Supplementary Information
Combining Statement of Revenues, Expenses and Changes in Net Position Internal Service Funds Fiscal Year Ended September 30, 2013
Vehicle InformationMaintenance Technology Insurance
Fund Fund Fund TotalOperating revenues:
Charges for services 326,997$ 774,370$ 599,571$ 1,700,938$ Total operating revenues 326,997 774,370 599,571 1,700,938
Operating expenses:Personnel - 254,491 - 254,491 Other operating expenses 164,105 360,409 570,844 1,095,358 Depreciation - 86,273 - 86,273
Total operating expenses 164,105 701,173 570,844 1,436,122
Operating income 162,892 73,197 28,727 264,816
Nonoperating revenues (expenses):Interest income 306 231 1,248 1,785 Miscellaneous revenue - - 325 325
Total nonoperating revenues (expenses) 306 231 1,573 2,110
Change in net position 163,198 73,428 30,300 266,926
Net position, beginning 1,186,303 896,491 4,175,965 6,258,759 Net position, ending 1,349,501$ 969,919$ 4,206,265$ 6,525,685$

62
City of North Lauderdale, Florida
Supplementary Information
Combining Statement of Cash Flows Internal Service Funds Fiscal Year Ended September 30, 2013
Vehicle InformationMaintenance Technology Insurance
Fund Fund Fund TotalCash Flows From Operating Activities
Receipts from customers and users 326,997$ 774,370$ 599,571$ 1,700,938$ Payments to suppliers (160,334) (394,818) (435,720) (990,872) Payments to employees - (256,312) - (256,312)
Net cash provided by operating activities 166,663 123,240 163,851 453,754
Cash Flows From Noncapital Financing ActivitiesMiscellaneous - - 325 325
Net cash provided by (used in) noncapitaland related financing activities - - 325 325
Cash Flows From Capital and Related FinancingActivities
Purchase of capital assets - (807) - (807) Net cash provided by (used in) capital
and related financing activities - (807) - (807)
Cash Flows From Investing ActivitiesSale of investments (699,486) (470,838) (2,231,995) (3,402,319) Purchase of investments 667,174 441,856 2,387,510 3,496,540 Interest received 306 231 1,248 1,785
Net cash provided by (used in) investing activities (32,006) (28,751) 156,763 96,006
Net increase in cash and equityin pooled cash 134,657 93,682 320,939 549,278
Cash and equity in pooled cash, beginning 371,061 245,746 1,327,857 1,944,664 Cash and equity in pooled cash, ending 505,718$ 339,428$ 1,648,796$ 2,493,942$

63
City of North Lauderdale, Florida
Supplementary Information
Combining Statement of Cash Flows Internal Service Funds Fiscal Year Ended September 30, 2013 (Continued)
Vehicle InformationMaintenance Technology Insurance
Fund Fund Fund TotalReconciliation of Operating Income to Net
Cash Provided By Operating ActivitiesOperating income 162,892$ 73,197$ 28,727$ 264,816$
Adjustments to reconcile operating incometo net cash provided by operating activities:Depreciation - 86,273 - 86,273 Changes in assets and liabilities:
(Increase)/decrease in prepaid items - - 135,430 135,430 (Decrease)/increase in accounts payable
and other liabilities 3,771 (34,409) (306) (30,944) (Decrease)/increase in compensated absences - (1,821) - (1,821)
Total adjustments 3,771 50,043 135,124 188,938 Net cash provided by (used in) operating activities 166,663$ 123,240$ 163,851$ 453,754$

This page intentionally left blank.

City of North Lauderdale, Florida
Supplementary Information
Agency Fund An agency fund is used to account for a situation where the government’s role is purely custodial, such as the receipt, temporary investment and remittance of fiduciary resources to individuals, private organizations, or other governments. Police Explorer Fund – This fund is used to account for the revenue and expenditures associated with a program that is run by the Broward County Sheriff’s Office for individuals between the ages of 14 and 18 who have an interest in the field of law enforcement. The participants are introduced to many facets of law enforcement and emergency services and work hand in hand with the deputies to assist them in the community policing philosophy. All funds are used solely to support the activities of those individuals enrolled in the program.
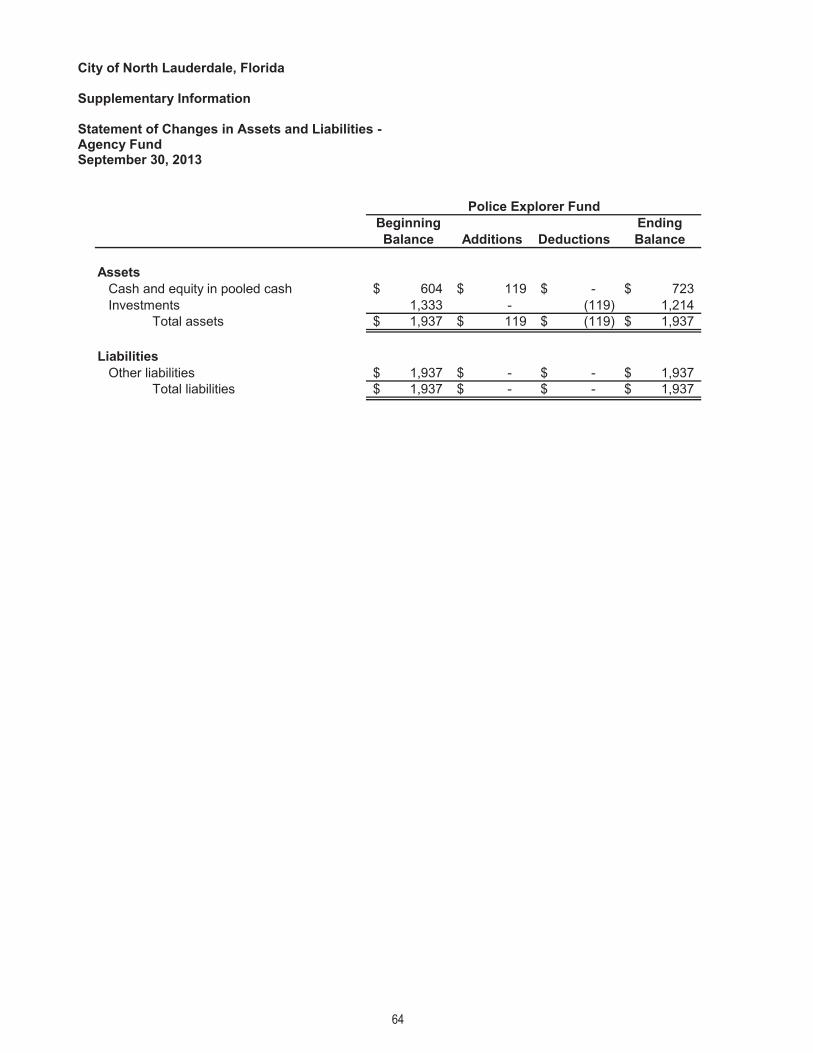
64
City of North Lauderdale, Florida
Supplementary Information
Statement of Changes in Assets and Liabilities - Agency Fund September 30, 2013
Beginning EndingBalance Additions Deductions Balance
AssetsCash and equity in pooled cash 604$ 119$ -$ 723$ Investments 1,333 - (119) 1,214
Total assets 1,937$ 119$ (119)$ 1,937$
LiabilitiesOther liabilities 1,937$ -$ -$ 1,937$
Total liabilities 1,937$ -$ -$ 1,937$
Police Explorer Fund
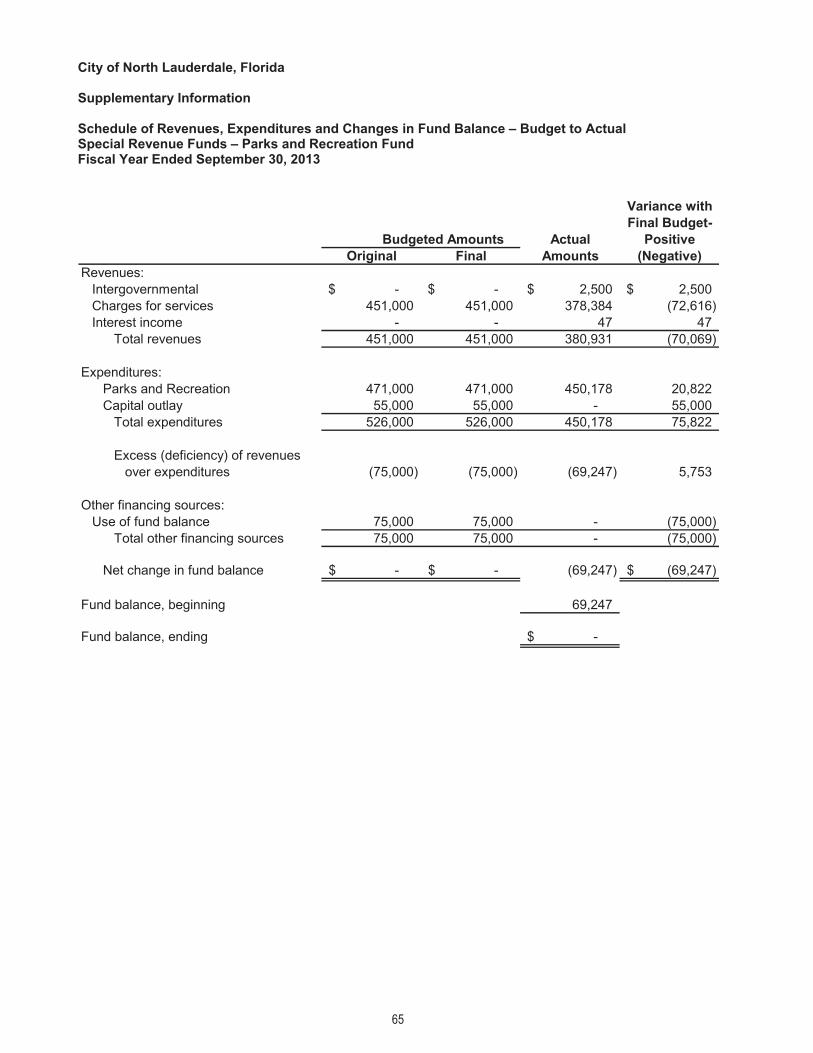
65
City of North Lauderdale, Florida
Supplementary Information
Schedule of Revenues, Expenditures and Changes in Fund Balance – Budget to Actual Special Revenue Funds – Parks and Recreation Fund Fiscal Year Ended September 30, 2013
Variance withFinal Budget-
Actual PositiveOriginal Final Amounts (Negative)
Revenues: Intergovernmental -$ -$ 2,500$ 2,500$
Charges for services 451,000 451,000 378,384 (72,616) Interest income - - 47 47
Total revenues 451,000 451,000 380,931 (70,069)
Expenditures:Parks and Recreation 471,000 471,000 450,178 20,822 Capital outlay 55,000 55,000 - 55,000
Total expenditures 526,000 526,000 450,178 75,822
Excess (deficiency) of revenues over expenditures (75,000) (75,000) (69,247) 5,753
Other financing sources:Use of fund balance 75,000 75,000 - (75,000)
Total other financing sources 75,000 75,000 - (75,000)
Net change in fund balance -$ -$ (69,247) (69,247)$
Fund balance, beginning 69,247
Fund balance, ending -$
Budgeted Amounts

66
City of North Lauderdale, Florida
Supplementary Information
Schedule of Revenues, Expenditures and Changes in Fund Balance – Budget to Actual Special Revenue Funds – Debt Service Fund Fiscal Year Ended September 30, 2013
Variance withFinal Budget-
Actual PositiveOriginal Final Amounts (Negative)
Revenues:Property taxes -$ -$ 960$ 960$ Interest income - - 24 24
Total revenues - - 984 984
Expenditures:Debt Service:
Principal 508,875 508,875 508,875 - Interest 206,268 206,268 206,268 - Bond costs - 6,500 6,417 83
Total expenditures 715,143 721,643 721,560 83
Excess (deficiency) of expenditures over revenue (715,143) (721,643) (720,576) 1,067
Other financing sources:Use of fund balance - 6,500 - (6,500) Transfers in 715,143 715,143 715,143 -
Total other financing sources 715,143 721,643 715,143 (6,500)
Net change in fund balance -$ -$ (5,433) (5,433)$
Fund balance, beginning 93,619
Fund balance, ending 88,186$
Budgeted Amounts

STATISTICAL SECTION This part of City of North Lauderdale’s comprehensive annual financial report presents detailed information as a context for understanding what information in the financial statements, note disclosures, and required supplementary information says about the government’s overall financial health. Financial trends: These schedules contain trend information to help the reader understand how the government’s financial performance and well-being have changed over time.
Net position by components 67Change in net position 68-69Governmental activities tax revenues by source 70Fund balance of governmental funds 71Changes in fund balance of governmental funds 72-73
Revenue Capacity: These schedules contain information to help readers assess the government’s most significant local revenue source, the property tax.
Assessed value and estimated actual value of taxable property 74Property tax rates – direct and overlapping governments 75Principal property taxpayers 76Property tax levies and collections 77
Debt Capacity: These schedules present information to help readers assess the affordability of the government’s current level of outstanding debt and the government’s ability to issue additional debt in the future.
Ratio of outstanding debt by type 78Ratio of general bonded debt outstanding 79Direct and overlapping governmental activity debt 80Legal debt margin information 81Pledged-revenue coverage 82
Demographic and Economic Information: These schedules offer demographic and economic indicators to help the reader understand the environment within which the government’s financial activities take place.
Demographic and economic statistics 83Principal employers 84
Operating Information: These schedules contain service and infrastructure data to help the readers understand how the information in the government’s financial report relates to the services the government provides and the activities it performs.
Full-time equivalent city government employees by function 85Operating indicators by function 86-87
Other Information: These schedules contain service and infrastructure data to help the reader understand how the information in the government’s financial report relates to the services the government provides and the activities it performs.
Capital assets by function 88

This page intentionally left blank.

67
City
of N
orth
Lau
derd
ale,
Flo
rida
Sche
dule
1
Net
Pos
ition
by
Com
pone
nts
Last
Ten
Fis
cal Y
ears
(a
ccru
al b
asis
of a
ccou
ntin
g)
2004
2005
2006
2007
2008
2009
2010
2011
2012
2013
Gov
ernm
enta
l act
iviti
es
Net
inve
stm
ent i
n ca
pita
l ass
ets
20,62
8,540
$
21
,139,2
62$
21,51
7,720
$
22
,170,6
45$
24,69
4,115
$
26
,280,1
34$
24,82
3,293
$
24
,717,3
14$
29,33
6,243
$
29
,370,5
33$
Res
trict
ed-
-
471,0
43
-
-
-
-
-
3,607
,006
3,750
,171
Unr
estri
cted
12,16
8,703
13
,659,3
43
15,92
5,071
23
,774,5
29
29,12
2,051
33
,684,9
32
39,86
6,992
42
,704,5
43
37,16
2,673
38
,855,0
33
To
tal g
over
nmen
tal a
ctiv
ities
net
pos
ition
32,79
7,243
$
34
,798,6
05$
37,91
3,834
$
45
,945,1
74$
53,81
6,166
$
59
,965,0
66$
64,69
0,285
$
67
,421,8
57$
70,10
5,922
$
71
,975,7
37$
Bus
ines
s-ty
pe a
ctiv
ities
Net
inve
stm
ent i
n ca
pita
l ass
ets
8,772
,947
$
9,588
,330
$
9,8
49,96
3$
10,01
6,606
$
10
,966,9
52$
11,28
7,874
$
11
,512,7
69$
13,71
7,225
$
14
,083,1
83$
14,30
5,201
$
Unr
estri
cted
6,870
,768
6,762
,568
7,7
44,62
4
8,547
,306
8,9
62,25
1
10,93
2,251
13
,356,2
40
13,66
8,668
16
,660,0
89
20,20
2,572
Tota
l bus
ines
s-ty
pe a
ctiv
ities
net
pos
ition
15,64
3,715
$
16
,350,8
98$
17,59
4,587
$
18
,563,9
12$
19,92
9,203
$
22
,220,1
25$
24,86
9,009
$
27
,385,8
93$
30,74
3,272
$
34
,507,7
73$
Prim
ary
gove
rnm
ent
Net
inve
stm
ent i
n ca
pita
l ass
ets
29,40
1,487
$
30
,727,5
92$
31,36
7,683
$
32
,187,2
51$
35,66
1,067
$
37
,568,0
08$
36,33
6,062
$
38
,434,5
39$
43,41
9,426
$
43
,675,7
34$
Res
trict
ed-
-
471,0
43
-
-
-
-
-
3,607
,006
3,750
,171
Unr
estri
cted
19,03
9,471
20
,421,9
11
23,66
9,695
32
,321,8
35
38,08
4,302
44
,617,1
83
53,22
3,232
56
,373,2
11
53,82
2,762
59
,057,6
05
To
tal p
rimar
y go
vern
men
t net
pos
ition
48,44
0,958
$
51
,149,5
03$
55,50
8,421
$
64
,509,0
86$
73,74
5,369
$
82
,185,1
91$
89,55
9,294
$
94
,807,7
50$
100,8
49,19
4$
106,4
83,51
0$
Sept
embe
r 30,

68
City
of N
orth
Lau
derd
ale,
Flo
rida
S
ched
ule
2 C
hang
e in
Net
Pos
ition
La
st T
en F
isca
l Yea
rs
(acc
rual
bas
is o
f acc
ount
ing)
2004
2005
2006
2007
2008
2009
2010
2011
2012
2013
Expe
nses
Gov
ernm
enta
l act
iviti
es:
Gen
eral
gov
ernm
ent
3,00
0,83
4$
3,63
9,60
4$
4,58
3,10
7$
3,93
9,96
6$
3,58
7,87
8$
3,16
0,47
3$
5,40
1,83
8$
4,14
4,03
4$
3,
242,
231
$
3,
600,
906
$
P
ublic
saf
ety
10,7
00,3
13
11
,755
,641
12
,075
,859
12
,580
,258
12
,780
,324
13,2
87,5
24
13
,749
,268
13
,974
,052
13,4
42,6
31
14,0
84,8
25C
omm
unity
dev
elop
men
t1,
421,
293
1,
536,
216
1,
886,
545
1,
933,
652
1,
811,
630
1,
812,
065
1,
549,
526
1,
766,
528
1,91
8,20
0
2,16
3,92
9P
hysi
cal e
nviro
nmen
t1,
569,
960
1,
660,
758
4,
618,
825
2,
115,
591
2,
378,
867
2,
423,
581
2,
715,
276
1,
965,
421
2,22
0,79
3
3,55
6,92
5S
treet
s69
0,83
7
65
6,18
6
71
5,44
9
69
3,74
8
73
3,14
4
83
1,87
3
83
3,03
9
1,
691,
199
1,71
1,43
4
1,78
4,41
9P
arks
and
recr
eatio
n3,
623,
975
3,
980,
966
3,
903,
583
3,
641,
994
3,
334,
265
3,
459,
330
3,
607,
099
3,
762,
106
3,95
5,19
5
4,01
7,91
5E
duca
tiona
l pro
gram
s4,
318,
144
4,
149,
536
3,
456,
067
3,
000
22,4
39
-
-
-
-
-
In
tere
st79
9,10
9
76
9,14
9
68
5,11
1
68
4,35
6
53
7,21
6
51
9,27
6
45
4,37
0
41
6,78
4
623,
976
195,
189
Tota
l gov
ernm
enta
l act
iviti
es e
xpen
ses
26,1
24,4
65
28
,148
,056
31
,924
,546
25
,592
,565
25
,185
,763
25,4
94,1
22
28
,310
,416
27
,720
,124
27,1
14,4
60
29,4
04,1
08
Bus
ines
s-ty
pe a
ctiv
ities
:W
ater
and
sew
er6,
195,
801
6,
741,
748
7,
257,
821
7,
113,
525
7,
131,
430
7,
182,
873
8,
494,
313
8,
284,
589
8,52
2,86
1
8,14
6,21
5S
torm
wat
er43
9,66
3
46
3,56
7
46
9,07
2
53
4,28
5
45
2,98
8
58
7,48
3
52
7,05
9
55
4,84
7
630,
768
748,
361
Tota
l bus
ines
s-ty
pe a
ctiv
ities
exp
ense
s6,
635,
464
7,
205,
315
7,
726,
893
7,
647,
810
7,
584,
418
7,
770,
357
9,
021,
372
8,
839,
436
9,15
3,62
9
8,89
4,57
6To
tal p
rimar
y go
vern
men
t exp
ense
s32
,759
,929
$
35,3
53,3
71$
39
,651
,439
$
33,2
40,3
75$
32
,770
,181
$
33,2
64,4
78$
37
,331
,788
$
36,5
59,5
60$
36,2
68,0
89$
38
,298
,684
$
Prog
ram
Rev
enue
sG
over
nmen
tal a
ctiv
ities
:C
harg
es fo
r ser
vice
s:G
ener
al g
over
nmen
t5,
038,
093
$
4,
972,
931
$
5,
527,
790
$
5,
393,
547
$
5,
511,
322
$
4,
130,
899
$
4,
248,
877
$
4,
767,
973
$
5,51
4,12
1$
6,75
2,08
4$
Pub
lic s
afet
y3,
603,
310
3,
761,
265
3,
847,
807
4,
033,
864
4,
843,
915
5,
224,
752
5,
377,
865
5,
428,
986
4,61
6,68
2
4,23
3,65
2C
omm
unity
dev
elop
men
t11
6,66
7
22
0,33
5
14
1,23
3
22
4,95
8
11
6,47
3
52
2,41
6
53
1,37
2
78
2,01
9
854,
039
912,
723
Phy
sica
l env
ironm
ent
-
-
-
-
-
-
-
-
-
58
5,46
8S
treet
s-
-
-
-
-
-
-
-
-
-
Par
ks a
nd re
crea
tion
344,
518
381,
349
408,
222
411,
319
367,
023
386,
722
403,
475
484,
522
42
0,43
3
43
9,30
9E
duca
tiona
l pro
gram
s14
8,34
5
22
2,42
1
10
3,05
6
-
-
-
-
-
-
-
Ope
ratin
g gr
ants
and
con
tribu
tions
4,96
6,61
7
3,76
5,20
4
6,24
8,36
5
852,
024
690,
449
1,08
9,23
9
2,96
8,83
9
1,56
9,65
1
68
6,30
3
2,
588,
430
Cap
ital g
rant
s an
d co
ntrib
utio
ns11
2,48
5
55
,586
-
-
-
-
-
-
116,
124
62,4
21To
tal g
over
nmen
tal a
ctiv
ities
pro
gram
reve
nues
14,3
30,0
35
13
,379
,091
16
,276
,473
10
,915
,712
11
,529
,182
11,3
54,0
28
13
,530
,428
13
,033
,151
12,2
07,7
02
15,5
74,0
87
Bus
ines
s-ty
pe a
ctiv
ities
:C
harg
es fo
r ser
vice
s:W
ater
and
sew
er6,
814,
323
7,
226,
400
7,
800,
845
7,
653,
950
7,
375,
404
9,
308,
074
10
,728
,291
10
,622
,041
11,6
64,4
25
11,3
33,2
36S
torm
wat
er52
3,73
0
52
0,48
4
53
7,72
3
53
2,00
8
63
2,93
3
73
4,87
8
47
9,21
1
68
7,71
7
730,
767
723,
343
Ope
ratin
g gr
ants
and
con
tribu
tions
-
-
-
-
-
-
-
-
-
-
C
apita
l gra
nts
and
cont
ribut
ions
-
-
308,
285
21,7
02
764,
562
-
-
-
-
60
0,38
8To
tal b
usin
ess-
type
act
iviti
es p
rogr
am re
venu
es7,
338,
053
7,
746,
884
8,
646,
853
8,
207,
660
8,
772,
899
10
,042
,952
11,2
07,5
02
11,3
09,7
58
12
,395
,192
12
,656
,967
Tota
l prim
ary
gove
rnm
ent p
rogr
am re
venu
es21
,668
,088
$
21,1
25,9
75$
24
,923
,326
$
19,1
23,3
72$
20
,302
,081
$
21,3
96,9
80$
24
,737
,930
$
24,3
42,9
09$
24,6
02,8
94$
28
,231
,054
$
Fisc
al Y
ear E
nded
Sep
tem
ber 3
0,

69
City
of N
orth
Lau
derd
ale,
Flo
rida
C
hang
e in
Net
Pos
ition
Sch
edul
e 2
(Con
tinue
d)
Last
Ten
Fis
cal Y
ears
(a
ccru
al b
asis
of a
ccou
ntin
g)
2004
2005
2006
2007
2008
2009
2010
2011
2012
2013
Net
(exp
ense
) / re
venu
eG
over
nmen
tal a
ctiv
ities
(11,
794,
430)
$
(14,
768,
965)
$
(15,
648,
073)
$
(14,
676,
853)
$
(13,
656,
581)
$
(14,
140,
094)
$
(14,
779,
988)
$
(14,
686,
973)
$
(1
4,90
6,75
8)$
(1
3,83
0,02
1)$
B
usin
ess-
type
act
iviti
es70
2,58
9
54
1,56
9
91
9,96
0
55
9,85
0
1,
188,
481
2,
272,
595
2,
186,
130
2,
470,
322
3,24
1,56
3
3,76
2,39
1To
tal p
rimar
y go
vern
men
t net
exp
ense
(11,
091,
841)
$
(14,
227,
396)
$
(14,
728,
113)
$
(14,
117,
003)
$
(12,
468,
100)
$
(11,
867,
499)
$
(12,
593,
858)
$
(12,
216,
651)
$
(1
1,66
5,19
5)$
(1
0,06
7,63
0)$
Gen
eral
Rev
enue
s an
d O
ther
Cha
nges
in
Net
Pos
ition
Gov
ernm
enta
l act
iviti
es:
Taxe
sP
rope
rty ta
xes
5,19
0,07
1$
6,35
5,65
8$
$7,3
09,0
20$9
,958
,875
$10,
055,
593
$10,
142,
849
$9,4
60,6
14$7
,196
,498
$7,1
54,4
806,
789,
514
$
U
tility
taxe
s3,
084,
779
3,
265,
487
3,
388,
368
3,46
8,39
13,
758,
932
3,40
9,50
33,
576,
677
3,53
8,82
73,
546,
402
2,42
1,23
4Fr
anch
ise
fees
2,04
9,76
4
2,13
4,69
2
2,43
8,81
82,
608,
168
2,71
7,42
92,
661,
513
2,50
0,95
92,
512,
409
2,50
9,17
42,
373,
523
Unr
estri
cted
gra
nts
and
cont
ribut
ions
4,37
3,80
3
4,55
9,16
7
4,76
2,10
34,
608,
001
4,36
9,59
33,
998,
584
3,97
8,75
84,
058,
165
4,17
4,95
04,
067,
481
Inte
rest
inco
me
270,
273
455,
323
864,
993
1,50
6,32
562
6,02
676
,544
338,
198
112,
646
205,
817
22,3
25M
isce
llane
ous
23,5
00
-
-
-
-
-
-
-
-
25
,759
Con
tribu
tion
of c
apita
l ass
ets
-
-
-
-
-
-
-
-
-
-
Tr
ansf
ers
-
-
-
-
-
-
(350
,000
)
-
-
-
Tota
l gov
ernm
enta
l act
iviti
es
14,9
92,1
90
16
,770
,327
18
,763
,302
22
,149
,760
21
,527
,573
20,2
88,9
93
19
,505
,206
17
,418
,545
17,5
90,8
23
15,6
99,8
36
Bus
ines
s-ty
pe a
ctiv
ities
:U
nres
trict
ed g
rant
s an
d co
ntrib
utio
ns-
-
-
-
-
-
-
-
-
-
Inte
rest
inco
me
127,
651
165,
614
323,
729
409,
475
176,
810
18,3
27
112,
753
46,5
63
11
5,81
6
2,
110
Con
tribu
tion
of c
apita
l ass
ets
-
-
-
-
-
-
-
-
-
-
Tr
ansf
ers
-
-
-
-
-
-
350,
000
-
-
-
To
tal b
usin
ess-
type
act
iviti
es
127,
651
165,
614
323,
729
409,
475
176,
810
18,3
27
462,
753
46,5
63
11
5,81
6
2,
110
Tota
l prim
ary
gove
rnm
ent
15,1
19,8
41$
16
,935
,941
$
19,0
87,0
31$
22
,559
,235
$
21,7
04,3
83$
20
,307
,320
$
19,9
67,9
59$
17
,465
,108
$
17
,706
,639
$
15,7
01,9
46$
Cha
nge
in N
et P
ositi
onG
over
nmen
t act
iviti
es3,
197,
760
$
2,
001,
362
$
3,
115,
229
$
7,
472,
907
$
7,
870,
992
$
6,
148,
899
$
4,
725,
218
$
2,
731,
572
$
2,68
4,06
5$
1,86
9,81
5$
Bus
ines
s-ty
pe a
ctiv
ities
830,
240
707,
183
1,24
3,68
9
969,
325
1,36
5,29
1
2,29
0,92
2
2,64
8,88
3
2,51
6,88
5
3,
357,
379
3,
764,
501
To
tal p
rimar
y go
vern
men
t4,
028,
000
$
2,
708,
545
$
4,
358,
918
$
8,
442,
232
$
9,
236,
283
$
8,
439,
822
$
7,
374,
101
$
5,
248,
457
$
6,04
1,44
4$
5,63
4,31
6$
Fisc
al Y
ear E
nded
Sep
tem
ber 3
0,

70
City
of N
orth
Lau
derd
ale,
Flo
rida
Sch
edul
e 3
Gov
ernm
enta
l Act
iviti
es T
ax R
even
ues
by S
ourc
e La
st T
en F
isca
l Yea
rs
(acc
rual
bas
is o
f acc
ount
ing)
Fisc
al Y
ear
Tax
Ende
dR
oll
Prop
erty
Util
ityFr
anch
ise
Sept
embe
r 30,
Year
Tax
Tax
Taxe
sTo
tal
2004
2003
5,19
0,07
1$
3,
084,
779
$
2,04
9,76
4$
10
,324
,614
$
2005
2004
6,35
5,65
8
3,
265,
487
2,13
4,69
2
11
,755
,837
2006
2005
7,30
9,02
0
3,
388,
368
2,43
8,81
8
13
,136
,206
2007
2006
9,95
8,87
5
3,
468,
391
2,60
8,16
8
16
,035
,434
2008
2007
10,0
55,5
93
3,75
8,93
2
2,
717,
429
16,5
31,9
54
2009
2008
10,1
42,8
49
3,40
9,50
3
2,
661,
513
16,2
13,8
65
2010
2009
9,46
0,61
4
3,
576,
677
2,50
0,95
9
15
,538
,250
2011
2010
7,19
6,49
8
3,
538,
827
2,51
2,40
9
13
,247
,734
2012
2011
7,15
4,48
0
3,
546,
402
2,50
9,17
4
13
,210
,056
2013
2012
6,78
9,51
4
2,
421,
234
2,37
3,52
3
11
,584
,271

71
City
of N
orth
Lau
derd
ale,
Flo
rida
Sch
edul
e 4
Fu
nd B
alan
ce o
f Gov
ernm
enta
l Fun
ds
Last
Ten
Fis
cal Y
ears
(m
odifi
ed a
ccru
al b
asis
of a
ccou
ntin
g) 20
0420
0520
0620
0720
0820
0920
1020
1120
1220
13
Gen
eral
Fun
d
Res
erve
d73
6,41
9$
1,73
9,34
9$
71
4,25
7$
58,1
81$
2,
297,
146
$
2,72
5,86
1$
109,
143
$
-$
-
$
-$
Unr
eser
ved
7,51
3,36
5
7,
092,
373
9,11
2,48
9
15
,367
,383
18,3
16,4
58
21
,621
,646
27,3
20,0
79
-
-
-
Non
spen
dabl
e-
-
-
-
-
-
-
115,
544
-
-
Assi
gned
-
-
-
-
-
-
-
3,
258,
113
3,20
7,31
1
3,20
7,31
1
Una
ssig
ned
-
-
-
-
-
-
-
26
,621
,314
24,6
86,7
43
27
,145
,191
Tota
l gov
ernm
enta
l act
iviti
es n
et a
sset
s8,
249,
784
$
8,83
1,72
2$
9,
826,
746
$
15,4
25,5
64$
20
,613
,604
$
24,3
47,5
07$
27
,429
,222
$
29,9
94,9
71$
27
,894
,054
$
30,3
52,5
02$
All
othe
r gov
ernm
enta
l fun
dsR
eser
ved1
6,45
5,27
6$
6,
213,
577
$
6,01
2,78
6$
2,
347,
526
$
1,30
7,85
3$
1,
040,
375
$
20
,840
$
-$
-
$
-$
U
nres
erve
d1 , rep
orte
d in
:
Spe
cial
reve
nue
fund
s1,
521,
770
790,
938
1,
720,
058
2,27
2,88
4
3,
115,
422
1,63
5,20
1
2,55
3,53
4
-
-
-
Cap
ital p
roje
cts
fund
s1,
477,
818
2,63
3,03
3
2,
821,
376
3,26
2,12
2
1,
895,
238
4,55
3,84
0
6,05
8,44
1
-
-
-
Per
man
ent f
unds
287,
512
37
4,66
9
23,6
99
-
-
-
-
-
-
-
Non
spen
dabl
e-
-
-
-
-
-
-
24,3
90
-
-
Res
trict
ed-
-
-
-
-
-
-
-
3,
607,
006
3,
750,
171
Com
mitt
ed-
-
-
-
-
-
-
-
16
2,86
6
88
,186
Assi
gned
-
-
-
-
-
-
-
9,
198,
807
5,24
8,75
6
4,58
0,30
4
Tota
l all
othe
r gov
ernm
enta
l fun
ds9,
742,
376
$
10,0
12,2
17$
10,5
77,9
19$
7,88
2,53
2$
6,
318,
513
$
7,22
9,41
6$
8,63
2,81
5$
9,22
3,19
7$
9,
018,
628
$
8,
418,
661
$
1 Due
to G
AS
B 5
4, e
ffect
ive
fisca
l yea
r 201
1, th
e re
serv
ed a
nd u
nres
erve
d co
mpo
nent
s ar
e no
long
er a
pplic
able
Sept
embe
r 30,

72
City
of N
orth
Lau
derd
ale,
Flo
rida
Sc
hedu
le 5
C
hang
es in
Fun
d B
alan
ce o
f Gov
ernm
enta
l Fun
ds
Last
Ten
Fis
cal Y
ears
(m
odifi
ed a
ccru
al b
asis
of a
ccou
ntin
g)
2004
2005
2006
2007
2008
2009
2010
2011
2012
2013
Rev
enue
s
Taxe
s8,
274,
850
$
9,62
1,14
5$
10
,697
,388
$
13,4
27,2
66$
13
,740
,531
$
13,9
57,1
09$
13
,202
,427
$
10,9
50,7
84$
10
,894
,402
$
10,3
65,8
10$
Fran
chis
e ta
xes
2,04
9,76
4
2,
134,
692
2,43
8,81
8
2,
608,
168
2,71
7,42
9
2,
661,
513
2,50
0,95
9
2,
512,
409
2,50
9,17
4
2,
373,
523
Lice
nses
and
per
mits
593,
670
72
8,74
6
1,27
4,50
4
96
3,22
0
777,
181
46
5,68
3
391,
810
45
3,63
4
572,
767
75
0,52
9
Inte
rgov
ernm
enta
l9,
424,
820
8,28
1,36
8
10
,915
,840
5,30
0,72
4
5,
159,
121
5,11
3,55
6
6,
991,
670
5,68
8,11
7
4,
926,
460
5,58
6,53
5
Cha
rges
for s
ervi
ces
3,98
4,02
0
4,
147,
022
4,29
5,65
0
4,
102,
068
3,65
8,57
8
3,
814,
539
4,06
7,77
5
4,
216,
491
4,35
9,00
6
4,
612,
666
Spec
ial a
sses
smen
ts2,
780,
850
2,91
5,00
6
3,
002,
212
3,78
1,88
5
4,
616,
311
4,86
9,79
5
4,
912,
893
5,18
6,83
3
4,
447,
773
5,33
0,69
9
Fine
s an
d fo
rfeitu
res
337,
480
44
6,91
3
486,
713
53
7,63
9
422,
969
71
8,20
7
762,
239
73
2,50
2
1,00
9,70
0
73
7,34
6
Inte
rest
inco
me
270,
273
45
5,32
3
864,
993
1,
293,
880
626,
026
76
,543
338,
202
11
2,64
6
181,
535
20
,542
Oth
er re
venu
es1,
606,
498
1,41
9,20
2
1,
063,
657
681,
167
1,
037,
436
152,
574
26
5,11
3
598,
280
71
2,58
0
1,49
4,16
1
Tota
l rev
enue
s29
,322
,225
30
,149
,417
35
,039
,775
32,6
96,0
17
32
,755
,582
31,8
29,5
19
33
,433
,088
30,4
51,6
96
29
,613
,397
31,2
71,8
11
Expe
nditu
res
Gen
eral
gov
ernm
ent
3,74
1,45
5
3,
617,
202
4,80
8,22
2
4,
165,
763
3,07
0,20
9
2,
865,
633
2,73
8,78
2
2,
851,
698
2,87
0,88
5
2,
910,
166
Publ
ic s
afet
y10
,546
,852
11
,498
,104
11
,744
,664
12,2
95,3
78
12
,575
,236
13,1
22,4
15
13
,558
,293
13,5
77,3
20
13
,886
,431
13,9
46,2
03
Com
mun
ity d
evel
opm
ent
1,40
2,66
6
1,
516,
912
1,86
7,91
3
1,
914,
307
1,76
5,16
7
1,
860,
045
1,59
2,98
2
1,
724,
272
1,93
0,20
0
2,
157,
239
Phys
ical
env
ironm
ent
1,06
2,24
7
1,
049,
041
4,07
5,44
3
1,
400,
913
1,62
4,32
2
1,
666,
998
1,92
1,66
9
1,
851,
914
2,19
7,88
0
3,
473,
453
Stre
ets
680,
839
64
0,87
8
699,
613
62
1,40
5
685,
978
83
7,11
1
834,
630
87
8,34
0
1,08
9,51
7
99
8,10
2
Park
s an
d re
crea
tion
3,36
9,43
4
3,
678,
005
3,65
1,09
8
3,
472,
463
3,19
0,33
0
3,
385,
773
3,53
0,28
0
3,
555,
359
3,85
0,45
6
3,
858,
987
Educ
atio
nal p
rogr
ams
4,06
2,02
1
3,
903,
031
3,20
0,75
6
3,
000
-
-
-
-
-
-
Hum
an S
ervi
ces
-
-
-
-
-
-
2,64
6,42
9
56
6,28
3
-
-
Cap
ital o
utla
y3,
358,
192
1,44
6,85
2
1,
499,
203
3,86
8,28
7
4,
173,
653
1,35
9,18
6
11
7,97
1
1,26
5,23
9
1,
278,
429
1,35
4,03
7
Deb
t ser
vice
:
Prin
cipa
l1,
190,
998
1,27
5,63
0
1,
344,
951
1,41
0,72
1
1,
463,
913
1,56
6,60
1
1,
192,
945
598,
271
4,
180,
538
150
8,87
5
Inte
rest
629,
665
77
6,75
9
693,
087
64
0,34
9
582,
753
52
0,95
1
463,
993
42
6,86
9
634,
547
20
6,26
8
Tota
l exp
endi
ture
s30
,044
,369
29
,402
,414
33
,584
,950
29,7
92,5
86
29
,131
,561
27,1
84,7
13
28
,597
,974
27,2
95,5
65
31
,918
,883
29,4
13,3
30
Sept
embe
r 30,

73
City
of N
orth
Lau
derd
ale,
Flo
rida
C
hang
es in
Fun
d B
alan
ce o
f Gov
ernm
enta
l Fun
ds
Sch
edul
e 5
(Con
tinue
d)
Last
Ten
Fis
cal Y
ears
(m
odifi
ed a
ccru
al b
asis
of a
ccou
ntin
g)
Exc
ess
of re
venu
es
over
/ (u
nder
) exp
endi
ture
s(7
22,1
44)
74
7,00
3
1,45
4,82
5
2,
903,
431
3,62
4,02
1
4,
644,
806
4,83
5,11
4
3,
156,
131
(2,3
05,4
86)
1,85
8,48
1
Oth
er fi
nanc
ing
sour
ces
(use
s)
Tran
sfer
s in
5,05
4,36
5
5,
116,
427
5,98
6,48
3
4,
078,
648
3,64
7,19
0
5,
862,
374
2,54
8,23
3
2,
158,
393
6,13
4,61
4
2,
463,
542
Tran
sfer
s ou
t(4
,804
,365
)
(5
,116
,427
)
(5
,986
,483
)
(4
,078
,648
)
(3
,647
,190
)
(5
,862
,374
)
(2
,898
,233
)
(2
,158
,393
)
(6
,134
,614
)
(2
,463
,542
)
Issu
ance
of d
ebt
4,88
3,80
3
10
4,77
6
105,
901
-
-
-
-
-
-
-
Sale
of c
apita
l ass
ets
-
-
-
-
-
-
-
-
-
-
Tota
l oth
er fi
nanc
ing
sour
ces
(use
s)5,
133,
803
104,
776
10
5,90
1
-
-
-
(3
50,0
00)
-
-
-
Net
cha
nge
in fu
nd b
alan
ces
4,41
1,65
9$
85
1,77
9$
1,56
0,72
6$
2,
903,
431
$
3,62
4,02
1$
4,
644,
806
$
4,48
5,11
4$
3,
156,
131
$
(2,3
05,4
86)
$
1,85
8,48
1$
Deb
t ser
vice
as
a pe
rcen
tage
of
non-
capi
tal e
xpen
ditu
res
6.82
%7.
34%
6.35
%7.
91%
8.20
%8.
08%
5.82
%3.
94%
15.7
1%1
2.55
%
1 In
crea
se d
ue to
def
easa
nce
of 2
004
Gen
eral
Obl
igat
ion
Bon
ds.

74
City
of N
orth
Lau
derd
ale,
Flo
rida
Sc
hedu
le 6
Ass
esse
d Va
lue
and
Estim
ated
Act
ual V
alue
of T
axab
le P
rope
rty
Last
Ten
Yea
rs
Tota
lE
stim
ated
Ass
esse
dF
isca
l Yea
rTa
xL
ess:
Tota
l Tax
able
Dir
ect
Act
ual
Val
ue
as a
E
nd
edR
oll
Rea
lP
erso
nal
Tax
Exe
mp
tA
sses
sed
Ta
x Ta
xab
leP
erce
nta
ge
of
Sep
tem
ber
30,
Yea
rP
rop
erty
Pro
per
tyR
eal P
rop
erty
Val
ue
Rat
eV
alu
eA
ctu
al V
alu
e
2004
2003
1,33
4,60
1,70
0$
45
,243
,677
$
44
2,46
9,21
0$
937,
376,
167
$
5.
7982
1,59
8,85
4,07
2$
58.6
28%
2005
2004
1,52
2,07
1,68
0
55
,888
,732
49
1,52
2,61
0
1,08
6,43
7,80
2
6.
0893
1,83
1,24
2,78
5
59.3
28%
2006
2005
1,86
1,25
5,27
0
55
,156
,589
63
2,98
2,62
0
1,28
3,42
9,23
9
6.
0211
2,21
5,34
7,51
4
57.9
34%
2007
2006
2,32
6,96
5,61
0
54
,076
,344
83
7,55
8,76
5
1,54
3,48
3,18
9
6.
7141
2,74
2,59
9,72
8
56.2
78%
2008
2007
2,57
0,82
8,46
0
57
,645
,797
83
5,87
4,82
0
1,79
2,59
9,43
7
5.
7737
3,02
6,20
6,51
7
59.2
36%
2009
2008
2,40
6,27
3,07
0
56
,207
,371
81
4,84
5,71
6
1,64
7,63
4,72
5
6.
4323
2,83
6,59
6,43
6
58.0
85%
20
1020
091,
888,
697,
840
54,4
33,0
46
557,
660,
249
1,
385,
470,
637
7.15
482,
245,
216,
720
61
.708
%
2011
2010
1,52
3,47
7,61
0
52
,486
,193
54
0,42
0,98
1
1,03
5,54
2,82
2
7.
2347
1,82
6,65
3,99
9
56.6
91%
20
1220
111,
401,
570,
920
57,9
28,6
30
505,
508,
668
95
3,99
0,88
2
7.75
041,
698,
019,
009
56
.183
%
2013
2012
1,35
6,04
6,28
0
57
,198
,461
48
7,96
9,44
8
925,
275,
293
7.
6078
1,64
4,95
8,88
4
56.2
49%
Sou
rce:
Bro
war
d C
ount
y P
rope
rty
App
rais
er F
orm
DR
-403
Not
e:P
rope
rty
in th
e C
ount
y is
rea
sses
sed
annu
ally
. T
he C
ount
y as
sess
es p
rope
rty
at a
ppro
xim
atel
y 88
% a
nd 5
5% o
f act
ual v
alue
for
real
and
pe
rson
al p
rope
rty
resp
ectiv
ely.
Est
imat
ed a
ctua
l tax
able
val
ue is
cal
cula
ted
by d
ivid
ing
asse
ssed
val
ue b
y th
ose
perc
enta
ges.
Tax
rat
es a
re p
er $
1,00
0 of
ass
esse
d va
lue.

75
City
of N
orth
Lau
derd
ale,
Flo
rida
Prop
erty
Tax
Rat
es- D
irect
and
Ove
rlapp
ing
Gov
ernm
ents
Sche
dule
7
(P
er $
1,00
0 of
Ass
esse
d Va
lue)
La
st T
en F
isca
l Yea
rs
Ove
rlapp
ing
Rat
esB
row
ard
Cou
nty
Nor
thFl
orid
aTo
tal
Fisc
al Y
ear
Tax
Deb
tTo
tal
Bro
war
dSc
hool
Wat
erB
row
ard
Chi
ldre
n's
Inla
ndD
irect
&En
ded
Rol
lO
pera
ting
Serv
ice
City
C
ount
yD
istr
ict
Man
agem
ent
Hos
pita
lSe
rvic
esN
avig
atio
nal
Ove
rlapp
ing
Sept
embe
r 30,
Year
Mill
age
Mill
age
Mill
age
Mill
age
Mill
age
Dis
tric
tD
istr
ict
Boa
rdD
istr
ict
Rat
es
2004
2003
5.67
920.
1190
5.79
827.
1880
8.41
760.
6970
2.50
000.
3920
0.03
8525
.031
3
2005
2004
5.67
920.
4101
6.08
937.
0230
8.26
950.
6970
2.48
030.
4231
0.03
8525
.020
7
2006
2005
5.67
920.
3419
6.02
116.
7830
8.06
230.
6970
2.17
460.
4231
0.03
8524
.199
6
2007
2006
6.42
920.
2849
6.71
416.
0661
7.86
870.
6970
1.83
170.
4073
0.03
8523
.623
4
2008
2007
5.53
070.
2430
5.77
375.
2868
7.64
840.
6240
1.62
550.
3572
0.03
4521
.350
1
2009
2008
6.18
750.
2448
6.43
235.
3145
7.41
700.
6240
1.70
590.
3754
0.03
4521
.903
6
2010
2009
6.91
850.
2363
7.15
485.
3889
7.43
100.
6240
1.70
590.
4243
0.03
4522
.763
4
2011
2010
6.91
850.
3162
7.23
475.
5530
7.63
100.
6240
1.87
500.
4696
0.03
4523
.421
8
2012
2011
7.40
660.
3438
7.75
045.
5530
7.41
800.
4363
1.87
500.
4789
0.03
4523
.546
1
2013
2012
7.60
780.
0000
7.60
785.
5530
7.45
600.
4289
1.85
640.
4902
0.03
4523
.426
8
City
of N
orth
Lau
derd
ale

76
City
of N
orth
Lau
derd
ale,
Flo
rida
S
ched
ule
8 Pr
inci
pal P
rope
rty
Taxp
ayer
s
Cur
rent
and
Nin
e Ye
ars
Ago
Perc
enta
ge o
fPe
rcen
tage
of
Taxa
ble
Tota
l Tax
able
Taxa
ble
Tota
l Tax
able
Ass
esse
dA
sses
sed
Ass
esse
dA
sses
sed
Taxp
aye r
Type
of B
usin
ess
Valu
e1R
ank
Valu
eVa
lue
Ran
kVa
lue
7900
Ham
pton
Blv
d LL
CR
enta
l Apa
rtmen
ts38
,156
,756
$
1
4.12
% G
rana
da a
t Nor
th L
aude
rdal
e LL
PR
enta
l Apa
rtmen
ts24
,917
,950
2
2.69
%
WR
PV
XI L
akev
iew
Lau
derd
ale
LLC
Ren
tal A
partm
ents
22,6
58,6
70
32.
45%
Ham
pton
Pla
ce J
oint
Ven
ture
Ren
tal A
partm
ents
22,5
62,2
85
42.
44%
25,3
63,9
26
42.
71%
H
ampt
on L
akes
Ass
ocia
tes
Ren
tal A
partm
ents
20,1
07,0
43
52.
17%
32,2
29,5
47
23.
44%
C
H R
ealty
III/C
ypre
ss L
PR
enta
l Apa
rtmen
ts25
,102
,930
6
2.71
%17
,047
,730
7
1.82
%
Flor
ida
Pow
er &
Lig
ht C
ompa
nyP
ublic
Util
ity C
ompa
ny18
,031
,399
7
1.95
% Th
e A
nsw
er G
roup
Inc.
Cal
l Ser
vice
Cen
ter
16,9
83,6
80
81.
84%
28,2
68,6
20
33.
02%
S
anct
uary
Cov
e As
soci
ates
, LTD
Ren
tal A
partm
ents
14,0
93,9
54
91.
52%
Wal
-Mar
t Sto
res
East
LP
Com
mer
cial
13,8
98,7
20
101.
50%
Par
rots
Lan
ding
Pha
se I
& II
Ren
tal A
partm
ents
30,6
79,8
18
13.
27%
Th
e B
elm
ont a
t Nor
th L
aude
rdal
eR
enta
l Apa
rtmen
ts18
,732
,970
5
2.00
%
Impe
rial V
illag
e of
Bro
war
d, L
tdR
enta
l Apa
rtmen
ts17
,882
,150
6
1.91
%
Sto
nerid
ge A
partm
ents
, IN
CR
enta
l Apa
rtmen
ts14
,989
,950
8
1.60
%
Cro
ss K
ey A
ssoc
Ren
tal A
partm
ents
14,8
56,1
86
91.
58%
Sus
a P
artn
ersh
ip L
P/N
ew P
lan
Rea
lty T
rust
Com
mer
cial
13,8
01,8
80
101.
47%
Tot
als
216,
513,
387
$
23.4
0%21
3,85
2,77
7$
22
.81%
1 The
se ta
xes
are
from
the
2012
tax
roll,
due
no
late
r tha
n M
arch
31,
201
3.S
ourc
e: B
row
ard
Cou
nty
Rev
enue
Col
lect
or.
2013
2004

77
City
of N
orth
Lau
derd
ale,
Flo
rida
Sch
edul
e 9
Prop
erty
Tax
Lev
ies
and
Col
lect
ions
La
st T
en Y
ears
Fisc
al Y
ear
Tax
Tota
l Tax
Col
lect
ed w
ithin
the
Fisc
alC
olle
ctio
ns in
En
ded
Rol
lLe
vy fo
rYe
ar o
f the
Lev
ySu
bseq
uent
To
tal C
olle
ctio
ns to
Dat
eSe
ptem
ber 3
0Ye
arFi
scal
Yea
r1,2
Am
ount
% o
f Lev
yYe
ars
Am
ount
% o
f Lev
y
2004
2003
5,04
1,35
9$
5,
182,
356
$
10
2.80
%7,
715
$
5,
190,
071
$
10
2.95
%
2005
2004
6,23
1,07
7
6,
315,
655
10
1.36
%40
,004
6,35
5,65
9
102.
00%
2006
2005
7,35
7,89
4
7,
281,
946
98
.97%
27,0
74
7,
309,
020
99
.34%
2007
2006
9,84
3,10
8
9,
941,
350
10
1.00
%17
,525
9,95
8,87
5
101.
18%
2008
2007
9,91
6,19
9
10
,053
,247
10
1.38
%2,
346
10
,055
,593
10
1.41
%
2009
2008
10,0
23,0
93
9,88
6,49
9
98.6
4%25
6,35
1
10,1
42,8
50
101.
19%
2010
2009
9,45
4,59
6
9,
449,
377
99
.94%
11,2
37
9,
460,
614
10
0.06
%
2011
2010
7,10
9,63
9
7,
196,
498
10
1.22
%-
7,19
6,49
8
101.
22%
2012
2011
7,11
6,22
3
7,
154,
481
10
0.54
%-
7,15
4,48
1
100.
54%
2013
2012
6,76
9,59
4
6,
789,
514
10
0.29
%-
6,78
9,51
4
100.
29%
¹In
clud
es g
ener
al a
nd d
ebt s
ervi
ce fu
nds
net o
f an
allo
wab
le d
isco
unt o
f app
roxi
mat
ely
4% fo
r ear
ly p
aym
ent.
How
ever
, not
all
colle
ctio
ns in
clud
e av
aila
ble
early
pay
men
t 4%
dis
coun
t2 S
ourc
e: F
lorid
a D
epar
tmen
t of R
even
ue D
R-4
20s

78
City
of N
orth
Lau
derd
ale,
Flo
rida
Sche
dule
10
Rat
io o
f Out
stan
ding
Deb
t by
Type
La
st T
en Y
ears
Bus
ines
s-Ty
peG
over
nmen
tal A
ctiv
ities
Act
iviti
es
Gen
eral
Cap
ital
Impr
ovem
ent
Oth
erW
ater
and
Sew
erTo
tal
Perc
enta
ge
Obl
igat
ion
Rev
enue
C
apita
lD
ebt
Rev
enue
Pr
imar
y of
Per
sona
lPe
rSe
ptem
ber 3
0B
onds
Bon
dsLe
ases
Paya
ble
Bon
dsG
over
nmen
tIn
com
e1C
apita
1
2004
4,95
0,00
0$
11
,455
,408
$
878,
192
$
-$
76
8,38
0$
18
,051
,980
$
3.
94%
448.
15
2005
4,81
0,00
0
10
,538
,303
764,
443
-
63
8,46
9
16
,751
,215
3.
65%
415.
86
2006
4,61
0,00
0
9,
583,
784
67
9,91
2
-
504,
363
15,3
78,0
59
3.36
%38
1.77
2007
4,40
0,00
0
8,
590,
315
1,
178,
222
-
365,
935
14,5
34,4
72
3.17
%36
0.83
2008
4,18
5,00
0
7,
556,
273
86
1,83
6
-
223,
038
12,8
26,1
47
2.80
%31
8.42
2009
3,96
0,00
0
6,
479,
968
-
-
75,5
30
10
,515
,498
2.
29%
261.
05
2010
3,83
0,00
0
5,
417,
023
-
-
-
9,
247,
023
2.02
%22
9.56
2011
3,69
5,00
0
4
,953
,752
-
-
-
8,
648,
752
1.26
%21
0.83
2012
-
4,4
68,2
14
-
-
-
4,46
8,21
4
0.
65%
108.
92
2013
-
3,9
59,3
39
-
-
-
3,95
9,33
9
0.
58%
96.5
2
¹Se
e Ta
ble
15 fo
r Sch
edul
e of
Dem
ogra
phic
s an
d Ec
onom
ic S
tatis
tics
for p
erso
nal i
ncom
e an
d po
pula
tion
data
.

79
City
of N
orth
Lau
derd
ale,
Flo
rida
Sch
edul
e 11
R
atio
of G
ener
al B
onde
d D
ebt O
utst
andi
ng
Last
Ten
Yea
rs
Perc
enta
ge o
fEs
timat
edFi
scal
Yea
rA
sses
sed
Gen
eral
Less
: Am
ount
sA
ctua
l Tax
able
Ende
dVa
lue
Bon
ded
Ava
ilabl
e in
Deb
tVa
lue
ofPe
rSe
ptem
ber 3
0Po
pula
tion1
(in th
ousa
nds)
Deb
t2Se
rvic
e Fu
ndTo
tal
Prop
erty
Cap
ita
2004
40,2
8193
7,37
6$
4,
950,
000
$
-
$
4,
950,
000
$
0.
53%
122.
89
2005
40,9
251,
086,
438
4,
810,
000
27
,011
4,
782,
989
0.
44%
116.
87
2006
41,5
841,
283,
429
4,
610,
000
27
,200
4,
582,
800
0.
36%
110.
21
2007
42,2
691,
543,
483
4,
400,
000
33
,547
4,
366,
453
0.
28%
103.
30
2008
42,2
871,
792,
599
4,
185,
000
44
,881
4,
140,
119
0.
23%
97.9
1
2009
41,3
101,
647,
635
3,
960,
000
19
,116
3,
940,
884
0.
24%
95.4
0
2010
41,0
231,
385,
471
3,
830,
000
20
,839
3,
809,
161
0.
27%
92.8
5
2011
41,2
481,
035,
543
3,
695,
000
24
,390
3,
670,
610
0.
35%
88.9
9
2012
41,8
3295
3,99
1
-
-
-
0.00
%-
2013
42,4
1392
5,27
5
-
-
-
0.00
%-
Not
e: D
etai
ls re
gard
ing
the
City
's o
utst
andi
ng d
ebt c
an b
e fo
und
in th
e no
tes
to th
e fin
anci
al s
tate
men
ts.
1 Sou
rce:
Loc
al G
over
nmen
t Fin
anci
al In
form
atio
n H
andb
ook
2 Inc
lude
s al
l lon
g-te
rm d
ebt p
ledg
ed b
y th
e C
ity's
pro
perty
taxe
s (G
ener
al O
blig
atio
n B
onde
d D
ebt).

80
City of North Lauderdale, Florida Schedule 12
Direct and Overlapping Governmental Activity Debt September 30, 2013
PercentageNet Applicable Estimated
Bonded to City of Share of Debt North Overlapping
Governmental Unit Outstanding Lauderdale 3 Debt
Debt repaid with property taxes:
Broward County 322,785,000$ 1 0.73% 2,354,265$
Broward County School District - 2 - Subtotal, Overlapping Debt 2,354,265
City of North Lauderdale Direct Debt -$
Total Direct and Overlapping Debt 2,354,266$
1 Source: Broward County Accounting Division.2 Source: School Board of Broward County Financial Reporting Division. As of June 30, 2013.3 Ratio of net assessed valuation in overlapping unit to that of the City. Net assessed valuation of the City of $925,275,293 and the County's net assessed valuation of $126,861,238,080. Source for the assessed valuation data used to estimate applicable percentage is Broward County Property Appraiser Form DR-422.

81
City
of N
orth
Lau
derd
ale,
Flo
rida
Sche
dule
13
Lega
l Deb
t Mar
gin
Info
rmat
ion
Last
Ten
Yea
rs
2004
2005
2006
2007
2008
2009
2010
2011
2012
2013
Deb
t lim
it13
7,98
4,53
8$
15
7,79
6,04
1$
191,
641,
186
$
23
8,10
4,19
5$
262,
847,
426
$
24
6,24
8,04
4$
194,
313,
089
$
15
7,59
6,38
0$
145,
949,
955
$
141,
324,
474
$
Tota
l net
deb
t app
licab
le to
lim
it4,
950,
000
4,
782,
989
4,
582,
800
4,36
6,45
3
4,
140,
119
3,94
0,88
4
3,
809,
161
3,67
0,61
0
-
-
Lega
l deb
t mar
gin
133,
034,
538
$
153,
013,
052
$
18
7,05
8,38
6$
233,
737,
742
$
25
8,70
7,30
7$
242,
307,
160
$
19
0,50
3,92
8$
153,
925,
770
$
14
5,94
9,95
5$
14
1,32
4,47
4$
Tota
l net
deb
t app
licab
le to
the
limit
as a
per
cent
age
of d
ebt l
imit
3.59
%3.
03%
2.39
%1.
83%
1.58
%1.
60%
1.96
%2.
33%
0.00
%0.
00%
Lega
l Deb
t Mar
gin
Cal
cula
tion
Ass
esse
d V
alue
925,
275,
293
$
Add
bac
k: e
xem
pt re
al p
rope
rty48
7,96
9,44
8
1,41
3,24
4,74
1$
Deb
t lim
it (1
0% o
f tot
al a
sses
sed
valu
e)14
1,32
4,47
4$
Deb
t app
licab
le to
lim
it:
Gen
eral
obl
igat
ion
bond
s-
Less
: Am
ount
s se
t asi
de fo
r rep
aym
ent
of g
ener
al o
blig
atio
n de
bt-
Tota
l net
deb
t app
licab
le to
lim
it-
Le
gal d
ebt m
argi
n14
1,32
4,47
4$
Not
e: U
nder
sta
te fi
nanc
ial l
aw, t
he C
ity o
f Nor
th L
aude
rdal
e's
outs
tand
ing
gene
ral o
blig
atio
n de
bt s
houl
d no
t exc
eed
10%
of t
otal
ass
esse
d pr
oper
ty v
alue
. B
y la
w, t
he g
ener
al
oblig
atio
n de
bt s
ubje
ct to
the
limita
tion
may
be
offs
et b
y am
ount
s se
t asi
de fo
r rep
ayin
g ge
nera
l obl
igat
ion
bond
s.
Sept
embe
r 30,

82
City
of N
orth
Lau
derd
ale,
Flo
rida
Sch
edul
e 14
Pl
edge
d R
even
ue C
over
age
Last
Ten
Yea
rs
Se
wer
Rev
enue
Bon
dsFi
scal
Yea
rW
ater
Less
:N
et
Ende
dC
harg
es
Ope
ratin
gA
vaila
ble
Deb
t Ser
vice
Sept
embe
r 30,
And
Oth
er1
Expe
nses
2R
even
uePr
inci
pal
Inte
rest
Cov
erag
e
2004
6,93
1,26
1$
6,14
3,06
3$
78
8,19
8$
768,
380
$
70,1
68$
94%
2005
7,35
5,70
5
6,35
2,12
1
1,
003,
584
638,
469
47,6
16
146%
2006
8,39
7,39
0
6,82
5,73
3
1,
571,
657
504,
366
29,2
56
295%
2007
8,03
5,52
9
6,63
7,95
4
1,
397,
575
365,
935
15,2
23
367%
2008
7,55
8,26
1
6,76
8,76
6
78
9,49
5
223,
038
5,65
7
34
5%
2009
9,32
4,20
5
6,80
7,99
7
2,
516,
208
75,5
30
702
33
01%
2010
10,9
30,4
10
8,
118,
714
2,81
1,69
6
3
3
N/A
2011
3
3
3
3
3
N/A
2012
3
3
3
3
3
N/A
2013
3
3
3
3
3
N/A
1 Tot
al re
venu
e of
the
Util
ities
Fun
d as
repo
rted
in th
e B
asic
Fin
anci
al S
tate
men
ts (i
nclu
sive
of i
nves
tmen
t ear
ning
s).
3 Dur
ing
fisca
l yea
r 201
0, th
e C
ity p
aid
off t
he W
ater
and
Sew
er R
even
ue B
onds
, Ser
ies
2003
.
2 Tot
al o
pera
ting
expe
nses
of t
he U
tiliti
es F
und
as re
porte
d in
the
Bas
ic F
inan
cial
Sta
tem
ents
(exc
lusi
ve o
f int
eres
t exp
ense
and
de
prec
iatio
n).

83
City
of N
orth
Lau
derd
ale,
Flo
rida
S
ched
ule
15
Dem
ogra
phic
and
Eco
nom
ic S
tatis
tics
Last
Ten
Yea
rs
Pers
onal
Per
Bro
war
dFi
scal
Yea
rIn
com
eC
apita
Cou
nty
Ende
d(a
mou
nts
expr
esse
d Pe
rson
al
Med
ian
Scho
olU
nem
ploy
men
tSe
ptem
ber 3
0,Po
pula
tion1
in th
ousa
nds)
2In
com
e2Ag
e2En
rollm
ent3
Rat
e4
2004
40,2
8145
8,33
2$
15
,557
$
30
.5
6,
370
4.5%
2005
40,2
8145
8,33
2
15
,557
30
.5
8,
184
3.5%
2006
40,2
8145
8,33
2
15
,557
30
.5
7,
806
5.8%
2007
40,2
8145
8,33
2
15
,557
30
.5
4,
535
3.8%
2008
40,2
8145
8,33
2
15
,557
30
.5
3,
947
6.4%
2009
40,2
8145
8,33
2
15
,557
30
.5
5,
360
10.9
%
2010
40,2
8145
8,33
2
15
,557
30
.5
5,
654
11.8
%
2011
41,0
2368
7,58
7
16
,667
30
.9
5,
948
10.7
%
2012
41,0
2368
7,58
7
16
,667
30
.9
8,
086
7.5%
2013
41,0
2368
7,58
7
16
,667
30
.9
5
5.8%
1,2
Sour
ce: U
S C
ensu
s Bu
reau
(bas
ed o
n th
e 20
00 a
nd 2
010
cens
us).
3 Sou
rce:
Sch
ool B
oard
of B
row
ard
Cou
nty.
4 Sou
rce:
Sta
te o
f Flo
rida
Agen
cy fo
r Wor
kfor
ce In
nova
tion.
5 Inf
orm
atio
n no
t ava
ilabl
e.
Not
e: P
opul
atio
n, m
edia
n ag
e in
form
atio
n ar
e ba
sed
on s
urve
ys c
ondu
cted
dur
ing
the
last
qua
rter o
f the
cal
enda
r yea
r. P
erso
nal i
ncom
e in
form
atio
n is
a to
tal f
or th
e ye
ar.
Une
mpl
oym
ent r
ate
info
rmat
ion
is a
n ad
just
ed y
early
ave
rage
. Sc
hool
enr
ollm
ent i
s ba
sed
on th
e ce
nsus
at
the
star
t of t
he s
choo
l yea
r.
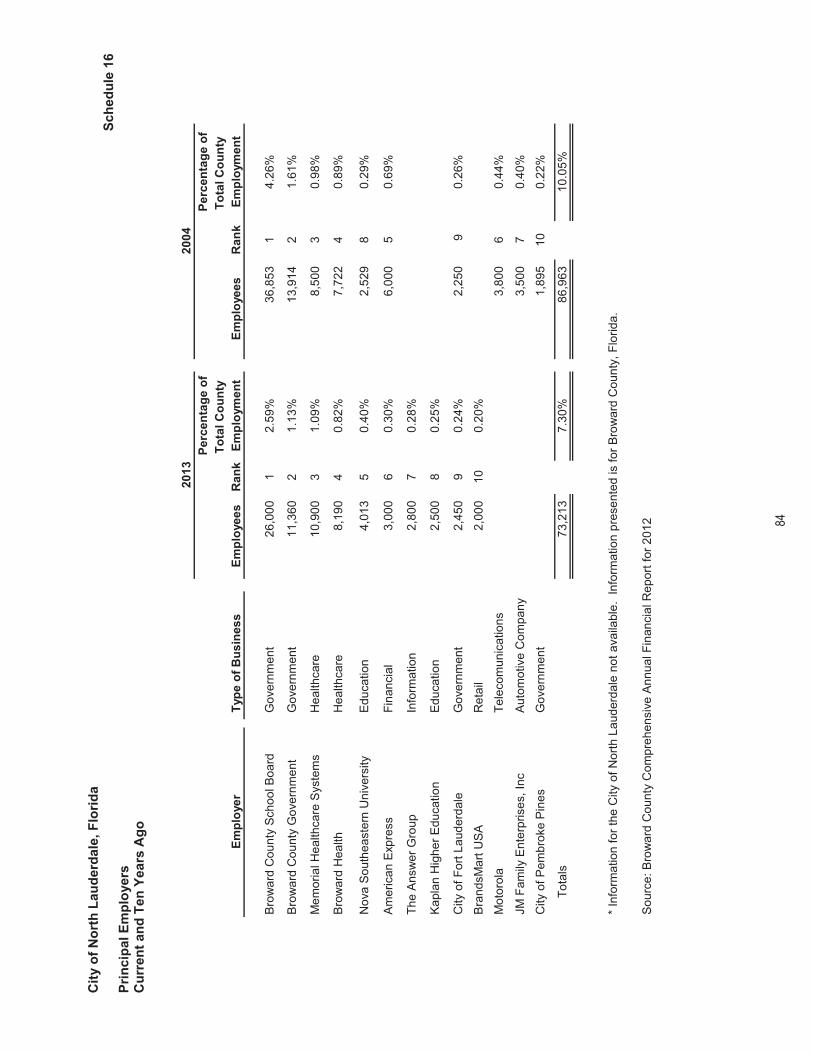
84
City
of N
orth
Lau
derd
ale,
Flo
rida
Sch
edul
e 16
Pr
inci
pal E
mpl
oyer
s C
urre
nt a
nd T
en Y
ears
Ago
Perc
enta
ge o
fPe
rcen
tage
of
Tota
l Cou
nty
Tota
l Cou
nty
Empl
oyer
Type
of B
usin
ess
Empl
oyee
sR
ank
Empl
oym
ent
Empl
oyee
sR
ank
Empl
oym
ent
Bro
war
d C
ount
y Sc
hool
Boa
rdG
over
nmen
t26
,000
12.
59%
36,8
53
1
4.26
%
Bro
war
d C
ount
y G
over
nmen
tG
over
nmen
t11
,360
2
1.
13%
13,9
14
2
1.61
%
Mem
oria
l Hea
lthca
re S
yste
ms
Hea
lthca
re10
,900
3
1.
09%
8,50
0
3
0.98
%
Bro
war
d H
ealth
Hea
lthca
re8,
190
4
0.82
%7,
722
40.
89%
Nov
a S
outh
east
ern
Uni
vers
ityEd
ucat
ion
4,01
3
5
0.
40%
2,52
9
8
0.29
%
Am
eric
an E
xpre
ssFi
nanc
ial
3,00
0
60.
30%
6,00
0
5
0.69
%
The
Ans
wer
Gro
upIn
form
atio
n2,
800
7
0.28
%
Kap
lan
Hig
her E
duca
tion
Educ
atio
n2,
500
8
0.25
%
City
of F
ort L
aude
rdal
eG
over
nmen
t2,
450
9
0.24
%2,
250
9
0.26
%
Bra
ndsM
art U
SA
Ret
ail
2,00
0
100.
20%
Mot
orol
aTe
leco
mun
icat
ions
3,80
0
6
0.44
%
JM F
amily
Ent
erpr
ises
, Inc
Auto
mot
ive
Com
pany
3,50
0
7
0.40
%
City
of P
embr
oke
Pin
esG
over
nmen
t1,
895
100.
22%
T
otal
s73
,213
7.30
%86
,963
10.0
5%
* In
form
atio
n fo
r the
City
of N
orth
Lau
derd
ale
not a
vaila
ble.
Inf
orm
atio
n pr
esen
ted
is fo
r Bro
war
d C
ount
y, F
lorid
a.
Sou
rce:
Bro
war
d C
ount
y C
ompr
ehen
sive
Ann
ual F
inan
cial
Rep
ort f
or 2
012
2013
2004

85
City
of N
orth
Lau
derd
ale,
Flo
rida
Sc
hedu
le 1
7 Fu
ll-Ti
me
Equi
vale
nt C
ity G
over
nmen
t Em
ploy
ees
by F
unct
ion
Last
Ten
Yea
rs
2004
2005
2006
2007
2008
2009
2010
2011
2012
2013
Func
tion
Legi
slat
ive
*14
.0
14
.0
13
.0
13
.0
12
.0
9.
0
9.0
9.
0
9.0
9.
0
Adm
inis
trativ
e **
22.0
22.0
22.0
20.0
14.0
12.0
12.0
12.0
12.0
12.0
Pub
lic W
orks
/Util
ities
43.0
41.0
51.0
54.0
39.0
39.0
43.0
43.0
45.0
45.0
Par
ks &
Rec
reat
ion
42.0
40.0
32.0
25.0
25.0
25.0
22.0
22.0
25.0
25.0
Com
mun
ity D
evel
opm
ent
14.0
14.0
14.0
15.0
15.0
16.0
16.0
16.0
16.0
16.0
Pol
ice
67.0
71.0
71.0
70.0
70.0
70.0
70.0
70.0
64.0
64.0
Fire
/Res
cue
47.0
47.0
47.0
47.0
46.0
45.0
42.0
42.0
45.0
45.0
Nor
th L
aude
rdal
e Ac
adem
y H
igh
S
choo
l***
49.0
50.0
46.0
-
-
-
-
-
-
-
T
otal
298.
0
299.
0
296.
0
2
44.0
221
.0
2
16.0
214
.0
2
14.0
216
.0
2
16.0
* L
egis
lativ
e in
clud
es C
ity C
omm
issi
on, C
ity M
anag
er, C
ity C
lerk
and
City
Atto
rney
.**
Adm
inis
tratio
n in
clud
es H
uman
Res
ourc
es a
nd F
inan
ce D
epar
tmen
ts a
nd In
form
atio
n Te
chno
logy
Div
isio
n.**
* N
orth
Lau
derd
ale
Aca
dem
y H
igh
Sch
ool c
lose
d 20
06
Sept
embe
r 30,

86
City
of N
orth
Lau
derd
ale,
Flo
rida
Sch
edul
e 18
O
pera
ting
indi
cato
rs b
y Fu
nctio
n La
st T
en Y
ears
2004
2005
2006
2007
2008
2009
2010
2011
2012
2013
Func
tion
Pol
ice
Phys
ical
arre
st1,
986
2,
105
2,
484
2
,569
2
,348
1
,605
1
,798
2
,065
1,
569
1,61
0
Park
ing
viol
atio
ns34
7
37
1
25
1
2
11
5
0
69
2
9
235
132
34
Traf
fic v
iola
tions
10,3
32
8,
772
10
,402
12,
243
11,
988
7,7
81
6,2
59
9,3
62
5,83
04,
465
Fire
resc
ue
Num
ber o
f cal
ls a
nsw
ered
4,48
5
4,57
0
4,17
8
4,1
61
4,0
51
4,0
97
4,3
11
4,2
91
4,85
05,
255
Insp
ectio
ns67
7
61
9
59
8
4
15
5
89
5
55
6
18
5
75
63
068
2
Com
mun
ity d
evel
opm
ent
Build
ing
perm
its is
sued
2,37
9
3,36
6
5,83
5
1 4
,301
2
,730
2
,252
2
,546
2
,968
2,
936
2,52
7
Not
e: I
ndic
ator
s no
t ava
ilabl
e fo
r the
gen
eral
gov
ernm
ent f
unct
ion.
1 Cha
nge
due
to d
amag
es d
one
by H
urric
ane
Wilm
a.
Sou
rce:
Inf
orm
atio
n ob
tain
ed fr
om v
ario
us D
epar
tmen
ts w
ithin
the
City
of N
orth
Lau
derd
ale.
Sept
embe
r 30,

87
City
of N
orth
Lau
derd
ale,
Flo
rida
Ope
ratin
g in
dica
tors
by
Func
tion
Sc
hedu
le 1
8 (C
ontin
ued)
La
st T
en Y
ears
2004
2005
2006
2007
2008
2009
2010
2011
2012
2013
Cul
ture
and
recr
eatio
ns
Athl
etic
pro
gram
s (p
artic
ipan
ts)
1,17
0
21,
255
1,
335
6
15
8
36
6
09
7
31
8
04
80
278
4
Yout
h ca
mps
(par
ticip
ants
)1,
340
1,
380
1,
450
1
,492
1
,584
1
,040
2
,107
1
,467
1,
505
1,52
1
Clu
b m
embe
rshi
ps68
66
65
5
2
72
4
2
75
6
2
7075
Faci
lity
rent
als
433
252
1
24
4
3
474
489
5
21
1
,356
5
06
85
987
1
Pool
adm
issi
ons
18,0
00
24
,800
24,3
00
2
8,29
2
3
4,29
2
3
0,11
0
3
4,08
0
2
6,06
4
39
,754
35,5
74
Wat
er
Num
ber o
f wat
er m
eter
s op
erat
ing
7,82
4
7,92
4
7,97
5
7,78
9
8,27
0
8,19
8
8,24
8
8,01
2
8,19
8
8,29
1
Aver
age
daily
con
sum
ptio
n
(in th
ousa
nds
of g
allo
ns)
2,56
0
2,54
8
2,59
0
2,54
0
2,20
5
2,18
4
2,16
7
2,42
6
2,03
1
2,01
0
Sew
er
Aver
age
daily
con
sum
ptio
n
(in th
ousa
nds
of g
allo
ns)
2,32
5
2,32
6
2,32
4
2,20
0
2,13
0
2,17
1
2,10
8
2,24
0
2,00
6
1,99
7
Not
e: I
ndic
ator
s no
t ava
ilabl
e fo
r the
gen
eral
gov
ernm
ent f
unct
ion.
2 Inc
reas
e du
e m
ainl
y to
the
addi
tion
of y
outh
bas
ketb
all,
men
's s
occe
r and
wom
en's
soc
cer
3 Dec
reas
e du
e to
tem
pora
ry c
losi
ng o
f Par
ks d
ue to
dam
ages
by
Hur
rican
e W
ilma.
Sou
rce:
Inf
orm
atio
n ob
tain
ed fr
om v
ario
us D
epar
tmen
ts w
ithin
the
City
of N
orth
Lau
derd
ale.
Sept
embe
r 30,

88
City
of N
orth
Lau
derd
ale,
Flo
rida
Sche
dule
19
C
apita
l Ass
ets
by F
unct
ion
Last
Ten
Yea
rs
2004
2005
2006
2007
2008
2009
2010
2011
2012
2013
Func
tion
Pub
lic s
afet
yPo
lice
stat
ions
12
2
2
2
2
2
2
2
2
2
Fire
sta
tions
2
2
2
2
2
2
2
2
2
2
Hig
hway
and
stre
ets
Stre
ets
(mile
s)54
54
54
54
54
54
54
54
54
54
Num
ber o
f stre
et li
ghts
1,32
9
1,
329
1,32
9
1,
329
1,32
9
1,
329
1,32
9
1,
329
1,32
9
1,
329
Cul
ture
and
recr
eatio
nsN
umbe
r of p
arks
18
18
18
18
18
18
18
18
18
18
N
umbe
r of l
ibra
ries
1
1
1
1
1
1
1
1
1
1
Sw
imm
ing
pool
s2
2
2
1
1
1
1
1
1
1
Com
mun
ity c
ente
rs2
2
1
3
3
3
3
3
3
3
Com
mun
ity b
us s
huttl
es1
2
2
2
2
2
2
2
3
3
Wat
erW
ater
mai
ns (m
iles)
58
58
58
52
54
54
58
58
58
58
Fi
re h
ydra
nts
679
69
2
701
75
0
776
77
6
776
77
6
776
78
9
M
axim
um d
aily
cap
acity
(in th
ousa
nds
of g
allo
ns)
7.48
7.48
7.48
7.48
7.48
7.48
7.48
7.48
7.48
7.48
Sew
erSa
nita
ry s
ewer
s (m
iles)
52
52
52
54
56
56
56
56
56
56
St
orm
sew
ers
(mile
s)25
25
25
25
25
25
25
25
25
25
Max
imum
dai
ly tr
eatm
ent c
apac
ity(in
mill
ions
of g
allo
ns p
er d
ay -
MG
D)
4.20
4.20
4.20
4.20
4.20
4.20
4.20
4.20
4.20
4.20
Not
e: I
ndic
ator
s no
t ava
ilabl
e fo
r the
gen
eral
gov
ernm
ent f
unct
ion.
1 Dur
ing
fisca
l yea
r 200
2, th
e C
ity c
ontra
cted
with
the
Bro
war
d C
ount
y S
herif
f's O
ffice
to p
rovi
de p
olic
ing
serv
ices
on
beha
lf of
the
City
.
Sou
rce:
Inf
orm
atio
n ob
tain
ed fr
om v
ario
us D
epar
tmen
ts w
ithin
the
City
of N
orth
Lau
derd
ale.
Sept
embe
r 30,

2700 North Military Trail � Suite 350 Boca Raton, Florida 33431 (561) 994-9299 � (800) 299-4728 Fax (561) 994-5823 www.graucpa.com
89
INDEPENDENT AUDITOR’S REPORT ON INTERNAL CONTROL OVER FINANCIAL REPORTING AND ON COMPLIANCE AND OTHER MATTERS BASED ON AN AUDIT
OF FINANCIAL STATEMENTS PERFORMED IN ACCORDANCE WITH GOVERNMENT AUDITING STANDARDS
Honorable Mayor, City Commissioners and City Manager City of North Lauderdale, Florida We have audited, in accordance with the auditing standards generally accepted in the United States of America and the standards applicable to financial audits contained in Government Auditing Standards issued by the Comptroller General of the United States, the financial statements of the governmental activities, the business-type activities, each major fund, and the aggregate remaining fund information of the City of North Lauderdale, Florida (the “City”) as of and for the fiscal year ended September 30, 2013, and the related notes to the financial statements, which collectively comprise the City’s basic financial statements, and have issued our opinion thereon dated March 18, 2014.
Internal Control Over Financial Reporting In planning and performing our audit of the financial statements, we considered the City’s internal control over financial reporting (internal control) to determine the audit procedures that are appropriate in the circumstances for the purpose of expressing our opinions on the financial statements, but not for the purpose of expressing an opinion on the effectiveness of the City’s internal control. Accordingly, we do not express an opinion on the effectiveness of the City’s internal control.
A deficiency in internal control exists when the design or operation of a control does not allow management or employees, in the normal course of performing their assigned functions, to prevent, or detect and correct misstatements on a timely basis. A material weakness is a deficiency, or a combination of deficiencies, in internal control, such that there is a reasonable possibility that a material misstatement of the entity’s financial statements will not be prevented, or detected and corrected on a timely basis. A significant deficiency is a deficiency, or a combination of deficiencies, in internal control that is less severe than a material weakness, yet important enough to merit attention by those charged with governance.
Our consideration of internal control was for the limited purpose described in the first paragraph of this section and was not designed to identify all deficiencies in internal control that might be material weaknesses or, significant deficiencies. Given these limitations, during our audit we did not identify any deficiencies in internal control that we consider to be material weaknesses. However, material weaknesses may exist that have not been identified.
Compliance and Other Matters As part of obtaining reasonable assurance about whether the City’s financial statements are free from material misstatement, we performed tests of its compliance with certain provisions of laws, regulations, contracts, and grant agreements, noncompliance with which could have a direct and material effect on the determination of financial statement amounts. However, providing an opinion on compliance with those provisions was not an objective of our audit, and accordingly, we do not express such an opinion. The results of our tests disclosed no instances of noncompliance or other matters that are required to be reported under Government Auditing Standards.

90
Purpose of this Report The purpose of this report is solely to describe the scope of our testing of internal control and compliance and the results of that testing, and not to provide an opinion on the effectiveness of the entity’s internal control or on compliance. This report is an integral part of an audit performed in accordance with Government Auditing Standards in considering the entity’s internal control and compliance. Accordingly, this communication is not suitable for any other purpose.
March 18, 2014
�

2700 North Military Trail � Suite 350 Boca Raton, Florida 33431 (561) 994-9299 � (800) 299-4728 Fax (561) 994-5823 www.graucpa.com
91
MANAGEMENT LETTER PURSUANT TO THE RULES OF THE AUDITOR GENERAL OF THE STATE OF FLORIDA
Honorable Mayor, City Commissioners and City Manager City of North Lauderdale, Florida We have audited the accompanying basic financial statements of the City of North Lauderdale, Florida (the “City”) as of and for the fiscal year ended September 30, 2013, and have issued a report thereon dated March 18, 2014. We conducted our audit in accordance with auditing standards generally accepted in the United States of America; Government Auditing Standards, issued by the Comptroller General of the United States; and Chapter 10.550, Rules of the Florida Auditor General. Those standards require that we plan and perform the audit to obtain reasonable assurance about whether the financial statements are free of material misstatement. In addition, we have issued our Independent Auditor’s Report on Internal Control over Financial Reporting and Compliance and Other Matters based on an audit of the financial statements performed in accordance with Government Auditing Standards and Chapter 10.550, Rules of the Florida Auditor General dated March 18, 2014. Disclosures in that report should be considered in conjunction with this management letter. The purpose of this letter is to comment on those matters required by Chapter 10.550 of the Rules of the Auditor General for the State of Florida. Accordingly, in connection with our audit of the financial statements of the City, as described in the first paragraph, we report the following: I. Current year findings and recommendations. II. Status of prior year findings and recommendations. III. Compliance with the Provisions of the Auditor General of the State of Florida. Our management letter is intended solely for the information and use of the Mayor, City Commission, management, the Legislative Auditing Committee, members of the Florida Senate and the Florida House of Representatives, the Florida Auditor General, and Federal and other granting agencies, as applicable, and is not intended to be and should not be used by anyone other than these specified parties. We wish to thank the City of North Lauderdale, Florida and the personnel associated with it, for the opportunity to be of service to them in this endeavor as well as future engagements, and the courtesies extended to us.
March 18, 2014
�

92
REPORT TO MANAGEMENT
I. CURRENT YEAR FINDINGS AND RECOMMENDATIONS
None
II. PRIOR YEAR FINDINGS AND RECOMMENDATIONS None III. COMPLIANCE WITH THE PROVISIONS OF THE AUDITOR GENERAL OF THE STATE OF
FLORIDA
Unless otherwise required to be reported in the auditor’s report on compliance and internal controls, the management letter shall include, but not be limited to the following: 1. A statement as to whether or not corrective actions have been taken to address findings
and recommendations made in the preceding annual financial audit report.
There were no significant findings and recommendations made in the preceding annual financial audit report for the fiscal year ended September 30, 2012.
2. A statement as to whether or not the local governmental entity complied with Section 218.415, Florida Statutes, regarding the investment of public funds.
The City complied with Section 218.415, Florida Statutes, regarding the investment of public funds.
3. Any recommendations to improve the local governmental entity's financial management.
There were no such matters discovered by, or that came to the attention of, the auditor, to be reported for the fiscal year ended September 30, 2013.
4. Noncompliance with provisions of contracts or grant agreements, or abuse, that have occurred, or are likely to have occurred, that have an effect on the financial statements that is less than material but which warrants the attention of those charged with governance.
There were no such matters discovered by, or that came to the attention of, the auditor, to be reported, for the fiscal year ended September 30, 2013.
5. The name or official title and legal authority of the City are disclosed in the notes to the financial statements.
6. The financial report filed with the Florida Department of Financial Services pursuant to Section 218.32(1)(a), Florida Statutes agrees with the September 30, 2013 financial audit report.
7. The City has not met one or more of the financial emergency conditions described in Section 218.503(1), Florida Statutes.
8. We applied financial condition assessment procedures pursuant to Rule 10.556(7) and no deteriorating financial conditions were noted. It is management’s responsibility to monitor financial condition, and our financial condition assessment was based in part on representations made by management and the review of financial information provided by same.

2700 North Military Trail � Suite 350 Boca Raton, Florida 33431 (561) 994-9299 � (800) 299-4728 Fax (561) 994-5823 www.graucpa.com
93
INDEPENDENT AUDITOR’S REPORT ON COMPLIANCE FOR EACH MAJOR PROGRAMAND ON INTERNAL CONTROL OVER COMPLIANCE REQUIRED BY OMB CIRCULAR A-133
Honorable Mayor, City Commissioners and City Manager City of North Lauderdale, Florida
Report on Compliance for Each Major Federal Program We have audited the City of North Lauderdale, Florida’s (the “City”) compliance with the types of compliance requirements described in the OMB Circular A-133 Compliance Supplement that could have a direct and material effect on each of the City’s major federal programs for the fiscal year ended September 30, 2013. The City’s major federal programs are identified in the summary of auditor’s results section of the accompanying schedule of findings and questioned costs.
Management’s Responsibility Management is responsible for compliance with the requirements of laws, regulations, contracts, and grants applicable to its federal programs.
Auditor’s Responsibility Our responsibility is to express an opinion on compliance for each of the City’s major federal programs based on our audit of the types of compliance requirements referred to above. We conducted our audit of compliance in accordance with auditing standards generally accepted in the United States of America; the standards applicable to financial audits contained in Government Auditing Standards, issued by the Comptroller General of the United States; and OMB Circular A-133, Audits of States, Local Governments, and Non-Profit Organizations. Those standards and OMB Circular A-133 require that we plan and perform the audit to obtain reasonable assurance about whether noncompliance with the types of compliance requirements referred to above that could have a direct and material effect on a major federal program occurred. An audit includes examining, on a test basis, evidence about the City’s compliance with those requirements and performing such other procedures as we considered necessary in the circumstances.
We believe that our audit provides a reasonable basis for our opinion on compliance for each major federal program. However, our audit does not provide a legal determination of the City’s compliance.
Opinion on Each Major Federal Program In our opinion, the City complied, in all material respects, with the types of compliance requirements referred to above that could have a direct and material effect on each of its major federal programs for the fiscal year ended September 30, 2013.
Report on Internal Control Over Compliance
Management of the City is responsible for establishing and maintaining effective internal control over compliance with the types of compliance requirements referred to above. In planning and performing our audit of compliance, we considered the City’s internal control over compliance with the types of requirements that could have a direct and material effect on each major federal program to determine the auditing procedures that are appropriate in the circumstances for the purpose of expressing an opinion on compliance for each major federal program and to test and report on internal control over compliance in accordance with OMB Circular A-133, but not for the purpose of expressing an opinion on the effectiveness of internal control over compliance. Accordingly, we do not express an opinion on the effectiveness of the City’s internal control over compliance.

94
A deficiency in internal control over compliance exists when the design or operation of a control over compliance does not allow management or employees, in the normal course of performing their assigned functions, to prevent, or detect and correct, noncompliance with a type of compliance requirement of a federal program on a timely basis. A material weakness in internal control over compliance is a deficiency, or combination of deficiencies, in internal control over compliance, such that there is a reasonable possibility that material noncompliance with a type of compliance requirement of a federal program will not be prevented, or detected and corrected, on a timely basis. A significant deficiency in internal control over compliance is a deficiency, or a combination of deficiencies, in internal control over compliance with a type of compliance requirement of a federal program that is less severe than a material weakness in internal control over compliance, yet important enough to merit attention by those charged with governance.
Our consideration of internal control over compliance was for the limited purpose described in the first paragraph of this section and was not designed to identify all deficiencies in internal control over compliance that might be material weaknesses or significant deficiencies. We did not identify any deficiencies in internal control over compliance that we consider to be material weaknesses. However, material weaknesses may exist that have not been identified.
The purpose of this report on internal control over compliance is solely to describe the scope of our testing of internal control over compliance and the results of that testing based on the requirements of OMB Circular A-133. Accordingly, this report is not suitable for any other purpose.
March 18, 2014 �

95
City of North Lauderdale, Florida
Schedule of Expenditures of Federal Awards Fiscal Year Ended September 30, 2013
Federal CFDA Agency or Pass- FederalFederal Grantor/Pass-Through Grantor/Program Title Number Through Number Expenditures
U.S. Department of Housing and Urban Development Pass-through Broward County, Florida: Community Development Block Grants (CDBG) 36th Year Rehab 14.218 163,918$ 37th Year Public Facilities and Improvements 14.218 62,298 37th Year Code Enforcement 14.218 68,912 37th Year Purchase Assistance 14.218 116,648 38th Year Residential Hardening 14.218 123 Subtotal U.S. Department of Housing and Urban Development 411,899
U.S. Department of Housing and Urban Development Pass-through Broward County, Florida: Neighborhood Stabilization Program (NSP) 14.228 70,343
U.S. Department of Homeland Security direct program Assistance to Firefighters 97.044 EMW-2012-FO-03312 57,950
Total Expenditure of Federal Awards 540,192$
See Notes to Schedule of Expenditures of Federal Awards

96
City of North Lauderdale, Florida
Notes to Schedule of Expenditures of Federal Awards Fiscal Year Ended September 30, 2013
Note 1. Basis of Presentation The accompanying schedule of expenditures of federal awards includes the federal grant activity of the city of North Lauderdale, Florida and is presented on the accrual basis of accounting. The information in this schedule is presented in accordance with the requirements of OMB Circular A-133 Audits of States and Local Governments, and Non-Profit Organization. Therefore some amounts presented in this schedule may differ from amounts presented in, or used in the preparation of, the basic financial statements. Note 2. Summary of Significant Accounting Policies
Expenditures are reported on the Schedule are reported on the modified accrual basis of accounting. Such expenditures are recognized following the cost principles contained within OMB Circular A-87, Cost Principles from State, Local and Indian Tribal Governments, wherein certain types of expenditures are not allowable or are limited as to reimbursement. Pass-through entity identifying numbers are presented where available.

97
City of North Lauderdale, Florida
Schedule of Findings and Questioned Costs – Federal Awards Fiscal Year Ended September 30, 2013
SUMMARY OF AUDIT RESULTS
1. The auditor’s report expresses an unmodified opinion on the financial statements of the City.
2. No significant deficiencies or material weaknesses relating to the audit of the financial statements are reported in the independent auditor’s report on internal control over financial reporting and on compliance and other matters based on an audit of financial statements performed in accordance with Government Auditing Standards.
3. No instances of noncompliance material to the financial statements of the City were disclosed during the audit.
4. No significant deficiencies or material weaknesses relating to the audit of the major federal awards programs are reported in the independent auditor’s report on compliance for each major program and on internal control over compliance required by OMB Circular A-133.
5. The independent auditor’s report on compliance for each major federal awards program for the City expresses an unmodified opinion.
6. There were no audit findings relative to the major federal awards tested for the City.
7. The programs/projects tested as major include:
Federal Award Program CFDA# Amount
Community Development Block Grants 14.218 411,899$
8. The dollar threshold used to distinguish between Type A and Type B federal programs was $300,000.
9. The City was determined to be a low-risk auditee pursuant to OMB Circular A-133. FINDINGS – FINANCIAL STATEMENTS AUDIT
None FINDINGS AND QUESTIONED COSTS – MAJOR FEDERAL AWARDS
None OTHER ISSUES
No summary schedule of prior audit findings is required because there were no prior audit findings related to federal awards programs. No corrective action plan is required because there were no findings required to be reported under the Federal Single Audit Act.