city of oakland, california housing and … · housing and community development . analysis of...
TRANSCRIPT

CITY of OAKLAND, CALIFORNIA HOUSING and COMMUNITY DEVELOPMENT
ANALYSIS OF IMPEDIMENTS TO FAIR HOUSING CHOICE
October 2015

1
To request interpretation services for this document in languages other than English, please contact Maryann Sargent at (510) 238-6170 or [email protected]. The City of Oakland will make all efforts to comply with translation requests in a timely manner. Para solicitar este documento en español por favor comuníquese con Maryann Sargent al (510)-238-6170 o [email protected].
如欲索取西班牙文版本或中文版本,請聯絡 Maryann Sargent (510)-238-6170 或 電郵

2
Table of Contents Executive Summary ............................................................................. 4
Ⅰ. Introduction .................................................................................... 5
The Federal Fair Housing Act ....................................................................... 8
California Fair Employment and Housing Act ..................................................... 8
Previous Analysis of Impediments and Actions Taken to Date .................................. 9
Ⅱ. Community Participation Process ........................................................ 12
Outreach and Engagement ......................................................................... 12
Key Identified Fair Housing Issues ................................................................. 12
Survey Process ........................................................................................ 13
Stakeholder and Community Meetings ............................................................ 13
Ⅲ. Quantitative and Qualitative Analysis ................................................... 15
RCAPs and ECAPs ..................................................................................... 16
Demographics ......................................................................................... 20
Employment .......................................................................................... 31
Housing ................................................................................................ 34
Communities of Opportunity ....................................................................... 45
Ⅳ. Fair Housing Organization Profile ....................................................... 54
Summary .............................................................................................. 64
Ⅴ. Oakland Fair Housing Capacity and Public Policies ................................... 65
City Fair Housing Capacity and Public Policies .................................................. 65
Oakland Housing Authority Fair Housing Capacity and Policies ............................... 67
Home Mortgage Disclosure Act (HMDA) Analysis ................................................. 69
Bank Branch Locations .............................................................................. 78
Ⅵ. Impediments to Fair Housing Choice ................................................... 81
Lack of Regulated Affordable Housing (Public) .................................................. 81
Lack of Coordination among Fair Housing, Tenant Rights, and Advocacy Entities in the City (Public) .......................................................................................... 82
Opposition to Siting of Affordable Housing (Public) ............................................ 82
Planning, Land Use and Zoning Practices (Public) .............................................. 82
Loss of Naturally Occurring Affordable Housing (Public/Private) ............................. 83
Need for Landlord Education (Public/Private) ................................................... 84
Lack of Accessible Units (Public/Private) ........................................................ 84
Discrimination Regarding Accessible Features (Public/Private)............................... 84

3
Lack of Access to Community Assets (Public/Private) .......................................... 85
Foreclosure Recovery: Homeowners, Renters, and their Communities (Public/Private) .. 85
Lending/Sales Discrimination (Private) ........................................................... 85
Ⅶ. Fair Housing Action Plan .................................................................. 87
General Action Elements ........................................................................... 87
Lack of Regulated Affordable Housing (Public) .................................................. 88
Lack of Coordination among Fair Housing/Advocacy Entities (Public) ....................... 88
Opposition to Siting of Affordable Housing (Public) ............................................ 89
Planning, Land Use and Zoning Practices (Public) .............................................. 89
Loss of Naturally Occurring Affordable Housing (Public/Private) ............................. 90
Need for Landlord Education (Public/Private) ................................................... 90
Lack of Accessible Units (Public/Private) ........................................................ 90
Discrimination Regarding Accessible Features (Public/Private)............................... 90
Lack of Access to Community Assets (Public/Private) .......................................... 91
Foreclosure Recovery: Homeowners, Renters, and their Communities (Public/Private) .. 91
Lending/Sales Discrimination (Private) ........................................................... 91
Ⅷ. Appendices
1. Stakeholder and Community Meeting Attendees
2. Community Survey Results

4
Executive Summary This document contains an updated Analysis of Impediments to Fair Housing Choice (AI) for the
City of Oakland, California. Oakland is an entitlement community under the U.S. Department
of Housing and Urban Development’s (HUD) Community Development Block Grant
Program (CDBG), the HOME Investment Partnerships Program (HOME), and the Emergency Solutions Grant Program (ESG). In accordance with the Housing and Community Development Act of 1974, as amended, each entitlement community must “affirmatively further fair housing.” In order to demonstrate that the entitlement community is “affirmatively further fairing housing” the community must conduct a Fair Housing Analysis which identifies any impediments to fair housing choice and what actions it will take to overcome the effects of any impediments identified. From 2011 to 2014, the City of Oakland received just over 300 fair housing related complaints. These complaints are reviewed and addressed either by Eden Council for Hope and Opportunity (ECHO), the State, or the Department of Housing and Urban Development. To better understand the conditions associated with housing complaints in the City of Oakland, the City conducted a thorough quantitative analysis of demographic, housing, socioeconomic, employment, mortgage lending, and bank location data to understand the current conditions in the City. The City complemented this data profile with a community survey, stakeholder interviews as well as a review and assessment of City plans, policies, and other resources to understand current conditions and identify potential impediments to fair housing choice. Based on this analysis, the City has identified the following impediments to fair housing choice in Oakland.
1. Lack of Regulated Affordable Housing 2. Loss of Naturally Occurring Affordable Housing 3. Need for Landlord Education 4. Lack of Coordination among Fair Housing, Tenant Rights, and Advocacy Entities 5. Lack of Accessible Units 6. Discrimination regarding Accessible Features 7. Lack of Access to Community Assets 8. Lending/Sales Discrimination 9. Opposition to Siting of Affordable Housing 10. Planning, Land Use and Zoning Practices 11. Foreclosure Recovery: Homeowners, Renters and their Communities
This document includes a full description of each impediment

5
Ⅰ. Introduction This document contains an updated Analysis of Impediments to Fair Housing Choice (AI) for the
City of Oakland, California. Oakland is an entitlement community under the U.S. Department
of Housing and Urban Development’s (HUD) Community Development Block Grant
Program (CDBG), the HOME Investment Partnerships Program (HOME), and the Emergency
Solutions Grant Program (ESG). In accordance with the Housing and Community Development
Act of 1974, as amended, each entitlement community must “affirmatively further fair
housing.” In order to demonstrate that the entitlement community is “affirmatively further
fairing housing” the community must conduct a Fair Housing Analysis which identifies any
impediments to fair housing choice and what actions it will take to overcome the effects of any
impediments identified. The HUD Fair Housing and Equal Opportunity (FHEO) Office is now
advising Federal entitlement Communities to update their Analysis of Impediments to Fair
Housing Choice to coincide with the Five Year Consolidated Plan, and then every five years
thereafter.
Equal and unimpeded access to residential housing is a fundamental civil right that enables
members of protected classes, as defined in the federal Fair Housing Act, to pursue personal,
educational, employment, or other goals. Because housing choice is so critical to personal
development, fair housing is a goal that government, public officials, and private citizens must
embrace if social equity is to become a reality. The federal Fair Housing Act prohibits
discrimination in housing based on a person’s race, color, religion, gender, disability, familial
status, or national origin. In addition, the U.S. Department of Housing and Urban Development
(HUD) issued a Final Rule on February 3, 2012 that prohibits entitlement communities, public
housing authorities, and other recipients of federal housing resources from discriminating on
the basis of actual or perceived sexual orientation, gender identity, or marital status. Persons
who are protected from discrimination by fair housing laws are referred to as members of the
protected classes.
At the time this report was created, HUD was in the process of revising its reporting
requirements for AI documents. This AI incorporates data and information in HUD’s proposed
Assessment of Fair Housing, or AFH, where available.
One of the goals of the new AFH is to improve access to opportunity for protected classes and
low income households. Access to opportunity should both expand housing choices in areas that
have been exclusionary and improve the quality and conditions of the neighborhoods affordable
to protected classes and low income residents.
A growing body of research has demonstrated that limited housing choice has negative
outcomes for child well-being, social mobility, and, ultimately, human capital development—
all factors in public sector dependency. Limited housing choice for low income households,
therefore, can inhibit a city’s economic growth.

6
To ensure the prevention and elimination of housing discrimination and housing segregation as
it pertains to fair housing choice, HUD requires all entitlements or jurisdictions directly
receiving any of the four HUD formula grant programs, Community Development Block Grant
(CDBG), Emergency Solutions Grant (ESG), HOME Investment Partnership Program (HOME), and
Housing Opportunities for Persons With Aids (HOPWA), to certify that the jurisdiction will
“affirmatively further fair housing choice” within their area of authority. “Affirmatively
furthering fair housing” is defined by HUD as requiring a local jurisdiction to conduct an analysis
to identify impediments to fair housing choice within the jurisdiction; to take appropriate
actions to overcome the effects of any impediments identified through the analysis; and to
maintain records reflecting the AI and actions taken in this regard.
Communities receiving HUD entitlement funds are required to:
Examine and attempt to alleviate housing discrimination within their jurisdiction
Promote fair housing choice for all persons
Provide opportunities for all persons to reside in any given housing development, regardless of race, color, religion, gender, disability, familial status, national origin, actual or perceived sexual orientation, gender identity, or marital status
Promote housing that is accessible to and usable by persons with disabilities, and
Comply with the non-discrimination requirements of the Fair Housing Act. An AI is a review of a jurisdiction’s laws, regulations, and administrative policies, procedures,
and practices affecting the location, availability, and accessibility of housing. It is also an
assessment of conditions, both public and private, affecting fair housing choice.
Public and private entity obligations under 24 CFR 91.225 can be grouped into three categories: Intent: the obligation to avoid policies, customs, practices, or processes whose intent or purpose is to impede, infringe, or deny the exercise of fair housing choice on the basis of race, color, religion, sex, national origin, disability and familial status. Effects: the obligation to avoid policies, customs, practices, or processes whose effect or impact is to impede, infringe, or deny the exercise of fair housing rights on the basis of race, color, religion, sex, national origin, disability and familial status. Affirmative Duties: the obligation and fiduciary responsibility of public agencies to anticipate policies, customs, practices, or processes that previously, currently, or may potentially impede, infringe, or deny the exercise of fair housing choice on the basis of race, color, religion, sex, national origin, disability and familial status. This AI will:
Evaluate population, household, income, and housing characteristics by protected classes
Evaluate public and private sector policies that impact fair housing choice

7
Identify blatant or de facto impediments to fair housing choice where any may exist, and
Recommend specific strategies to overcome the effects of any identified impediments. An impediment to fair housing choice is defined as any action, omission, or decision that
restricts or has the effect of restricting the availability of housing choices of members of the
protected classes. This AI serves as the basis for fair housing planning; provides essential
information to policy makers, administrative staff, housing providers, lenders, and fair housing
advocates; and assists in building public support for fair housing efforts. The City is expected
to review and approve the AI and use it for direction, leadership, and resources for future fair
housing planning. The AI will serve as a point-in-time baseline against which future progress in
implementing fair housing initiatives will be evaluated and recorded.
A comprehensive approach was used to complete the Analysis of Impediments to Fair Housing Choice for the City of Oakland. The following sources were utilized:
The most recently available demographic data regarding population, household, housing, income, and employment at the Census Tract and municipal level
Public policies affecting the siting and development of housing
Administrative policies concerning housing and community development
Financial lending institution data from the Home Mortgage Disclosure Act (HMDA) database
Agencies that provide housing and housing related services to members of the protected classes
Fair housing complaints filed with HUD, California and ECHO Housing.
Interviews conducted with agencies and organizations that provide housing and housing related services to members of the protected classes

8
The Federal Fair Housing Act The Federal Fair Housing Act covers most housing and is the primary federal legislation to prevent housing discrimination. The Act prohibits anyone taking any of the following actions based on race, color, religion, gender, disability, familial status or national origin:
Refusal to rent or sell housing
Refusal to negotiate for housing
Make housing unavailable
Deny a dwelling
Set different terms, conditions, or privileges for the sale or rental of a dwelling
Provide different housing services or facilities
Falsely deny that housing is available for inspection, sale or rental
Persuade owners to sell or rent at a loss
Deny access to or membership in a facility or service
Refusal to make a mortgage loan
Refusal to provide information regarding loans
Impose different terms or conditions on a loan
Discriminate in appraising property
Refuse to purchase a loan
Set different terms or conditions for purchasing a loan
Threaten, coerce, intimidate or interfere with anyone exercising fair housing right
Advertise or make any statement that indicates a limitation or preference based on race, color, religion, gender, disability, familial status or national origin
Refuse to let the person with a disability to make reasonable modifications
Refuse to make reasonable accommodations in rules, policies and practices if necessary
Unless a building qualifies as housing for older persons, it may not discriminate based on familial status.
California Fair Employment and Housing Act In the State of California, California Fair Employment and Housing Act prohibits housing discrimination based on the following characteristics. This list provides additional protections than the Federally defined protected classes.
Race
Color
Religion
Sex
Gender
Gender Identify
Gender Expression
Sexual Orientation
Marital Status
National Origin
Ancestry
Familial Status
Source of Income
Disability
Genetic Information

9
Previous Analysis of Impediments and Actions Taken to Date The City of Oakland last conducted an Analysis of Impediments to Fair Housing Choice adopted in 2011. As a result of this analysis, the City identified 13 impediments to fair housing choice. These impediments are listed below with a summary of actions taken over the past five years to address these impediments. The City has made significant efforts to address these impediments despite challenging conditions in which market demand has risen considerably coupled with the decline and loss of affordable housing and community development resources.
1. Lack of Affordable Housing The City of Oakland faces a severe shortage of decent housing available and affordable to low-income persons. Actions taken to address impediment
Work closely with developers to identify and pursue all available funding for affordable housing
Work to remove constraints to development of housing
Give priority in annual NOFA to developments that include units for extremely low- and very low-income households and/or encourages siting of affordable housing in areas without concentration of poverty
2. Community Opposition to Siting of Affordable Rental Housing
Neighborhood opposition to development of affordable rental housing. Actions taken to address impediment
Encourage developers to include community outreach program as part of predevelopment process
Participate in public information and education activities to highlight affordable housing accomplishments and their positive impacts
Conduct briefings and work sessions with City Council to provide decision makers with information on City’s low income housing needs
Encourage developers to assist in formation of resident councils
Monitor existing affordable housing to ensure that management and maintenance are of high quality
Support East Bay Housing Organization’s (EBHO) Affordable Housing Week
Support five CHDOs in City that certify their annual actions align with this goal
3. Discrimination in the Sale or Rental of Housing The report Discriminatory Housing Trends identified a number of discriminations associated with both the sale and rental of housing to protected classes. Actions taken to address impediment
Provide funding to nonprofit agencies to provide fair housing counseling, investigate complaints and provide information and referrals
Provide outreach and information materials in other languages in order to reach out to underserved populations
Encourage owners and managers of affordable housing to provide translation assistance or referrals to community –based organizations that can assist with the translation for housing applicants

10
Require that all projects that receive public assistance (federal or non-federal) comply with the City’s Affirmative Fair Marketing Guidelines
4. Lack of Accessible Features in Housing
Many low-income persons lack resources to modify homes to install necessary accessible features. Actions taken to address impediment
Provide Access Improvement Grants to existing homeowners and owners of rental developments (5-year goal of 40 households (as of September 2014, 30 applications were received and completed or underway))
5. Barriers to the Provision of Supportive Housing
Difficult to access funding for supportive services associated with housing and overcome neighborhood opposition to siting of supportive housing. Actions taken to address impediment
Work with PATH/Everyone Home partnerships to find sources for long-term services linked to housing
Provide education and outreach regarding housing with supportive services
Support EBHO’s Affordable Housing Week
6. Discrimination in Mortgage Lending 2005 HMDA data and anecdotal evidence identified variations in mortgage lending among races/ethnicities. Actions taken to address impediment
Monitor and assess HMDA data and Community Reinvestment Act lender evaluations
Encourage financial institution participation in mortgage lending to low and moderate income individuals
Fund consumer counseling that includes financial literacy and credit counseling
Administer City’s Linked Banking Services Ordinance requiring financial institutions to meet Fair Share allocations based on community need and bank’s total deposits
Pursue pending lawsuit against Wells Fargo Bank challenging predatory lending practices against minority borrowers.
7. Foreclosures
Many homeowners have experienced foreclosure or struggling with risk of foreclosures. Actions taken to address impediment
Use NSP funds and other funding sources to acquire, rehabilitate and resell foreclosed homes
Work with non-profit housing service providers to target programs to extremely low, low and moderate income homeowners
8. Housing Conditions

11
Many low-income homeowners are seniors, persons with disabilities and/or minorities who have few resources available to rehabilitate their homes and cannot keep up with routine maintenance. Actions taken to address impediment
Fund housing rehabilitation both inside and outside areas of minority concentration
9. Land Use and Zoning Practices
Constraints such as permitting process for permanent supportive housing. Actions taken to address impediment
Amended its Planning Code in July 2014 to only require transitional and supportive housing consisting of less than six residents to be considered a residential use of property and must only be subject to those restrictions that apply to other residential dwellings of the same type in the same zone
Works to reduce the time and cost of environmental reviews by using CEQA exemptions for affordable housing
10. Access to Transportation
Low-income population tends to rely on public transportation. Affordable housing near public transit is a necessity. Actions taken to address impediment
Prioritize affordable housing developments near transit to provide better access to jobs and services
11. Policies Regarding Public Housing and Section 8
Need to continue to promote mixed income developments and development and placement of affordable housing in areas that do not have high minority concentrations. Actions taken to address impediment
The Oakland Housing Authority is focusing investment into rehabilitating current public housing and/or project based voucher units in order to increase housing options for low-income families, improve the quality of housing for families and improve the surrounding neighborhoods and communities
12. Policies Regarding Other Assisted Housing
There is a concentration of assisted housing in the flatlands area of Oakland. Actions taken to address impediment
Taking action to monitor and preserve assisted housing when possible to prevent affordable units from expiring
13. Policies Regarding Location of Housing and Community Development Activities
Housing and community development policies can result in targeting of affordable housing and other activities in high minority concentration areas. Actions taken to address impediment
Targeted HUD funding to address impediments cited in 2011 Impediments to Fair Housing Choice.

12
Ⅱ. Community Participation Process
Outreach and Engagement Community outreach is critical to any planning process to ensure that residents, housing providers, stakeholders and city agencies and departments are able to participate in the planning process. Public participation can take the form of community meetings, focus groups, individual interviews, and electronic and paper-based surveys. The outreach process for the preparation for this AI included:
Meetings with Oakland City staff and agencies
Interviews with fair housing related service providers
Web-based surveys
Stakeholder participation at community meetings
Resident participation at community meetings In Spring 2015, Cloudburst conducted a series of interviews with the following agencies to gather issues and opportunities related to fair housing in Oakland and how conditions have changed over the past five years and how the agency expects conditions to change in the coming five years. These interviews targeted organizations that work directly with residents of Oakland on issues related to fair housing. The organizations interviewed were:
1. ECHO Housing 2. Center for Independent Living 3. Bay Area Legal Aid 4. Centro Legal de la Raza 5. East Bay Community Law Center 6. Causa Justa :: Just Cause 7. Oakland Housing Authority
Key Identified Fair Housing Issues As a result of the interviews, stakeholders identified a number of potential impediments to Fair Housing in the City of Oakland. The primary impediment identified by all stakeholders is the overall lack of affordable housing in the Bay Area and in the City of Oakland. The lack of affordable housing puts immediate pressure on low- and moderate-income households in the City. Given the continued growth in the region’s housing market, these pressures are not expected to alleviate in the near future. The key impediments identified by stakeholders include: 1. Lack of Affordable Housing 2. Landlord Education 3. Lack of Accessible Units

13
4. Coordination 5. Discrimination regarding accessible features 6. Lack of access to community assets
Survey Process As part of the Consolidated Plan/Analysis of Impediments process, the City of Oakland conducted an electronic and paper-based survey to gather data on neighborhood conditions, community needs, and fair housing issues. The survey was available in English, Spanish, and Chinese characters. The City distributed the survey electronically through email list-serves, stakeholder email lists, City employee email lists, as well as social media outlets. Additionally, the City made paper versions available at key stakeholders, community meetings, and City departments and offices. The City collected 1,404 responses to the survey and used the data to inform needs for community development projects as well as assess fair housing issues among residents within the City. The survey emphasized residents satisfaction with their current living situation, desire to move (and limitations preventing a move), barriers to housing, conditions of persons with disabilities, access to housing, and housing discrimination. The surveys also included a series of demographic questions to allow the results to be filtered by different protected classes to compare and contrast experiences for different households and persons. Key findings from the survey are included below.
50.50% of residents are satisfied with their current living situation. When asked to select the one reason why they are not satisfied with their current living situation, slightly more than 17% of residents indicated they did not feel safe in their neighborhoods.
37.5% of survey respondents indicated a desire to move from their current home/apartment. Of this 37.5%, slightly over 88% indicated that the cost of housing was the largest impediment to finding a new house/apartment.
36.8% of respondents identified that they would face a barrier to housing if they looked for housing. Of these respondents, the two largest barriers were cost of housing and need for access to public transit.
More than half of respondents with a disability or family member with a disability indicated that they have trouble traveling in their neighborhood due to poorly maintained/lack of sidewalks.
18 respondents of 243 with a disability or family member with a disability indicated that their landlord refused to make accommodations for the disability.
18% of respondents were denied housing to rent or buy in the past five years. The most common reasons were other buyer paid cash or above asking price, income too low, and bad credit.
139 respondents indicated that they had been discriminated against when looking for housing in Oakland. Of those who felt they were discriminated against, just over ¾ contacted a fair housing or other related agency for additional information. Less than 8% filed formal fair housing complaints.
Stakeholder and Community Meetings

14
The community and stakeholder meetings were held at City Hall to review the draft of the Analysis of Impediments report. The meetings included a brief overview of the analytical work including the qualitative and quantitative methods used as well as the recommended action steps for each identified impediment. Stakeholders and community members were asked for their input on each identified impediment and corresponding action ideas. The meetings were structured as an informal dialogue between the facilitators and the attendees. Key comments from the meetings are included below: General
Identify who is in charge of ensuring these actions move forward.
Include/evaluate Section 8 housing in the AI report.
Include homeless population’ struggles in AI report.
Educate other entities in Alameda County since some funding sources are countywide.
Recognize “displacement” as impediment.
Make note of the foreclosure problem the still exists since previous AI report.
Make better distinctions between public and private sector.
Rethink how future surveys can reach those who are visually impaired or have a learning disability.
Put a stronger emphasis on transportation in the report.
Highlight what the city has actually done since the previous AI report. Lack of Affordable Housing
Establish a more robust rent control program that puts less pressure on tenants to know the law.
Establish more stringent rent increase petitions, particularly around capital improvements.
Reexamine Section 8 housing specifically looking at why people can’t use their vouchers and how landlords are using Section 8 as a means of discrimination.
Conduct more testing in Oakland around Section 8 discrimination.
Hold city accountable for preservation efforts.
Revaluate/enforce Surplus Land Act.
Reevaluate city lending practices.
Conduct more robust studies of SROs.
Establish more controls around receiverships. Current housing is not always inhabitable.
Address economics of affordable housing. How can the city think about group deals that include housing, grocery stores, and department stores, without pushing out small businesses?
Identify/establish better landlord incentives.
Reevaluate looking at abandoned property takeovers by government.
Need for Landlord Education
Train SRO landlords specifically about issues they may face such as bed bugs and sustainability.
Establish SRO landlord collaborative.
Identify which organizations are best equipped to train different types of landlords and tenants.
Conduct “press attack” so that more people know about housing discrimination and what to do.

15
Use the Rent Authorization Board as a means to share information on housing discrimination.
Lack of Coordination among Fair Housing, Tenant Rights, and Advocacy Entities in the City
Coordinate or hire someone to coordinate a working group.
Initiate conference that brings together all fair housing groups to talk.
Lack of Accessible Units
Evaluate transportation needs of those living in accessible units.
Educate landlords about Access Improvement Program (AIP) so they know it exists. Discrimination Regarding Accessible Features
Identify/establish better landlord incentives.
Continue landlord education programs. Lack of Access to Community Assets
Recognize transit as community asset. Lending/Sales Discrimination
Establish/enforce better links with banking ordinances.
Establish/improve more stringent audit practices for landlords in violation of fair housing policy.
Establish proactive measures to reach out to mortgage seeker before they apply to loans.
Think creatively about how information is shared with general public. Opposition to Siting of Affordable Housing
Develop policies so that inclusionary zoning is not a choice, but a requirement
Foster better understanding of SROS and the need for SROs.
Establish clear message that the City of Oakland cares about and will push for more affordable housing.
Establish/enforce reprimand for section 8 discrimination.
Acknowledge that previous public housing efforts caused many of the problems that exist today.
Change language around public housing. For example, use “enhancement” not “opposition.”
Planning, Land Use and Zoning Practices
Align zoning requirements for residential and transitional/supportive housing units.
Reexamine 300 ft. restriction on transitional housing placement next to another transitional housing establishment.
Improve access to zoning information for general public including online communication tools that people can quickly respond to.
Find new and creative ways to engage community members in zoning discussions.
Evaluate secondary unit regulations.
Ⅲ. Quantitative and Qualitative Analysis

16
RCAPs and ECAPs A large body of social research has demonstrated the powerful negative effects of residential segregation on income and opportunity for minority families, which are commonly concentrated in communities “characterized by older housing stock, slow growth, and low tax bases – the resources that support public services and schools.”1 Households living in lower-income areas of racial and ethnic concentration have fewer opportunities for education, wealth building, and employment.2 Historically, the Department of Housing and Urban Development (HUD) has relied on identifying racially and ethnically concentrated areas of poverty (RCAPs and ECAPs), geographic areas where both high poverty rates and a high percentage of minorities are clustered. The rationale for this analysis was to help communities determine where to invest housing resources by pinpointing the areas of greatest existing need. However, current evidence suggests that adding more subsidized housing to places that already have a high concentration of social and economic issues (i.e. RCAPs and ECAPs) could be counter-productive and not meet the spirit of the goals of HUD programs. This does not mean RCAP/ECAPs should be ignored by communities, however. Residents in RCAP/ECAPs still need services and high quality places to live, and stabilizing and improving conditions in the lowest-income neighborhoods remains a key priority of HUD programs. Instead, investment should be balanced between existing RCAP/ECAPs and other neighborhoods that offer opportunities and advantages for families. To describe the variation in neighborhood opportunity across regions, HUD has adopted a “Communities of Opportunity” model based on research developed by The Kirwan Institute for the Study of Race and Ethnicity at The Ohio State University. Communities of Opportunity is a framework that assigns each neighborhood a score reflecting the degree to which its residents have access to amenities and services such as good schools, jobs, stable housing, transit, low crime, and minimal health hazards. HUD and the Institute draw upon an extensive research base demonstrating the importance of neighborhood conditions in predicting life outcomes. The ultimate goals of this exercise are to bring opportunities to opportunity-deprived areas and to connect people to existing opportunities throughout a region. The Institute has argued that “we need to assess the geographic differences in resources and opportunities across a region to make informed, affirmative interventions into failures and gaps in ‘free market’ opportunities.” The Communities of Opportunity model is highly spatial and therefore map-based, generating a geographic footprint of inequality. The process of creating opportunity maps involves building a set of indicators that reflect local issues but are also based on research that validates the connections between the indicators and increased opportunity. Data is collected at the smallest geographic unit possible for each indicator and organized into sectors (prosperity, mobility, etc.), which are then combined to create a composite opportunity map. The resulting maps allow communities to analyze opportunity “comprehensively and
1 Orfield, Myron. “Land Use and Housing Policies to Reduce Concentrated Poverty and Racial Segregation.” Fordham Urban Law Journal. Volume 33, Issue 3, 2005. 2 Turner, Margery, et al. “Discrimination in Metropolitan Housing Markets: National Results from Phase I HDS 2000. Urban Institute. Online: huduser.org/Publications/pdf/Phase1_Report.pdf

17
comparatively, to communicate who has access to opportunity-rich areas and who does not, and to understand what needs to be remedied in opportunity-poor communities.” The combination of identifying RCAP/ECAPs and Communities of Opportunity creates a holistic approach to community investment. Although ethnicity and race as described by the US Census are not the same, this study uses rates of both non-White and Hispanic populations to map a single combined group of racial and ethnic concentrations, henceforth referred to collectively as racially concentrated areas of poverty, or RCAPs. Each Census Tract was evaluated by the share of either its non-White or Hispanic population, whichever was higher. The standard HUD definitions of RCAPs and ECAPs are areas where the total non-White population is greater than 50% and the poverty rate is greater than 40%. These baseline thresholds for defining RCAPs are meant to serve as a starting point for communities across the nation. HUD encourages communities to modify these thresholds if they do not make sense for local demographics. Given the spatial distribution of race and poverty in Oakland, the guideline thresholds are appropriate. The RCAP and ECAP Census Tracts are included in all maps to highlight where these areas of high minority and poverty concentration are located to help inform our analysis. Map 1: RCAP/ECAP Areas in Oakland
1
2
3

18
Map 1a: RCAP/ECAP Areas in Oakland – Zoomed in Area 1
Map 1b: RCAP/ECAP Areas in Oakland – Zoomed in Area 2

19
Map 1c: RCAP/ECAP Areas in Oakland – Zoomed in Area 3

20
Demographics
While population growth is in a steady state, White, Asian and Latino households are increasing while African American households are decreasing. Table 1: Population Profile
Oakland 2000 2013 Change Percent Change
# % # %
Total Population 399,477 100% 397,011 100% (2,466) -1%
White 124,921 31% 156,236 39% 31,315 25%
African American 141,294 35% 107,015 27% (34,279) -24%
Asian 60,110 15% 65,354 17% 5,244 9%
Hispanic 87,443 22% 102,090 26% 14,647 17% Graph 1: Percentage of Population by Race/Ethnicity: 2000 vs. 2013
According to the US Census American Community Survey (ACS), the City of Oakland’s population has remained relatively stable over the past 13 years, reducing from 399,477 to 397,011.3 While the total population has remained stable, the African American population has decreased significantly in the City, from just over 141,000 to 107,000, a decrease of more than 24 percent. On the contrary, Oakland’s White, Latino and Asian populations have increased (increasing by 25%, 17%, and 9% respectively). A dissimilarity index measures the evenness between two demographic groups distributed across Census Tracts in the City of Oakland. The higher the index, the more segregation exists
3. The 2010 Census and the American Community Survey (ACS) continue to be evaluated by City of Oakland staff. Comparing these data to other sources used by the City (e.g.: 2000 Census, California State Department of Finance, and USPS 90-day Vacancy data), there is clear evidence that there are problems with the ACS sampling. Specifically, the ACS data in question is an under count of the population and over count of the vacancy rate.
31%35%
15%
22%
39%
27%
17%
26%
0%
5%
10%
15%
20%
25%
30%
35%
40%
45%
White African American Asian Hispanic
2000 2013

21
among Census Tracts. Table 2 below presents the City’s Dissimilarity Index for the period between 2000 and 2010. In reviewing the data between 2000 and 2010, it is apparent that the dissimilarity index has declined from 2000 to 2010 between White and Non-White populations and all sub populations. While this would indicate that the City is becoming less segregated, it is important to note that the total African American population declined by more than 11 percentage points.
Table 2: Dissimilarity Index
Racial / Ethnic Group Year Population
Dissimilarity Index with White Population
Dissimilarity Index with Hispanic Pop.
# %
White 2000 108,046 32% n/a 0.54
2010 134,931 35% n/a 0.51
Non-White 2000 234,179 68% 0.41 0.29
2010 255,802 66% 0.36 0.28
Hispanic 2000 74,897 22% 0.54 n/a
2010 99,077 25% 0.51 n/a
African-American
2000 125,716 37% 0.49 0.36
2010 109,471 28% 0.42 0.34
Asian 2000 46,087 14% 0.42 0.54
2010 65,811 17% 0.41 0.51 The maps below highlight race/ethnicity trends in the City of Oakland and their association to RCAP/ECAP areas, as defined above.

22
Map 2: African-American Population (2013) by Census Tract
As illustrated above, a number of the RCAP/ECAP areas have 30% or more African American residents. The areas with the highest concentration of African American residents are in West Oakland and East Oakland.

23
Map 3: Hispanic Population (2013) by Census Tract
This map indicates that the majority of the Hispanic population is concentrated in East Oakland, with much of the area at a threshold of at least 30% Hispanic. Further, many of the tracts in East Oakland are majority Hispanic.

24
Map 4: Asian Population (2013) by Census Tract
Dissimilar from where many African American and Hispanic populations live in Oakland, the areas with higher Asian populations are concentrated in smaller areas just east of Downtown and in a small area of East Oakland.

25
Map 5: Non-Hispanic White Population (2013) by Census Tract
Unlike the African-American, Hispanic, and Asian maps presented above, the areas with the highest share of White population are largely concentrated in North Oakland and Oakland Hills. When looking specifically at the RCAP/ECAP areas, the white population is minimal when compared to other races and ethnicities seen in the previous maps.

26
Map 6: Race/Ethnicity Comparison from 2000 - 2013
The maps above indicate the general geographic location of African-American and Hispanic persons in 2000 and 2013. Each dot represents ten people. When comparing the two maps, there is a clear increase of the Hispanic population in East Oakland, largely supplanting the African-American population in this area. Less apparent, but also noticeable, is the African-American population decrease in East Oakland east of Interstate 580.

27
Map 7: Foreign Born Population (2013) by Census Tract
Over 107,000 residents in Oakland are foreign born (approximately 27% of the City’s population). The foreign born population is largely located in East Oakland, specifically in the RCAP/ECAP areas in East Oakland. In areas with a higher foreign born population, it is likely that there is a greater percentage of the population that has a limited proficiency in English. In Oakland as a whole, 21% of residents report that they speak English less than “Very Well.” The Spanish speaking population in the City is approximately 22%.

28
Map 8: Population with a Disability (2013) by Census Tract
According to the ACS, approximately 45,000 residents in Oakland have a disability (11%). While there is no wide disparity of the concentration of disabled persons in the City, a small concentration of the disabled populations is located in downtown, likely due to the prevalence of services, walkable neighborhoods and accessible residential units.

29
Map 9: Population over 65 with a Disability (2013) by Census Tract
Just over 38% of the City’s population over the age of 65 has at least one disability. When comparing this map illustrating the population over 65 with a disability to persons overall with a disability, there is a concentration of elderly, disabled persons in in downtown/West Oakland as well as some Census Tracts in East Oakland.

30
Map 10: Population in Poverty (2013) by Census Tract
As illustrated above, poverty rates are concentrated in West Oakland, downtown and East Oakland. There are very low poverty rates in the Oakland Hills and North Oakland.

31
Employment
Blacks face the highest unemployment rates Local employment opportunities are the most critical influence on household income, which is an extremely important factor in evaluating housing choice. The American Community Survey provides detailed employment data by gender and race, two of the protected classes in the Fair Housing Act, indicating differences in employment rates among groups. According to 2013 estimates for the City of Oakland, women experience slightly higher unemployment rates than men. White residents are less likely to experience unemployment than any other race or ethnicity, and Blacks experience the highest unemployment rates in the City (nearly double the overall unemployment rate). Graph 2: Unemployment Rate by Protected Classes in 2013
*Does not include Native American/Hawaiian/Pacific Islander **Hispanic ethnicity is counted independently of race
13%
11%
12%
8%
25%
11%
7%
11%
0% 5% 10% 15% 20% 25% 30%
Civilian labor force
Male
Female
White
Black
Asian
Some other race*
Hispanic**
Pro
tect
ed C
lass
es

32
Map 11: Job Location of People earning less than $1,200/month (2013) by Census Tract
The highest concentration of low-income jobs are in downtown and in East Oakland, especially in the Census Tracts surrounding and encompassing the Oakland Airport.
33
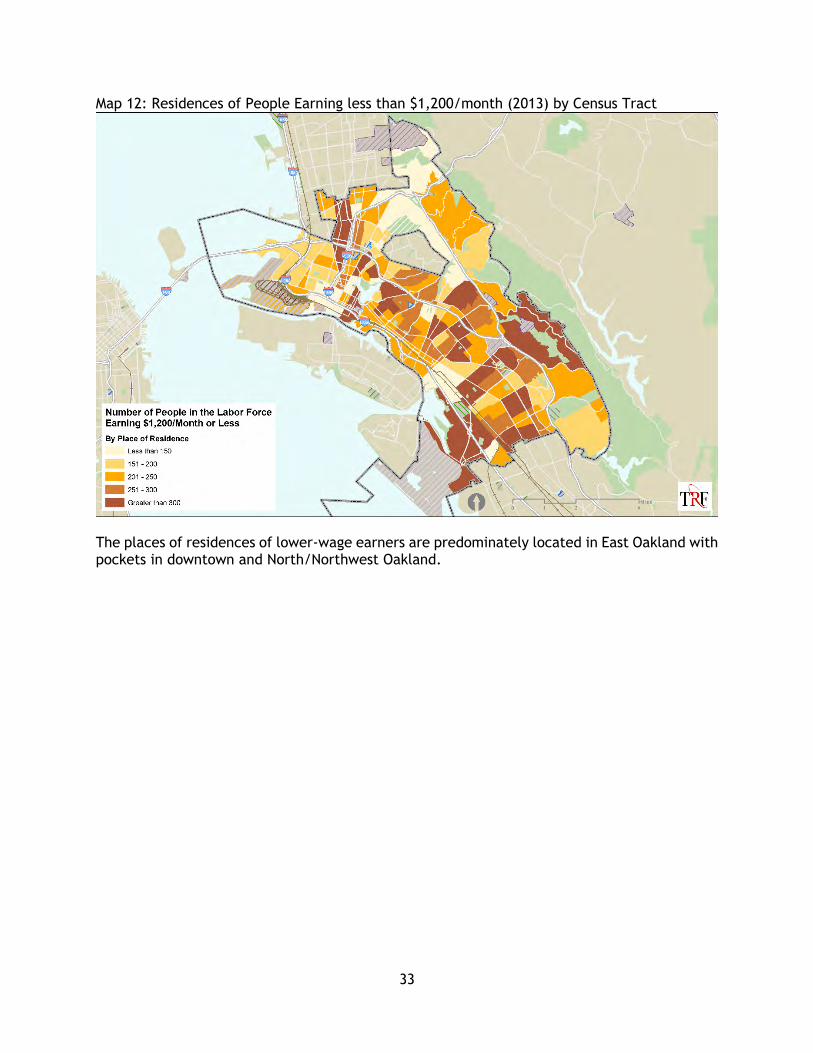
Map 12: Residences of People Earning less than $1,200/month (2013) by Census Tract
The places of residences of lower-wage earners are predominately located in East Oakland with pockets in downtown and North/Northwest Oakland.

34
Housing
The majority of Oakland’s housing stock is comprised of older, multi-family homes Graph 3: Housing Type (2013)
Older multi-family homes tend to be less accessible for those with physical disabilities, as they generally have narrower doorways and hallways. Additionally, older multi-family buildings may lack facilities such as ramps and elevators that are more standard in modern apartment complexes. Most homes in Oakland were built before 1980, and over half were built before 1950. Graph 4: Age of Housing Stock (2013)
In addition to generally being less accessible, older houses can require more maintenance and energy efficiency upgrades, which places additional financial burden on low-income homeowners. As illustrated earlier, City residents who are older and/or disabled are more likely to live in poverty than other groups, leaving these populations without the means to maintain and upgrade their homes as needed.
62%
2%
12%
8%
26%
0%
Single-family, detached
Single-family, attached
Small multi-family (2 to 4 units)
Medium multi-family (5 to 9 units)
Large multi-family (10 or more units)
Mobile Home
6%
10%
33%
51%
Built 2000 or later
Built 1980 to 1999
Built 1950 to 1979
Built before 1950

35
Graph 5: Housing Tenure by Race (2013)
As indicated by the graph above, a much higher share of White and Asian households own a home compared to Hispanic and African-American households. This gap may be indicative of the overall wealth gap among the different races/ethnicities in the City.
Housing Problems The Consolidated Plan analyzed housing problems, severe housing problems and cost burdened data by race to identify potential areas of disproportionate greater need. These areas include:
Disproportionate greater need for housing problems for Hispanic households at 50-80% and 80-100% AMI
Disproportionate greater need for housing problems for Pacific Islander households at 30-50% AMI
Disproportionate greater need for severe housing problems for Pacific Islander population at 0-30% AMI, 30-50%, 50-80%, and 80-100% AMI
Disproportionate greater need for severe housing problems for AIAN population at 0-30% AMI, 30-50%, and 50-80% AMI
Disproportionate greater need for severe housing problems for Hispanic population at 0-30% AMI, 50-80%, and 80-100% AMI
AIAN Disproportionate greater need for cost burden
Large Family Households (0-80% AMI) had disproportionate greater need for cost burden and extreme cost burden
0-50% AMI Renter Households had disproportionate greater need for cost burden
Subsidized housing is located in areas with higher poverty rates and declining population Subsidized housing includes Low Income Housing Tax Credit developments, HOME rental assistance properties, persons with disabilities, Section 202 developments for low-income seniors, Section 811 supportive housing and Oakland Redevelopment Agency’s Affordable Housing developments. According to the data from the City’s database of subsidized housing units illustrated in the map, the majority of HUD, State and local subsidized developments in the Oakland area are located near the center of the City and in or around Racially Concentrated Areas of Poverty (RCAPs). The map below does not include Oakland Housing Authority Public Housing units.
40%
48%
41%
32%
30%
60%
52%
63%
78%
70%
0% 10% 20% 30% 40% 50% 60% 70% 80% 90% 100%
Total
White
Asian
Hispanic
African American
Percentage of Housing Tenure Type
Rac
e/Et
hn
icit
y
Owners Renters

36
Map 13a: Total Units of Subsidized Housing
As indicated in the map above, the concentration of subsidized housing units (not including Oakland Housing Authority subsidized units) is located in downtown and areas of West and East Oakland. There is a smaller share of subsidized units in North Oakland. There are no subsidized units east of Interstate 580.

37
Map 13b: Total Units of Subsidized Housing
The map above shows the number of Section 8 residences per Census Tract. While there is a heavier concentration of Section 8 buildings in East Oakland, they are also located throughout downtown and areas of West Oakland.

38
Map 14: Housing Violations (2012-2015) by Census Tract
A housing violation is recorded in the City of Oakland by Code Enforcement. Violations are issued for unsafe/unsanitary buildings, zoning violations, public nuisances and other deficiencies that do not meet or comply with City Code. The majority of housing violations in Oakland are concentrated in West Oakland, East Oakland and downtown. To a lesser extent, there are concentrations of housing violations in North Oakland and in the southeastern area of the City. In focusing just on the RCAP/ECAP areas, all of these Census Tracts have a high concentration of housing violations.

39
Map 15: Foreclosure Filings (2012-2015)
The map above illustrates the share of foreclosure filings as a share of the total number of housing units per Census Tract. Though the share of foreclosures declined since 2008, there is still a concentration of at least 5% of all housing units in Census Tracts in East Oakland.

40
Map 16: Foreclosure Locations (2012-2015) and % African American Population
The map above indicates the location of a foreclosure and the thematic shading indicates the share of African-American residents. As discussed earlier, the concentration of African-American population is in West Oakland, downtown, and East Oakland. These areas also have a higher share of foreclosures.
41
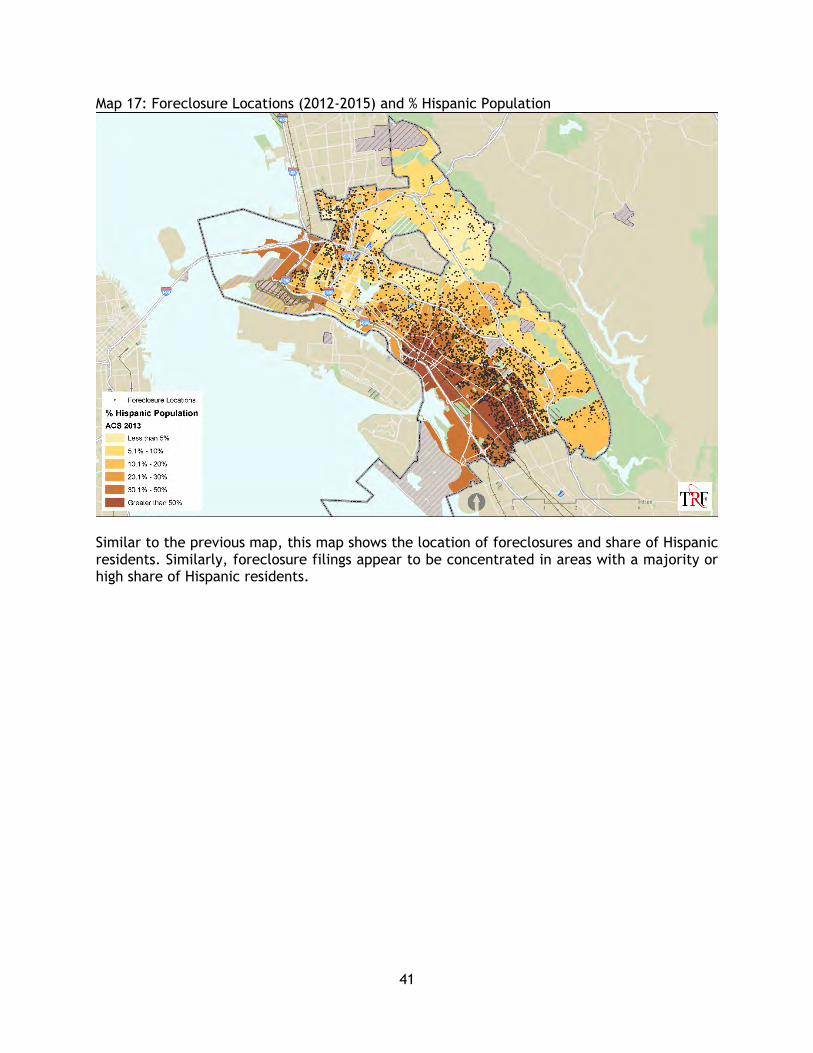
Map 17: Foreclosure Locations (2012-2015) and % Hispanic Population
Similar to the previous map, this map shows the location of foreclosures and share of Hispanic residents. Similarly, foreclosure filings appear to be concentrated in areas with a majority or high share of Hispanic residents.

42
Housing Cost Burden Table 3: Housing Cost Burden
Cost-Burdened Households 2000 2013 2000-2013 Change
Total Owners 62,434 62,538 0%
Total Renters 88,199 92,248 5%
Number of Residents
Burdened Owners 17,094 25,215 48%
Extremely-Burdened Owners 7,342 10,782 47%
Burdened Renters 37,215 49,004 32%
Extremely-Burdened Renters 19,169 26,617 39%
Percent of Residents
Burdened Owners 27% 40% 47%
Extremely-Burdened Owners 12% 17% 47%
Burdened Renters 42% 53% 26%
Extremely-Burdened Renters 22% 29% 33%
Housing Cost Burden is defined as a household paying more than 30% of its household income for housing. An Extremely-Burdened household is defined as paying more than 50% of its household income for housing. In Oakland, nearly 60% of all owners and more than 80% of renters were cost burdened in 2013 and nearly 25% of all households are extremely cost burdened. Further, the share of cost burdened households have increased significantly from 2000 to 2013 for both renters and owners. The following four maps show households that are cost burdened and extremely cost burdened by tenure type (homeowner or renter). In assessing the data collectively, cost burdened households are concentrated in areas of East Oakland, West Oakland, Downtown, and parts of downtown. The areas of high concentration coincide with the RCAP/ECAP areas and with areas noted above as being high concentrations of poverty and/or minority populations.

43
Map 18: Cost Burdened for Owner-Occupied Households (2013) by Census Tract
Map 19: Extremely Cost Burdened for Owner-Occupied Households (2013) by Census Tract

44
Map 20: Cost Burdened for Renter-Occupied Households (2013) by Census Tract
Map 21: Extremely Cost Burdened for Renter-Occupied Households (2013) by Census Tract

45
Communities of Opportunity A growing body of social research demonstrates the powerful adverse impact that residential segregation can have on income and opportunity for minority families. Studies, such as Margery Turner’s 2000 Urban Institute Report titled Discrimination in Metropolitan Housing Markets: National Results from Phase 1 HDS 2000 finds that households in areas with low median incomes and high concentrations of race/ethnicity concentration have fewer opportunities for education, jobs and wealth creation. Given research such as this, HUD recognizes the importance of neighborhood conditions on life outcomes and access to fair housing. With that, the following maps indicate the relation of RCAP/ECAP areas to community assets such as nonprofits, community facilities and quality schools. The nonprofit data is compiled by the National Center for Charitable Statistics. The data presented in this report is from the Center’s 2012 dataset. It is important to note that all nonprofit data is based on the organization’s geography and not its catchment area. As such, areas that appear to be underserved by nonprofits may actually fall within a nonprofit’s service area. The education data used in this report is based on the State’s 2013 API Growth and base Academic Performance Indexes (APIs). In 2014, the State announced that it would transition to Smarter Balanced Assessment after the 2015 school year. This data is not yet available and, as such, the 2013 API data is the most current data available. Map 22: Location of Community Assets and RCAP/ECAPs

46
As illustrated above, parks and recreation facilities are generally accessible through the City. However, when assessing the location of libraries and health clinics there are a reduced number of services in West Oakland and East Oakland, especially in or adjacent to the RCAP/ECAP Census Tracts in East Oakland. Map 23: Proximity to Arts/Recreation Nonprofits
There are very few Arts and Recreation organizations in East Oakland. The majority are concentrated in Downtown and North Oakland.

47
Map 24: Proximity to Education/Youth Nonprofits
In general, there is a high number of Education/Youth organizations throughout the City. The majority are concentrated in downtown with some in North Oakland, West Oakland and along the International Blvd Corridor in East Oakland. There still appears to be a lower share of organizations operating in East Oakland than the rest of the City.

48
Map 25: Proximity to Health/Medical Nonprofits
While it appears that Health/Medical nonprofits are concentrated in downtown and parts of North Oakland (likely associated with the Medical campuses in North Oakland), many of these entities provide services throughout the City and likely have a broader catchment area than indicated on the map.

49
Map 26: Proximity to Human Services Nonprofits
Similar to Medical/Health, the majority of Human Services Nonprofits are concentrated in the Downtown area, but likely have a larger catchment area. There are a much lower share of nonprofits in East Oakland and, to a lesser extent, West Oakland.

50
Map 27: Proximity to Other Nonprofits
Other Nonprofits include nonprofits that are focused on community service, civil rights, public safety, religion, environment and science. These organizations are predominately concentrated in Downtown, with some spillover in North Oakland and West Oakland. There are very few organizations located in East Oakland.

51
Education The following maps indicate the State Education Academic Performance Indexes by data by both Census Tract (overall Average) and average scores by Race/Ethnicity by School. The highest performing students are located in the Oakland Hills and in parts of North Oakland, both by average score by Census Tract as well as scores by school. The majority of schools that have sufficient data to report on for White and Asian students indicate an above 800 (well above average) or score between 700-800 (above average). However, for African-American and Hispanic students, schools in East Oakland and West Oakland report scores being below 600 for a much greater share when compared to the White and Asian student populations. Map 28: API Data (2013) for White Students

52
Map 29: API Data (2013) for African-American Students
Map 30: API Data (2013) for Hispanic Students

53
Map 31: API Data (2013) for Asian Students

54
Ⅳ. Fair Housing Organization Profile There are numerous federal laws that cover fair housing including the following: Fair Housing Act and other civil rights laws, including Title VI of the Civil Rights Act of 1964, Section 109 of the Housing and Community Development Act of 1974, Section 504 of the Rehabilitation Act of 1973, Title II of the Americans with Disabilities Act of 1990, the Age Discrimination Act of 1975, Title IX of the Education Amendments Act of 1972, and the Architectural Barriers Act of 1968. All of these federal actions are part of every City’s responsibility when conducting business. HUD does require through its community development regulations that all entitlement jurisdiction affirmatively further fair housing. It is expected that the jurisdiction will provide a minimum of three services:
1. Enforcement - Fair housing complaint intake and referral system. 2. Outreach - Programs to promote the services of the organization as well as materials
related to fair housing for distribution throughout the City. 3. Education - Programs that educate the housing delivery system to fair housing laws,
regulations and litigation so that they may be better informed as to their responsibilities under the law and also to educate consumer on their rights regarding fair housing.
It is the decision of the jurisdiction on how this is best done but, at the minimum, a basic fair housing program is needed. The City of Oakland offers a comprehensive Fair Housing Program through its agreement with Eden Council for Hope and Opportunity (ECHO). ECHO provides intake, investigation (including testing) and counseling regarding housing discrimination complaints. The agency provides this service for a variety of communities in Alameda County as well as for the City of Oakland. ECHO has a long history of advocating for equal housing rights since its establishment in 1964. ECHO is complaint driven in its enforcement activities, working with a number of organizations to assure a cooperative and collaborative program for the City. ECHO also provides counseling regarding tenant/landlord issues but not for the City of Oakland. This service is provided by a number of other organizations that service the City such as Bay Area Legal Aid and Housing and Economic Rights Advocates. While this activity is not specifically related to fair housing and often not recognized as a true fair housing activity, it has become an important step for advocates as they provide enforcement services regarding housing discrimination. Often what seems a simple tenant/landlord issue will become a fair housing complaint upon further investigation. An example would be the tenant who calls to receive counseling regarding an eviction. Upon further questioning of the tenant, it is discovered that the tenant is disabled and the reason for the eviction is that they have a ramp that the landlord has decided they do not like. Consequently, the service that organizations provide regarding tenant/landlord counseling and advocacy is extremely important in the provision of fair housings services to the City. All tenant/landlord inquiries that ECHO receives are referred to other organizations for assistance that operate in the City of Oakland. Similarly,

55
tenant/landlord organizations in Oakland are instructed to forward potential fair housing complaints or issues to ECHO. ECHO offers free fair housing education for tenants groups, members of the housing industry, and community-based organizations about federal and state fair housing laws. A review of ECHO’s intake and investigative efforts found that organization provides a high quality of service for residents of the City. Including ECHO there are three main organizations who offer fair housing services in the City of Oakland, California Department of Fair Employment and Housing (CDFEH - the FHAP agency), Bay Area Legal Aid (FHIP agency since 2012) and Housing and Economic Rights Advocates (HERA -a past FHIP agency). ECHO has a cooperative relationship with Bay Area Legal Aid. Bay Area Legal Aid has received $325,000 in FY2013 and FY2014 to continue fair housing enforcement services to address the fair housing needs of low-income Bay Area residents in the protected classes and build capacity among local, state, and regional public and private organizations. Specifically, Bay Area Legal Aid will:
1. Conduct intake and investigate complaints 2. Conciliate complaints of housing discrimination 3. File and/or litigate meritorious complaints for judicial enforcement 4. Conduct complaint and audit-based testing
In addition, Bay Area Legal Aid will submit analyses regarding the performance of local entitlement jurisdictions in meeting their obligations to affirmatively further fair housing under applicable laws and regulations. The organization’s education and outreach activities will include fair housing education presentations, fair housing enforcement trainings for staff of local Bay Area government and community-based organizations, and regional trainings on fair housing law and litigation. The tables below break down data provided by ECHO, HUD and CDFEH. The maps present a geographic illustration of Housing Complaints. Table 4 breaks out fair housing complaints received and investigated by ECHO for the time period from 2011 through 2014. The vast majority of complaints were from non-Hispanic households, more than 87%. Of complaints by protected class, Disability was the largest at more than 39%. This aligns with national trend data as complaints based on disability rank number one of all protective classes nationally. Familial status (10%) and Race (8%) follow as the next highest of specific protected classes. This also follows national trends. A significant number of those filing complaints are female, 75.5% compared to males 24.5%. Of those that do file complaints 65% or 212 earn less than 30% of area median income. That is significant in that the majority of households experiencing alleged discrimination are women and significantly poor. Of Hispanics who filed complaints 65% were earning less than 30% of median income. This was also the case for non-Hispanics with 65% earning less than 30% of median income. In every protected class category, those earning less than 30% of median income were the largest

56
populations. For Disabilities it was more than 55%, for Race it was 70% and for Familial Status it was more than 72%. It is also important to note that data provided by ECHO shows that the vast majority of complaints filed based on Familial Status were female headed households. With more than 75% of all complaints filed from women and 66% of those earning less than 30% of median income this segment of the population appears to be one of the most vulnerable.
Graph 6: Housing Complaints by Gender
Graph 7: Housing Complaints by Gender and Income
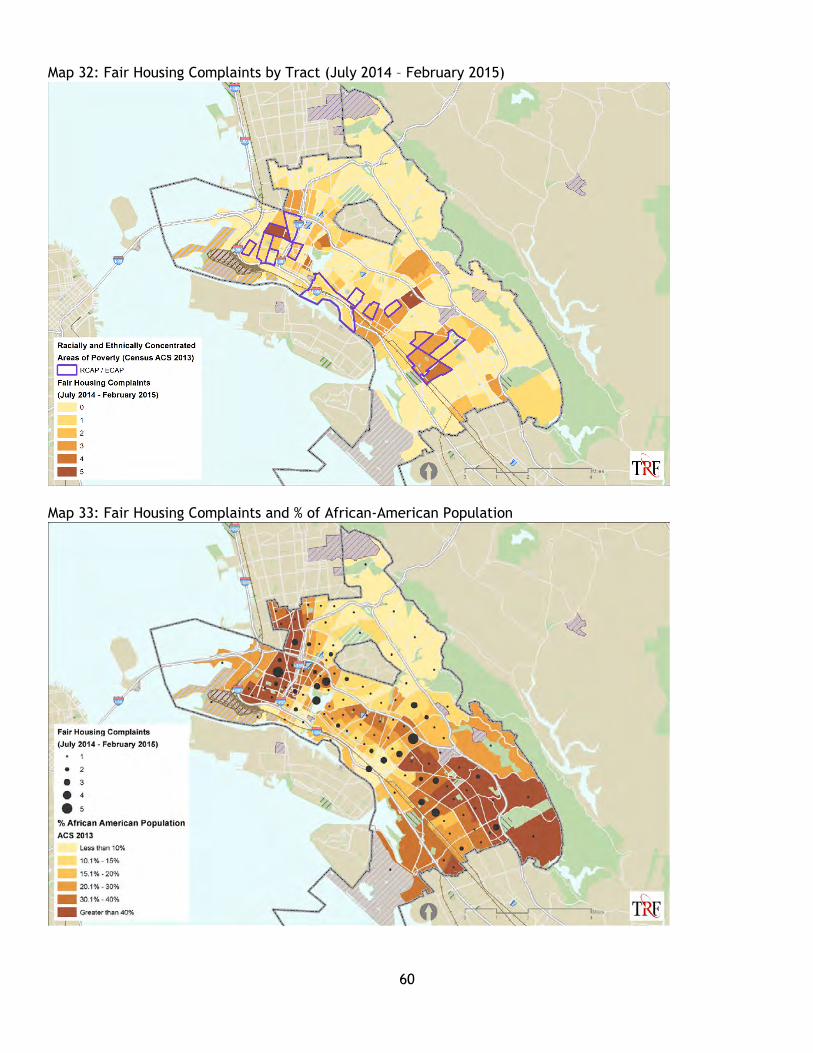
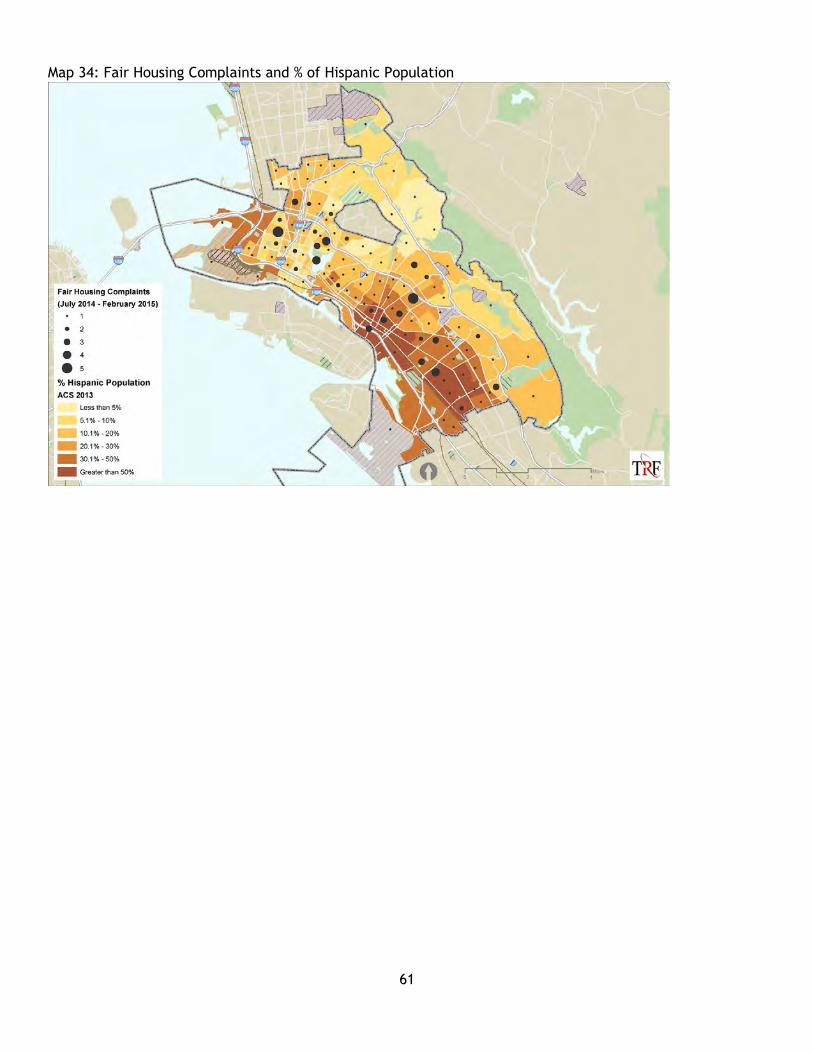
The locations of the complaints are included in Map 32. The majority of housing complaints from July 2014 – May 2015 are located in the flatlands of Oakland and are either in or adjacent to RCAP/ECAP areas. Maps 33 and 34 show areas of high concentrations of African American and Latino residents with the number of housing complaints. Areas with more complaints tend to be in areas of higher minority concentration. Table 5 shows complaints received from HUD and the FHAP agency (CDFEH.) The purpose of the Fair Housing Assistance Program (FHAP) is to provide assistance to State and local fair housing enforcement agencies. The intent of this funding program is to build a coordinated intergovernmental enforcement effort to further fair housing and to encourage the agencies to assume a greater share of the responsibility for the administration and enforcement of their fair housing laws and ordinances.
24.5%
75.5%
Male Female
0
20
40
60
80
100
120
140
160
<30% >30% to <50% >50% to <80%
Tota
l Nu
mb
er o
f C
om
pla
ints
Income Categories
Male Female

57
During the five year period between 2010 and 2014 HUD received 25 complaints of which Disability made up 40% followed by National Origin (32%) and Race (16%). The FHAP agency received 91 complaints with Disability accounting for more than 50% of the complaints, Race (13%) and National Origin (10.9%) followed as the next highest complaints. These trends align with the data collected by ECHO. Table 6 shows action taken on complaints received from HUD and the FHAP agency. Of the Disability cases received by the two agencies a large number were found to be “no cause” – seven for HUD and 25 for the CDFEH. Of those, Disability complaints CDFEH settled 11 while HUD settled two. One potential cause for further analysis is that almost half of the Disability complaints filed (51) were found to be “no cause.” In reviewing this trend in the aggregate, it presents a potential need for further analysis and careful investigation of future disability cases given the large share of disability cases. Both HUD and the CDFEH recovered over $27,885,000 in damages awarded. The largest settlement was for $27,550,000 for refusal to sell, discriminatory advertising, statements and notices based on race, color and national origin. The next highest settlement, also from HUD, was for $175,000 in a race/national origin complaint for refusal to sell and discriminatory financing.

58
Table 4: City of Oakland Fair Housing Complaints Filed 2011-2014
ECHO Fair Housing Complaints
Type of Complaint All Complaints Income
Number Percent <30% >30% to <50% >50% to <80% DTS
Hispanic 37 12% 24 1 1 2
Non-Hispanic 265 88% 172 53 17 23
Race 27 8% 19 5 2 1
National Origin 7 2% 4 3 0 0
Familial Status 33 10% 24 2 2 5
Disability 129 40% 72 21 14 14
Gender 11 3% 9 2 0 0
Religion 2 1% 2 0 0 0
Ancestry 0 0 0 0 0 0
Color 3 1% 2 1 0 0
Marital Status 4 1% 3 1 0 0
Age 9 3% 5 2 2 0
Sexual Orientation 7 3% 5 1 0 1
Source Income 16 5% 12 4 0 1
Other 76 23% 55 13 6 2
Total 324 100% 212 55 26 24
Male 74 25% 58 12 4 0
Female 228 76% 142 40 19 27
Total 302 100% 200 52 23 27

59
Graph 8: Housing Complaints by Type (2011-2014)
8%
2%
10%
40%
3%
1% 0% 1% 1%3% 3%
5%
23%
0%
5%
10%
15%
20%
25%
30%
35%
40%
45%
Race NationalOrigin
FamilialStatus
Disability Gender Religion Ancestry Color MaritalStatus
Age SexualOrientation
SourceIncome
Other
Per
cen
tage
of
Tota
l Co
mp
lain
ts
Types of Complaints
60
Map 32: Fair Housing Complaints by Tract (July 2014 – February 2015)
Map 33: Fair Housing Complaints and % of African-American Population
61
Map 34: Fair Housing Complaints and % of Hispanic Population

62
Table 5: HUD/FHAP Agency Fair Housing Complaints (2010-2014)
Type of Complaint HUD All Complaints FHAP All Complaints
Number Percent Number Percent
Race 4 16% 12 13%
National Origin 8 32% 10 11%
Familial Status 0 0 6 7%
Disability 10 40% 51 56 %
Gender 1 4% 9 10%
Religion 0 0 3 3%
Ancestry 0 0 0 0
Color 2 8% 0 0
Marital Status 0 0 0 0
Age 0 0 0 0
Sexual Orientation 0 0 0 0
Source Income 0 0 0 0
Total 25 100% 91 100%
NOTE: HUD = Department Of Housing and Urban Development – Fair Housing and Equal Opportunity. FHAP = Fair Housing Assistance Program – California Department of Fair Employment & Housing

63
Table 6: City of Oakland - Action/Results On Fair Housing Complaints HUD - FHA (2010-2014)
Type of Complaint
Action/Results
No Cause Settled - Conciliated
Failed to Cooperate
Withdrawn w/ Resolution
Judicial Consent Order
Missing Complaint
Unknown Respondent
HUD FHAP HUD FHAP HUD FHAP HUD FHAP HUD FHAP HUD FHAP HUD FHAP
Race 1 7 2 2 1 3
National Origin 3 4 2 2 1
Familial Status 1 3 2 1
Disability 7 25 2 11 3 1 4 2 1
Gender 5 1 1 1
Religion 1 1
Ancestry
Color 1
Marital Status
Age
Sexual Orientation
Source Income
Other

64
Summary Overall, the fair housing programs in the City of Oakland are very effective. ECHO does a good job considering their size and area covered in responding to a wide variety of complaints. ECHO offers an effective program to the residents of the City. HUD and CDFEH provide an alternative resource for residents and for ECHO to file complaints. Complementing these agencies, are a large number of tenant/landlord and other advocacy organizations that provide an exceptional range of services to residents throughout the City of Oakland. One potential cause for concern, given the large number of fair housing organizations in the City of Oakland, is the need for careful coordination among the providers to both realize service delivery efficiencies as well as ensure that certain geographies or populations are adequately served. Further, it would benefit from these organizations to coordinate and align data collection methodologies and results. This would better ensure data consistency among organizations and ensure that needs are being addressed. Further, closer collaboration would better assist clients as services are transferred from one agency to another.

65
Ⅴ. Oakland Fair Housing Capacity and
Public Policies
City Fair Housing Capacity and Public Policies The City of Oakland has supported fair housing organizations and activities through a number of different ways in the past five years – ranging from the allocation of HUD funding to addressing fair housing issues to revising zoning ordinances and city policies to affirmatively further fair housing.
Funding Fair Housing Organizations In the 2010 – 2014 Consolidated Plan period, the City of Oakland actively funded a range of fair housing organizations and activities. Total funding from 2010 – 2013 was nearly $1.5 million. This funding was used for a range of fair housing related activities including housing discrimination testing, housing counseling, information/referral services, legal representation, tenant/landlord mediation, counseling and other services. Funding was allocated to five different agencies over this period. A summary of funding is provided in the table below. Table 7: Fair Housing Funding – 2010 -2013
Year Allocation Activities
FY2010 $358,000 (ECHO Housing, East Bay Community Law Center, Causa Justa :: Just Cause, and Centro Legal de la Raza)
Housing discrimination case management
Fair housing outreach and training
Limited English proficiency legal representation
Housing service counseling
Tenant/Landlord resolution services, counseling, and mediation
Information/referral for residents with disabilities
Information and referral on housing related issues
Legal representation of selected clients
FY2011 $297,140 (ECHO Housing, East Bay Community Law Center, Center for Independent Living, Causa Justa :: Just Cause, and Centro Legal de la Raza)
Housing discrimination case management
Fair housing outreach and training
Limited English proficiency legal representation
Housing service counseling
Tenant/Landlord resolution services, counseling, and mediation
Information/referral for residents with disabilities
Information and referral on housing related issues
Legal representation of selected clients
FY2012 $297,140 (ECHO Housing, East Bay Community Law Center, Center for Independent Living, Causa
Housing discrimination case management
Fair housing outreach and training
Limited English proficiency legal representation
Housing service counseling

66
Justa :: Just Cause, and Centro Legal de la Raza)
Tenant/Landlord resolution services, counseling, and mediation
Information/referral for residents with disabilities
Information and referral on housing related issues
Legal representation of selected clients
FY2013 $541,866 (ECHO Housing, East Bay Community Law Center, Causa Justa :: Just Cause, and Centro Legal de la Raza)
Housing discrimination case management
Fair Housing testing
Fair housing outreach and training
Limited English proficiency legal representation
Housing service counseling
Tenant/Landlord resolution services, counseling, and mediation
Legal representation of selected clients
TOTAL $1,494,146 Housing discrimination case management
Fair housing outreach and training
Limited English proficiency legal representation
Housing service counseling
Tenant/Landlord resolution services, counseling, and mediation
Information/referral for residents with disabilities
Information and referral on housing related issues
Legal representation of selected clients In addition to directly funding fair housing activities and related counseling and services, the City of Oakland also affirmatively furthers fair housing with projects and activities through other Housing and Community Development efforts.
1. Give priority in annual HOME NOFA to projects that encourage the siting of affordable housing in areas without concentrations of poverty and in proximity to community assets
2. Encourage community outreach and engagement regarding the need for affordable housing
3. Carefully monitor existing affordable housing developments to ensure they are well maintained
4. Fund the Housing Assistance Center to serve as a single point of contact for housing services and referrals
5. Leverage non-HUD funds to support anti-poverty programs and services 6. Improve transportation options to major job centers 7. Development of new and rehabilitation of existing community assets and infrastructure
Through these efforts, the City of Oakland is targeting opportunities to affirmatively further fair housing by improving community conditions as well as target and promote the development and provision of affordable housing. Given the high demand for affordable housing throughout the city, these efforts have helped to at least partially mitigate the gentrification pressures in Oakland.

67
Oakland Housing Authority Fair Housing Capacity and Policies The Oakland Housing Authority has a series of policies and processes in place for both public housing developments as well as in its Section 8 program to affirmatively further fair housing and civil rights through all of its programs. OHA’s fair housing policies and processes are documented in the Admissions and Continued Occupancy Policy (updated 2015) and comply with fair housing and civil rights regulations. Through its FSS, FUP and Section 8 programs, OHA has policies and processes in place to affirmatively further fair housing.
Discrimination Complaints As part of OHA’s orientation process, it ensures that all residents are fully aware of all applicable civil rights laws. It provides information to all applicant families about civil rights requirements. If a resident believes they have suffered any form of discrimination, OHA will provide the resident with all necessary paperwork, offer to assist the resident in completing the form and refer the resident to both HUD FHEO and California Department of Fair Employment and Housing.
Reasonable Accommodations OHA actively encourages any resident to make a request for an exception, change or adjustment to a rule, policy, practice or service because of a disability. OHA will treat any such request as a request for a reasonable accommodation. OHA will provide forms and/or guidance to the requestor on the information necessary to make the request. OHA will review and assess requests for reasonable accommodations on a case-by-case basis, taking into all available factors. OHA will approve any request for an accommodation if the following three conditions are met:
1. The request was made by or on behalf of a person with a disability 2. There is a disability-related need for the accommodation 3. The requested accommodation is reasonable, meaning it would not impose an undue
financial and administrative burden on OHA or fundamentally alter OHA’s operations
Limited English Proficiency OHA follows HUD’s December 19, 2003 guidance designed to assist housing authorities comply with Title VI of the Civil Rights Act of 1964. OHA recognizes that for many applicants and residents, English is not their primary language and they have a limited ability to read, write, speak or understand English. Language for LEP Persons can be a barrier to accessing important benefits. OHA’s automated phone service provides menu options in English, Cantonese, Spanish, and Vietnamese. The Authority uses “I speak” flash cards to identify the language spoken by walk-in LEP clients. Once identified, OHA uses a telephone interpretation service to assist walk-in clients – enabling OHA to serve clients in over 150 languages.

68
All vital documents (such as waitlist application and opening notices) are translated from English into Cantonese, Spanish and Vietnamese. Oral translation, where reasonable, will be provided for other LEP clients.
Waitlist Process OHA’s project-based voucher sites use site-based waiting lists. Each site-based waitlist must establish the selection criteria or preferences for occupancy of particular units, in accordance with all federal, state and local civil rights and fair housing requirements. OHA audits site-based waiting lists biennially to ensure that waiting list management and tenant selections are adhering to written procedures and policies.
Relocation Policies If a temporary relocation is necessary because of maintenance or other conditions and an appropriate unit is not immediately available, OHA will provide temporary accommodations. If the condition of the unit cannot be repaired, OHA will transfer the resident to the first available and appropriate unit.
Housing Authority Units and Resident Profile As of May 2015, OHA currently oversees 1,544 public housing units and 12,269 vouchers (1,795 project-based vouchers and 10,474 tenant-based vouchers). A brief profile of all public housing residents is provided in the table below. Table 8: Public Housing Resident Characteristics
Category Public Housing Resident
Voucher Holder
Total Units 1,544 12,269
White 64 962
African American 993 8,592
Asian 412 2,512
Hispanic 48 533
Non-Hispanic 1,448 11,736
Elderly 708 3,198
# of Disabled Families 336 2,819
Requesting Accessibility Features
1,444 9,914
Average Annual Income $14,985 $18,461 Source: 2015 Consolidated Plan
OHA does not anticipate opening any waitlist in the upcoming year except for potentially one partial waitlist for three bedroom units at Lion’s Creek Crossing. The OHA waitlist (as of December 2014) totaled more than 44,000 households, indicating an incredibly high demand for affordable housing in the City.
69
Home Mortgage Disclosure Act (HMDA) Analysis Unfettered access to fair housing choice requires impartial and equal access to the mortgage lending market. The Fair Housing Act prohibits lenders from discriminating against members of the protected classes in granting mortgage loans, providing information on loans, imposing the terms and conditions of loans (such as interest rates and fees), conducting appraisals, and considering whether to purchase loans. An analysis of mortgage applications and their outcomes can identify possible discriminatory lending practices and patterns in a community. Under the terms of the Financial Institutions Reform, Recovery, and Enforcement Act of 1989, any commercial lending institution that makes five or more home mortgage loans annually must report all residential loan activity to the Federal Reserve Bank under the terms of the Home Mortgage Disclosure Act (HMDA). The HMDA regulations require most institutions involved in lending to comply and report information on loans denied, withdrawn, or incomplete by race, sex, and income of the applicant. The information from the HMDA statements assists in determining whether financial institutions are serving the housing needs of their communities. The data also help to identify possible discriminatory lending practices and patterns. The data focus on the number of homeowner mortgage applications received by lenders for home purchases, refinancing, and improvements. The most recent HMDA data available for the City of Oakland is from 2013. The information includes data for Alameda County as a reference to the City. The information provided is for the primary applicant only; co-applicants were not included in the analysis. In addition, where information was not provided or is categorized as not applicable, no analysis has been conducted due to the lack of information.

70
Mortgage Loan Summary Analysis The tables and maps below provide data on mortgage loan summary data. The data includes a profile of percent of loan applications denied by race/ethnicity, percent of loan applications denied by income levels (less than $25,000, $25,000 - $50,000, $50,000 - $100,000, $100,000 - $150,000, and greater than $150,000) coupled with race/ethnicity, and the share of high cost loans by race/ethnicity. The maps provide a summary of the number/type of mortgage originations by Census Tract as well as mortgage origination amounts by Census Tract. Table 9: Loan Application Denials by Race
Percent of Loan Applications Denied % Point Difference
Loan Purpose All Race and Ethnicity
African American White Asian Hispanic Non-Hispanic
African American / White
Asian / White
Hispanic / Non-Hispanic
All loan purposes
Oakland 32% 45% 28% 35% 40% 32% 17% 7% 9%
Alameda County 29% 42% 27% 30% 37% 29% 15% 2% 9%
Purchase loans
Oakland 31% 45% 27% 34% 38% 31% 18% 7% 8%
Alameda County 29% 41% 26% 29% 36% 28% 15% 3% 8%
Home improvement loans
Oakland 43% 46% 39% 54% 44% 42% 7% 14% 2%
Alameda County 43% 45% 39% 45% 42% 42% 6% 6% 0%
Refinance loans
Oakland 46% 50% 44% 29% 78% 44% 6% -16% 44%
Alameda County 40% 44% 35% 42% 43% 38% 9% 7% 5%

71
Graph 9: Loan Applications Denied by Race
For all loans in Oakland, 45% of African American loans are denied, while 28% of White loans and 35% of Asian loans are denied. This difference between African-American loans and White loans is slightly greater in Oakland than in Alameda County. Similarly, 40% of Hispanic loan applications were denied, compared to 32% for non-Hispanic applications. When examining purchase loans, 45% of African-American loans were denied, while only 27% of White loans and 34% of Asian loans were denied. This data presents a potential concern and impediment to fair housing given the large discrepancy between White and African American and to a lesser extent between Hispanic and non-Hispanic and Asian and White.
29% 29%
43%40%
0%
5%
10%
15%
20%
25%
30%
35%
40%
45%
50%
All loan purposes Purchase loans Home improvement loans Refinance loans
Perc
enta
ge o
f R
ace/E
thnic
ity
Denie
d L
oans
Loan Type
All Race and Ethnicity African American White Asian Hispanic Non-Hispanic

72
Table 10: Loan Applications Denied by Income Category
Percent of Loan Applications Denied Difference
All Race and Ethnicity
African American White Asian Hispanic
Non-Hispanic
African American / White
Asian / White
Hispanic / Non-Hispanic
All income Categories 32% 45% 28% 35% 40% 32% 17% 7% 9%
Less than $25,000 58% 55% 57% 48% 59% 55% -2% -9% 4%
$25,000 - $50,000 46% 52% 42% 46% 43% 46% 11% 5% -3%
$50,000 - $100,000 35% 43% 31% 40% 39% 35% 12% 9% 4%
$100,000 - $150,000 27% 39% 25% 27% 32% 27% 15% 3% 6%
More than $150,000 24% 44% 23% 25% 31% 25% 21% 2% 6% Graph 10: Loan Applications Denied by Income Category
This data table examines loan applications denied when comparing race/ethnicity and income categories. As income levels rise, the discrepancy between White and African-American households as well as Hispanic Non-Hispanic increases. Similar to the table above, this presents a potential concern of an impediment to fair housing access.
58%
46%
35%
27%24%
0%
10%
20%
30%
40%
50%
60%
70%
Less than $25,000 $25,000 - $50,000 $50,000 - $100,000 $100,000 - $150,000 More than $150,000
Perc
enta
ge o
f R
ace/E
thnic
ity
Denie
d L
oans
Income Categories
All Race and Ethnicity African American White Asian Hispanic Non-Hispanic

73
Table 11: Share of High Cost Loans
Percent of High Cost Loans Difference
County All Race and Ethnicity
African American White Asian Hispanic
Non-Hispanic
African American / White
Asian / White
Hispanic / Non-Hispanic
All loan purposes
Oakland 1% 5% 1% 0% 14% 1% 3% -1% 13%
Alameda County 1% 4% 1% 0% 3% 1% 3% -1% 2%
Purchase loans
Oakland 0% 1% 0% 0% 1% 0% 1% 0% 1%
Alameda County 0% 1% 0% 0% 1% 0% 1% 0% 0%
Home improvement loans
Oakland 6% 23% 15% 7% 19% 14% 8% -8% 5%
Alameda County 6% 20% 16% 12% 16% 15% 5% -3% 0%
Refinance loans
Oakland 0% 0% 0% 0% 0% 0% 0% 0% 0%
Alameda County 0% 1% 0% 0% 0% 0% 1% 0% 0% This table examines high cost loans by race and ethnicity. In general, there is a very small share of high price loans in Oakland and Alameda County for purchase and refinance loans. However, there is a higher share of high purchase loans for Home Improvement Loans. When examining this category, there is a higher share of high cost loans targeted to African-American and Hispanic populations than other races/ethnicities.

74
Map 35: Number of Purchase Loan Originations (2013) by Census Tract
This map examines the concentration of loan originations in 2013 by Census Tract. There is a much higher concentration of originations in the Oakland Hills and, to a lesser extent, North Oakland. Throughout Downtown, East Oakland and West Oakland there is a very small number of originations and low number of originations in all RCAP/ECAP areas. Concentration of Loan Originations in Oakland Hills and to a lesser extent North Oakland

75
Map 36: Number of Conventional Purchase Loans (2013) by Census Tract
Mirroring the previous map for all purchase loans, the conventional purchase loans indicates that the majority are based in the Oakland Hills and North Oakland. There are very few in East Oakland, Downtown and all of the RCAP/ECAP areas.

76
Map 37: Number of Government Purchase Loans (2013) by Census Tract
On the contrary to examining conventional loans, the majority of government insured purchase loans are concentrated in East Oakland, including in two RCAP/ECAP Census Tracts. However, there are still a very low number of government insured loans throughout the City.

77
Map 38: Average Purchase Loan Amount (2013) by Census Tract
The above map depicts the average purchase loan amount. This map further illustrates the discrepancy in wealth and income between the Oakland Hills and North Oakland compared to East Oakland and West Oakland, which have much lower average loan amounts.
Key Points There is a clear discrepancy between White/Non White populations in access to
mortgage lending/denial rates.
Data trends show increasing discrimination with medium- and upper-income levels when comparing different races/ethnicities.
The HMDA and Mortgage data relatively aligns with Alameda County as a whole.
When comparing this data to the 2008 MSA data (used for 2011 Analysis of Impediments), the 2013 data shows increased variation among race/ethnicity.

78
Bank Branch Locations In addition to analyzing HMDA and mortgage summary data, it is valuable to assess the access to retail banking and credit unions in the City to explore access to financial services. Areas that are underserved with banks and/or credit unions may have less access to housing finance services as well as be pressured to use high cost payday lending type services. The maps below indicate retail bank locations recorded by the Federal government compared to median household income and share of African-American and Latino residents. Map 39: Bank and Credit Union Branch Locations and Median Household Income
When analyzing the location of Banks and Credit Unions, the majority are concentrated in downtown’s commercial center. Banks are also fairly regularly located in North Oakland and close to the Oakland Airport. There are, however, a limited number of banks or credit unions in lower median household income areas, especially in East Oakland.

79
Map 40: Bank and Credit Union Branch Locations and % African-American Population

80
Map 41: Bank and Credit Union Branch Locations and % Hispanic Population
When analyzing the location of banks to areas of high concentration of African-American and Hispanic residents, the data indicates that there are a lower number of bank and credit union branch locations in areas with higher minority populations, indicating a potential greater challenge for basic banking services for minority residents.
Key Points
Lower income areas and areas with high minority concentration have limited access to financial services.
Aside from downtown RCAP/ECAP tracts, only one RCAP/ECAP tract in East Oakland has a retail banking location.
This data indicates a potential need for additional/improved access to financial services throughout the City.

81
Ⅵ. Impediments to Fair Housing Choice The previous sections of this report have identified the demographic, housing, socioeconomic, quality of life, and financial lending characteristics of the City as well as a brief profile of the City’s current policies and procedures as they relate to furthering fair housing. This report has also provided an overview of current procedures of ECHO Housing and fair housing compliant data gathered for the City of Oakland. Based on this analysis, the City of Oakland has identified a number of areas that could constitute impediments to fair housing choice. Each of these areas is discussed in more detail below. The impediments are categorized in three categories: Public, Public/Private, and Private. Public: Includes impediments and activities associated with zoning, building codes, regulated affordable housing, and municipal and other services. Public/Private: Includes impediments and activities associated with fair housing enforcement, outreach programs, private market inputs on affordable housing, and general housing market conditions. Private: Includes impediments and activities associated with lending policies and procedures and The ensuing section offers recommendations on strategies and actions to address these impediments.
Lack of Regulated Affordable Housing (Public) As documented in this report, the Oakland Housing Element, OHA 2016 Plan, 2015 Consolidated Plan, and other public and media reports, there is a severe shortage of suitable housing available and affordable to very low-, low-, and moderate-, income households in Oakland. As housing prices continue to rise, low- and moderate-income households, especially renters, are being priced out of traditionally affordable neighborhoods in the City. As documented in this report and the City’s Consolidated Plan, protected classes such as minorities, elderly, persons with disabilities, and female head of household are disproportionately low- and moderate-income households and are being more adversely impacted by the lack of regulated affordable housing than the population as a whole. Section 8 voucher holders are also disproportionately impacted by the lack of landlords willing to rent housing to Oaklander’s who hold this type of housing subsidy. As reported by stakeholders, there are a decreasing number of landlords that accept Section 8 vouchers. Consequently, more voucher holders need to look for rental housing outside of Oakland. The City of Oakland has taken great efforts in promoting affordable housing in the past five years, but with the loss of Redevelopment tax-increment funds dedicated to affordable housing, the reduction in Federal resources, and the increase in market demand, this issue remains a significant impediment to fair housing choice in Oakland and the Bay Area region.

82
Lack of Coordination among Fair Housing, Tenant Rights, and Advocacy Entities in the City (Public) A strength of Oakland’s fair housing services is the number of strong and active organizations that operate throughout the City. These organizations have an understanding of the needs of the community and actively work to affirmatively further fair housing throughout the City for a range of constituents. However, many of these organizations act independently without centralized coordination. Consequently, there is a potential for overlapping services or, alternatively, underserved areas/populations. Further, the lack of coordination may result in confusion among service providers and the client when two service providers are working with the same client. For example, the hand-off from a tenant/landlord service provider to a fair housing agency may not happen smoothly because roles and responsibilities are not clearly articulated and understood. While this lack of coordination per se is not an impediment to fair housing choice, there is an opportunity to improve and coordinate the service delivery of these organizations that would improve the effectiveness and efficiency of fair housing services in the City. In addition to this need for coordination, other housing and social service agencies do not have a strong understanding of fair housing and what constitutes housing discrimination. As a result, these organizations are neither well suited to help serve on the front line for identifying potential fair housing issues nor to reference clients to the appropriate service.
Opposition to Siting of Affordable Housing (Public) The City has made efforts in the past five years to mitigate opposition to siting of affordable housing in neighborhoods throughout Oakland. However, despite efforts made by the City, developers, and other stakeholders there is still opposition to affordable housing in neighborhoods throughout the City. City staff confirmed these challenges and they were reinforced by comments submitted by residents as part of the Consolidated Plan Public Hearings – in which residents made statements insinuating that no more affordable housing should be built in their neighborhoods. This community opposition limits the ability for the City to develop additional affordable housing to address the severe affordable housing shortage.
Planning, Land Use and Zoning Practices (Public) The City has made gains in improving planning and land use practices to eliminate constraints to developing affordable housing in the City. However, the City’s zoning code still maintains distinctions between transitional/supportive housing and general residential development. This distinction makes it more difficult to develop supportive or transitional housing in the City. Likewise, the City’s current zoning code places a 300 foot restriction on the proximity of more than one transitional housing project. Such a limitation prevents the development of scattered-site or even multiple transitional housing projects within close proximity to one another. This limits the areas within the City where new transitional housing can be identified. In terms of eliminating constraints to develop affordable housing, the City identified land use and planning practices in their 2015 Housing Element that initiate or further expedite the

83
development process for housing in the City. Delayed or lengthy planning processes increases the cost of affordable housing development, which ultimately limits the number of units that can be built. Continuing to monitor and identify potential areas where project delays can be minimized or removed entirely, will decrease project time and cost, and thus help to alleviate issues associated with the affordable housing development process.
Loss of Naturally Occurring Affordable Housing (Public/Private) Compounding the issue of lack of regulated affordable housing is the loss of naturally occurring affordable housing. With the tremendous increase in market demand for owner and renter-occupied units in the City, housing prices for both new homeowners and existing renters has dramatically increased. This loss of naturally occurring affordable housing has also led to significant displacement and gentrification as outlined in the assessment of changing demographic profiles in the City over the past decade. This is further illustrated in a recent study conducted by UC Berkeley researchers at the Urban Displacement Project, which identifies nearly all Census Tracts in Oakland as being at high risk for gentrification and displacement. The increase in demand (and corresponding displacement) and the impact on naturally occurring affordable housing is impacted by several public and private market conditions:
1. Approximately one third of all housing units in the City are rent controlled while any new construction built after January 1, 1983 has no such rent control provisions. Consequently, landlords are able to increase the cost of rental units for non-controlled properties to match market costs. These cost increases push many existing residents (predominately low- and moderate-income households) out of the Oakland rental market, displacing them to surrounding communities
2. Of those units that are protected under rent control, landlords are able to increase rental prices by making capital improvements to the building and passing-on a portion of those costs to their tenants. Given that tenants generally don’t have the time, resources, or understanding of rent control rules to be able to challenge unjust rent increases (ex. landlords making capital improvements that are actually just deferred maintenance), moving out becomes the most plausible option.
3. The foreclosure crisis recovery continues to impact both renters and owners. Renters of formerly foreclosed single family residences that were purchased by investors and placed on rental market are not protected by rent control. As the real estate market values increase in the City, investors are selling their investment and displacing households renting these units. For some owners, although the height of the foreclosure crisis has passed, there are still significant numbers of households that are losing their homes to foreclosure or who are at risk of foreclosure. For those owners who are not at risk of foreclosure but who live in neighborhoods that are not seeing impacts of non-local real estate investors, there continue to exist abandoned defaulted and foreclosed properties. Those housing units are registered in the City’s Foreclosed Property Blight Abatement program whose efforts are focused on ensuring that existing defaulted and foreclosed properties do not become nuisance properties that further decrease real estate values in neighborhoods. Additionally, City staff are working with a public interest law firm to protect long-standing Oakland owner-occupied housing residents

84
who were impacted by predatory loans that made their affordable housing payments, unaffordable. 4
As a result of these market conditions, many protected class households have been displaced or are at serious risk of displacement in the short-term.
Need for Landlord Education (Public/Private) Interviews with fair housing and service providers in Oakland identified that many landlords, primarily smaller landlords, lack knowledge of fair housing rules and requirements. Consequently, these landlords may discriminate (potentially inadvertently or without full understanding of the law) against protected classes. Anecdotally, service providers indicated that this discrimination seemed to be especially prevalent for persons with disabilities making reasonable accommodation requests to the landlord. Both service providers and the East Bay Rental Housing Association offer workshops, training and resources on fair housing rules and regulations for landlords. However, based on the input from service providers, these resources may not be reaching all landlords. Consequently, discrimination (whether inadvertent or not) may occur resulting in a potential impediment to fair housing choice for protected classes.
Lack of Accessible Units (Public/Private) Due to the age and style of the housing stock in Oakland, there is a limited number of accessible units in the City. Furthering this issue, households with members with a disability are more likely to be low- or moderate-income households who do not have the financial resources to make the necessary accommodations to housing units to make them accessible. This limited number of accessible units in addition to the inability of households with members with a disability to make their units accessible are impediments to fair housing choice for persons with a disability. Currently, the City operates an Access Improvement Program that provides grants for reasonable accommodations for owner- and renter-occupied households. However, this funding is not adequate to fully address the need and many owners and renters do not know that this program exists.
Discrimination Regarding Accessible Features (Public/Private) In interviews with service providers, providers anecdotally cited that one of the most common complaints was regarding discrimination about service animals and accessible features. Discrimination claims ranged from landlords refusing to allow service animals to be present in the unit to not allowing the addition of ramps and other accessibility features. The complaint data compiled by ECHO, CDFEH, and HUD validates this claim since the majority of the complaints were associated with discrimination with the most common complaint being landlords refusing service animals. Fair housing service providers in Oakland suggested this was
4 City of Oakland Agenda Report “Quarterly Report on Foreclosure Issues” February 26, 2015 presented at the Community Economic Development Committee on March 24, 2015.

85
potentially due to lack of knowledge of legislation that prevents discrimination of a tenant due to a service animal.
Lack of Access to Community Assets (Public/Private) As indicated in the quality of life, financial, and employment data, RCAP/ECAP, areas of high minority concentration, and low-income areas have limited access to community assets, banks, transit and employment centers when compared with the City as a whole. The limited access to these assets has an adverse impact on the residents (disproportionately protected classes) to have access to jobs, quality schools, fresh food and financial institutions.
Foreclosure Recovery: Homeowners, Renters, and their Communities (Public/Private) As noted in the analysis of foreclosed properties, the rate of foreclosure in Oakland has declined since the last Analysis of Impediments. However, there is still a concentration of foreclosed properties in East Oakland including within the RCAP/ECAP Census Tracts. Furthermore, many individuals, families, and the community at large are still dealing with the repercussions of being foreclosed upon. Foreclosures lower property values in the surrounding neighborhood and cause blight. Neighborhood absentee homeowners (i.e. banks) also do not adequately manage the vacant properties resulting in blight and locations for criminal activities, further lowering property values. This, in turn, threatens the remaining homeowners’ ability to refinance homes and limits incentives for potential homebuyers to move into the neighborhood. Foreclosed homeowners are also left with little to no savings and reduced credit scores resulting in difficulty obtaining funding for future homes. Renters in properties that were foreclosed on also are adversely affected including unlawful eviction attempts, health problems due to unresponsive landlords in pre-foreclosure situations, lack of stability especially for persons with disabilities, seniors, and families with children, in addition to other issues associated with the change of building ownership such as evictions due to non-payment, payment for moving, and rent increases. The repercussions of foreclosures on homeowners, renters, and the community at large is an impediment to fair housing.
Lending/Sales Discrimination (Private) As indicated in the Mortgage Sales summary data (HMDA data profile), there is a significant differences between White household mortgage denial rates when compared to Latino and African American households. The discrepant share of African American households denied is especially apparent for medium-income and higher-income households. In the course of developing the document, the Oakland City Attorney has filed a lawsuit against Wells Fargo Bank alleging predatory lending targeted to minority households in Oakland. While the number of high cost loans has declined in the City since the last Analysis of Impediments, there is still a higher prevalence of non-White households who receive high cost mortgages, especially for Home Improvement loans.

86
The discrepancies in denial rates are further compounded by the limited number of loan originations in West, downtown and East Oakland (areas that tend to be lower-income and higher minority concentration) and are the locations of all of the RCAP/ECAPs in the City. As a result, the wealth gap in Oakland is likely rising between high-income and low- and moderate-income households. This potential discrimination by race/ethnicity in seeking mortgage loans is a clear impediment to housing choice.

87
Ⅶ. Fair Housing Action Plan This Analysis of Impediments to Fair Housing Choice has provided information on the population and housing needs of Oakland, with a special emphasis on the needs of racial and ethnic minorities, families with children, persons with disabilities, and other members of protected classes under federal non-discrimination laws and regulations. Oakland is a city of great racial and ethnic diversity, in which groups which are racial and ethnic minorities at the national level are in fact in the majority in the City. The City also has significant number of seniors and people with disabilities, for whom there may be a need for housing with supportive services. There are also a significant number of families with five or more persons, who find it extremely difficult to secure adequate and affordable housing. Analysis of data available also indicated that low-income and minority households are more likely to be in areas with limited community assets. As described by HUD in the recent Affirmatively Furthering Fair Housing Rule, requires communities to assess disparity in access to community services such as transit, quality schools and open space. The concentration of RCAP/ECAP areas in these areas with limited services and assets meets the new AFFH definition of an impediment to fair housing choice. The City must continue to target and address these areas of concentrated poverty and minority concentration and promote affordable housing in asset-rich areas. On the contrary, the City has made significant strides in affirmatively furthering fair housing through planning code amendments, public housing policies and housing and community development programs by attempting to target housing developments in non-concentrated areas of poverty and encourage development to be within proximity to asset rich areas. The City should continue to promote and expand these policies to continue to further fair housing choice and streamline the development process for affordable housing. In addition to these policies and targeting developments in areas without high concentrations of poverty, the City has also allocated significant resources to fair housing programs through its CDBG programs in the past five years that have had a positive impact on the delivery of fair housing and tenant/landlord services. The City should continue to fund both fair housing services as well as promote affirmatively furthering fair housing through its various programs and policies. To that end, the following actions are recommended to address impediments and affirmatively further fair housing:
General Action Elements In preparing to address these responses, the City recognizes that many of the fair housing issues, especially those impacted by the private market, are regional in nature and cannot be addressed by Oakland alone. To this end, the City of Oakland will invite neighboring cities and regional organizations to participate in a planning strategy to identify ways that the region can address fair housing issues such as the increasing rate of displacement and discrimination in the mortgage market. General actions the City will take to address impediments to fair housing include:
1. Identify a primary lead from the Housing and Community Development to serve as point person to drive this Action Plan for the next five years.
88
2. Produce progress reports on all action items on an annual basis in the Annual HUD Reporting document (CAPER).
3. Host a planning session with regional organizations and local governments to discuss strategies on how to address fair housing issues from a regional perspective
4. Host a series of summits with housing providers, fair housing organizations and other stakeholders regularly (at least twice a year) to confirm progress towards addressing fair housing issues over next 5 years.
5. Convene meeting with East Bay governments and agencies to collaborate on service delivery to explore strategies to unify data collection and service delivery into a more streamlined process.
Lack of Regulated Affordable Housing (Public)
Continue to work with developers, Federal, State and other stakeholders to identify and pursue all available funding for affordable housing.
Identify potential city-owned parcels or other sites that can be used for affordable housing developments as articulated in the Housing Element and in accordance with the City’s real estate disposition laws. HCD will work with other departments to identify potential parcels for mixed-income (including possibly affordable housing) and report to City Council and ways in which the City could comply with the Surplus Land Act, if applicable.
Through its HOME and other Housing NOFAs, HCD will encourage siting of affordable housing in areas without concentrations of poverty.
Through its HOME and other Housing NOFAs, HCD will encourage siting of affordable housing in asset-rich areas.
Continue to streamline development and permitting process to reduce costs for affordable housing. HCD will gather input from affordable housing developers on additional strategies to streamline development process and assess if recommendations can be incorporated into development process.
Explore and identify potential land use policies and zoning concessions such as inclusionary zoning, parking requirements that can be made to reduce cost of development and promote affordable housing or allowance of secondary units. HCD should prepare an analysis of the possible increase in affordable housing in Oakland based on these policies and share with City Council.
Continue pending analysis of potential development impact fees, including a housing impact fee to fund affordable housing development with an in-lieu on-site inclusionary option.
Meet with OHA to understand what data, if any, is collected regarding landlords who oppose Section 8 and facilitate a discussion on what outreach the City and OHA could initiate to these landlords on the benefits of Section 8 program.
Establish goal of preserving all affordable housing units expiring in next ten years.
Lack of Coordination among Fair Housing/Advocacy Entities (Public)
Identify point of contact to be responsible for coordinating all activities with fair housing providers at City.
Conduct kick-off meeting with city-funded fair housing/advocacy entities with City to establish roles and responsibilities.
Facilitate quarterly meetings with city-funded fair housing/advocacy entities with City to ensure ongoing coordination and alignment.

89
Explore coordinated database development or reporting to enable City or appointed agent to collect and analyze data at city-wide level.
Explore coordinated development and delivery of trainings, outreach and other efforts to ensure all areas/populations of Oakland are adequately served.
Promote semi-annual or annual trainings from different advocacy entities for all city funded service agencies on various elements of fair housing and tenant rights.
Opposition to Siting of Affordable Housing (Public)
HCD, City Council and Mayor to establish clear message on importance of affordable housing and that City is in support of affordable housing.
Continue to work with developers to conduct community outreach programs as part of predevelopment process.
Consult with legal service provider in region to provide legal education to stakeholders on California Government Code that prevents discrimination on the development of housing based on the source of financing used for that development.
Use language such as “enhancing neighborhoods” to avoid negative connotation of affordable housing.
Conduct proactive outreach to council members and community leaders.
As noted above, assess feasibility of inclusionary zoning to leave no choice for siting of affordable housing.
Continue to participate and promote Affordable Housing week.
Coordinate with Oakland Housing Authority in outreach and marketing campaigns.
Continue to provide technical and/or financial support to organizations that are involved in education and information campaigns.
Continue to monitor existing affordable housing to ensure that property is well maintained.
Continue to encourage formation of resident councils in affordable housing developments to foster sense of commitment to and participation in neighborhood activities.
Planning, Land Use and Zoning Practices (Public)
Continue to streamline processes for the issuance of zoning/building permits for affordable housing.
Use existing service provider and stakeholder networks to engage low- and moderate-income households in discussions regarding zoning and changes to the planning code and access to land use and zoning policies.
Explore additional planning/zoning concessions that can be made to affordable housing developments.
Explore use and viability of affordable housing development impact fee.
Continue to gather input and feedback on ways to improve planning, land use and zoning practices from practitioners and stakeholders.
Recommend to Strategic Planning office to revise zoning code to treat transitional/supportive housing in same manner as residential units.
Recommend to Strategic Planning office to revise zoning code to eliminate 300 foot restriction for development of multiple supportive housing projects.
Evaluate secondary unit regulations as option of increasing number of housing units and/or affordable housing units in the City.

90
As noted above, evaluate the impact and feasibility of inclusionary zoning to increase affordable housing in the City and provide a report to City Council on the outcomes of the evaluation.
Loss of Naturally Occurring Affordable Housing (Public/Private)
HCD to study and possibly propose an expanded rent control model to better protect tenants and maintain affordable housing within the City.
HCD to continue support of Community Buying Program with the goal of assisting developers to purchase tax defaulted, foreclosed, abandoned, or unmaintained properties for the development of affordable homeownership opportunities.
Action items from the above “Lack of Regulated Affordable Housing” that address the development and supply of more affordable housing also apply to this impediment given that it will reduce the number of people that will have to move due to market demand.
Need for Landlord Education (Public/Private)
Conduct landlord education summit with housing service providers, East Bay Rental Housing Association and other stakeholders to identify education gaps in landlord education.
Conduct outreach and education to broaden reach of stakeholders including business groups such as Chamber of Commerce.
Coordinate with housing service providers and East Bay Rental Housing Association to market fair housing trainings and resources. Potential marketing strategies include:
o Leveraging lending institutions and banks to provide training, resource and contact information to landlords or potential landlords
o Conduct media campaigns through utility bills o Market trainings in newspapers, social media and other outlets o Advertise at meetings and social events for landlord associations
Use quizzes or assessment tools to test knowledge and impact of training to ensure that participant achieves training learning objectives.
Lack of Accessible Units (Public/Private)
Continue to provide Access Improvement Program grants to homeowners and landlords.
Coordinate efforts and activities with disability rights advocacy and outreach organizations in Oakland.
Continue to require 504 accessible units to be built in City assisted rental developments.
Establish additional landlord incentives such as microloans to make units more accessible.
Discrimination Regarding Accessible Features (Public/Private)
Continue to provide funding to nonprofit agencies to provide fair housing counseling, complaint investigation and referral services.
Provide trainings on fair housing regulations regarding persons with disabilities and reasonable accommodations.
91
Continue to provide fair housing workshops and public outreach efforts, ensuring that activities include guidance on discrimination regarding accessible features.
Provide counseling and outreach to persons with disabilities on how to identify discrimination regarding accessible features.
Establish better landlord incentives such as microloans to make units more accessible.
Lack of Access to Community Assets (Public/Private)
Continue to target affordable housing in areas that are asset-rich and not in areas of concentrated poverty.
Leverage other HUD resources to improve community assets and conditions in areas of minority concentration and RCAP/ECAP areas.
Coordinate efforts with other City/County agencies to improve community assets and conditions in areas of minority concentration and RCAP/ECAP areas.
Foreclosure Recovery: Homeowners, Renters, and their Communities (Public/Private) As listed in the City’s 2011 Analysis of Impediments, the following actions will continue to be pursued:
Encourage more research to gain a deeper understanding of the role of race in mortgage lending and foreclosure prevention in order to inform public policy and encourage the accountability of financial institutions.
Continue to work with non-profit housing services providers to target programs to extremely low, low and moderate income homeowners at risk of losing their homes to foreclosure.
Support housing counseling efforts by either providing City funding or supporting applications for outside funding.
Continue to enforce the City’s Just Cause Ordinance to protect tenants from being evicted from foreclosed housing units.
Lending/Sales Discrimination (Private)
Continue to provide funding to nonprofit agencies to provide fair housing counseling, complaint investigation and referral services.
Provide financial support for fair housing audits for rental and homeownership properties.
Support law firms that work with affordable housing owners and agents to provide assistance regarding fair housing practices.
Continue to provide fair housing workshops and public education outreach efforts
Conduct targeted outreach, support and counseling to minority households.
Explore including HMDA Institution Data Reports as part of Linked Banking Services Ordinance analysis for Oakland financial institutions.
Consult with City Attorney annually to review HMDA data and post summary of findings publically.
Promote creative marketing and outreach to residents regarding lending practices.
Promote more stringent audit practices – if landlords, sellers, or banks are in violation of fair housing policy, proceed with lawsuit.

Ⅷ. Appendices
Stakeholder and Community Meeting Attendees
Name Organization Meeting
Judy Jackson Everyone Home Stakeholder Meeting
Lisa Greif Bay Area Legal Aid Stakeholder Meeting
Ellyn Gendler Bay Area Legal Aid Stakeholder Meeting
Nick Dubruff Public Advocates Stakeholder Meeting
David Zisser Public Advocates Stakeholder Meeting
Jacee Santos Housing Consortium of the Easy Bay Stakeholder Meeting
Lucy Kasdin Bay Area Community Services Stakeholder Meeting
Erik Enriquez Bay Area Community Services Stakeholder Meeting
Travis Poor Bay Area Community Services Stakeholder Meeting
Lisa Hopkins Housing Consortium of the Easy Bay Stakeholder Meeting
Michele Byrd City of Oakland Stakeholder Meeting
Gustavo Guzman Community Meeting
Greg Garrett City of Oakland Community Meeting
Douglas Williams City of Oakland Community Meeting
Denise Turner City of Oakland - DHS Community Meeting
Laura Reye Community Meeting

95.34% 1,331
4.66% 65
Q1 Do you live in the City of Oakland?Answered: 1,396 Skipped: 8
Total 1,396
Yes
No
0% 10% 20% 30% 40% 50% 60% 70% 80% 90% 100%
Answer Choices Responses
Yes
No
1 / 36
Oakland Resident Consolidated Plan Survey

50.24% 640
14.84% 189
87.91% 1,120
Q2 Please check all that apply:Answered: 1,274 Skipped: 130
Total Respondents: 1,274
I work inOakland
I havechildren in...
I regularlyparticipate ...
0% 10% 20% 30% 40% 50% 60% 70% 80% 90% 100%
Answer Choices Responses
I work in Oakland
I have children in Oakland Public Schools
I regularly participate in Oakland recreational, cultural or leisure activities
2 / 36
Oakland Resident Consolidated Plan Survey

Q3 Please identify the zip code where youlive:
Answered: 1,247 Skipped: 157
3 / 36
Oakland Resident Consolidated Plan Survey

Q4 If you could change one thing in yourneighborhood, what would it be?
Answered: 1,208 Skipped: 196
4 / 36
Oakland Resident Consolidated Plan Survey

34.47% 425
22.22% 274
43.31% 534
Q5 Do you think the physical condition ofthe public space in your neighborhood
(streets, sidewalks, parks) is:Answered: 1,233 Skipped: 171
Total 1,233
Stable
Improving
Declining
0% 10% 20% 30% 40% 50% 60% 70% 80% 90% 100%
Answer Choices Responses
Stable
Improving
Declining
5 / 36
Oakland Resident Consolidated Plan Survey

50.61% 624
38.85% 479
10.54% 130
Q6 Do you feel safe in your immediateneighborhood?
Answered: 1,233 Skipped: 171
Total 1,233
Yes
No
Unsure/NotApplicable
0% 10% 20% 30% 40% 50% 60% 70% 80% 90% 100%
Answer Choices Responses
Yes
No
Unsure/Not Applicable
6 / 36
Oakland Resident Consolidated Plan Survey

48.90% 602
38.34% 472
12.75% 157
Q7 Do you think the physical condition ofhousing in your neighborhood is:
Answered: 1,231 Skipped: 173
Total 1,231
Stable
Improving
Declining
0% 10% 20% 30% 40% 50% 60% 70% 80% 90% 100%
Answer Choices Responses
Stable
Improving
Declining
7 / 36
Oakland Resident Consolidated Plan Survey

86.03% 1,096
7.46% 95
6.51% 83
Q8 Do you perceive economicdevelopment/job creation to be a critical
issue in the City?Answered: 1,274 Skipped: 130
Total 1,274
Yes
No
Unsure/NotApplicable
0% 10% 20% 30% 40% 50% 60% 70% 80% 90% 100%
Answer Choices Responses
Yes
No
Unsure/Not Applicable
8 / 36
Oakland Resident Consolidated Plan Survey

61.51% 783
17.28% 220
21.21% 270
Q9 Do you think abandoned or foreclosedproperties are a critical issue in the City?
Answered: 1,273 Skipped: 131
Total 1,273
Yes
No
Unsure/NotApplicable
0% 10% 20% 30% 40% 50% 60% 70% 80% 90% 100%
Answer Choices Responses
Yes
No
Unsure/Not Applicable
9 / 36
Oakland Resident Consolidated Plan Survey

5.86% 75
14.69% 188
47.34% 606
29.77% 381
29.45% 377
12.81% 164
25.39% 325
43.98% 563
8.28% 106
Q10 What are the two most importantconsiderations to you in choosing a place
to live (pick two)?Answered: 1,280 Skipped: 124
Total Respondents: 1,280
Family nearby
Close to work
Price ofhousing
Convenient toneighborhood...
Access topublic...
Access toquality...
Attractivenessof neighborhood
Public safety
Other (pleasespecify)
0% 10% 20% 30% 40% 50% 60% 70% 80% 90% 100%
Answer Choices Responses
Family nearby
Close to work
Price of housing
Convenient to neighborhood amenities
Access to public transportation
Access to quality schools/youth services
Attractiveness of neighborhood
Public safety
Other (please specify)
10 / 36
Oakland Resident Consolidated Plan Survey

Q11 Please rank the level of need for thefollowing types of Community Developmentin the City (1 = most critical need; 6 = least
critical need):Answered: 1,226 Skipped: 178
Safe andAffordable...
Community/Neighborhood...
Community/Neighborhood...
EconomicDevelopment
11 / 36
Oakland Resident Consolidated Plan Survey

6.75%82
19.36%235
72.49%880
1.40%17
1,214
7.96%97
41.46%505
45.32%552
5.25%64
1,218
10.39%125
47.96%577
37.49%451
4.16%50
1,203
4.14%50
26.93%325
66.28%800
2.65%32
1,207
3.52%43
28.26%345
66.91%817
1.31%16
1,221
Low Need Moderate Need High Need Unsure/Not Applicable
Infrastructure(Streets,...
0% 10% 20% 30% 40% 50% 60% 70% 80% 90% 100%
Low Need Moderate Need High Need Unsure/Not Applicable Total
Safe and Affordable Housing
Community/Neighborhood Services
Community/Neighborhood Facilities
Economic Development
Infrastructure (Streets, Sidewalks, Parks)
12 / 36
Oakland Resident Consolidated Plan Survey

Q12 Please rank the level of need for thefollowing types of Public Services in the
City:Answered: 1,228 Skipped: 176
YouthServices/Chi...
Senior Services
JobTraining/Rea...
Health/Behavioral Health...
Homebuyer
13 / 36
Oakland Resident Consolidated Plan Survey

Low Need Moderate Need High Need Unsure/Not Applicable
Education/Fi...
Fair Housing
Services forPersons with...
HomelessServices
DomesticViolence...
0% 10% 20% 30% 40% 50% 60% 70% 80% 90% 100%
14 / 36
Oakland Resident Consolidated Plan Survey

5.78%70
21.88%265
58.22%705
14.12%171
1,211
6.28%76
37.02%448
39.42%477
17.27%209
1,210
4.54%55
24.11%292
62.43%756
8.92%108
1,211
4.88%59
29.14%352
57.78%698
8.20%99
1,208
21.10%254
41.78%503
26.66%321
10.47%126
1,204
11.54%140
28.77%349
53.26%646
6.43%78
1,213
9.12%110
39.14%472
34.83%420
16.92%204
1,206
7.01%85
27.39%332
58.99%715
6.60%80
1,212
6.71%81
32.04%387
44.45%537
16.80%203
1,208
Low Need Moderate Need High Need Unsure/Not Applicable Total
Youth Services/Child Care
Senior Services
Job Training/Readiness Programs
Health/Behavioral Health Services
Homebuyer Education/Financial Literacy
Fair Housing
Services for Persons with Disabilities
Homeless Services
Domestic Violence Services
15 / 36
Oakland Resident Consolidated Plan Survey

50.50% 603
2.26% 27
7.71% 92
3.02% 36
1.01% 12
17.25% 206
1.76% 21
1.68% 20
5.03% 60
9.80% 117
Q13 Are you satisfied with your currentliving situation? If no, what is the primary
reason you are not?Answered: 1,194 Skipped: 210
Total 1,194
I am happywith my curr...
No, too farfrom work.
No, tooexpensive.
No, too small.
No, toocrowded.
No, I don'tfeel safe in...
No, pooraccess to...
No, poorhousing...
No, pooraccess to go...
Other (pleasespecify)
0% 10% 20% 30% 40% 50% 60% 70% 80% 90% 100%
Answer Choices Responses
I am happy with my current living situation.
No, too far from work.
No, too expensive.
No, too small.
No, too crowded.
No, I don't feel safe in the neighborhood.
No, poor access to public transportation.
No, poor housing condition.
No, poor access to good schools or other neighborhood amenities.
Other (please specify)
16 / 36
Oakland Resident Consolidated Plan Survey

62.51% 732
3.25% 38
33.13% 388
4.61% 54
2.82% 33
14.52% 170
7.77% 91
1.28% 15
7.09% 83
Q14 Would you like to move from yourcurrent home or apartment? If yes, what arethe three main reasons you haven’t moved
yet. (pick up to three)Answered: 1,171 Skipped: 233
I do not wantto move from...
Need theaccessibilit...
Can’t affordto move/can’...
Family reasons
Family membersdo not want ...
Can’t find abetter place...
Rentals arefull; can’t...
Landlordsdon’t take...
Job is here
Family is here
Other (pleasespecify)
0% 10% 20% 30% 40% 50% 60% 70% 80% 90% 100%
Answer Choices Responses
I do not want to move from my current home/apartment.
Need the accessibility features of my current housing unit
Can’t afford to move/can’t afford to live anywhere else
Family reasons
Family members do not want to move
Can’t find a better place to live
Rentals are full; can’t find a place to rent
Landlords don’t take Section 8
Job is here
17 / 36
Oakland Resident Consolidated Plan Survey

5.29% 62
9.65% 113
Total Respondents: 1,171
Family is here
Other (please specify)
18 / 36
Oakland Resident Consolidated Plan Survey
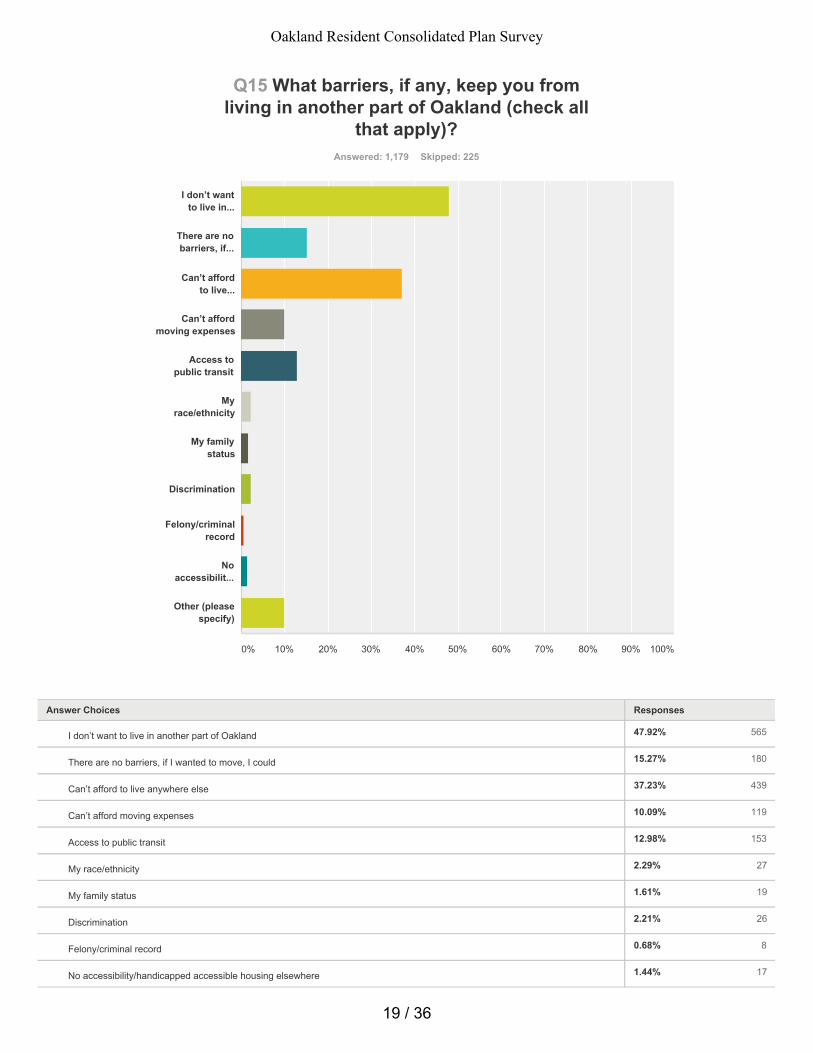
47.92% 565
15.27% 180
37.23% 439
10.09% 119
12.98% 153
2.29% 27
1.61% 19
2.21% 26
0.68% 8
1.44% 17
Q15 What barriers, if any, keep you fromliving in another part of Oakland (check all
that apply)?Answered: 1,179 Skipped: 225
I don’t wantto live in...
There are nobarriers, if...
Can’t affordto live...
Can’t affordmoving expenses
Access topublic transit
Myrace/ethnicity
My familystatus
Discrimination
Felony/criminalrecord
Noaccessibilit...
Other (pleasespecify)
0% 10% 20% 30% 40% 50% 60% 70% 80% 90% 100%
Answer Choices Responses
I don’t want to live in another part of Oakland
There are no barriers, if I wanted to move, I could
Can’t afford to live anywhere else
Can’t afford moving expenses
Access to public transit
My race/ethnicity
My family status
Discrimination
Felony/criminal record
No accessibility/handicapped accessible housing elsewhere
19 / 36
Oakland Resident Consolidated Plan Survey

9.92% 117
Total Respondents: 1,179
Other (please specify)
20 / 36
Oakland Resident Consolidated Plan Survey

79.17% 950
20.83% 250
Q16 Do you, or someone in your household,have a disability of any type?
Answered: 1,200 Skipped: 204
Total 1,200
No, nobody inmy household...
Yes, someonein my househ...
0% 10% 20% 30% 40% 50% 60% 70% 80% 90% 100%
Answer Choices Responses
No, nobody in my household has a disability of any type
Yes, someone in my household has a disability
21 / 36
Oakland Resident Consolidated Plan Survey

Q17 Please rate your level of agreementwith the following statements:
Answered: 252 Skipped: 1,152
Either ahousehold...
I can’t afforda housing un...
My landlordrefused to...
My landlordrefused to m...
22 / 36
Oakland Resident Consolidated Plan Survey

13.10%33
26.59%67
22.62%57
18.65%47
19.05%48
252
16.19%40
24.70%61
11.74%29
10.93%27
36.44%90
247
14.11%34
16.60%40
3.32%8
0.83%2
65.15%157
241
14.40%35
15.23%37
4.12%10
3.29%8
62.96%153
243
Strongly Disagree Disagree Agree Strongly Agree N/A
0% 10% 20% 30% 40% 50% 60% 70% 80% 90% 100%
StronglyDisagree
Disagree Agree StronglyAgree
N/A Total
Either a household member or I have a disability and cannot get around theneighborhood because of broken sidewalks/no sidewalks/poor street lighting.
I can’t afford a housing unit that has accessibility/handicapped features (e.g. grab bars,ramps, handicapped parking).
My landlord refused to accept a service animal.
My landlord refused to make an accommodation for me or my household member’sdisability.
23 / 36
Oakland Resident Consolidated Plan Survey

Q18 When you looked for housing to rent orbuy in Oakland in the past five years, wereyou ever denied housing to rent or buy? If
yes, why (check all that apply)?Answered: 1,118 Skipped: 286
I have notlooked for...
I was notdenied housi...
Other buyerpaid cash or...
Size of myfamily/house...
Bad credit
Income too low
Healthcondition/HIV
Sexualorientation ...
Immigrationstatus
Source ofincome
Race/ethnicity
Foreclosurehistory
Service animal
Section8/Housing...
Evictionhistory
Criminalbackground
0% 10% 20% 30% 40% 50% 60% 70% 80% 90% 100%
24 / 36
Oakland Resident Consolidated Plan Survey

49.46% 553
32.20% 360
14.76% 165
0.81% 9
4.38% 49
8.05% 90
0.09% 1
0.63% 7
0.18% 2
3.94% 44
1.43% 16
0.72% 8
0.36% 4
0.63% 7
0.63% 7
0.36% 4
Total Respondents: 1,118
Answer Choices Responses
I have not looked for housing to rent or buy in the past five years
I was not denied housing to rent or buy
Other buyer paid cash or a higher price
Size of my family/household
Bad credit
Income too low
Health condition/HIV
Sexual orientation or gender identity
Immigration status
Source of income
Race/ethnicity
Foreclosure history
Service animal
Section 8/Housing Choice Voucher
Eviction history
Criminal background
25 / 36
Oakland Resident Consolidated Plan Survey

3.86% 45
3.09% 36
4.97% 58
81.56% 951
6.52% 76
Q19 Have you ever felt you werediscriminated against when looking for
housing in Oakland?Answered: 1,166 Skipped: 238
Total 1,166
Yes, in thepast year
Yes, 2 to 5years ago
Yes, more than5 years ago ...
No
Unsure
0% 10% 20% 30% 40% 50% 60% 70% 80% 90% 100%
Answer Choices Responses
Yes, in the past year
Yes, 2 to 5 years ago
Yes, more than 5 years ago or I don’t remember when
No
Unsure
26 / 36
Oakland Resident Consolidated Plan Survey

7.65% 15
4.59% 9
3.06% 6
3.57% 7
5.61% 11
77.04% 151
11.73% 23
Q20 If you felt you were discriminatedagainst, what did you do about the
discrimination (check all that apply)?Answered: 196 Skipped: 1,208
Total Respondents: 196
Called/emailedFair Housing...
Called emailedother...
Called/emailedHousing...
Called/emailedgovernment...
Called/emaileda lawyer
Nothing
Other
0% 10% 20% 30% 40% 50% 60% 70% 80% 90% 100%
Answer Choices Responses
Called/emailed Fair Housing organization
Called emailed other organization
Called/emailed Housing Authority
Called/emailed government agency
Called/emailed a lawyer
Nothing
Other
27 / 36
Oakland Resident Consolidated Plan Survey

2.56% 5
2.56% 5
0.00% 0
0.00% 0
1.54% 3
0.00% 0
0.00% 0
91.28% 178
5.13% 10
Q21 Did you file a complaint after you werediscriminated against (check all that apply)?
Answered: 195 Skipped: 1,209
Total Respondents: 195
Yes, to theState of...
Yes, to theDepartment o...
Yes, to CausaJusta/Just...
Yes, to Centerfor Independ...
Yes, to ECHOHousing
Yes, to CentroLegal de la...
Yes, to EastBay Communit...
No, I did notfile a...
Yes, Other(please...
0% 10% 20% 30% 40% 50% 60% 70% 80% 90% 100%
Answer Choices Responses
Yes, to the State of California
Yes, to the Department of Housing and Urban Development (HUD)
Yes, to Causa Justa/Just Cause
Yes, to Center for Independent Living
Yes, to ECHO Housing
Yes, to Centro Legal de la Raza
Yes, to East Bay Community Law Center
No, I did not file a compliant
Yes, Other (please specify)
28 / 36
Oakland Resident Consolidated Plan Survey

Q22 If you filed a complaint, please describeif the complaint was resolved, how long it
took to be resolved, and if you weresatisfied with the outcome.
Answered: 12 Skipped: 1,392
29 / 36
Oakland Resident Consolidated Plan Survey

32.74% 383
67.26% 787
Q23 What is your gender?Answered: 1,170 Skipped: 234
Total 1,170
Male
Female
0% 10% 20% 30% 40% 50% 60% 70% 80% 90% 100%
Answer Choices Responses
Male
Female
30 / 36
Oakland Resident Consolidated Plan Survey

70.68% 822
14.96% 174
2.67% 31
9.80% 114
0.69% 8
9.37% 109
Q24 Please provide your race (check all thatapply):
Answered: 1,163 Skipped: 241
Total Respondents: 1,163
White
Black orAfrican...
AmericanIndian and...
Asian
NativeHawaiian and...
Other race
0% 10% 20% 30% 40% 50% 60% 70% 80% 90% 100%
Answer Choices Responses
White
Black or African American
American Indian and Alaska Native
Asian
Native Hawaiian and Other Pacific Islander
Other race
31 / 36
Oakland Resident Consolidated Plan Survey

8.41% 87
91.59% 948
Q25 Please provide your race ethnicity:Answered: 1,035 Skipped: 369
Total 1,035
Hispanic orLatino
Not Hispanicor Latino
0% 10% 20% 30% 40% 50% 60% 70% 80% 90% 100%
Answer Choices Responses
Hispanic or Latino
Not Hispanic or Latino
32 / 36
Oakland Resident Consolidated Plan Survey

24.57% 287
62.59% 731
4.54% 53
2.83% 33
7.79% 91
13.61% 159
3.94% 46
Q26 Please describe your household (checkall that apply):
Answered: 1,168 Skipped: 236
Total Respondents: 1,168
Single person
Smallhousehold (2...
Largehousehold (m...
Single parent
Household withchildren und...
Elderlyhousehold wi...
Elderlyhousehold wi...
0% 10% 20% 30% 40% 50% 60% 70% 80% 90% 100%
Answer Choices Responses
Single person
Small household (2-4 people)
Large household (more than 4 people)
Single parent
Household with children under 6 years of age
Elderly household with at least one person between the ages of 62 and 74
Elderly household with at least one person age 75 or older
33 / 36
Oakland Resident Consolidated Plan Survey

53.80% 630
8.11% 95
2.22% 26
3.25% 38
0.68% 8
11.96% 140
15.46% 181
2.22% 26
2.31% 27
Q27 Please provide your employmentstatus:
Answered: 1,171 Skipped: 233
Total 1,171
Employed fulltime
Employed parttime
Student
Not employed,looking for...
Not employedNOT looking ...
Self-employed
Retired
Disabled, notable to work
Work in home(caregiver,...
0% 10% 20% 30% 40% 50% 60% 70% 80% 90% 100%
Answer Choices Responses
Employed full time
Employed part time
Student
Not employed, looking for work
Not employed NOT looking for work
Self-employed
Retired
Disabled, not able to work
Work in home (caregiver, homemaker)
34 / 36
Oakland Resident Consolidated Plan Survey

2.23% 25
6.41% 72
5.70% 64
10.42% 117
14.43% 162
18.43% 207
42.39% 476
Q28 What category does your totalhousehold income fall (include income from
all sources)?Answered: 1,123 Skipped: 281
Total 1,123
Less than$10,000
$10,000 -$25,000
$25,000 -$35,000
$35,000 –$50,000
$50,000 -$75,000
$75,000 -$100,000
More than$100,000
0% 10% 20% 30% 40% 50% 60% 70% 80% 90% 100%
Answer Choices Responses
Less than $10,000
$10,000 - $25,000
$25,000 - $35,000
$35,000 – $50,000
$50,000 - $75,000
$75,000 - $100,000
More than $100,000
35 / 36
Oakland Resident Consolidated Plan Survey

33.68% 394
65.56% 767
0.26% 3
4.53% 53
11.03% 129
1.62% 19
6.58% 77
1.79% 21
Q29 Please provide your housing status(check all that apply):
Answered: 1,170 Skipped: 234
Total Respondents: 1,170
Rent
Own home
Homeless
Living doubledup/with frie...
Have anotherperson/famil...
Receive ahousing subsidy
Havedifficulty...
Have been lateon rent or...
0% 10% 20% 30% 40% 50% 60% 70% 80% 90% 100%
Answer Choices Responses
Rent
Own home
Homeless
Living doubled up/with friends or family
Have another person/family living in my home
Receive a housing subsidy
Have difficulty making monthly housing expenses
Have been late on rent or mortgage payments at least twice in last six months
36 / 36
Oakland Resident Consolidated Plan Survey