city of oakland mobility hub suitability analysis...
TRANSCRIPT
City of Oakland Mobility Hub Suitability Analysis Technical Report
Presented to the City of Oakland in December 2015 by
218 Consultants University of California, Berkeley Department of City and Regional Planning Transportation Planning Studio, Fall 2015
Karl Anderson | Samuel Blanchard | Derek Cheah | Adam Koling | Drew Levitt
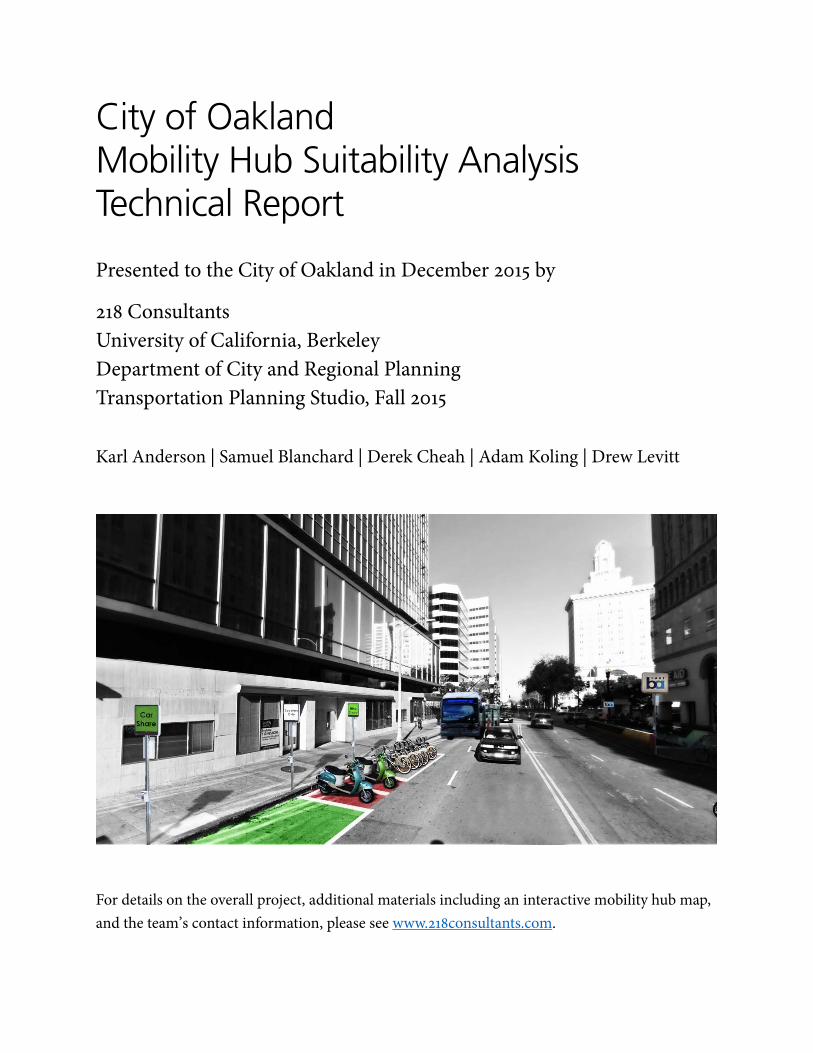
For details on the overall project, additional materials including an interactive mobility hub map, and the team’s contact information, please see www.218consultants.com.

This page intentionally left blank.

218 Consultants Fall 2015
1
Executive Summary Introduction Within the last decade, several new transportation options have emerged in the San Francisco Bay Area that supplement existing road and transit networks. These emerging modes range from transportation network companies (e.g. Lyft or Uber) to car, bike, electric bike (e-bike), and scooter share services. The arrival of new modes presents both an opportunity to improve mobility in the City of Oakland and a challenge to direct their growth in an efficient and equitable way. 218 Consultants proposes to use the concept of mobility hubs – bringing several modes together in the same place – to address this challenge and seize this opportunity.
Mobility hubs have the potential to address several notable deficiencies in Oakland’s present transportation system, including poor first- and last-mile access from many areas of the city to key bus and rail transit stations, and long travel times for public transit trips that do not utilize core high-frequency transit services. 218 Consultants, a team of transportation planning and engineering graduate students working in the Transportation Planning Studio at the University of California, Berkeley, has conducted a study on the optimal placement of future mobility hubs throughout Oakland and the distribution of modes at each hub. The themes of social equity and environmental resiliency were central to this analysis.
Methods The team implemented a suitability analysis to determine optimal mobility hub locations and modal distributions. Under a multi-criteria evaluation framework, secondary data from a variety of sources were used to construct indices and scenarios, each representing a collection of thematically-linked factors. This quantitative analysis was supplemented with a qualitative evaluation to generate a set of recommended hub locations. Finally, a subsequent qualitative assessment was used to determine the specific modes that would participate in each hub location.
Findings The output of the location suitability analysis identified 77 mobility hub locations throughout Oakland, spaced between 0.5 miles and 1 mile apart on average. In general, hubs were located in close proximity to key transportation infrastructure and services, including high-frequency bus and rail transit lines; in areas with high observed land use intensity, particularly for large employment centers and non-residential uses; and in lower-density residential neighborhoods that currently lack high-quality mobility options.
The modal selection process found that the majority of the 77 recommended mobility hub locations were suitable for multiple modes, with bike share being the most prevalent. The characteristics of certain modes made them particularly suitable for specific classes of hub locations – as an example, the steep terrain of the Oakland Hills made the area more suitable for e-bike share and scooter share stations. While some lower-income neighborhoods were found to be relatively unsuitable for more costly modes such as e-bike share, these modes were instead sited at key transit hubs in the area to maintain an equitable distribution of such modes across the entire city.

218 Consultants Fall 2015
2
The maps below show: a) the selected mobility hub areas, and b) the distribution of modes participating at each mobility hub.
Recommendations for Oakland’s Consideration The suitability analysis results reflect a mixed methods approach, which employed a degree of subjectivity in the selection of index and scenario weights and final locations. On this basis, it is recommended that the City of Oakland assess the extent to which these inputs and the results that follow align with its objectives. An interactive webmap (http://218consultants.com/interactive-suitability-map/) was developed that allows users to specify their own subjective priorities, in order to enable the City of Oakland to explore different scenarios for mobility hub placement. The City of Oakland could also expand upon the analysis by adding new variables that may influence both the placement of hubs and the distribution of modes.
Another set of recommendations concerns the next steps in the implementation of mobility hubs. These include phasing and prioritizing certain hubs for construction, coordinating with relevant external stakeholders, considering subsidy programs for certain modes to ensure equitable access, and performing extensive ex-post performance evaluations. These recommendations are linked to corresponding sections of the accompanying Department of Transportation Best Practices Report (http://218consultants.com/reports-and-presentations/).
Finally, the study’s values-based suitability analysis framework is generalizable to a variety of other related applications throughout the City of Oakland, including conceptual planning and design, and development of the City’s Capital Investment Plan. The framework emphasizes equity and resiliency, and addresses the contemporary interest in delivering equitable and resilient cities. It is thus a valuable tool for Oakland and other similar cities in achieving value-oriented outcomes for their constituents.

218 Consultants Fall 2015
i
Table of Contents i List of Figures ................................................................................................................................................... iii ii List of Tables ..................................................................................................................................................... iii iii List of Abbreviations ........................................................................................................................................ iv iv Project and Team Description .......................................................................................................................... v v Acknowledgments .............................................................................................................................................. v vi Suggested Citation .............................................................................................................................................. v 1 Introduction ........................................................................................................................................................ 1
1.1 Background ................................................................................................................................................ 1 1.2 Objectives ................................................................................................................................................... 2
2 Literature Review ............................................................................................................................................... 3 2.1 Mobility Hubs ............................................................................................................................................ 3 2.2 Spatial Suitability Analysis Methods ...................................................................................................... 6 2.3 Mobility Hub Suitability Variables .......................................................................................................... 7
3 Study Area .......................................................................................................................................................... 9 4 Data .................................................................................................................................................................... 12 5 Methods ............................................................................................................................................................. 13
5.1 Suitability Analysis Framework ............................................................................................................. 13 5.2 Data Processing and Variable Construction ........................................................................................ 15 5.3 Index Construction ................................................................................................................................. 16
5.3.1 Low Automobility ............................................................................................................................... 17 5.3.2 Disadvantaged Populations ................................................................................................................ 17 5.3.3 Resiliency ............................................................................................................................................. 18 5.3.4 New Service Viability .......................................................................................................................... 19 5.3.5 Future Growth Potential .................................................................................................................... 20 5.3.6 Transportation Connectivity ............................................................................................................. 21 5.3.7 Land Use Intensity .............................................................................................................................. 22
5.4 Scenario Development ............................................................................................................................ 23 5.4.1 Realization of Preferred Alternative Scenario ................................................................................ 24
5.5 Location and Mode Suitability Analysis ............................................................................................... 25 5.5.1 Qualitative Location Selection .......................................................................................................... 25 5.5.2 Qualitative Modal Selection .............................................................................................................. 26
6 Results ............................................................................................................................................................... 26 6.1 Mobility Hub Locations .......................................................................................................................... 27 6.2 Mobility Hub Modes ............................................................................................................................... 28
7 Discussion ......................................................................................................................................................... 30 7.1 Location and Phasing of Hub Implementation ................................................................................... 30 7.2 Alignment with Existing Investment Plans .......................................................................................... 31 7.3 Safety Considerations .............................................................................................................................. 33

218 Consultants Fall 2015
ii
7.4 Further Applications ............................................................................................................................... 34 7.5 Limitations and Future Research Opportunities ................................................................................. 35
8 Recommendations and Conclusions ............................................................................................................. 36 9 References ......................................................................................................................................................... 39 Appendix A List of data sources ......................................................................................................................... 43 Appendix B Variables participating in indices .................................................................................................. 45 Appendix C Equations used to calculate each index ........................................................................................ 50 Appendix D Equations used to calculate each scenario ................................................................................... 51 Appendix E Oakland Priority Development Areas as of 2015 ........................................................................ 51 Appendix F Price points of potential transportation modes servicing Oakland mobility hubs ................ 52 Appendix G Maps of indices used in scenarios ................................................................................................. 53 Appendix H Maps of scenarios used for suitability analysis ............................................................................ 56

218 Consultants Fall 2015
iii
i List of Figures Figure 1: Rendering of a mobility hub on a city street ............................................................................................ 2 Figure 2: North Hollywood mobility hub rendering ............................................................................................. 4 Figure 3: The study area in the City of Oakland, CA ............................................................................................ 10 Figure 4: Mobility hub suitability analysis methodology workflow diagram .................................................... 15 Figure 5: Preferred alternative scenario .................................................................................................................. 27 Figure 6: Selected mobility hub areas based on preferred alternative scenario ................................................ 28 Figure 7: Locations of modes participating at each mobility hub. ...................................................................... 29 Figure 8: Mobility hub candidate areas and a) Oakland Priority Development Areas; b) officially designated disadvantaged areas in Oakland .......................................................................................................... 31 Figure 9: Screenshot of interactive webmap of indices and weights ................................................................... 35
ii List of Tables Table 1: Summary of a selection of mobility hubs in North America ................................................................... 5 Table 2: Demographic composition of Oakland, CA ............................................................................................ 11 Table 3: Key terms and concepts used in the suitability analysis methodology ................................................ 13 Table 4: Income quartiles used in the Disadvantaged Populations index .......................................................... 18 Table 5: Service goals and participating indices of each scenario ....................................................................... 23 Table 6: Mobility hub modal distribution for the 77 identified hubs ................................................................. 30 Table 7: Top 10 mobility hub locations by population .......................................................................................... 32 Table 8: Top 10 mobility hub locations by employment ....................................................................................... 33

218 Consultants Fall 2015
iv
iii List of Abbreviations Abbreviation Definition ABAG Association of Bay Area Governments ACS American Community Survey AC Transit Alameda–Contra Costa Transit District AHP Analytic hierarchy process BART San Francisco Bay Area Rapid Transit District CHTS California Household Travel Survey CNT Center for Neighborhood Technology CPAD California Protected Areas Database DOT Department of Transportation ESRI Environmental Systems Research Institute FEMA Federal Emergency Management Agency GTFS General Transit Feed Specification HUD United States Department of Housing and Urban Development LEHD Longitudinal Employer-Household Dynamics MCE Multi-criteria evaluation MTC Metropolitan Transportation Commission NACTO National Association of City Transportation Officials NAICS North American Industry Classification System NED DEM National Elevation Dataset Digital Elevation Model NCIT National Commission on Intermodal Transportation NOAA National Oceanic and Atmospheric Administration OD Origin and destination OEHHA CalEPA Office of Environmental Health Hazard Assessment, California Environmental
Protection Agency PCA Principal component analysis PDA Priority Development Area SF Summary File SWITRS Statewide Integrated Traffic Records System TNC Transportation network company USGS United States Geological Survey

218 Consultants Fall 2015
v
iv Project and Team Description 218 Consultants is a team of transportation planning and engineering graduate students at the University of California, Berkeley, who seek to promote equitable and resilient transportation systems in the San Francisco Bay Area. The team recently proposed an implementation strategy for the City of Oakland’s new Department of Transportation (DOT). This strategy provides a framework to implement mobility hubs across the City of Oakland that integrates emerging modes of bike share, car share, and rideshare services with transit services to improve first and last mile access. Two sub-teams worked closely to develop this strategy, one focusing on best practices from municipal DOTs across the country in such aspects as financing and funding, internal and external coordination, and public interface; and another working to identify the optimal locations for mobility hubs within Oakland and the corresponding modes that each hub could offer. This report and associated content for this project, including an interactive webmap, can be found on the project website: http://www.218consultants.com/.
v Acknowledgments The authors would like to acknowledge the helpful feedback received from studio instructor Karen Trapenberg Frick and the other studio participants: Abigail Cochran, Cheng Ding, Ulises Hernandez, Kei Kojo, Kim Le, Lee Reis, Dana Rubin, and Anne Spevack. Additional thanks to Yasir Hameed for creating the mobility hub rendering, to Dan Chatman and Susan Shaheen of UC Berkeley for helpful feedback on the methodology, and to the UC Berkeley D-Lab for providing access to ESRI Business Analyst. The authors also thank the City of Oakland and staff including Matt Nichols, Sara Barz, Carlos Hernandez, Fern Uennatornwaranggoon, and Oriya Cohen for their guidance and feedback throughout the development of this report. Special thanks go to the University of California Transportation Center and the Department of City and Regional Planning at the College of Environmental Design at UC Berkeley for their additional support.
vi Suggested Citation Karl Anderson, Samuel Blanchard, Derek Cheah, Adam Koling, and Drew Levitt, 2015, “City of Oakland Mobility Hub Suitability Analysis Technical Report,” Fall 2015 Transportation Planning Studio, Department of City and Regional Planning, University of California, Berkeley, December 2015, http://218consultants.com/wp-content/uploads/2015/12/City-of-Oakland-Mobility-Hub-Suitability-Analysis-Technical-Report.pdf

218 Consultants Fall 2015
1
1 Introduction 1.1 Background Despite a variety of transportation options available to residents and commuters in Oakland, a vital element of the city’s transportation system is lacking: the first- and last-mile systems serving the existing public transit network. The recent emergence and growth of car sharing, transportation network companies (TNCs), and other ridesharing modes such as dynamic ridesharing, along with the planned expansion of Bay Area Bike Share in 2016 to the East Bay and expressed interest from electric bike (e-bike) sharing companies, may mitigate the challenge posed by deficient first- and last-mile access in Oakland. These relatively new vehicle sharing modes are proposed to interface with traditional bus and rail transit at mobility hubs citywide, enabling a convergence of multiple modes and increase the connectivity between modes and add value to travelers.
Oakland is a culturally and socioeconomically diverse city located in a region facing a variety of natural hazards such as earthquakes and sea level rise. Equitable transportation service distribution and infrastructure resiliency are important considerations in planning any improvement or future expansion to Oakland’s transportation infrastructure. Throughout the team’s work, equity is defined as ensuring that all Oakland residents be able to reach destinations across the city in a time- and cost-effective manner, irrespective of their geographic location or socioeconomic status.1 Within the context of a transportation system, resiliency is defined as the ability to withstand, adapt to, and recover from major disaster events and disruptive long-term environmental trends.2 218 Consultants has developed a network of mobility hubs for the City of Oakland’s consideration to address the first- and last-mile transit access issue while promoting the values of transportation service equity and infrastructure resiliency.
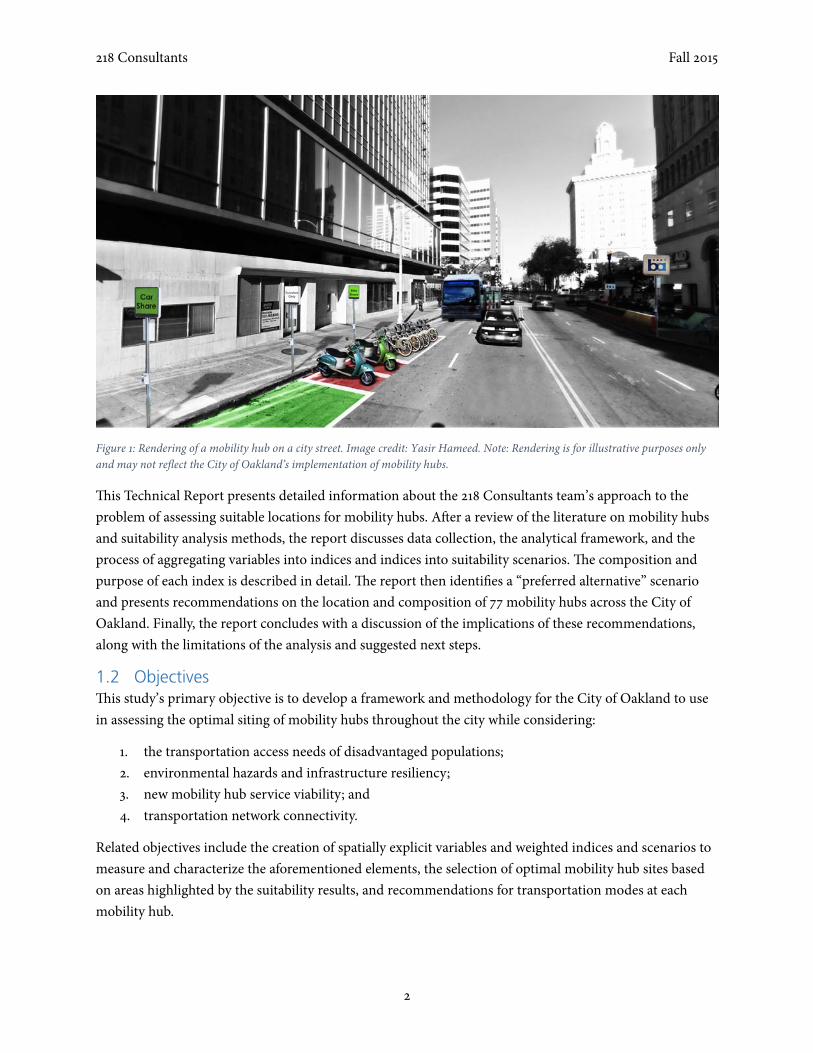
As shown in Figure 1, hubs may include the following modes and infrastructure, depending on location:
1. public transit service, including rail transit stations or bus stops; 2. bike and e-bike share dock stations; 3. designated white curb space for passenger pickup and drop off for ride share services and taxis; 4. designated parking spots for car share vehicles; and 5. designated parking spots for scooter share vehicles.
Mobility hubs may be implemented by the City’s recently announced new Department of Transportation (DOT)3; a mobility hub implementation program has the potential to set a precedent for implementing future transportation-related projects and programs under a similar values-oriented framework.
1 Brian D. Taylor, “The Geography of Urban Transportation Finance,” The Geography of Urban Transportation, 2004, 294–331. 2 Metropolitan Transportation Commission, “Climate Change Adaptation Case Studies” (Oakland, CA, 2011), http://www.fhwa.dot.gov/environment/climate_change/adaptation/case_studies/san_francisco_mtc/index.cfm. 3 Ruth Miller, “What Oakland Mayor’s Proposal for a Department of Transportation Means,” Streetsblog California, May 19, 2015, http://cal.streetsblog.org/2015/05/19/what-oakland-mayors-proposal-for-a-department-of-transportation-means/.
218 Consultants Fall 2015
2
Figure 1: Rendering of a mobility hub on a city street. Image credit: Yasir Hameed. Note: Rendering is for illustrative purposes only and may not reflect the City of Oakland’s implementation of mobility hubs.
This Technical Report presents detailed information about the 218 Consultants team’s approach to the problem of assessing suitable locations for mobility hubs. After a review of the literature on mobility hubs and suitability analysis methods, the report discusses data collection, the analytical framework, and the process of aggregating variables into indices and indices into suitability scenarios. The composition and purpose of each index is described in detail. The report then identifies a “preferred alternative” scenario and presents recommendations on the location and composition of 77 mobility hubs across the City of Oakland. Finally, the report concludes with a discussion of the implications of these recommendations, along with the limitations of the analysis and suggested next steps.
1.2 Objectives This study’s primary objective is to develop a framework and methodology for the City of Oakland to use in assessing the optimal siting of mobility hubs throughout the city while considering:
1. the transportation access needs of disadvantaged populations; 2. environmental hazards and infrastructure resiliency; 3. new mobility hub service viability; and 4. transportation network connectivity.
Related objectives include the creation of spatially explicit variables and weighted indices and scenarios to measure and characterize the aforementioned elements, the selection of optimal mobility hub sites based on areas highlighted by the suitability results, and recommendations for transportation modes at each mobility hub.

218 Consultants Fall 2015
3
2 Literature Review Existing literature was used to inform the following components of the study: 1) mobility hub definitions and plans in other cities; 2) methods used in other spatial suitability analyses; and 3) variables used to characterize and measure elements related to the site suitability of mobility hubs and other transportation services. The following subsections describe and synthesize key literature findings from each of the three topic areas.
2.1 Mobility Hubs The transportation planning literature defines a mobility hub as: 1) the seamless confluence of multiple transportation modes or services in a single location; and 2) a source of value for travelers who benefit from the multimodal connectivity and resulting travel time or cost savings.4 Henry and Marsh5 observed that municipalities implementing mobility hubs and multimodal transportation stations tend to seek the following outcomes:
1. improved accessibility and mobility for the elderly, the economically disadvantaged, and people with disabilities;
2. redirection of trips away from overstressed infrastructure and towards services with available capacity;
3. reduced overall transportation costs by offering users a choice of travel mode, and therefore allowing each trip or portion of a trip to be completed using the most cost-effective mode; and
4. enhanced economic productivity and efficiency.
Of particular interest to Oakland as it assesses the feasibility and desirability of mobility hubs are a series of new vehicle sharing modes, including bike sharing, e-bike sharing, car sharing, and scooter sharing. Shaheen and Christensen6 documented the various social, environmental, and transportation benefits of such shared-use modes, in particular the ability to extend the catchment area of public transit, bridge gaps in existing transportation networks, and encourage multimodality by improving first- and last-mile connectivity to transit. Despite the numerous benefits of integrating new vehicle sharing modes with traditional public transit, with the exception of one partnership between a car sharing company and Chicago’s transit operating agency, these researchers found that few other partnerships have formed,7 perhaps owing to the complex administrative and bureaucratic differences between the private (car sharing) and public (transit) sectors. Cost decreases, technological developments such as improved mobile application functionality, and an embrace of integration by policymakers and entrepreneurs could potentially lead to better integration of vehicle sharing and public transit, as is the goal in Oakland.
4 Lyndon Henry and David L. Marsh, “Intermodal Surface Public Transport Hubs: Harnessing Synergy for Success in America’s Urban and Intercity Travel,” 2008, http://trid.trb.org/view.aspx?id=874793. 5 Ibid. 6 Susan Shaheen and Matt Christensen, “Shared-Use Mobility Summit: Retrospective from North America’s First Gathering on Shared-Use Mobility” (Berkeley, CA: Transportation Sustainability Research Center, 2013). 7 Ibid.

218 Consultants Fall 2015
4
Due to the relatively recent emergence of the vehicle sharing economy, the existing literature most commonly examines mobility hubs as an intermodal transfer point solely between traditional public transportation modes (e.g. bus and/or rail). It also notes the lack of widespread implementation of hubs that incorporate both traditional and emerging modes, comparable to those envisioned for Oakland; however, many cities worldwide have been undergoing planning and preliminary feasibility evaluation for such hubs.8 Four examples from North America can be found in Table 1.
In the Los Angeles metropolitan area, for example, a city-sponsored initiative led by its DOT seeks to place mobility hubs in strategic locations to serve multiple transport modes, dense urban areas and job centers, and large populations of underrepresented and lower-income individuals.9 Figure 2 shows a rendering of Los Angeles’s mobility hub concept. Modes include bike share, scooter share, and demand-responsive shuttles. In Toronto, mobility hubs are being planned by Metrolinx, the regional transportation planning agency; hub locations for the metropolitan area were selected based on the presence of and demand for access to inter-regional destinations, as well as the market demand and land availability to attract development, among other criteria.10
Figure 2: North Hollywood mobility hub rendering. Source: Cultural Weekly.11
8 Metrolinx, “Mobility Hubs: Development of a Regional Transportation Plan for the Greater Toronto and Hamilton Area, Green Paper #2” (Toronto, Ontario, February 2008), http://www.metrolinx.com/en/projectsandprograms/mobilityhubs/Mobility_Hubs_green_paper.pdf; City of Los Angeles, “Los Angeles Mobility Hub: Project Brief,” July 13, 2010, http://www.lachamber.com/clientuploads/TGM_committee/071310_Los%20Angeles%20Mobility%20Hub%20Project%20Brief%20July%202010.pdf. 9 City of Los Angeles, “Los Angeles Mobility Hub: Project Brief.” 10 Metrolinx, “Mobility Hubs: Development of a Regional Transportation Plan for the Greater Toronto and Hamilton Area, Green Paper #2.” 11 NoHo Mobility Hub Rendering, Rendering, 2015, http://www.culturalweekly.com/wp-content/uploads/2015/02/NoHo-RNL-Renderings-V2-2.jpg.

218 Consultants Fall 2015
5
Table 1: Summary of a selection of mobility hubs in North America.12
Metro-politan Area Modes
Rationale for implementation Lead agency
Number of sites
Toronto, Ontario, Canada
Rail transit; individual bicycles; pedestrians; private automobiles
Improved travel experience, especially for transit; economic development; achievement of environmental goals
Metrolinx (greater Toronto transportation agency)
~40 candidates
Los Angeles, CA
Public transit; individual bicycles; bike sharing; e-bike sharing; scooter sharing; demand-responsive shuttles and jitneys
First and last mile access to transit; improved access for disadvantaged populations
City of Los Angeles None specified
Chicago, IL
Rail and bus transit; individual bicycles
Improved bicycle-transit connectivity
Chicago Department of Transportation; transit agencies
None specified
Tysons Corner, VA
Rail and bus transit; car sharing; bike sharing; individual bicycles; taxis
Maximized rail transit accessibility; improved last mile connections from rail transit; green space near transit facilities
Virginia Department of Transportation; Washington Metropolitan Area Transit Authority
Four conceptual locations
A major challenge for implementing mobility hubs is the funding, management, and coordination of various services at the hubs. Findings from the National Commission on Intermodal Transportation (NCIT) indicated that since funding and management are traditionally divided by mode, responsibility for a hub could initially be unclear.13 Mobility management must simultaneously fulfill functions in four categories: operations, technology, information or program, and land use. As applied to the mobility hub concept, these functions would manifest themselves, for example, in transit-oriented development (land use) or car sharing–transit operator partnerships (operational).
12 Metrolinx, “Mobility Hubs: Development of a Regional Transportation Plan for the Greater Toronto and Hamilton Area, Green Paper #2”; City of Los Angeles, “Los Angeles Mobility Hub: Project Brief”; John Pucher and Ralph Buehler, “Integrating Bicycling and Public Transport in North America,” Journal of Public Transportation 12, no. 3 (2009): 79–104, doi:http://dx.doi.org/10.5038/2375-0901.12.3.5; Nelson\Nygaard Consulting Associates, Inc., “Mobility Hubs for Tysons Corner Metrorail Stations: Conceptual Design Plans,” 2013, http://www.mwcog.org/transportation/activities/tlc/pdf/Fairfax-Hubs.pdf. 13 Henry and Marsh, “Intermodal Surface Public Transport Hubs.”

218 Consultants Fall 2015
6
2.2 Spatial Suitability Analysis Methods Suitability analyses have long been used to inform and optimize the placement of resources or activities in space and can utilize a variety of methods. Malczewski14 identified numerous multi-attribute or multi-criteria evaluation (MCE) methods, where the number of outcome alternatives is predetermined and a variety of attributes are inputs for the analysis. These include, in order of complexity, simple weighted linear combinations, ordered weighted averaging, and analytical hierarchy analysis.15 Analytical hierarchy analysis, also known as analytic hierarchy process (AHP), provides a means of classifying various criteria or attributes of an analysis into a hierarchy and aggregating them across multiple indices. Banai16 argued that a key advantage of AHP over other methodologies is that it can operationally handle fuzziness, or varying degrees of truth as opposed to a strictly true or false response, and diverse classes and subclasses of attributes. Xiang and Whitley17 found that AHP is useful in evaluating the importance of gradations in various attributes, relative to one another. In the case of mobility hubs, for example, an index at the highest level of the hierarchy could represent disadvantaged populations, with sub-indices or attributes, such as household income and English speaking ability, nested at a lower level, below the overall Disadvantaged Populations index.
The literature also identified a number of weaknesses to the AHP process. The first key difficulty is the assumption of independence among attributes that underlies the AHP and other multi-criteria methods, which is potentially invalid due to correlation between two or more attributes.18 This correlation, or linear dependence, among input variables gives rise to a problem known as multicollinearity; methods of addressing this problem include a class of ideal points methods,19 or a principal components method. Another issue is related to the standardization of non-commensurate criteria (those that are not compatible in size, type, or scale), particularly using linear transformation methods.20 The transformation process could potentially affect the numerical order and relationship among values, both within individual attributes and across multiple attributes.21 Non-linear scaling and transformation approaches may be more
14 Jacek Malczewski, “GIS-Based Land-Use Suitability Analysis: A Critical Overview,” Progress in Planning 62, no. 1 (July 2004): 3–65, doi:10.1016/j.progress.2003.09.002. 15 Ibid. 16 Reza Banai, “Fuzziness in Geographical Information Systems: Contributions from the Analytic Hierarchy Process,” International Journal of Geographical Information Systems 7, no. 4 (July 1, 1993): 315–29, doi:10.1080/02693799308901964. 17 W.-N. Xiang and D. L. Whitley, “Weighting Land Suitability Factors by the PLUS Method,” Environment and Planning B: Planning and Design 21, no. 3 (1994): 273–304, doi:10.1068/b210273. 18 Malczewski, “GIS-Based Land-Use Suitability Analysis.” 19 Ibid. 20 Hong Jiang and J. Ronald Eastman, “Application of Fuzzy Measures in Multi-Criteria Evaluation in GIS,” International Journal of Geographical Information Science 14, no. 2 (March 13, 2000): 173–84, doi:10.1080/136588100240903. 21 Malczewski, “GIS-Based Land-Use Suitability Analysis.”

218 Consultants Fall 2015
7
robust, especially when applied to a land suitability assessment similar to the mobility hub suitability analysis.22
Principal component analysis (PCA) was also explored as a supplement to AHP. Cervero and Kockelman23 used PCA to address the multicollinearity problem that arose when assessing the effects of several potentially correlated built environment factors on travel. PCA creates a small number of underlying factors that represent relationships among sets of interrelated variables,24 and in doing so yields results that are easily interpretable without confounding multiple correlated attributes, as the AHP or any other multi-criteria method would without specifically correcting for it. PCA can potentially offer a valuable means of informing the AHP process while providing a solution to multicollinearity. However, PCA is data driven and does not allow for subjectivity when selecting specific variables to include in the AHP evaluation, for both the current study as well as future endeavors in siting mobility hubs by the City of Oakland.
In addition to quantitative methodologies, qualitative assessments have also been incorporated into other suitability analyses, such as Sacramento’s bicycle share stations as recently evaluated by Goodman and Handy.25 Five quantitative variables were used in the analysis, which also provided a qualitative assessment of factors pertaining to equity to inform potential station location, including concentrations of low-income households, zero car households, and food stamp recipients as a precursor to a future, more rigorous quantitative analysis.26
2.3 Mobility Hub Suitability Variables Factors that impact the suitability of a mobility hub location are generally dependent upon projected ridership or use of transportation services at a hub location, the convenience of a location to trip generating land use or activity sites, and the degree to which a hub can improve transportation access and connectivity in areas that lack adequate services. Cities such as Los Angeles have sought to implement mobility hubs that are located in convenient locations and in locations accessible to disadvantaged populations. The Los Angeles Department of Transportation described the region’s mobility hub program as the implementation of “highly visible and conveniently located venues,” the development of sites welcoming to “all users regardless of income level,” specifically accessible to and affordable for “under-represented populations including welfare recipients and low-income individuals,” and the streamlining of “secure bicycle parking, vehicle sharing, and shuttle/jitney demand-responsive services.”27 These considerations, together with the objectives of the City of Oakland to provide mobility hubs that expand transportation access equity and that are in locations resilient to natural hazards, suggest that an
22 Jiang and Eastman, “Application of Fuzzy Measures in Multi-Criteria Evaluation in GIS.” 23 Robert Cervero and Kara Kockelman, “Travel Demand and the 3Ds: Density, Diversity, and Design,” Transportation Research Part D: Transport and Environment 2, no. 3 (1997): 199–219. 24 Ibid. 25 Brianna Goodman and Susan Handy, “Providing Equitable Access to Sacramento’s Bike Share System,” Research Report (Davis, CA: Institute of Transportation Studies, 2015). 26 Ibid. 27 City of Los Angeles, “Los Angeles Mobility Hub: Project Brief,” 1.

218 Consultants Fall 2015
8
appropriate analysis requires a diverse set of variables to objectively characterize the suitability of one site over another.
The literature often utilizes proxy variables to provide a measure of travel activity. Proxy variables are commonly used to substitute observed or simulated origin and destination (OD) data due to the relatively coarse spatial scale of common OD data (e.g. Transportation Analysis Zones) that may not adequately capture neighborhood-scale travel patterns and are often based on small sample sizes. The intensity of activity or destination sites that either generate or receive trips has been used in numerous studies, namely in travel pattern, housing and economic agglomeration, and walkability studies.28 Destinations such as parks,29 transit stations,30 business establishments,31 and proxies for activity destinations such as population and employment density32 and retail business establishment and destination kernel densities33 have been used throughout the literature. Indices are often constructed to aggregate these attributes to measure urban environment attributes such as walkability.34
Socioeconomic variables and indices derived from these variables are commonly used in the literature to assess the locations of disadvantaged populations. For example, the Neighborhood Deprivation Index utilizes a number of variables such as household income, employment status, and household crowding, among others, and uses PCA to reduce the data into quartiles of neighborhood deprivation.35 The Center
28 Anne Vernez Moudon and Chanam Lee, “Walking and Bicycling: An Evaluation of Environmental Audit Instruments,” American Journal of Health Promotion 18, no. 1 (2003): 21–37; Reid Ewing and Robert Cervero, “Travel and the Built Environment: A Synthesis,” Transportation Research Record: Journal of the Transportation Research Board, no. 1780 (2001): 87–114; Cervero and Kockelman, “Travel Demand and the 3Ds.” 29 Billie Giles-Corti et al., “Increasing Walking: How Important Is Distance To, Attractiveness, and Size of Public Open Space?,” American Journal of Preventive Medicine 28, no. 2 (2005): 169–76. 30 Lilah M. Besser and Andrew L. Dannenberg, “Walking to Public Transit: Steps to Help Meet Physical Activity Recommendations,” American Journal of Preventive Medicine 29, no. 4 (2005): 273–80. 31 Ester Cerin et al., “Destinations That Matter: Associations with Walking for Transport,” Health & Place 13, no. 3 (2007): 713–24; Barbara B. Brown et al., “Mixed Land Use and Walkability: Variations in Land Use Measures and Relationships with BMI, Overweight, and Obesity,” Health & Place 15, no. 4 (2009): 1130–41. 32 Robert Cervero and Michael Duncan, “Walking, Bicycling, and Urban Landscapes: Evidence from the San Francisco Bay Area,” American Journal of Public Health 93, no. 9 (2003): 1478–83; Cervero and Kockelman, “Travel Demand and the 3Ds”; Christoph Buck et al., “Development and Application of a Moveability Index to Quantify Possibilities for Physical Activity in the Built Environment of Children,” Health & Place 17, no. 6 (2011): 1191–1201. 33 Mei-Po Kwan, “Interactive Geovisualization of Activity-Travel Patterns Using Three-Dimensional Geographical Information Systems: A Methodological Exploration with a Large Data Set,” Transportation Research Part C: Emerging Technologies 8, no. 1 (2000): 185–203; Buck et al., “Development and Application of a Moveability Index to Quantify Possibilities for Physical Activity in the Built Environment of Children”; Michael Duncan, “The Impact of Transit-Oriented Development on Housing Prices in San Diego, CA,” Urban Studies 48, no. 1 (January 1, 2011): 101–27, doi:10.1177/0042098009359958. 34 Buck et al., “Development and Application of a Moveability Index to Quantify Possibilities for Physical Activity in the Built Environment of Children”; Moudon and Lee, “Walking and Bicycling.” 35 Lynne C. Messer et al., “The Development of a Standardized Neighborhood Deprivation Index,” Journal of Urban Health: Bulletin of the New York Academy of Medicine 83, no. 6 (November 2006): 1041–62, doi:10.1007/s11524-006-9094-x.
218 Consultants Fall 2015
9
for Neighborhood Technology36 measured household housing and transportation costs in the Bay Area based on the percentage of income spent on such costs, and concluded that such combined costs can constitute a substantial burden on low-income households living in the Bay Area. Wells and Thill37 considered percentages of minority, low-income, and elderly residents as demographic variables representing neighborhood transit dependency, and found that in several cities such areas tended to receive inferior transit service. Prelog38 identified multiple variables of disadvantage, including the ratio of income to poverty level and minority status, in determining locations for bike infrastructure. Acknowledging that public housing residents often live in areas deprived of economic and basic service or amenity opportunities, Apparicio and Séguin39 measured the accessibility of various services and facilities to public housing units.
Variables representing low automobility have been used in the transportation equity literature to measure disproportional access and transportation service quality for populations without access to automobiles. Indicators of the proportion of racial and ethnic minorities, kindergarten to 12th grade students, elderly individuals, and low income households are commonly used as proxies for low automobility; direct measures of vehicle ownership are also available.40
3 Study Area The study area is the City of Oakland, CA. Oakland is located in Alameda County in the center of the San Francisco Bay Area. Oakland is a major hub in the regional transportation system, served by Interstates 80, 580, 880, and 980, freight railroads and Amtrak California’s Capitol Corridor, an international airport, and several intercity bus services (e.g. Greyhound, Megabus, and BoltBus) (Figure 3). Furthermore, Oakland is served by major regional transit services including the San Francisco Bay Area Rapid Transit District (BART) system with eight stations within city limits, an extensive bus system operated by the Alameda-Contra Costa Transit District (AC Transit) with 1,813 individual bus stops, and the Jack London Square ferry terminal.41 Round trip car share operators, including Zipcar and City CarShare, currently
36 Center for Neighborhood Technology, “Bay Area Housing and Transportation Affordability: A Closer Look” (Oakland, CA: Metropolitan Transportation Commission, 2009). 37 Kirstin Wells and Jean-Claude Thill, “Do Transit-Dependent Neighborhoods Receive Inferior Bus Access? A Neighborhood Analysis in Four US Cities,” Journal of Urban Affairs 34, no. 1 (2012): 43–63. 38 Rachel Prelog, “Equity of Access to Bicycle Infrastructure” (League of American Bicyclists, September 1, 2015), http://www.bikeleague.org/content/new-report-equity-access-bicycle-infrastructure. 39 Philippe Apparicio and Anne-Marie Séguin, “Measuring the Accessibility of Services and Facilities for Residents of Public Housing in Montreal,” Urban Studies 43, no. 1 (2006): 187–211. 40 Alan T. Murray and Rex Davis, “Equity in Regional Service Provision,” Journal of Regional Science 41, no. 4 (2001): 557–600, doi:10.1111/0022-4146.00233; Alexa Delbosc and Graham Currie, “Using Lorenz Curves to Assess Public Transport Equity,” Journal of Transport Geography 19, no. 6 (2011): 1252–59; Wells and Thill, “Do Transit-Dependent Neighborhoods Receive Inferior Bus Access?” 41 “GTFS Data Exchange,” December 2015, http://www.gtfs-data-exchange.com/.

218 Consultants Fall 2015
10
operate 58 individual car sharing locations in Oakland, most of which are located in the downtown area (Figure 3).42
Oakland is a racially and economically diverse city. According to the 5-year 2009–2013 American Community Survey (ACS), Oakland has a population of 397,011, of which nearly three quarters are racial or ethnic minorities. Table 2 documents Oakland’s racial and ethnic diversity. Poverty and limited access to conventional mobility are a concern for many Oaklanders: of the City’s 154,786 households, 18% do not own a vehicle; median household income is $52,583, well below the regional figure of $77,887; and 16.7% of Oakland households have annual incomes below the federal poverty level. According to the Center for Neighborhood Technology (CNT), households in Oakland on average spent about 41% of their income on housing and transportation.43
Figure 3: The study area in the City of Oakland, CA: a) Major geographic areas of Oakland; b) Major transportation infrastructure and services including BART, AC Transit, and car sharing services. Note: Figure 3a location names denote general geographic areas in Oakland and adjacent municipalities and do not represent neighborhood names.
42 City CarShare, “City CarShare Locations,” CityCarShare.org, December 2015, https://citycarshare.org/cars-locations/locations/; Zipcar, “Car Sharing San Francisco Bay Area - Find Car Share Locations,” December 2015, http://www.zipcar.com/sf/find-cars. 43 Center for Neighborhood Technology, “Bay Area Housing and Transportation Affordability: A Closer Look.”

218 Consultants Fall 2015
11
Table 2: Demographic composition of Oakland, CA. Source: 2009–2013 ACS 5-year estimates, Table B03002.
Race/Ethnicity Population PercentageBlack or African American (non-Hispanic) 105,362 26.5%White (non-Hispanic) 103,603 26.1%Hispanic 102,090 25.7%Asian (non-Hispanic) 64,955 16.4%Some other race (non-Hispanic) 21,001 5.3%Total 397,011 100.0%
According to 2013 Longitudinal Employer-Household Dynamics (LEHD) data, Oakland held 192,485 jobs, which were concentrated in the top five industries of Health Care and Social Assistance (21%), Public Administration (9%), Transportation and Warehousing (9%), Educational Services (8%), and Professional, Scientific, and Technical Services (7%). These socioeconomic and employment characteristics are not uniform over the city and vary by geography (e.g. North, East, West Oakland and downtown) and physical environment (e.g. lowlands and hills).
Travel characteristics of Oakland residents are reflective of the City’s multimodal transportation system and proximity to regional destinations outside the City, including San Francisco and San Jose. Travel diary survey data from the 2010–2012 California Household Travel Survey (CHTS) revealed that the weighted mean distance of all trips associated with Oakland during that time period was 6.95 miles, while the weighted median was 1.33 miles. Automobile and walking were the two most popular modes of travel, accounting for 51 and 32 percent of all trips made, respectively. Public transit (e.g. AC Transit and BART) accounted for 11 percent and bicycling accounted for 2 percent. These results are indicative of two dominant types of trips being made: 1) short-distance, walkable trips of one mile or less within City boundaries, and 2) longer, regional trips by automobile or public transit on the 10–20 mile order of magnitude to job centers outside the City.
Oakland is also at risk of experiencing a variety of natural and manmade disasters. Due to Oakland’s location adjacent to the San Francisco Bay, low-lying areas and infrastructure are susceptible to sea level rise and storm surges related to climate change, tsunamis, and extreme weather events. While the entire Bay Area is at risk of substantial earthquake damage, Oakland’s areas of landfill adjacent to the Bay are particularly vulnerable to earthquake damage because their low-velocity soil amplifies shaking, resulting in liquefaction. Oakland’s hills lie adjacent to heavy biofuel grass and woodlands and are at higher risk of wildfire. Additionally, Oakland’s many creeks are at risk of intermittent flooding.44
44 Association of Bay Area Governments, “Regional Resilience Initiative: Policy Agenda for Recovery” (Oakland, CA, March 2013), http://resilience.abag.ca.gov/wp-content/documents/resilience/Regional%20Resilience%20Initiative%20Policy%20Plan_March%202013.pdf; City of Oakland, ICLEI – Local Governments for Sustainability, and CirclePoint, “Energy and Climate Action Plan,” December 4, 2012, http://www2.oaklandnet.com/oakca1/groups/pwa/documents/report/oak039056.pdf.
218 Consultants Fall 2015
12
4 Data Data were collected for the City of Oakland representing the following dimensions:
1. socioeconomic and demographic characteristics; 2. employment characteristics; 3. housing characteristics; 4. transportation infrastructure and services; 5. environmental hazards and terrain; 6. land use characteristics; and 7. public and private destinations and services.
Appendix A provides a detailed list of data and data sources collected for the mobility hub suitability analysis. All data except the business establishment data are publicly available.
Socioeconomic and demographic characteristics were collected from the 5-year 2009–2013 ACS estimates, the 2010 Census Summary File 1 (SF1), and the 2000 Census SF1. Data tables representing population, race, household annual income, student status, age, disability status, vehicle availability, food stamp recipients, and language were extracted. Data were collected at the block group level where available; otherwise, data were collected at the tract level and then scaled to the block group according to the ratio of total block group population to total tract population. The 2000 Census tract data were transformed to be directly comparable to the 2010 block group data through a two-step process:
1. The 2000 Census tract boundaries were crosswalked to 2010 Census tract boundaries in Stata (StataCorp, College Station, TX) using the Brown University Longitudinal Tract Database.45
2. The 2000 Census tract data were then downscaled to the block group level according to the ratio of 5-year 2009–2013 ACS estimates block group population to tract population.
Employment data for all job types were acquired at the block level from the LEHD dataset for 2003 and 2013. These data then were post-processed and aggregated up to the block group level. Block group-level data on housing and transportation affordability were acquired from the CNT. Housing data representing U.S. Department of Housing and Urban Development (HUD) public housing inventory and housing choice vouchers were collected at the address level from HUD and Alameda County. Priority Development Areas (PDAs) denoting the areas municipalities have targeted for planned future concentrations of housing and employment development were acquired from the Association of Bay Area Governments (ABAG).
Retail business establishment locations at the address level were acquired from InfoGroup as provided by the Environmental Systems Research Institute’s (ESRI) Business Analyst. The locations of important services and destinations, including schools and colleges, health care facilities, parks, and social service
45 Brown University, “Longitudinal Tract Data Base,” US2010, accessed October 5, 2015, http://www.s4.brown.edu/us2010/Researcher/Bridging.htm.

218 Consultants Fall 2015
13
offices, were acquired at the address and feature level from Alameda County, the California Department of Public Health, and the California Protected Areas Database.
Environmental hazard data representing sea level rise inundation risk, national flood hazard zones, earthquake liquefaction zones, and wildfire threat were acquired from the National Oceanic and Atmospheric Administration (NOAA), the Federal Emergency Management Agency (FEMA), the U.S. Geological Survey (USGS), and the California Department of Forestry and Fire Protection, respectively. Terrain data were acquired from the USGS 10-meter National Elevation Dataset Digital Elevation Model (NED DEM).
Data representing AC Transit and BART transit infrastructure (e.g. stops and routes) and schedules were acquired from each respective agency’s General Transit Feed Specification (GTFS) files. The locations of ferry terminals and Amtrak stations were gathered from the Metropolitan Transportation Commission (MTC). Intercity bus terminal locations were identified from the Greyhound, Megabus, and BoltBus websites. Current round trip car share service sites at the address level were extracted from Zipcar and City CarShare websites.
5 Methods 5.1 Suitability Analysis Framework Based on the suitability analysis literature review, a phased multi-criteria evaluation method was used to determine optimal sites for mobility hubs. This method falls into the category of analytic hierarchy process (AHP), and is the most appropriate multi-criteria analysis method due to its provision of a hierarchical structure that can be used to incorporate qualitative value judgments at different levels of the analysis. Table 3 defines several key terms and concepts that are integral to the suitability analysis methodology.
Table 3: Key terms and concepts used in the suitability analysis methodology.
Concept Definition
Mobility hub
Location where multiple transport modes converge to enhance connectivity to and from each other and provide first- and last-mile accessibility to destinations from transit facilities.46
Variable Quantitative measure of an existing condition, which may be sociodemographic, infrastructure-related, or environmental in nature, at a certain geography.
Index Thematically linked collection of variables that synthetically represents the suitability of an area for a mobility hub according to the index’s theme. Index values are dimensionless and take on meaning only in comparison across locations.
Scenario Subjective weighting of indices reflecting a set of assumptions about desired outcomes. Price assumption
Predetermined set of prices for the various services offered at mobility hubs, constructed with the goal of predicting consumer response to such prices (Appendix F).
46 Henry and Marsh, “Intermodal Surface Public Transport Hubs.”
218 Consultants Fall 2015
14
Qualitative lens
Exploration of the suitability of locations suggested by scenario analyses according to additional subjective criteria.
Z-score The number of standard deviations a given data point is above the mean. Z-scores are represented both positively and negatively.
Percentile The relative rank of each value within a distribution of 100 equal parts.
The suitability analysis methodology can be summarized as a four-step process consisting of: 1) data processing and variable construction; 2) index construction; 3) scenario development; and 4) location and mode suitability analysis. Figure 4 summarizes the index and scenario construction and location and mode suitability analysis methodology workflow. Each step is described briefly below and in detail in the following sub-sections:
1. Data processing and variable construction: data for variables of interest were gathered, and mathematical operations were performed on specific variables to prepare them for the suitability analysis, enable meaningful comparisons across non-commensurate variables, and represent them at the block group level.
2. Index construction: indices were calculated as weighted sums of transformed, thematically linked variables at the block group level.
3. Scenario development: scenarios were built as weighted sums of transformed, thematically linked indices at the block group level. A “preferred alternative” scenario, consisting of a set of weightings deemed by the team as most representative of the City of Oakland’s service goals, was identified. Candidate locations for mobility hubs were then placed under this preferred alternative scenario.
4. Location and mode suitability analysis: a hybrid qualitative/quantitative approach was used to site mobility hubs across Oakland and determine the supply of each mode that would be present at each location.

218 Consultants Fall 2015
15
Figure 4: Mobility hub suitability analysis methodology workflow diagram for scenario development, optimal hub locations, and hub modal distribution. Note: Workflow diagram illustrates an example of the variables used for the Low Automobility index and the subsequent scenarios that utilize the index. The remaining variables, indices, and scenarios are generalized.
5.2 Data Processing and Variable Construction Individual variables in the data were operationalized using the 2010 Census block group as the unit of analysis. Block groups were selected because they are compatible with many other common statistical units, they are the smallest unit available for a majority of detailed socioeconomic variables, and they adequately approximate the local scale on which walking trips occur. Proxy variables for land use intensity, travel patterns, and origins and destinations in Oakland were constructed in place of using traditional origin and destination (OD) data. This approach addresses the limitations associated with available OD data, namely its large spatial scale and small sample sizes. The literature and existing practice establish that distance to and density of destinations are appropriate indicators of land use intensity and trip generation potential.47 For more information on this literature, see section 2.3, Mobility Hub Suitability Variables, above.
47 Moudon and Lee, “Walking and Bicycling”; Ewing and Cervero, “Travel and the Built Environment,” 2001; Reid Ewing and Robert Cervero, “Travel and the Built Environment: A Meta-Analysis,” Journal of the American Planning Association 76, no. 3 (2010): 265–94; Cervero and Kockelman, “Travel Demand and the 3Ds.”
218 Consultants Fall 2015
16
Raw data were processed into variables using a variety of spatial and statistical operations. These operational steps include the following:
Euclidean, or straight line, distance from a block group centroid to the nearest feature of a certain class (e.g. nearest school). Euclidean distance calculations were generated rather than network distances to better reflect individual conception of travel distance and time, as individuals generally do not perceive the street grid when planning trips and instead will realize the general distance or time between two locations. Euclidean and network distances tend to generate proportional results in dense urban grid networks due to the uniform topology of dense street networks.
Euclidean buffers, typically 0.25 or 0.5 miles in radius, around a block group centroid or destination feature to determine whether features of a certain class (e.g. AC Transit bus stops) fell within a buffer or to determine whether block groups were within a threshold distance from a feature (e.g. BART station).
Variables consisting of counts (e.g. Census data) converted into percentages or proportions. Calculations of the proportion of block group area overlaid by another administrative designation
(e.g. PDAs). Boolean or categorical variables to indicate if a block group intersected with a polygon feature of a
certain class (e.g. within an annual flood risk zone).
All variables, other than threshold measures, were subsequently transformed into z-scores to enable meaningful comparison across non-commensurate variables.
5.3 Index Construction Several indices were calculated for each Oakland block group from the weighted sum of transformed variables for that given block group, with the weights determined subjectively based on the literature and discussions with expert researchers and academic faculty. These indices represent an aggregation of multiple individual variables and are outlined in detail in the following sub-sections. Based on conversations with the City of Oakland during the scoping of this project, the following seven indices were constructed to represent various aspects of mobility hub placement:
1. Low Automobility 2. Disadvantaged Populations 3. Resiliency 4. New Service Viability 5. Future Growth Potential 6. Transportation Connectivity 7. Land Use Intensity
Low Automobility, Disadvantaged Populations, and Resiliency were identified by the City of Oakland to best characterize the goals of equitable and resilient transportation. New Service Viability was selected to capture the areas where economic opportunity could achieve both high mobility hub service ridership and profitability for mobility hub service providers. Future Growth Potential was incorporated to identify areas

218 Consultants Fall 2015
17
of the city that are likely to bear the greatest share of population and employment growth in the immediate future. Transportation Connectivity was used to identify areas that are served well by transit and areas that are underserved to address first- and last-mile transportation access. Finally, Land Use Intensity was used to measure areas that would be most or least likely to generate trips. Appendix B and Appendix C list variables by index membership and their respective weights in index equations, respectively.
5.3.1 Low Automobility The Low Automobility index captures the extent to which residents of each block group have lower than ordinary access to vehicles. The index includes two variables derived from the 5-year 2009–2013 American Community Survey estimates (subsequently referred to as ACS): 1) the proportion of households in each block group with fewer vehicles than household members; and 2) the proportion of households in each block group with zero vehicles (ACS table B08201). The Low Automobility index also includes measures of two groups associated in the literature with reduced access to vehicle mobility. One variable captures the proportion of block group population who are students in kindergarten through the 12th grade (ACS table B14001), while another, from the 2010 Census SF1, expresses the proportion of the population who are 65 years and over (2010 Census SF1 table P012).48
These four Census-derived proportions were normalized by z-score transformation; their weighted sum was then calculated to form the Low Automobility index. A high score on the Low Automobility index indicates that the population largely fall into groups that could benefit substantially from new mobility options. Scenarios that seek to address inequitable access to mobility will incorporate the Low Automobility index with a significant weighting. Low automobility is also associated with a higher willingness to pay for new mobility options.
5.3.2 Disadvantaged Populations One of the fundamental goals of Oakland’s investment in mobility hubs is to address socioeconomic inequity by prioritizing hub sites in areas of disadvantaged and underrepresented populations. To facilitate this analysis, the Disadvantaged Populations index highlights areas with high prevalence of groups that face social and economic stresses. The variables participating in this index were based on literature findings from studies on the influence of various socioeconomic variables on travel and health outcomes.49
The index draws on data from the widely used CNT Housing and Transportation Affordability Index to capture high transportation costs as a percentage of annual household income.50 The CNT Index variable representing transportation costs as a percentage of income for a household making the national median income was used to approximate the ratio of transportation costs to household income. Higher
48 Murray and Davis, “Equity in Regional Service Provision”; Delbosc and Currie, “Using Lorenz Curves to Assess Public Transport Equity”; Wells and Thill, “Do Transit-Dependent Neighborhoods Receive Inferior Bus Access?” 49 Messer et al., “The Development of a Standardized Neighborhood Deprivation Index”; Prelog, “Equity of Access to Bicycle Infrastructure”; Wells and Thill, “Do Transit-Dependent Neighborhoods Receive Inferior Bus Access?” 50 Center for Neighborhood Technology, “About the Index,” 2015, http://htaindex.cnt.org/about/.

218 Consultants Fall 2015
18
transportation costs as a percentage of income were associated with a greater level of economic disadvantage.
Like the Low Automobility index, the Disadvantaged Populations index includes numerous proportion variables calculated using 2010 Census SF1 and ACS data. These variables include the proportion of households with limited English fluency (ACS table B16002), the proportion of racial and ethnic minority (not non-Hispanic white) individuals (2010 Census SF1 table P5), the percent of the population with at least one disability (ACS table B18135), and the proportion of block group households that receive food stamps (ACS table B19058). These proportions were normalized by transformation to z-scores.
Additionally, household income was represented in the Disadvantaged Populations index by four variables measuring the percentage of households that fell within each quartile of Oakland’s citywide distribution of household incomes. This method was used instead of percent of population under the City’s median household income in order to provide a more nuanced representation of income. Table 4 shows the citywide income distribution as quartiles and the corresponding income ranges available in the Census data. These proportions were then normalized as z-scores.
Table 4: Income quartiles used in the Disadvantaged Populations index. Source: 2009–2013 ACS table B19001.
Quartile Citywide income quartile range Corresponding Census variable range 1 $0-23,141 $0-19,999 2 $23,142-52,582 $20,000-49,999 3 $52,583-100,667 $50,000-99,999 4 $100,668+ $100,000+
Finally, the presence and quantity of subsidized or public housing units were identified via two variables from HUD and Alameda County respectively: the percentage of renter-occupied housing units whose residents are housing choice voucher recipients and the count of public housing projects, including subsidized below-market-rate units, within each block group. Apparicio and Séguin found that areas of public housing generally have poor access to basic economic services and amenities.51
A higher value on the Disadvantaged Populations index indicates that members of disadvantaged groups represent a greater proportion of the block group’s population. As such, a block group scoring highly on the Disadvantaged Populations index is a strong candidate for mobility hub investments that seek to improve equitable mobility.
5.3.3 Resiliency Another major goal for implementing Oakland’s mobility hubs is to prioritize investment in areas that are resilient to natural hazards in order to protect infrastructure from future environmental events. An index was developed that prioritizes areas with environments that are less susceptible to a variety of natural
51 Apparicio and Séguin, “Measuring the Accessibility of Services and Facilities for Residents of Public Housing in Montreal.”

218 Consultants Fall 2015
19
hazards. Variables for the Resiliency index are based on climate change and natural hazard data from NOAA, FEMA, USGS, and Cal-Fire. Data were selected on the premise that mobility hubs ought to be sited in locations throughout the city that would be able to cope with any major environmental disturbance to the transportation system.
USGS data on soil liquefaction zones in Oakland were classified by five categories of liquefaction, ranging from low liquefaction susceptibility to high liquefaction susceptibility. Values for each classification were assigned on a 0-5 scale, and then weighted for the index. To correctly represent the data, weightings were assigned as negative values, as lower values of this indicator correspond to less environmentally resilient areas. Areas identified as having a high risk of wildfire by Cal-Fire were assigned using the same methodology, classifying the data on a 0 to 3 scale from no risk to high risk. The variable was then assigned a negative weighting for incorporation in the index.
Data from FEMA represent areas within the study area that would be impacted by a 0.2% annual chance of flood hazard, which is a standard flood risk measure used by FEMA for insurance purposes. Block groups that overlapped these zones received a –0.5 weighting in the index. This same method was applied to the areas at risk of coastal sea level rise identified by NOAA. The NOAA data contains three cumulative categories for sea level rise: 1 foot, 3 feet, and 5 feet. Any block group that was impacted by these amounts of sea level rise was assigned a weighting of –1.2 for 1 foot, –0.8 for 3 feet, and –0.4 for 5 feet.
These five variables were normalized by transformation to z-scores. A high score in the Resiliency index indicates that the block group is among the most resilient areas of Oakland, and thus best suited for the siting of a mobility hub. A low score in this index is associated with a higher risk of damage resulting from any of the measured environmental hazards. Scenarios that seek to prioritize resilient locations for station placement will incorporate the Resiliency index with a high weighting.
Additional variables that were considered for the Resiliency index included suitability as evacuation points and proximity to climate change adaptation projects. These were not implemented due to constraints in data availability and quality.
5.3.4 New Service Viability Perhaps the most important goal for private-sector transportation service providers is the profitability and ridership of their respective services, and more broadly, of the mobility hubs in which their services participate. In response to these interests, the New Service Viability index prioritizes block groups and areas with high opportunity for economic gain, primarily through high revenue collection potential. While this index does not specifically address equity concerns, most if not all scenarios involving the New Service Viability index also incorporated one or both of the equity-themed indices (Low Automobility and Disadvantaged Populations). See section 5.4, Scenario Development, below for further description and discussion of these scenarios.
The first variable represents the population (ACS table B01001) within each block group and adjacent block groups, defined as block groups whose centroids fall within a 0.25 mile Euclidean distance of the respective block group’s centroid. The summed population within these block groups was assigned a

218 Consultants Fall 2015
20
positive weighting to favor areas that provide exposure to many potential customers. Additionally, a similar procedure for the population in the top income quartile (derived from ACS table B19001) was performed. This approach effectively double counts high-income individuals, as they have the ability to spend larger proportions of their income on transportation.
A similar procedure to the one described above was conducted for the count of all jobs and specifically jobs in high-wage sectors, using LEHD and ACS data. Both variables were positively weighted in the index calculation. Next, the count of current round trip car share locations within each block group was calculated and weighted positively. Current round trip car share locations were included on the assumption that these locations were chosen by their operators to result in a positive economic outcome.
The final variable draws on data from the CNT Housing and Transportation Affordability Index to represent transportation costs as a percentage of annual household income. Incorporation of this variable allows the index to prioritize mobility hubs in areas of Oakland where transportation costs represent a higher proportion of household incomes. Because mobility hubs offer less expensive travel options than many other modes, including private vehicle ownership, they may be relatively more attractive to groups spending heavily on transportation.
A high score in the New Service Viability index reveals the block groups and areas of high profitability for service providers. Scenarios that seek to ensure that mobility hubs are placed in ways that ensure mobility hub service viability will incorporate this index with a significant weighting.
5.3.5 Future Growth Potential For mobility hubs to adapt to future needs of the transportation network due to increasing potential population and economic growth, the team constructed a Future Growth Potential index. This index uses data from the Census, ABAG, and LEHD to express: 1) the locations in the city that are projected grow in population and employment as discussed below; and 2) where the City of Oakland is prioritizing new development (i.e. inside PDAs), which is in line with regional planning in the context of California Senate Bill (SB) 375 and Sustainable Communities Strategies through Plan Bay Area.52 A list of planned PDAs in Oakland can be found in Appendix E.
Population data from the 2000 Census SF1 and 5-year 2009–2013 ACS estimates were used to calculate a simple linearly annualized growth rate for each block group. 2003 and 2013 LEHD work area characteristics were used to generate employment growth rates for each block group in the same manner. Lastly, block group PDA membership was determined by calculating the percentage of a block group that falls within a planned PDA. PDAs from ABAG are local municipality defined areas targeted for infill development near transit that are projected to incur an increase in population and commercial activity.
These three variables were normalized by transformation to z-scores. A high score in the Future Growth Potential index indicates that the block groups are in the areas of Oakland where growth is projected to
52 Association of Bay Area Governments, “Plan Bay Area - Plan Elements,” 2013, http://www.planbayarea.org/plan-bay-area/plan-elements.html.

218 Consultants Fall 2015
21
continue, thus best suited for the siting of a mobility hub to accommodate a growing population and additional demand on the transportation network. Scenarios that seek to address Future Growth Potential locations for station placement will incorporate this index with a high weighting. A low score in this index is associated with an anticipated slower rate of growth or limited growth projections.
Additional variables that were considered for the Future Growth Potential index were zoning classifications with respect to future residential and commercial capacity. However, zoning regulations were not included due to their complexity, as well as the mutability of land use designations in the future.
5.3.6 Transportation Connectivity A key goal for mobility hubs in Oakland is to increase individual mobility by tying into existing transportation infrastructure, such as transit stations, and enhancing first- and last-mile accessibility. Two Transportation Connectivity indices were created, representing High and Low Transportation Connectivity.
In the context of a mobility hub suitability analysis, transportation connectivity can be thought of in two opposing ways. On the one hand, areas with high transportation connectivity may be good candidates for a mobility hub, as the hub could benefit from an already-high level of mobility. On the other hand, areas with low transportation connectivity may stand to benefit more from an increase in mobility provided by the placement of a mobility hub. Like the Land Use Intensity indices below, the Transportation Connectivity indices are primarily used in a phased manner (see section 5.4.1, Realization of Preferred Alternative Scenario) to guide the selection of specific mobility hub sites.
To construct the High Transportation Connectivity index, a distance threshold was used to select block groups that were within 0.5 mile walking catchment area of: a BART station, a ferry terminal, an Amtrak station, or an intercity bus station. The 0.5 mile buffer distance was selected to approximate a 10-minute walk, a distance that has been widely used in the transit planning literature to construct transit catchment areas.53 Additionally, the quantity of bus service was determined using GTFS data by summing the number of AC Transit buses stopping at bus stops within or immediately adjacent to the block group on a typical weekday. The bus service variable was normalized via a z-score transformation.
The Low Transportation Connectivity index measures block groups’ isolation from transportation infrastructure by considering the distance from each block group’s centroid to the nearest of each of the following features: BART station, ferry terminal, Amtrak station, and intercity bus station. Each of these distance variables was normalized with a z-score transformation. The AC Transit bus service variable also participates in the Low Transportation Connectivity index, with a negative coefficient, so that areas with less bus service score more highly on the Low Transportation Connectivity index.
The rationale for the use of distance thresholds for the High Transportation Connectivity index, as compared with an absolute distance measure for the Low Transportation Connectivity index, is that high
53 Daniel G. Chatman et al., “Making Effective Fixed-Guideway Transit Investments: Indicators of Success. Volume 1: Handbook, Volume 2: Research Report,” TCRP Report, no. 167 (2014), http://trid.trb.org/view.aspx?id=1316715.

218 Consultants Fall 2015
22
connectivity to the transportation network is essentially a binary condition (a given area is either reachable on foot from a BART station or not), while there are greater and lesser degrees of isolation from transportation.
5.3.7 Land Use Intensity In the interest of developing a proxy for higher and lower volumes of trip generation, two indices were generated to represent High and Low Land Use Intensity. Both indices consist of distance to parks, Alameda County social service offices, hospitals and health clinics; schools and colleges, and business establishments, calculated based on data obtained from ESRI Business Analyst InfoGroup, Alameda County, the State of California, and CPAD.
Unlike the pair of Transportation Connectivity indices, the two Land Use Intensity indices are exact opposites of each other. These indices were built for primary use in the qualitative assessment of mobility hub station location. This method has been adapted from literature that utilizes proxy variables to provide a measure of transportation trips activity rather than using observed or simulated OD data. For more information on this literature, see section 2.3, Mobility Hub Suitability Variables.
Retail North American Industry Classification System (NAICS) codes were extracted from ESRI Business Analyst InfoGroup business establishment data and were transformed into a kernel density surface to proxy land use intensity and accessibility to destinations. The kernel density calculation utilized a cell size of 0.6 miles with a 1 mile search radius. The block group centroid was assigned the kernel density value. A higher value indicates a greater density of business establishments. Both High and Low Land Use Intensity indices incorporated this variable.
For the High Land Use Intensity index, the distance of each block group’s centroid to nearby parks, Alameda County social service offices, hospitals and health clinics, and schools and colleges were calculated. The distances to land use received negative weightings; that is, a greater distance to the nearest amenity resulted in a lower score on the High Land Use Intensity index. In addition to the distance calculations to land uses, the count of jobs in block groups whose centroids fall within 0.25 mile Euclidean distance of each block group’s centroid was also calculated for the index and assigned a positive weighting. Each of these distance and job count variables were normalized with a z-score transformation.
The Low Land Use Intensity index measures block group seclusion from concentrated areas of land use by considering the distance from each block group’s centroid to the nearest of each of the following features: parks, social service offices, health clinics, schools, and retail establishments. Distances to land uses received positive weightings in the index. The index was further informed by the count of jobs in block groups whose centroids fall within 0.25 mile Euclidean distance of its centroid, and weighted negatively. Each of these distance and job count variables was normalized with a z-score transformation.
Additional variables that were considered for the Land Use Intensity indices were zoning classifications with respect to current residential and commercial capacity and origin and destination (OD) trip pair data. However, as noted above, zoning regulations were ultimately omitted due to their high complexity and the ease with which they can be substantially changed, unlike the physically existing activities and services

218 Consultants Fall 2015
23
captured in the Land Use Intensity indices. OD trip pair data were also not included due to the relatively coarse spatial scale of commonly available data (e.g. Transportation Analysis Zones), which are a poor representation of neighborhood scale, as well as the small sample sizes in existing OD data.
5.4 Scenario Development Index values were transformed by calculating the percentile of each value within the overall index to facilitate comparisons across all seven indices and enable a robust combination of multiple indices to form scenarios. A total of seven scenarios were constructed as weighted sums of the percentile-transformed indices. The City of Oakland’s emphasis on the themes of equity and resiliency informed the team’s decision to incorporate the relevant indices – Low Automobility, Disadvantaged Populations, and Resiliency – in most scenarios. The service goals and targets and participating indices of each scenario are identified in Table 5 below. The equations used to calculate each scenario, with corresponding weights, are listed in Appendix D.
Table 5: Service goals and participating indices of each scenario.
Number Service goals and targets Participating indices 1 Populations of need Low Automobility
Disadvantaged Populations 2 Areas resilient to natural disasters Resiliency 3 Populations of need living in
resilient areas Low Automobility Disadvantaged Populations Resiliency
4 Areas of strong and growing service viability
New Service Viability Future Growth Potential
5 Resilient areas likely to experience growth
Resiliency Future Growth Potential
6 Areas with high land use intensity but low transportation connectivity
High Land Use Intensity Low Transportation Connectivity
7 Populations of need, resilient areas, and strong service viability areas
Low Automobility Disadvantaged Populations Resiliency New Service Viability Future Growth Potential
The team also developed an interactive webmap that allows for rapid exploration of additional or alternative scenarios. This tool, available at 218consultants.com, enables users to assign their own sets of weightings to each of the seven indices, and to immediately see those weightings’ impact on the relative suitability of each of Oakland’s block groups for the placement of mobility hubs.

218 Consultants Fall 2015
24
5.4.1 Realization of Preferred Alternative Scenario The multiple scenarios in Table 5 were constructed and implemented as an iterative process to not only explore how individual scenarios performed but also to provide rationale for the selection of the preferred alternative scenario. The first scenario, with the service goal of populations of need, represents the areas of Oakland where traditionally underserved populations reside as well as areas where there are concentrations of low automobility. Both of these indices (Disadvantaged Populations, Low Automobility) were incorporated into one scenario to determine where there was greatest need for equitable placement of mobility hubs, a priority of the overall research task. The second scenario incorporates Oakland’s second priority, resiliency. This scenario solely considers natural hazard variables, to identify the areas of Oakland most likely to sustain or be spared damage during a severe natural event. After the first two scenarios were implemented, the Low Automobility, Disadvantaged Populations, and Resiliency indices were used to represent the service goal of populations of need living in resilient areas.
Although the “populations of need living in resilient areas” scenario satisfies Oakland’s key goals of resiliency and equity, these criteria are not fully representative of the intended use of mobility hubs. Thus, additional scenarios were constructed that represent travel patterns, future growth, transportation connectivity, and intensity of land use. The “areas of strong and growing service viability” scenario identifies areas of Oakland where mobility hub operators are most likely to receive the greatest economic benefit or ridership. Furthermore, this scenario highlights the block groups where economic gain will continue to thrive given projected development and population growth. The Future Growth Potential index was also incorporated into scenario five, “resilient areas likely to experience growth,” where it emphasizes resilient areas with the highest rates of population and employment growth. The sixth scenario that represents high land use intensity and low transportation connectivity utilizes indices that characterize high-intensity areas of Oakland where there were the largest gaps in the current transportation network, i.e. locations especially in need of improved access via investment in mobility hubs.
Finally, scenario seven, “populations of need, resilient areas, and strong service viability areas,” was selected as the preferred alternative scenario as it incorporated all aspects of the research goals and the perceived successful use of mobility hubs. This final implementation scenario involves all seven indices. The scenario was then fully implemented via a three-phase process:
1. Implement and hold constant five indices (Low Automobility, Disadvantaged Populations, Resiliency, New Service Viability, and Future Growth Potential) prior to the introduction of Land Use Intensity and Transportation Connectivity.
2. Identify areas of high land use intensity and transportation connectivity (using the corresponding indices) and manually select mobility hub locations in areas that are in strong candidate locations for both land use intensity and transportation connectivity measures.
3. Identify areas of lower land use intensity and transportation connectivity (using the corresponding indices) and manually select mobility hub locations in areas that score high on these indices, and are in close proximity to mobility hubs established in step 2.

218 Consultants Fall 2015
25
For steps 2 and 3, the manual selection of mobility hub locations was confined to block groups that scored in the 50th percentile or above for the preferred alternative scenario. The latter constraint was implemented as a means of ensuring that all recommended mobility hub locations would be in block groups that performed relatively well under the preferred alternative scenario. The 50th percentile is a widely accepted and common method utilized to capture the top ranking proportion of a continuous variable as a Boolean value.
5.5 Location and Mode Suitability Analysis 5.5.1 Qualitative Location Selection After completing the values-based multi-criteria evaluation and generating a preferred alternative scenario, the project team used a hybrid quantitative-qualitative approach to site mobility hubs across Oakland. The following criteria informed the siting of hubs, in descending order of importance:
1. block group score in the preferred alternative scenario; 2. spacing between hubs; 3. proximity to existing key transportation infrastructure and services; and 4. proximity to major population and employment centers.
Block groups that scored in the upper half of suitability in the preferred alternative scenario (with either the high or low land use and transportation intensity overlays) were considered prime candidates for mobility hubs. Because each mobility hub functions only as a component of a networked system, hubs were generally located not more than 1 mile from one another to allow for at most a 0.5 mile access radius for each hub. This spacing between hubs approximates the standard size of walking catchment areas for transit services.54 A number of mobility hubs were located in close proximity to key transportation infrastructure and services including BART stations, major AC Transit transfer locations, Amtrak stations, the ferry terminal, the Oakland International Airport, and intercity bus stations.
Once all hub locations were selected according to the qualitative criteria listed above, key metrics for each location were generated using the same block group-level data from the quantitative analysis. These metrics include: total population in block groups whose centroids fall with a 0.5 mile Euclidean buffer of the hub, total jobs in those block groups, whether the hub falls within a PDA, and whether the hub falls within a MTC Community of Concern or Office of Environmental Health Hazard Assessment (OEHHA), California Environmental Protection Agency (Cal EPA) disadvantaged community.
Additional criteria that were considered in the siting of mobility hubs but were ultimately not used in the analysis include Oakland Police Department crime statistics and Statewide Integrated Traffic Records System (SWITRS). These criteria were not utilized because of data quality concerns and because many safety conditions can be highly mutable in the near term, through interventions such as streetscape redesigns or public safety campaigns coordinated with the Oakland Police Department.
54 Ibid.

218 Consultants Fall 2015
26
5.5.2 Qualitative Modal Selection The modal distribution of each mobility hub was determined through a hybrid quantitative and qualitative process that included: 1) the consideration of the average topographic slope of street segments within each block group; 2) the proximity of the hub to key transportation infrastructure; and 3) the socioeconomic and land use characteristics of each mobility hub location. This qualitative approach was used instead of a fully quantitative process because some dynamics, such as the relationship between local income characteristics to the per-ride or per-year cost of each transportation mode, are exceptionally complex and not easily modeled.
Topography was measured using the USGS NED DEM where slope (in degrees) was calculated for all street segments. Each block group was assigned the average slope of streets within the block group. A cutoff of 2 degrees was used to indicate extreme slope where bicycling can be difficult for the common user which precludes the placement of bike share stations in these locations. As such, candidate hub locations in block groups where the average slope was above this 2-degree threshold were not considered for bike share. These hubs were selected for e-bike share instead.
Another consideration in siting certain modes was each hub’s proximity to transportation infrastructure and services, including other mobility hubs. As an example, a hub with point-to-point car share was not sited less than 0.4 miles from another hub with point-to-point car share, owing to the longer distances typically covered by car trips. The provision of point-to-point car share services was concentrated at hubs near major transportation facilities that serve destinations beyond Oakland, such as BART stations, the Amtrak station, and the airport, and at hubs located in block groups that scored in the top 10th percentile of land use intensity. This dual placement of hubs would allow travelers to use point-to-point car share to access major destinations (as proxied by the land use criterion) from major transportation facilities, and vice versa. Conversely, bike share was excluded from the airport due to the existing road infrastructure catering to high speed automobiles and its high distance to other destinations.
Socioeconomic characteristics also informed the modal selection process. Given that e-bike share and scooter share both featured relatively high costs but comparable functionality as regular bike share, their placement focused on mobility hubs in high-income block groups, which were proxied using block groups that scored poorly on the Low Automobility index (and thus were associated with high levels of automobility). Additionally, e-bike share and scooter share were considered for hubs in areas with steep streets, as mentioned above, and in areas with high employment concentrations such as Downtown Oakland. Appendix F shows the price points of potential transportation modes servicing the mobility hubs; these price points helped to inform the qualitative modal selection.
6 Results From the suitability analysis procedure, the team arrived at a series of optimal mobility hub locations under the preferred alternative scenario and the specific modes that would participate at each hub. The following subsections present these results in more detail.

218 Consultants Fall 2015
27
6.1 Mobility Hub Locations Block groups that scored above the 50th percentile in the preferred alternative scenario, representing populations of need, resilient areas, and strong new service viability areas, were considered prime candidates for mobility hubs (Figure 5). These block groups were primarily located along major transit and commercial corridors, notably Broadway and Telegraph Avenue in Downtown and North Oakland, and International Boulevard in East Oakland.
Figure 5: Preferred alternative scenario.
For a full set of maps similar to Figure 5 for each index and scenario, please consult Appendix G and Appendix H, respectively.
The location suitability analysis resulted in 77 mobility hubs placed throughout the City, as shown in Figure 6. Mobility hubs were generally located not more than 1 mile from each other to allow for at most a 0.5 mile access radius for each hub. Most hubs sited during the High Land Use Intensity and Transportation Connectivity phase were in close proximity to key transportation infrastructure and services including BART stations, major AC Transit transfer locations, Amtrak stations, the ferry terminal, the Oakland international Airport, and intercity bus stations. Meanwhile, under the low Land Use

218 Consultants Fall 2015
28
Intensity and Transportation Connectivity assumption, hubs were located primarily in residential neighborhoods, a reasonable distance and short car or bike share trip away from the transit services listed above.
Figure 6: Selected mobility hub areas based on preferred alternative scenario and qualitative and quantitative overlays.
It is important to note that the location recommendations in Figure 6 represent the general areas where mobility hubs should be located (within an approximately one city block radius). A more detailed analysis considering street configuration, infrastructure, and parking will need to be conducted to identify specific locations on the ground (i.e. intersection corners and/or street segments).
6.2 Mobility Hub Modes The modal selection process found that the majority of the 77 recommended mobility hub locations were suitable for multiple modes, with bike share being the most ubiquitous (Figure 7; Table 6).
Certain modes were more prevalent at hubs in certain parts of Oakland. For example, the provision of e-bike share was largely located in the Oakland Hills due to the steep terrain, while point-to-point car share stations were ideally sited at major transportation terminals (the airport, Amtrak station, and intercity bus terminals) and destinations, notably residential areas, located far from these facilities, to serve potentially

218 Consultants Fall 2015
29
luggage- or cargo-carrying users intending to make a longer trip outside of Oakland by airplane, train, or bus.
The predominant modes at mobility hubs in East Oakland are bike share and round trip car share. These modes are prevalent because bike share is ideally suited for East Oakland, where many high-frequency transit lines can be reached via short trips over relatively flat terrain. Furthermore, the greater cost of point-to-point car share and e-bike share make them a less perfect match for low-income individuals living in East Oakland. However, point-to-point car share and, to a lesser extent, e-bike and scooter share services have been placed at key hubs in the area to maintain an equitable distribution of such modes across the entire city.
Figure 7: Locations of modes participating at each mobility hub.

218 Consultants Fall 2015
30
Table 6: Mobility hub modal distribution for the 77 identified hubs.
Mode Number of hubsBike share 67 Round trip car share 44 E-bike and scooter share 26 Point-to-point car share 24
7 Discussion The results of the suitability analysis merit further discussion, particularly concerning subsequent steps and considerations in implementing mobility hubs. The following sub-sections discuss these elements:
specific locations for siting hubs within the recommended areas; phasing and sequencing of hub implementation, particularly construction; alignment of a mobility hub program with existing investment plans; public safety considerations; further applications of the suitability analysis methodology; and limitations of the current study and next steps for future research and study extensions.
7.1 Location and Phasing of Hub Implementation The selected mobility hub locations offer many Oakland residents the potential to travel throughout the city using an array of fast and convenient options. The successful implementation of mobility hubs has the potential to not only improve travel times, utility, and convenience for users, but extend the reach of existing transportation investments from BART and AC Transit. As a result, mobility hubs provide great potential to influence transportation choices and patterns. Areas where there are larger concentrations of economic activity, specifically in the central business district and around the Broadway, Telegraph Avenue, North Oakland, and International Boulevard commercial corridors, have the highest concentrations of hubs, which in turn offer additional potential for increased economic output in the surrounding areas and throughout the city at large. Areas that did not perform well in either the high land use intensity or the low land use intensity assessments may have scored poorly in the preferred alternative scenario and as such did not receive any hub designations.
Implementation of a large number of hubs at once presents a burden on available funding, staff resources, operator availability, and alignment of resources with Oakland’s Department of Public Works. It is therefore necessary to consider a phasing plan for prioritizing mobility hub installations. Potential phasing strategies include, among many others:
1. concentrated implementation of mobility hubs in and around Downtown Oakland, serving the area of greatest activity as quickly as possible;
2. piloting hubs at key transportation nodes such as BART stations and AC Transit connection points, then expanding over time into nearby areas of lower accessibility; or

218 Consultants Fall 2015
31
3. prioritizing equitable mobility via a full-scale deployment in East Oakland.
As station placement comes closer to fruition and operators begin to determine appropriate amounts and distribution of modes for each hub, Oakland may gain a more comprehensive understanding of optimal modal distribution. The City can take the lead in an iterative process of deployment and balancing of modes and vehicles across the network of mobility hubs, responding to and anticipating data on vehicle availability and observed ridership.
7.2 Alignment with Existing Investment Plans Over 60 percent of the recommended hub locations (48 out of 77) are within PDAs in the City of Oakland, while a similar share also fall into designated MTC Communities of Concern55 or OEHHA CalEPA disadvantaged communities56 (Figure 8). Furthermore, the majority of locations that were among the top 10 in nearby population (Table 7) and employment (Table 8) also fell in a PDA or official designated MTC and OEHHA CalEPA disadvantaged area. The City of Oakland stands to benefit greatly by aligning its mobility hub placement strategy with existing local and regional plans that target investment in residential and commercial growth zones (e.g. PDAs), as well as regional efforts to reinvest in disadvantaged areas. In many cases, funding from state and regional sources can support new infrastructure within these areas.
Figure 8: Mobility hub candidate areas and a) Oakland Priority Development Areas; b) officially designated disadvantaged areas in Oakland. Data sources: ABAG; MTC; OEHHA CalEPA.57
55 Metropolitan Transportation Commission, “Equity Analysis Report: Transportation 2035 Plan for the San Francisco Bay Area” (Oakland, CA: Metropolitan Transportation Commission, 2009). 56 California Environmental Protection Agency, “Designation of Disadvantaged Communities Pursuant to Senate Bill 535 (De Leon),” 2014, http://www.calepa.ca.gov/EnvJustice/GHGinvest/Documents/SB535DesCom.pdf. 57 Association of Bay Area Governments, “ABAG GIS Catalog,” December 2015, http://gis.abag.ca.gov/gisdata.html; Metropolitan Transportation Commission, “Communities of Concern Tracts (detailed Data),” Metropolitan

218 Consultants Fall 2015
32
Table 7: Top 10 mobility hub locations by population. Data sources: Population: 5-year 2009–2013 ACS table B01001; jobs: 2013 LEHD; Neighborhoods: City of Oakland 2015; PDA: ABAG planning PDAs; regional and state identified disadvantaged areas: MTC Communities of Concern and OEHHA CalEPA disadvantaged communities.
Location Description Mode
Rank
Total population within 0.5 mi radius
Total jobs within 0.5 mi radius
Neighbor-hood
Closest major cross street
Within PDA
Within regional & state identified disadvantaged areas
Bike share
E-bike Share
Round trip car share
Point-to-point car share
1 19,585 987 Harrington 35th Av and Brookdale Av
No Yes Yes No No No
2 19,387 1,611 Ivy Hill 5th Av and Park Blvd
No No Yes No No No
3 18,701 1,623 Harrington 35th Av and Foothill Blvd
Yes Yes Yes No No No
4 18,655 1,128 Clinton 12th Av and E 22nd St
No No Yes No No No
5 18,385 2,683 Oak Tree Foothill Blvd and Fruitvale Av
Yes Yes Yes No Yes No
6 15,378 6,171 Clinton 6th Av and International Blvd
Yes Yes Yes No Yes No
7 15,268 1,740 Meadow Brook
23rd Av and E 24th St
No No Yes No No No
8 15,138 10,628 Grand Lake
Oakland Av and MacArthur Blvd
No Yes Yes Yes Yes No
9 14,681 61,406 City Center 14th St and Broadway
Yes Yes Yes No No Yes
10 14,484 3,429 Grand Lake
Grand Av and Lake Park Av
No No Yes Yes Yes No
Transportation Commission Open Data, October 7, 2014, http://dataportal.mtc.opendata.arcgis.com/datasets/bd01177b772e44a3880c233112d5f093_14; Office of Environmental Health Hazard Assessment, “OEHHA CalEnviroScreen 2.0” (California Environmental Protection Agency, Sacramento, CA, November 10, 2014), http://oehha.ca.gov/ej/ces2.html.

218 Consultants Fall 2015
33
Table 8: Top 10 mobility hub locations by employment. Data sources: Population: 5-year 2009–2013 ACS table B01001; jobs: 2013 LEHD; Neighborhoods: City of Oakland 2015; PDA: ABAG planning PDAs; regional and state identified disadvantaged areas: MTC Communities of Concern and OEHHA CalEPA disadvantaged communities.
Location Description Mode
Rank
Total population within 0.5 mi radius
Total jobs within 0.5 mi radius
Neighbor-hood
Closest major cross street
Within PDA
Within regional & state identified disadvantaged areas
Bike share
E-bike share
Round trip car share
Point-to-point car share
1 14,681 61,406 City Center 14th St and Broadway
Yes Yes Yes No No Yes
2 12,271 46,352 Uptown 14th St and Martin Luther King, Jr. Way
Yes Yes Yes No No No
3 10,937 45,059 Lakeside 14th St and Oak St
Yes Yes Yes No No Yes
4 6,812 41,509 Chinatown 7th St and Webster St
Yes Yes Yes No No Yes
5 8,619 32,695 Lake Merritt Office District
19th St and Broadway
Yes Yes Yes Yes No Yes
6 10,707 29,740 Uptown Grand Av and Telegraph Av
Yes Yes Yes No No Yes
7 10,317 23,806 Chinatown 7th St and Oak St
Yes Yes Yes Yes No Yes
8 3,030 22,072 Jack London Square
Clay St and Embarcadero W
Yes No Yes Yes Yes Yes
9 14,259 17,418 Oakland Avenue/ Harrison Street
Broadway and W MacArthur Blvd
Yes Yes Yes No No No
10 10,048 16,674 Peralta/ Laney
2nd Av and E 10th St
Yes Yes Yes No No Yes
7.3 Safety Considerations Implementing mobility hubs could affect both local crime and collision activity. In assessing areas’ suitability for mobility hubs, the team placed emphasis on existing physical and social conditions, rather than safety data, because the hubs themselves could have a transformative effect on safety and thus should not be constrained by potentially rapidly changing safety conditions.
Hubs placed along corridors or at intersections with relatively high vehicle volumes should be considered candidates for safety-oriented streetscape redesigns in accordance with the design principles established by

218 Consultants Fall 2015
34
the National Association of City Transportation Officials (NACTO).58 Implementing pedestrian- and bicyclist-friendly street designs will be important to the success of walking and bicycling as modes participating in mobility hubs.
Mobility hubs will be natural nexuses for activity, as Oaklanders transfer among transportation modes at hub locations. It is possible that this increased activity will cause increased incidence of crime at and near hubs, but it is equally possible that more activity may increase the “eyes on the street” and reduce criminal activity around mobility hubs. In either case, the City of Oakland could consider undertaking public safety campaigns at or near the hubs upon implementation.
7.4 Further Applications While this suitability analysis was developed for the implementation and siting of mobility hubs, the suitability analysis tools and data developed can easily be adapted for use in other citywide planning decisions. For instance, the tool can prioritize areas for resilient infrastructure, equitable paving improvements, and potential affordable housing development. The methodology behind this analysis has been rooted in widely accepted practice and contemporary transportation planning literature.
To help facilitate the future use of the data and techniques involved in this research, the team developed a proof-of-concept interactive web-based mapping tool (Figure 9). This webmap allows for internet users to explore and change the weightings for all the indices from this analysis, in effect creating their own “preferred alternative” suitability scenario. As currently developed, the tool can be used to explore the impact of different weighting schemes for City staff to consider. Users may use the map output to determine their own optimal hub locations. This tool could be expanded to include capabilities for the public to electronically submit their preferred weightings to the City for public input or as an augmentation to traditional planning activities.
58 National Association of City Transportation Officials, Urban Street Design Guide, 2nd edition (Washington: Island Press, 2013).
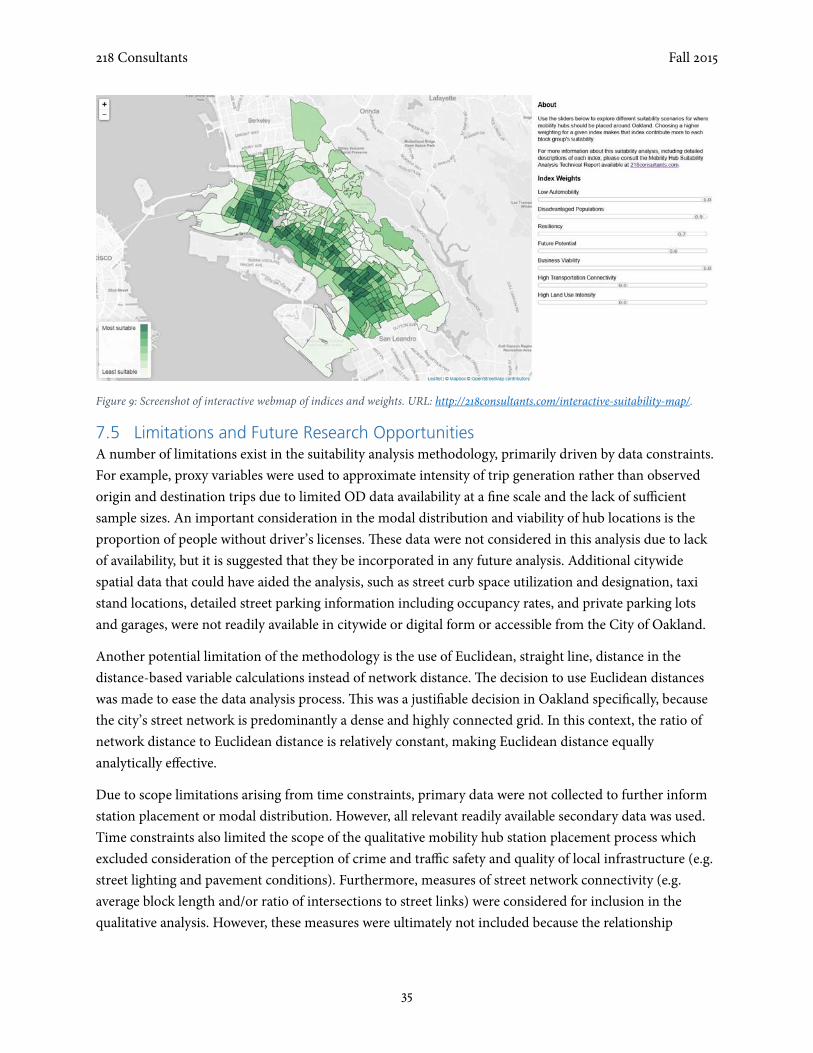
218 Consultants Fall 2015
35
Figure 9: Screenshot of interactive webmap of indices and weights. URL: http://218consultants.com/interactive-suitability-map/.
7.5 Limitations and Future Research Opportunities A number of limitations exist in the suitability analysis methodology, primarily driven by data constraints. For example, proxy variables were used to approximate intensity of trip generation rather than observed origin and destination trips due to limited OD data availability at a fine scale and the lack of sufficient sample sizes. An important consideration in the modal distribution and viability of hub locations is the proportion of people without driver’s licenses. These data were not considered in this analysis due to lack of availability, but it is suggested that they be incorporated in any future analysis. Additional citywide spatial data that could have aided the analysis, such as street curb space utilization and designation, taxi stand locations, detailed street parking information including occupancy rates, and private parking lots and garages, were not readily available in citywide or digital form or accessible from the City of Oakland.
Another potential limitation of the methodology is the use of Euclidean, straight line, distance in the distance-based variable calculations instead of network distance. The decision to use Euclidean distances was made to ease the data analysis process. This was a justifiable decision in Oakland specifically, because the city’s street network is predominantly a dense and highly connected grid. In this context, the ratio of network distance to Euclidean distance is relatively constant, making Euclidean distance equally analytically effective.
Due to scope limitations arising from time constraints, primary data were not collected to further inform station placement or modal distribution. However, all relevant readily available secondary data was used. Time constraints also limited the scope of the qualitative mobility hub station placement process which excluded consideration of the perception of crime and traffic safety and quality of local infrastructure (e.g. street lighting and pavement conditions). Furthermore, measures of street network connectivity (e.g. average block length and/or ratio of intersections to street links) were considered for inclusion in the qualitative analysis. However, these measures were ultimately not included because the relationship
218 Consultants Fall 2015
36
between street network connectivity and mobility hub suitability is complex and highly dependent upon potential modes expected to participate at any given location.
Scope and time constraints also limited the ability to develop and include a custom model of user household income and price of modes as a means of determining optimal mode distribution. Despite the fact that modes such as point-to-point car share and e-bike share might be too costly for low-income individuals living in East Oakland, the team specifically placed these modes at key hubs in the area to maintain an equitable modal distribution across the city. Looking ahead, the City of Oakland should consider providing some form of subsidy for potential users in low-income areas to ensure that this equitable modal distribution translates into equitable access to such modes. This can be achieved through collaboration with private service providers to reduce costs charged to users of lower income and other disadvantaged groups. Furthermore, several low-income areas are located in MTC Communities of Concern or OEHHA CalEPA disadvantaged communities, which may be prime candidates for external, public funding, specifically to reduce user costs associated with mobility hubs.
Lastly, future research is recommended to supplement the suitability analysis with additional quantitative feasibility models that examine the financing, maintenance, and operation feasibility for the recommended 77 mobility hubs while considering city budget constraints and funding mechanisms. Future coordination with adjacent cities, including Berkeley, Emeryville, Piedmont, Alameda, and San Leandro, will also be required for mobility hub implementation. This would aid in the siting of mobility hubs as there may be locations outside of Oakland’s boundaries that could support a mobility hub servicing populations inside Oakland, and vice versa.
8 Recommendations and Conclusions The output of the location suitability analysis identified 77 mobility hub locations throughout Oakland, most of which were near key transportation infrastructure and services, in areas with high observed land use intensity, and in lower-density residential neighborhoods that currently lack high-quality mobility options. The majority of the hub locations were suitable for multiple modes, with bike share being the most prevalent, with the characteristics of certain modes making them particularly suitable for specific classes of hub locations – for example, the steep terrain of the Oakland Hills made e-bike share and scooter share preferable to bike share. In addition to future research (utilization of better data, incorporation of complex models, coordination with other jurisdictions, and inclusion of subsidies), the City of Oakland can enhance location and modal distribution based on the following recommendations:
Conduct a rigorous suitability assessment of the 77 recommended hub locations for implementation. These locations are in part reflective of a hybrid quantitative and qualitative method that used subjective expert opinion to weight factors that determined optimal hub locations and their relative importance, which may not align in full with City of Oakland’s objectives. As such, a thorough evaluation of the extent to which each recommended location also meets the City’s objectives should be conducted, and with those most in alignment moving forward to implementation.

218 Consultants Fall 2015
37
One critical lens to be incorporated into this suitability assessment is consideration of the potential for mobility hub investments to contribute to gentrification and displacement in communities near hubs. Current research suggests that not just the investment itself, but also planning for future investment, can accelerate processes of displacement.59
Develop other scenarios to inform mobility hub placement beyond the preferred alternative and the six others presented in this report. The webmap introduced in section 7.4, Further Applications, provides a simple interface for City staff and members of the public to interactively explore the suitability analysis methodology, using scenarios that comprise various index weightings of their own choosing. Furthermore, it serves as a platform for public engagement between the implementing City agency and stakeholders outside City government, most notably residents and workers.
Expand on the modal suitability analysis performed for this study to include more variables that influence modal suitability at each proposed mobility hub location. These variables may include: curb space usage and parking availability, potential subsidies on vehicle sharing usage to lower-income populations, and detailed origin-destination trip characteristics. Incorporation of these variables may require further data collection and availability on the part of the City and regional transportation agencies.
Once the hub locations and participating modes have been optimized further, implementation of the hubs would continue with additional planning, funding, design, and finally construction. The following recommendations concern these next stages of implementation:
Phase the implementation process, particularly construction, by first considering hubs that are in close proximity to key transit services, transportation facilities, and employment and population centers. Constructing a large number of hubs at once may be infeasible due to resource constraints; as such, those that are likely to have the greatest impact, by either serving the most users or integrating best into the existing transportation system, should be prioritized. Other means of phasing and prioritization may be considered in conjunction with the Project Prioritization section of 218 Consultants’ accompanying DOT Best Practices Report.
Coordinate with relevant stakeholders outside City government throughout the implementation process. Stakeholders may include other public agencies, transit operators, vehicle sharing operators, utility service providers, neighboring municipalities, neighborhood associations, community-based organizations, and business improvement districts. For example, AC Transit and other bus operators would be invested in the specific location of mobility hubs relative to their bus stops, while utility service providers (such as the East Bay Municipal Utility District or Pacific Gas and Electric), whose utility lines run under city streets, will need to be
59 Miriam Zuk and Karen Chapple, “Case Studies on Gentrification and Displacement” (Berkeley, CA: UC Berkeley, July 2015), http://www.urbandisplacement.org/sites/default/files/images/case_studies_on_gentrification_and_displacement-_full_report.pdf.

218 Consultants Fall 2015
38
consulted should any repaving work be necessary during construction. The Internal and External Coordination section of the accompanying DOT Best Practices Report features other strategies for stakeholder coordination.
One particular aspect of this coordination is to introduce subsidy programs for mobility hub users living in low-income areas, to ensure equitable access to all modes participating in the hubs. The City should collaborate with private service providers to reduce costs charged to these users, as well as seek to leverage external, public funding to reduce usage costs for low-income areas, which are often located in MTC Communities of Concern or OEHHA CalEPA disadvantaged communities.
Perform extensive ex-post evaluation of mobility hub performance. Ex-post evaluation can be accomplished using metrics such as usage of mobility hub modes as measured using travel surveys, infrastructure and service implementation progress (the number of bike share docks constructed, for example), the number of users who are eligible for or are receiving subsidies for vehicle sharing costs, and socioeconomic indicators for service catchment areas around the hubs. Intercept surveys of hub users can also inform user satisfaction with the hubs and any user-specified recommendations for improvement. Other metrics may be informed from the Performance Management section of the accompanying DOT Best Practices Report.
Revise the distribution and volume of transportation modes at mobility hubs as necessary, based on data collected by the City of Oakland and individual service providers. Oaklanders’ travel and activity patterns may change in the future, and the flexible composition of mobility hubs allows the City to reconfigure the mobility hub network responsively. The potential for revisions to increase the physical footprint of hubs in the future should be taken into consideration when mobility hub sites are initially selected. The City may also wish to collaborate with service providers to develop a dynamic pricing mechanism that can organically encourage users to help rebalance vehicles across the city.
Finally, delivering recommendations on the location and modes of mobility hubs in Oakland is only one application of this study’s suitability analysis methodology. This framework can be generalized to assist in a variety of planning and implementation projects in Oakland and similar cities. In preparing the City’s final Pedestrian Master Plan, for example, the methodology could inform a list of high-priority intersections with pedestrian safety concerns and specific projects targeting identified locations. Equally important are applications beyond transportation, such as the identification of high-scoring projects or programs in a funding grant application.
As this report has demonstrated, this analytical framework can help improve equitable access to mobility options and facilitate the transition to a more environmentally resilient transportation network. Beyond this application, it can help the City of Oakland and its peers achieve a wide range of value-oriented outcomes for their constituents.

218 Consultants Fall 2015
39
9 References Apparicio, Philippe, and Anne-Marie Séguin. “Measuring the Accessibility of Services and Facilities for
Residents of Public Housing in Montreal.” Urban Studies 43, no. 1 (2006): 187–211. Association of Bay Area Governments. “ABAG GIS Catalog,” December 2015.
http://gis.abag.ca.gov/gisdata.html. ———. “Plan Bay Area - Plan Elements,” 2013. http://www.planbayarea.org/plan-bay-area/plan-
elements.html. ———. “Regional Resilience Initiative: Policy Agenda for Recovery.” Oakland, CA, March 2013.
http://resilience.abag.ca.gov/wp-content/documents/resilience/Regional%20Resilience%20Initiative%20Policy%20Plan_March%202013.pdf.
Banai, Reza. “Fuzziness in Geographical Information Systems: Contributions from the Analytic Hierarchy Process.” International Journal of Geographical Information Systems 7, no. 4 (July 1, 1993): 315–29. doi:10.1080/02693799308901964.
Bay Area Bike Share. “Pricing,” 2015. http://www.bayareabikeshare.com/pricing. Besser, Lilah M., and Andrew L. Dannenberg. “Walking to Public Transit: Steps to Help Meet Physical
Activity Recommendations.” American Journal of Preventive Medicine 29, no. 4 (2005): 273–80. Brown, Barbara B., Ikuho Yamada, Ken R. Smith, Cathleen D. Zick, Lori Kowaleski-Jones, and Jessie X.
Fan. “Mixed Land Use and Walkability: Variations in Land Use Measures and Relationships with BMI, Overweight, and Obesity.” Health & Place 15, no. 4 (2009): 1130–41.
Brown University. “Longitudinal Tract Data Base.” US2010. Accessed October 5, 2015. http://www.s4.brown.edu/us2010/Researcher/Bridging.htm.
Buck, Christoph, Hermann Pohlabeln, Inge Huybrechts, Ilse De Bourdeaudhuij, Yannis Pitsiladis, Lucia Reisch, and Iris Pigeot. “Development and Application of a Moveability Index to Quantify Possibilities for Physical Activity in the Built Environment of Children.” Health & Place 17, no. 6 (2011): 1191–1201.
California Environmental Protection Agency. “Designation of Disadvantaged Communities Pursuant to Senate Bill 535 (De Leon),” 2014. http://www.calepa.ca.gov/EnvJustice/GHGinvest/Documents/SB535DesCom.pdf.
Center for Neighborhood Technology. “About the Index,” 2015. http://htaindex.cnt.org/about/. ———. “Bay Area Housing and Transportation Affordability: A Closer Look.” Oakland, CA: Metropolitan
Transportation Commission, 2009. Cerin, Ester, Eva Leslie, Lorinne du Toit, Neville Owen, and Lawrence D. Frank. “Destinations That
Matter: Associations with Walking for Transport.” Health & Place 13, no. 3 (2007): 713–24. Cervero, Robert, and Michael Duncan. “Walking, Bicycling, and Urban Landscapes: Evidence from the
San Francisco Bay Area.” American Journal of Public Health 93, no. 9 (2003): 1478–83. Cervero, Robert, and Kara Kockelman. “Travel Demand and the 3Ds: Density, Diversity, and Design.”
Transportation Research Part D: Transport and Environment 2, no. 3 (1997): 199–219. Chatman, Daniel G., Robert Cervero, Emily Moylan, Ian Carlton, Dana Weissman, Joe Zissman, Erick
Guerra, et al. “Making Effective Fixed-Guideway Transit Investments: Indicators of Success. Volume 1: Handbook, Volume 2: Research Report.” TCRP Report, no. 167 (2014). http://trid.trb.org/view.aspx?id=1316715.
218 Consultants Fall 2015
40
City CarShare. “City CarShare Locations.” CityCarShare.org, December 2015. https://citycarshare.org/cars-locations/locations/.
———. “Plans & Pricing: Individuals & Households,” 2015. https://citycarshare.org/plans-pricing/individuals-households/.
City of Los Angeles. “Los Angeles Mobility Hub: Project Brief,” July 13, 2010. http://www.lachamber.com/clientuploads/TGM_committee/071310_Los%20Angeles%20Mobility%20Hub%20Project%20Brief%20July%202010.pdf.
City of Oakland, ICLEI – Local Governments for Sustainability, and CirclePoint. “Energy and Climate Action Plan,” December 4, 2012. http://www2.oaklandnet.com/oakca1/groups/pwa/documents/report/oak039056.pdf.
Delbosc, Alexa, and Graham Currie. “Using Lorenz Curves to Assess Public Transport Equity.” Journal of Transport Geography 19, no. 6 (2011): 1252–59.
Duncan, Michael. “The Impact of Transit-Oriented Development on Housing Prices in San Diego, CA.” Urban Studies 48, no. 1 (January 1, 2011): 101–27. doi:10.1177/0042098009359958.
Ewing, Reid, and Robert Cervero. “Travel and the Built Environment: A Meta-Analysis.” Journal of the American Planning Association 76, no. 3 (2010): 265–94.
———. “Travel and the Built Environment: A Synthesis.” Transportation Research Record: Journal of the Transportation Research Board, no. 1780 (2001): 87–114.
Giles-Corti, Billie, Melissa H. Broomhall, Matthew Knuiman, Catherine Collins, Kate Douglas, Kevin Ng, Andrea Lange, and Robert J. Donovan. “Increasing Walking: How Important Is Distance To, Attractiveness, and Size of Public Open Space?” American Journal of Preventive Medicine 28, no. 2 (2005): 169–76.
Goodman, Brianna, and Susan Handy. “Providing Equitable Access to Sacramento’s Bike Share System.” Research Report. Davis, CA: Institute of Transportation Studies, 2015.
“GTFS Data Exchange,” December 2015. http://www.gtfs-data-exchange.com/. Henry, Lyndon, and David L. Marsh. “Intermodal Surface Public Transport Hubs: Harnessing Synergy for
Success in America’s Urban and Intercity Travel,” 2008. http://trid.trb.org/view.aspx?id=874793. Hernandez, Carlos. “Questions Re Bike Share (City of Oakland Email),” November 4, 2015. Jiang, Hong, and J. Ronald Eastman. “Application of Fuzzy Measures in Multi-Criteria Evaluation in GIS.”
International Journal of Geographical Information Science 14, no. 2 (March 13, 2000): 173–84. doi:10.1080/136588100240903.
Kwan, Mei-Po. “Interactive Geovisualization of Activity-Travel Patterns Using Three-Dimensional Geographical Information Systems: A Methodological Exploration with a Large Data Set.” Transportation Research Part C: Emerging Technologies 8, no. 1 (2000): 185–203.
Lyft. “San Francisco,” 2015. https://www.lyft.com/cities/san-francisco. Malczewski, Jacek. “GIS-Based Land-Use Suitability Analysis: A Critical Overview.” Progress in Planning
62, no. 1 (July 2004): 3–65. doi:10.1016/j.progress.2003.09.002. Messer, Lynne C., Barbara A. Laraia, Jay S. Kaufman, Janet Eyster, Claudia Holzman, Jennifer Culhane,
Irma Elo, Jessica G. Burke, and Patricia O’Campo. “The Development of a Standardized Neighborhood Deprivation Index.” Journal of Urban Health: Bulletin of the New York Academy of Medicine 83, no. 6 (November 2006): 1041–62. doi:10.1007/s11524-006-9094-x.
Metrolinx. “Mobility Hubs: Development of a Regional Transportation Plan for the Greater Toronto and Hamilton Area, Green Paper #2.” Toronto, Ontario, February 2008.

218 Consultants Fall 2015
41
http://www.metrolinx.com/en/projectsandprograms/mobilityhubs/Mobility_Hubs_green_paper.pdf.
Metropolitan Transportation Commission. “Climate Change Adaptation Case Studies.” Oakland, CA, 2011. http://www.fhwa.dot.gov/environment/climate_change/adaptation/case_studies/ san_francisco_mtc/index.cfm.
———. “Communities of Concern Tracts (detailed Data).” Metropolitan Transportation Commission Open Data, October 7, 2014. http://dataportal.mtc.opendata.arcgis.com/datasets/bd01177b772e44a3880c233112d5f093_14.
———. “Equity Analysis Report: Transportation 2035 Plan for the San Francisco Bay Area.” Oakland, CA: Metropolitan Transportation Commission, 2009.
Miller, Ruth. “What Oakland Mayor’s Proposal for a Department of Transportation Means.” Streetsblog California, May 19, 2015. http://cal.streetsblog.org/2015/05/19/what-oakland-mayors-proposal-for-a-department-of-transportation-means/.
Moudon, Anne Vernez, and Chanam Lee. “Walking and Bicycling: An Evaluation of Environmental Audit Instruments.” American Journal of Health Promotion 18, no. 1 (2003): 21–37.
Murray, Alan T., and Rex Davis. “Equity in Regional Service Provision.” Journal of Regional Science 41, no. 4 (2001): 557–600. doi:10.1111/0022-4146.00233.
National Association of City Transportation Officials. Urban Street Design Guide. 2nd edition. Washington: Island Press, 2013.
Nelson\Nygaard Consulting Associates, Inc. “Mobility Hubs for Tysons Corner Metrorail Stations: Conceptual Design Plans,” 2013. http://www.mwcog.org/transportation/activities/tlc/pdf/Fairfax-Hubs.pdf.
NoHo Mobility Hub Rendering. Rendering, 2015. http://www.culturalweekly.com/wp-content/uploads/2015/02/NoHo-RNL-Renderings-V2-2.jpg.
Office of Environmental Health Hazard Assessment. “OEHHA CalEnviroScreen 2.0.” California Environmental Protection Agency, Sacramento, CA, November 10, 2014. http://oehha.ca.gov/ej/ces2.html.
Prelog, Rachel. “Equity of Access to Bicycle Infrastructure.” League of American Bicyclists, September 1, 2015. http://www.bikeleague.org/content/new-report-equity-access-bicycle-infrastructure.
Pucher, John, and Ralph Buehler. “Integrating Bicycling and Public Transport in North America.” Journal of Public Transportation 12, no. 3 (2009): 79–104. doi:http://dx.doi.org/10.5038/2375-0901.12.3.5.
Scoot Networks. “Membership,” 2015. http://www.scootnetworks.com/membership/. Shaheen, Susan, and Matt Christensen. “Shared-Use Mobility Summit: Retrospective from North
America’s First Gathering on Shared-Use Mobility.” Berkeley, CA: Transportation Sustainability Research Center, 2013.
Taylor, Brian D. “The Geography of Urban Transportation Finance.” The Geography of Urban Transportation, 2004, 294–331.
Uber. “Uber - San Francisco Bay Area,” 2015. https://www.uber.com/cities/san-francisco. Wells, Kirstin, and Jean-Claude Thill. “Do Transit-Dependent Neighborhoods Receive Inferior Bus
Access? A Neighborhood Analysis in Four US Cities.” Journal of Urban Affairs 34, no. 1 (2012): 43–63.
Xiang, W.-N., and D. L. Whitley. “Weighting Land Suitability Factors by the PLUS Method.” Environment and Planning B: Planning and Design 21, no. 3 (1994): 273–304. doi:10.1068/b210273.

218 Consultants Fall 2015
42
Zipcar. “Car Sharing San Francisco Bay Area - Find Car Share Locations,” December 2015. http://www.zipcar.com/sf/find-cars.
———. “San Francisco Bay Area Carsharing Rates & Plans,” 2015. http://www.zipcar.com/sf/check-rates. Zuk, Miriam, and Karen Chapple. “Case Studies on Gentrification and Displacement.” Berkeley, CA: UC
Berkeley, July 2015. http://www.urbandisplacement.org/sites/default/files/images/case_studies_on_gentrification_and_displacement-_full_report.pdf.

218 Consultants Fall 2015
43
Appendix A List of data sources
Data Category Year Spatial Data Type or Unit Source
Demographic/ socioeconomic variables
Demographic/ socioeconomic
2009–2013; 2010; 2000
Polygon Census block group and tract
2009–2013 5-year ACS; 2010 Census SF1; 2000 Census SF1
Employment locations and numbers
Employment 2003 and 2013
Polygon Census block
LEHD
HUD public housing inventory
Housing 2007 Point Alameda County
HUD housing choice vouchers
Housing 2015 Polygon Census Tract
HUD
Business establishments
Land use 2015 Point ESRI Business Analyst InfoGroup
Parks and protected areas
Land use 2015 Polygon CPAD
Priority Development Areas
Land use 2015 Polygon ABAG
Fire threat Resiliency 2005 100 m raster grid California Department of Forestry and Fire Protection
Sea level rise inundation risk
Resiliency 2012 Polygon NOAA
National flood hazard zones
Resiliency 2014 Polygon FEMA
Earthquake liquefaction zones
Resiliency 2006 Polygon USGS
Social service offices Services 2015 Point Alameda County Schools and colleges Services 2014 Point Alameda County Healthcare facilities Services 2014 Point California Department of
Public Health Housing and Transportation Affordability Index
Socioeconomic 2014 Polygon Census Tract
Center for Neighborhood Technology
Street centerlines Streets 2014 Polyline Alameda County Digital Elevation Model
Terrain 2009 10 m raster grid USGS
AC Transit stops and schedule
Transportation 2015 Point AC Transit GTFS

218 Consultants Fall 2015
44
Data Category Year Spatial Data Type or Unit Source
BART stops and schedule
Transportation 2015 Point BART GTFS
Ferry terminals Transportation 2008 Point MTC Amtrak stations Transportation 2008 Point MTC Intercity bus stations Transportation 2015 Point Greyhound, Megabus,
BoltBus Car share locations Vehicle sharing 2015 Point City CarShare and Zipcar
Notes: HUD: U.S. Department of Housing and Urban Development, AC Transit: Alameda–Contra Costa Transit District, BART: Bay Area Rapid Transit, ACS: American Community Survey, SF: Summary File, LEHD: Longitudinal Employer–Household Dynamics, ESRI: Environmental Systems Research Institute, CPAD: California Protected Areas Database, ABAG: Association of Bay Area Governments, NOAA: National Oceanic and Atmospheric Administration, FEMA: Federal Emergency Management Agency, USGS: U.S. Geological Survey, GTFS: General Transit Feed Specification, MTC: Metropolitan Transportation Commission.

218 Consultants Fall 2015
45
Appendix B Variables participating in indices
Variable Variable Name
Low Automobility (ix_auto)
Disadvantaged Populations (ix_disad)
Transportation Connectivity (Low) (ix_tcfe)
Transportation Connectivity (High) (ix_tcco)
Land Use Intensity (Low) (ix_lufe)
Land Use Intensity (High) (ix_luco)
Resiliency (ix_res)
New Service Viability (ix_buvi)
Future Growth Potential (ix_fupo)
% of households with fewer vehicles than individuals
LowVehHH_z 1.0
% of households with zero vehicles
ZeroVehH_z 1.0
% of population who are K-12 students
K12Stud_z 0.8
% of population who are seniors (anyone above 65)
Seniors_z 0.5
transportation costs as a percentage of national median income
TransCos_z 0.5 0.2
% of “limited English speaking households”
LowEngli_z 0.3
% of renter-occupied housing units who are housing choice voucher recipients
VoucherP_z 0.3
Count of public housing projects
PubHouCt_z 0.5
% of households in income quartile 1: $0-$23,142 (mapped to $0-24,999)
IncQ1Pct_z 0.8

218 Consultants Fall 2015
46
Variable Variable Name
Low Automobility (ix_auto)
Disadvantaged Populations (ix_disad)
Transportation Connectivity (Low) (ix_tcfe)
Transportation Connectivity (High) (ix_tcco)
Land Use Intensity (Low) (ix_lufe)
Land Use Intensity (High) (ix_luco)
Resiliency (ix_res)
New Service Viability (ix_buvi)
Future Growth Potential (ix_fupo)
% of households in income quartile 2: $23,143-$52,583 (mapped to $25,000-49,999)
IncQ2Pct_z 0.4
% of households in income quartile 3: $52,584-$100,668 (mapped to $50,000-99,999)
IncQ3Pct_z 0.0
% of households in income quartile 4: $100,669+ (mapped to $100,000+)
IncQ4Pct_z -0.4
% of population who are not non-Hispanic white in 2010
PctNonWh_z 0.7
% of population with disabilities
Disabled_z 0.5
% of households that receive Food Stamps or a Food Stamp benefit card
FoodStam_z 0.5
block group centroid distance (mi) to BART station
bartdist_z 1.0
block group centroid distance (mi) to ferry terminal
ferrydis_z 0.4
block group centroid distance (mi) to Amtrak station
amtrdist_z 0.4
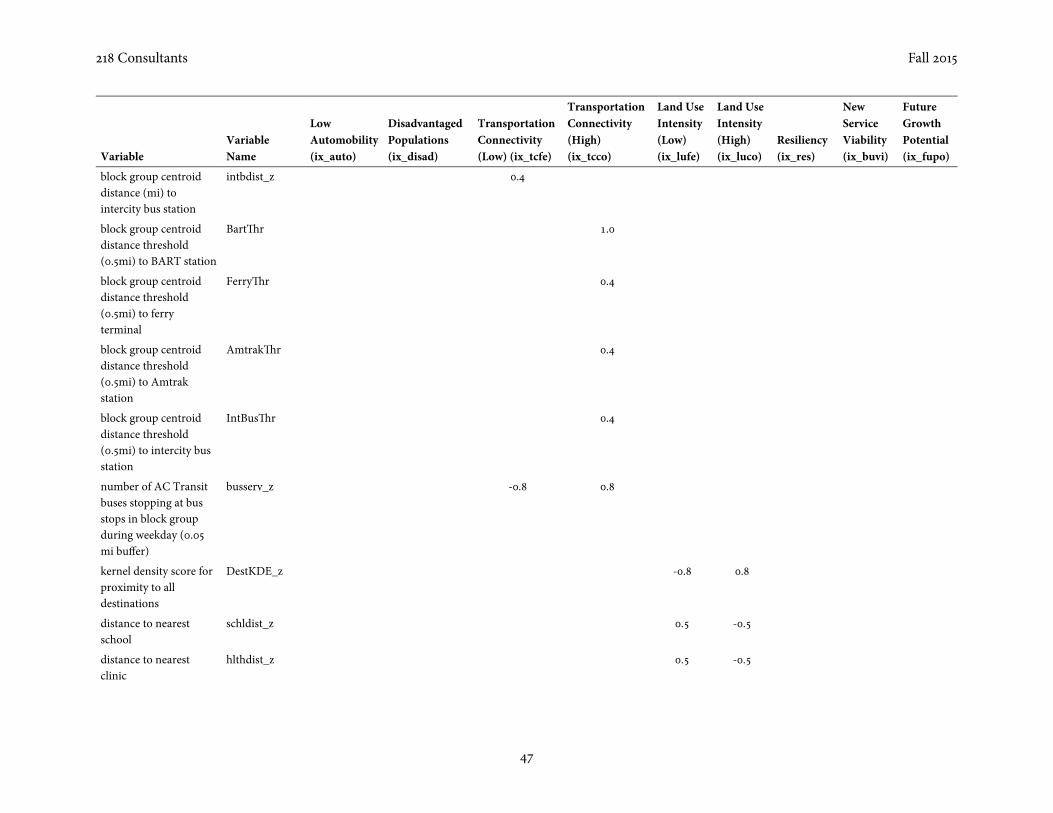
218 Consultants Fall 2015
47
Variable Variable Name
Low Automobility (ix_auto)
Disadvantaged Populations (ix_disad)
Transportation Connectivity (Low) (ix_tcfe)
Transportation Connectivity (High) (ix_tcco)
Land Use Intensity (Low) (ix_lufe)
Land Use Intensity (High) (ix_luco)
Resiliency (ix_res)
New Service Viability (ix_buvi)
Future Growth Potential (ix_fupo)
block group centroid distance (mi) to intercity bus station
intbdist_z 0.4
block group centroid distance threshold (0.5mi) to BART station
BartThr 1.0
block group centroid distance threshold (0.5mi) to ferry terminal
FerryThr 0.4
block group centroid distance threshold (0.5mi) to Amtrak station
AmtrakThr 0.4
block group centroid distance threshold (0.5mi) to intercity bus station
IntBusThr 0.4
number of AC Transit buses stopping at bus stops in block group during weekday (0.05 mi buffer)
busserv_z -0.8 0.8
kernel density score for proximity to all destinations
DestKDE_z -0.8 0.8
distance to nearest school
schldist_z 0.5 -0.5
distance to nearest clinic
hlthdist_z 0.5 -0.5

218 Consultants Fall 2015
48
Variable Variable Name
Low Automobility (ix_auto)
Disadvantaged Populations (ix_disad)
Transportation Connectivity (Low) (ix_tcfe)
Transportation Connectivity (High) (ix_tcco)
Land Use Intensity (Low) (ix_lufe)
Land Use Intensity (High) (ix_luco)
Resiliency (ix_res)
New Service Viability (ix_buvi)
Future Growth Potential (ix_fupo)
distance to nearest social service office
sservdis_z 0.5 -0.5
distance to parks parkdist_z 0.4 -0.4
low liquefaction susceptibility
Liq_Valu_z -0.7
block group in annual flood risk zone (zone suitability 0.2% annual chance flood hazard)
WillFlood -0.5
% block group area that would be underwater given 1 foot sea level rise
SLR_1ft -0.4
% block group area that would be underwater given 3 feet sea level rise
SLR_3ft -0.4
% block group area that would be underwater given 5 feet sea level rise
SLR_5ft -0.4
fire risk to property for majority of block group area
FireThrt_z -0.6
proportion of block group area within Plan Bay Area Priority Development Area
PctPDA_z 0.8
population within 0.25mi buffer
TtlPop25_z 0.8
higher-income population within 0.25mi buffer
Inc25Q4_z 0.8

218 Consultants Fall 2015
49
Variable Variable Name
Low Automobility (ix_auto)
Disadvantaged Populations (ix_disad)
Transportation Connectivity (Low) (ix_tcfe)
Transportation Connectivity (High) (ix_tcco)
Land Use Intensity (Low) (ix_lufe)
Land Use Intensity (High) (ix_luco)
Resiliency (ix_res)
New Service Viability (ix_buvi)
Future Growth Potential (ix_fupo)
number of jobs within 0.25mi buffer
TtlJob25_z -0.7 0.7 1.0
number of higher-income jobs within 0.25mi buffer
HiEarn25_z 1.0
population change over time
PpChange_z 0.6
increase in jobs over time
JbChange_z 0.8
count of current carshare locations
CarShaCt_z 0.2

218 Consultants Fall 2015
50
Appendix C Equations used to calculate each index Index Short Name Equation Low Automobility ix_auto [LowVehHH_z]*1 + [ZeroVehH_z]*1 + [K12Stud_z]*0.8 +
[Seniors_z]*0.5 Disadvantaged Populations
ix_disad [TransCos_z]*0.5 + [LowEngli_z]*0.3 + [VoucherP_z]*0.3 + [PubHouCt_z]*0.5 + [IncQ1Pct_z]*0.8 + [IncQ2Pct_z]*0.4 + [IncQ3Pct_z]*0 + [IncQ4Pct_z]*-0.4 + [PctNonWh_z]*0.7 + [Disabled_z]*0.5 + [FoodStam_z]*0.5
Transportation Connectivity (Low)
ix_tcfe [bartdist_z]*1 + [ferrydis_z]*0.4 + [amtrdist_z]*0.4 + [intbdist_z]*0.4 + [busserv_z]*-0.8
Transportation Connectivity (High)
ix_tcco [BartThr]*1 + [FerryThr]*0.4 + [AmtrakThr]*0.4 + [IntBusThr]*0.4 + [busserv_z]*0.8
Land Use Intensity (Low)
ix_lufe [DestKDE_z]*-0.8 + [schldist_z]*0.5 + [hlthdist_z]*0.5 + [sservdis_z]*0.5 + [parkdist_z]*0.4 + [TtlJob25_z]*-0.7
Land Use Intensity (High)
ix_luco [DestKDE_z]*0.8 + [schldist_z]*-0.5 + [hlthdist_z]*-0.5 + [sservdis_z]*-0.5 + [parkdist_z]*-0.4 + [TtlJob25_z]*0.7
Resiliency ix_res [Liq_Valu_z]*-0.7 + [WillFlood]*-0.5 + [SLR_1ft]*-0.4 + [SLR_3ft]*-0.4 + [SLR_5ft]*-0.4 + [FireThrt_z]*-0.6
New Service Viability
ix_buvi [TransCos_z]*0.2 + [TtlPop25_z]*0.8 + [Inc25Q4_z]*0.8 + [TtlJob25_z]*1 + [HiEarn25_z]*1 + [HighEarn_z]*1 + [CarShaCt_z]*0.2
Future Growth Potential
ix_fupo [PctPDA_z]*0.8 + [PpChange_z]*0.6 + [JbChange_z]*0.8
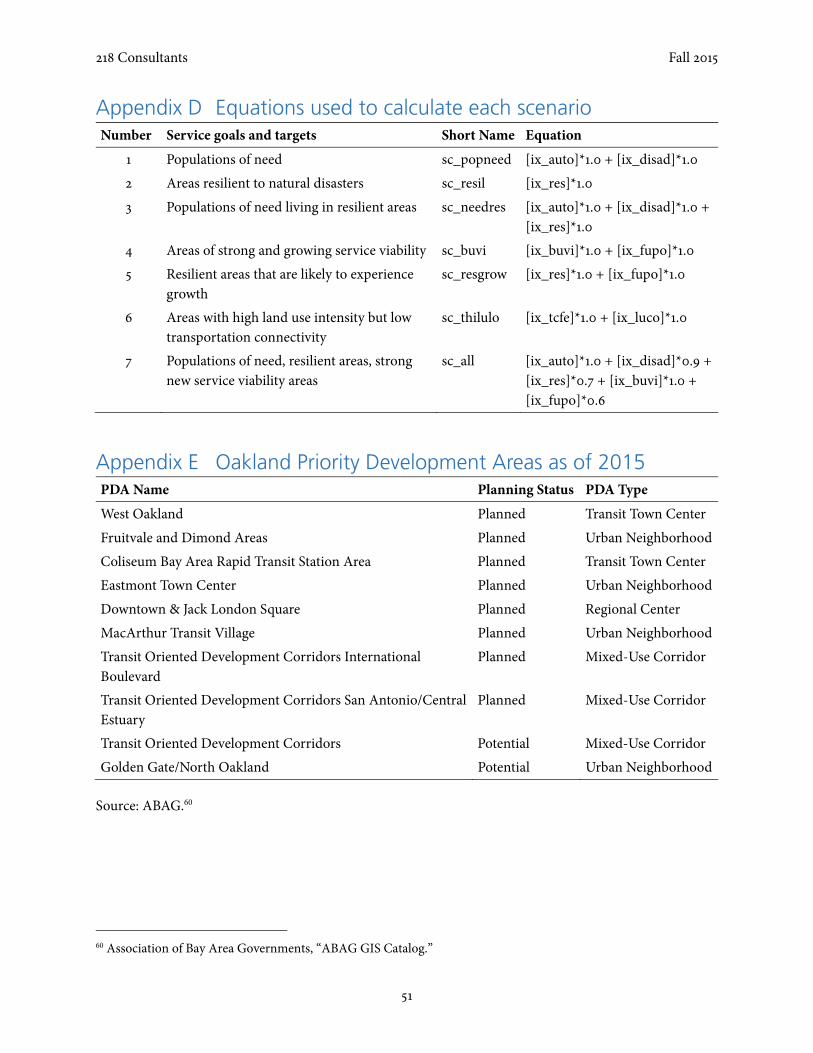
218 Consultants Fall 2015
51
Appendix D Equations used to calculate each scenario Number Service goals and targets Short Name Equation
1 Populations of need sc_popneed [ix_auto]*1.0 + [ix_disad]*1.0 2 Areas resilient to natural disasters sc_resil [ix_res]*1.0 3 Populations of need living in resilient areas sc_needres [ix_auto]*1.0 + [ix_disad]*1.0 +
[ix_res]*1.0 4 Areas of strong and growing service viability sc_buvi [ix_buvi]*1.0 + [ix_fupo]*1.0 5 Resilient areas that are likely to experience
growth sc_resgrow [ix_res]*1.0 + [ix_fupo]*1.0
6 Areas with high land use intensity but low transportation connectivity
sc_thilulo [ix_tcfe]*1.0 + [ix_luco]*1.0
7 Populations of need, resilient areas, strong new service viability areas
sc_all [ix_auto]*1.0 + [ix_disad]*0.9 + [ix_res]*0.7 + [ix_buvi]*1.0 + [ix_fupo]*0.6
Appendix E Oakland Priority Development Areas as of 2015 PDA Name Planning Status PDA Type West Oakland Planned Transit Town Center Fruitvale and Dimond Areas Planned Urban NeighborhoodColiseum Bay Area Rapid Transit Station Area Planned Transit Town Center Eastmont Town Center Planned Urban NeighborhoodDowntown & Jack London Square Planned Regional Center MacArthur Transit Village Planned Urban NeighborhoodTransit Oriented Development Corridors International Boulevard
Planned Mixed-Use Corridor
Transit Oriented Development Corridors San Antonio/Central Estuary
Planned Mixed-Use Corridor
Transit Oriented Development Corridors Potential Mixed-Use Corridor Golden Gate/North Oakland Potential Urban Neighborhood
Source: ABAG.60
60 Association of Bay Area Governments, “ABAG GIS Catalog.”
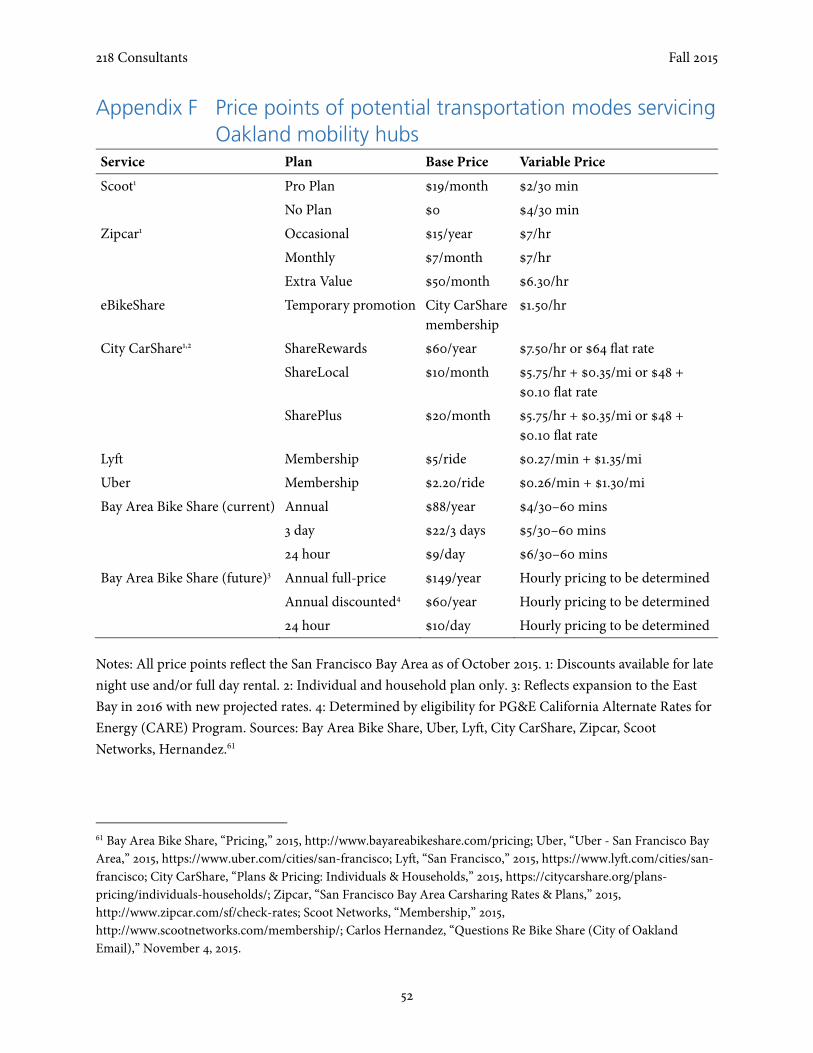
218 Consultants Fall 2015
52
Appendix F Price points of potential transportation modes servicing Oakland mobility hubs
Service Plan Base Price Variable Price Scoot1 Pro Plan $19/month $2/30 min No Plan $0 $4/30 min Zipcar1 Occasional $15/year $7/hr Monthly $7/month $7/hr Extra Value $50/month $6.30/hr eBikeShare Temporary promotion City CarShare
membership $1.50/hr
City CarShare1,2 ShareRewards $60/year $7.50/hr or $64 flat rate ShareLocal $10/month $5.75/hr + $0.35/mi or $48 +
$0.10 flat rate SharePlus $20/month $5.75/hr + $0.35/mi or $48 +
$0.10 flat rate Lyft Membership $5/ride $0.27/min + $1.35/mi Uber Membership $2.20/ride $0.26/min + $1.30/mi Bay Area Bike Share (current) Annual $88/year $4/30–60 mins 3 day $22/3 days $5/30–60 mins 24 hour $9/day $6/30–60 mins Bay Area Bike Share (future)3 Annual full-price $149/year Hourly pricing to be determined Annual discounted4 $60/year Hourly pricing to be determined 24 hour $10/day Hourly pricing to be determined
Notes: All price points reflect the San Francisco Bay Area as of October 2015. 1: Discounts available for late night use and/or full day rental. 2: Individual and household plan only. 3: Reflects expansion to the East Bay in 2016 with new projected rates. 4: Determined by eligibility for PG&E California Alternate Rates for Energy (CARE) Program. Sources: Bay Area Bike Share, Uber, Lyft, City CarShare, Zipcar, Scoot Networks, Hernandez.61
61 Bay Area Bike Share, “Pricing,” 2015, http://www.bayareabikeshare.com/pricing; Uber, “Uber - San Francisco Bay Area,” 2015, https://www.uber.com/cities/san-francisco; Lyft, “San Francisco,” 2015, https://www.lyft.com/cities/san-francisco; City CarShare, “Plans & Pricing: Individuals & Households,” 2015, https://citycarshare.org/plans-pricing/individuals-households/; Zipcar, “San Francisco Bay Area Carsharing Rates & Plans,” 2015, http://www.zipcar.com/sf/check-rates; Scoot Networks, “Membership,” 2015, http://www.scootnetworks.com/membership/; Carlos Hernandez, “Questions Re Bike Share (City of Oakland Email),” November 4, 2015.

218 Consultants Fall 2015
53
Appendix G Maps of indices used in scenarios
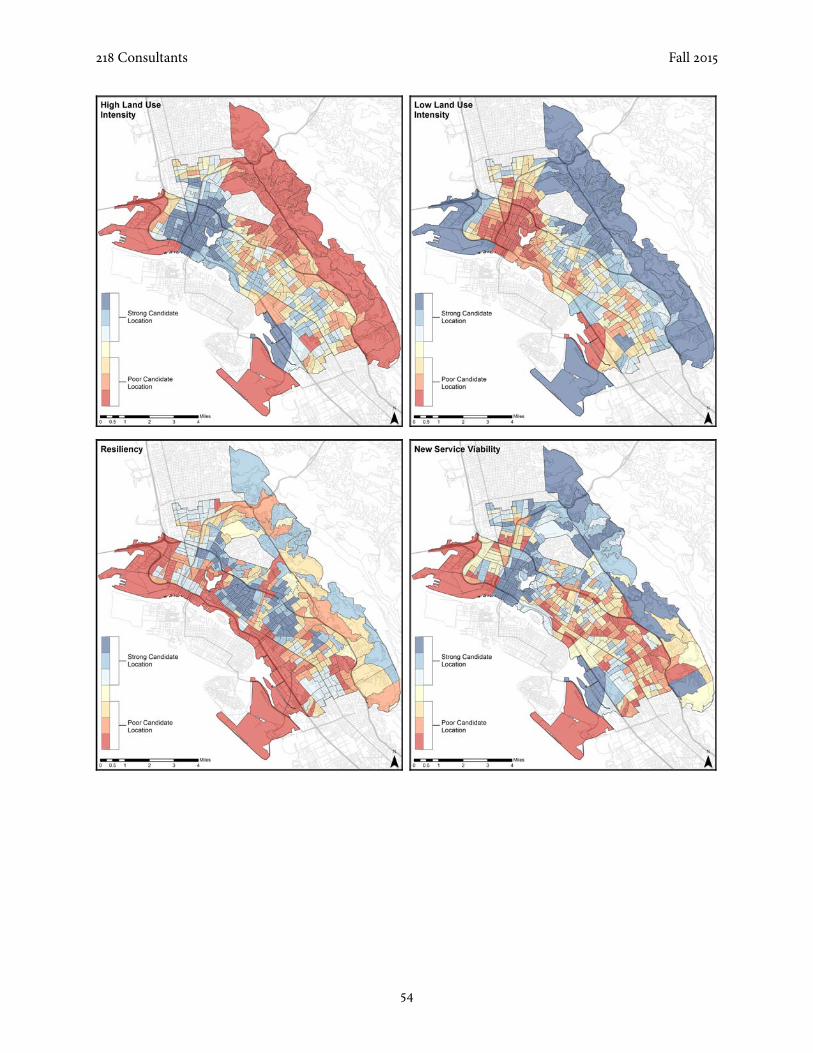
218 Consultants Fall 2015
54

218 Consultants Fall 2015
55

218 Consultants Fall 2015
56
Appendix H Maps of scenarios used for suitability analysis

218 Consultants Fall 2015
57