city of pataskala, ohio finance · pdf filecity of pataskala, ohio finance department ......
TRANSCRIPT

City of Pataskala, Ohio Finance Department
Report to City Council For the Period Ended September 30, 2012
James M. Nicholson Finance Director

CITY OF PATASKALA, OHIO September 2012 Finance Dept. Report to Council
Table of Contents
Table of Contents ............................................................................................................ 1
Financial Condition Report ............................................................................................. 3
Cash & Fund Balance Reconciliation ............................................................................... 6
Year To‐Date Fund Balance Detail .................................................................................. 7
Full‐Year 2012 Fund Activity & Balance Projections ....................................................... 8
A1 ‐ General Fund ........................................................................................................... 9 Fund Analysis ....................................................................................................... 9 Revenue & Expenditure Statement ..................................................................... 11 Revenue Detail ..................................................................................................... 12 Expenditure Detail ............................................................................................... 13
B1 – Street Fund ............................................................................................................. 15 Fund Analysis ....................................................................................................... 15 Revenue & Expenditure Statement ..................................................................... 18 Revenue Detail ..................................................................................................... 19
B13 – Police Fund ........................................................................................................... 21 Fund Analysis ....................................................................................................... 21 Revenue & Expenditure Statement ..................................................................... 23 Revenue Detail ..................................................................................................... 24
C6 – Capital Improvements Fund ................................................................................... 25 Fund Analysis ....................................................................................................... 25 Revenue & Expenditure Statement ..................................................................... 28 Revenue Detail ..................................................................................................... 29
E1 – Water Fund ............................................................................................................. 31 Fund Analysis ....................................................................................................... 31 Revenue & Expenditure Statement ..................................................................... 33 Revenue Detail ..................................................................................................... 34
E2 – Sewer Fund ............................................................................................................. 35 Fund Analysis ....................................................................................................... 35 Revenue & Expenditure Statement ..................................................................... 37 Revenue Detail ..................................................................................................... 38
- 1 -

- 2 -

TO: City Council Members Mayor Butcher Tim Boland, City Administrator
FROM: Jamie Nicholson
DATE: October 9, 2012
RE: September 2012 Financial Condition Report We have closed the books for the month of September and Q3‐2012, and I am pleased to present this report on the financial condition of the city. On a year to‐date cash basis, the city has collected more than $12.91 million in total revenue from all sources, or 77.36% of budget. Income tax collections for the month were $358,891 and were 59.49% higher than last year when compared to the $225,019 collected in September 2011. Total year to‐date income tax collections are $2.87 million (107% of budget), and when compared to a September 2011 YTD total of $2.52 million, are $344,929 or 13.67% higher. The full‐year budget is currently projected to be $2.67 million. It is important to note that the September 2011 year to‐date collections were 77.21% of the full‐year actual collections. During the month of October, we will be increasing the full‐year income tax revenues by $770,000, or 28.75% to reflect the better than originally estimated rate of collection. The city has received both of the semi‐annual property tax settlements from Licking County. Total property taxes received to‐date are $795,712, and are $144.2 thousand, or 15.34% below budget. It is important to note, however, that collections are only $12,500 or 1.5% below 2011 levels. It appears that the 2012 estimate provided by the County Auditor included the rollback/homestead monies, and the budget duplicated those funds. During October, the real property tax line will be decreased to reflect the actual receipts. The full‐year budget for all property tax revenues (real, personal, etc.) is $1.05 million, and includes approximately $103 thousand in TIF receipts and nearly $18 thousand in other property tax revenues. Intergovernmental revenues represent one of the largest revenue categories for the city. They reflect funding from the federal, state and county governments. The revenues can come in the form of loans,
CITY OF PATASKALA, OHIO
City of Pataskala Finance Department
James M. Nicholson, Finance Director [email protected]
Janice A. Smith, Finance Manager [email protected]
621 West Broad Street Suite 2B
Pataskala, Ohio 43062 Telephone: (740) 927-3167
Fax: (740) 927-0228
www.ci.pataskala.oh.us
Property Tax$917,229 7.10%
Income Tax$2,866,472 22.20%
Inter‐governmental$2,958,105 22.91%
Service Charges$2,053,028 15.90%
Fines & Permits$220,291 1.71%
Misc Other$2,589,276 20.05%
Transfers & Advances$1,308,997 10.14%
YTD Revenue by Source
- 3 -

grants or reimbursements. For 2012, a total of $5.61 million has been budgeted, with $4.38 million of the total coming from grants and loans. Through September 30, a total of $2.96 million (52.74% of the category budget) has been collected. Approximately $900 thousand of the uncollected total represents OPWC loan/grant payments directly to the associated contractors, and is directly offset by non‐incurred project expenditures. In October, these revenues (along with the corresponding expenditures) will be eliminated from the budget. Service charge revenues are another major revenue category for the city. As the title would imply, these revenues are received in exchange for providing services to residents, businesses and other customers. Water and sewer usage fees represent the largest single component of this category. For 2012, $2.20 million has been budgeted for total service charge revenues. Water and sewer fees represent $2.04
million, or 92.76% of the category total. Year to date collections are $2.05 million, or 93.17% of the budget. The total is up by $166,173 (8.80%) when compared to the same nine‐month period in 2011. With three quarters on the books for 2012, expenditures continue to be better than or generally in line with expectations. As of September 30, the combined total unencumbered balance as a percentage of the budget (for all funds ‐ excluding contingency funds) is 33.85%. This is $2.0 million higher than, and compares favorably to, the 9‐month straight‐line rate of 25%.
The general fund ended the month of September 2012 with an unencumbered balance of $1.26 million, and is down by $243.3 thousand, or 16.14% from September 2011. In addition, the Street (B1) fund unencumbered fund balance has declined by $67.8 thousand (9.39%), and the Police (B13) fund has declined by $500.5 thousand (26.99%) from 2011 as well. It will be important for the city to continue to closely monitor each of the key fund balances to ensure that adequate funding is available to provide the desired level of service to the community. I have provided this summary analysis to facilitate a better understanding of the sources of
General Fund$1,608,564 12.46%
Street Fund$932,200 7.22%
Police Fund$762,555 5.91%
Capital Improvements$2,326,560 18.02%Water Fund
$1,012,465 7.84%
Sewer Fund$812,477 6.29%
Water/Sewer Capital
$2,794,497 21.64%
Other Governmental$1,337,950 10.36%
Other Enterprise$1,326,201 10.27%
YTD Revenue by Fund
General Fund$1,269,936 12.57%
Street Fund$899,176 8.90%
Police Fund$1,439,055 14.24%
Capital Improvements
$458,927 4.54%Water Fund
$902,369 8.93%
Sewer Fund$1,473,897 14.59%
Water/Sewer Capital
$1,573,312 15.57%
Other Governmental
$853,759 8.45%
Other Enterprise$1,232,753 12.20%
YTD Expenditures by Fund
September September FY Bud/Act
FY 2012 $358,891 $2,866,472 $2,678,001
FY 2011 $225,019 $2,521,543 $3,265,037
$‐
$0.5
$1.0
$1.5
$2.0
$2.5
$3.0
$3.5
Millions
Income Tax Collections ‐ All Funds
- 4 -

all city revenues, the status of collections to‐date and available fund balances. The report will now turn its focus to each of the primary governmental and enterprise funds of the city: A1 – General Fund; B1 – Street Fund; B13 – Police Fund; C6 – Capital Improvements; and E1/E2 – Water/Sewer Funds. Over the next several months, we will be spending a significant amount of time and effort developing revenue projections, as well as program and project spending plans for 2013 and beyond. I look forward to presenting our assumptions and the resulting product to Council in late‐October. Respectfully submitted,
- 5 -
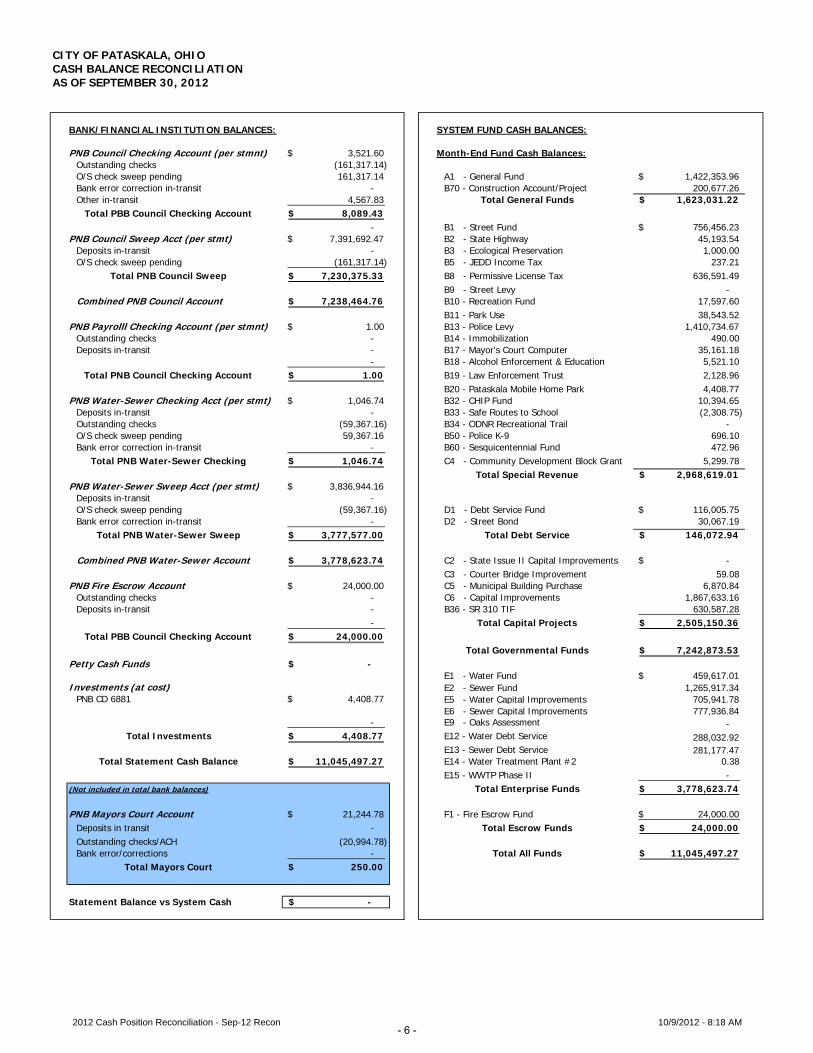
CITY OF PATASKALA, OHIOCASH BALANCE RECONCILIATIONAS OF SEPTEMBER 30, 2012
BANK/FINANCIAL INSTITUTION BALANCES: SYSTEM FUND CASH BALANCES:
PNB Council Checking Account (per stmnt) 3,521.60$ 0 Month-End Fund Cash Balances:Outstanding checks (161,317.14) 0 # ##O/S check sweep pending 161,317.14 0 # A1 - General Fund 1,422,353.96$ ##Bank error correction in-transit - 0 B70 - Construction Account/Project 200,677.26 Other in-transit 4,567.83 0 Total General Funds 1,623,031.22$
Total PBB Council Checking Account 8,089.43$ 0 # ##- 0 # B1 - Street Fund 756,456.23$ ##
PNB Council Sweep Acct (per stmt) 7,391,692.47$ 0 # B2 - State Highway 45,193.54 ##Deposits in-transit - # B3 - Ecological Preservation 1,000.00 ##O/S check sweep pending (161,317.14) 0 # B5 - JEDD Income Tax 237.21 ##
Total PNB Council Sweep 7,230,375.33$ 1 # B8 - Permissive License Tax 636,591.49 ##0 # B9 - Street Levy - ##
Combined PNB Council Account 7,238,464.76$ 0 # B10 - Recreation Fund 17,597.60 ##0 # B11 - Park Use 38,543.52 ##
PNB Payrolll Checking Account (per stmnt) 1.00$ 0 # B13 - Police Levy 1,410,734.67 ##Outstanding checks - 0 # B14 - Immobilization 490.00 ##Deposits in-transit - 1 # B17 - Mayor's Court Computer 35,161.18 ##
- 0 # B18 - Alcohol Enforcement & Education 5,521.10 ##Total PNB Council Checking Account 1.00$ 1 # B19 - Law Enforcement Trust 2,128.96 ##
0 # B20 - Pataskala Mobile Home Park 4,408.77 ##PNB Water-Sewer Checking Acct (per stmt) 1,046.74$ # B32 - CHIP Fund 10,394.65 ##
Deposits in-transit - 0 # B33 - Safe Routes to School (2,308.75) ##Outstanding checks (59,367.16) 1 # B34 - ODNR Recreational Trail - ##O/S check sweep pending 59,367.16 B50 - Police K-9 696.10 Bank error correction in-transit - # # B60 - Sesquicentennial Fund 472.96 ##
Total PNB Water-Sewer Checking 1,046.74$ # C4 - Community Development Block Grant 5,299.78 ### Total Special Revenue 2,968,619.01$ ##
PNB Water-Sewer Sweep Acct (per stmt) 3,836,944.16$ # # ##Deposits in-transit - # ##O/S check sweep pending (59,367.16) D1 - Debt Service Fund 116,005.75$ Bank error correction in-transit - # D2 - Street Bond 30,067.19 ##
Total PNB Water-Sewer Sweep 3,777,577.00$ # Total Debt Service 146,072.94$ ### ##
Combined PNB Water-Sewer Account 3,778,623.74$ # C2 - State Issue II Capital Improvements -$ ### C3 - Courter Bridge Improvement 59.08 ##
PNB Fire Escrow Account 24,000.00$ C5 - Municipal Building Purchase 6,870.84 Outstanding checks - C6 - Capital Improvements 1,867,633.16 Deposits in-transit - B36 - SR 310 TIF 630,587.28
- Total Capital Projects 2,505,150.36$ Total PBB Council Checking Account 24,000.00$
Total Governmental Funds 7,242,873.53$ Petty Cash Funds -$ # ##
1 # E1 - Water Fund 459,617.01$ ##Investments (at cost) # E2 - Sewer Fund 1,265,917.34 ##
PNB CD 6881 4,408.77$ # E5 - Water Capital Improvements 705,941.78 ##0 # E6 - Sewer Capital Improvements 777,936.84 ##
- # E9 - Oaks Assessment - Total Investments 4,408.77$ E12 - Water Debt Service 288,032.92
# E13 - Sewer Debt Service 281,177.47 ##Total Statement Cash Balance 11,045,497.27$ E14 - Water Treatment Plant #2 0.38
0 E15 - WWTP Phase II - (Not included in total bank balances) 0 # Total Enterprise Funds 3,778,623.74$ ##
0 # ##PNB Mayors Court Account 21,244.78$ 0 # F1 - Fire Escrow Fund 24,000.00$ ##
Deposits in transit - 0 # Total Escrow Funds 24,000.00$ ##Outstanding checks/ACH (20,994.78) 0 #Bank error/corrections - 0 # Total All Funds 11,045,497.27$ ##
Total Mayors Court 250.00$ 0 # ##0 # ##0 # ##
Statement Balance vs System Cash -$ 0 # ##0
2012 Cash Position Reconciliation - Sep-12 Recon 10/9/2012 - 8:18 AM- 6 -

CITY OF PATASKALA, OHIOYEAR TO-DATE FUND BALANCE DETAILAS OF SEPTEMBER 30, 2012
+ - = - =
Fund Number / DescriptionDecember 31,
2011 Total Cash Balance
Year To-Date Revenues
Year To-Date Expenditures
Current Fund Cash Balance
Outstanding Encumbrances
September 30, 2012
Unencumbered Fund Balance
A1 - General Fund 1,083,726.21$ 1,608,563.79$ 1,269,936.04$ 1,422,353.96$ 158,071.02$ 1,264,282.94$ B70 - Construction Account/Project 200,185.56 1,685.36 1,193.66 200,677.26 - 200,677.26
Total General Funds 1,283,911.77$ 1,610,249.15$ 1,271,129.70$ 1,623,031.22$ 158,071.02$ 1,464,960.20$
B1 - Street Fund 723,432.31$ 932,199.67$ 899,175.75$ 756,456.23$ 102,167.29$ 654,288.94$ B2 - State Highway 48,093.17 38,908.91 41,808.54 45,193.54 2,707.44 42,486.10 B3 - Ecological Preservation - 1,000.00 - 1,000.00 - 1,000.00 B5 - JEDD Income Tax 237.21 - - 237.21 - 237.21 B8 - Permissive License Tax 482,481.27 333,288.58 179,178.36 636,591.49 315,137.44 321,454.05 B9 - Street Levy - - - - - - B10 - Recreation Fund 9,377.33 28,213.27 19,993.00 17,597.60 4,707.26 12,890.34 B11 - Park Use 66,247.55 12,126.61 39,830.64 38,543.52 13.86 38,529.66 B13 - Police Levy 2,087,235.54 762,554.51 1,439,055.38 1,410,734.67 56,807.14 1,353,927.53 B14 - Immobilization 490.00 - - 490.00 - 490.00 B17 - Mayor's Court Computer 25,262.09 11,493.00 1,593.91 35,161.18 - 35,161.18 B18 - Alcohol Enforcement & Education 5,521.10 - - 5,521.10 - 5,521.10 B19 - Law Enforcement Trust 777.77 1,351.19 - 2,128.96 - 2,128.96 B20 - Pataskala Mobile Home Park 4,408.77 - - 4,408.77 - 4,408.77 B32 - CHIP Fund 172.38 172,641.00 162,418.73 10,394.65 - 10,394.65 B33 - Safe Routes to School - 64,479.86 66,788.61 (2,308.75) - (2,308.75) B34 - ODNR Recreational Trail 175,458.52 44,885.20 220,343.72 - - - B50 - Police K-9 1,279.61 - 583.51 696.10 - 696.10 B60 - Sesquicentennial Fund 314.86 400.00 241.90 472.96 108.10 364.86 C4 - Community Development Block Grant 0.46 60,889.00 55,589.68 5,299.78 - 5,299.78
Total Special Revenue 3,630,789.94$ 2,464,430.80$ 3,126,601.73$ 2,968,619.01$ 481,648.53$ 2,486,970.48$
D1 - Debt Service Fund -$ 179,384.26$ 63,378.51$ 116,005.75$ -$ 116,005.75$ D2 - Street Bond 30,067.19 - - 30,067.19 - 30,067.19
Total Debt Service 30,067.19$ 179,384.26$ 63,378.51$ 146,072.94$ -$ 146,072.94$
C2 - State Issue II Capital Improvements -$ -$ -$ -$ -$ -$ C3 - Courter Bridge Improvement 59.08 - - 59.08 - 59.08 C5 - Municipal Building Purchase 6,870.84 - - 6,870.84 - 6,870.84 C6 - Capital Improvements - 2,326,559.77 458,926.61 1,867,633.16 1,739,966.56 127,666.60 B36 - SR 310 TIF 527,988.65 103,415.24 816.61 630,587.28 - 630,587.28
Total Capital Projects 534,918.57$ 2,429,975.01$ 459,743.22$ 2,505,150.36$ 1,739,966.56$ 765,183.80$ Total Governmental Funds 5,479,687.47$ 6,684,039.22$ 4,920,853.16$ 7,242,873.53$ 2,379,686.11$ 4,863,187.42$
E1 - Water Fund 349,520.30$ 1,012,465.47$ 902,368.76$ 459,617.01$ 102,754.15$ 356,862.86$ E2 - Sewer Fund 1,927,336.53 812,477.48 1,473,896.67 1,265,917.34 117,685.98 1,148,231.36 E5 - Water Capital Improvements 123,171.08 1,307,037.30 724,266.60 705,941.78 356,898.32 349,043.46 E6 - Sewer Capital Improvements 139,522.43 1,487,459.32 849,044.91 777,936.84 163,689.25 614,247.59 E9 - Oaks Assessment - 144,218.10 144,218.10 - - - E12 - Water Debt Service 174,438.50 259,788.18 146,193.76 288,032.92 - 288,032.92 E13 - Sewer Debt Service 41,535.22 553,296.65 313,654.40 281,177.47 222,827.52 58,349.95 E14 - Water Treatment Plant #2 0.38 - - 0.38 - 0.38 E15 - WWTP Phase II - 628,686.57 628,686.57 - - -
Total Enterprise Funds 2,755,524.44$ 6,205,429.07$ 5,182,329.77$ 3,778,623.74$ 963,855.22$ 2,814,768.52$
F1 - Fire Escrow Fund -$ 24,000.00$ -$ 24,000.00$ -$ 24,000.00$ Total Agency/Fiduciary Funds -$ 24,000.00$ -$ 24,000.00$ -$ 24,000.00$
Total All Funds 8,235,211.91$ 12,913,468.29$ 10,103,182.93$ 11,045,497.27$ 3,343,541.33$ 7,701,955.94$
2012 Cash Position Reconciliation - Sep-12 Fund Bal 10/9/2012 - 8:18 AM- 7 -

CIT
Y O
F P
ATA
SKA
LA, O
HIO
FULL
-YEA
R F
UN
D A
CTI
VIT
Y A
ND
BA
LAN
CE
PR
OJE
CTI
ON
SA
S O
F SE
PTE
MB
ER 3
0, 2
012
+-
=-
=+
=
Fund
Num
ber
/ D
escr
ipti
onD
ecem
ber
31,
2011
Tot
al C
ash
Bal
ance
FY 2
012
Esti
mat
ed
Rev
enue
sFY
201
2 B
udge
t Ex
pend
itur
es
Pro
ject
ed F
und
Bal
ance
s pe
r P
erm
Bud
get
FY 2
012
Supp
lem
enta
l A
ppro
pria
tion
s
Tota
l Exp
ense
B
udge
t as
of
Sept
embe
r 30
, 20
12
FY 2
012
Est
Rev
enue
A
djus
tmen
ts
EOY
Pro
ject
ed
Fund
Bal
ance
s as
of
Sep
tem
ber
30,
2012
Con
ting
ency
B
alan
ce
Incl
uded
in T
otal
B
udge
t
Con
t B
al
as %
of
Bud
get*
A1 -
Gen
eral
Fun
d1,
083,
726.
21$
1,
553,
000.
00$
2,73
4,51
3.00
$
(9
7,78
6.79
)$
233,
460.
00$
2,96
7,97
3.00
$
331,
247.
00$
0.21
$
66
6,58
2.00
$
28.9
6%B7
0 -
Cons
truc
tion
Acco
unt/
Proj
ect
200,
185.
56
10
,000
.00
19
4,67
1.00
15,5
14.5
6
15,5
15.0
0
21
0,18
6.00
1.
00
0.
56
-
0.00
%To
tal G
ener
al F
unds
1,28
3,91
1.77
$
1,56
3,00
0.00
$
2,
929,
184.
00$
(82,
272.
23)
$
24
8,97
5.00
$
3,
178,
159.
00$
33
1,24
8.00
$
0.
77$
666,
582.
00$
26
.54%
B1 -
Str
eet
Fund
723,
432.
31$
94
6,82
8.00
$
1,68
1,56
3.00
$
(1
1,30
2.69
)$
(11,
303.
00)
$
1,67
0,26
0.00
$
-$
0.31
$
17
8,32
4.00
$
11.9
5%B2
- S
tate
Hig
hway
48,0
93.1
7
48,2
50.0
0
94,6
98.0
0
1,64
5.17
1,64
5.00
96
,343
.00
-
0.17
-
0.
00%
B3 -
Eco
logi
cal P
rese
rvat
ion
-
-
-
-
-
-
-
-
-
0.
00%
B5 -
JED
D I
ncom
e Ta
x23
7.21
25
0.00
48
7.00
0.
21
-
487.
00
-
0.
21
-
0.00
%B8
- P
erm
issi
ve L
icen
se T
ax48
2,48
1.27
720,
000.
00
1,
217,
887.
00
(15,
405.
73)
(1
5,40
6.00
)
1,
202,
481.
00
-
0.
27
-
0.00
%B9
- S
tree
t Le
vy-
1,71
5.00
1,71
5.00
-
-
1,71
5.00
-
-
-
0.00
%B1
0 -
Recr
eatio
n Fu
nd9,
377.
33
40
,000
.00
48
,365
.00
1,
012.
33
1,
012.
00
49,3
77.0
0
-
0.
33
-
0.00
%B1
1 -
Park
Use
66,2
47.5
5
25,0
00.0
0
67,6
70.0
0
23,5
77.5
5
23,5
77.0
0
91
,247
.00
-
0.55
-
0.
00%
B13
- Po
lice
Lev y
2,08
7,23
5.54
63
8,62
0.00
2,47
9,84
3.00
24
6,01
2.54
24
6,01
3.00
2,
725,
856.
00
1.
00
0.
54
449,
793.
00
19
.76%
B14
- Im
mob
iliza
tion
490.
00
600.
00
2,10
5.00
(1,0
15.0
0)
(1
,015
.00)
1,09
0.00
-
-
-
0.00
%B1
7 -
May
or's
Cou
rt C
ompu
ter
25,2
62.0
9
13,0
00.0
0
36,4
23.0
0
1,83
9.09
1,83
9.00
38
,262
.00
-
0.09
-
0.
00%
B18
- Al
coho
l Enf
orce
men
t &
Edu
catio
n5,
521.
10
50
0.00
5,
121.
00
90
0.10
90
0.00
6,
021.
00
-
0.
10
-
0.00
%B1
9 -
Law
Enf
orce
men
t Tr
ust
777.
77
300.
00
822.
00
255.
77
256.
00
1,07
8.00
1.00
0.77
-
0.
00%
B20
- Pa
task
ala
Mob
ile H
ome
Park
4,40
8.77
40.0
0
4,
467.
00
(1
8.23
)
(18.
00)
4,
449.
00
1.
00
0.
77
-
0.00
%B3
2 -
CHIP
Fun
d17
2.38
41
0,00
0.00
410,
000.
00
17
2.38
-
41
0,00
0.00
(1
72.0
0)
0.
38
-
0.00
%B3
3 -
Safe
Rou
tes
to S
choo
l-
772,
226.
00
77
2,22
6.00
-
-
772,
226.
00
-
-
-
0.00
%B3
4 -
OD
NR
Recr
eatio
nal T
rail
175,
458.
52
23
9,82
9.00
239,
829.
00
17
5,45
8.52
(1
9,48
5.28
)
22
0,34
3.72
(1
75,4
59.0
0)
19,4
84.8
0
-
0.00
%B5
0 -
Polic
e K-
91,
279.
61
-
1,00
5.00
274.
61
275.
00
1,28
0.00
1.00
0.61
-
0.
00%
B60
- Se
squi
cent
enni
al F
und
314.
86
400.
00
710.
00
4.86
5.
00
715.
00
1.
00
0.
86
-
0.00
%C4
- C
omm
unity
Dev
elop
men
t Bl
ock
Gra
nt0.
46
76,0
00.0
0
76,0
00.0
0
0.46
30
,000
.00
106,
000.
00
30,0
00.0
0
0.
46
-
0.00
%To
tal S
peci
al R
even
ue3,
630,
789.
94$
3,
933,
558.
00$
7,14
0,93
6.00
$
42
3,41
1.94
$
25
8,29
4.72
$
7,
399,
230.
72$
(1
45,6
26.0
0)$
19,4
91.2
2$
62
8,11
7.00
$
9.28
%
D1
- D
ebt
Serv
ice
Fund
-$
158,
280.
00$
15
8,28
0.00
$
-$
-$
158,
280.
00$
40,0
00.0
0$
40
,000
.00
$
-$
0.00
%D
2 -
Stre
et B
ond
30,0
67.1
9
-
30
,067
.00
0.
19
-
30,0
67.0
0
-
0.
19
-
0.00
%To
tal D
ebt
Serv
ice
30,0
67.1
9$
15
8,28
0.00
$
188,
347.
00$
0.
19$
-$
18
8,34
7.00
$
40
,000
.00
$
40,0
00.1
9$
-
$
0.
00%
C2 -
Sta
te I
ssue
II
Capi
tal I
mpr
ovem
ents
-$
899,
998.
00$
89
9,99
8.00
$
-$
-$
899,
998.
00$
-$
-$
-$
0.00
%C3
- C
ourt
er B
ridge
Im
prov
emen
t59
.08
-
59
.00
0.08
-
59
.00
-
0.08
-
0.
00%
C5 -
Mun
icip
al B
uild
ing
Purc
hase
6,87
0.84
-
6,
871.
00
(0
.16)
-
6,87
1.00
1.00
0.84
-
0.
00%
C6 -
Cap
ital I
mpr
ovem
ents
-
2,
950,
900.
00
3,76
5,90
1.00
(8
15,0
01.0
0)
(1
,557
,605
.00)
2,
208,
296.
00
(7
42,6
04.0
0)
-
-
0.00
%B3
6 -
SR 3
10 T
IF52
7,98
8.65
104,
000.
00
63
1,98
9.00
(0.3
5)
-
63
1,98
9.00
1.
00
0.
65
-
0.00
%To
tal C
apit
al P
roje
cts
534,
918.
57$
3,
954,
898.
00$
5,30
4,81
8.00
$
(8
15,0
01.4
3)$
(1,5
57,6
05.0
0)$
3,
747,
213.
00$
(7
42,6
02.0
0)$
1.57
$
-
$
0.
00%
Tota
l Gov
ernm
enta
l Fun
ds5,
479,
687.
47$
9,
609,
736.
00$
15,5
63,2
85.0
0$
(4
73,8
61.5
3)$
(1,0
50,3
35.2
8)$
14
,512
,949
.72
$ (5
16,9
80.0
0)$
59,4
93.7
5$
1,
294,
699.
00$
9.79
%
E1 -
Wat
er F
und
349,
520.
30$
1,
100,
172.
00$
1,28
4,62
9.00
$
16
5,06
3.30
$
16
5,06
3.00
$
1,
449,
692.
00$
-
$
0.
30$
58,1
97.0
0$
4.18
%E2
- S
ewer
Fun
d1,
927,
336.
53
850,
767.
00
2,
494,
072.
00
284,
031.
53
284,
032.
00
2,77
8,10
4.00
1.00
0.53
75
7,03
2.00
37.4
6%E5
- W
ater
Cap
ital I
mpr
ovem
ents
123,
171.
08
1,
185,
800.
00
1,18
5,80
0.00
12
3,17
1.08
26
8,69
8.00
1,
454,
498.
00
13
3,20
0.00
(1
2,32
6.92
)
-
0.00
%E6
- S
ewer
Ca p
ital I
mpr
ovem
ents
139,
522.
43
1,
505,
000.
00
1,50
5,00
0.00
13
9,52
2.43
26
3,19
3.00
1,
768,
193.
00
11
6,00
1.00
(7
,669
.57)
-
0.00
%E9
- O
aks
Asse
ssm
ent
-
-
-
-
144,
219.
00
144,
219.
00
144,
219.
00
-
-
0.00
%E1
2 -
Wat
er D
ebt
Serv
ice
174,
438.
50
24
8,16
1.00
417,
388.
00
5,
211.
50
2,
811.
00
420,
199.
00
12,3
27.0
0
14
,727
.50
-
0.
00%
E13
- Se
wer
Deb
t Se
rvic
e41
,535
.22
31
0,80
0.00
308,
200.
00
44
,135
.22
27
9,13
5.00
58
7,33
5.00
24
2,67
0.00
7,
670.
22
-
0.
00%
E14
- W
ater
Tre
atm
ent
Plan
t #
20.
38
-
-
0.
38
-
-
-
0.
38
-
0.00
%E1
5 -
WW
TP P
hase
II
-
1,
750,
000.
00
1,75
0,00
0.00
-
-
1,
750,
000.
00
-
-
-
0.
00%
Tota
l Ent
erpr
ise
Fund
s2,
755,
524.
44$
6,
950,
700.
00$
8,94
5,08
9.00
$
76
1,13
5.44
$
1,
407,
151.
00$
10
,352
,240
.00
$ 64
8,41
8.00
$
2,
402.
44$
81
5,22
9.00
$
8.55
%To
tal A
ll Fu
nds
8,23
5,21
1.91
$
16,5
60,4
36.0
0$
24
,508
,374
.00
$
287,
273.
91$
356,
815.
72$
24,8
65,1
89.7
2$
131,
438.
00$
61,8
96.1
9$
2,
109,
928.
00$
9.27
%
*Not
e: C
alcu
latio
n ex
clud
es t
he c
ontin
genc
y am
ount
fro
m t
he t
otal
bud
get
amou
nt.
2012
Cas
h P
ositi
on R
econ
cilia
tion
- S
ep-1
2 B
udge
t Fun
d B
al10
/9/2
012
- 8:
18 A
M
- 8 -

General Fund (A1) Revenue – On a year to‐date basis, the general fund has been credited with total revenue of approximately $1.61 million which reflects 85.37% of budget. Excluding the impact of interfund advance repayments in the calculation, the total collected amount becomes 83.47% of budget. While it might appear that general fund revenue collections are running higher than budget when compared to a straight‐line basis of 75% of budget, the timing of when the city receives its semi‐annual property tax settlements has a tendency to skew the total. Eliminating the impact that the property tax receipt has in the calculation, the total is actually running at 71.54% of budget, or approximately 3.5% below budget.
The largest revenue source for the general fund is property taxes which account for 49.79% of the 2012 fund revenue budget. To‐date, the general fund has received $800,884 in property taxes, or 84.75% of budget. This total is below 2011 receipts (down $12,988 from September 2011). In October, we will be reducing the forecast to reflect the more accurate collection rate. Intergovernmental revenues represent the second largest revenue category for the general fund. For 2012, it is projected to account for approximately $244.2 thousand (12.96% of budget), and consists of the following revenue items: local government distributions, property tax rollback/homestead exemption reimbursement from the state; electric utility income tax reimbursement; and cigarette/liquor taxes and fees. Through September 30, the fund has received $148,152 in this category, or 60.68% of budget. The total is down by $131.9 thousand, or 47.11%, from the same period in 2011. The decrease is primarily due to the receipt of $61.7 thousand in homestead/rollback revenues in August 2011 not yet received in 2012, as well as reduced other local government distributions from the state, including estate taxes. Fines, licenses and permits revenue is the other major general fund revenue source. The 2012 budget in this category is $210.0 thousand (11.15% of budget), and consists of fines, forfeitures, building licenses/permits, and other miscellaneous permits. The city has received $201,879 in this category to‐date (96.13% of budget), and is down $12.0 thousand (5.6%) from 2011. The variance is due to reduced
Property Tax$800,884 49.79%
Inter‐governmental$148,152 9.21%
Service Charges$136,708 8.50%
Fines & Permits$201,879 12.55%
Misc Other$104,305 6.48%
Transfers & Advances$216,636 13.47%
YTD General Fund Revenue by Source
Property Tax$944,941 50.15%
Inter‐governmental$244,170 12.96%
Service Charges$159,500 8.46%
Fines & Permits$210,000 11.15%
Misc Other$109,000 5.78%
Transfers & Advances$216,636 11.50%
General Fund Revenue ‐ Budget
- 9 -

collection of fines and forfeitures. In October, we will be increasing the forecast to reflect the better than expected rate of collection.
Expenditures – The general fund has a total appropriated expenditure budget of nearly $2.97 million, inclusive of $666.6 thousand in contingency funds. Total spending through September 30 is $1.27 million and is equal to 42.79% of the 2012 budget. Excluding contingency and interfund advances and transfers in the calculation results in total spending equal to 54.9% of budget versus a straight‐line basis of 75%.
Salaries, wages and other employee‐related costs represent the largest expense category with a 2012 budget of $824.2 thousand, or 27.77% of the general fund budget. Spending through September 30 is $568.5 thousand or 68.98% of budget. The slightly favorable YTD variance ($49.6 thousand below budget) is due to the delayed hiring of several open positions. Contractual services is another major expense category in the general fund. The 2012 budget in this category is $440.7 thousand (14.85% of budget) and provides for non‐employee personal services. Spending through September 30 is $282.8 thousand or 64.19% of budget and is in line with expectations after 9 months. Including encumbrances (i.e. purchase orders) in the total, 79.65% has been either spent or committed to be spent. It is important to note that much of the spending in this category does not tend to follow a linear path; rather it is typically disbursed in large ‘chunks’ to the vendors when the services are provided. Supplies and general operating expenditures is the other significant expense category in the general fund. It combines a number of other basic types of expenditures including supplies, equipment, utilities and other miscellaneous expenses. It has a 2012 budget of $313.9 thousand, or 10.57% of budget. Spending to‐date is $116.9 thousand or 37.25% of budget. Including encumbrances in the calculation, the total spent (or committed to spend) is $133.5 thousand (42.53% of budget). A lack of required spending on needed repairs and improvements to lands and buildings resulting in spending to be below budget is the primary cause of the positive variance.
Salary & Related$824,191 27.77%
Contractual Services$440,650 14.85% Supplies &
Gen'l Operating$313,850 10.57%
Capital Outlay$486,300 16.38%
Debt Service$200,000 6.74%
Contingency$666,582 22.46%
Transfers & Advances$36,400 1.23%
General Fund Budget by Category
Salary & Related$568,521 44.77%
Contractual Services$282,842 22.27%
Supplies & Gen'l Operating
$116,917 9.21%
Capital Outlay$175,256 13.80%
Debt Service$100,000 7.87% Transfers &
Advances$26,400 2.08%
YTD General Fund Spending
- 10 -

CITY OF PATASKALA, OHIOSEPTEMBER 2012 YTD ANALYSIS - General Fund (A1)
REVENUE
Taxes Property Taxes 800,884$ 944,941$ 144,057$ 84.75% 814,710$ 999,991$ 185,281$ 81.47% (13,826)$ -1.70%
Income Taxes - - - 0.00% - - - 0.00% - 0.00%
800,884$ 944,941$ 144,057$ 84.75% 814,710$ 999,991$ 185,281$ 81.47% (13,826)$ -1.70%
Intergovernmental State Shared Taxes & Permits 141,783$ 241,170$ 99,387$ 58.79% 275,742$ 226,235$ (49,507)$ 121.88% (133,958)$ -48.58%
Grants & Loans 2,000 - (2,000) 100.00% 1,390 - (1,390) 100.00% 611 43.94%
Special Assessments 4,369 3,000 (1,369) 145.64% 2,967 - (2,967) 100.00% 1,403 47.28%
148,152$ 244,170$ 96,018$ 60.68% 280,098$ 226,235$ (53,863)$ 123.81% (131,945)$ -47.11%
Charges for Service Water & Sewer Fees -$ -$ -$ 0.00% -$ -$ -$ 0.00% -$ 0.00%
Other Fees & Charges 136,708 159,500 22,792 85.71% 115,312 155,000 39,688 74.40% 21,395 18.55%
136,708$ 159,500$ 22,792$ 85.71% 115,312$ 155,000$ 39,688$ 74.40% 21,395$ 18.55%
Fines, Licenses & Permits Fines & Forfeitures 151,610$ 150,000$ (1,610)$ 101.07% 166,743$ 105,000$ (61,743)$ 158.80% (15,134)$ -9.08%
Building, Licenses & Permits 49,504 60,000 10,496 82.51% 46,318 59,000 12,682 78.50% 3,186 6.88%
Other Permits 765 - (765) 100.00% 790 1,000 210 79.00% (25) -3.16%
201,879$ 210,000$ 8,121$ 96.13% 213,851$ 165,000$ (48,851)$ 129.61% (11,972)$ -5.60%
Other Sources Investment Income 4,866$ 4,000$ (866)$ 121.64% 4,721$ 3,100$ (1,621)$ 152.30% 145$ 3.06%
Rental Income 84,885 100,000 15,115 84.88% 77,530 87,192 9,662 88.92% 7,355 9.49%
Bond/Note Issuance - - - 0.00% - - - 0.00% - 0.00%
Sale of Assets - - - 0.00% - - - 0.00% - 0.00%
Other Income 14,554 5,000 (9,554) 291.08% 5,819 5,000 (819) 116.37% 8,735 150.12%
104,305$ 109,000$ 4,695$ 95.69% 88,069$ 95,292$ 7,223$ 92.42% 16,235$ 18.43%
Transfers Transfers & Advances In 216,636$ 216,636$ -$ 100.00% -$ -$ -$ 0.00% 216,636$ 100.00%
216,636$ 216,636$ -$ 100.00% -$ -$ -$ 0.00% 216,636$ 100.00%
1,608,564$ 1,884,247$ 275,683$ 85.37% 1,512,041$ 1,641,518$ 129,477$ 92.11% 96,523$ 6.38%
Adjustments:- Elim impact of Interfund transfers/advances (216,636)$ (216,636)$ -$ 0.00% -$ -$ -$ 0.00% (216,636)$ 100.00%
- - - 0.00% - - - 0.00% - 0.00%
(216,636)$ (216,636)$ -$ 0.00% -$ -$ -$ 0.00% (216,636)$ 100.00%
1,391,928$ 1,667,611$ 275,683$ 83.47% 1,512,041$ 1,641,518$ 129,477$ 92.11% (120,113)$ -7.94%
EXPENDITURE & ENCUMBRANCES
Salary & Related Salaries & Wages 422,132$ 616,812$ 194,680$ 31.56% -$ 194,680$ 31.56% 426,048$ (3,916)$ -2.01%Benefits 146,389 207,379 60,990 29.41% - 60,990 29.41% 147,905 (1,516) -2.49%
568,521$ 824,191$ 255,670$ 31.02% -$ 255,670$ 31.02% 573,953$ (5,433)$ -2.12%
Contractual Services 282,842$ 440,650$ 157,808$ 35.81% 68,118$ 89,690$ 20.35% 264,969$ 17,874$ 19.93%Supplies & General Operating 116,917 313,850 196,933 62.75% 16,573 180,361 57.47% 104,761 12,156 6.74%Capital Outlay 175,256 486,300 311,044 63.96% 73,380 237,663 48.87% 93,202 82,054 34.53%Debt Service 100,000 200,000 100,000 50.00% - 100,000 50.00% 70,000 30,000 30.00%Contingency Funds - 666,582 666,582 -100.00% - 666,582 100.00% - - 0.00%Transfers & Advances 26,400 36,400 10,000 27.47% - 10,000 27.47% 39,727 (13,327) -133.27%
1,269,936$ 2,967,973$ 1,698,037$ 57.21% 158,071$ 1,539,966$ 51.89% 1,146,612$ 123,325$ 8.01%
Adjustments:- Interfund transfers & advances (26,400)$ (36,400)$ (62,800)$ 172.53% -$ 10,000$ 27.47% (39,727)$ 13,327$ 133.27%- Contingency funds - (666,582) (666,582) -100.00% - 666,582 100.00% - - 0.00%
(26,400)$ (702,982)$ (676,582)$ 96.24% -$ 676,582$ 96.24% (39,727)$ 13,327$ 1.97%
1,243,536$ 2,264,991$ 1,021,455$ 45.10% 158,071$ 863,384$ 38.12% 1,106,885$ 136,652$ 15.83%
YTD 2011
YTD 2012 H/(L) YTD
2011% H/(L)YTD 2011
2011 BudgetYTD
Uncollected Balance
% Available
% H/(L)%
Collected
YTD 2012 H/(L) YTD
2011
Total Adjustments
Adjusted Grand Total Expenditures
Unenc & Avail Balance
Total Encumbered
YTD 2012 2012 BudgetYTD Unspent
Balance% Unspent
Total Salary & Related
Grand Total Expenditures
Total Adjustments to Revenue
Adjusted Grand Total Revenue
% Collected
Total Taxes
Total Intergovernmental
Total Charges for Service
Total Fines, Licenses & Permits
Total Other Sources
YTD 2012 2012 BudgetYTD
Uncollected Balance
Total Transfers
Grand Total Revenue
Sep-12 Financial Reporting Worksheet - General Fund (A1) 10/9/2012 - 7:51 AM- 11 -

CITY OF PATASKALA, OHIO2012 REVENUE BUDGET ANALYSIS - General Fund (A1)THROUGH SEPTEMBER 30, 2012
Row LabelsCurrent Month
Year To-Date BudgetUncollected
BalancePermanent
BudgetRevenue
AdjustmentsA 1 - General Fund 50,737.12$ 1,608,563.79$ 1,884,247.00$ 275,683.21$ 1,553,000.00$ 331,247.00$
1 - Taxes -$ 800,884.02$ 944,941.00$ 144,056.98$ 815,000.00$ 129,941.00$ 1 - Property Taxes -$ 800,884.02$ 944,941.00$ 144,056.98$ 815,000.00$ 129,941.00$
1 - Real Property Taxes -$ 795,712.80$ 939,941.00$ 144,228.20$ 810,000.00$ 129,941.00$ 2 - Other Property Taxes -$ 5,171.22$ 5,000.00$ (171.22)$ 5,000.00$ -$ 3 - Personal Property Tax -$ -$ -$ -$ -$ -$
2 - Intergovernmental 3,127.94$ 148,152.35$ 244,170.00$ 96,017.65$ 259,500.00$ (15,330.00)$ 1 - State-Shared Taxes & Permits 3,127.94$ 141,783.11$ 241,170.00$ 99,386.89$ 256,500.00$ (15,330.00)$
1 - Local Government Fund 3,127.94$ 48,322.66$ 79,000.00$ 30,677.34$ 79,000.00$ -$ 2 - Rollback/Homestead -$ 55,146.70$ 115,000.00$ 59,853.30$ 115,000.00$ -$ 3 - Electric Utility Income Tax -$ -$ 2,000.00$ 2,000.00$ 2,000.00$ -$ 4 - Cigarette Tax -$ 344.59$ 500.00$ 155.41$ 500.00$ -$ 5 - Liquor Permits -$ 9,631.30$ 10,000.00$ 368.70$ 10,000.00$ -$ 6 - Estate Tax -$ 28,337.86$ 34,670.00$ 6,332.14$ 50,000.00$ (15,330.00)$
2 - Grants & Loans -$ 2,000.00$ -$ (2,000.00)$ -$ -$ 1 - Grants & Loans -$ 2,000.00$ -$ (2,000.00)$ -$ -$
3 - Special Assessments -$ 4,369.24$ 3,000.00$ (1,369.24)$ 3,000.00$ -$ 1 - Special Assessments -$ 4,369.24$ 3,000.00$ (1,369.24)$ 3,000.00$ -$
3 -Charges for Service 22,028.01$ 136,707.85$ 159,500.00$ 22,792.15$ 159,500.00$ -$ 1 - Water & Sewer -$ -$ -$ -$ -$ -$
5 - Delinquent Water/Sewer Fees -$ -$ -$ -$ -$ -$
2 - Other Fees & Charges 22,028.01$ 136,707.85$ 159,500.00$ 22,792.15$ 159,500.00$ -$ 1 - Franchise Fees -$ 114,679.84$ 137,500.00$ 22,820.16$ 137,500.00$ -$ 2 - Tower Lease 22,028.01$ 22,028.01$ 22,000.00$ (28.01)$ 22,000.00$ -$
4 - Fines, Licenses & Permits 17,542.55$ 201,878.96$ 210,000.00$ 8,121.04$ 210,000.00$ -$ 1 - Fines & Forfeitures 12,793.80$ 151,609.75$ 150,000.00$ (1,609.75)$ 150,000.00$ -$
1 - Fines & Forfeitures 12,793.80$ 151,609.75$ 150,000.00$ (1,609.75)$ 150,000.00$ -$
2 - Licenses & Permits 4,748.75$ 50,269.21$ 60,000.00$ 9,730.79$ 60,000.00$ -$ 1 - Building Licenses & Permits 4,638.75$ 49,504.21$ 60,000.00$ 10,495.79$ 60,000.00$ -$ 2 - Miscellaneous Permits 110.00$ 765.00$ -$ (765.00)$ -$ -$
5 - Miscellaneous Revenue 8,038.62$ 104,304.61$ 109,000.00$ 4,695.39$ 109,000.00$ -$ 1 - Investment Income 768.34$ 4,865.79$ 4,000.00$ (865.79)$ 4,000.00$ -$
1 - Investment Income 768.34$ 4,865.79$ 4,000.00$ (865.79)$ 4,000.00$ -$
2 - Other Misc Revenue 7,270.28$ 99,438.82$ 105,000.00$ 5,561.18$ 105,000.00$ -$ 1 - Rental Income 7,079.07$ 84,884.82$ 100,000.00$ 15,115.18$ 100,000.00$ -$ 4 - Miscellaneous Income 191.21$ 14,554.00$ 5,000.00$ (9,554.00)$ 5,000.00$ -$
6 - Transfers & Advances -$ 216,636.00$ 216,636.00$ -$ -$ 216,636.00$ 1 - Interfund Advances -$ 216,636.00$ 216,636.00$ -$ -$ 216,636.00$
1 - Interfund Advances -$ 216,636.00$ 216,636.00$ -$ -$ 216,636.00$
Grand Total 50,737.12$ 1,608,563.79$ 1,884,247.00$ 275,683.21$ 1,553,000.00$ 331,247.00$
10/9/2012 - 7:51 AM Sep-12 Financial Reporting Worksheet - Rev Pivot- 12 -

CITY OF PATASKALA, OHIO2012 EXPENDITURE BUDGET ANALYSIS - General FundTHROUGH SEPTEMBER 30, 2012
Row Labels Current Month Year To-DateTotal
EncumbrancesTotal Budget
Unencumbered Bal
Permanent Budget
Supplemental Approp.
A 1 - General Fund 95,079.71$ 1,269,936.04$ 158,071.02$ 2,967,973.00$ 1,539,965.94$ 2,734,513.00$ 233,460.00$ 01 - Mayor 1,303.19$ 13,667.91$ -$ 19,106.00$ 5,438.09$ 19,106.00$ -$
1 - Wages 1,099.04$ 9,891.36$ -$ 13,189.00$ 3,297.64$ 13,189.00$ -$ 2 - Benefits 151.67$ 1,673.73$ -$ 2,117.00$ 443.27$ 2,117.00$ -$ 3 - Contractual Services -$ 637.50$ -$ 1,000.00$ 362.50$ 1,000.00$ -$ 4 - Supplies & General Operating 52.48$ 1,465.32$ -$ 2,800.00$ 1,334.68$ 2,800.00$ -$
02 - Finance Director 7,635.25$ 49,747.21$ -$ 80,423.00$ 30,675.79$ 43,023.00$ 37,400.00$ 1 - Wages 5,428.42$ 33,059.41$ -$ 55,774.00$ 22,714.59$ 32,074.00$ 23,700.00$ 2 - Benefits 1,373.65$ 10,551.18$ -$ 16,649.00$ 6,097.82$ 5,149.00$ 11,500.00$ 4 - Supplies & General Operating 833.18$ 6,136.62$ -$ 8,000.00$ 1,863.38$ 5,800.00$ 2,200.00$
03 - Finance Manager 6,155.19$ 70,182.69$ 1,618.31$ 97,477.00$ 25,676.00$ 97,477.00$ -$ 1 - Wages 4,051.14$ 38,386.90$ -$ 52,044.00$ 13,657.10$ 52,044.00$ -$ 2 - Benefits 1,085.69$ 12,228.55$ -$ 17,083.00$ 4,854.45$ 17,083.00$ -$ 3 - Contractual Services 533.56$ 16,852.42$ 1,618.31$ 24,350.00$ 5,879.27$ 24,350.00$ -$ 4 - Supplies & General Operating 484.80$ 2,714.82$ -$ 4,000.00$ 1,285.18$ 4,000.00$ -$
04 - Finance Assistant -$ -$ -$ 20,661.00$ 20,661.00$ 20,661.00$ -$ 1 - Wages -$ -$ -$ 15,218.00$ 15,218.00$ 15,218.00$ -$ 2 - Benefits -$ -$ -$ 2,443.00$ 2,443.00$ 2,443.00$ -$ 4 - Supplies & General Operating -$ -$ -$ 3,000.00$ 3,000.00$ 3,000.00$ -$
05 - Legal 14,163.10$ 144,608.01$ 10,105.85$ 194,540.00$ 39,826.14$ 194,540.00$ -$ 1 - Wages 9,740.27$ 92,375.55$ -$ 121,740.00$ 29,364.45$ 121,740.00$ -$ 2 - Benefits 1,347.23$ 19,398.16$ -$ 23,000.00$ 3,601.84$ 23,000.00$ -$ 3 - Contractual Services 3,000.00$ 27,000.00$ 9,000.00$ 39,000.00$ 3,000.00$ 39,000.00$ -$ 4 - Supplies & General Operating 75.60$ 5,834.30$ 1,105.85$ 10,800.00$ 3,859.85$ 10,800.00$ -$
06 - Magistrate/Mayor's Court -$ 15,543.75$ 6,956.25$ 22,500.00$ -$ 17,000.00$ 5,500.00$ 3 - Contractual Services -$ 15,543.75$ 6,956.25$ 22,500.00$ -$ 17,000.00$ 5,500.00$
07 - Administrator 3,927.34$ 63,870.56$ 17,682.91$ 120,683.00$ 39,129.53$ 120,683.00$ -$ 1 - Wages 2,015.25$ 19,111.71$ -$ 25,891.00$ 6,779.29$ 25,891.00$ -$ 2 - Benefits 632.33$ 8,144.56$ -$ 9,992.00$ 1,847.44$ 9,992.00$ -$ 3 - Contractual Services 240.00$ 23,148.57$ 16,437.50$ 60,000.00$ 20,413.93$ 60,000.00$ -$ 4 - Supplies & General Operating 1,039.76$ 13,465.72$ 1,245.41$ 24,800.00$ 10,088.87$ 24,800.00$ -$ 5 - Capital Outlay -$ -$ -$ -$ -$ -$ -$
08 - Service Director 3,987.18$ 40,007.08$ -$ 56,579.00$ 16,571.92$ 56,579.00$ -$ 1 - Wages 2,754.87$ 25,913.07$ -$ 34,922.00$ 9,008.93$ 34,922.00$ -$ 2 - Benefits 895.04$ 10,097.19$ -$ 14,157.00$ 4,059.81$ 14,157.00$ -$ 4 - Supplies & General Operating 337.27$ 3,996.82$ -$ 7,500.00$ 3,503.18$ 7,500.00$ -$
09 - Licking County Auditor -$ 16,813.32$ -$ 25,000.00$ 8,186.68$ 25,000.00$ -$ 3 - Contractual Services -$ 16,813.32$ -$ 25,000.00$ 8,186.68$ 25,000.00$ -$
10 - State Auditor 852.64$ 2,787.18$ -$ 7,000.00$ 4,212.82$ 7,000.00$ -$ 3 - Contractual Services 852.64$ 2,787.18$ -$ 7,000.00$ 4,212.82$ 7,000.00$ -$
11 - Council 2,315.14$ 25,361.30$ 4,708.64$ 40,678.00$ 10,608.06$ 40,678.00$ -$ 1 - Wages 1,800.77$ 17,533.18$ -$ 21,609.00$ 4,075.82$ 21,609.00$ -$ 2 - Benefits 248.50$ 2,637.29$ -$ 3,469.00$ 831.71$ 3,469.00$ -$ 3 - Contractual Services 82.80$ 1,331.93$ 2,270.30$ 5,000.00$ 1,397.77$ 5,000.00$ -$ 4 - Supplies & General Operating 183.07$ 3,858.90$ 2,438.34$ 10,600.00$ 4,302.76$ 10,600.00$ -$
12 - Council Clerk 3,533.83$ 35,999.19$ 984.05$ 54,085.00$ 17,101.76$ 54,085.00$ -$ 1 - Wages 2,998.03$ 27,409.70$ -$ 38,865.00$ 11,455.30$ 38,865.00$ -$ 2 - Benefits 503.32$ 7,183.13$ -$ 9,420.00$ 2,236.87$ 9,420.00$ -$ 4 - Supplies & General Operating 32.48$ 1,406.36$ 984.05$ 5,800.00$ 3,409.59$ 5,800.00$ -$
13 - Street Lights 1,751.22$ 40,542.48$ 9,457.52$ 50,000.00$ -$ 50,000.00$ -$ 3 - Contractual Services 1,751.22$ 40,542.48$ 9,457.52$ 50,000.00$ -$ 50,000.00$ -$
14 - Court Clerk 4,200.53$ 46,421.31$ -$ 67,978.00$ 21,556.69$ 73,478.00$ (5,500.00)$ 1 - Wages 3,135.24$ 28,234.97$ -$ 40,283.00$ 12,048.03$ 40,283.00$ -$ 2 - Benefits 959.30$ 10,746.14$ -$ 15,195.00$ 4,448.86$ 15,195.00$ -$ 4 - Supplies & General Operating 105.99$ 7,440.20$ -$ 12,500.00$ 5,059.80$ 18,000.00$ (5,500.00)$
15 - Court Security 404.07$ 3,677.46$ -$ 4,238.00$ 560.54$ 4,238.00$ -$ 1 - Wages 355.07$ 3,178.97$ -$ 3,652.00$ 473.03$ 3,652.00$ -$ 2 - Benefits 49.00$ 498.49$ -$ 586.00$ 87.51$ 586.00$ -$
16 - LC Health Board -$ 61,500.00$ -$ 61,500.00$ -$ 61,500.00$ -$ 3 - Contractual Services -$ 61,500.00$ -$ 61,500.00$ -$ 61,500.00$ -$
Sep-12 Financial Reporting Worksheet - Exp Pivot 10/9/2012 - 7:51 AM
- 13 -

CITY OF PATASKALA, OHIO2012 EXPENDITURE BUDGET ANALYSIS - General FundTHROUGH SEPTEMBER 30, 2012
Row Labels Current Month Year To-DateTotal
EncumbrancesTotal Budget
Unencumbered Bal
Permanent Budget
Supplemental Approp.
17 - Lands & Buildings 12,823.08$ 348,925.22$ 100,105.32$ 895,800.00$ 446,769.46$ 884,500.00$ 11,300.00$ 1 - Wages -$ -$ -$ -$ -$ -$ -$ 2 - Benefits -$ -$ -$ -$ -$ -$ -$ 3 - Contractual Services 3,738.14$ 47,029.56$ 21,046.70$ 80,000.00$ 11,923.74$ 71,000.00$ 9,000.00$ 4 - Supplies & General Operating 3,928.49$ 26,639.42$ 5,678.25$ 129,500.00$ 97,182.33$ 134,500.00$ (5,000.00)$ 5 - Capital Outlay 5,156.45$ 175,256.24$ 73,380.37$ 486,300.00$ 237,663.39$ 479,000.00$ 7,300.00$ 6 - Debt Service -$ 100,000.00$ -$ 200,000.00$ 100,000.00$ 200,000.00$ -$
18 - Parks & Recreation -$ 26,323.09$ -$ 29,149.00$ 2,825.91$ 38,649.00$ (9,500.00)$ 1 - Wages -$ 122.50$ -$ 2,283.00$ 2,160.50$ 2,283.00$ -$ 2 - Benefits -$ 200.59$ -$ 366.00$ 165.41$ 366.00$ -$ 4 - Supplies & General Operating -$ -$ -$ 500.00$ 500.00$ -$ 500.00$ 7 - Transfers & Advances -$ 26,000.00$ -$ 26,000.00$ -$ 36,000.00$ (10,000.00)$
19 - Liability Insurance -$ 21,256.00$ -$ 34,700.00$ 13,444.00$ 35,000.00$ (300.00)$ 3 - Contractual Services -$ 21,256.00$ -$ 34,700.00$ 13,444.00$ 35,000.00$ (300.00)$
20 - Planning & Zoning 29,008.63$ 206,443.27$ 2,696.71$ 333,191.00$ 124,051.02$ 322,191.00$ 11,000.00$ 1 - Wages 18,230.36$ 122,759.33$ -$ 170,285.00$ 47,525.67$ 170,285.00$ -$ 2 - Benefits 7,486.40$ 59,923.11$ -$ 84,656.00$ 24,732.89$ 84,656.00$ -$ 3 - Contractual Services -$ 680.00$ -$ 19,000.00$ 18,320.00$ 5,000.00$ 14,000.00$ 4 - Supplies & General Operating 3,291.87$ 23,080.83$ 2,696.71$ 59,250.00$ 33,472.46$ 62,250.00$ (3,000.00)$ 5 - Capital Outlay -$ -$ -$ -$ -$ -$ -$
21 - Planning Commission -$ 1,194.29$ 1,228.82$ 6,446.00$ 4,022.89$ 4,946.00$ 1,500.00$ 1 - Wages -$ 350.00$ -$ 4,261.00$ 3,911.00$ 4,261.00$ -$ 2 - Benefits -$ 573.11$ -$ 685.00$ 111.89$ 685.00$ -$ 4 - Supplies & General Operating -$ 271.18$ 1,228.82$ 1,500.00$ -$ -$ 1,500.00$
22 - BZA 381.18$ 1,638.13$ 529.69$ 3,566.00$ 1,398.18$ 1,766.00$ 1,800.00$ 1 - Wages 160.04$ 406.49$ -$ 1,522.00$ 1,115.51$ 1,522.00$ -$ 2 - Benefits 3.04$ 261.33$ -$ 544.00$ 282.67$ 244.00$ 300.00$ 4 - Supplies & General Operating 218.10$ 970.31$ 529.69$ 1,500.00$ -$ -$ 1,500.00$
23 - Personnel BOR -$ 250.56$ -$ 1,972.00$ 1,721.44$ 1,472.00$ 500.00$ 1 - Wages -$ 95.00$ -$ 1,268.00$ 1,173.00$ 1,268.00$ -$ 2 - Benefits -$ 155.56$ -$ 204.00$ 48.44$ 204.00$ -$ 4 - Supplies & General Operating -$ -$ -$ 500.00$ 500.00$ -$ 500.00$
24 - General Office 1,280.44$ 22,948.75$ 1,996.95$ 37,900.00$ 12,954.30$ 37,900.00$ -$ 3 - Contractual Services 247.20$ 7,719.66$ 1,331.50$ 11,600.00$ 2,548.84$ 11,600.00$ -$ 4 - Supplies & General Operating 1,033.24$ 15,229.09$ 665.45$ 26,300.00$ 10,405.46$ 26,300.00$ -$
25 - Contingency Fund -$ -$ -$ 666,582.00$ 666,582.00$ 512,641.00$ 153,941.00$ 8 - Contingency -$ -$ -$ 666,582.00$ 666,582.00$ 512,641.00$ 153,941.00$
26 - Sesquicentennial Fund -$ 400.00$ -$ 400.00$ -$ 400.00$ -$ 7 - Transfers & Advances -$ 400.00$ -$ 400.00$ -$ 400.00$ -$
27 - Park Use Fund -$ -$ -$ 10,000.00$ 10,000.00$ 10,000.00$ -$ 7 - Transfers & Advances -$ -$ -$ 10,000.00$ 10,000.00$ 10,000.00$ -$
28 - Project Manager 1,357.70$ 9,827.28$ -$ 25,819.00$ 15,991.72$ -$ 25,819.00$ 1 - Wages 1,048.24$ 3,303.44$ -$ 14,006.00$ 10,702.56$ -$ 14,006.00$ 2 - Benefits 276.98$ 2,116.94$ -$ 6,813.00$ 4,696.06$ -$ 6,813.00$ 4 - Supplies & General Operating 32.48$ 4,406.90$ -$ 5,000.00$ 593.10$ -$ 5,000.00$
30 - Human Resources -$ -$ -$ -$ -$ -$ -$ 1 - Wages -$ -$ -$ -$ -$ -$ -$ 2 - Benefits -$ -$ -$ -$ -$ -$ -$ 4 - Supplies & General Operating -$ -$ -$ -$ -$ -$ -$
31 - Charter Review -$ -$ -$ -$ -$ -$ -$ 1 - Wages -$ -$ -$ -$ -$ -$ -$
Grand Total 95,079.71$ 1,269,936.04$ 158,071.02$ 2,967,973.00$ 1,539,965.94$ 2,734,513.00$ 233,460.00$
Sep-12 Financial Reporting Worksheet - Exp Pivot 10/9/2012 - 7:51 AM
- 14 -

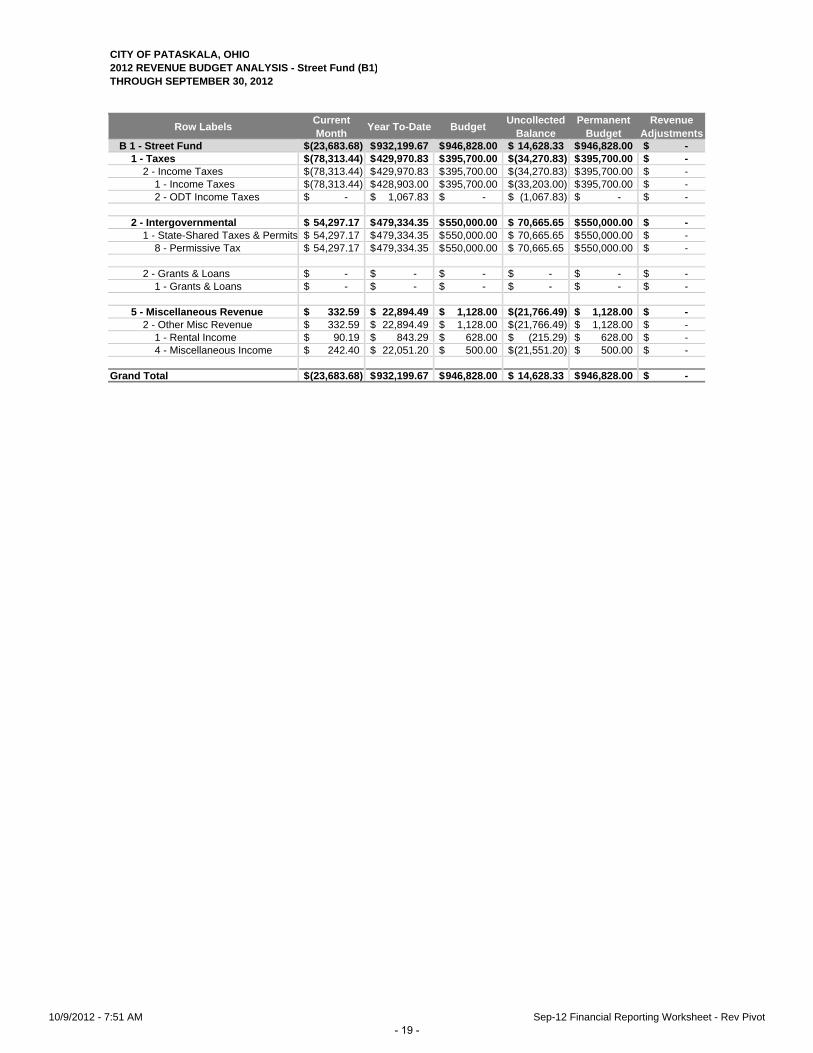
Street Fund (B1) Revenue – The Street fund has a 2012 revenue budget of $946.8 thousand. On a year to‐date basis, the Street fund has been credited with total revenue of approximately $932.2 thousand, or 98.46% of budget. Total revenue to‐date is approximately $186.1 thousand (16.64%) below the same period in 2011. The fund’s primary revenue sources are income taxes and intergovernmental revenues.
Collections in September were $53.8 thousand, and were roughly flat to the same month in 2011. The reported number was presented as a negative number (‐$78,313) and was the result of a correction of a prior‐period (April 2012) posting error that should have been credited to the Police (B13) fund. Year to‐date Income tax revenues credited to the fund (net of the correction) are $429.9 thousand and represent 108.7% of budget. In comparison, collections through September 2011 were $630.3 thousand and represented 84.04% of the 2011 full‐year collections. Even though the allocation to the fund has been changed from 25% to 15% of total collections, it appears that collections are running ahead of last year and represent an opportunity to the city. The green bar in the chart to the right reflects the revenue that would have been allocated to the fund if the percentage had not changed for 2012. In October, we will be increasing the forecast by $166.8 thousand to reflect the current rate of collection. Intergovernmental revenues in the Street fund are budgeted at $550.0 thousand and represent 58.09% of the fund’s revenue budget. This category is comprised of state‐shared (i.e., permissive) taxes, and
Income Tax$395,700 41.79%
Inter‐governmental$550,000 58.09%
Misc Other$1,128 0.12%
Street Fund Revenue ‐ Budget
Income Tax$429,971 46.12%
Inter‐governmental$479,334 51.42%
Misc Other$22,894 2.46%
YTD Street Fund Revenue by Source
September September YTD FY Bud/Act
FY 2012 ($78,313) $429,971 $395,700
FY 2011 $56,255 $630,327 $750,000
FY 2012 w/25% $89,723 $936,863 $879,745
$(0.2)
$‐
$0.2
$0.4
$0.6
$0.8
$1.0
Millions
Income Tax Collections ‐ Street Fund
- 15 -

grants/loans from other governmental agencies. On a year to‐date basis, the city has received $479.3 thousand in this category (87.15% of budget) and is up by $7.1 thousand (1.52%) to 2011 collections. The favorable variance to budget in 2012 is due to motor vehicle registration fees and gasoline excise tax revenues running better than originally projected. The other category, Other Sources, was budgeted at $1.1 thousand, and the city has received $22.9 thousand to‐date. The significant positive variance to budget is due to the one‐time receipt of: 2011 RITA retainer refund ($5.2 thousand); medical insurance rebate/refunds ($8.5 thousand); sale of miscellaneous city assets ($1.8 thousand); and miscellaneous vendor refunds ($1.4 thousand). Expenditures – The Street fund has a total appropriated expenditure budget of $1.67 million, inclusive of $178.3 thousand in contingency funds. Total spending through September 30 is $899.2 thousand and is equal to 53.83% of the 2012 budget. Excluding contingency funds in the calculation, total spending is equal to 60.27% of budget versus a straight‐line basis of 75%.
Salaries, wages and other employee‐related costs represent the largest expense category with a 2012 budget of $593.5 thousand, or 35.53% of budget. Spending through September 30 is $362.1 thousand or 61.01% of budget. The favorable YTD variance ($83.0 thousand below budget) is due to better than anticipated use of overtime, savings realized on medical insurance due to election of single versus family coverage, an open position and the hiring of 2 part‐time workers instead of the 3 included in the budget. Supplies and general operating expenditures is another significant expense category in the Street fund. It combines a number of other basic types of expenditures including supplies, equipment, utilities and other miscellaneous expenses. It has a 2012 budget of $474.7 thousand, or 28.42% of budget. Spending to‐date is $264.6 thousand or 55.75% of budget. Including encumbrances in the calculation, the total spent (or committed to spend) is $309.3 thousand (65.16% of budget). Below‐budget spending on storm drainage repairs, street light repairs, and miscellaneous street maintenance materials is the cause of the positive variance.
Salary & Related$362,102 40.27%
Contractual Services$113,100 12.58%
Supplies & Gen'l Operating
$264,619 29.43%
Capital Outlay$159,355 17.72%
YTD Street Fund Spending
Salary & Related$593,477 35.53%
Contractual Services$176,300 10.56%
Supplies & Gen'l Operating
$474,659 28.42%
Capital Outlay$247,500 14.82%
Contingency$178,324 10.68%
Street Fund Budget by Category
- 16 -

Spending on capital projects and equipment is the other major expense category in the Street fund. The 2012 budget in this category is $247.5 thousand (14.82% of budget) and provides funding for street and roadway infrastructure maintenance and related equipment. Spending through September 30 is $159.4 thousand, or 64.39% of budget. Including encumbrances in the calculation, the total committed to spend is $168.6 thousand (68.12% of budget). Spending in this category also does not tend to go on a straight‐line basis; rather it is typically disbursed periodically to the vendors when the projects are invoiced and/or completed.
- 17 -

CITY OF PATASKALA, OHIOSEPTEMBER 2012 YTD ANALYSIS - Street Fund (B1)
REVENUE
Taxes Property Taxes -$ -$ -$ 0.00% -$ -$ -$ 0.00% -$ 0.00%
Income Taxes 429,971 395,700 (34,271) 108.66% 630,327 750,000 119,673 84.04% (200,356) -31.79%
429,971$ 395,700$ (34,271)$ 108.66% 630,327$ 750,000$ 119,673$ 84.04% (200,356)$ -31.79%
Intergovernmental State Shared Taxes & Permits 479,334$ 550,000$ 70,666$ 87.15% 472,147$ 550,000$ 77,853$ 85.84% 7,188$ 1.52%
Grants & Loans - - - 0.00% - - - 0.00% - 0.00%
Special Assessments - - - 0.00% - - - 0.00% - 0.00%
479,334$ 550,000$ 70,666$ 87.15% 472,147$ 550,000$ 77,853$ 85.84% 7,188$ 1.52%
Charges for Service Water & Sewer Fees -$ -$ -$ 0.00% -$ -$ -$ 0.00% -$ 0.00%
Other Fees & Charges - - - 0.00% - - - 0.00% - 0.00%
-$ -$ -$ 0.00% -$ -$ -$ 0.00% -$ 0.00%
Fines, Licenses & Permits Fines & Forfeitures -$ -$ -$ 0.00% -$ -$ -$ 0.00% -$ 0.00%
Building, Licenses & Permits - - - 0.00% - - - 0.00% - 0.00%
Other Permits - - - 0.00% - - - 0.00% - 0.00%
-$ -$ -$ 0.00% -$ -$ -$ 0.00% -$ 0.00%
Other Sources Investment Income -$ -$ -$ 0.00% -$ -$ -$ 0.00% -$ 0.00%
Rental Income 843 628 (215) 134.28% 803 700 (103) 114.69% 40 5.04%
Bond/Note Issuance - - - 0.00% - - - 0.00% - 0.00%
Sale of Assets - - - 0.00% - - - 0.00% - 0.00%
Other Income 22,051 500 (21,551) 4410.24% 14,976 500 (14,476) 2995.23% 7,075 47.24%
22,894$ 1,128$ (21,766)$ 2029.65% 15,779$ 1,200$ (14,579)$ 1314.91% 7,116$ 45.10%
Transfers Transfers & Advances In -$ -$ -$ 0.00% -$ -$ -$ 0.00% -$ 0.00%
-$ -$ -$ 0.00% -$ -$ -$ 0.00% -$ 0.00%
932,200$ 946,828$ 14,628$ 98.46% 1,118,252$ 1,301,200$ 182,948$ 85.94% (186,053)$ -16.64%
Adjustments:- Elim impact of Interfund transfers/advances -$ -$ -$ 0.00% -$ -$ -$ 0.00% -$ 0.00%
- - - 0.00% - - - 0.00% - 0.00%
-$ -$ -$ 0.00% -$ -$ -$ 0.00% -$ 0.00%
932,200$ 946,828$ 14,628$ 98.46% 1,118,252$ 1,301,200$ 182,948$ 85.94% (186,053)$ -16.64%
EXPENDITURE & ENCUMBRANCES
Salary & Related Salaries & Wages 246,691$ 387,796$ 141,105$ 36.39% -$ 141,105$ 36.39% 227,710$ 18,981$ 13.45%Benefits 115,411 205,681 90,270 43.89% - 90,270 43.89% 123,928 (8,517) -9.44%
362,102$ 593,477$ 231,375$ 38.99% -$ 231,375$ 38.99% 351,638$ 10,464$ 4.52%
Contractual Services 113,100$ 176,300$ 63,200$ 35.85% 48,237$ 14,963$ 8.49% 82,827$ 30,273$ 202.32%Supplies & General Operating 264,619 474,659 210,040 44.25% 44,688 165,352 34.84% 215,812 48,807 29.52%Capital Outlay 159,355 247,500 88,145 35.61% 9,243 78,903 31.88% 104,159 55,195 69.95%Debt Service - - - 0.00% - - 0.00% - - 0.00%Contingency Funds - 178,324 178,324 -100.00% - 178,324 100.00% - - 0.00%Transfers & Advances - - - 0.00% - - 0.00% - - 0.00%
899,176$ 1,670,260$ 771,084$ 46.17% 102,167$ 668,917$ 40.05% 754,436$ 144,740$ 21.64%
Adjustments:- Interfund transfers & advances -$ -$ -$ 0.00% -$ -$ 0.00% -$ -$ 0.00%- Contingency funds - (178,324) (178,324) -100.00% - 178,324 100.00% - - 0.00%
-$ (178,324)$ (178,324)$ -100.00% -$ 178,324$ 100.00% -$ -$ 0.00%
899,176$ 1,491,936$ 592,760$ 39.73% 102,167$ 490,593$ 32.88% 754,436$ 144,740$ 29.50%
Grand Total Expenditures
Total Adjustments
Adjusted Grand Total Expenditures
Unenc & Avail Balance
% Available
Total Salary & Related
Adjusted Grand Total Revenue
YTD 2012 2012 BudgetYTD Unspent
Balance
Total Transfers
Grand Total Revenue
Total Adjustments to Revenue
YTD 2011YTD 2012 H/(L) YTD
2011% H/(L)% Unspent
Total Encumbered
YTD 2012 H/(L) YTD
2011% H/(L)
Total Taxes
YTD 2011 2011 Budget2012 BudgetYTD
Uncollected Balance
% Collected
YTD Uncollected
Balance
% Collected
Total Charges for Service
Total Fines, Licenses & Permits
Total Other Sources
Total Intergovernmental
YTD 2012
Sep-12 Financial Reporting Worksheet - Street Fund (B1) 10/9/2012 - 7:51 AM- 18 -
CITY OF PATASKALA, OHIO2012 REVENUE BUDGET ANALYSIS - Street Fund (B1)THROUGH SEPTEMBER 30, 2012
Row LabelsCurrent Month
Year To-Date BudgetUncollected
BalancePermanent
BudgetRevenue
AdjustmentsB 1 - Street Fund (23,683.68)$ 932,199.67$ 946,828.00$ 14,628.33$ 946,828.00$ -$
1 - Taxes (78,313.44)$ 429,970.83$ 395,700.00$ (34,270.83)$ 395,700.00$ -$ 2 - Income Taxes (78,313.44)$ 429,970.83$ 395,700.00$ (34,270.83)$ 395,700.00$ -$
1 - Income Taxes (78,313.44)$ 428,903.00$ 395,700.00$ (33,203.00)$ 395,700.00$ -$ 2 - ODT Income Taxes -$ 1,067.83$ -$ (1,067.83)$ -$ -$
2 - Intergovernmental 54,297.17$ 479,334.35$ 550,000.00$ 70,665.65$ 550,000.00$ -$ 1 - State-Shared Taxes & Permits 54,297.17$ 479,334.35$ 550,000.00$ 70,665.65$ 550,000.00$ -$
8 - Permissive Tax 54,297.17$ 479,334.35$ 550,000.00$ 70,665.65$ 550,000.00$ -$
2 - Grants & Loans -$ -$ -$ -$ -$ -$ 1 - Grants & Loans -$ -$ -$ -$ -$ -$
5 - Miscellaneous Revenue 332.59$ 22,894.49$ 1,128.00$ (21,766.49)$ 1,128.00$ -$ 2 - Other Misc Revenue 332.59$ 22,894.49$ 1,128.00$ (21,766.49)$ 1,128.00$ -$
1 - Rental Income 90.19$ 843.29$ 628.00$ (215.29)$ 628.00$ -$ 4 - Miscellaneous Income 242.40$ 22,051.20$ 500.00$ (21,551.20)$ 500.00$ -$
Grand Total (23,683.68)$ 932,199.67$ 946,828.00$ 14,628.33$ 946,828.00$ -$
10/9/2012 - 7:51 AM Sep-12 Financial Reporting Worksheet - Rev Pivot- 19 -

- 20 -

Police Fund (B13) Revenue – The Police fund has a 2012 revenue budget of $638.6 thousand. On a year to‐date basis, the Police fund has received approximately $762.6 thousand in total revenue, or 119.41% of budget. Total revenue to‐date, however, is approximately $1.15 million (60.13%) below the same period in 2011. The fund’s primary revenue sources are income taxes and intergovernmental revenues.
Year to‐date income tax revenues credited to the fund are $688.0 thousand and represent 108.66% of budget. In comparison, collections through September 2011 were $1.89 million and represented 77.47%
of the 2011 full‐year collections. Collections for the month of September are $132.1 thousand higher due to a prior‐period misposting error from the Street (B1) fund. Even though the allocation to the fund has been changed from 75% to 24% of total collections, collections to‐date are running ahead of ahead of budget and represent an opportunity to the city. Adjusting for the change in allocation rates (see green bar in chart at left) would indicate that collections are running above the 2011 pace for this fund. In
October, we will be increasing the revenue forecast by $266.9 thousand to reflect the current collection rate. The other major category, Other Sources, was budgeted at $5.0 thousand, and the city has received $70.0 thousand to‐date. The significant positive variance to budget is due to the one‐time receipt of: 2011 RITA retainer refund ($15.6 thousand); medical insurance rebate/refunds ($14.7 thousand); sale of
Income Tax$687,953 90.22%
Fines, Licenses & Permits$4,600 0.60%
Misc Other$70,001 9.18%
YTD Police Fund Revenue by Source
September September YTD FY Bud/Act
FY 2012 $218,281 $687,953 $633,121
FY 2011 $168,764 $1,886,670 $2,229,000
FY12 w/75% $682,128 $2,149,854 $1,978,503
$‐
$0.5
$1.0
$1.5
$2.0
$2.5
Millions
Income Tax Collections ‐ Police Fund
Income Tax$633,121 99.14%
Fines, Licenses & Permits$500 0.08%
Misc Other$5,000 0.78%
Police Fund Revenue ‐ Budget
- 21 -

miscellaneous/surplus city assets ($1.8 thousand); Homeland Security payment on seizures ($10.1 thousand); and Ohio Plan insurance reimbursement on two totaled Police cruisers ($22.3 thousand). Expenditures – The Police fund has a total appropriated expenditure budget of $2.72 million, inclusive of $449.8 thousand in contingency funds. Total spending through September 30 is $1.44 million and is equal to 52.79% of the 2012 budget. Excluding contingency funds in the calculation, total spending is equal to 63.23% of budget versus a straight‐line basis 75%.
Salaries, wages and other employee‐related costs represent the largest expense category with a 2012 budget of $1.48 million, or 54.32% of budget. Spending through September 30 is $948.1 thousand or 64.03% of budget. The favorable YTD variance ($162.4 thousand below budget) is due to an open budgeted officer position, better than anticipated use of overtime, several employees ‘opting out’ of the health insurance, tuition reimbursement not incurred, and new employees selecting insurance coverage other than the family level included in the 2012 budget. Supplies and general operating expenditures is another significant expense category in the Police fund. It combines a number of other basic types of expenditures including supplies, equipment, utilities and other miscellaneous expenses. It has a 2012 budget of $302.0 thousand, or 11.08% of budget. Spending to‐date is $131.6 thousand or 43.59% of budget. Including encumbrances in the calculation, the total spent (or committed to spend) is $162.0 thousand (53.63% of budget). Below‐budget spending on patrol vehicle miscellaneous parts/repairs, continuing education reimbursements, uniforms/other miscellaneous equipment and radio/computer repairs are the drivers of the positive variance. Spending on capital equipment is the other major expense category in the Police fund. The 2012 budget in this category is $275 thousand (10.09% of budget) and provides funding for the acquisition of law enforcement‐related equipment and capital improvements. Spending through September 30 is $254.4 thousand, or 92.5% of budget. The primary expenditure in this category is the purchase of 7 new police cruisers. The city took possession of those in July at a total cost of $254.4 thousand.
Salary & Related$948,054 65.88%
Contractual Services$104,986 7.30%
Supplies & Gen'l Operating
$131,627 9.15%
Capital Outlay$254,388 17.68%
YTD Police Fund Spending
Salary & Related
$1,480,663 54.32%
Contractual Services$218,400 8.01%
Supplies & Gen'l Operating
$302,000 11.08%
Capital Outlay$275,000 10.09%
Contingency$449,793 16.50%
Police Fund Budget by Category
- 22 -

CITY OF PATASKALA, OHIOSEPTEMBER 2012 YTD ANALYSIS - Police Fund (B13)
REVENUE
Taxes Property Taxes -$ -$ -$ 0.00% -$ -$ -$ 0.00% -$ 0.00%
Income Taxes 687,953 633,121 (54,832) 108.66% 1,890,980 2,229,000 338,020 84.84% (1,203,026) -63.62%
687,953$ 633,121$ (54,832)$ 108.66% 1,890,980$ 2,229,000$ 338,020$ 84.84% (1,203,026)$ -63.62%
Intergovernmental State Shared Taxes & Permits -$ -$ -$ 0.00% 3,430$ 5,000$ 1,571$ 68.59% (3,430)$ -100.00%
Grants & Loans - - - 0.00% - - - 0.00% - 0.00%
Special Assessments - - - 0.00% - - - 0.00% - 0.00%
-$ -$ -$ 0.00% 3,430$ 5,000$ 1,571$ 68.59% (3,430)$ -100.00%
Charges for Service Water & Sewer Fees -$ -$ -$ 0.00% -$ -$ -$ 0.00% -$ 0.00%
Other Fees & Charges - - - 0.00% - - - 0.00% - 0.00%
-$ -$ -$ 0.00% -$ -$ -$ 0.00% -$ 0.00%
Fines, Licenses & Permits Fines & Forfeitures 4,600$ 500$ (4,100)$ 920.00% 455$ 6,000$ 5,545$ 7.58% 4,145$ 910.99%
Building, Licenses & Permits - - - 0.00% - - - 0.00% - 0.00%
Other Permits - - - 0.00% - - - 0.00% - 0.00%
4,600$ 500$ (4,100)$ 920.00% 455$ 6,000$ 5,545$ 7.58% 4,145$ 910.99%
Other Sources Investment Income -$ -$ -$ 0.00% -$ -$ -$ 0.00% -$ 0.00%
Rental Income - - - 0.00% - - - 0.00% - 0.00%
Bond/Note Issuance - - - 0.00% - - - 0.00% - 0.00%
Sale of Assets - - - 0.00% - - - 0.00% - 0.00%
Other Income 70,001 5,000 (65,001) 1400.02% 17,916 10,000 (7,916) 179.16% 52,085 290.72%
70,001$ 5,000$ (65,001)$ 1400.02% 17,916$ 10,000$ (7,916)$ 179.16% 52,085$ 290.72%
Transfers Transfers & Advances In -$ -$ -$ 0.00% -$ -$ -$ 0.00% -$ 0.00%
-$ -$ -$ 0.00% -$ -$ -$ 0.00% -$ 0.00%
762,555$ 638,621$ (123,934)$ 119.41% 1,912,780$ 2,250,000$ 337,220$ 85.01% (1,150,226)$ -60.13%
Adjustments:- Elim impact of Interfund transfers/advances -$ -$ -$ 0.00% -$ -$ -$ 0.00% -$ 0.00%
- - - 0.00% - - - 0.00% - 0.00%
-$ -$ -$ 0.00% -$ -$ -$ 0.00% -$ 0.00%
762,555$ 638,621$ (123,934)$ 119.41% 1,912,780$ 2,250,000$ 337,220$ 85.01% (1,150,226)$ -60.13%
EXPENDITURE & ENCUMBRANCES
Salary & Related Salaries & Wages 660,566$ 971,062$ 310,496$ 31.97% -$ 310,496$ 31.97% 534,121$ 126,445$ 40.72%Benefits 287,488 509,601 222,113 43.59% - 222,113 43.59% 264,544 22,945 10.33%
948,054$ 1,480,663$ 532,609$ 35.97% -$ 532,609$ 35.97% 798,665$ 149,390$ 28.05%
Contractual Services 104,986$ 218,400$ 113,414$ 51.93% 26,462$ 86,951$ 39.81% 142,237$ (37,250)$ -42.84%Supplies & General Operating 131,627 302,000 170,373 56.41% 30,345 140,029 46.37% 125,199 6,428 4.59%Capital Outlay 254,388 275,000 20,612 7.50% - 20,612 7.50% 1,424 252,964 1227.26%Debt Service - - - 0.00% - - 0.00% - - 0.00%Contingency Funds - 449,793 449,793 -100.00% - 449,793 100.00% - - 0.00%Transfers & Advances - - - 0.00% - - 0.00% - - 0.00%
1,439,055$ 2,725,856$ 1,286,801$ 47.21% 56,807$ 1,229,993$ 45.12% 1,067,524$ 371,531$ 30.21%
Adjustments:- Interfund transfers & advances -$ -$ -$ 0.00% -$ -$ 0.00% -$ -$ 0.00%- Contingency funds - (449,793) (449,793) -100.00% - 449,793 100.00% - - 0.00%
-$ (449,793)$ (449,793)$ -100.00% -$ 449,793$ 100.00% -$ -$ 0.00%
1,439,055$ 2,276,063$ 837,008$ 36.77% 56,807$ 780,200$ 34.28% 1,067,524$ 371,531$ 47.62%
Grand Total Expenditures
Total Adjustments
Adjusted Grand Total Expenditures
Unenc & Avail Balance
% Available
Total Salary & Related
Adjusted Grand Total Revenue
YTD 2012 2012 BudgetYTD Unspent
Balance
Total Transfers
Grand Total Revenue
Total Adjustments to Revenue
YTD 2011YTD 2012 H/(L) YTD
2011% H/(L)% Unspent
Total Encumbered
YTD 2012 H/(L) YTD
2011% H/(L)
Total Taxes
YTD 2011 2011 Budget2012 BudgetYTD
Uncollected Balance
% Collected
YTD Uncollected
Balance
% Collected
Total Charges for Service
Total Fines, Licenses & Permits
Total Other Sources
Total Intergovernmental
YTD 2012
Sep-12 Financial Reporting Worksheet - Police Fund (B13) 10/9/2012 - 7:51 AM- 23 -

CITY OF PATASKALA, OHIO2012 REVENUE BUDGET ANALYSIS - Police Fund (B13)THROUGH SEPTEMBER 30, 2012
Row LabelsCurrent Month
Year To-Date BudgetUncollected
BalancePermanent
BudgetRevenue
AdjustmentsB13 - Police Levy 219,077.44$ 762,554.51$ 638,621.00$ (123,933.51)$ 638,620.00$ 1.00$
1 - Taxes 218,281.06$ 687,953.36$ 633,121.00$ (54,832.36)$ 633,120.00$ 1.00$ 1 - Property Taxes -$ -$ -$ -$ -$ -$
1 - Real Property Taxes -$ -$ -$ -$ -$ -$ 2 - Other Property Taxes -$ -$ -$ -$ -$ -$ 3 - Personal Property Tax -$ -$ -$ -$ -$ -$
2 - Income Taxes 218,281.06$ 687,953.36$ 633,121.00$ (54,832.36)$ 633,120.00$ 1.00$ 1 - Income Taxes 218,281.06$ 686,244.83$ 633,121.00$ (53,123.83)$ 633,120.00$ 1.00$ 2 - ODT Income Taxes -$ 1,708.53$ -$ (1,708.53)$ -$ -$
2 - Intergovernmental -$ -$ -$ -$ -$ -$ 1 - State-Shared Taxes & Permits -$ -$ -$ -$ -$ -$
2 - Rollback/Homestead -$ -$ -$ -$ -$ -$ 3 - Electric Utility Income Tax -$ -$ -$ -$ -$ -$
4 - Fines, Licenses & Permits 630.00$ 4,600.00$ 500.00$ (4,100.00)$ 500.00$ -$ 1 - Fines & Forfeitures 630.00$ 4,600.00$ 500.00$ (4,100.00)$ 500.00$ -$
1 - Fines & Forfeitures 630.00$ 4,600.00$ 500.00$ (4,100.00)$ 500.00$ -$
5 - Miscellaneous Revenue 166.38$ 70,001.15$ 5,000.00$ (65,001.15)$ 5,000.00$ -$ 2 - Other Misc Revenue 166.38$ 70,001.15$ 5,000.00$ (65,001.15)$ 5,000.00$ -$
3 - Sale of Assets -$ -$ -$ -$ -$ -$ 4 - Miscellaneous Income 166.38$ 70,001.15$ 5,000.00$ (65,001.15)$ 5,000.00$ -$
Grand Total 219,077.44$ 762,554.51$ 638,621.00$ (123,933.51)$ 638,620.00$ 1.00$
10/9/2012 - 7:51 AM Sep-12 Financial Reporting Worksheet - Rev Pivot- 24 -

Capital Improvements Fund (C6) Revenue – The Capital Improvements fund has a 2012 revenue budget of $2.2 million. On a year to‐date basis, the fund has received approximately $2.32 in total revenue, or 105.71% of budget. As this is a new fund in 2012, there is no revenue to compare it against for 2011. The fund’s primary revenue sources are income taxes and other sources.
Income taxes are the primary revenue source for the Capital Improvements fund. The 2012 budget for income tax revenues in the fund is $1.45 million. Year to‐date Income tax revenues credited to the fund
are $1.58 million and represent 108.66% of budget. As was the case in the previously reviewed funds, it is apparent that collections are running ahead of last year and represents an opportunity to the city. In October, we will be increasing the revenue forecast by $611.6 thousand to reflect the better than expected rate of collection. The other major category, Other Sources, was budgeted at $750 thousand, and to‐date, the city has received all of that revenue. This
category is where a portion ($750,000) of the 2012 BANs were recorded. The costs of issuance and underwriters discount associated with this portion of the BANs ($7.5 thousand) which were previously recorded here were moved to the Debt Service (D1) fund. Expenditures – The Capital Improvements fund has a total appropriated expenditure budget of $2.21 million. Total spending through September 30 is $458.9 thousand and is equal to 20.78% of the 2012
Income Tax$1,576,560 67.76%
Misc Other$750,000 32.24%
YTD Capital Improvements FundRevenue by Source
September September YTD FY Bud/Act
FY 2012 $197,390 $1,576,560 $1,450,900
FY 2011 $0 $0 $0
$‐ $0.2 $0.4 $0.6 $0.8 $1.0 $1.2 $1.4 $1.6 $1.8
Millions
Income Tax CollectionsCapital Improvements Fund
Income Tax$1,450,900 65.92% Misc Other
$750,000 34.08%
Capital Improvements Fund Revenue Budget
- 25 -

budget. Including encumbrances in the calculation, total committed spending is equal to 99.57% of budget versus a straight‐line basis of 75%. As would be expected, spending on capital projects and equipment is the major expense category in the Capital Improvements fund. The 2012 budget in this category is $2.12 million, (96.02% of budget) and
provides funding for the construction of a number of infrastructure improvements. Spending through September 30 is $378.8 thousand, or 17.87% of budget. Including encumbrances in the calculation, total committed spending is equal to $2.12 million (99.92% of budget). The primary planned expenditures in this category are the 2012 Roadway Asset Management Plan (RAMP) projects, and include the following projects: (*asterisk indicates projects funded by $750,000 from 2012 BAN issuance)
Project Name Budget
McIntosh Road* $290,488
Township Road – Phase I* 86,149
John Reese Parkway* 78,469
High Street* 98,939
Cedar Street* 50,340
Front Street* 51,190
Taylor Glen/Kylemore* (remaining $179,559 in project costs funded by B8 – Permissive Tax fund) 94,425
Havens Corner 895,694
Laurel Lane (remaining $160,117 in project costs funded by B8 – Permissive Tax fund) 253,207
Bristol/Linda 193,662
Depot Street 26,253
Uncommitted/Unused Balance 1,625
GRAND TOTAL $2,120,441
Capital Outlay$2,120,441 96.02%
Contractual Services$80,459 3.64%
Debt Service$7,396 0.33%
Capital Fund Budget by Category
Capital Outlay$378,849 82.55%
Contractual Services$73,481 16.01%
Debt Service$6,596 1.44%
YTD Capital Fund Spending
- 26 -

Contractual services is the other major expense category in the Capital Improvements fund. The 2012 budget in this category is $80.5 thousand (3.64% of budget) and provides for non‐employee personal services. Spending through September 30 is $73.5 thousand, or 91.33% of budget. Spending in this category is designated for the payment of tax collection fees to the Regional Income Tax Agency (RITA) and for taxpayer refund requests.
- 27 -

CITY OF PATASKALA, OHIOSEPTEMBER 2012 YTD ANALYSIS - Capital Improvements Fund (C6)
REVENUE
Taxes Property Taxes -$ -$ -$ 0.00% -$ -$ -$ 0.00% -$ 0.00%
Income Taxes 1,576,560 1,450,900 (125,660) 108.66% - - - 0.00% 1,576,560 100.00%
1,576,560$ 1,450,900$ (125,660)$ 108.66% -$ -$ -$ 0.00% 1,576,560$ 100.00%
Intergovernmental State Shared Taxes & Permits -$ -$ -$ 0.00% -$ -$ -$ 0.00% -$ 0.00%
Grants & Loans - - - 0.00% - - - 0.00% - 0.00%
Special Assessments - - - 0.00% - - - 0.00% - 0.00%
-$ -$ -$ 0.00% -$ -$ -$ 0.00% -$ 0.00%
Charges for Service Water & Sewer Fees -$ -$ -$ 0.00% -$ -$ -$ 0.00% -$ 0.00%
Other Fees & Charges - - - 0.00% - - - 0.00% - 0.00%
-$ -$ -$ 0.00% -$ -$ -$ 0.00% -$ 0.00%
Fines, Licenses & Permits Fines & Forfeitures -$ -$ -$ 0.00% -$ -$ -$ 0.00% -$ 0.00%
Building, Licenses & Permits - - - 0.00% - - - 0.00% - 0.00%
Other Permits - - - 0.00% - - - 0.00% - 0.00%
-$ -$ -$ 0.00% -$ -$ -$ 0.00% -$ 0.00%
Other Sources Investment Income -$ -$ -$ 0.00% -$ -$ -$ 0.00% -$ 0.00%
Rental Income - - - 0.00% - - - 0.00% - 0.00%
Bond/Note Issuance 750,000 750,000 - 100.00% - - - 0.00% 750,000 100.00%
Sale of Assets - - - 0.00% - - - 0.00% - 0.00%
Other Income - - - 0.00% - - - 0.00% - 0.00%
750,000$ 750,000$ -$ 100.00% -$ -$ -$ 0.00% 750,000$ 100.00%
Transfers Transfers & Advances In -$ -$ -$ 0.00% -$ -$ -$ 0.00% -$ 0.00%
-$ -$ -$ 0.00% -$ -$ -$ 0.00% -$ 0.00%
2,326,560$ 2,200,900$ (125,660)$ 105.71% -$ -$ -$ 0.00% 2,326,560$ 100.00%
Adjustments:- Elim impact of Interfund transfers/advances -$ -$ -$ 0.00% -$ -$ -$ 0.00% -$ 0.00%
- - - 0.00% - - - 0.00% - 0.00%
-$ -$ -$ 0.00% -$ -$ -$ 0.00% -$ 0.00%
2,326,560$ 2,200,900$ (125,660)$ 105.71% -$ -$ -$ 0.00% 2,326,560$ 100.00%
EXPENDITURE & ENCUMBRANCES
Salary & Related Salaries & Wages -$ -$ -$ 0.00% -$ -$ 0.00% -$ -$ 0.00%Benefits - - - 0.00% - - 0.00% - - 0.00%
-$ -$ -$ 0.00% -$ -$ 0.00% -$ -$ 0.00%
Contractual Services 73,481$ 80,459$ 6,978$ 8.67% -$ 6,978$ 8.67% -$ 73,481$ 1053.03%Supplies & General Operating - - - 0.00% - - 0.00% - - 0.00%Capital Outlay 378,849 2,120,441 1,741,592 82.13% 1,739,967 1,625 0.08% - 378,849 23312.95%Debt Service 6,596 7,396 800 10.81% - 800 10.81% - 6,596 824.79%Contingency Funds - - - 0.00% - - 0.00% - - 0.00%Transfers & Advances - - - 0.00% - - 0.00% - - 0.00%
458,927$ 2,208,296$ 1,749,369$ 79.22% 1,739,967$ 9,403$ 0.43% -$ 458,927$ 4880.73%
Adjustments:- Interfund transfers & advances -$ -$ -$ 0.00% -$ -$ 0.00% -$ -$ 0.00%- Contingency funds - - - 0.00% - - 0.00% - - 0.00%
-$ -$ -$ 0.00% -$ -$ 0.00% -$ -$ 0.00%
458,927$ 2,208,296$ 1,749,369$ 79.22% 1,739,967$ 9,403$ 0.43% -$ 458,927$ 4880.73%
Total Charges for Service
Total Fines, Licenses & Permits
Total Other Sources
Total Intergovernmental
YTD 2012YTD 2012 H/(L) YTD
2011% H/(L)
Total Taxes
YTD 2011 2011 Budget2012 BudgetYTD
Uncollected Balance
% Collected
YTD Uncollected
Balance
% Collected
YTD 2011YTD 2012 H/(L) YTD
2011% H/(L)% Unspent
Total Encumbered
Adjusted Grand Total Revenue
YTD 2012 2012 BudgetYTD Unspent
Balance
Total Transfers
Grand Total Revenue
Total Adjustments to Revenue
Grand Total Expenditures
Total Adjustments
Adjusted Grand Total Expenditures
Unenc & Avail Balance
% Available
Total Salary & Related
Sep-12 Financial Reporting Worksheet - Capital Improvements (C6) 10/9/2012 - 7:51 AM- 28 -

CITY OF PATASKALA, OHIO2012 REVENUE BUDGET ANALYSIS - Capital Improvements Fund (C6)THROUGH SEPTEMBER 30, 2012
Row LabelsCurrent Month
Year To-Date BudgetUncollected
BalancePermanent
BudgetRevenue
AdjustmentsC 6 - Capital Improvements 189,994.32$ 2,326,559.77$ 2,200,900.00$ (125,659.77)$ 2,950,900.00$ (750,000.00)$
1 - Taxes 197,390.25$ 1,576,559.77$ 1,450,900.00$ (125,659.77)$ 1,450,900.00$ -$ 2 - Income Taxes 197,390.25$ 1,576,559.77$ 1,450,900.00$ (125,659.77)$ 1,450,900.00$ -$
1 - Income Taxes 197,390.25$ 1,572,644.38$ 1,450,900.00$ (121,744.38)$ 1,450,900.00$ -$ 2 - ODT Income Taxes -$ 3,915.39$ -$ (3,915.39)$ -$ -$
5 - Miscellaneous Revenue (7,395.93)$ 750,000.00$ 750,000.00$ -$ 1,500,000.00$ (750,000.00)$ 2 - Other Misc Revenue (7,395.93)$ 750,000.00$ 750,000.00$ -$ 1,500,000.00$ (750,000.00)$
2 - Proceeds from Debt Issuance -$ 750,000.00$ 750,000.00$ -$ 1,500,000.00$ (750,000.00)$ 3 - Sale of Assets (7,395.93)$ -$ -$ -$ -$ -$
Grand Total 189,994.32$ 2,326,559.77$ 2,200,900.00$ (125,659.77)$ 2,950,900.00$ (750,000.00)$
10/9/2012 - 7:51 AM Sep-12 Financial Reporting Worksheet - Rev Pivot- 29 -

- 30 -

Water Fund (E1) Revenue – The Water fund has a 2012 revenue budget of $1.1 million. The fund’s primary revenue sources are charges for service and other sources. On a year to‐date basis, the Water fund has received approximately $1.01 million in total revenue, or 92.03% of budget, and is up by $162.0 thousand or 19.04% from the same period in 2011.
Year to‐date service charge revenues credited to the fund are $996.5 thousand and represent 90.99% of budget. In comparison, collections through September 2011 were $848.0 thousand and represented
72.63% of the 2011 full‐year collections. It would appear that collections are running ahead of last year and is an opportunity to the city. In October, we will be increasing the revenue forecast by $214.8 thousand to reflect the better than anticipated rate of collection in 2012. The other major category, Other Sources, was budgeted at $5.0 thousand, and the city has received $15.9 thousand to‐date. The significant positive variance to budget is due to the one‐time
receipt of: medical insurance rebate/refunds ($6.0 thousand); sale of miscellaneous city assets ($2.9 thousand); employee COBRA premiums ($3.4 thousand), and increased plan purchases ($1.0 thousand). Expenditures – The Water fund has a total appropriated expenditure budget of $1.44 million, inclusive of $58.2 thousand in contingency funds. Total spending through September 30 is $902.4 thousand and is
Charges for Service$996,530 98.43%
Misc Other$15,935 1.57%
YTD Water Fund Revenue by Source
September September YTD FY Bud/Act
FY 2012 $131,997 $996,530 $1,095,172
FY 2011 $106,469 $848,019 $1,095,172
$‐
$0.2
$0.4
$0.6
$0.8
$1.0
$1.2
Millions
Usage Fee Collections ‐Water Fund
Charges for Service
$1,095,172 99.55%
Misc Other$5,000 0.45%
Water Fund Revenue ‐ Budget
- 31 -

equal to 62.25% of the 2012 budget. Excluding transfers, advances and contingency funds in the calculation, total spending is equal to 57.31% of budget versus a straight‐line basis of 75%.
Supplies and general operating is the primary major expense category in the Water fund. It combines a number of other basic types of expenditures including operating supplies, equipment, utilities and other miscellaneous expenses. It has a 2012 budget of $662.5 thousand, or 45.7% of the total Water fund budget. Spending to‐date is $357.5 thousand or 53.96% of budget. Including encumbrances in the calculation, the total spent (or committed to spend) is $451.1 thousand (68.08% of budget). Below‐budget spending on plant maintenance and operating supplies are the primary drivers of the positive variance. Salaries, wages and other employee‐related costs represent the other major expense category with a 2012 budget of $420.6 thousand, or 29.01% of the total fund budget. Spending through September 30 is $256.3 thousand or 60.94% of budget. The slightly favorable YTD variance ($59.2 thousand below budget) is due to: union wage increase budgeted at 5.00% versus 4.25% approved in the CBA; wage and benefit savings associated with the open water supervisor position; and an employee ‘opted out’ of the health insurance program.
Salary & Related$256,293 28.40%
Contractual Services$42,852 4.75%
Supplies & Gen'l Operating
$357,463 39.61%
Transfers & Advances$245,761 27.24%
YTD Water Fund Spending
Salary & Related$420,598 29.01%
Contractual Services$62,636 4.32%
Supplies & Gen'l Operating
$662,500 45.70%
Contingency$58,197 4.01%
Transfers & Advances$245,761 16.95%
Water Fund Budget by Category
- 32 -
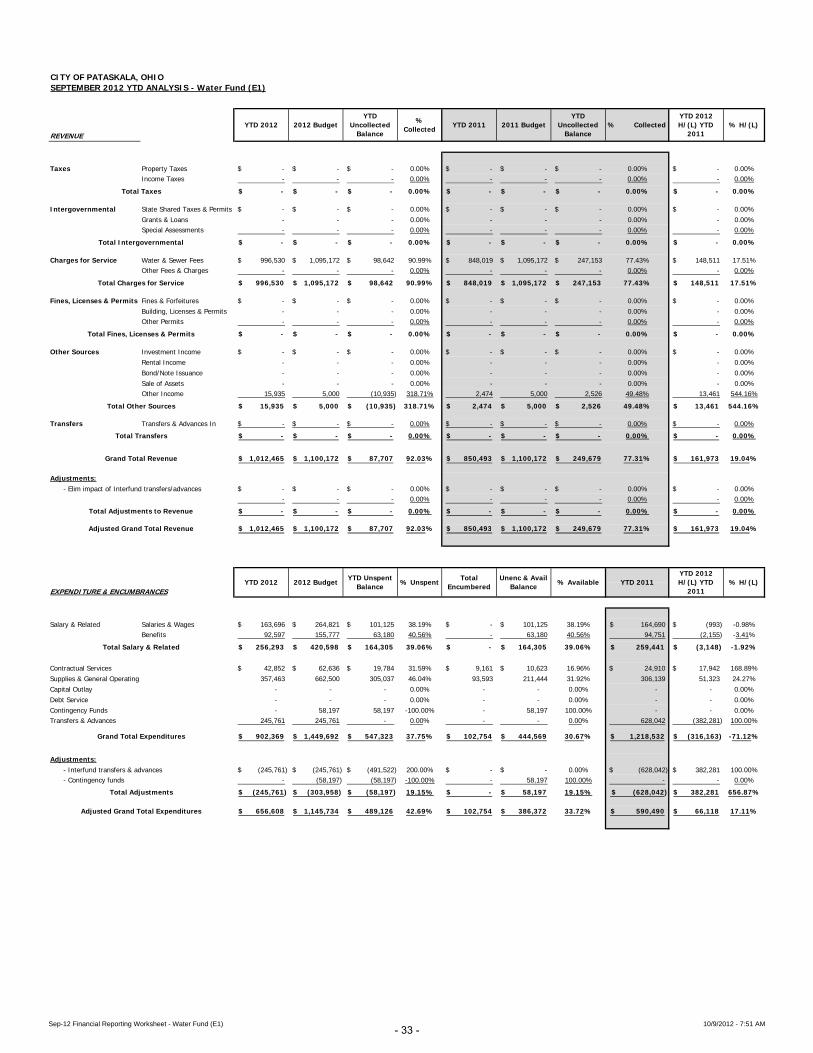
CITY OF PATASKALA, OHIOSEPTEMBER 2012 YTD ANALYSIS - Water Fund (E1)
REVENUE
Taxes Property Taxes -$ -$ -$ 0.00% -$ -$ -$ 0.00% -$ 0.00%
Income Taxes - - - 0.00% - - - 0.00% - 0.00%
-$ -$ -$ 0.00% -$ -$ -$ 0.00% -$ 0.00%
Intergovernmental State Shared Taxes & Permits -$ -$ -$ 0.00% -$ -$ -$ 0.00% -$ 0.00%
Grants & Loans - - - 0.00% - - - 0.00% - 0.00%
Special Assessments - - - 0.00% - - - 0.00% - 0.00%
-$ -$ -$ 0.00% -$ -$ -$ 0.00% -$ 0.00%
Charges for Service Water & Sewer Fees 996,530$ 1,095,172$ 98,642$ 90.99% 848,019$ 1,095,172$ 247,153$ 77.43% 148,511$ 17.51%
Other Fees & Charges - - - 0.00% - - - 0.00% - 0.00%
996,530$ 1,095,172$ 98,642$ 90.99% 848,019$ 1,095,172$ 247,153$ 77.43% 148,511$ 17.51%
Fines, Licenses & Permits Fines & Forfeitures -$ -$ -$ 0.00% -$ -$ -$ 0.00% -$ 0.00%
Building, Licenses & Permits - - - 0.00% - - - 0.00% - 0.00%
Other Permits - - - 0.00% - - - 0.00% - 0.00%
-$ -$ -$ 0.00% -$ -$ -$ 0.00% -$ 0.00%
Other Sources Investment Income -$ -$ -$ 0.00% -$ -$ -$ 0.00% -$ 0.00%
Rental Income - - - 0.00% - - - 0.00% - 0.00%
Bond/Note Issuance - - - 0.00% - - - 0.00% - 0.00%
Sale of Assets - - - 0.00% - - - 0.00% - 0.00%
Other Income 15,935 5,000 (10,935) 318.71% 2,474 5,000 2,526 49.48% 13,461 544.16%
15,935$ 5,000$ (10,935)$ 318.71% 2,474$ 5,000$ 2,526$ 49.48% 13,461$ 544.16%
Transfers Transfers & Advances In -$ -$ -$ 0.00% -$ -$ -$ 0.00% -$ 0.00%
-$ -$ -$ 0.00% -$ -$ -$ 0.00% -$ 0.00%
1,012,465$ 1,100,172$ 87,707$ 92.03% 850,493$ 1,100,172$ 249,679$ 77.31% 161,973$ 19.04%
Adjustments:- Elim impact of Interfund transfers/advances -$ -$ -$ 0.00% -$ -$ -$ 0.00% -$ 0.00%
- - - 0.00% - - - 0.00% - 0.00%
-$ -$ -$ 0.00% -$ -$ -$ 0.00% -$ 0.00%
1,012,465$ 1,100,172$ 87,707$ 92.03% 850,493$ 1,100,172$ 249,679$ 77.31% 161,973$ 19.04%
EXPENDITURE & ENCUMBRANCES
Salary & Related Salaries & Wages 163,696$ 264,821$ 101,125$ 38.19% -$ 101,125$ 38.19% 164,690$ (993)$ -0.98%Benefits 92,597 155,777 63,180 40.56% - 63,180 40.56% 94,751 (2,155) -3.41%
256,293$ 420,598$ 164,305$ 39.06% -$ 164,305$ 39.06% 259,441$ (3,148)$ -1.92%
Contractual Services 42,852$ 62,636$ 19,784$ 31.59% 9,161$ 10,623$ 16.96% 24,910$ 17,942$ 168.89%Supplies & General Operating 357,463 662,500 305,037 46.04% 93,593 211,444 31.92% 306,139 51,323 24.27%Capital Outlay - - - 0.00% - - 0.00% - - 0.00%Debt Service - - - 0.00% - - 0.00% - - 0.00%Contingency Funds - 58,197 58,197 -100.00% - 58,197 100.00% - - 0.00%Transfers & Advances 245,761 245,761 - 0.00% - - 0.00% 628,042 (382,281) 100.00%
902,369$ 1,449,692$ 547,323$ 37.75% 102,754$ 444,569$ 30.67% 1,218,532$ (316,163)$ -71.12%
Adjustments:- Interfund transfers & advances (245,761)$ (245,761)$ (491,522)$ 200.00% -$ -$ 0.00% (628,042)$ 382,281$ 100.00%- Contingency funds - (58,197) (58,197) -100.00% - 58,197 100.00% - - 0.00%
(245,761)$ (303,958)$ (58,197)$ 19.15% -$ 58,197$ 19.15% (628,042)$ 382,281$ 656.87%
656,608$ 1,145,734$ 489,126$ 42.69% 102,754$ 386,372$ 33.72% 590,490$ 66,118$ 17.11%
Total Charges for Service
Total Fines, Licenses & Permits
Total Other Sources
Total Intergovernmental
YTD 2012YTD 2012 H/(L) YTD
2011% H/(L)
Total Taxes
YTD 2011 2011 Budget2012 BudgetYTD
Uncollected Balance
% Collected
YTD Uncollected
Balance% Collected
YTD 2011YTD 2012 H/(L) YTD
2011% H/(L)% Unspent
Total Encumbered
Adjusted Grand Total Revenue
YTD 2012 2012 BudgetYTD Unspent
Balance
Total Transfers
Grand Total Revenue
Total Adjustments to Revenue
Grand Total Expenditures
Total Adjustments
Adjusted Grand Total Expenditures
Unenc & Avail Balance
% Available
Total Salary & Related
Sep-12 Financial Reporting Worksheet - Water Fund (E1) 10/9/2012 - 7:51 AM- 33 -
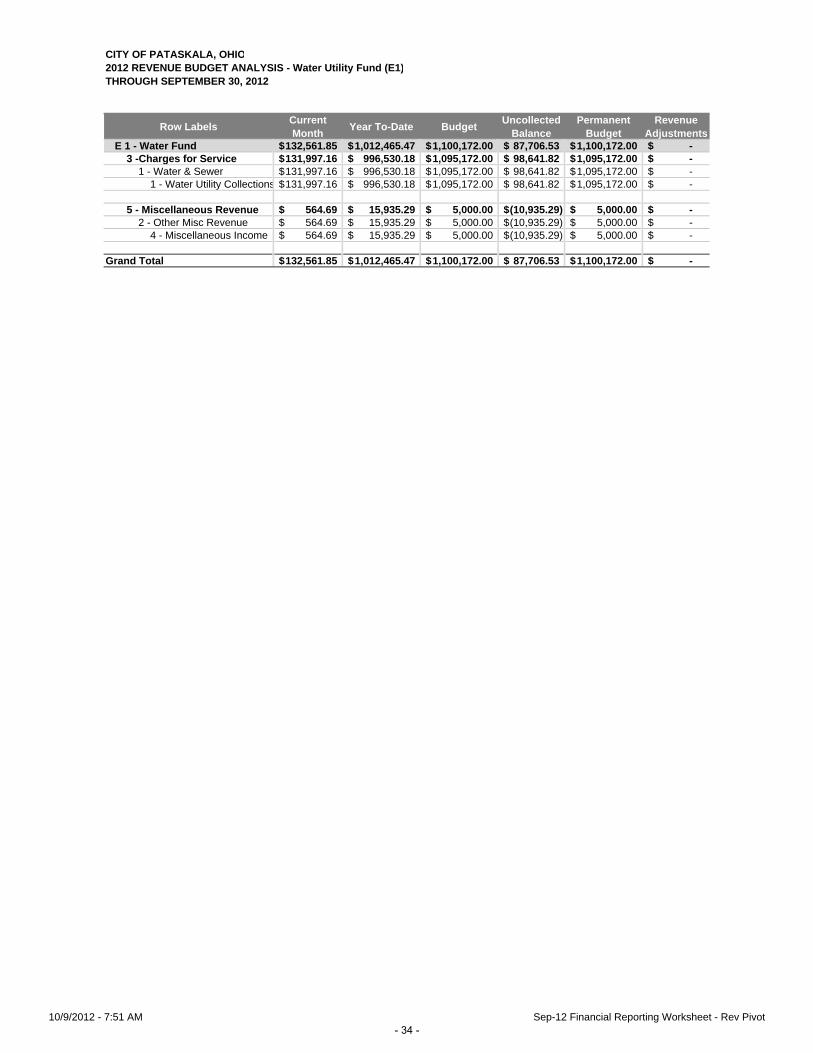
CITY OF PATASKALA, OHIO2012 REVENUE BUDGET ANALYSIS - Water Utility Fund (E1)THROUGH SEPTEMBER 30, 2012
Row LabelsCurrent Month
Year To-Date BudgetUncollected
BalancePermanent
BudgetRevenue
AdjustmentsE 1 - Water Fund 132,561.85$ 1,012,465.47$ 1,100,172.00$ 87,706.53$ 1,100,172.00$ -$
3 -Charges for Service 131,997.16$ 996,530.18$ 1,095,172.00$ 98,641.82$ 1,095,172.00$ -$ 1 - Water & Sewer 131,997.16$ 996,530.18$ 1,095,172.00$ 98,641.82$ 1,095,172.00$ -$
1 - Water Utility Collections 131,997.16$ 996,530.18$ 1,095,172.00$ 98,641.82$ 1,095,172.00$ -$
5 - Miscellaneous Revenue 564.69$ 15,935.29$ 5,000.00$ (10,935.29)$ 5,000.00$ -$ 2 - Other Misc Revenue 564.69$ 15,935.29$ 5,000.00$ (10,935.29)$ 5,000.00$ -$
4 - Miscellaneous Income 564.69$ 15,935.29$ 5,000.00$ (10,935.29)$ 5,000.00$ -$
Grand Total 132,561.85$ 1,012,465.47$ 1,100,172.00$ 87,706.53$ 1,100,172.00$ -$
10/9/2012 - 7:51 AM Sep-12 Financial Reporting Worksheet - Rev Pivot- 34 -

Sewer Fund (E2) Revenue – The Sewer fund has a 2012 revenue budget of $850.8 thousand. On a year to‐date basis, the Sewer fund has received approximately $812.5 thousand in total revenue, or 95.5% of budget. In October, we will be increasing the revenue forecast by $265.2 thousand to reflect the better than anticipated rate of collections. Total revenues are down, however, by $638.9 thousand or 44.02% from the same period in 2011. The primary driver of the decline is the receipt of over $700 thousand in OWDA loan proceeds in 2011 for the construction of the wastewater treatment plant. The fund’s primary revenue sources are charges for service, intergovernmental and other sources.
Year to‐date service charge revenues credited to the fund are $797.9 thousand and represent 100.52% of budget. In comparison, collections through September 2011 were $729.5 thousand and represented 72.74% of the 2011 full‐year collections. The estimated revenue in this category will be increased in
October to reflect trends. The intergovernmental revenue category reflects the remaining OWDA loan disbursements associated with the construction of the wastewater treatment plan. It is budgeted at $52.0 thousand, but nothing has been received by the city to‐date. The project is being finalized at this time, and the final distributions will be posted in October. The other major category, Other Sources, was budgeted at $5.0
Charges for Service$797,863 98.20%
Inter‐governmental
$0 0.00%
Misc Other$14,615 1.80%
YTD Sewer Fund Revenue by Source
Charges for Service$793,767 93.30%
Inter‐governmental
$52,000 6.11%
Misc Other$5,001 0.59%
Sewer Fund Revenue ‐ Budget
September September YTD FY Bud/Act
FY 2012 $103,290 $797,863 $793,767
FY 2011 $83,668 $729,523 $976,084
$‐
$0.2
$0.4
$0.6
$0.8
$1.0
$1.2
Millions
Usage Fee Collections ‐ Sewer Fund
- 35 -

thousand, and the city has received $14.6 thousand to‐date. The significant positive variance to budget is due to the one‐time receipt of: medical insurance rebate/refunds ($6.0 thousand); sale of surplus city assets ($2.9 thousand); and employee COBRA premiums ($2.6 thousand). Expenditures – The Sewer fund has a total appropriated expenditure budget of $2.78 million, inclusive of $757.0 thousand in contingency funds. Total spending through September 30 is $1.47 million and is equal to 53.05% of the 2012 budget. Excluding transfers, advances and contingency funds in the calculation, total spending is equal to 64.24% of budget versus a straight‐line basis of 75%.
For 2012, the largest expense category for the Sewer fund is interfund transfers. It has a budget of $820.2 thousand (29.52% of budget), and reflects transfers to the Sewer Capital Improvements (E6) fund ($277.0 thousand) and the Sewer Debt Service (E13) fund ($543.2 thousand). Supplies and general operating expenditures is the next major expense category in the Sewer fund. It combines a number of other basic types of expenditures including operating supplies, equipment, utilities and other miscellaneous expenses. It has a 2012 budget of $552.8 thousand, or 19.9% of budget. Spending to‐date is $286.2 thousand or 19.42% of budget. Including encumbrances in the calculation, the total spent (or committed to spend) is $392.6 thousand (71.03% of budget). The primary drivers of the positive variance include: below‐budget spending on sludge disposal, utilities, and lab services; partially offset by higher than anticipated spending on sewer system maintenance and safety equipment. Salaries, wages and other employee‐related costs represent the other major expense category with a 2012 budget of $486.4 thousand, or 17.51% of budget. Spending through September 30 is $298.7 thousand or 61.4% of budget. The slightly favorable YTD variance ($66.1 thousand below budget) is due to: union wage increase was budgeted at 5.00% versus 4.25% approved in the CBA; wage and benefit savings associated with a mid‐year hire of the utility operator position; and an employee ‘opted out’ of the health insurance program.
Salary & Related$486,372 17.51%
Contractual Services$161,750 5.82%
Supplies & Gen'l Operating
$552,750 19.90%
Contingency$757,032 27.25%
Transfers & Advances$820,200 29.52%
Sewer Fund Budget by Category
Salary & Related$298,654 20.26%
Contractual Services$68,836 4.67%
Supplies & Gen'l Operating
$286,207 19.42%
Transfers & Advances$820,200 55.65%
YTD Sewer Fund Spending
- 36 -

CITY OF PATASKALA, OHIOSEPTEMBER 2012 YTD ANALYSIS - Sewer Fund (E2)
REVENUE
Taxes Property Taxes -$ -$ -$ 0.00% -$ -$ -$ 0.00% -$ 0.00%
Income Taxes - - - 0.00% - - - 0.00% - 0.00%
-$ -$ -$ 0.00% -$ -$ -$ 0.00% -$ 0.00%
Intergovernmental State Shared Taxes & Permits -$ -$ -$ 0.00% -$ -$ -$ 0.00% -$ 0.00%
Grants & Loans - 52,000 52,000 0.00% 719,510 790,000 70,490 91.08% (719,510) -100.00%
Special Assessments - - - 0.00% - - - 0.00% - 0.00%
-$ 52,000$ 52,000$ 0.00% 719,510$ 790,000$ 70,490$ 91.08% (719,510)$ -100.00%
Charges for Service Water & Sewer Fees 797,863$ 793,767$ (4,096)$ 100.52% 729,523$ 793,767$ 64,244$ 91.91% 68,339$ 9.37%
Other Fees & Charges - - - 0.00% - - - 0.00% - 0.00%
797,863$ 793,767$ (4,096)$ 100.52% 729,523$ 793,767$ 64,244$ 91.91% 68,339$ 9.37%
Fines, Licenses & Permits Fines & Forfeitures -$ -$ -$ 0.00% -$ -$ -$ 0.00% -$ 0.00%
Building, Licenses & Permits - - - 0.00% - - - 0.00% - 0.00%
Other Permits - - - 0.00% - - - 0.00% - 0.00%
-$ -$ -$ 0.00% -$ -$ -$ 0.00% -$ 0.00%
Other Sources Investment Income -$ -$ -$ 0.00% -$ -$ -$ 0.00% -$ 0.00%
Rental Income - - - 0.00% - - - 0.00% - 0.00%
Bond/Note Issuance - - - 0.00% - - - 0.00% - 0.00%
Sale of Assets - - - 0.00% - - - 0.00% - 0.00%
Other Income 14,615 5,001 (9,614) 292.24% 2,350 5,000 2,650 47.00% 12,265 521.96%
14,615$ 5,001$ (9,614)$ 292.24% 2,350$ 5,000$ 2,650$ 47.00% 12,265$ 521.96%
Transfers Transfers & Advances In -$ -$ -$ 0.00% -$ -$ -$ 0.00% -$ 0.00%
-$ -$ -$ 0.00% -$ -$ -$ 0.00% -$ 0.00%
812,477$ 850,768$ 38,291$ 95.50% 1,451,383$ 1,588,767$ 137,384$ 91.35% (638,906)$ -44.02%
Adjustments:- Elim impact of Interfund transfers/advances -$ -$ -$ 0.00% -$ -$ -$ 0.00% -$ 0.00%
- - - 0.00% - - - 0.00% - 0.00%
-$ -$ -$ 0.00% -$ -$ -$ 0.00% -$ 0.00%
812,477$ 850,768$ 38,291$ 95.50% 1,451,383$ 1,588,767$ 137,384$ 91.35% (638,906)$ -44.02%
EXPENDITURE & ENCUMBRANCES
Salary & Related Salaries & Wages 199,462$ 301,471$ 102,009$ 33.84% -$ 102,009$ 33.84% 157,647$ 41,815$ 40.99%Benefits 99,192 184,901 85,709 46.35% - 85,709 46.35% 95,264 3,928 4.58%
298,654$ 486,372$ 187,718$ 38.60% -$ 187,718$ 38.60% 252,911$ 45,743$ 24.37%
Contractual Services 68,836$ 161,750$ 92,914$ 57.44% 11,274$ 81,640$ 50.47% 245,093$ (176,258)$ -215.90%Supplies & General Operating 286,207 552,750 266,543 48.22% 106,412 160,131 28.97% 286,672 (465) -0.29%Capital Outlay - - - 0.00% - - 0.00% - - 0.00%Debt Service - - - 0.00% - - 0.00% - - 0.00%Contingency Funds - 757,032 757,032 -100.00% - 757,032 100.00% - - 0.00%Transfers & Advances 820,200 820,200 - 0.00% - - 0.00% 227,992 592,208 100.00%
1,473,897$ 2,778,104$ 1,304,207$ 46.95% 117,686$ 1,186,521$ 42.71% 1,012,668$ 461,229$ 38.87%
Adjustments:- Interfund transfers & advances (820,200)$ (820,200)$ (1,640,400)$ 200.00% -$ -$ 0.00% (227,992)$ (592,208)$ 100.00%- Contingency funds - (757,032) (757,032) -100.00% - 757,032 100.00% - - 0.00%
(820,200)$ (1,577,232)$ (757,032)$ 48.00% -$ 757,032$ 48.00% (227,992)$ (592,208)$ -78.23%
653,697$ 1,200,872$ 547,175$ 45.56% 117,686$ 429,489$ 35.76% 784,676$ (130,980)$ -30.50%
Total Charges for Service
Total Fines, Licenses & Permits
Total Other Sources
Total Intergovernmental
YTD 2012YTD 2012 H/(L) YTD
2011% H/(L)
Total Taxes
YTD 2011 2011 Budget2012 BudgetYTD
Uncollected Balance
% Collected
YTD Uncollected
Balance
% Collected
YTD 2011YTD 2012 H/(L) YTD
2011% H/(L)% Unspent
Total Encumbered
Adjusted Grand Total Revenue
YTD 2012 2012 BudgetYTD Unspent
Balance
Total Transfers
Grand Total Revenue
Total Adjustments to Revenue
Grand Total Expenditures
Total Adjustments
Adjusted Grand Total Expenditures
Unenc & Avail Balance
% Available
Total Salary & Related
Sep-12 Financial Reporting Worksheet - Sewer Fund (E2) 10/9/2012 - 7:51 AM- 37 -

CITY OF PATASKALA, OHIO2012 REVENUE BUDGET ANALYSIS - Sewer Utility Fund (E2)THROUGH SEPTEMBER 30, 2012
Row LabelsCurrent Month
Year To-Date BudgetUncollected
BalancePermanent
BudgetRevenue
AdjustmentsE 2 - Sewer Fund 103,813.55$ 812,477.48$ 850,768.00$ 38,290.52$ 850,767.00$ 1.00$
2 - Intergovernmental -$ -$ 52,000.00$ 52,000.00$ 52,000.00$ -$ 2 - Grants & Loans -$ -$ 52,000.00$ 52,000.00$ 52,000.00$ -$
1 - Grants & Loans -$ -$ 52,000.00$ 52,000.00$ 52,000.00$ -$
3 -Charges for Service 103,290.18$ 797,862.70$ 793,767.00$ (4,095.70)$ 793,767.00$ -$ 1 - Water & Sewer 103,290.18$ 797,862.70$ 793,767.00$ (4,095.70)$ 793,767.00$ -$
3 - Sewer Utility Collections 103,290.18$ 797,862.70$ 793,767.00$ (4,095.70)$ 793,767.00$ -$
5 - Miscellaneous Revenue 523.37$ 14,614.78$ 5,001.00$ (9,613.78)$ 5,000.00$ 1.00$ 2 - Other Misc Revenue 523.37$ 14,614.78$ 5,001.00$ (9,613.78)$ 5,000.00$ 1.00$
2 - Proceeds from Debt Issuance -$ -$ -$ -$ -$ -$ 4 - Miscellaneous Income 523.37$ 14,614.78$ 5,001.00$ (9,613.78)$ 5,000.00$ 1.00$
Grand Total 103,813.55$ 812,477.48$ 850,768.00$ 38,290.52$ 850,767.00$ 1.00$
10/9/2012 - 7:51 AM Sep-12 Financial Reporting Worksheet - Rev Pivot- 38 -