city of port angeles
DESCRIPTION
City of Port Angeles. Strategic Planning Presentation June 7, 2011. Presented by: Gary Saleba, President EES Consulting, Inc. A registered professional engineering corporation with offices in Kirkland, WA; Bellingham, WA; and Portland, OR - PowerPoint PPT PresentationTRANSCRIPT

1
City of Port Angeles
Strategic Planning PresentationJune 7, 2011
Presented by:
Gary Saleba, PresidentEES Consulting, Inc.
A registered professional engineering corporation withoffices in Kirkland, WA; Bellingham, WA; and Portland, OR
Telephone (425) 889-2700 Facsimile (425) [email protected]
2
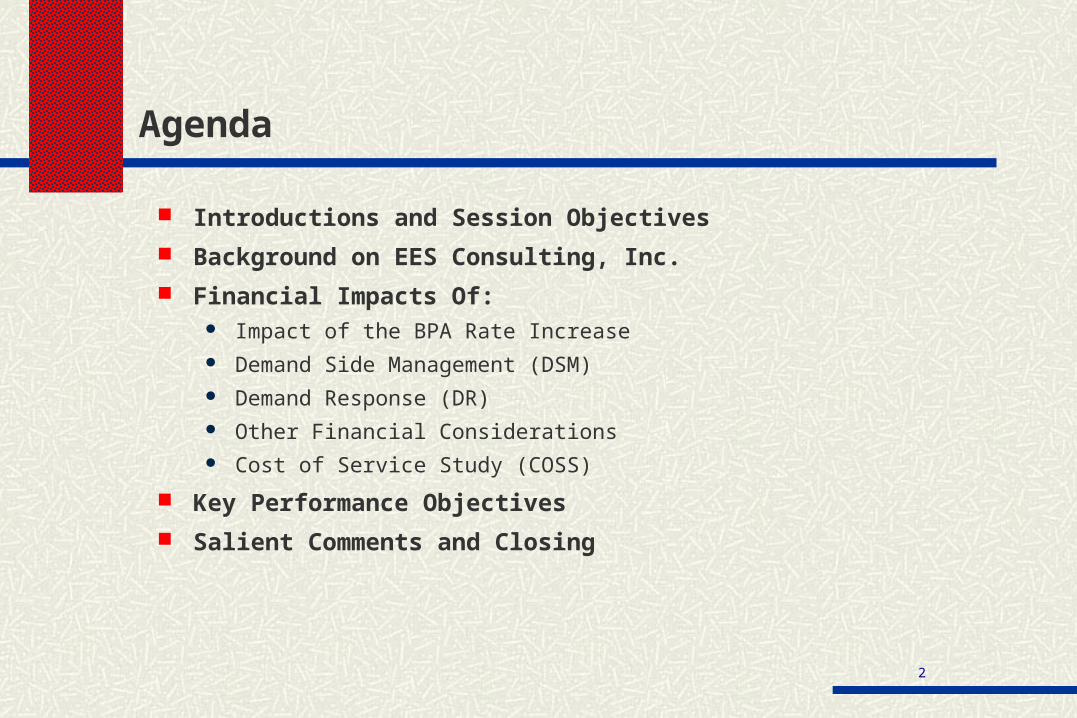
Agenda
Introductions and Session Objectives
Background on EES Consulting, Inc.
Financial Impacts Of: Impact of the BPA Rate Increase Demand Side Management (DSM) Demand Response (DR) Other Financial Considerations Cost of Service Study (COSS)
Key Performance Objectives
Salient Comments and Closing

3
About EES Consulting, Inc.
Registered Professional Engineering and Management Consulting Firm Formed in 1978 Offices in Bellingham, Kirkland, and Portland 30-40 Professional Staff – ½ Engineers, ½ Other Professionals Clientele Consists of Utilities, Large Industrial Customers, Regulatory
Commissions throughout North America Primary Lines of Business
Engineering design/construction management Resource and strategic planning Regulatory affairs/expert witness Rates / cost of service Demand side management
Background of EES Senior Consultants

4
Impact of New BPA Rates on the City
New TRM Rates from BPA Beginning October 2011 “Tier 1” rate for lower-cost federal power resources (HWM) “Tier 2” rate for new load growth at market rates New TRM demand charge priced at market prices
Charges the incremental demand above grandfathered amount (CDQ)
Load following charge Charges and credits based on difference between City energy use and BPA’s hydro /
thermal resource shape
Overall power supply increase estimated at 12% starting October 2011 Equates to at least a 6% retail rate increase Will be adjusted every two years going forward
Overall transmission rate change estimated at 0%

5
BPA Tiered Rate Methodology (TRM) Rates
TRM Includes a Large Flat Monthly Customer Charge (~90% of bill) in Addition to the Demand and Load Shaping Charges Below

6
Impact of BPA Rate Increase

7
Impact of New BPA Rates on the City
How to Deal with Growth Energy efficiency
Demand response
Everyone pays
New Large Single Load Policy
Financial Reserve Levels Significant power bill fluctuations (monthly variation up to $2 million) Existing rate stabilization fund Existing unrestricted cash balance

8
Electric Unrestricted Cash Balance

9
Demand Side Management
Demand Side Management has Two Primary Components: Energy efficiency
Demand response
The Target for Energy Efficiency could be to Keep the City’s Total Electricity Requirements Under HWM and Out of Tier 2
The Target for Demand Response could be to Control Peak Demand and Therefore Reduced TRM Demand Charges. Also Helps Reduce Capacity of Local Distribution Facilities.
Effective DSM Can Optimize Low-Cost Tier 1 Power from BPA and Reduced or Eliminate Demand Charges

10
Energy Efficiency
Objective – The Objective for Offering Energy Efficiency Programs is to Delay or Avoid the Need to Purchase Tier 2 or Market-Priced Electricity
In 2009 EES Consulting Completed an Energy Efficiency Potential Assessment to Determine the Amount and Cost of Energy Efficiency Available to the City
The potential assessment indicated that 0.34 aMW of energy efficiency is available per year from the residential and commercial sectors at $30/MWh
Another 0.4 – 0.5 aMW per year is available from the industrial sector
In 2012 a Conservation Plan Will be Required by BPA

11
Energy Efficiency– Strong Performance by City
Energy Efficiency Achievements FY07 - FY09
BPA-FundedBPA Funded
aMW2007
CustomersaMW/10,000
Customers
Cowlitz PUD 6.540 48,083 1.360
City of Port Angeles 1.088 10,623 1.024
Franklin PUD 0.917 21,299 0.431
Pend Oreille PUD 0.355 8,549 0.415
Richland 0.945 22,984 0.411
Lewis PUD 1.066 30,157 0.353
Tacoma Power 4.678 165,122 0.283
Snohomish PUD 8.540 315,437 0.271
Benton PUD 1.225 45,569 0.269
Inland Power 0.904 35,186 0.257
Clark PUD 3.958 180,043 0.220
Grays Harbor PUD 0.877 41,585 0.211
Clallam PUD 0.608 29,595 0.205
Mason PUD #3 0.536 31,940 0.168
Seattle City Light 5.178 383,127 0.135
TOTALS/AVG 37.415 1,369,299 0.273

12
Energy Efficiency– Summary
The City has a Strong History of Energy Efficiency Achievements Low cost, high impact programs to date The City is one of the leaders in terms of savings per customer
Effective Energy Efficiency Programs Can Further Delay the Need for Tier 2 Purchases, Subject to Any New Large Single Loads
The City has Significant Energy Efficiency Potential
Energy Efficiency Programs May Cause Upward Rate Pressure Initially Initial program and incentive costs ($500K - $1M) BPA to double funding in October 2011 City has spent $300,000/year of ratepayer funds each of the last 2 years Those who participate will pay less, even if rates increase In the long run, rates will be lower
Overall the City Can Serve More Customers with the Same kWh
13
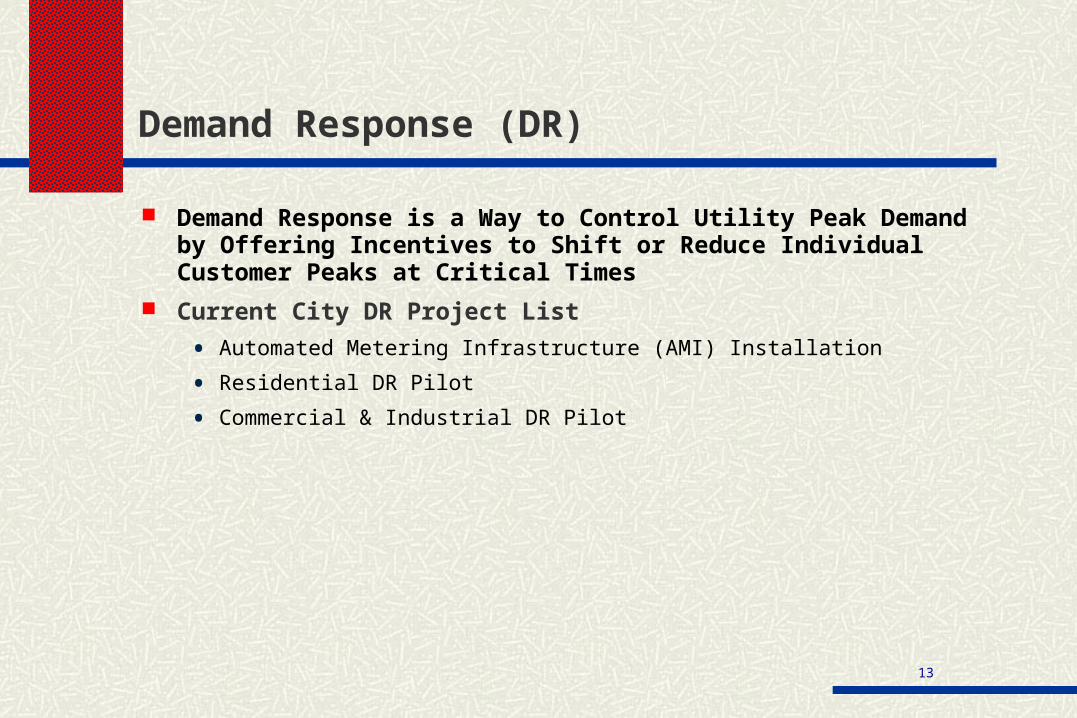
Demand Response (DR)
Demand Response is a Way to Control Utility Peak Demand by Offering Incentives to Shift or Reduce Individual Customer Peaks at Critical Times
Current City DR Project List
• Automated Metering Infrastructure (AMI) Installation
• Residential DR Pilot
• Commercial & Industrial DR Pilot

14
Demand Response (DR): Advanced Metering Infrastructure
Goals and Objectives
• To provide the City the ability to implement DR
Project Summary
• AMI installation the first step to implementation of DR
• City replacing all electric and water meters with AMI
• Installation to be complete by end of 2011
• Total project cost approximately $4.4 million
Project Status
• Installation currently under way
15
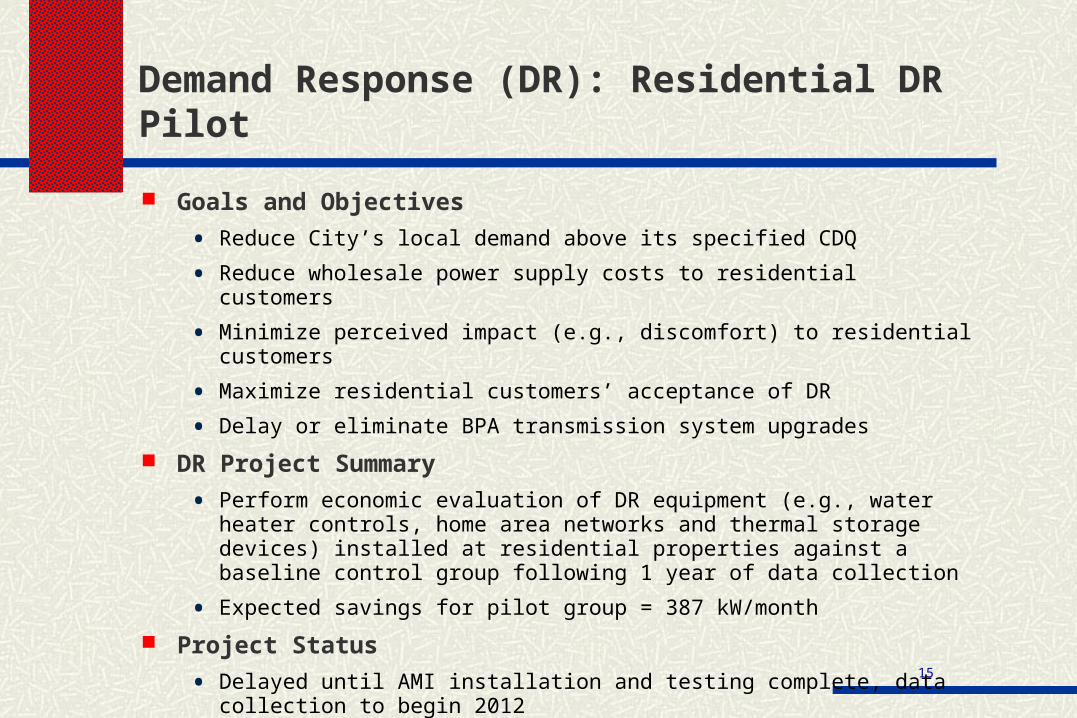
Demand Response (DR): Residential DR Pilot
Goals and Objectives
• Reduce City’s local demand above its specified CDQ
• Reduce wholesale power supply costs to residential customers
• Minimize perceived impact (e.g., discomfort) to residential customers
• Maximize residential customers’ acceptance of DR
• Delay or eliminate BPA transmission system upgrades
DR Project Summary
• Perform economic evaluation of DR equipment (e.g., water heater controls, home area networks and thermal storage devices) installed at residential properties against a baseline control group following 1 year of data collection
• Expected savings for pilot group = 387 kW/month
Project Status
• Delayed until AMI installation and testing complete, data collection to begin 2012
Project Co-Funding From BPA
• $426,000
16
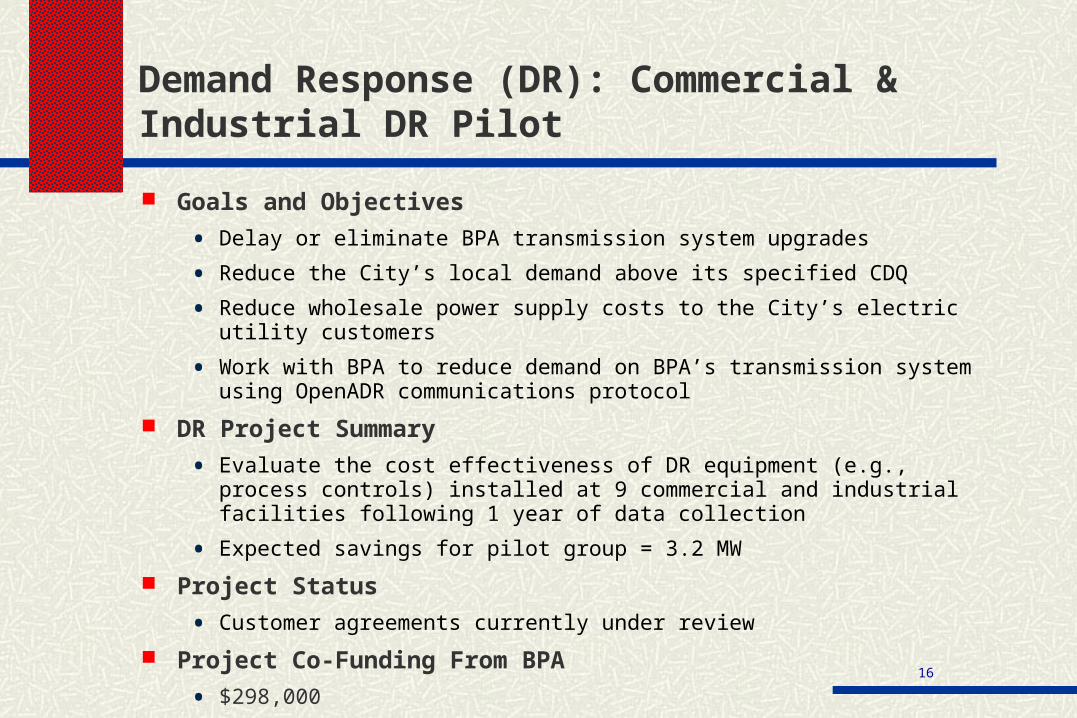
Demand Response (DR): Commercial & Industrial DR Pilot
Goals and Objectives
• Delay or eliminate BPA transmission system upgrades
• Reduce the City’s local demand above its specified CDQ
• Reduce wholesale power supply costs to the City’s electric utility customers
• Work with BPA to reduce demand on BPA’s transmission system using OpenADR communications protocol
DR Project Summary
• Evaluate the cost effectiveness of DR equipment (e.g., process controls) installed at 9 commercial and industrial facilities following 1 year of data collection
• Expected savings for pilot group = 3.2 MW
Project Status
• Customer agreements currently under review
Project Co-Funding From BPA
• $298,000

17
Demand Response (DR): Summary
The City has a Very Active DR Strategy Infrastructure is being built
Pilot studies underway
The AMI System will Enable the City to Better Optimize and Minimize Customer Peak Demand

18
Other Financial Considerations
Will The City Purchase the Fiber Optic Network?
19
Cost of Service Study (COSS) – TRM Study
Cost of Service Study – Performed in July 2010 Focus on TRM and Retail Rate Design NOT COSS Rates
Revenue requirement study showed - 5.3% increase needed 2.3% approved by City Council
Cost allocation showed – no major realignment needed However- does not take into account post-2011 power supply rates
Rate design goals Collection of fixed costs Cost based Price signals
TOU Demand rates

20
Cost of Service Study (COSS)
Seasonal Time-of-Use was the City Council Approved Rate Design for All Customer Classes (~200 commercial customers with demand rate)
Winter and summer seasons Customer base charge
Peak, shoulder, and off-peak energy charge
Inclining block demand rate (only applies to ~200 commercial customers)
Demand rate: 95% similar to current rates, 5% at new demand rate (avg. $9.5/kW)
Similar to City’s current Municipal water pump rate design
Sends Correct Price Signal Without too Much Complexity
Encourages Customers to: Shift loads to lower-priced off-peak hours
Reduces peak demand and winter energy consumption
Peak and Off-Peak Periods Should Reflect BPA’s Time of Use Periods Demand may be modified to reflect City’s requirements

21
Updated BPA Peak Hours, Off-Peak Hours, Shoulder Hours and Demand via 24-Hour Time Clock

22
Electric Rate Design Including Season Rates (Winter/Summer)

23
Financial Consider building operating reserves beyond minimums necessary
Energy Efficiency Cheapest option for load growth Continue pursuing cost effective programs
Demand Response Continue implementation Next is Pilot Program and evaluation
Rates Future rate increase should be applied only to the base charge to reduce
financial risk Develop New Large Single Load Policy Survey customers for interest in green energy rate options Conduct a cost of service analysis in 2013 after TRM is fully in place and 12
months AMI
Recommended Key Performance Objectives

24
Conclusions/Salient Comments
If it Was Easy, It Would Have Already Been Done
If You Don’t Do It, Someone Else Will
Better to Have No Business than Bad Business
Better to be Roughly Right, than Precisely Wrong