city of poulsbo, washington comprehensive annual financial ... · immigrants in the late...
TRANSCRIPT

City of Poulsbo, Washington
Comprehensive Annual Financial Report
For the fiscal year ended December 31, 2008

Cover Photo: 2008 marks the City’s Centennial Celebration. On the cover is a special City logo that
was created to symbolize the event. The statue of the “Viking” is located in Liberty Bay Park on the
waterfront of historic downtown Poulsbo. (A boardwalk takes walkers to neighboring American Legion
Park). The “Viking” is in memory of Maurice Lindvig, City Mayor from 1969 to 1976, and was constructed
in 1979 by Phillip Levine.

CITY OF POULSBO
WASHINGTON
COMPREHENSIVE ANNUAL
FINANCIAL REPORT
For the fiscal year ended
December 31, 2008
Finance Director
Deborah Booher

PREPARED BY
THE CITY FINANCE TEAM:
Finance Director
Deborah Booher
Accounting Manager
Jana Brown
Accounting Technician
Leticia Fee
Accounting Technician
Sandi Nannery
Accounting Technician
Sarah Salter
Accounting Technician
Linda Shaw
Accounting Technician
Kelly Ziemann
Accounting Clerk
Trina Lee
Administrative Assistant
Dawn Hamrick
For comments or questions, contact
City of Poulsbo, Finance Department
360.779.3901

CITY OF POULSBO INTRODUCTORY SECTION
2008 COMPREHENSIVE ANNUAL FINANCIAL REPORT i
TABLE OF CONTENTS
INTRODUCTORY SECTION PAGE
Letter of Transmittal ........................................................................................................................................ 1
GFOA Certificate of Achievement for Excellence in Financial Reporting ................................................... 11
Organization Chart ......................................................................................................................................... 12
City of Poulsbo Principal Officials ................................................................................................................ 13
FINANCIAL SECTION
Independent Auditor’s Report ........................................................................................................................ 15
Management’s Discussion and Analysis ........................................................................................................ 17
Basic Financial Statements
Government-Wide Financial Statements:
Statement of Net Assets .................................................................................................................... 33
Statement of Activities ...................................................................................................................... 34
Fund Financial Statements:
Balance Sheet – Governmental Funds .............................................................................................. 36
Reconciliation of Governmental Fund Balances to the Net Assets of Governmental Activities ...... 37
Statement of Revenues, Expenditures, and Changes in Fund Balances – Governmental Funds ...... 38
Reconciliation of the Statement of Revenues, Expenditures, and Changes in Fund Balances –
Governmental Funds to the Statement of Activities ................................................................. 39
Statement of Revenues, Expenditures, and Changes in Fund Balances – Budget and Actual:
General Fund ............................................................................................................................ 40
Statement of Net Assets – Proprietary Funds ................................................................................... 42
Statement of Revenues, Expenses, and Changes in Net Assets – Proprietary Funds ....................... 43
Statement of Cash Flows – Proprietary Funds .................................................................................. 44
Statement of Fiduciary Net Assets .................................................................................................... 46
Statement of Changes in Assets and Liabilities-Agency Fund ......................................................... 47
Notes to the Basic Financial Statements ................................................................................................. 49
Combining and Individual Fund Statements and Schedules
Governmental Funds:
Fund Descriptions ............................................................................................................................. 75
Combining Balance Sheet – Nonmajor Governmental Funds .......................................................... 78
Combining Statement of Revenues, Expenditures, and Changes in Fund Balances –
Nonmajor Governmental Funds ........................................................................................... 84
Statements of Revenues, Expenditures, and Changes in Fund Balance – Budget to Actual:
City Street Fund ................................................................................................................................ 91
Arterial Street Fund........................................................................................................................... 92

CITY OF POULSBO INTRODUCTORY SECTION
2008 COMPREHENSIVE ANNUAL FINANCIAL REPORT ii
Recreation Activity Fund .................................................................................................................. 93
FINANCIAL SECTION (continued)
Capital Improvement Fund ............................................................................................................... 94
Cumulative Reserve/Revenue Stabilization Fund ............................................................................. 95
Cumulative Reserve Fund ................................................................................................................. 96
Historic Downtown Poulsbo Association Fund ................................................................................ 97
Marine Science Center Fund ............................................................................................................. 98
Paths and Trails Reserve Fund .......................................................................................................... 99
Drug Enforcement Fund .................................................................................................................. 100
Transient Occupancy Tax Fund ...................................................................................................... 101
Police Restricted Fund .................................................................................................................... 102
Miscellaneous Governmental Debt Fund ........................................................................................ 103
Non-Voted General Obligation Debt Fund ..................................................................................... 104
Voted General Obligation Debt Fund ............................................................................................. 105
Local Improvement District Fund ................................................................................................... 106
Equipment Acquisition Fund .......................................................................................................... 107
Park Reserve Fund .......................................................................................................................... 108
Library Improvement Fund ............................................................................................................. 109
Recreation Reserve Fund ................................................................................................................ 110
Street Reserve Fund ........................................................................................................................ 111
Park Acquisition Fund .................................................................................................................... 112
Museum Reserve Fund .................................................................................................................... 113
Cemetery Reserve Fund .................................................................................................................. 114
City Street Equipment Reserve Fund .............................................................................................. 115
Facility Fund ................................................................................................................................... 116
Combining Statements – Internal Service Funds:
Fund Descriptions ........................................................................................................................... 117
Combining Statement of Net Assets – Internal Service Funds ....................................................... 119
Combining Statement of Revenues, Expenses and Changes in Fund Net Assets –
Internal Service Funds ....................................................................................................... 120
Combining Statement of Cash Flow – Internal Service Funds ....................................................... 121
STATISTICAL SECTION
Financial:
Net Assets by Component – Last Ten Fiscal Years ........................................................................ 125
Changes in Net Assets – Last Ten Fiscal Years .............................................................................. 126
Governmental Activities Tax Revenues by Source – Last Ten Fiscal Years .................................. 128
Fund Balances of Governmental Funds – Last Ten Fiscal Years ................................................... 129
Changes in Fund Balances of Governmental Funds – Last Ten Fiscal Years ................................ 130
General Governmental Tax Revenues by Source – Last Ten Fiscal Years..................................... 131
Revenue Capacity:
Assessed Value and Estimated Actual Value of Taxable Property – Last Ten Fiscal Years .......... 132
Property Tax Rates – Direct and Overlapping Governments – Last Ten Fiscal Years .................. 133
Principal Taxpayers – Current Year and Nine Years Ago .............................................................. 134

CITY OF POULSBO INTRODUCTORY SECTION
2008 COMPREHENSIVE ANNUAL FINANCIAL REPORT iii
STATISTICAL SECTION (continued)
Property Tax Levies and Collections – Last Ten Fiscal Years ....................................................... 135
Debt Capacity:
Ratios of Outstanding Debt by Type – Last Ten Fiscal Years ........................................................ 136
Ratios of General Bonded Debt Outstanding – Last Ten Fiscal Years ........................................... 137
Direct and Overlapping Governmental Activities Debt .................................................................. 138
Legal Debt Margin Information – Last Ten Fiscal Years ............................................................... 139
Pledged-Revenue Coverage – Last Ten Fiscal Years ..................................................................... 140
Demographic and Economic:
Demographic Statistics – Last Ten Fiscal Years ............................................................................ 141
Principal Employers – Current Year and Ten Years Ago ............................................................... 142
Operating:
Full-time Equivalent City Government Employees by Function .................................................... 143
Operating Indicators by Function – Last Ten Fiscal Years............................................................. 144
Capital Assets Statistics by Function – Last Ten Fiscal Years ....................................................... 146

CITY OF POULSBO INTRODUCTORY SECTION
2008 COMPREHENSIVE ANNUAL FINANCIAL REPORT iv
THIS PAGE INTENTIONALLY LEFT BLANK
CITY OF POULSBO INTRODUCTORY SECTION
2008 COMPREHENSIVE ANNUAL FINANCIAL REPORT Page 1
City of Poulsbo
June 30, 2008
To the Honorable Mayor Quade, City Council, and
Citizens of the City of Poulsbo
City of Poulsbo
Poulsbo, Washington
We are pleased to present the Comprehensive Annual Financial Report (CAFR) of the City of Poulsbo. This
report for the fiscal year ending December 31, 2008, reflects our intent to provide an organized,
comprehensive and informative presentation of the financial statements and other financial and statistical
data. We believe the information, as presented, is accurate in all material aspects; that it is presented in a
manner designed to set forth fairly the financial position and results of operations of the city as measured
and reported by the financial activity of its various funds; and that all disclosures, necessary to enable the
reader to gain an adequate understanding of the city’s financial affairs, have been included. Responsibility
for both the accuracy of the data, and the completeness and fairness of the presentation, including all
disclosures, rests with city management.
This report was prepared by the city’s Finance Department in accordance with generally accepted
accounting principles (GAAP) and is intended to provide sufficient information to permit the assessment of
stewardship and accountability, to demonstrate legal compliance, and to provide management control.
The Comprehensive Annual Financial Report is presented in three sections: introductory, financial and
statistical:
The introductory section includes this transmittal letter, the table of contents, our organizational chart and a
listing of principal officials, along with the Government Finance Officers Association (GFOA) Certificate
of Achievement for Excellence in Financial Reporting for the 2007 CAFR.
The financial section:
begins with the independent auditor’s report, followed by
Management’s Discussion and Analysis. The reader is then directed to
The Basic Financial Statements and Notes that provide an overview of the City’s financial position
and operating results. Presented next are
the Combining Statement for nonmajor funds; and concluding this section are
CITY OF POULSBO INTRODUCTORY SECTION
2008 COMPREHENSIVE ANNUAL FINANCIAL REPORT Page 2
other schedules that provide detailed information relative to the Basic Financial Statements
The statistical section, which is not audited, includes selected financial and demographic information
generally presented on a multiple year basis. This information depicts various trends, which have affected
the fiscal condition of the City over the last 10 years, and provides more general purpose statistical
information related to the City and its operations.
The City of Poulsbo’s financial statements have been audited by the Washington State Auditor’s Office.
The goal of the audit was to provide reasonable assurance the financial statements of the City of Poulsbo,
for the fiscal year ended December 31, 2008, are free of material misstatements. The independent auditor
concluded, based upon the audit, there was a reasonable basis for rendering an unqualified opinion the City
of Poulsbo’s financial statements are fairly presented in conformity with Generally Accepted Accounting
Principles (GAAP).
GAAP requires management provide a narrative introduction and an overview and analysis to accompany
the basic financial statements in the form of Management’s Discussion and Analysis (MD&A). This letter
of transmittal is designed to complement the MD&A and should be read in conjunction with it. The City of
Poulsbo’s MD&A can be found immediately following the report of the independent auditor.
Profile of Government
The City of Poulsbo is located in Kitsap County, west of Seattle. Originally settled by Norwegian
immigrants in the late 1800's on Liberty Bay, a fjord of Puget Sound, Poulsbo continues to maintain its
Scandinavian atmosphere through its architecture, celebrations and hospitality. Holding to its
Scandinavian heritage has earned the city the nickname "Little Norway" and visits from two Norwegian
Kings.
The City of Poulsbo has a strong Mayor form of government, organized under the Optional Municipal Code
as provided in State law. The Optional Municipal code confers a limited form of “home rule” to those
municipalities organized under this provision. The independently elected mayor is the executive officer of
the city and is responsible for all administrative transactions of the City, for overseeing the day-to-day
operations of the city, and for appointment of each of the seven department heads. The City Council is the
policy-making branch and is responsible for, among other things, passing ordinances, exercising legislative
and quasi-judicial functions, and adopting the budget. The seven members of the city council and mayor
serve four-year staggered terms, with four council positions up for election one year and then two years
later, the mayor and remaining the three council positions appear on the ballot.
To provide a full range of services to its citizens, the City of Poulsbo is divided into departments, financial
management and control systems. Services provided include: police protection; maintenance of water and
sewer services; garbage and recycling disposal; street maintenance, construction and repair of facilities and
assets; municipal court; land use administration, and general administration. The City designs and maintains
many parks and green spaces, coordinates recreation activities, fosters neighborhood livability and works to

CITY OF POULSBO INTRODUCTORY SECTION
2008 COMPREHENSIVE ANNUAL FINANCIAL REPORT Page 3
preserve the City’s environmental quality and historic legacy. Additional information may be found in the
notes to the financial statements, thus readers are encouraged to review this CAFR in its entirety.
2008 In Review
Celebrations throughout 2008 marked the City’s Centennial year. An opening events featuring historical
displays built the Poulsbo Historical Society, a grand opening of Centennial Park and a street dance were a
few of the events which brought citizens to celebrate the City’s 100th birthday.
For the City of Poulsbo, the year 2008 was a year focused on long range planning, including updates of the
City’s Comprehensive Plan and all functional plans while progressing on its own design for a New City
Hall.
The City diligently moved forward with a draft of an updated Comprehensive Plan. The process began with
several community meetings to inform the public of the process and gather feedback for the desired long
range plan of the City. From these meetings a complete draft was released including a substantially updated
Capital Facilities chapter. At the end of 2008, meetings with the Planning Commission commenced
including joint meetings with the City Council. Included in the process were updates to the City’s
functional plans including City utilities, transportation and City Parks. . These plans will detail the City’s
long range vision and necessary infrastructure to support the vision and anticipated growth. The process
will continue with final adoption anticipated in 2009.
New retail stores continued to develop in the College Market Place Development. In 2008, Office Max
opened their doors and a Petco was substantially completed with an anticipated opening in early 2009.
There are many parcels available in the 215 acre College Market Place Development, resulting in
anticipated growth in both retail and multi-family development.
With the vision of growth on the horizon, the City Council strategically moved forward with two major
decisions.
The first major decision was to develop a New City Hall in the historic downtown, following the citizen’s
choice to build a City Hall within the downtown core. An interlocal agreement was entered into with Kitsap
Consolidated Housing Authority to provide project management. Two parcels of land on 3rd
Avenue and
Moe were purchased by the City for the downtown location. A contract with Lewis Architects was
approved by the City Council for design. Substantial design was completed in 2008 with advertising for
bids expected in early 2009. The City plans to issue debt in 2009 for the City Hall project.
The second project was the Council’s decision to sell a large parcel of land on 10th Avenue to a local
hospital to develop a new Medical Center. The center will provide services for radiation and medical
oncology, primary care, urgent care, and diagnostic imaging. Closing is anticipated in early 2009 with
permitting and planning processes beginning shortly thereafter. The center will provide a much needed
center at the west end of the county allowing citizens the option of local treatment.
As the challenge of providing more services with fewer resources continues, the City’s Management team
has done an excellent job of using resources efficiently. One benefit of a professional staff is their ability to

CITY OF POULSBO INTRODUCTORY SECTION
2008 COMPREHENSIVE ANNUAL FINANCIAL REPORT Page 4
seek grants and other alternative funding sources for City improvements. With our limited tax base, grants
and community participation are some of the ways we can accomplish goals we may not have otherwise
been able to attain.
Other Projects
Major projects started or completed during 2008 include:
1. State Route (SR) Hwy 305 Project:
This $20 million project is primarily a
State Department of Transportation
project that added two HOV lanes as
well as installing additional turning
lanes at the cross street intersections.
The project will increase capacity of the
SR 305 corridor from 20,000 to 35,000
vehicles per day. Consequently, the
project will increase mobility and safety
along this corridor. When the citizen
sponsored Initiative 695 severely
reduced funding for various State
transportation projects, the scope of this
particular project was reduced. In response the City went out and successfully secured
approximately $12 million in various grant and developer funds to return the project back to its
original scope. The City will be managing the $3.5 million Transportation Improvement Board
grant. The project began in 2007, and was completed in 2008. As part of the project, the City
completed the design and replacement of the 7th Avenue culvert and road expansion. The road
allows additional access points for SR 305, helping with the traffic flow through the City.
2. Poulsbo Fish Park Restoration:
With the acquisition of 13 acres at the head
of Liberty Bay, along the Dogfish Creek
Estuary, plans for development of the site
into Poulsbo’s Fish Park are underway. The
Master Plan for development of the site was
completed in 2004. The plan calls for
public access trails, interpretive areas,
restoration of the estuary, wildlife viewing,
and educational opportunities. Planned
public access into wildlife areas is important
to the survival of the vegetation and
wildlife. In conjunction with the City,
volunteers have helped with construction of
CITY OF POULSBO INTRODUCTORY SECTION
2008 COMPREHENSIVE ANNUAL FINANCIAL REPORT Page 5
the public access trails, viewing platforms, interpretive signs, pedestrian bridges, about 1 mile of
compacted gravel trails, stream re-direction, and restoration plantings. A local artist and other
community businesses volunteered time and materials to create a welcoming piece of art featuring a
carving of a fish from a rock at the entrance to the newly developed parking area. In 2008 local
service groups volunteered time and materials to construct a boardwalk to increase pedestrian trails
and access to further points of the park. Parking lot improvements and continued trail
development also continued into 2008. This project is being partially funded with grants from the
Interagency Committee for Outdoor Recreation (IAC) and the Salmon Board Recovery Fund
(SRFB).
3. Viking Avenue: Preliminary design work started in 2008 for both the north and south end of
Viking Avenue. The plan is to widen the road, providing sidewalks, bike lanes and improving the
drainage. Federal grants were received to help fund the design of the project. The construction of
the project is not anticipated to begin for several years.
4. North Kitsap Regional Event Center: This project partnered the City with North Kitsap School
District, Kitsap County and the Public Facilities District to update the High School Stadium and
Strawberry Fields with artificial turf and provided lights at Strawberry Field to provide additional
fields to aid the current demand for local playing fields. With the fields completed many local
organizations have been putting the fields to heavy use as they are available beyond the daylight
hours.
5. Vinland Community Fields: The city partnered with North Kitsap School District and the Vinland
Elementary PTA to develop the playing fields at Vinland Elementary School. These fields provide
more opportunities to aid in the demand from local organizations for field availability.
6. Betty Iverson Kiwanis Park Playground: The last
playground in the city to be replaced was completed in
September. This playground is universally accessible,
with a ramp for wheelchair access. The Poulsbo
Kiwanis Club volunteered time and labor to the
playground for the park.
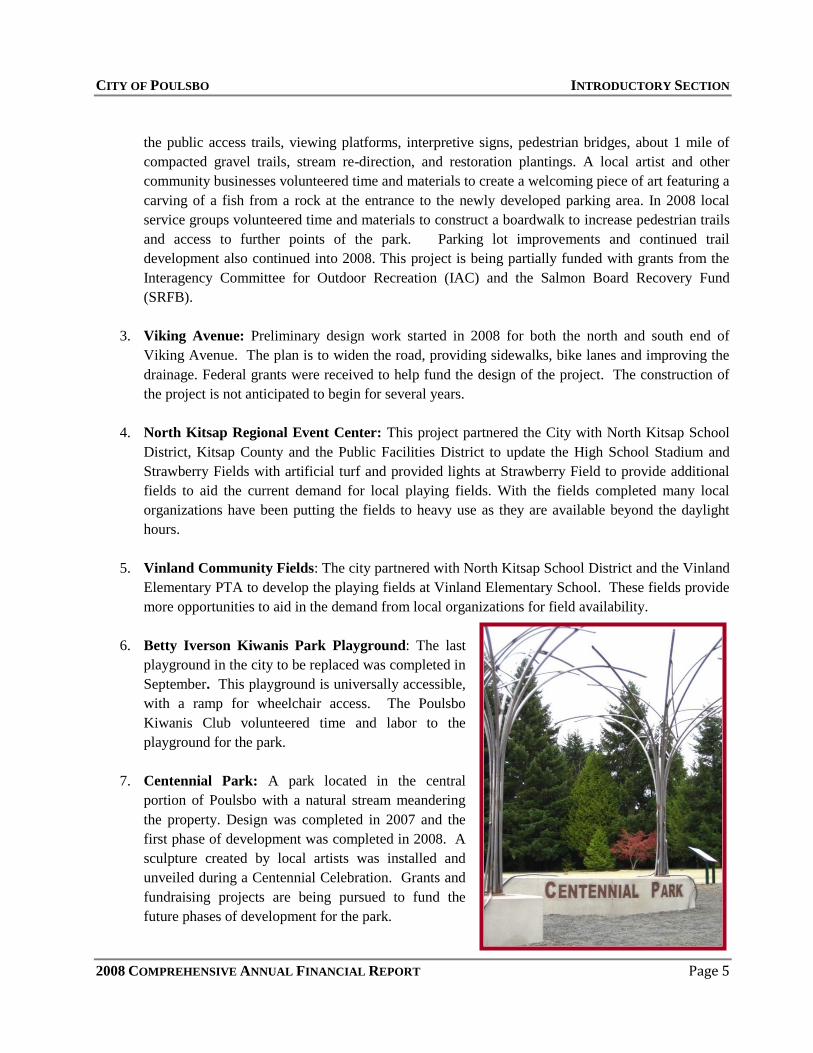
7. Centennial Park: A park located in the central
portion of Poulsbo with a natural stream meandering
the property. Design was completed in 2007 and the
first phase of development was completed in 2008. A
sculpture created by local artists was installed and
unveiled during a Centennial Celebration. Grants and
fundraising projects are being pursued to fund the
future phases of development for the park.

CITY OF POULSBO INTRODUCTORY SECTION
2008 COMPREHENSIVE ANNUAL FINANCIAL REPORT Page 6
65906445 6500
6965 7005 70107200
7450 74907560
7840
5000
5500
6000
6500
7000
7500
8000
City of Poulsbo
Population
8. Public Works Property: A large parcel of flat land was purchased in 2008 for the future site of a
Public Works facility. The goal is to get vehicles and related utility and transportation maintenance
functions out of the center of the City and to a more accessible location with less environmental
impact. In 2009 the City is planning to locate transfer trailers for solid waste and contract with a
local disposal company to transport the trailers and eliminate the multiple daily trips with the
garbage trucks to the land fill at the south end of the county, a substantial distance from the City.
9. Sewer Infiltration and Inflow Project: The sewer fund is phasing improvements over several
years to the drainage basins to reduce the inflow of liquids to the sewer lines. These improvements
will reduce the infiltration of rain water and run off into the sewer system thereby reducing the cost
and amount to be processed by the sewage plants.
Economic Condition and Outlook
More and more, people are deciding that
Poulsbo and the surrounding area is a great
place to live and work. Additionally, the
City has become a very popular place for
development. The City acknowledges its
responsibility to respond to growth and has
adopted all development regulations, which
are called for by state law to protect its
environment and quality of life. The City
continues to review and revise these
regulations based on experience ratios.
Three military bases are located in Kitsap
County; Bremerton's Puget Sound Naval
Shipyard, Naval Submarine Base Bangor and
Keyport's Naval Undersea Warfare Center. With a population of 7,840 many of Poulsbo's residents are
employed at one of the federal bases or commute to metropolitan Seattle by ferry. In addition, Poulsbo has
a large and active senior citizen population.
Washington State’s Growth Management Act has been in place for more than 15 years. It is expected that
most future growth will take place in the designated urban growth areas for which cities are the primary
service providers. It is projected that Poulsbo's surrounding area population will increase by more than
7,000 to have a population over 14,000 by 2020.
Centrally located in the heart of Poulsbo, the downtown area has maintained its history and many of the
original buildings have been renovated. Graced with a photographic waterfront parkway and boardwalk,
the area invites tourists to shop and spend an afternoon or weekend. Poulsbo's waterfront is active year
round and a favorite destination for day excursions and vacationing boaters.
In 1998, the City approved a master plan for redevelopment of a 31-acre residential section of the
downtown area known as "the Project". The project earned its name when homes were built during World
War II to provide housing for government workers. These dilapidated houses were demolished in 1999,
CITY OF POULSBO INTRODUCTORY SECTION
2008 COMPREHENSIVE ANNUAL FINANCIAL REPORT Page 7
accounting for the drop in the City’s population that year. The project has earned three awards from the
State’s Master Builders Association including “Community of the Year” and “Best Community Land Use”.
The approved master plan calls for a residential village that complements and enhances the downtown
district. The first phase, of 164 residential units, includes small cottages, cottage clusters, single-family
residences, and luxury view-oriented town homes. Phase I was completed in 2004 and the second phase
began in 2006. The project’s second phase includes 140 single family homes, and a small number of live-
work units. The goal is for this master-planned community to expand our walkable downtown core,
provide community living and provide a combined residential commercial option. Some of the units were
completed and inhabited by both residences and small businesses throughout 2007. Phase 2 of the project
has continued into 2008, but with the economic slowdown in the housing market, this phase has slightly
slowed and will continue to develop in the coming year, with the anticipation of improvement in the
market.
In 1994, 215 acres of undeveloped property was annexed in the City. The Olhava Master Plan is a phased
development over a ten-year period. The master plan includes 840,000 square feet of commercial
buildings, a 325,000 square foot business park, 70 single-family units and 420 multi-family residents and
ball fields. Developers also donated 20 acres to the Olympic Community College, which built a satellite
campus in 2004. The college offers the latest in technology such as satellite classes and video conferencing
to enhance the educational opportunities. The development now carries the name, "College Market Place."
Two anchor stores, Wal-Mart and Home Depot opened their doors in January 2006. Several other
businesses soon followed opening in adjacent strip malls. The area is continuing to develop with First
Security Bank and Office Maxx opening in 2008 and a new Petco opening their doors in early 2009. This
project is a huge investment of private dollars into the community.
State Highway 305 runs through the east side of Poulsbo providing access to the Bainbridge Island/Seattle
ferry, which is twelve miles to the south. In 2008 the widening and HOV lanes were completed on this main
highway through the City. This has greatly helped with the commuting congestions for better access
through the City.
“Poulsbo Village” is situated just off State Hwy 305 on the east side of the City. In years past, this was an
agricultural area for Poulsbo; however, today it is a lively business community. The “Village” began with a
shopping mall containing retail stores, offices, an athletic club and medical facilities and has now grown
into a commercial area on both sides of State Highway 305 and has established itself with a healthy
customer base.
Boxlight, manufacturer of projectors, is a Fortune 500 company, and has a six building commercial campus
park located on Lincoln Hill, east of State Highway 305. This project transformed an old gravel pit into a
contemporary business park with a spectacular view of the Olympic Mountains. The campus continues to
attract companies that provide family wage jobs for professionals who prefer not to commute to the Seattle
area.
It is anticipated in 2009, Harrison Hospital will begin development of a new medical facility on the west
side of the highway. This will allow access to a state of the art medical facility for emergency services and
cancer treatment. The preliminary plans are anticipated to be submitted in 2009 to begin the development.

CITY OF POULSBO INTRODUCTORY SECTION
2008 COMPREHENSIVE ANNUAL FINANCIAL REPORT Page 8
Economic development appears to be filtering into all areas of the City. The City encompasses over 2600
acres and for economical analysis and contrasting purposes is divided into four geographical areas:
Central Downtown Poulsbo – the Historic area and waterfront
West Side Junction Area – Viking Avenue Corridor
East Side State Highway 305 and Lincoln Hill
Northwest Corner College Market Place
The 2003 State Legislation prompted renewed activity in property owner generated annexations. Since
2003 the City has approved 15 annexations totaling just under 800 acres. The City has annexed
approximately 65% of its Urban Growth Area. This represents a 35% expansion in the City’s acreage over
the last several years. The annexed areas are primarily residential with one exception, a business park and
nursery on the corner of State Highway 305 and Bond Road. A moratorium was put in place by the Council
in 2008. This was a method for the City Council to take pause and evaluate in conjunction with a task force
the best policy for the City to follow in order to provide services for the areas being annexed to the City.
The moratorium has now been lifted and there has been continued interest from landowners for annexation
of their properties.
The City of Poulsbo continues to promote smart growth with new businesses coming into the area and
providing local employment as well as maintaining our “small town” atmosphere. We feel government,
citizens, and developers working together can successfully accomplish the goal of making Poulsbo the
premier place to live and work on the Kitsap Peninsula.
Cash Management
Careful financial control of the City’s daily operations is an important part of Poulsbo’s overall fiscal
management program. Achieving adequate cash management and investment control requires sound
financial planning to ensure that sufficient revenues are available to meet the current expenditures of any
one operating period.
The City has adopted a Financial Management Policy, which requires the Fund Balance to be in excess of
8% of the operating revenues and the cash and investment balances to be in excess of 3 months of operating
expenses. These items are reviewed quarterly with Council Members.
Once steps are taken to ensure that the City maintains a protected cash position in its daily operations, it is
to the City’s advantage to prudently invest idle funds until such time as they are required to make
expenditures according to the following guidelines:
The City’s idle cash will be invested on a continuous basis in accordance with the City’s adopted
investment policies.
The City has and will maintain a formal investment policy that is reviewed and endorsed by national
professional financial organizations.
CITY OF POULSBO INTRODUCTORY SECTION
2008 COMPREHENSIVE ANNUAL FINANCIAL REPORT Page 9
The City will invest all funds (in excess of current requirements) based upon the following order of
priority: 1) Legality, 2) Safety, 3) Liquidity and yield.
Investments with City funds will not be made for purposes of speculation.
The City is prohibited from investing in any financial instruments that are not approved for legal
investments for municipalities in the State of Washington.
Proper security measures will be taken to safeguard investments. The City’s designated banking
institution will provide adequate collateral to insure City funds.
Risk Management
During 2008, the City continued its liability and property coverage as a member of the Association of
Washington Cities Risk Management Service Agency. The City continues to take advantage of the risk
management training offered though AWC/RMSA education programs. The City’s industrial insurance is
provided by Washington State and is administered by the Department of Labor and Industries. Coverage is
purchased by means of standard State assessed rates per working hour which are computed using risk
categories as well as the City’s loss history.
Awards
The City of Poulsbo has committed itself to financial excellence for many years as experienced by the
receipt of the Government Finance Officers Association (GFOA) Certificate of Achievement for Excellence
in Financial Reporting as well as the Distinguished Budget Presentation award. Commitment to the
residents of the City of Poulsbo has always been full disclosure of the financial position of the City.
The City has received the Distinguished Budget Presentation award for several years, including the 2008
Budget.
The Government Finance Officers Association of the United States and Canada (GFOA) awarded a
Certificate of Achievement for Excellence in Financial Reporting to the City of Poulsbo, Washington for its
Comprehensive Annual Financial Report (CAFR) for the fiscal year ended December 31, 2007.
In order to be awarded a Certificate of Achievement a governmental unit must publish an easily readable
and efficiently organized CAFR that conforms to program standards. Such reports must satisfy both
generally accepted accounting principles and applicable legal requirements.
A certificate of Achievement is valid for a period of one year only. We believe our current report continues
to conform to the requirements and standards of the Certificate of Achievement Program, and we are
submitting the 2008 Comprehensive Annual Financial Report to the GFOA for review. The Certificate of
Achievement is the highest form of recognition in the area of Governmental Financial Reporting, and its
award represents significant accomplishment by a government and its management.
Acknowledgements
CITY OF POULSBO INTRODUCTORY SECTION
2008 COMPREHENSIVE ANNUAL FINANCIAL REPORT Page 10
The preparation of this Comprehensive Annual Financial Report represents the culmination of months of
collaborative teamwork by the entire staff of the Finance Department. The preparation of this report could
not have been accomplished without the professional, efficient and dedicated staff of the Finance team and
to each member I extend my sincere appreciation, in particular to our Accounting Manager, Jana Brown,
who manages the CAFR preparation.
Further appreciation is also offered to the City’s management team, the Mayor, and the City Council for
their encouragement, interest and support in conducting the financial operations of the City in a sound and
progressive manner. In addition, I would express thanks to the efficient assistance of our local auditor from
the Washington State Auditor’s Office.
Respectfully submitted,
Deborah Booher
Finance Director

CITY OF POULSBO INTRODUCTORY SECTION
2008 COMPREHENSIVE ANNUAL FINANCIAL REPORT Page 11

CITY OF POULSBO INTRODUCTORY SECTION
2008 COMPREHENSIVE ANNUAL FINANCIAL REPORT Page 12
City of Poulsbo
Citizens
Mayor &
City Council
General Government
City Clerks Dept.
Jill Boltz
Finance Dept.
Deborah Booher
Municipal Court
Judge Tolman
Human Resources
Deanna Kingery
Information Services
Tim Treacher
Security of Persons & Property
Police Dept.
Dennis Swiney
EMS
Physical & Environment
Planning Dept.
Barry Berezowsky
Engineering
Barry Loveless
Culture & Recreation
Parks & Recreation
Mary McCluskey
Parks Capital Projects
Recreation Projects
Pre-School Programs
Grant Writing
Public WorksBarry Loveless
Parks/Cemetery/Facilities/Library
Utilities
Water/Sewer
Solid Waste
Storm Water
General Facilities
Boards &
CommissionsCity Attorney
City of Poulsbo Organization Chart

CITY OF POULSBO INTRODUCTORY SECTION
2008 COMPREHENSIVE ANNUAL FINANCIAL REPORT Page 13
City of Poulsbo Officials As of December 31, 2008
Mayor
Kathryn Quade December 31, 2009
City Council
Kimberlee Crowder December 31, 2009
Dale Rudolph December 31, 2009
Ed Stern December 31, 2009
Becky Erickson December 31, 2011
Linda Berry-Maraist December 31, 2011
Connie Lord December 31, 2011
Jeff McGinty December 31, 2011
Executive Staff and Legal Counsel
City Clerk Jill Boltz
Finance Director Deborah Booher
Parks & Recreation Director Mary McCluskey
Planning Director Barry Berezowsky
Police Chief Dennis Swiney
Public Works Director Barry Loveless
Municipal Judge Jeffrey Tolman
Prosecutor Kitsap County Prosecutor
City Attorney Jim Haney, Ogden Murphy Wallace
Bond Attorney Preston Gates and Ellis
CITY OF POULSBO INTRODUCTORY SECTION
2008 COMPREHENSIVE ANNUAL FINANCIAL REPORT Page 14
THIS PAGE INTENTIONALLY LEFT BLANK

Washington State Auditor Brian Sonntag
INDEPENDENT AUDITOR'S REPORT
June 30, 2009
Council City of Poulsbo Poulsbo, Washington
We have audited the accompanying financial statements of the governmental activities, the business-type activities, each major fund, and the aggregate remaining fund information of the City of Poulsbo, Kitsap County, Washington, as of and for the year ended December 31, 2008, which collectively comprise the City's basic financial statements as listed in the table of contents. These financial statements are the responsibility of the City's management. Our responsibility is to express opinions on these financial statements based on our audit.
We conducted our audit in accordance with auditing standards generally accepted in the United States of America and the standards applicable to financial audits contained in Government Auditing Standards, issued by the Comptroller General of the United States. Those standards require that we plan and perform the audit to obtain reasonable assurance about whether the financial statements are free of material misstatement. An audit includes examining, on a test basis, evidence supporting the amounts and disclosures in the financial statements. An audit also includes assessing the accounting principles used and significant estimates made by management, as well as evaluating the overall financial statement presentation. We believe that our audit provides a reasonable basis for our opinions.
In our opinion, the financial statements referred to above present fairly, in all material respects, the respective financial position of the governmental activities, the business-type activities, each major fund, and the aggregate remaining fund information of the City of Poulsbo, Kitsap County, Washington, as of December 31, 2008, and the respective changes in financial position and, where applicable, cash flows thereof, and the budgetary comparison for the General Fund for the year then ended in conformity with accounting principles generally accepted in the United States of America.
As described in Note 12, during the year ended December 31, 2008, the City implemented the Governmental Accounting Standards Board's Statement 45, Accounting and Financial Reporting by Employers for Postemployment Benefits Other Than Pensions, and Statement 50, Pension Disclosures-an amendment of GASB Statements No. 25 and No. 27.
Insurance Building, PO Box 40021 • Olympia, Washington 98504-0021 • (360) 902-0370 • (866) 902-3900 • TDD Relay (800) 833-6388 FAX (360) 753-0646 • http://www.sao.wa.goY
In accordance with Government Auditing Standards, we will also issue our report dated June 30, 2009, on our consideration of the City's internal control over financial reporting and on our tests of its compliance with certain provisions of laws, regulations, contracts, and grant agreements and other matters. The purpose of that report is to describe the scope of our testing of internal control over financial reporting and compliance and the results of that testing, and not to provide an opinion on the internal control over financial reporting or on compliance. That report is an integral part of an audit performed in accordance with Government Auditing Standards and should be considered in assessing the results of our audit.
The management's discussion and analysis on pages 17 through 31 and information on postemployment benefits other than pensions on page 73 are not a required part of the basic financial statements but are supplementary information required by the Governmental Accounting Standards Board. We have applied certain limited procedures, which consisted principally of inquiries of management regarding the methods of measurement and presentation of the required supplementary information. However, we did not audit the information and express no opinion on it.
Our audit was performed for the purpose of forming opinions on the financial statements that collectively comprise the City's basic financial statements. The accompanying information listed as combining and individual fund statements and schedules on pages 75 through 121 is presented for purposes of additional analysis and is not a required part of the basic financial statements. This information has been subjected to auditing procedures applied in the audit of the basic financial statements and, in our opinion, is fairly stated, in all material respects, in relation to the basic financial statements taken as a whole.
The information identified in the table of contents as the Introductory and Statistical Sections is presented for purposes of additional analysis and is not a required part of the basic financial statements of the City. Such information has not been subjected to the auditing procedures applied in the audit of the basic financial statements and, accordingly, we express no opinion on it.
Sincerely,
BRIAN SONNTAG, CGFM STATE AUDITOR

CITY OF POULSBO FINANCIAL SECTION
2008 COMPREHENSIVE ANNUAL FINANCIAL REPORT Page 17
MANAGEMENT’S DISCUSSION AND ANALYSIS
Management’s Discussion and Analysis (MD&A) of the City of Poulsbo’s financial performance provides
an overall review of the City’s financial activities for the year ended December 31, 2008. The intent of this
discussion and analysis is to look at the City’s financial performance as a whole.
This Management’s Discussion and Analysis (MD&A) combined with the Transmittal Letter, the Financial
Statements and the Notes to the Financial Statements represent the complete 2008 financial activities for the
City of Poulsbo.
These are all intended to:
Assist the reader in focusing on significant financial issues
Provide an overview of the City’s financial activity
Identify changes in the City’s financial position
Identify any material deviations from the financial plan and adopted annual budget
Identify individual fund issues or concerns
FINANCIAL INFORMATION
The City’s government wide financial statements have been prepared on the full-accrual basis of accounting
in conformity with generally accepted accounting principles (GAAP). The City’s Fund Financial
Statements for governmental funds have been prepared on the modified accrual basis in conformity with
GAAP. The City’s proprietary funds are accounted for the on the full-accrual basis.
The City of Poulsbo’s financial system integrates financial and administrative controls that ensure the
safeguarding of assets and the reliability of financial reports. These controls are designed to provide:
Reasonable assurance that transactions are executed in accordance to management understanding
and approval
Reasonable assurance that transactions are executed in accordance to GAAP principles
Accountability for control of assets and obligations
Assurance that sufficient reporting and review exists to provide adequate information for analysis
and comparability of data
Internal control is a high priority for the City. The Washington State Office of the Auditor (SAO) reviews
the City’s internal controls, and the City receives and takes action on all recommendations made by SAO.
FINANCIAL HIGHLIGHTS
City of Poulsbo assets exceeded its liabilities at the close of the 2008 fiscal year by $85 million (net
assets). Of this amount $16.7 million (unrestricted net assets) may be used to meet the city’s
ongoing obligations to its citizens and creditors.
Reported net assets increased $15.1 million. Net assets of governmental activities increased $5.9
million, or 17.3%, during 2008. Net assets of business-type activities increased $9.2 million, or
25.1%, during 2008. Much of the increase is the construction of City projects including the land
purchase and preliminary design and site work costs for a new City Hall, but also a large amount is

CITY OF POULSBO FINANCIAL SECTION
2008 COMPREHENSIVE ANNUAL FINANCIAL REPORT Page 18
due to contributed capital from several developers and a substantial amount from a retail
development.
Investments in capital assets net of debt, increased $19.7 million. This is primarily due to an
increase in the amount of Capital Assets from Contributed Capital from a large retail development.
Total liabilities decreased by $2.7 million. A large portion of the decrease is due to decreasing
outstanding debt and exercising a 5 year call for $600,000 of General Obligation Debt with
proceeds reserved from mitigation funds.
Overall, the book value of capital assets increased by $17.5 million. Total capital assets from
governmental activities increased $8,596,981 or 21.84%. Capital assets of business-type activities
increased $8,920,051 or 22.77%.
City governmental fund tax revenue has increased an average of 10.21% per year for the last five
years.
At the close of the current fiscal year, the City’s governmental funds reported combined ending
fund balances of $7.2 million. Approximately 97% of this total amount, or $7 million, is available
for spending at the government’s discretion (unreserved fund balance). 84% or $6 million of the
ending fund balances are recorded in the City’s Special Revenue and Capital Project funds.
At the end of the current fiscal year, the unreserved fund balance for the General Fund was
$988,024 or 10% of the total General Fund expenditures. It should also be noted that the Special
Revenue Fund, “Cumulative Reserve/Revenue Stabilization Fund,” is also used to reserve funds for
General Fund purposes. The combined unreserved fund balances for the General Fund and the
Cumulative Reserve/Revenue Stabilization Fund total $2.7 million, or 28% of the General Fund
expenditures.
OVERVIEW OF THE FINANCIAL
STATEMENTS
This discussion and analysis provides an
introduction and overview to the City of
Poulsbo’s basic financial statements. The basic
financial statements are comprised of three
components.
Government-wide Financial Statements
Fund Financial Statements
Notes to the Financial Statements
This report contains other supplementary information in addition to the basic financial statements, including
combining statements for non-major funds, budget to actual comparisons and statistical tables.
Financial statements focus on both the City as a whole (government-wide) and on major individual funds.
Both perspectives allow the user to address relevant questions, broaden a basis for annual comparisons and
enhance the City’s accountability. A graphic is provided to illustrate the composition of the reports.
•Management Discussion and Analysis (required supplementary information)
MD&A
•Government-Wide Finanical Statements
•Notes to Financial Statements
Basic Financial Statements
•Required Supplementary Information (other than MD&A)
Other Required Supplementary
Information

CITY OF POULSBO FINANCIAL SECTION
2008 COMPREHENSIVE ANNUAL FINANCIAL REPORT Page 19
Government-Wide Financial Statements
The government-wide financial statements are designed to provide readers with a broad overview of the
City of Poulsbo’s finances, in a manner similar to a private-sector business. The statements include all
assets and liabilities using the full accrual basis of accounting recognizing revenues and expenses in the
current year regardless of when the cash transaction occurred.
The Statement of Net Assets presents information on all the City’s assets and liabilities, with the
difference between the two reported as net assets. The Statement of Net Assets serves a purpose similar to
that of the Balance Sheet of a private-sector business. Over time, increases or decreases in net assets may
serve as a useful indicator of whether the financial position of the city is improving or deteriorating.
The Statement of Activities focuses upon both the gross and net cost of various activities that are provided
by the government’s general tax and other revenues. This is intended to summarize and simplify the user’s
analysis of cost to various governmental services and/or subsidy to various business-type activities. By
separating program revenue from general revenue, users of the financial statements can identify the extent
to which each program relies on taxes for funding.
In the Statement of Net Assets and the Statement of Activities, the City activities are divided into two
categories:
Governmental Activities - Most of the City’s basic services are reported here, including the police,
facilities, parks, planning, engineering and general administration. Taxes (property, sales, and
utility) and intergovernmental revenues finance most of these activities.
Business-Type Activities - The City charges a fee to customers to help cover all or most of the costs
of certain services provided. The City charges fees to recoup the cost of the operations of water
and sewer, storm drain, and solid waste utilities as well as all capital and debt expenses associated
with the individual utility.
Fund Financial Statements
Traditional users of governmental financial statements will find the Fund Financial Statements presentation
more familiar. The focus is on Major Funds rather than types. A Major Fund has three elements as defined
by GASB 34.
Total assets, liabilities, revenues, or expenditures/expenses of that individual governmental
or enterprise funds are at least ten percent (10%) of the corresponding total (assets,
liabilities, etc) for all funds of that category or type (i.e. governmental, proprietary , or
fiduciary); and
Total assets, liabilities, revenues, or expenditures/expenses of the individual government
fund or enterprise funds are at least five percent (5%) of the corresponding total for all
governmental and enterprise funds combined; or
Any other governmental or enterprise fund that the government’s officials believe is
particularly important
Governmental Funds: Governmental Funds are used to account for essentially the same functions reported
as governmental activities in the Government-wide Financial Statements. The focus of governmental Fund

CITY OF POULSBO FINANCIAL SECTION
2008 COMPREHENSIVE ANNUAL FINANCIAL REPORT Page 20
Financial statements is on near-term inflows and outflows of available resources and on balances of
resources available at the end of the fiscal year. Such information is useful in evaluating whether there are
more or less financial resources that can be spent in the near future to finance City services.
Because the focus of governmental funds is narrower than that of the governmental-wide financial
statements, it is useful to compare the information presented for governmental funds with similar
information presented for governmental activities in the government-wide financial statements. This
provides the reader a better understanding of the long-term impact of the government’s near term financial
decisions. Both the governmental fund balance sheet and the governmental fund statement of revenues,
expenditures, and changes in fund balances provide a reconciliation to facilitate the comparison between
governmental funds and governmental activities.
The City of Poulsbo maintains budgetary controls over the governmental funds to ensure compliance with
state law and council adoption at a fund level.
Proprietary Funds: Proprietary funds are divided into two types: enterprise funds provide services to
customers outside the City unit; and internal services funds that provide services to other City departments.
The City uses enterprise funds to account for its water, sewer, solid waste and storm drain activities.
Internal service funds are an accounting method used to accumulate and allocate costs internally among the
City’s various functions. The City uses internal service funds to account for the City’s mechanic services,
public works administration and self-insurance program. Proprietary funds use the same basis of accounting
as business type activities.
Fiduciary Funds: Fiduciary Funds are used to account resources held for the benefit of parties outside the
City. All of the City’s fiduciary activities are reported in separate Statements of Fiduciary Net Assets and
consist of Agency funds only. These activities are excluded from the City’s government-wide financial
statements because the assets cannot be used to finance the City’s operations.
Notes to the Financial Statements: The notes provide additional information that is essential to a full
understanding of the data provided, and are an integral part of the government-wide and fund financial
statements.
GOVERNMENT-WIDE FINANCIAL ANALYSIS
The Statement of Net Assets looks at the City as a whole. Table 1 provides a summary comparing the
City’s net assets for 2008 and 2007. Governmental Activities net assets have a fairly significant increase of
$5.9 million. The increase is primarily due to increased Capital Assets and the reduction of Long Term
Liability as the debt payments continue to reduce the debt. The City purchased two parcels of land and
substantially completed design and site work for the future City Hall. This accounted for a large portion of
the increase in capital assets. Another large amount is due to contributed capital by private developers
turning over their roads and street lights to the City.
The Business Type Activities also had a significant increase of $9.1 million. This increase is largely due to
a sewer project for a large retail development. A portion of the project was attributed to the City and a large
portion was directly related to the contractor who then turned it over to the City as contributed capital.

CITY OF POULSBO FINANCIAL SECTION
2008 COMPREHENSIVE ANNUAL FINANCIAL REPORT Page 21
The overall financial position for the City of Poulsbo has improved over the prior year. In 2008, assets
exceeded liabilities by $85.9 million, an increase of $15.1 million or 21.31%. The largest portion of the
City’s net assets, $68,564,992 or 80% reflects its investment in capital assets (land, buildings, machinery
and equipment, and infrastructure); less any related outstanding debt used to acquire those assets. The
City’s capital assets are used to provide services to citizens. Consequently, these assets are not available for
future spending.
2008 2007 2008 2007 2008 2007
Current and Other Assets $ 9,117,137 $14,120,840 $10,692,189 $ 10,782,379 $19,809,327 $24,903,219
Capital Assets Net 39,372,308 30,775,326 39,166,455 30,246,403 78,538,763 61,021,730
TOTAL ASSETS 48,489,445 44,896,166 49,858,644 41,028,782 98,348,089 85,924,949
Long-term Debt 6,714,144 7,861,669 3,641,043 4,040,593 10,355,187 11,902,262
Other Liabilities 1,501,827 2,699,687 605,437 527,264 2,107,264 3,226,951
TOTAL LIABILITIES 8,215,971 10,561,355 4,246,481 4,567,858 12,462,451 15,129,213
NET ASSETS
Invested in Capital Assets 32,758,461 22,927,641 35,806,531 25,907,276 68,564,992 48,834,917
Restricted 159,881 920,317 492,011 491,489 651,891 1,411,805
Unrestricted (deficit) 7,355,133 10,486,853 9,313,622 10,062,161 16,668,754 20,549,014
TOTAL NET ASSETS $40,273,475 $34,334,811 $45,612,163 $36,460,925 $85,885,638 $70,795,736
Table 1: Condensed Statement of Net Assets
GO VERNMENTAL
ACTIVITIES
BUSINESS-TYPE
ACTIVITIES
TO TAL PRIMARY
GO VERNMENT
The City’s total net assets that represent resources which are subject to external restrictions on how they
may be used is .76% The large reduction in restricted assets for 2008 is due to specific amounts collected
for mitigation funds reserved to pay a portion of General Obligation debt at the five year call. The
remaining balance of unrestricted net assets ($16.7 million) may be used to meet the government’s ongoing
obligations to citizens and creditors.
-
10,000,000
20,000,000
30,000,000
40,000,000
50,000,000
Governmental Business-Type
Unrestricted
Restricted
Net Capital Assets
CITY OF POULSBO FINANCIAL SECTION
2008 COMPREHENSIVE ANNUAL FINANCIAL REPORT Page 22
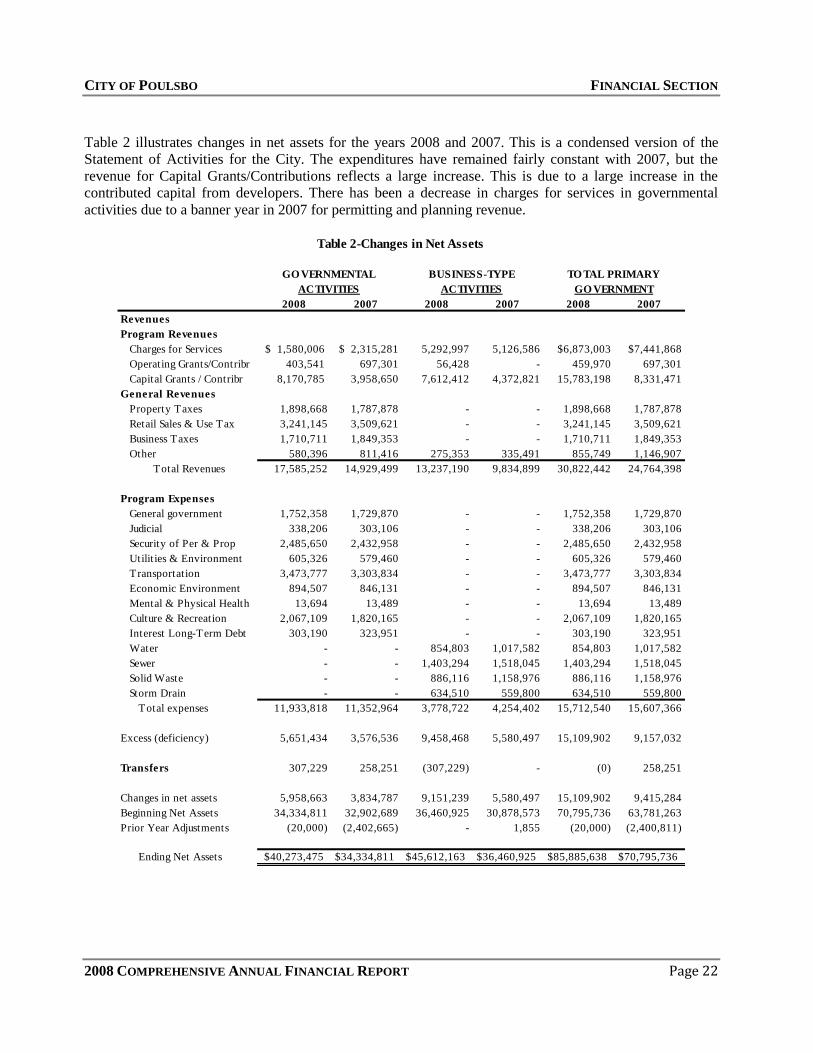
Table 2 illustrates changes in net assets for the years 2008 and 2007. This is a condensed version of the
Statement of Activities for the City. The expenditures have remained fairly constant with 2007, but the
revenue for Capital Grants/Contributions reflects a large increase. This is due to a large increase in the
contributed capital from developers. There has been a decrease in charges for services in governmental
activities due to a banner year in 2007 for permitting and planning revenue.
2008 2007 2008 2007 2008 2007
Revenues
Program Revenues
Charges for Services $ 1,580,006 $ 2,315,281 5,292,997 5,126,586 $6,873,003 $7,441,868
Operating Grants/Contribr 403,541 697,301 56,428 - 459,970 697,301
Capital Grants / Contribr 8,170,785 3,958,650 7,612,412 4,372,821 15,783,198 8,331,471
General Revenues
Property Taxes 1,898,668 1,787,878 - - 1,898,668 1,787,878
Retail Sales & Use Tax 3,241,145 3,509,621 - - 3,241,145 3,509,621
Business Taxes 1,710,711 1,849,353 - - 1,710,711 1,849,353
Other 580,396 811,416 275,353 335,491 855,749 1,146,907
Total Revenues 17,585,252 14,929,499 13,237,190 9,834,899 30,822,442 24,764,398
Program Expenses
General government 1,752,358 1,729,870 - - 1,752,358 1,729,870
Judicial 338,206 303,106 - - 338,206 303,106
Security of Per & Prop 2,485,650 2,432,958 - - 2,485,650 2,432,958
Utilities & Environment 605,326 579,460 - - 605,326 579,460
Transportation 3,473,777 3,303,834 - - 3,473,777 3,303,834
Economic Environment 894,507 846,131 - - 894,507 846,131
Mental & Physical Health 13,694 13,489 - - 13,694 13,489
Culture & Recreation 2,067,109 1,820,165 - - 2,067,109 1,820,165
Interest Long-Term Debt 303,190 323,951 - - 303,190 323,951
Water - - 854,803 1,017,582 854,803 1,017,582
Sewer - - 1,403,294 1,518,045 1,403,294 1,518,045
Solid Waste - - 886,116 1,158,976 886,116 1,158,976
Storm Drain - - 634,510 559,800 634,510 559,800
Total expenses 11,933,818 11,352,964 3,778,722 4,254,402 15,712,540 15,607,366
Excess (deficiency) 5,651,434 3,576,536 9,458,468 5,580,497 15,109,902 9,157,032
Transfers 307,229 258,251 (307,229) - (0) 258,251
Changes in net assets 5,958,663 3,834,787 9,151,239 5,580,497 15,109,902 9,415,284
Beginning Net Assets 34,334,811 32,902,689 36,460,925 30,878,573 70,795,736 63,781,263
Prior Year Adjustments (20,000) (2,402,665) - 1,855 (20,000) (2,400,811)
Ending Net Assets $40,273,475 $34,334,811 $45,612,163 $36,460,925 $85,885,638 $70,795,736
Table 2-Changes in Net Assets
GO VERNMENTAL BUSINESS-TYPE TO TAL PRIMARY
ACTIVITIES ACTIVITIES GO VERNMENT

CITY OF POULSBO FINANCIAL SECTION
2008 COMPREHENSIVE ANNUAL FINANCIAL REPORT Page 23
Charges for
Services
9%
Operating
Grants
2%
Capital Grants
47%
Property Taxes
11%Retail Sales &
Use Taxes
18%Business Taxes
7%
Excise Taxes
3%
Penalties &
Interest
0%
Investment
earnings
3%
Gain
(loss) on
disposal of
capital assets
0%
Revenue by Source
Governmental Activities
GOVERNMENTAL ACTIVITIES
Revenues
Taxes account for the largest revenue category in the governmental funds, generating 42% of the total
revenue. The majority of tax revenue is received in the General Fund accounting for 76% of the revenue.
Because of this ratio, the category receives the majority of attention. Included in this category are sales,
property, utility, criminal justice, and gambling taxes. Governmental fund taxes total $7,269,716.
Property tax receipts involve the very predictable effect of the 101% levy lid limitation, and a somewhat
more variable consideration of new construction. The assessed valuation for property located within the
City limits of Poulsbo for 2008 was $1,337,337,310. For 2008, the City’s regular property levy tax rate was
1.439938 per $1,000 of assessed value.
The City continues to follow their policy of transferring the calculated reserve amount to street reserves and
then transferring 36% of property tax revenue less the calculated reserve amount to the City Street
Operations Fund and 5% to each of the Park Reserve and Street Reserve funds.
Sales and Use tax revenue, in contrast to property tax, can be a highly fluctuating tax source. Although the
City has experienced a continual increase in sales tax, in 2008 the City saw a slight decline. The majority
of the decline is due to reduction in car sales and construction activity, which is similar to many
government agencies impacted by the declining economy experienced in 2008. Sales tax continues to be the
City’s largest single source of revenue. The City’s sales tax rate is 1% on all retail sales taking place within
the City limits.
In 2008, sales tax received in the City’s General Fund totaled $3,114,453. This is a 4% reduction from
2007. The City allocates sales tax revenue as follows: 5% is transferred to the Capital Equipment
Acquisition Fund for capital replacement purchases and 2% is transferred into this same fund for capital
purchases for new programs. An additional 3% of the sales tax is transferred into the Revenue Stabilization
Fund. This reserve fund is used for unanticipated reductions of revenues and/or any unbudgeted and
unanticipated expenditures.
The majority of sales tax revenue (59%) comes from the retail trade category. The next largest sales tax
category is construction, accounting for 14% of the tax. A large retail development continues to have
businesses open their doors, increasing retail sales tax in many different categories which gives Poulsbo a
diversified revenue base.
Business Taxes are
admissions tax and taxes
applied to utilities
providing services in the
City including City-owned
and privately owned
utilities. On the whole,
these taxes tend to be
stable from year to year
making up 25% of the
governmental tax revenue.

CITY OF POULSBO FINANCIAL SECTION
2008 COMPREHENSIVE ANNUAL FINANCIAL REPORT Page 24
Expenses
General Government services encompass a variety of services including legislative, executive, financial,
legal, judicial, personnel, building maintenance, and audit/risk management.
Security of Persons and Property services are provided by the City’s Police Department who works to
provide professional law enforcement services to keep our citizens and their property safe. Special
emphasis is placed on community-oriented programs that will prevent crime and forge a partnership
between the officers and the citizens they serve.
Utility and Environment services create a satisfactory living environment for the City’s residents.
Inspection of private construction projects and coordinating the design of city projects are two examples of
physical environment activities.
Transportation services provide maintenance of the City’s streets, sidewalks, paths and traffic control
signs/signals.
Economic Environment services include land use planning, zoning and community development.
Mental and Physical Health services include the City’s support for the county’s substance abuse program.
The City is required by State law to commit 2% of our revenues from liquor profits and liquor tax to this
program. The City has a contract with the Kitsap County Health District, which uses a formula based on
population and assessed value to determine the City’s level of subsidy.
Culture and Recreation services include expenditures for participant recreation programs and maintenance
of the park facilities.
The chart below illustrates the surplus or net subsidy required for different, key City governmental-type
programs.
0 1,000,000 2,000,000 3,000,000 4,000,000 5,000,000 6,000,000 7,000,000
General Government
Judical
Security Persons & Property
Utilities & Environment
Transportation
Economic Environment
Mental * Physical Health
Culture & Recreation
Governmental Activities - Expense and Program Revenue
Program Revenue
Expenses

CITY OF POULSBO FINANCIAL SECTION
2008 COMPREHENSIVE ANNUAL FINANCIAL REPORT Page 25
1,086,444
1,065,837
1,167,668
1,196,905
1,226,491
0
200,000
400,000
600,000
800,000
1,000,000
1,200,000
1,400,000
2004 2005 2006 2007 2008
Water Service Charge Revenue
BUSINESS-TYPE ACTIVITY
Enterprise Funds: The City of Poulsbo owns and fully operates four utilities: water, sewer, storm drain,
and solid waste/recycle. These utilities are accounted for in four enterprise funds as part of the City’s fund
structure and operations: 1) water utility fund; 2) sewer utility fund; 3) solid waste utility fund; and 4) storm
drain utility fund.
Water Utility: The City’s water utility is solely
supported by its customers, and revenue is generally
derived from three sources: 1) monthly service charges,
2) system connection fees, and 3) miscellaneous
revenues. The majority of revenue comes from monthly
service charges. The 2008 revenue saw a slight increase
of $29.5 thousand due to cost of living rate increase
Sewer Utility: The City’s sewer utility is also solely
supported by its users and revenue is generally
derived from three sources: 1) monthly service
charges, 2) system connection fees, and 3)
miscellaneous revenues, which include investment
interest and charges associated with force account
activities. The majority of revenue comes from
monthly service charges. The summer months (June
through September) charge consumption based on
an average water usage during the eight previous
months. The rate takes into consideration increased
summer usage for watering, which does not produce
additional wastewater. The 2008 revenue saw a
slight increase of $81.2 thousand due to cost of living rate increase
Solid Waste Utility: The solid waste utility is supported
by its users and revenue is generally derived from service
charges which include: 1) service charges for scheduled
residential and regular dumpster garbage collection, and 2)
service charges for recycling. The majority of revenue
comes from monthly service charges. There was no cost of
living increase in rates, so the majority of the $52.3
thousand increase was due to increase in services provided.
1,728,458 1,756,981
1,828,979
1,881,126 1,962,393
0
400,000
800,000
1,200,000
1,600,000
2,000,000
2004 2005 2006 2007 2008
Sewer Service Charge Revenue
1,087,416
1,141,2381,204,338
1,204,534
1,256,845
0
400,000
800,000
1,200,000
2004 2005 2006 2007 2008
Solid Waste Service Charge
Revenue
CITY OF POULSBO FINANCIAL SECTION
2008 COMPREHENSIVE ANNUAL FINANCIAL REPORT Page 26
0 500,000 1,000,000 1,500,000 2,000,000
Water
Sewer
Solid Waste
Storm Drain
Business Activities - Expense and Charge for Service Revenue
Revenue - Charge for Services
Expenses
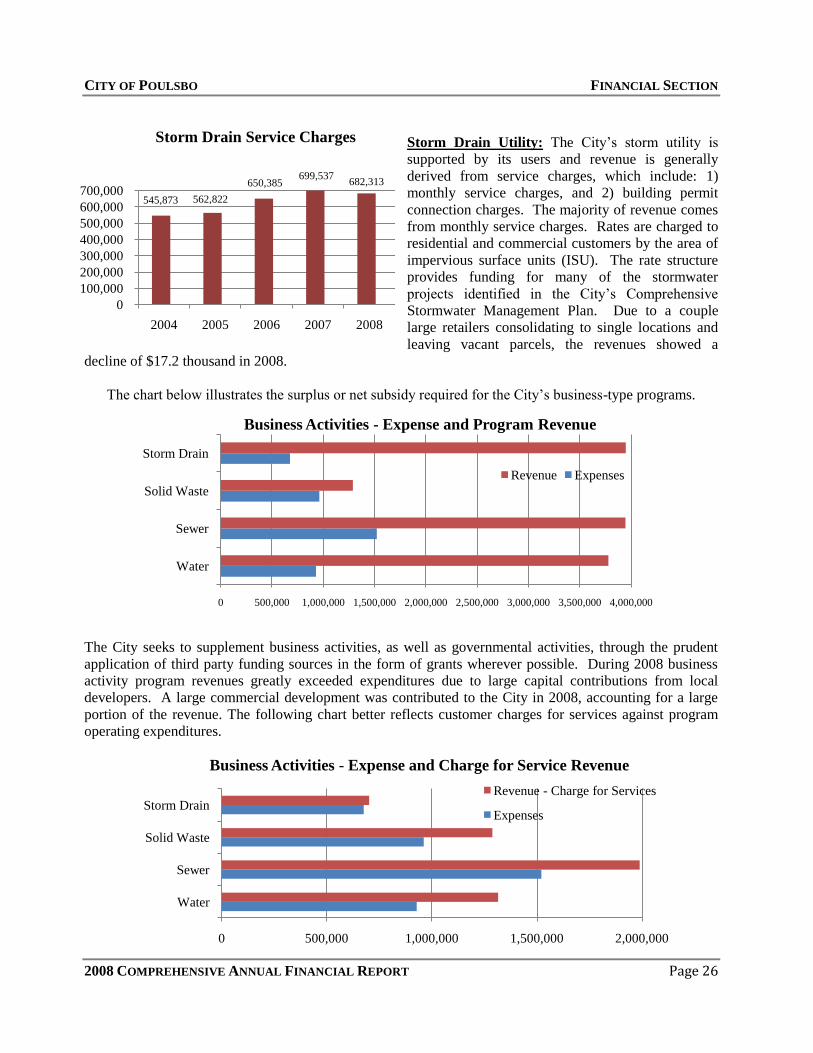
Storm Drain Utility: The City’s storm utility is
supported by its users and revenue is generally
derived from service charges, which include: 1)
monthly service charges, and 2) building permit
connection charges. The majority of revenue comes
from monthly service charges. Rates are charged to
residential and commercial customers by the area of
impervious surface units (ISU). The rate structure
provides funding for many of the stormwater
projects identified in the City’s Comprehensive
Stormwater Management Plan. Due to a couple
large retailers consolidating to single locations and
leaving vacant parcels, the revenues showed a
decline of $17.2 thousand in 2008.
The chart below illustrates the surplus or net subsidy required for the City’s business-type programs.
The City seeks to supplement business activities, as well as governmental activities, through the prudent
application of third party funding sources in the form of grants wherever possible. During 2008 business
activity program revenues greatly exceeded expenditures due to large capital contributions from local
developers. A large commercial development was contributed to the City in 2008, accounting for a large
portion of the revenue. The following chart better reflects customer charges for services against program
operating expenditures.
545,873 562,822
650,385 699,537
682,313
0
100,000
200,000
300,000
400,000
500,000
600,000
700,000
2004 2005 2006 2007 2008
Storm Drain Service Charges
0 500,000 1,000,000 1,500,000 2,000,000 2,500,000 3,000,000 3,500,000 4,000,000
Water
Sewer
Solid Waste
Storm Drain
Business Activities - Expense and Program Revenue
Revenue Expenses
CITY OF POULSBO FINANCIAL SECTION
2008 COMPREHENSIVE ANNUAL FINANCIAL REPORT Page 27
Internal Service Funds: The City of Poulsbo also has three Internal Service Funds. These account for the
goods and services provided to other units of the entity. Payment by the benefiting unit is intended to fund
the costs of providing such service. The City of Poulsbo has three funds that fall into this category: General
Facilities Fund, Public Works Administration Fund, and Medical Reimbursement Fund.
General Facilities Fund: The General Facility Fund is an internal service fund that provides the City with
in-house mechanic services. The service is responsible for both major and minor repairs of all mechanical
equipment used in the business activity funds including cars, trucks, heavy equipment, portable pumps and
generators, and small engines. All general governmental department vehicles and equipment including
Police, Engineering, Building, and Parks & Recreation are also serviced by the in-house services. Funding
is derived from charges for parts, labor, and overhead. This allows the mechanic shop to be fully self-
sufficient. No other funding is used to support this operation.
Public Works Administration Fund: Public Works Administration is an internal service support fund
responsible for the overall supervision and administration of the Public Works Department. Public Works
Administration is supported by those departments, which include the Streets, Water/Sewer, Solid Waste,
Stormwater, General Facilities, Parks, Central Building Maintenance and Cemetery Departments. Expenses
associated with the operation of Public Works Administration are allocated based on a percentage of the
respective department budgets.
Medical Reimbursement Fund: The Medical Reimbursement provides self-insurance for one of the City’s
employee groups. The City self-insures for the difference between a $100 and $500 deductible. Employees
in this group are reimbursed for the difference in the deductible amount just as if their medical plan offered
the lower deductible. The cost of self-insuring is funded through the savings in medical insurance
premiums.
The City’s Funds
Information about the City’s major governmental funds begins on page 36. The City, in accordance with
GASB 34 performed the major fund calculation and determined that the Street Reserve Fund, the Facilities
Fund, and the General Fund, met the requirements to qualify as major funds. These funds are accounted for
using the modified accrual basis of accounting. As reported on the Statement of Revenues, Expenditures,
and Changes in Fund Balances, governmental funds have total revenues of $12.1 million and expenditures
of $15.8 million.
Major Funds:
General Fund: General Fund accounts for the main operating revenues and expenditures of the City’s
governmental functions. Revenues and expenditures related to Clerk, Executive, Legislative, Finance,
Police, Engineering, Planning and Park Maintenance are some of the primary functions of the general
government accounted for in General Fund. The majority of tax revenues are receipted into the General
Fund supporting the governmental functions of the City.
Street Reserves Fund: Accounts for major capital improvements to City streets and transportation
projects. In 2008 one of the large contributors to the fund was a pass through grant for a project
exceeding $4 million for Washington State Department of Transportation (WSDOT) for the
construction of State Highway 305. This is a main thoroughfare for vehicles to access the Kitsap
Peninsula through Poulsbo from Bainbridge Island and the Seattle ferries.
Capital Facilities Fund: The Facilities Fund accounts for capital improvements and construction of
capital projects related to governmental functions. Bond proceeds and expenditures related to the
construction of a new City Hall are being accounted for in the Facilities Fund. The City Hall project
CITY OF POULSBO FINANCIAL SECTION
2008 COMPREHENSIVE ANNUAL FINANCIAL REPORT Page 28
commenced in 2005 but encountered delays and a change in location approved by the City Council.
The purchase of land and site work accounted for the large expenditures in 2008.
BUDGETARY HIGHLIGHTS
The following is a brief review of the budgeting changes from the adopted to the amended final budget for
the General Fund. Please note budget to actual comparisons start on page 40 for the major current expense
and special revenue funds. Budget to Actuals for all other funds begin on page 91. The significant
budgetary changes in the General Fund included:
The final General Fund revenue budget increased by approximately 1.1%, or $98,143 of the
original adopted budget. The majority of this variance was mainly due to recognizing increases in
sales tax, donations for the City’s Centennial Celebration events as well as a healthy investment
environment;
The final General Fund expenditure budget increased by approximately 15.9%, or $1,442,776. The
majority of the variance is due to increased labor costs and related equipment costs for a new
position in the Police Department, professional services in the Planning Department to assist in the
major update of the Comprehensive Plan, expenses related to the City’s Centennial Celebrations,
the share of General Fund functions supported by Public Works toward the purchase of a parcel of
land intended for a future Public Work’s site and transfers out of General Fund created from actual
carryover dollars in excess of the projection to the City’s reserves.
A copy of the City’s Budget-in-Brief is available on our website www.cityofpoulsbo.com. The complete
budget provides details of the City’s plans for using its resources during the year hence and may be
obtained by contacting our Finance Director at 360-697-2487 or [email protected].
CASH MANAGEMENT
Aggressive efforts to maximize interest earnings of temporary cash reserves have been successful. The City
manages cash accounts by the pooled cash management concept and plans investment maturities to coincide
with cash needs. The pool concept provides for investing greater amounts of money at more favorable
interest rates. The short-term investment of idle cash continues to be a significant source of revenue for the
City and the combined accounts in our Governmental Activities earned $584,445 in 2008.
DEBT ADMINISTRATION
The City participates in various forms of debt, which is summarized as follows: $5.810 million of a General
Obligation (GO) bond type. There are two types of GO debt; those that are retired by tax levies (Voted
GO/Levy) and those that, while secured by the tax base, are actually being retired by revenue from the
various sources and funds. The City also has three Public Works Trust Fund loans (PWTF). Two are
recorded in Governmental Activities with combined principal balances of $902,374 and one that is recorded
in Business-Type Activities with a principal balance of $320,934.
Revenue bonds are retired by means of revenue in the proprietary funds. There is no general tax liability
for these obligations. Revenue bond debt in utilities is controlled by bond covenants and the outstanding
principal amount is $3,719,000.

CITY OF POULSBO FINANCIAL SECTION
2008 COMPREHENSIVE ANNUAL FINANCIAL REPORT Page 29
The City’s debt obligations are well within the statutory limits for debt capacity. There are three types of
statutory limits on general obligation debt capacity:
1. The first limit is on the amount of general obligation debt that can be incurred without a vote of the
people. For this type of debt, a city is limited to 1.5% of its assessed value ($1,337,337,310), or
$20,060,060;
2. The second statutory limit is the amount of general obligation debt a city may incur for general
governmental purposes with a vote of the people. This limit is 2.5% of the assessed value
($1,337,337,310). For 2008 the City’s limit is $33,433,433, less any amount issued as non-voted
debt. The City has no voted debt outstanding as of December 31, 2008; and
3. The third limit also is calculated as a percentage of assessed value. This statutory limit allows a
City to incur general obligation debt of up to an additional 2.5% of its assessed value for bond
issues approved by the voters for the purpose of utility improvements and an additional 2.5% for
parks or open space development.
The City in anticipating issuing General Obligation debt for the construction of a new City Hall went
through a bond rating with Standard and Poor’s. The City’s rating was upgraded 2 levels to an AA rating,
due to its healthy reserve balances, sound city policies and practices and anticipated local development in
an excellent location and visibility to a larger metropolitan city.
Additional information on the City’s debt is provided in Note 9, “Long-Term Debt and Capital Lease” and
may be found on page 66 of these statements.
CAPITAL EQUIPMENT AND UPGRADING CAPITAL FACILITIES
The City continues to provide for replacement of capital items of $5,000 or more, such as motor vehicles,
public works equipment and other miscellaneous equipment, through the utilization of the capital
replacement fund. These replacements are funded with 5% of the sales taxes collected in the General Fund
and transferred to the Capital Replacement Fund. Additionally 2% of sales tax dollars collected will be
used as funding for new program capital outlay enhancements.
For several years the City’s budget has been focused almost exclusively on operation and maintenance costs
at the expense of capital outlay costs to maintain and upgrade the existing infrastructure. It has become
apparent that we must be more attentive to building maintenance programs and begin to plan for future
renovation and replacement. Much of the increase in Capital Assets in 2008 is due to contributed capital
from developers. Several housing developments and a large retail development turned their capital
improvements over to the City in the form of Contributed Capital. This capital is primarily infrastructure for
utilities and road improvements Additional information on the City’s capital assets is provided in Note 5,
beginning on page 59.

CITY OF POULSBO FINANCIAL SECTION
2008 COMPREHENSIVE ANNUAL FINANCIAL REPORT Page 30
2008 2007 2008 2007 2008 2007
Land $5,994,703 $5,994,703 $288,593 $288,593 $6,283,296 $6,283,296
Buildings 1,748,779 1,726,333 101,985 91,338 1,850,764 1,817,670
Other Improvements 3,124,967 3,211,956 34,258,489 27,597,338 37,383,456 30,809,294
Infrastructure 18,865,599 12,066,527 - - 18,865,599 12,066,527
Machinery & Equipment 553,938 484,831 730,601 527,857 1,284,539 1,012,688
Work in Progress 9,084,322 7,290,977 3,786,786 1,741,278 12,871,108 9,032,255
Totals $39,372,308 $30,775,327 $39,166,455 $30,246,403 $78,538,763 $61,021,730
ACTIVITIES ACTIVITIES
Table 3-Capital Assets at Year End, Net of Depreciation
GO VERNMENTAL BUSINESS-TYPE TOTAL
ECONOMIC FACTORS AND POULSBO IN THE FUTURE
The State of Washington does not have a state personal income tax and therefore the state operates
primarily using property, sales, utility, and gas taxes. Primarily the City relies on sales, property and utility
taxes and a limited array of permitted other taxes, fees, and state and federal grants to support governmental
activities.
For the business-type and certain governmental activities (permitting, recreation programs, etc.) the user
pays a related fee or associated charge.
Sales taxes represent a major revenue source for governmental funds and provide an economic
measurement of the local economy. Despite a slowdown in the general economy in other areas of the
country, the City of Poulsbo has experienced modest increases in sales tax revenue for the five years
preceding 2008, averaging approximately 7% annually, with the exception of 2006. During 2006 sales taxes
soared by 29% fueled primarily by two big-box anchor stores, Wal-Mart and Home Depot. Although the
trend has reflected an average increase, 2008 saw a decrease of 4%. This is primarily due to a declining
economy in the areas of vehicle sales and a slowdown in home sales and construction. Although there has
been a decline, some areas of the City are still reflecting a growth. Development and new retail continue to
increase in the College Market Place with a new Petco set to open in early 2009.
Several new large construction projects are anticipated for 2009. The City will be constructing a new
30,000 square foot City Hall and continuing with a large transportation project widening a main corridor on
Viking Avenue to include a center turn lane and sidewalks. Anticipated in the future is a new medical
facility developed by Harrison Hospital to include emergency care and a new oncology center. Harrison
Hospital is negotiating with the City for a parcel of land for this facility with design work anticipated in
2009 and construction to begin in 2010.
The level of taxes, fees and charges for services (including development related mitigation fees) will have a
bearing on the City’s competitive ability to encourage retail, office, residential, and industrial development
to locate in their jurisdiction. The City places significant emphasis on encouraging economic development
to attract family wage paying jobs and as an incentive does not assess a business and occupation tax.
The City’s population has grown by almost 400 people in the last three years. In the past several years the
City has approved annexations just under 800 acres or approximately one-half of our urban growth area. All
of these annexations have been initiated by property owners who are looking for access to City utilities and
greater development densities. Annexations have slowed in 2008 due to the Council asking for a break to

CITY OF POULSBO FINANCIAL SECTION
2008 COMPREHENSIVE ANNUAL FINANCIAL REPORT Page 31
evaluate the annexation process and the impact to the City services, availability and related costs to serve
these areas.
A major revision to the City’s Comprehensive Plan began in 2007 and will continue through 2009. Several
public meetings were held at different venues to encourage public participation in 2007. At the end of 2008
and rolling into 2009 the Planning Commission has been meeting weekly to review individual sections and
then combining with City Council for monthly joint meetings. The Comprehensive Plan is working
congruently with the development of functional plans for each of the City’s utilities and is anticipated to be
adopted in 2009.
Request for Financial Information
This financial report is designed to provide our citizens, taxpayers, creditors and investors with a general
overview of the City’s finances and to show the City’s accountability for the monies it receives. Any
questions about this report or requests for additional financial information should be addressed to the
Finance Department, City of Poulsbo, P.O. Box 98, Poulsbo, Washington, 98370. Personal inquiries may
be directed to Jana Brown, Accounting Manager at (360) 697-8233, [email protected] or
Deborah Booher, Finance Director at (360) 697-2487, [email protected].

CITY OF POULSBO FINANCIAL SECTION
2008 COMPREHENSIVE ANNUAL FINANCIAL REPORT Page 32
THIS PAGE INTENTIONALLY LEFT BLANK
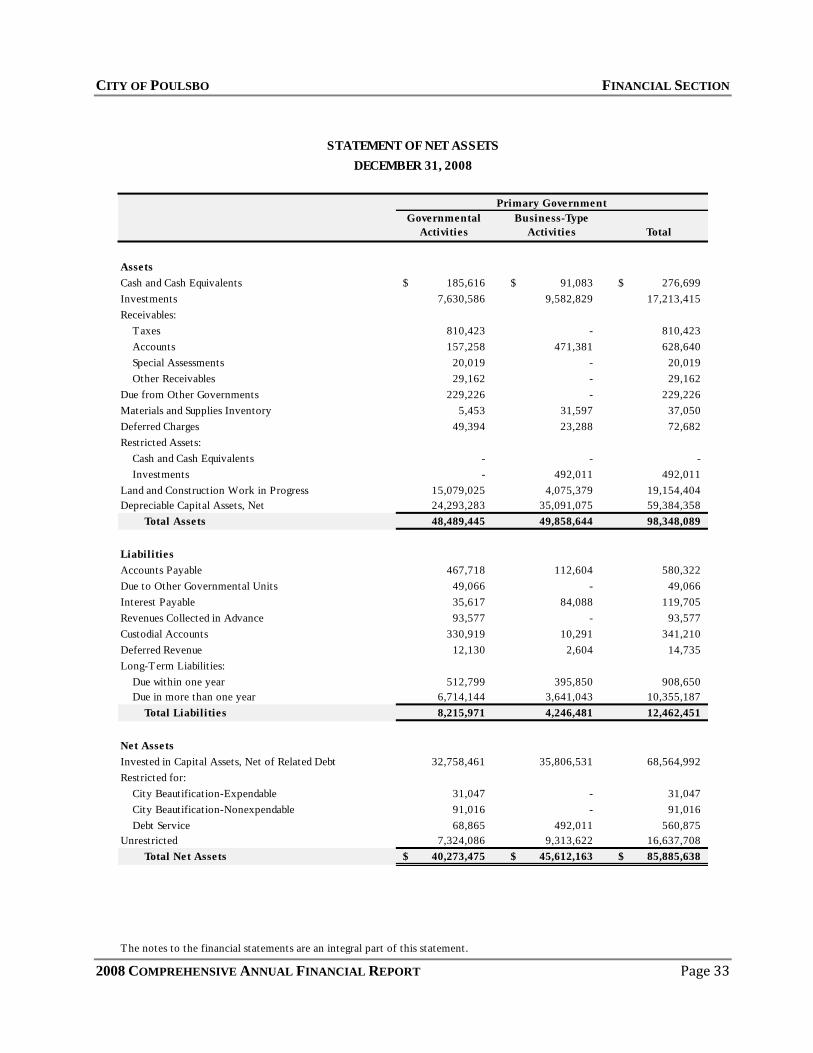
CITY OF POULSBO FINANCIAL SECTION
2008 COMPREHENSIVE ANNUAL FINANCIAL REPORT Page 33
Governmental
Activities
Business-Type
Activities Total
Assets
Cash and Cash Equivalents 185,616$ 91,083$ 276,699$
Investments 7,630,586 9,582,829 17,213,415
Receivables:
Taxes 810,423 - 810,423
Accounts 157,258 471,381 628,640
Special Assessments 20,019 - 20,019
Other Receivables 29,162 - 29,162
Due from Other Governments 229,226 - 229,226
Materials and Supplies Inventory 5,453 31,597 37,050
Deferred Charges 49,394 23,288 72,682
Restricted Assets:
Cash and Cash Equivalents - - -
Investments - 492,011 492,011
Land and Construction Work in Progress 15,079,025 4,075,379 19,154,404
Depreciable Capital Assets, Net 24,293,283 35,091,075 59,384,358
Total Assets 48,489,445 49,858,644 98,348,089
Liabilities
Accounts Payable 467,718 112,604 580,322
Due to Other Governmental Units 49,066 - 49,066
Interest Payable 35,617 84,088 119,705
Revenues Collected in Advance 93,577 - 93,577
Custodial Accounts 330,919 10,291 341,210
Deferred Revenue 12,130 2,604 14,735
Long-Term Liabilities:
Due within one year 512,799 395,850 908,650
Due in more than one year 6,714,144 3,641,043 10,355,187
Total Liabilities 8,215,971 4,246,481 12,462,451
Net Assets
Invested in Capital Assets, Net of Related Debt 32,758,461 35,806,531 68,564,992
Restricted for:
City Beautification-Expendable 31,047 - 31,047
City Beautification-Nonexpendable 91,016 - 91,016
Debt Service 68,865 492,011 560,875
Unrestricted 7,324,086 9,313,622 16,637,708
Total Net Assets 40,273,475$ 45,612,163$ 85,885,638$
The notes to the financial statements are an integral part of this statement.
Primary Government
STATEMENT OF NET ASSETS
DECEMBER 31, 2008

CITY OF POULSBO FINANCIAL SECTION
2008 COMPREHENSIVE ANNUAL FINANCIAL REPORT Page 34
Expenses
Governmental activities:
General government 1,752,358$ 268,307$ 119,079$ 6,319,731$
Judicial 338,206 106,268 - -
Security of Persons & Property 2,485,650 142,855 54,930 -
Utilit ies & Environment 605,326 58,143 - -
T ransportation 3,473,777 7,096 - 1,651,146
Economic Environment 894,507 508,805 174,126 15,000
Mental & Physical Health 13,694 - - -
Culture & Recreation 2,067,109 488,532 55,408 184,908
Interest on Long-Term Debt 303,190 - - -
Total Governmental Activities 11,933,818 1,580,006 403,541 8,170,785
Business-Type Activities:
Water 928,153 1,314,880 - 2,464,315
Sewer 1,520,839 1,988,486 - 1,957,805
Solid Waste 961,512 1,287,759 - -
Storm Drain 675,448 701,872 56,428 3,190,292
Total Business-Type Activities 4,085,952 5,292,997 56,428 7,612,412
Total Primary Government 16,019,770$ 6,873,003$ 459,970$ 15,783,198$
General Revenues:
Property Taxes
Retail Sales & Use Taxes
Business and Occupation Taxes
Excise Taxes
Penalties & Interest
Investment earnings
Gain (loss) on disposal of capital assets
Transfers
Total General Revenues,Special Items, and Transfers
Change in Net Assets
Net Assets Beginning of Year
Prior Period Adjustments
Net-Assets End of Year
The notes to the financial statements are an integral part of this statement.
Charges for
Services
O perating
Grants and
Contributions
Capital Grants
and
Contributions
STATEMENT OF ACTIVITIES
FOR THE YEAR ENDED DECEMBER 31, 2008
Program Revenues
Page 1 of 2

CITY OF POULSBO FINANCIAL SECTION
2008 COMPREHENSIVE ANNUAL FINANCIAL REPORT Page 35
Total
4,954,758$ -$ 4,954,758$
(231,938) - (231,938)
(2,287,866) - (2,287,866)
(547,183) - (547,183)
(1,815,534) - (1,815,534)
(196,576) - (196,576)
(13,694) - (13,694)
(1,338,262) - (1,338,262)
(303,190) - (303,190)
(1,779,485) - (1,779,485)
- 2,851,043 2,851,043
- 2,425,452 2,425,452
- 326,247 326,247
- 3,273,144 3,273,144
- 8,875,886 8,875,886
(1,779,485)$ 8,875,886$ 7,096,400$
General Revenues:
1,898,668 - 1,898,668
3,241,145 - 3,241,145
1,452,140 - 1,452,140
565,800 - 565,800
- - -
579,695 275,353 855,048
701 - 701
- - -
7,738,149 275,353 8,013,502
5,958,663 9,151,239 15,109,902
34,334,811 36,460,925 70,795,736
(20,000) (20,000)
40,273,475$ 45,612,163$ 85,885,638$
Governmental
Activities
Business-Type
Activities
Primary Government
Net (Expenses) Revenue and Changes in Net Assets
STATEMENT OF ACTIVITIES
FOR THE YEAR ENDED DECEMBER 31, 2008
Page 2 of 2

CITY OF POULSBO FINANCIAL SECTION
2008 COMPREHENSIVE ANNUAL FINANCIAL REPORT Page 36
General
Fund
Street
Reserve Fund
Facilities
Fund
Non-Major
Governmental
Funds
Total
Governmental
Funds
Assets
Cash and Cash Equivalents 24,560$ 21,543$ 741$ 138,446$ 185,290$
Investments 1,406,860 810,864 813,713 4,377,722$ 7,409,160
Receivables:
Taxes 11,266 - - 35,746$ 47,012
Accounts 33,862 72,942 13 50,442$ 157,258
Special Assessments - - 20,019$ 20,019
Due from other govern units - 213,600 - 15,626$ 229,226
Inventories 5,453 - - -$ 5,453
Cash and Investments-Restricted - - - 122,063$ 122,063
Total Assets 1,482,002$ 1,118,949$ 814,466$ 4,760,064$ 8,175,481$
Liabilities and Fund Balances
Liabilities
Accounts Payable 94,119$ 73,464$ 223,228$ 76,653$ 467,464$
Due to Other Governments 49,066 - - - 49,066
Custodial Accounts 329,092 - - 1,828 330,919
Deferred Revenue 21,700 - - 84,007 105,707
Total Liabilities 493,978 73,464 223,228 162,488 953,157
Fund Balances:
Reserved, reported in:
Debt Service - - - 68,865 68,865
Permanent fund - - - 122,063 122,063
Unreserved, reported in:
General fund 988,024 - - - 988,024
Special revenue funds - - - 3,233,954 3,233,954
Capital project funds - 1,045,485 591,238 1,172,695 2,809,419
Total Fund Balances 988,024 1,045,485 591,238 4,597,576 7,222,324
Total Liabilities and Fund Balances 1,482,002$ 1,118,949$ 814,466$ 4,760,064$ 8,175,481$
The notes to the financial statements are an integral part of this statement.
BALANCE SHEET-GOVERNMENTAL FUNDS
DECEMBER 31, 2008

CITY OF POULSBO FINANCIAL SECTION
2008 COMPREHENSIVE ANNUAL FINANCIAL REPORT Page 37
Total Governmental Fund Balances:
Amounts reported for governmental activities in the statement of 7,222,324$
net assets are different because:
Capital assets used in governmental activities are not financial resources and therefore
are not reported in the governmental funds. 39,372,308
These assets consist of:
Land 5,994,703$
Buildings and structures 3,875,678
Improvements 27,922,658
Machinery and Equipment 1,951,877
Construction in Progress 9,084,322
Less: Accumulated Depreciation (9,456,930)
Other Assets that are not available to pay for current-period expenditures and
therefore are not reported in governmental funds. 841,607
Long-term liabilit ies, including bonds payable are not due and payable in the current
period and therefore are not reported in the governmental funds. (7,262,560)
Interest Payable (35,617)
Long-term Liabilities (7,226,943)
Internal service funds (less depreciable capital assets, net listed above) that are used by
management to charge the costs of certain activities to individual funds.
Total Assets 100,049
Less: total Depreciable Capital Assets, net
(listed above)
Less: Total Liabilities (254) 99,796
Net assets of governmental activities 40,273,475$
The notes to the financial statements are an integral part of this statement.
RECONCILIATION OF TOTAL GOVERNMENTAL FUND BALANCES TO
NET ASSETS OF GOVERNMENTAL ACTIVITIES
December 31, 2008

CITY OF POULSBO FINANCIAL SECTION
2008 COMPREHENSIVE ANNUAL FINANCIAL REPORT Page 38
General
Fund
Street
Reserve
Fund
Facilities
Fund
Non-Major
Governmental
Funds Total
Revenues
Taxes 6,499,933$ -$ -$ 769,783$ 7,269,716$
Licenses and Permits 379,154 - - 7,096 386,251
Intergovernmental 162,249 1,606,718 - 348,699 2,117,665
Charges for Services 1,038,668 - - 572,994 1,611,662
Fines and Forfeitures 102,630 - - 580 103,210
Interest and Other Earnings 352,639 17,085 42,198 165,044 576,967
Miscellaneous - - 415 65,102 65,517
Total Revenues 8,535,273 1,623,803 42,613 1,929,299 12,130,988
Expenditures
Current:
General Government 2,461,228 - - 48,883 2,510,110
Security of Persons & Property 2,273,373 - - 16,282 2,289,655
Utilit ies and Environment 566,653 - - 18,938 585,591
T ransportation - 1,677,117 - 980,507 2,657,624
Economic Environment 884,848 - - 6,761 891,608
Mental and Physical Health 13,694 - - - 13,694
Culture and Recreation 528,628 - - 1,250,380 1,779,008
Debt Service:
Principal - - - 1,199,323 1,199,323
Interest & Fiscal Charges - - - 303,190 303,190
Capital Outlay - 354,729 2,803,169 466,835 3,624,733
Total Expenditures 6,728,423 2,031,846 2,803,169 4,291,100 15,854,538
Excess of Revenues Over (Under) Expenditures 1,806,850 (408,044) (2,760,556) (2,361,801) (3,723,550)
O ther Financing Sources (Uses)
Transfers In 298,340 467,252 453,962 3,582,617 4,802,172
Transfers Out (2,965,006) - - (1,837,166) (4,802,172)
Intergovernmental Payments (15,000) - - - (15,000)
Sale of Capital Assets 2,180 - - - 2,180
Total O ther Financing Sources and Uses (2,679,486) 467,252 453,962 1,745,452 (12,820)
Net Change in Fund Balances (872,636) 59,208 (2,306,593) (616,349) (3,736,370)
Fund Balances Beginning of Year 1,880,660 900,154 2,897,832 5,213,925 10,892,572
Prior Year Adjustment (20,000) 86,123 - - 66,123
Fund Balances End of Year 988,024$ 1,045,485$ 591,238$ 4,597,576$ 7,222,324$
The notes to the financial statements are an integral part of this statement.
FOR THE YEAR ENDED DECEMBER 31, 2008
STATEMENT OF REVENUES, EXPENDITURES, AND CHANGES IN FUND BALANCES
GOVERNMENTAL FUNDS
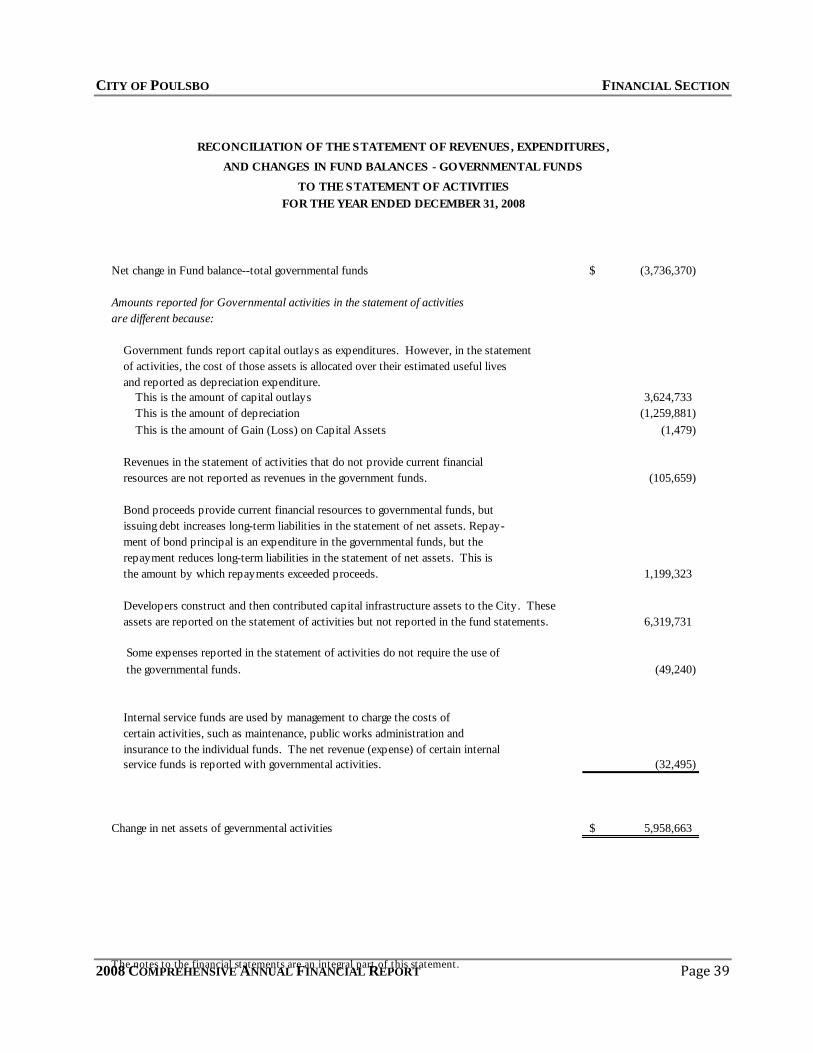
CITY OF POULSBO FINANCIAL SECTION
2008 COMPREHENSIVE ANNUAL FINANCIAL REPORT Page 39
Net change in Fund balance--total governmental funds (3,736,370)$
Amounts reported for Governmental activities in the statement of activities
are different because:
Government funds report capital outlays as expenditures. However, in the statement
of activities, the cost of those assets is allocated over their estimated useful lives
and reported as depreciation expenditure.
This is the amount of capital outlays 3,624,733
This is the amount of depreciation (1,259,881)
This is the amount of Gain (Loss) on Capital Assets (1,479)
Revenues in the statement of activities that do not provide current financial
resources are not reported as revenues in the government funds. (105,659)
Bond proceeds provide current financial resources to governmental funds, but
issuing debt increases long-term liabilities in the statement of net assets. Repay-
ment of bond principal is an expenditure in the governmental funds, but the
repayment reduces long-term liabilities in the statement of net assets. This is
the amount by which repayments exceeded proceeds. 1,199,323
Developers construct and then contributed capital infrastructure assets to the City. These
assets are reported on the statement of activities but not reported in the fund statements. 6,319,731
Some expenses reported in the statement of activities do not require the use of
the governmental funds. (49,240)
Internal service funds are used by management to charge the costs of
certain activities, such as maintenance, public works administration and
insurance to the individual funds. The net revenue (expense) of certain internal
service funds is reported with governmental activities. (32,495)
Change in net assets of gevernmental activities 5,958,663$
The notes to the financial statements are an integral part of this statement.
FOR THE YEAR ENDED DECEMBER 31, 2008
RECONCILIATION OF THE STATEMENT OF REVENUES, EXPENDITURES,
AND CHANGES IN FUND BALANCES - GOVERNMENTAL FUNDS
TO THE STATEMENT OF ACTIVITIES
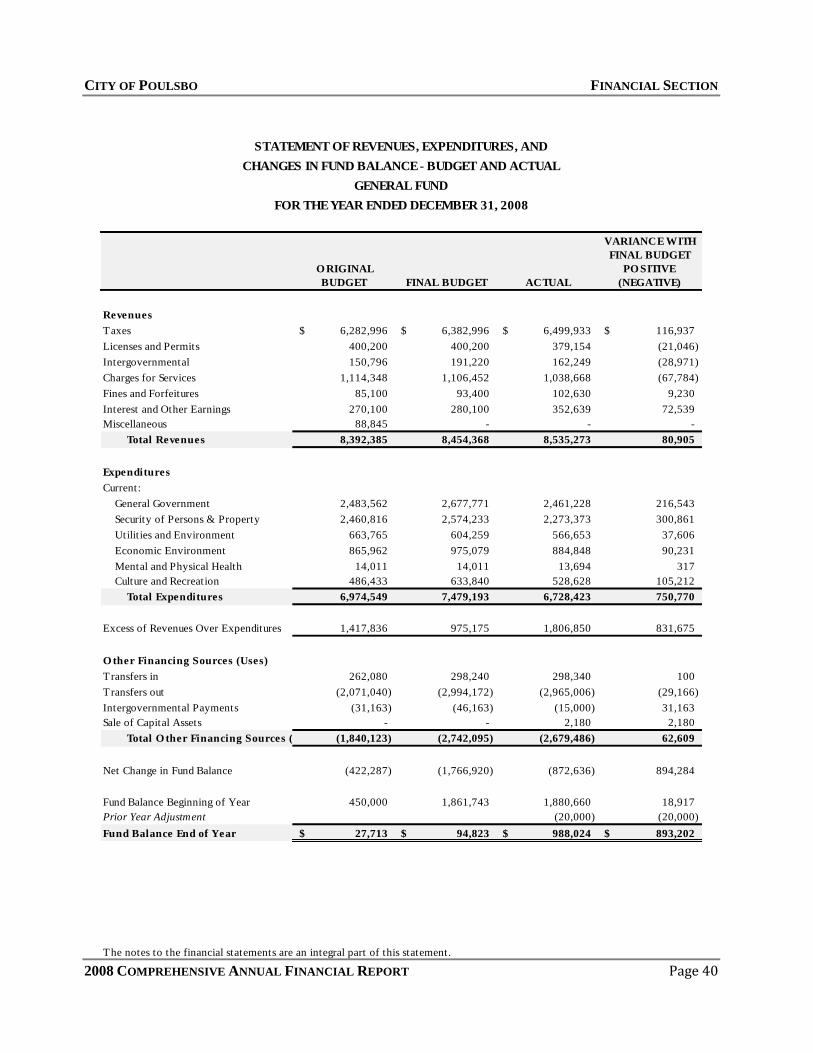
CITY OF POULSBO FINANCIAL SECTION
2008 COMPREHENSIVE ANNUAL FINANCIAL REPORT Page 40
O RIGINAL
BUDGET FINAL BUDGET ACTUAL
VARIANCE WITH
FINAL BUDGET
PO SITIVE
(NEGATIVE)
Revenues
Taxes 6,282,996$ 6,382,996$ 6,499,933$ 116,937$
Licenses and Permits 400,200 400,200 379,154 (21,046)
Intergovernmental 150,796 191,220 162,249 (28,971)
Charges for Services 1,114,348 1,106,452 1,038,668 (67,784)
Fines and Forfeitures 85,100 93,400 102,630 9,230
Interest and Other Earnings 270,100 280,100 352,639 72,539
Miscellaneous 88,845 - - -
Total Revenues 8,392,385 8,454,368 8,535,273 80,905
Expenditures
Current:
General Government 2,483,562 2,677,771 2,461,228 216,543
Security of Persons & Property 2,460,816 2,574,233 2,273,373 300,861
Utilities and Environment 663,765 604,259 566,653 37,606
Economic Environment 865,962 975,079 884,848 90,231
Mental and Physical Health 14,011 14,011 13,694 317
Culture and Recreation 486,433 633,840 528,628 105,212
Total Expenditures 6,974,549 7,479,193 6,728,423 750,770
Excess of Revenues Over Expenditures 1,417,836 975,175 1,806,850 831,675
O ther Financing Sources (Uses)
Transfers in 262,080 298,240 298,340 100
Transfers out (2,071,040) (2,994,172) (2,965,006) (29,166)
Intergovernmental Payments (31,163) (46,163) (15,000) 31,163
Sale of Capital Assets - - 2,180 2,180
Total O ther Financing Sources (Uses) (1,840,123) (2,742,095) (2,679,486) 62,609
Net Change in Fund Balance (422,287) (1,766,920) (872,636) 894,284
Fund Balance Beginning of Year 450,000 1,861,743 1,880,660 18,917
Prior Year Adjustment (20,000) (20,000)
Fund Balance End of Year 27,713$ 94,823$ 988,024$ 893,202$
The notes to the financial statements are an integral part of this statement.
STATEMENT OF REVENUES, EXPENDITURES, AND
CHANGES IN FUND BALANCE - BUDGET AND ACTUAL
GENERAL FUND
FOR THE YEAR ENDED DECEMBER 31, 2008

CITY OF POULSBO FINANCIAL SECTION
2008 COMPREHENSIVE ANNUAL FINANCIAL REPORT Page 41
THIS PAGE INTENTIONALLY LEFT BLANK

CITY OF POULSBO FINANCIAL SECTION
2008 COMPREHENSIVE ANNUAL FINANCIAL REPORT Page 42
Assets
Current Assets:
Cash and Cash Equivalents 21,361$ 35,497$ 24,987$ 6,125$ 87,970$ 3,439$
Investments 2,837,981 3,362,918 1,481,288 1,687,213 9,369,399 312,793
Accounts Receivable 95,609 172,086 124,587 78,029 470,312 1,430
Due from other Governments - - - - - -
Inventories 23,606 6,799 - - 30,405 1,192
Total Current Assets 2,978,556 3,577,300 1,630,863 1,771,367 9,958,086 318,854
Noncurrent Assets:
Restricted cash, cash equivalents, and invests.:
Custodial trust funds - - - - - -
Revenue bond covenant investment 108,242 383,768 - - 492,011 -
Deferred Charges 5,123 18,165 - - 23,288 -
Capital Assets:
Land 136,261 107,397 162 44,773 288,593 -
Buildings and Structures 65,281 253,933 - 16,184 335,398 -
Other Improvements 13,910,214 17,425,089 - 10,079,676 41,414,979 32,424
Machinery and Equipment 536,084 736,270 612,527 309,093 2,193,975 56,218
Construction in Progress 449,306 2,077,962 - 159,346 2,686,614 1,100,172
Less: Accumulated Depreciation (2,994,173) (4,291,239) (576,226) (1,013,906) (8,875,545) (66,373)
Total Noncurrent Assets 12,216,338 16,711,345 36,463 9,595,167 38,559,313 1,122,441
Total Assets 15,194,894$ 20,288,645$ 1,667,326$ 11,366,533$ 48,517,399$ 1,441,295$
Liabilities
Current Liabilities
Accounts payable 8,297$ 51,844$ 35,554$ 10,964$ 106,660$ 6,198$
Custodial 1,438 8,853 - - 10,291 -
Total Current Liabilities 9,734 60,697 35,554 10,964 116,950 6,198
Noncurrent Liabilities:
Rev. bonds payable (net of unamortized disc.) 784,653 2,781,952 - - 3,566,605 -
Accrued interest payable 17,840 66,248 - - 84,088 -
Deferred Revenue 2,604 - - - 2,604 -
Compensated absences 12,916 21,955 34,243 18,275 87,389 61,966
Due to Other Governmental Units 57,126 263,808 - - 320,934 -
Total Noncurrent Liabilities 875,140 3,133,963 34,243 18,275 4,061,620 61,966
Total Liabilities 884,875 3,194,660 69,797 29,239 4,178,571 68,164
Net Assets
Invested in capital assets, net of related debt 11,261,192 13,791,268 36,463 9,595,167 34,684,090 1,122,441
Restricted for debt service 108,242 383,768 - - 492,011 -
Unrestricted 2,940,585 2,918,949 1,561,066 1,742,128 9,162,727 250,690
Total net assets 14,310,020$ 17,093,985$ 1,597,529$ 11,337,294$ 44,338,828$ 1,373,131$
Internal service funds are used by management to charge the costs of certain activities to individual funds.
Total business-type Internal Sevice Fund assets 1,341,245
Less total business-type Internal Service Fund liabilit ies (67,910) 1,273,335
Net assets of business-type activities 45,612,163$
The notes to the financial statements are an integral part of this statement.
STATEMENT OF NET ASSETS - PROPRIETARY FUNDS
Water Solid Waste Storm Drain Sewer
DECEMBER 31, 2008
Internal
Service Funds Total
Business-type Activities Enterprise Funds
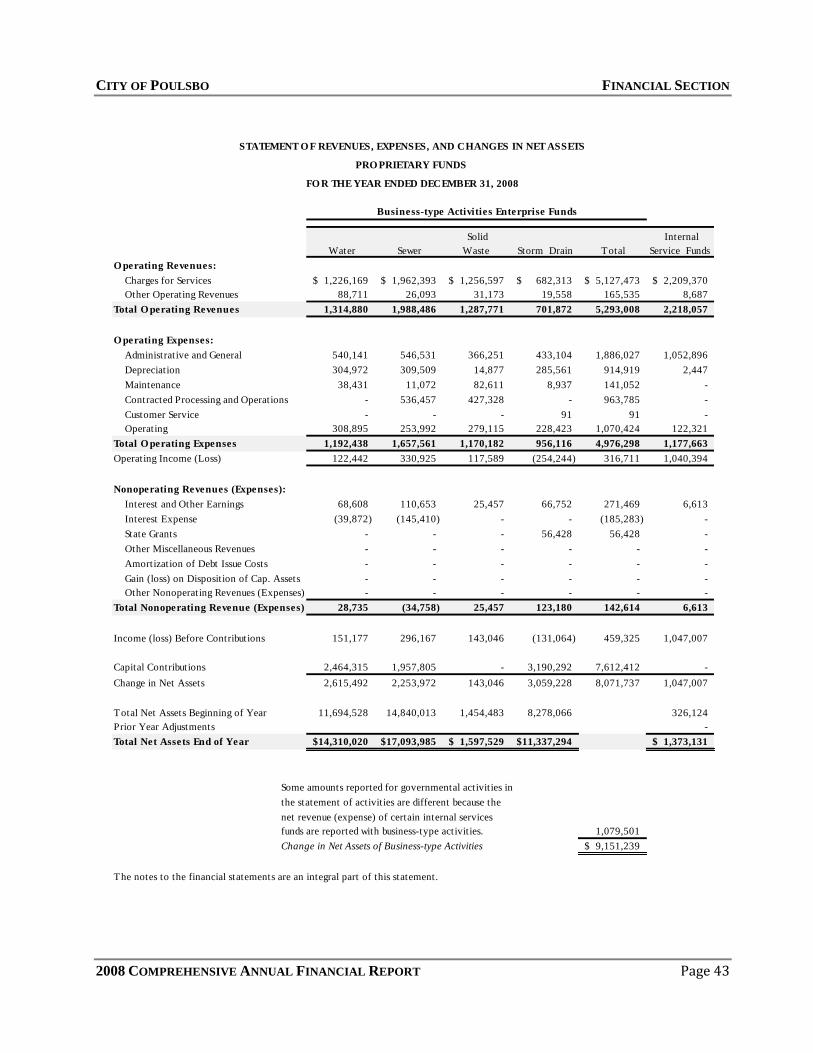
CITY OF POULSBO FINANCIAL SECTION
2008 COMPREHENSIVE ANNUAL FINANCIAL REPORT Page 43
O perating Revenues:
Charges for Services 1,226,169$ 1,962,393$ 1,256,597$ 682,313$ 5,127,473$ 2,209,370$
Other Operating Revenues 88,711 26,093 31,173 19,558 165,535 8,687
Total O perating Revenues 1,314,880 1,988,486 1,287,771 701,872 5,293,008 2,218,057
O perating Expenses:
Administrative and General 540,141 546,531 366,251 433,104 1,886,027 1,052,896
Depreciation 304,972 309,509 14,877 285,561 914,919 2,447
Maintenance 38,431 11,072 82,611 8,937 141,052 -
Contracted Processing and Operations - 536,457 427,328 - 963,785 -
Customer Service - - - 91 91 -
Operating 308,895 253,992 279,115 228,423 1,070,424 122,321
Total O perating Expenses 1,192,438 1,657,561 1,170,182 956,116 4,976,298 1,177,663
Operating Income (Loss) 122,442 330,925 117,589 (254,244) 316,711 1,040,394
Nonoperating Revenues (Expenses):
Interest and Other Earnings 68,608 110,653 25,457 66,752 271,469 6,613
Interest Expense (39,872) (145,410) - - (185,283) -
State Grants - - - 56,428 56,428 -
Other Miscellaneous Revenues - - - - - -
Amortization of Debt Issue Costs - - - - - -
Gain (loss) on Disposition of Cap. Assets - - - - - -
Other Nonoperating Revenues (Expenses) - - - - - -
Total Nonoperating Revenue (Expenses) 28,735 (34,758) 25,457 123,180 142,614 6,613
Income (loss) Before Contributions 151,177 296,167 143,046 (131,064) 459,325 1,047,007
Capital Contributions 2,464,315 1,957,805 - 3,190,292 7,612,412 -
Change in Net Assets 2,615,492 2,253,972 143,046 3,059,228 8,071,737 1,047,007
Total Net Assets Beginning of Year 11,694,528 14,840,013 1,454,483 8,278,066 326,124
Prior Year Adjustments -
Total Net Assets End of Year 14,310,020$ 17,093,985$ 1,597,529$ 11,337,294$ 1,373,131$
Some amounts reported for governmental activities in
the statement of activities are different because the
net revenue (expense) of certain internal services
funds are reported with business-type activities. 1,079,501
Change in Net Assets of Business-type Activities 9,151,239$
The notes to the financial statements are an integral part of this statement.
STATEMENT O F REVENUES, EXPENSES, AND CHANGES IN NET ASSETS
PRO PRIETARY FUNDS
FO R THE YEAR ENDED DECEMBER 31, 2008
Sewer
Solid
Waste
Business-type Activities Enterprise Funds
Water Storm Drain Total
Internal
Service Funds

CITY OF POULSBO FINANCIAL SECTION
2008 COMPREHENSIVE ANNUAL FINANCIAL REPORT Page 44
Cash Flows from O perating Activities
Receipts from customers and users 1,310,792$ 1,974,505$ 1,284,272$ 681,821$ 5,251,390$ 2,218,306$
Payments for interfund services provided (368,293) - (249,992) (340,119) (958,404) -
Payments to suppliers (310,566) (1,130,367) (669,874) (91,119) (2,201,926) (591,751)
Payments to employees (207,926) (217,082) (209,813) (221,162) (855,984) (562,819)
Net cash provided (used) by operating
activities 424,006 627,055 154,593 29,421 1,235,075 1,063,736
Cash Flows From Noncapital
Financing Activities
Transfers in (out ) to other funds - - - - - -
Net cash provided (used) by noncapital
and related financing activities - - - - - -
Cash Flows from Capital and Related
Financing Activities
Proceeds from Capital Debt - - - - - -
Capital contributions 191,970 193,362 - 56,428 441,760 -
Purchase of capital assets (44,183) (24,695) (24,137) - (93,015) -
Acquisition and construction of capital assets (93,194) (1,230,372) - (133,702) (1,457,269) (1,057,749)
Principal paid on capital debt (83,181) (303,667) - - (386,848) -
Interest paid on capital debt (35,496) (127,949) - - (163,445) -
Proceeds from Disposition of capital assets - - - - - -
Net cash provided (used) by capital
and related financing activities (64,084) (1,493,321) (24,137) (77,274) (1,658,816) (1,057,749)
Cash Flows from Investing Activities
Proceeds from sales and maturities of
investments 2,473,597 7,054,073 1,343,430 2,264,374 13,135,474 242,271
Purchase of investment (2,956,756) (6,465,532) (1,507,013) (2,347,107) (13,276,408) (339,141)
Interest and dividends received 68,608 110,653 25,457 66,752 271,469 6,613
Net cash used by investing activities (414,551) 699,194 (138,126) (15,981) 130,535 (90,257)
Net increase in cash and cash equivalents (54,629) (167,073) (7,670) (63,834) (293,206) (84,270)
Cash and cash equivalents Beginning of Year 75,990 202,570 32,658 69,959 381,176 87,708
Cash and cash equivalents End of Year 21,361$ 35,497$ 24,987$ 6,125$ 87,970$ 3,439$
Noncash financing, capital and investing activities:
The notes to the financial statements are an integral part of this statement.
Water Sewer
Solid
Waste
Storm
Drain Total
Internal
Service
Funds
STATEMENT OF CASH FLOWS - PROPRIETARY FUNDS
FOR THE YEAR ENDED DECEMBER 31, 2008
Page 1 of 2
Business-type Activities Enterprise Funds
In 2008, capital assets were contributed by private sources, $3,190,292.15 to the Storm Drain Fund, $2,279,759.91 to the Water Fund,
and $1,761,964.00 to the Sewer Fund.

CITY OF POULSBO FINANCIAL SECTION
2008 COMPREHENSIVE ANNUAL FINANCIAL REPORT Page 45
Reconciliation of operating income to
net cash provided (used) by operating
activities:
Operating Income (Loss) 122,442$ 330,925$ 117,589$ (254,244)$ 316,711$ 1,040,394$
Adjustments to reconcile operating income to net
cash provided (used) by operating activities
Depreciation 304,972 309,509 14,877 285,561 914,919 2,447
(Increase) decrease in accounts receivable (2,945) (114) (3,498) (20,051) (26,608) 249
(Increase) decrease in inventories 1,807 55 - - 1,862 35
Increase (decrease) in accounts payable 1,591 (3,107) 23,285 10,215 31,983 1,595
Increase (decrease) in Custodial Funds (1,143) (13,867) - - (15,010) -
Increase (decrease) in compensated absences
payable (2,717) 3,655 2,341 7,941 11,219 19,017
Total Adjustments 301,565 296,130 37,005 283,665 918,364 23,342
Net Cash Provided By O perating
Activities 424,006$ 627,055$ 154,593$ 29,421$ 1,235,075$ 1,063,736$
The notes to the financial statements are an integral part of this statement.
Internal
Service
Funds
Business-type Activities Enterprise Funds
Page 2 of 2
Water Sewer
Solid
Waste
Storm
Drain Total
FOR THE YEAR ENDED DECEMBER 31, 2008
STATEMENT OF CASH FLOWS - PROPRIETARY FUNDS

CITY OF POULSBO FINANCIAL SECTION
2008 COMPREHENSIVE ANNUAL FINANCIAL REPORT Page 46
Agency Fund
Assets
Cash and cash equivalents 106,145$
Investments -
Total Assets 106,145
Liabilities
Retainage Payable 58,548
Custodial funds 47,597
Total Liabilities 106,145
Net Assets -$
The notes to the financial statements are an integral part of this statement.
STATEMENT OF FIDUCIARY NET ASSETS
AGENCY FUND
DECEMBER 31, 2008

CITY OF POULSBO FINANCIAL SECTION
2008 COMPREHENSIVE ANNUAL FINANCIAL REPORT Page 47
1/1/08
Balance Additions Deletions
12/31/08
Balance
Assets
Cash and cash equivalents 14,345$ 267,826$ 176,026$ 106,145$
Investments 40,407 58,913 99,320 -
Total Assets 54,752 326,739 275,345 106,145
Liabilities
Retainage Payable 18,324 315,964 275,740 58,548
Custodial funds 36,427 153,782 142,612 47,597
Total Liabilities 54,752 469,746 418,353 106,145
Net Assets -$ (143,007)$ (143,007)$ -$
The notes to the financial statements are an integral part of this statement.
AGENCY FUND
FOR THE YEAR ENDED DECEMBER 31, 2008
STATEMENT OF CHANGES IN ASSETS AND LIABILITIES
CITY OF POULSBO FINANCIAL SECTION
2008 COMPREHENSIVE ANNUAL FINANCIAL REPORT Page 48
THIS PAGE INTENTIONALLY LEFT BLANK

CITY OF POULSBO FINANCIAL SECTION
2008 COMPREHENSIVE ANNUAL FINANCIAL REPORT Page 49
NOTES TO THE FINANCIAL STATEMENTS
INDEX
ITEM PAGE
NOTE 1: SUMMARY OF SIGNIFICANT ACCOUNTING POLICIES ..................................................... 50 NOTE 2: STEWARDSHIP, COMPLIANCE AND ACCOUNTABILITY .................................................. 56 NOTE 3: DEPOSITS AND INVESTMENTS ............................................................................................... 57 NOTE 4: PROPERTY TAXES...................................................................................................................... 58 NOTE 5: CAPITAL ASSETS ....................................................................................................................... 59 NOTE 6: EMPLOYEE RETIREMENT AND PENSION PLANS ............................................................... 61 NOTE 7: RISK MANAGEMENT ................................................................................................................. 65 NOTE 8: CONSTRUCTION AND OTHER SIGNIFICANT COMMITMENTS ........................................ 66 NOTE 9: LONG-TERM DEBT ..................................................................................................................... 66 NOTE 10: CONTINGENCIES AND COMMITMENTS ............................................................................. 70 NOTE 11: JOINT VENTURES ..................................................................................................................... 70 NOTE 12: POSTEMPLOYMENT BENEFITS OTHER THAN PENSIONS ............................................. 70 The City has adopted implementation of GASB Statement No. 45 (GASB 45) Accounting and Financial
Reporting by Employers for Postemployment Benefits Other than Pensions and Statement No. 50 (GASB
50) Pension Disclosures. ................................................................................................................................ 70 NOTE 13: PRIOR PERIOD ADJUSTMENTS ............................................................................................ 72

CITY OF POULSBO FINANCIAL SECTION
2008 COMPREHENSIVE ANNUAL FINANCIAL REPORT Page 50
NOTE 1: SUMMARY OF SIGNIFICANT ACCOUNTING POLICIES
The financial statements of the City of Poulsbo have been prepared in conformity with generally accepted accounting
principles (GAAP) as applied to governmental units. The Governmental Accounting Standards Board (GASB) is the
accepted standard setting body for establishing governmental accounting and financial reporting principles. The
significant accounting policies are described below.
A. REPORTING ENTITY
The City of Poulsbo, located in Kitsap County, Washington, was incorporated in 1908. It operates under the laws of
the State of Washington applicable to code cities with a Mayor-Council form of government. A full-time mayor and
seven council members, all elected at large for four-year terms, administer the City. The City provides what are
considered general government services including public safety, streets, parks, planning and zoning, permits and
inspection, general administrative, water, sanitary sewer collection, solid waste collection and storm drainage services.
The City’s Comprehensive Annual Financial Report (CAFR) includes all funds, agencies and boards controlled by, or
dependent on, the City. Control by or dependence on the City was determined on the basis of financial accountability,
budget adoption, taxing authority, outstanding debt service secured by revenues or general obligations of the City,
obligations of the City to finance any deficits that may occur, or receipt of significant subsidies from the City.
B. GOVERNMENT-WIDE AND FUND FINANCIAL STATEMENTS
The City’s basic financial statements include government-wide statements and fund financial statements, which
provide a more detailed level of financial information.
1. Government-wide Financial Statements
The Statement of Net Assets and the Statement of Activities report information on all of the nonfiduciary activities of
the primary government. For the most part, the effect of interfund activity has been removed from these statements.
Governmental activities, which normally are supported by taxes and intergovernmental revenues, are reported
separately from business- type activities, which rely to a significant extent on fees and charges for support.
The Statement of Activities presents changes in the government-wide net assets by function or program. It focuses on
expenses rather than expenditures and shows to what extent direct program revenues offset expenses for a given
function. Our policy is to allocate indirect costs to a specific function. Program revenues include: 1) charges to
customers or applicants who purchase, use or directly benefit from a program; and 2) grants and contributions that are
restricted for the purpose of operational or capital use for a particular program. Taxes and other items such as
investment interest, not restricted for specific programs, are reported on the statement as general revenues. The
comparison of direct expenses with program revenues identifies the extent to which each function is self-financing, or
draws from the general revenues of the City.
General revenues on the Statement of Activities include transfers between governmental and business type activities.
As stated in Note 1. D. 3 (Interfund Transactions), the utility tax paid on the City’s internal utilities (Water, Sewer,
Solid Waste, and Storm Drain) is recorded as an expenditure in the business type funds and as a revenue in the
governmental funds (General Fund). On the Statement of Activities this transaction is presented as a transfer between
business-type and governmental activities.
The Statement of Net Assets presents the financial condition of the City’s governmental and business-type activities of
the year-end. It reports all financial and capital assets including infrastructure and all liabilities, including current and
long-term.
2. Fund Financial Statements
During the year, the City segregates transactions related to certain City functions or activities into separate funds in
order to aid financial management and to demonstrate legal compliance. Fund financial statements are designed to
present financial information of the City at this more detailed level and include statements for governmental,
proprietary, and fiduciary funds, even though the fiduciary funds are excluded from the government-wide statements.

CITY OF POULSBO FINANCIAL SECTION
2008 COMPREHENSIVE ANNUAL FINANCIAL REPORT Page 51
In the basic financial statements, the governmental and enterprise fund financial statements focus on major funds.
Major individual government funds and major individual enterprise funds are reported as separate columns in the fund
financial statements.
C. MEASUREMENT FOCUS, BASIS OF ACCOUNTING, AND FINANCIAL STATEMENT
PRESENTATION
Basis of accounting refers to the point at which revenues or expenditures/expenses are recognized in the accounts and
reported in the financial statements. Basis relates to the timing of the measurements made, regardless of the
measurement focus applied.
The government-wide financial statements are reported using the economic resources measurement focus and the
accrual basis of accounting, as are the proprietary funds. Revenues are recorded when earned and expenses are
recorded when a liability is incurred, regardless of the timing of related cash flows. Property taxes are recognized as
revenues in the year for which they are levied. Grants and similar items are recognized as revenue as soon as all
eligibility requirement imposed by the provider have been met. Agency funds only report assets and liabilities.
Agency funds do not have a measurement focus; however, the agency funds do use the accrual basis of accounting to
recognized receivables and payables.
Governmental fund financial statements are reported using the current financial resources measurement focus and the
modified accrual basis of accounting, Revenues are recognized as soon as they are both measurable and available.
Revenues are considered to be available when they are collectible within the current period or soon enough thereafter
to pay liabilities of the current period. For this purpose, the City considers revenues to be available if they are collected
within 60 days of the end of the current fiscal period. Expenditures generally are recorded when a liability is incurred,
as under accrual accounting. However, debt service expenditures, as well as expenditures related to compensated
absences and claims and judgments, are recorded only when payment is due.
Property taxes, licenses, and interest associated within the current fiscal period are all considered to be susceptible to
accrual and so have been recognized as revenues of the current fiscal period. Only the portion of special assessment
receivable due within the current fiscal period is considered to be susceptible to accrual as revenue of the current
period. All other revenue items are considered to be measurable and available only when cash is received by the City.
The City reports the following major governmental funds:
The General Fund is the City’s primary operating fund. It accounts for all financial resources of the general
government, except those required to be accounted for in another fund.
The Street Reserve Fund was established to make improvements to the transportation system. Funding is
from State and Federal grants and operating transfers.
The Facilities Fund was created to fund capital improvements to the City facilities.
The City reports the following major proprietary funds:
The Water Fund accounts for providing water services. Its revenues are mostly received from service charges
and system connection charges. Expenses are for maintenance and operations of a water supply, storage and
distribution system. This fund also reflects the operation of revenue bonds outstanding, the funds available
for redemption of bonds, cumulative reserve and construction funds.
The Sewer Fund accounts for providing sewer services. Its revenues are mostly received from service charges
and system connection charges. Expenses are for maintenance and extensions of drainage, sewer service
facilities, maintaining sewer collection and transmission systems. This fund also reflects the operation of
revenue bonds outstanding, the funds available for redemption of bonds, cumulative reserve and construction
funds.
The Solid Waste Fund accounts for operations of the collection and transportation of solid waste. Its revenues
are received from service charges. Expenses are made up of the cost of collection and disposal of solid waste.

CITY OF POULSBO FINANCIAL SECTION
2008 COMPREHENSIVE ANNUAL FINANCIAL REPORT Page 52
The Storm Drain Fund accounts for the operation, construction, and maintenance of the storm water
management system.
Additionally, the City reports the following fund types:
Special Revenue Funds account for the proceeds of specific revenue sources to finance specific activities as
required by law or administration regulation. Their revenues are earmarked to finance certain activities or
functions.
Debt Service Funds account for resources accumulated and payment made for principal and interest on the
general government except those required to be accounted for in another fund.
Capital Project Funds account for the acquisition or development of capital facilities for governmental
activities. The major sources of revenue are from proceeds from general obligation bonds, grants, and
contributions from other funds.
Internal Service Funds account for the financing of goods and services provided by one City department or
agency to another City department or agency on a cost reimbursement basis. The City has three Internal
Service Funds:
The General Facilities’ Fund is used to account for the costs of maintaining all City vehicles and
construction equipment used by other City departments on a cost reimbursement basis. The General
Facilities Fund is proprietary in nature and on the government-wide statements is reported under
business-type.
The Public Works Administration Fund accounts for the administration support to the City’s Streets,
Water/Sewer, Solid Waste, Storm Drain, and General Facilities Funds. The Public Works
Administration Fund is business type in nature and on the government-wide statements is reported
under business type.
The Medical Reimbursement Fund is used to fund the City's self-insured portion of the employee's
medical deductible. The Medical Reimbursement Fund is governmental in nature and on the
government-wide statements is reported under governmental.
Agency funds are custodial in nature and are used to account for assets held in an agency capacity for others.
All assets reported in agency funds are offset by a liability to another party on whose behalf they are being
held. Agency funds do not report results of operations. The City has only one Agency Fund.
Permanent Funds account for resources that are legally restricted to the extent that only the earnings, and not
the principal, may be used for specific purposes that support the City’s programs and benefit the City and its
citizens. The City has one Permanent fund, the Bernice Borgen Beautification Fund. The fund accounts for a
trust established from Ms. Borgen’s estate of an original donation of $90,002 in 2000 and an additional
contribution of $1,014 in 2002. Only the interest earned on this donation can be used for beautification of the
City. The City Council has the authority to determine what these expenditures will be. As of year-end,
interest available for expenditure is $31,047. This amount also represents the designated unrealized
investment earnings.
Private sector standards of accounting and financial reporting issued prior to December 1, 1989, generally are followed
in both the government-wide and proprietary fund financial statements to the extent that those standards do not
conflict with or contradict guidance of the Governmental Accounting Standards Board (GASB). Governments also
have the option of following subsequent private sector guidance for the business-type activities and enterprise funds,
subject to the same limitation. The City has elected not to follow subsequent private-sector guidance.
As a general rule the effect of interfund activity has been eliminated from the government-wide financial statements so
that expenses are not reported twice. Business type activities receive services from governmental-type activities. In
2008, $307,229 in expenses and the associated revenues has been eliminated from the governmental activities. The
expenditures for these services are reflected in the business-type expenses.

CITY OF POULSBO FINANCIAL SECTION
2008 COMPREHENSIVE ANNUAL FINANCIAL REPORT Page 53
Amounts reported as program revenues include 1) charges to customers, 2) operating grants and contributions, and 3)
Capital grants and contributions, including special assessments. Internally dedicated resources are reported as general
revenues rather than program revenues. General revenues include all taxes.
Proprietary funds distinguish operating revenues and expenses from nonoperating items. Operating revenues and
expenses generally result from providing services and producing and delivering goods in connection with a proprietary
fund’s principal ongoing operations. The principal operating revenues of the proprietary funds are the charges for
goods and services. Operating expenses for enterprise funds and internal service funds include the cost of sales and
services, administrative expenses, and depreciation on capital assets. All revenue and expenses not meeting this
definition are reported as nonoperating revenues and expenses.
When both restricted and unrestricted resources are available for use, it is the City’s policy to use restricted resources
first, then unrestricted resources as needed.
D. ASSETS, LIABILITIES, AND NET ASSETS OR EQUITY
1. Cash and Investments
The City’s cash and equivalents are considered to be currency on hand, demand deposits with banks and short-term
investments with maturity dates of three months or less. Investments are obligations of the U.S. Government, U.S.
agency issues, obligations of the state of Washington, general obligations of Washington State municipalities (the
State Treasurer’s Local Government Investment Pool (LGIP)), or certificates of deposit with Washington State Banks
and savings and loan institutions. It is the City's policy to invest all temporary cash surpluses. Interest on these
investments is allocated to each fund on the basis of investments owned. These investments are reported on the
Statement of Net Assets and Combining Balance Sheets as cash and cash equivalents or investments.
All investments are stated at fair value as of December 31, 2008.
2. Receivables
The City of Poulsbo recognizes receivables in its various funds using the accounting basis required for that fund.
These receivables are as follows:
Property Taxes
The City’s annual property tax levy is billed and collected by Kitsap County. Taxes collected by the County,
but not remitted to the City by year-end, are reported as receivables. Taxes are levied and become a lien on
the first day of the calendar year. When property taxes become three years delinquent, the County is required
by State statute to foreclose on the property.
Accounts Receivable
Customer Accounts Receivable consist of amounts owed by private individuals or organizations for goods
and services provided. Uncollectable amounts are considered immaterial and the direct write-off method is
used.
Special Assessments
Special assessments are recorded when levied. Special assessments receivable consist of current and
delinquent assessments and related interest and penalties. Deferred assessments consist of unbilled special
assessments that are liens against the property benefited.
3. Interfund Transactions
During the course of normal operations, the City has numerous transactions between City funds. Interfund
transactions such as buying goods and services are recorded as revenues and expenditures. Repayments from funds
responsible for particular expenditures/expenses to the funds that initially paid for them are not presented on the
financial statements. Transfers between funds are included as "other financing sources or uses." Interfund loans,
when applicable, are recorded as receivables in the lending fund and payables in the borrowing fund. The City had no
interfund loans in 2008.
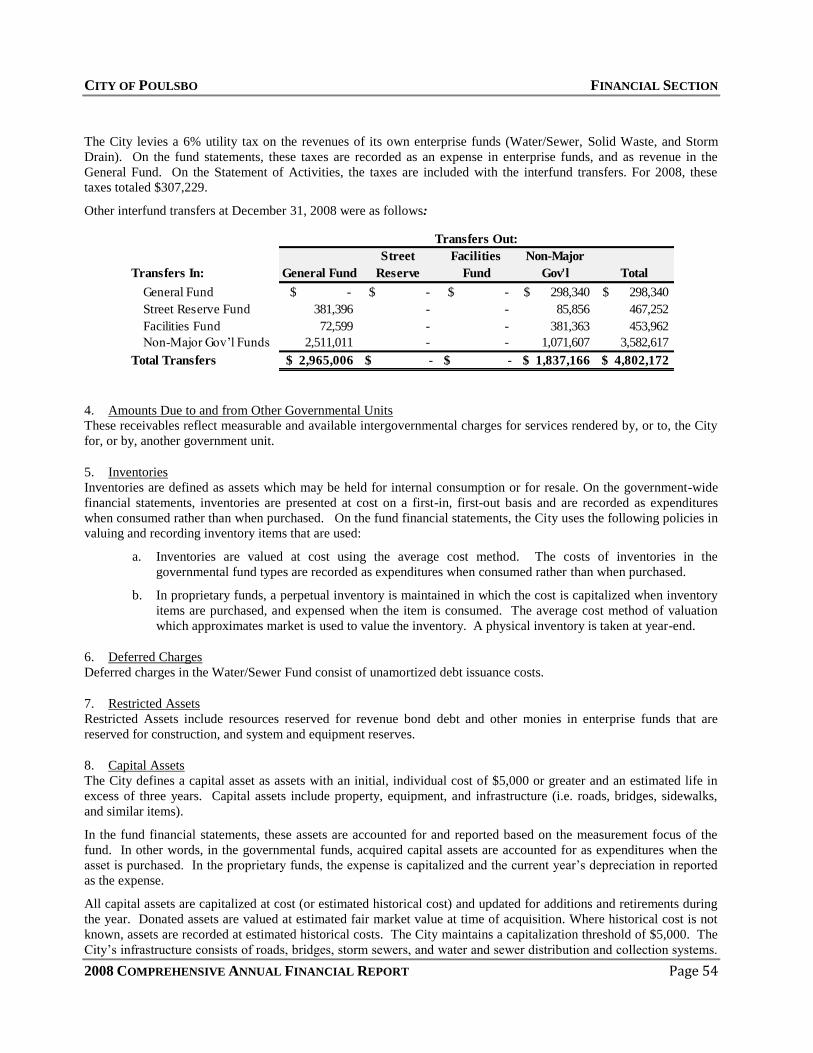
CITY OF POULSBO FINANCIAL SECTION
2008 COMPREHENSIVE ANNUAL FINANCIAL REPORT Page 54
The City levies a 6% utility tax on the revenues of its own enterprise funds (Water/Sewer, Solid Waste, and Storm
Drain). On the fund statements, these taxes are recorded as an expense in enterprise funds, and as revenue in the
General Fund. On the Statement of Activities, the taxes are included with the interfund transfers. For 2008, these
taxes totaled $307,229.
Other interfund transfers at December 31, 2008 were as follows:
Transfers In: General Fund
Street
Reserve
Facilities
Fund
Non-Major
Gov'l Total
General Fund $ - $ - $ - $ 298,340 $ 298,340
Street Reserve Fund 381,396 - - 85,856 467,252
Facilities Fund 72,599 - - 381,363 453,962
Non-Major Gov’l Funds 2,511,011 - - 1,071,607 3,582,617
Total Transfers $ 2,965,006 $ - $ - $ 1,837,166 $ 4,802,172
Transfers Out:
4. Amounts Due to and from Other Governmental Units
These receivables reflect measurable and available intergovernmental charges for services rendered by, or to, the City
for, or by, another government unit.
5. Inventories
Inventories are defined as assets which may be held for internal consumption or for resale. On the government-wide
financial statements, inventories are presented at cost on a first-in, first-out basis and are recorded as expenditures
when consumed rather than when purchased. On the fund financial statements, the City uses the following policies in
valuing and recording inventory items that are used:
a. Inventories are valued at cost using the average cost method. The costs of inventories in the
governmental fund types are recorded as expenditures when consumed rather than when purchased.
b. In proprietary funds, a perpetual inventory is maintained in which the cost is capitalized when inventory
items are purchased, and expensed when the item is consumed. The average cost method of valuation
which approximates market is used to value the inventory. A physical inventory is taken at year-end.
6. Deferred Charges
Deferred charges in the Water/Sewer Fund consist of unamortized debt issuance costs.
7. Restricted Assets
Restricted Assets include resources reserved for revenue bond debt and other monies in enterprise funds that are
reserved for construction, and system and equipment reserves.
8. Capital Assets
The City defines a capital asset as assets with an initial, individual cost of $5,000 or greater and an estimated life in
excess of three years. Capital assets include property, equipment, and infrastructure (i.e. roads, bridges, sidewalks,
and similar items).
In the fund financial statements, these assets are accounted for and reported based on the measurement focus of the
fund. In other words, in the governmental funds, acquired capital assets are accounted for as expenditures when the
asset is purchased. In the proprietary funds, the expense is capitalized and the current year’s depreciation in reported
as the expense.
All capital assets are capitalized at cost (or estimated historical cost) and updated for additions and retirements during
the year. Donated assets are valued at estimated fair market value at time of acquisition. Where historical cost is not
known, assets are recorded at estimated historical costs. The City maintains a capitalization threshold of $5,000. The
City’s infrastructure consists of roads, bridges, storm sewers, and water and sewer distribution and collection systems.

CITY OF POULSBO FINANCIAL SECTION
2008 COMPREHENSIVE ANNUAL FINANCIAL REPORT Page 55
Improvements are capitalized but the costs of normal maintenance and repairs, not adding to the value of the asset or
materially extending an asset’s life, are not.
Property, plant, and equipment of the primary government are depreciated using the straight-line method and reported
in the government-wide statements and proprietary funds using the following estimate useful lives:
Estimated Useful Life in years
Buildings and improvements 10-100
Equipment 3-25
Roads-collectors and residential 30
Water and sewer distribution and collection systems 40
9. Compensated Absences
It is the City’s policy to permit employees to accumulate earned, but unused, vacation leave up to a maximum of 240
hours. Vacation pay is payable to the maximum upon resignation, retirement, or the death of an employee.
Compensatory time is accruable to a maximum of 80 hours.
Sick leave accumulation is unlimited, but is only payable upon resignation, retirement or the death of an employee for
50% up to a maximum balance of 1,200 hours.
In accordance with GASB Statement No. 16, the City accrues vacation pay and no liability is recorded for non-vesting
accumulating rights to receive sick pay benefits. However, a liability is recognized for that portion of the
accumulating sick leave benefits that it is estimated will be taken as termination leave prior to resignation. This
provides for the termination pay for eligible employees vacation and 50% percent of their sick leave to a maximum of
1,200 hours accrued.
The City’s General Facilities internal service fund predominantly serves the governmental funds and, therefore, their
compensated absences liability is included with the governmental activities above. The entire compensated absence
liability is reported on the government-wide financial statements. In the proprietary funds, the entire amount of
compensated absences is reported as a fund liability.
In prior years, the General Fund, City Street Fund, and Recreation Activity Fund have typically been used to liquidate
these liabilities.
10. Custodial Accounts
These accounts reflect the liability for net monetary assets being held by the City in its trustee or agency capacity.
11. Accrued Liabilities and Long-Term Obligations
All payables, accrued liabilities and long-term obligations are reported in the government-wide financial statements.
Also, all payables, accrued liabilities and long-term obligations payable from proprietary funds are reported on the
proprietary fund financial statements.
In general, governmental fund payables and accrued liabilities, those once incurred, are paid in a timely manner and in
full from current financial resources, are reported as obligations of the funds. When due, bonds, capital leases and
long-term loans are recognized as a liability on the governmental fund financial statements.
12. Deferred Revenues
Deferred revenues consist of amounts recognized as receivables but not revenues in governmental funds because the
revenue recognition criteria have not been met.
13. Fund Reserves and Designations
The City has established various reserve funds. The purpose of these funds is to build reserves for purposes such as
equipment replacement, revenue stabilization, and other capital outlays (structures and improvements, etc.).

CITY OF POULSBO FINANCIAL SECTION
2008 COMPREHENSIVE ANNUAL FINANCIAL REPORT Page 56
Designations of fund balance in the fund financial statements represent tentative management plans that are subject to
change. The City reserves those portions of fund balance which are legally segregated for a specific use. An example
would be the reserved fund balance for city beautification from the permanent fund, “Bernice Borgen Beautification
Fund.”
14. Net Assets
Net assets represent the difference between assets and liabilities. Net assets invested in capital assets, net of related
debt consists of capital assets, net of accumulated depreciation, reduced by the outstanding balances of any borrowing
used for the acquisition, construction or improvement of those assets. Net assets are reported as restricted when there
are limitations imposed on their use through external restrictions imposed by creditors, grantors or laws or regulations
of other governments.
NOTE 2: STEWARDSHIP, COMPLIANCE AND ACCOUNTABILITY
A. BUDGETARY INFORMATION
The City adopts an annual appropriated budget for all funds except the agency and permanent fund. Throughout the
year, Council can amend the original adopted budget by ordinance. The financial statements include budgetary
comparisons for general, special revenue, capital projects and debt service fund types. Budget amounts presented are
reported according to GAAP and show the original budget and the final budget with all approved budget amendments
included. The calendar below outlines the process for preparing, reviewing and adopting the annual budget:
MAY – JULY
Capital Improvement team begins process to update Capital Improvement Plan (CIP)
JULY – AUGUST
Council meets to review and set budgetary policies
Budgetary packets with instruction and initial allocations provided
Revenues are reviewed and forecasted
Departments meet with Council committees to finalize recommended budget proposals
Department budget proposals submitted to Finance Department
SEPTEMBER – DECEMBER
Budget submission reviewed with Mayor
Mayor’s proposed preliminary budget prepared and distributed to Council
Public Hearings held
CIP presented to Council
Additional funding & New Program requests reviewed
Property tax levy set
Department budgets presented to full Council for review and discussion
Preliminary budget with all changed prepared and distributed
DECEMBER
Final review and adoption of budget
The final budget, as adopted, is published within the first three months of the new budget year and distributed to
various governmental agencies as well as to the local library to be available to the citizens and all interested members
of the public.
Annual appropriated budgets are adopted at the level of the fund and the budgets constitute the legal authority for
expenditures at that level. Subsidiary revenue and expenditure records are used to compare the budgeted amounts with
actual revenues and expenditures. As a management control device, the subsidiary ledgers monitor expenditures for
individual functions and activities by object class. Transfers or revisions within funds that are less than $2500 are
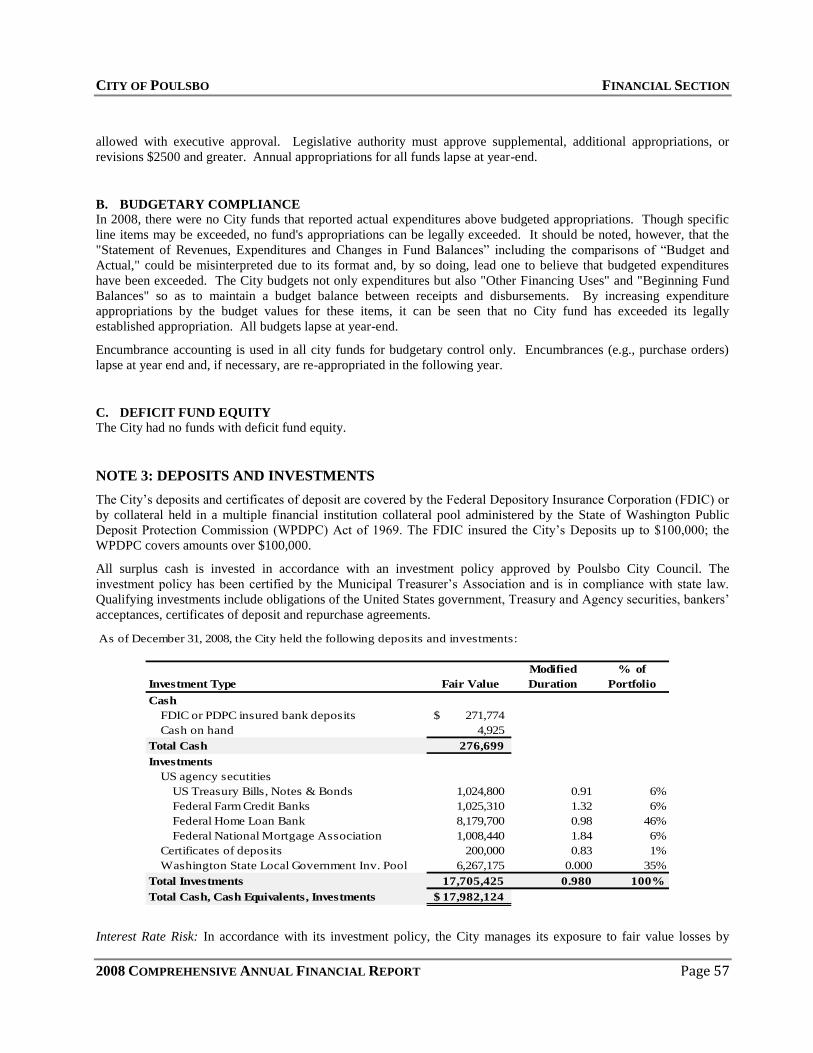
CITY OF POULSBO FINANCIAL SECTION
2008 COMPREHENSIVE ANNUAL FINANCIAL REPORT Page 57
allowed with executive approval. Legislative authority must approve supplemental, additional appropriations, or
revisions $2500 and greater. Annual appropriations for all funds lapse at year-end.
B. BUDGETARY COMPLIANCE
In 2008, there were no City funds that reported actual expenditures above budgeted appropriations. Though specific
line items may be exceeded, no fund's appropriations can be legally exceeded. It should be noted, however, that the
"Statement of Revenues, Expenditures and Changes in Fund Balances” including the comparisons of “Budget and
Actual," could be misinterpreted due to its format and, by so doing, lead one to believe that budgeted expenditures
have been exceeded. The City budgets not only expenditures but also "Other Financing Uses" and "Beginning Fund
Balances" so as to maintain a budget balance between receipts and disbursements. By increasing expenditure
appropriations by the budget values for these items, it can be seen that no City fund has exceeded its legally
established appropriation. All budgets lapse at year-end.
Encumbrance accounting is used in all city funds for budgetary control only. Encumbrances (e.g., purchase orders)
lapse at year end and, if necessary, are re-appropriated in the following year.
C. DEFICIT FUND EQUITY
The City had no funds with deficit fund equity.
NOTE 3: DEPOSITS AND INVESTMENTS
The City’s deposits and certificates of deposit are covered by the Federal Depository Insurance Corporation (FDIC) or
by collateral held in a multiple financial institution collateral pool administered by the State of Washington Public
Deposit Protection Commission (WPDPC) Act of 1969. The FDIC insured the City’s Deposits up to $100,000; the
WPDPC covers amounts over $100,000.
All surplus cash is invested in accordance with an investment policy approved by Poulsbo City Council. The
investment policy has been certified by the Municipal Treasurer’s Association and is in compliance with state law.
Qualifying investments include obligations of the United States government, Treasury and Agency securities, bankers’
acceptances, certificates of deposit and repurchase agreements.
As of December 31, 2008, the City held the following deposits and investments:
Investment Type Fair Value
Modified
Duration
% of
Portfolio
Cash
FDIC or PDPC insured bank deposits 271,774$
Cash on hand 4,925
Total Cash 276,699
Investments
US agency secutities
US Treasury Bills, Notes & Bonds 1,024,800 0.91 6%
Federal Farm Credit Banks 1,025,310 1.32 6%
Federal Home Loan Bank 8,179,700 0.98 46%
Federal National Mortgage Association 1,008,440 1.84 6%
Certificates of deposits 200,000 0.83 1%
Washington State Local Government Inv. Pool 6,267,175 0.000 35%
Total Investments 17,705,425 0.980 100%
Total Cash, Cash Equivalents, Investments 17,982,124$
Interest Rate Risk: In accordance with its investment policy, the City manages its exposure to fair value losses by

CITY OF POULSBO FINANCIAL SECTION
2008 COMPREHENSIVE ANNUAL FINANCIAL REPORT Page 58
attempting to match its investments with anticipated cash flow requirements. Unless matched to a specific cash flow,
the City will not directly invest in securities maturing more than five (5) years from the date of purchase
Credit Risk: Credit risk is the risk that an issuer or other counterparty to an investment will not fulfill its obligations.
All agency securities in our portfolio are rated AAA and the Certificates of Deposit are covered by the PDPCA. The
Washington State Local Government Investment Pool operated in a manner consistent with the SEC’s 2a-7 of the
investment Act of 1940, and is unrated.
The City’s Investment Policy directs that the standard of prudence for investment activities shall be the Prudent
Investor Standard that states: “Investments shall be made with judgment and care, under circumstances then
prevailing, that persons of prudence, discretion and intelligence exercise in the management of their own affairs, not
for speculation, but for investment, considering the probable safety of their capital as well as the probable income to
be derived.”
Concentration of credit risk: The City diversifies its investment instruments to avoid incurring unreasonable risk
inherent with the over-investment of instruments and issuers as follows:
Diversification by security type:
U.S. Treasury bills, notes & bonds 100%
U.S. Government Sponsored Enterprises 100%
FNMA 50%
FHLMC 50%
FHLB 50%
FFCB 50%
Other GSEs 10%
Certificates of Deposit & Public Deposits 20%
Bankers Acceptance 10%
WA State LGIP 100%
WA State and Local Bonds 10%
Repurchase Agreement 10%
Other Legal Investments 10%
NOTE 4: PROPERTY TAXES
The City may levy up to $3.60 per $1,000 of assessed valuation for general governmental services, however, that
amount is reduced by the Kitsap County Library and Kitsap County Fire District 18 annexations. The Library District
may levy up to a maximum of $.50 and Fire District 18 may levy up to a maximum of $1.50 per $1,000 of assessed
valuation.
This amount may also be reduced subject to the following limitations:
Washington State RCW 84.55.010 limits the growth of regular property taxes to six percent per year, after
adjustments for new construction. If the assessed valuation increases by more than six percent, due to
revaluation, the levy rate will be decreased. Since the City of Poulsbo is a taxing district under 10,000
populations, it is able to continue to raise their levy by an amount up to six percent with a simple majority
vote and no requirement of a finding of “substantial need” as included in Referendum 47 for larger
jurisdictions.
The Washington State Constitution limits the total regular property taxes to one percent of assessed valuation,
or $10 per $1,000 of value. If the taxes of all districts exceed this amount, each is proportionately reduced
until the total is at or below the one percent limit.
Washington State Voter Initiation 747, which passed in November 2001, limits property taxes for taxing
jurisdictions under 10,000 in population to 1% over the previous year’s levy.

CITY OF POULSBO FINANCIAL SECTION
2008 COMPREHENSIVE ANNUAL FINANCIAL REPORT Page 59
For 2008, the City's levy for general governmental services was $1.439938 per $1,000 on the assessed valuation of
$1,337,337,310 for a total of $1,925,724.
The Kitsap County Treasurer acts as agent to collect property taxes levied in the county for all taxing authorities.
Collections are distributed after the end of each month.
Property Tax Calendar
Jan 1 Taxes are levied and become an enforceable lien against properties
Feb 14 Tax statements are mailed
April 30 The first of two equal installment payments is due
May 31 Assessed value of property is established at 100% of market value for next year’s levy
Oct 31 The second installment is due
During the year, property tax revenues are recognized when cash is collected. At year-end, property tax revenues are
recognized for collections to be distributed by the County Treasurer in January. No allowance for uncollectible taxes
is established because delinquent taxes are considered fully collectible.
All property taxes are received into the General Fund with the exception of the taxes, associated with construction of
the Fire Station, which are received in the Voted General Obligation Debt Fund. Transfers are made to the other
governmental funds to support various City services.
NOTE 5: CAPITAL ASSETS
All reported capital assets of the City are depreciated. Improvements are depreciated over the remaining useful lives
of the related capital assets. Useful lives for infrastructure were estimated based on the City’s historical records of
necessary improvements and replacement.
Capital asset activity for the primary government for the year ended December 31, 2008, was as follows:
BEGINNING
BALANCE INCREASES DECREASES
ENDING
BALANCE
Governmental-Type Activities
Capital assets, not being depreciated:
Land 5,994,703 - - 5,994,703
Construction Work in Progress 7,290,977 3,439,578 (1,646,233) 9,084,322
Total capital assets not being depreciated 13,285,680 3,439,578 (1,646,233) 15,079,025
Capital assets, being depreciated:
Buildings 3,746,806 128,872 - 3,875,678
Other Improvements 3,708,009 228,877 (110,481) 3,826,406
Machinery and Equipment 1,723,514 304,432 (76,069) 1,951,877
Infrastructure 16,508,367 7,587,915 (30) 24,096,252
Total capital assets being depreciated 25,686,696 8,250,097 (186,580) 33,750,213
Less accumulated depreciation for:
Buildings (2,020,473) (106,425) - (2,126,898)
Other Improvements (496,053) (205,386) - (701,439)
Machinery and Equipment (1,238,683) (159,256) - (1,397,939)
Infrastructure (4,441,840) (788,814) - (5,230,654)
Total accumulated depreciation (8,197,049) (1,259,881) - (9,456,930)
Total capital assets, being depreciated, net 17,489,647 6,990,216 (186,580) 24,293,283
Governmental activity capital assets, net 30,775,327$ 10,429,794$ (1,832,813)$ 39,372,308

CITY OF POULSBO FINANCIAL SECTION
2008 COMPREHENSIVE ANNUAL FINANCIAL REPORT Page 60
BEGINNING
BALANCE INCREASES DECREASES
ENDING
BALANCE
Business-Type Activities
Capital assets, not being depreciated:
Land 288,593 - - 288,593
Construction Work in Progress 1,741,278 2,524,125 (478,617) 3,786,786
Total capital assets not being depreciated 2,029,871 2,524,125 (478,617) 4,075,379
Capital assets, being depreciated:
Buildings 319,214 16,184 - 335,398
Other Improvements 33,969,110 7,724,447 (246,155) 41,447,402
Machinery and Equipment 1,961,760 321,003 (23,571) 2,259,192
Total capital assets being depreciated 36,250,084 8,061,634 (269,725) 44,041,993
Less accumulated depreciation for:
Buildings (227,877) (5,537) - (233,413)
Other Improvements (6,371,772) (817,141) - (7,188,913)
Machinery and Equipment (1,433,903) (94,688) - (1,528,591)
Total accumulated depreciation (8,033,552) (917,365) - (8,950,917)
Total capital assets, being depreciated, net 28,216,532 7,144,269 (269,725) 35,091,075
Business-type activity capital assets, net 30,246,403$ 9,668,393$ (748,342)$ 39,166,455
Depreciation expense was charged to functions/programs of the primary government as follows:
Security of Persons and Property 95,684
Utilities and Environment 13,335
Transportation 815,190
Economic Environment 5,840
Culture and Recreation 271,464
-
Total depreciation expense - governmental activities 1,259,881$
Capital assets held by the government's internal service funds are charged to
the various fundtions based on their usage of the assets
Depreciation expense was charged Business-Type Activities of the primary government as follows:
Sewer 309,509
Solid Waste 14,877
Storm Drain 285,561
Public Works Administration 2,447
Total depreciation expense - business-type activities 917,365$

CITY OF POULSBO FINANCIAL SECTION
2008 COMPREHENSIVE ANNUAL FINANCIAL REPORT Page 61
NOTE 6: EMPLOYEE RETIREMENT AND PENSION PLANS
Substantially, all of the City of Poulsbo’s full-time and qualifying part-time employees participate in one of the State's
retirement systems described below. The cost-sharing multiple-employer defined benefit public employee retirement
plans are administered by the Washington State Department of Retirement Systems (DRS). DRS, a department within
the primary government of the State of Washington, issues a publicly available CAFR that includes financial
statements and required supplementary information for each plan. The DRS CAFR may be obtained from the
Department of Retirement Systems, Communications Unit, P.O. Box 48380, Olympia, WA 98504-8380. The
following disclosures are made pursuant to GASB Statement 27, Accounting for Pensions by State and Local
Government Employer and No. 50, Pension Disclosures, an Amendment of GASB Statements No. 25 and No. 27.
A. PUBLIC EMPLOYEES' RETIREMENT SYSTEM (PERS) PLANS 1, 2, and 3
Plan Descriptions:
PERS is a cost-sharing multiple-employer retirement system comprised of three separate plans for membership
purposes: Plan 1 and 2 are defined benefit plans and Plan 3 is a combination defined benefit/defined contribution plan.
Membership in the plan includes elected officials; state employees; employees of the Supreme, Appeals and Superior
courts (other than judges in a judicial retirement system); employees of legislative committees; community and
technical colleges, college and university employees (not in national higher education retirement programs); judges of
district and municipal courts; and employees of local governments.
PERS participants who joined the system by September 30, 1977, are Plan I members. Those who joined on or after
October 1, 1977 and by either, February 28, 2002 for state and higher education employees, or August 31, 2002 for
local government employees, are Plan 2 members unless they exercise an option to transfer their membership to Plan
3. PERS participants joining the system on or after March 1, 2002 for state and higher education employees, or
September 1, 2002 for local government employees have the option of choosing membership in either PERS Plan 2 or
PERS Plan 3. The option must be exercised within 90 days of employment. An employee is reported in Plan 2 until a
choice is made. Employees who fail to choose within 90 days default to PERS Plan 3. Notwithstanding, PERS Plan 2
and Plan 3 members may opt out of plan membership if terminally ill, with less than five years to live.
PERS defined benefit retirement benefits are financed from a combination of investment earnings and employer and
employee contributions. PERS retirement benefit provisions are established in state statute and may be amended only
by the State Legislature.
Plan 1 retirement benefits are vested after an employee completes five years of eligible service. Plan members are
eligible for retirement at any age after 30 years of service, or at the age of 60 with five years of service, or at the age of
55 with 25 years of service. The annual pension is 2 percent of the average final compensation per year of service,
capped at 60 percent. The average final compensation is based on the greatest compensation during any 24 eligible
consecutive compensation months. If qualified, after reaching the age of 66 a cost-of-living allowance is granted based
on years of service credit and is capped at 3 percent annually.
Plan 2 retirement benefits are vested after an employee completes five years of eligible service. Plan 2 members may
retire at the age of 65 with five years of service, or at the age of 55 with 20 years of service, with an allowance of 2
percent of the average final compensation per year of service. The average final compensation is based on the greatest
compensation during any eligible consecutive 60-month period. Plan 2 retirements prior to the age of 65 receive
reduced benefits. If retirement is at age 55 or older with at least 30 years of service, a 3 percent per year reduction
applies; otherwise an actuarial reduction will apply. There is no cap on years of service credit; and a cost-of-living
allowance is granted (indexed to the Seattle Consumer Price Index), capped at 3 percent annually.
Plan 3 has a dual benefit structure. Employer contributions finance a defined benefit component, and member
contributions finance a defined contribution component. The defined benefit portion provides a benefit calculated at 1
percent of the average final compensation per year of service. The average final compensation is based on the greatest
compensation during any eligible consecutive 60-month period. Plan 3 members become eligible for retirement if they
have: at least ten years of service; or five years including twelve months that were earned after age 54; or five service
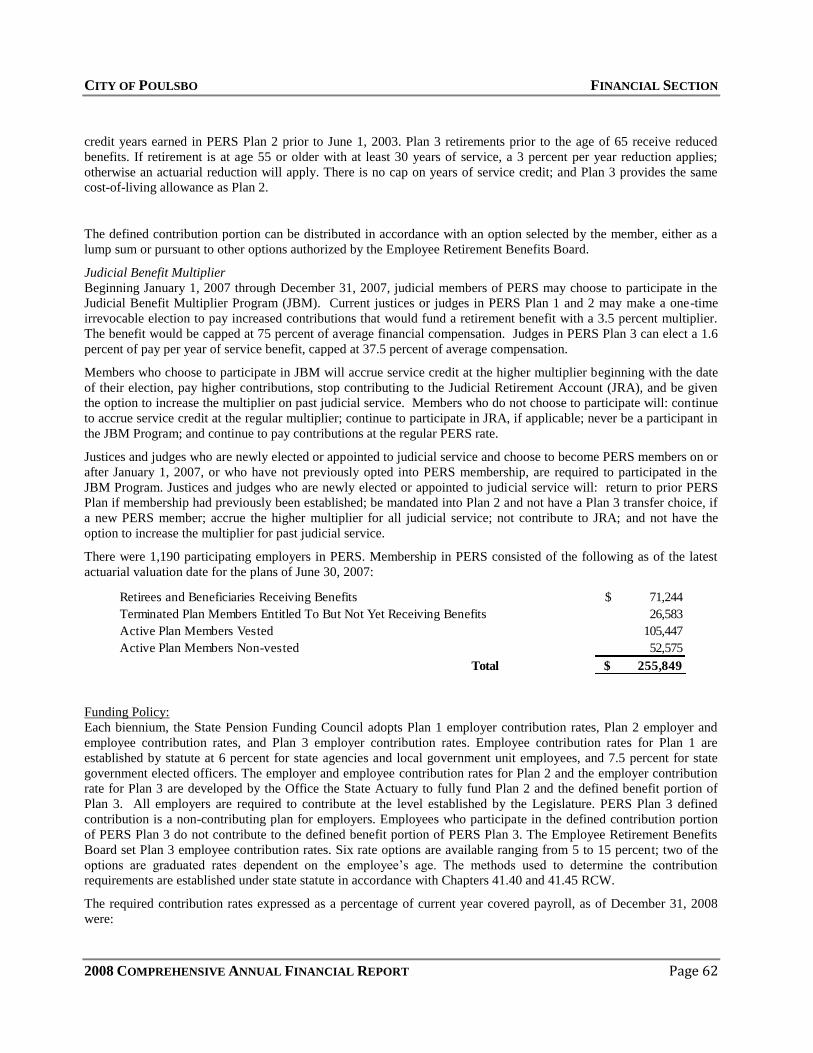
CITY OF POULSBO FINANCIAL SECTION
2008 COMPREHENSIVE ANNUAL FINANCIAL REPORT Page 62
credit years earned in PERS Plan 2 prior to June 1, 2003. Plan 3 retirements prior to the age of 65 receive reduced
benefits. If retirement is at age 55 or older with at least 30 years of service, a 3 percent per year reduction applies;
otherwise an actuarial reduction will apply. There is no cap on years of service credit; and Plan 3 provides the same
cost-of-living allowance as Plan 2.
The defined contribution portion can be distributed in accordance with an option selected by the member, either as a
lump sum or pursuant to other options authorized by the Employee Retirement Benefits Board.
Judicial Benefit Multiplier
Beginning January 1, 2007 through December 31, 2007, judicial members of PERS may choose to participate in the
Judicial Benefit Multiplier Program (JBM). Current justices or judges in PERS Plan 1 and 2 may make a one-time
irrevocable election to pay increased contributions that would fund a retirement benefit with a 3.5 percent multiplier.
The benefit would be capped at 75 percent of average financial compensation. Judges in PERS Plan 3 can elect a 1.6
percent of pay per year of service benefit, capped at 37.5 percent of average compensation.
Members who choose to participate in JBM will accrue service credit at the higher multiplier beginning with the date
of their election, pay higher contributions, stop contributing to the Judicial Retirement Account (JRA), and be given
the option to increase the multiplier on past judicial service. Members who do not choose to participate will: continue
to accrue service credit at the regular multiplier; continue to participate in JRA, if applicable; never be a participant in
the JBM Program; and continue to pay contributions at the regular PERS rate.
Justices and judges who are newly elected or appointed to judicial service and choose to become PERS members on or
after January 1, 2007, or who have not previously opted into PERS membership, are required to participated in the
JBM Program. Justices and judges who are newly elected or appointed to judicial service will: return to prior PERS
Plan if membership had previously been established; be mandated into Plan 2 and not have a Plan 3 transfer choice, if
a new PERS member; accrue the higher multiplier for all judicial service; not contribute to JRA; and not have the
option to increase the multiplier for past judicial service.
There were 1,190 participating employers in PERS. Membership in PERS consisted of the following as of the latest
actuarial valuation date for the plans of June 30, 2007:
$ 71,244
26,583
105,447
52,575
$ 255,849 Total
Retirees and Beneficiaries Receiving Benefits
Terminated Plan Members Entitled To But Not Yet Receiving Benefits
Active Plan Members Vested
Active Plan Members Non-vested
Funding Policy:
Each biennium, the State Pension Funding Council adopts Plan 1 employer contribution rates, Plan 2 employer and
employee contribution rates, and Plan 3 employer contribution rates. Employee contribution rates for Plan 1 are
established by statute at 6 percent for state agencies and local government unit employees, and 7.5 percent for state
government elected officers. The employer and employee contribution rates for Plan 2 and the employer contribution
rate for Plan 3 are developed by the Office the State Actuary to fully fund Plan 2 and the defined benefit portion of
Plan 3. All employers are required to contribute at the level established by the Legislature. PERS Plan 3 defined
contribution is a non-contributing plan for employers. Employees who participate in the defined contribution portion
of PERS Plan 3 do not contribute to the defined benefit portion of PERS Plan 3. The Employee Retirement Benefits
Board set Plan 3 employee contribution rates. Six rate options are available ranging from 5 to 15 percent; two of the
options are graduated rates dependent on the employee’s age. The methods used to determine the contribution
requirements are established under state statute in accordance with Chapters 41.40 and 41.45 RCW.
The required contribution rates expressed as a percentage of current year covered payroll, as of December 31, 2008
were:
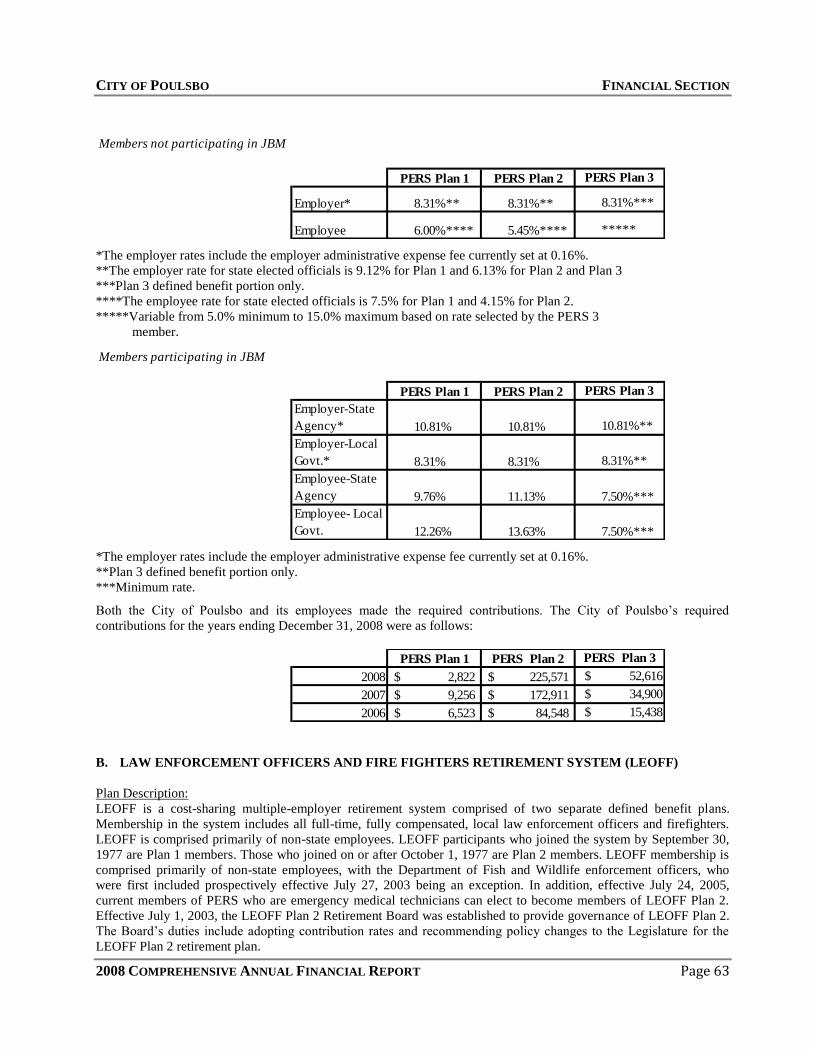
CITY OF POULSBO FINANCIAL SECTION
2008 COMPREHENSIVE ANNUAL FINANCIAL REPORT Page 63
Members not participating in JBM
PERS Plan 1 PERS Plan 2 PERS Plan 3
Employer* 8.31%** 8.31%** 8.31%***
Employee 6.00%**** 5.45%**** *****
*The employer rates include the employer administrative expense fee currently set at 0.16%.
**The employer rate for state elected officials is 9.12% for Plan 1 and 6.13% for Plan 2 and Plan 3
***Plan 3 defined benefit portion only.
****The employee rate for state elected officials is 7.5% for Plan 1 and 4.15% for Plan 2.
*****Variable from 5.0% minimum to 15.0% maximum based on rate selected by the PERS 3
member.
Members participating in JBM
PERS Plan 1 PERS Plan 2 PERS Plan 3
Employer-State
Agency* 10.81% 10.81% 10.81%**
Employer-Local
Govt.* 8.31% 8.31% 8.31%**
Employee-State
Agency 9.76% 11.13% 7.50%***
Employee- Local
Govt. 12.26% 13.63% 7.50%***
*The employer rates include the employer administrative expense fee currently set at 0.16%.
**Plan 3 defined benefit portion only.
***Minimum rate.
Both the City of Poulsbo and its employees made the required contributions. The City of Poulsbo’s required
contributions for the years ending December 31, 2008 were as follows:
PERS Plan 1 PERS Plan 2 PERS Plan 3
2008 2,822$ 225,571$ $ 52,616
2007 9,256$ 172,911$ $ 34,900
2006 6,523$ 84,548$ $ 15,438
B. LAW ENFORCEMENT OFFICERS AND FIRE FIGHTERS RETIREMENT SYSTEM (LEOFF)
Plan Description:
LEOFF is a cost-sharing multiple-employer retirement system comprised of two separate defined benefit plans.
Membership in the system includes all full-time, fully compensated, local law enforcement officers and firefighters.
LEOFF is comprised primarily of non-state employees. LEOFF participants who joined the system by September 30,
1977 are Plan 1 members. Those who joined on or after October 1, 1977 are Plan 2 members. LEOFF membership is
comprised primarily of non-state employees, with the Department of Fish and Wildlife enforcement officers, who
were first included prospectively effective July 27, 2003 being an exception. In addition, effective July 24, 2005,
current members of PERS who are emergency medical technicians can elect to become members of LEOFF Plan 2.
Effective July 1, 2003, the LEOFF Plan 2 Retirement Board was established to provide governance of LEOFF Plan 2.
The Board’s duties include adopting contribution rates and recommending policy changes to the Legislature for the
LEOFF Plan 2 retirement plan.

CITY OF POULSBO FINANCIAL SECTION
2008 COMPREHENSIVE ANNUAL FINANCIAL REPORT Page 64
LEOFF defined benefits are financed from a combination of investment earnings, employer and employee
contributions, and a special funding situation in which the state pays the remainder through state legislative
appropriations. LEOFF retirement benefit provisions are established in state statute and may be amended by the State
Legislature.
LEOFF Plan 1 retirement benefits are vested after an employee completes five years of eligible service. Plan 1
members are eligible for retirement with five years of service at the age of 50. The benefit per year of service
calculated as a percent of final average salary is as follows:
Term of Service
Percent of Final
Average
20 or more years 2.00%
10 but less than 20 years 1.50%
5 but less than 10 years 1.00%
The final average salary is the basic monthly salary received at the time of retirement, provided a member has held the
same position or rank for 12 months preceding the date of retirement. Otherwise, it is the average of the highest
consecutive 24 months’ salary within the last 10 years of service. If membership was established in LEOFF after
February 18, 1974, the service retirement benefit is capped at 60 percent of final average salary. A cost-of-living
allowance is granted (indexed to the Seattle Consumer Price Index).
LEOFF Plan 2 retirement benefits are vested after an employee completes five years of eligible service. Plan 2
members may retire at the age of 50 with 20 years of service, or at the age of 53 with five years of service, with an
allowance of 2 percent of the final average salary per year of service. The final average salary is based on the highest
consecutive 60 months. Plan 2 retirements prior to the age of 53 are reduced 3 percent for each year that the benefit
commences prior to age 53. There is no cap on years of service credit; and a cost-of-living allowance is granted
(indexed to the Seattle Consumer Price Index), capped at 3 percent annually.
There are 374 participating employers in LEOFF. Membership in LEOFF consisted of the following as of the latest
actuarial valuation date for the plans of June 30, 2007:
$ 9,085
633
12,904
3,708
Total $ 26,330
Retirees and Beneficiaries Receiving Benefits
Terminated Plan Members Entitled To But Not Yet Receiving Benefits
Active Plan Members Vested
Active Plan Members Non-vested
Funding Policy:
Starting on July 1, 2000, Plan 1 employers and employees will contribute zero percent as long as the plan remains
fully funded. Employer and employee contribution rates are developed by the Office of the State Actuary to fully fund
the plan. Plan 2 employers and employees are required to pay at the level adopted by the LEOFF Plan 2 Retirement
Board. All employers are required to contribute at the level required by state law. The Legislature, by means of a
special funding arrangement, appropriated money from the state General Fund to supplement the current service
liability and fund the prior service costs of Plan 2 in accordance with the requirements of the Pension Funding Council
and the LEOFF Plan 2 Retirement Board. However, this special funding situation is not mandated by the state
constitution and this funding requirement could be returned to the employers by a change of statute.
The required contribution rates expressed as a percentage of current-year covered payroll, as of December 31, 2008
were as follows:

CITY OF POULSBO FINANCIAL SECTION
2008 COMPREHENSIVE ANNUAL FINANCIAL REPORT Page 65
LEOFF Plan 1 LEOFF Plan 2
Employer* 0.16% 5.46%**
Employee 0.00% 8.83%
State n/a 3.53%
*The employer rates include the employer administrative expense free currently set at 0.16%
** the employer rate for ports and universities is 8.80%
Both the City of Poulsbo and the employees made the required contributions. The City of Poulsbo’s required
contributions for the years ending December 31 were as follows:
LEOFF Plan 1 LEOFF Plan 2
2008 -$ 64,004$
2007 -$ 58,609$
2006 -$ 53,282$
NOTE 7: RISK MANAGEMENT
A. RISK POOL
The City of Poulsbo is a member of the Association of Washington Cities Risk Management Service Agency (AWC
RMSA). Chapter 48.62 RCW authorizes the governing body of any one or more governmental entities to form
together or join a pool or organization for the joint purchasing of insurance, and/or joint self-insuring and/or joint
hiring or contracting for risk management services to the same extent that they may individually purchase insurance,
self-insure or hire or contract for risk management services. An agreement to form a pooling arrangement was made
pursuant to the provisions of Chapter 39.34 RCW, the Interlocal Cooperation Act. The AWC RMSA was formed on
January 1, 1989 when 32 municipalities in the State of Washington joined together by signing an Interlocal
Governmental Agreement to pool their self-insured losses and jointly purchase insurance and administrative services.
Currently, 86 municipalities/entities participate in the pool.
The AWC RMSA allows members to establish a program of joint insurance and provides risk management services to
all members. All coverages are on an occurrence basis. The AWC RMSA provides all risk property, comprehensive
crime, general liability, automobile liability, police liability, public officials’ liability, employee fidelity and faithful
performance, and boiler and machinery coverage. Boiler and machinery is included with the property reinsurance
carrier, as of June 1, 2005, and employee fidelity coverage is a stand-alone policy that the AWC RMSA arranges for
its members. The AWC RMSA also allows members to group purchase airport liability coverages.
Members pay an annual assessment to the AWC RMSA. The AWC RMSA is responsible for payment of all covered
causes of loss against the jurisdiction above the stated retention. AWC RMSA, itself, pays out of its own funds all
claims up to $400,000 for liability and $50,000 for property and thereafter purchases excess liability insurance through
NLC Mutual Insurance Company, up to $1 million, and CV Starr, from $1 million to $5 million. The excess property
coverage is purchased through Allianz, using the Pool’s broker, Arthur J. Gallagher Risk Management Services. Since
the AWC RMSA is a cooperative program, the members of the AWC RMSA are jointly liable.
Members contract to remain in the pool a minimum of three years and must give one-year notice before terminating
participation. The Interlocal Governmental Agreement is renewed automatically each year. Even after termination, a
member is still responsible for contributions to the Pool for any unresolved, unreported, and in-process claims for the
period they were a signatory to the Interlocal Governmental Agreement. The Pool is governed by a board of directors
serving ex-officio as the AWC Board of Directors.

CITY OF POULSBO FINANCIAL SECTION
2008 COMPREHENSIVE ANNUAL FINANCIAL REPORT Page 66
The AWC RMSA establishes a loss fund for both reported and unreported insured events, which includes estimates of
both future payments of losses and related claim adjustment expenses. The specific financials of the AWC RMSA can
be seen in the Annual Report on file with the City of Poulsbo.
B. EMPLOYEE MEDICAL REIMBURSEMENT PLAN
For the Police Association the City purchases a KPS plan with a $500 deductible and then self-insures the portion of
the deductible between $100 and $500. Each employee and their dependants covered by KPS are eligible for an
annual reimbursement of up to $320 ({$500 - $100 = $400} x 80%). The reimbursement is for charges over the $100
deductible, and under the $500 amount, that would have been covered under the KPS $100 deductible plan. The
reimbursement plan has a three-dependent per family maximum that mirrors KPS’s maximum out-of-pocket
component.
To fund this medical reimbursement plan, the City transfers the liability for each employee and the three-dependent
maximum into the Employee Medical Reimbursement Fund. All employee claims for medical reimbursement under
this plan are paid from this fund.
The residual remaining in the fund builds a reserve to fund employee leave cash-outs upon termination. The fund also
provides a reserve for the PERS 1 retirees’ excess compensation.
NOTE 8: CONSTRUCTION AND OTHER SIGNIFICANT COMMITMENTS
NOTE 9: LONG-TERM DEBT
A. BONDS
General Obligation Bonds are a direct obligation of the City for which its full faith and credit are pledged. Debt
service is paid from the Debt Service Funds. Debt service for voter-approved issues is funded by special property tax
levies. Debt service for non-voted issues is funded from the regular property taxes.
At December 31, 2008 the City had seven significant contractual obligations as follows:
Noll Road Improvements Parametrix 3,575$
Long Range Transportation Plan Update David Evans & Associates 5,362
Sewer Comprehensive Plan Update Parametrix 1,298
Viking Avenue Improvement Parametrix 72,690
Dogfish Creek Restoration Jones & Stokes 6,687
Central Poulsbo Drainage Basin Alpha Development 5,849
City Hall Project Lewis Architecture 300,261
395,722$

CITY OF POULSBO FINANCIAL SECTION
2008 COMPREHENSIVE ANNUAL FINANCIAL REPORT Page 67
As of December 31, 2008, the governmental long-term debt of the City consisted of the following:
Issuance
DatePurpose
Original
Issue
Interest
Rates
Maturity
Date
Debt
Outstanding
2002
Limited GO Refunding Bonds: Issue for the
purpose of refunding certain outstanding bond
of the PPDA (Marine Science Center)
255,000 2.5 - 4.8% 2011 95,000
2003
Unlimited GO Bonds: Issued to provide funds to
payoff the Morris property loan and to fund
three transportation projects. The transportation
money will be used to improve Finn Hill Rd,
Caldart Ave and 10th Avenue.
2,505,000 1.10 - 4.55% 2022 1,095,000
2005
Limited GO Bonds: Issued to provide funds to
finance the Municipal Campus Project, which
consists of a 30,000 square foot City hall facility,
including acquisition of land, civil site work and
architecture and engineering costs
5,185,000 3.25 - 4.30% 2025 4,620,000
Total $ 5,810,000
Revenue Bonds are payable from revenues generated by the Water/Sewer Enterprise Fund.
As of December 31, 2008, the long-term debt payable from proprietary fund resources consisted of the following:
1998 Water/Sewer Revenue Bonds (Unrefunded
portion)
$ 4,810,000 3.75 - 4.95% 2012 $ 650,000
2005 Refunding of 1998 Water/Sewer Revenue Bonds 3,134,000 3.45% 2017 3,069,000
Total 3,719,000$
B. PUBLIC WORKS TRUST FUND LOANS
States of Washington Public Works Trust Fund Loans (PWTF) are an intergovernmental loan from the Public Works
Board to undertake local public works projects. These loans are a direct responsibility of the City. Poulsbo currently
has three such loans. The first PWTF loan of $869,025, which is being repaid from the Water/Sewer Fund, was used
for the Jensen Way sewer improvements. The second PWTF loan of $1,412,514, which will be repaid from
governmental funds, is for Front Street reconstruction. The third PWTF loan of $50,000 was used to perform a
comprehensive traffic study to update the city’s comprehensive traffic plan. In 2008, payments for interest of $40,007
and principal retirement of $130,171 were made.
As of December 31, 2008, the long-term debt payable for PWTF loans consisted of the following:
Issuance
DatePurpose
Original
Issue
Interest
Rates
Maturity
Date
Debt
Outstanding
1995 Sewer Improvements to Jensen Way $ 869,025 3.0% 2015 $ 320,934
2000 Street Improvements to Front Street 1,406,930 3.0% 2020 892,420
2003 Traffic Study for Comprehensive Plan 50,000 0.0% 2009 9,955
Total 1,223,309$
C. ADVANCED REFUNDING
The City has three bond issues that have been refunded in prior years with defeased bonds left outstanding. The 1992
Water/Sewer revenue bonds were partially refunded in 1998. The 1988 General Obligation bonds were fully refunded
in 1997. The remaining 1998 Water/Sewer revenue bonds were partially refunded in 2005. Refunded proceeds were

CITY OF POULSBO FINANCIAL SECTION
2008 COMPREHENSIVE ANNUAL FINANCIAL REPORT Page 68
placed in irrevocable trusts. The assured cash flow from these trust funds is sufficient to pay all principal and interest
on these bonds as they become due. Accordingly, these bonds and the corresponding liabilities are not reflected in the
accompanying financial statements. The following outstanding bonds, at December 31, 2008, were considered
defeased:
D. DEBT SERVICE REQUIREMENTS TO MATURITY FOR PRIMARY GOVERNMENT
Principal Interest Total Principal Interest Total
2009 380,000$ 229,118$ 609,118$ 352,000$ 136,541$ 488,541$
2010 375,000 217,473 594,483 370,000 122,672 492,672
2011 390,000 204,205 594,205 383,000 107,969 490,969
2012 375,000 190,750 565,750 396,000 92,546 488,546
2013 325,000 177,140 502,140 414,000 76,521 490,521
2014-2018 1,680,000 689,720 2,369,720 1,804,000 158,217 1,962,217
2019-2023 1,560,000 362,335 1,922,335 - - -
2024-2025 725,000 47,085 772,085 - - -
5,810,000$ 2,117,826$ 7,927,826$ 3,719,000$ 694,465$ 4,413,465$
Year Ended
Dec 31
General Obligation Bonds
Governmental Activities
Revenue Bonds
Business-Type Activities
Principal Interest Total Principal Interest Total
2009 84,323$ 26,773$ 111,096$ 45,848$ 9,628$ 55,476$
2010 74,368 24,542 98,910 45,848 8,253 54,100
2011 74,368 22,310 96,679 45,848 6,877 52,725
2012 74,368 20,079 94,448 45,848 5,502 51,349
2013 74,368 17,848 92,217 45,848 4,126 49,974
2014-2018 371,841 55,776 427,618 91,695 4,126 95,822
2019-2020 148,737 6,693 155,430 - - -
902,375$ 174,022$ 1,076,396$ 320,934$ 38,512$ 359,446$
Year Ended
Dec 31
Public Works Trust Fund Loans
Governmental Activities Business-Type Activities
Advanced Refunding
Amount
Primary Government 580,000$
Business-type Activity 1,435,000

CITY OF POULSBO FINANCIAL SECTION
2008 COMPREHENSIVE ANNUAL FINANCIAL REPORT Page 69
LONG-TERM LIABILITIES
1. Long-term liability activity:
Beginning Ending
Balance Additions Reductions Balance
Governmental Activities
Bonds payable:
General obligation bonds 6,925,000$ -$ 1,115,000$ 5,810,000$
Less Unamortized Bond Discount (53,104) - (3,970) (49,134)
Due to Other Governmental Units 986,698 - 84,323 902,375
Compensated Absences 515,565 39,327 30,433 524,459
Misc NonCurrent Liability - 39,244 - 39,244
Total Governmental activity long-term
liabilities 8,374,159$ 78,571$ 1,225,786$ 7,226,943$
Business-type Activities
Bonds payable:
Revenue Bonds 4,060,000$ -$ 341,000$ 3,719,000$
Less Deferred Amount Refunded (169,327) - (16,933) (152,395)
Less Unamoritzed Bond Discount 0 - - 0
Due to Other Governmental Units 366,782 - 45,848 320,934
Compensated Absences 119,118 32,954 2,717 149,354
Total Business-type activity long-term
liabilities 4,376,572$ 32,954$ 372,632$ 4,036,894$
2. Liabilities due within one year:
Date of
IssueLiabilities Due Within One Year - Governmental Activities
Due within
one year
2002Limited GO Refunding Bonds: Issue for the purpose of refunding certain outstanding bond
of the PPDA (Marine Science Center) 40,000
2003
Unlimited GO Bonds: Issued to provide funds to payoff the Morris property/Muni campus
loan and to fund three transportation projects. The transportation money will be used to
improve Finn Hill Rd, Caldart Ave and 10th Avenue. 140,000
2005
Limited GO Bonds: Issued to provide funds to finance the Municipal Campus Project, which
consists of a 30,000 square foot City hall facility, including acquisition of land, civil site work
and architecture and engineering costs 200,000
2000 Due to Other Governmatal Units(PWTF)-Street Improvements to Front Street 74,368
2003 Due to Other Governmatal Units(PWTF)-Traffic Study for Comprehensive Plan 9,955
Unamortized Bond Discount (3,970)
Compensated Absences 52,446
Total Governmental Activities 512,799$
Date of
IssueLiabilities Due Within One Year - Business-Type Activities
Due within
one year
1998 Water/Sewer Revenue Bonds 150,000$
2005 Water/Sewer Refunded Revenue Bonds 202,000
1995 Due to Other Governmatal Units(PWTF)-Sewer Improvements to Jensen Way 45,848
Deferred Amount Refunded (16,933)
Compensated Absences 14,935
Total Business-Type Activities 395,850$

CITY OF POULSBO FINANCIAL SECTION
2008 COMPREHENSIVE ANNUAL FINANCIAL REPORT Page 70
NOTE 10: CONTINGENCIES AND COMMITMENTS
In the opinion of management, the City's insurance policies and/or self-insurance reserves are adequate to pay all
known or pending claims.
As of December 31, 2008, there were a small number of claims for damages and lawsuits pending against the City. In
the opinion of the City Attorney, however, neither the potential liability for any single claim or lawsuit, nor the
aggregate potential liability arising from all actions currently pending would materially affect the financial condition
of the City. Due to both their uncertainty and immateriality, no liabilities or estimated liabilities have been included in
the City’s financial statements.
The City’s annexation to Fire District #18 in 1999 carried with it two contingencies. The first contingency was the
City’s obligation to continue paying off the General Obligation bonds for the Fire Hall which were originally issued in
1988 and refunded in 1997. The bonds were paid off in 2008. The second contingency is to reimburse to the Fire
District any leave cashed out by employees that was accrued before the annexation. The City’s portion of the
reimbursement is calculated at fifty percent of the cash out. The outstanding leave balances are included with the
City’s compensated absences.
NOTE 11: JOINT VENTURES
In November 1998, the voters approved a measure to create the Poulsbo Library Capital Facilities District along with a
voter approved bond issue of $1.6 million to expand the Poulsbo Library. The Capital Facilities District boundaries
reach beyond the City’s boundaries including areas in the County which are also served by the Kitsap Regional
Library.
The City, Kitsap County, and the Kitsap Regional Library agreed to be jointly responsible for the improvement of the
library with the City being the lead agency for the construction management. The City owns the building and grounds
and is responsible for its continued maintenance.
The financials for the Kitsap County Library Capital Facilities District are available at Kitsap County, Washington.
County information can be obtained from their website at www.kitsapgov.com.
NOTE 12: POSTEMPLOYMENT BENEFITS OTHER THAN PENSIONS
The City has adopted implementation of GASB Statement No. 45 (GASB 45) Accounting and Financial Reporting by
Employers for Postemployment Benefits Other than Pensions and Statement No. 50 (GASB 50) Pension Disclosures.
Plan Description
As required by the Revised Code of Washington (RCW) Chapter 41.26, the City provides lifetime medical care for
members of the Law Enforcement Officers and Firefighters (LEOFF) retirement system hired before October 1, 1977
under a defined benefit healthcare plan administered by the City. The members necessary hospital, medical, and
nursing care expenses not payable by worker’s compensation, social security, insurance provided by another
employer, other pension plan, or any other similar source are covered. Most medical coverage for eligible retirees is
provided by the City’s employee medical insurance program. Under the authorization of the LEOFF Disability Board,
direct payment is made for other retiree medical expenses not covered by standard medical plan benefit provisions.
Financial reporting for the LEOFF retiree healthcare plan is included in the City’s Comprehensive Annual Financial
Report. As of December 31, 2008 the City has two members in this group.
Funding Policy
Funding for LEOFF retiree healthcare costs is provided entirely by the City as required by RCW. The City’s funding
policy is based upon pay-as-you-go financing requirements.

CITY OF POULSBO FINANCIAL SECTION
2008 COMPREHENSIVE ANNUAL FINANCIAL REPORT Page 71
Annual OPEB Cost and Net OPEB Obligation
The City’s annual other post employment benefit (OPEB) cost is calculated based upon the annual required
contribution (ARC), an amount determined using the alternative method permitted under GASB No. 45. A single
retirement age of 56.22 was assumed for all active members for the purpose of determining the actuarial liability.
Termination and mortality rates were assumed to follow the LEOFF 1 termination and mortality rates used in
September 30, 2006 actuarial valuation issued by the Office of State Actuary (OSA). Healthcare costs and trends were
determined by Milliman and used by OSA in the state-wide LEOFF 1 medical performed in 2007. The results were
based on grouped data with 4 active groupings and 4 inactive groupings. The actuarial cost method used to determine
the actuarial accrued liability was Projected Cost Credit. Their assumptions are individually and collectively
reasonable for the purposes of this valuation.
The ARC represents a level of funding that, if paid on an ongoing basis, is projected to cover the normal cost each year
and amortize any unfunded actuarial liabilities over a period of thirty years as of January 1, 2008. The following table
shows the components of the City’s annual OPEB cost for the year, the amount actually contributed to the plan, and
changes in the City’s net OPEB. The net OPEB obligation of $39,244 is included as a non-current liability on the
Statement of Net Assets.
OTHER POST EMPLOYMENT BENEFITS OBLIGATION
YEAR ENDING 12/31/2008
Determination of Annual Required Contribution:
Normal Cost at Year End $0
Amortization of Unfunded
Actuarial Accrued Liability (UAAL) 65,964
Annual Required Contribution $65,964
Determination of Net OPEB Obligation:
Annual Required Contribution $65,964
Interest prior year Net OPEB Obligation 0
Adjustments to ARC 0
Annual OPEB Cost $65,964
Contributions (26,720)
Increase in Net OPEB Obligations $39,244
Net OPEM Obligation-Beginning of Year $0
NET OPEM Obligation-End of Year $39,244
The City's percentage of annual OPEB cost contributed to the plan for 2008 is 41%
Funded Status and Funding Progress
As of January 1, 2008, the most recent actuarial valuation date, the plan was 0% funded. The accrued liability for
benefits was $708,423 and the actuarial value of the assets was $0 resulting in a UAAL of $708,423. Actuarial
valuations involve estimates of the value of reported amounts and assumptions about the probability of occurrence of
events far into the future. Examples include assumptions about future employment, mortality, and the healthcare cost
trend. Amounts determined regarding the funded status of the plan and the annual required contributions of the
employer are subject to continual revision as actual results are compared with past expectations and new estimates are
made about the future. The schedule of funding progress, presented as required supplementary information following
the notes to the financial statements, presents multiyear trend information that shows whether the actuarial value of
plan assets is increasing or decreasing over time relative to the actuarial liabilities for benefits.
CITY OF POULSBO FINANCIAL SECTION
2008 COMPREHENSIVE ANNUAL FINANCIAL REPORT Page 72
Actuarial Methods and Assumptions
Projections of benefits for financial reporting purposes are based on the substantive plan (the plan as understood by the
employer and the plan members) and include the types of benefits provided at the time of each valuation. The actuarial
methods and assumptions used include techniques that are designed to reduce the effects of short-term volatility in
actuarial accrued liabilities, consistent with the long-term perspective of the calculations. In the January 1, 2008
actuarial valuation, the entry age normal actuarial cost method was used. The actuarial assumptions used included a
5.50% discount rate, which is based upon the long-term investment yield on the investments that are expected to be
used to finance payment of benefits. A medical inflation rate of 9%, graded to 5% over eight years was used along
with a long term care inflation rate of 4.5%. The UAAL is being amortized on a closed basis at the assumed discount
rate.
NOTE 13: PRIOR PERIOD ADJUSTMENTS
Adjustments related to prior periods were a result of corrections made to the following funds that were considered to
be of a material value:
General Fund: $20,000 – Prior year correction for advanced business license revenue that was recorded in
December 2007, instead of January 2008.
Street Reserve Fund: $86,123- An Adjustment for the Finn Hill Road Project. When the project was closed out of
construction work in progress it was determined that a portion should have gone to the
Storm Drain Fund. Since this adjustment is capital in nature it is reflected on the
governmental statement but is not reflected on the Statement of Activities because is falls
on the Statement of Net Assets.
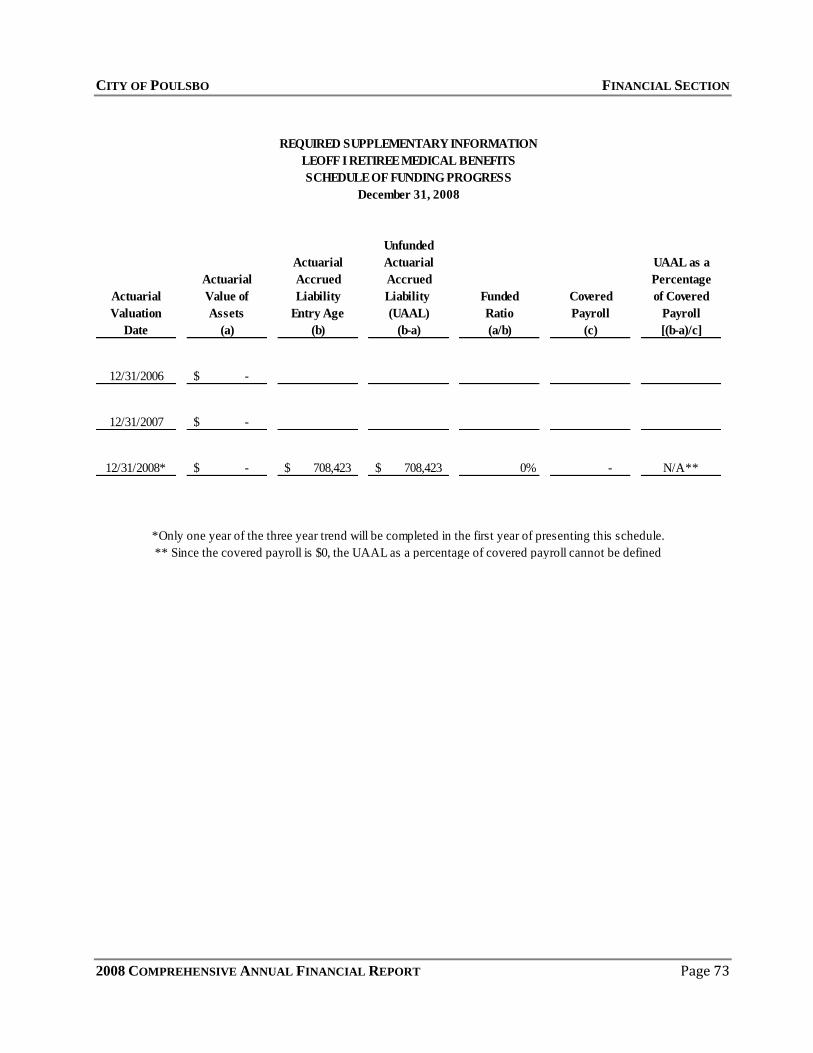
CITY OF POULSBO FINANCIAL SECTION
2008 COMPREHENSIVE ANNUAL FINANCIAL REPORT Page 73
Unfunded
Actuarial Actuarial UAAL as a
Actuarial Accrued Accrued Percentage
Actuarial Value of Liability Liability Funded Covered of Covered
Valuation Assets Entry Age (UAAL) Ratio Payroll Payroll
Date (a) (b) (b-a) (a/b) (c) [(b-a)/c]
12/31/2006 -$
12/31/2007 -$
12/31/2008* -$ 708,423$ 708,423$ 0% - N/A**
LEOFF I RETIREE MEDICAL BENEFITS
*Only one year of the three year trend will be completed in the first year of presenting this schedule.
** Since the covered payroll is $0, the UAAL as a percentage of covered payroll cannot be defined
REQUIRED SUPPLEMENTARY INFORMATION
SCHEDULE OF FUNDING PROGRESS
December 31, 2008

CITY OF POULSBO FINANCIAL SECTION
2008 COMPREHENSIVE ANNUAL FINANCIAL REPORT Page 74
THIS PAGE INTENTIONALLY LEFT BLANK

CITY OF POULSBO FINANCIAL SECTION
2008 COMPREHENSIVE ANNUAL FINANCIAL REPORT Page 75
NONMAJOR GOVERNMENTAL FUNDS
Special Revenue Funds
Special Revenue Funds are established to account for the proceeds of specific revenue sources that are legally
restricted to expenditures for specific purposes.
The City Street Fund accounts for monies received and expenditures made to provide general governmental services
for the administration of street-oriented maintenance and repair
The Arterial Street Fund accounts for the receipt and expenditure of the State-levied motor vehicle fuel taxes
distributed to the City in accordance with State RCW 82.36.020. Revenues are used for construction, improvement,
chip sealing, seal coating, and repair of arterial streets or for payment of related municipal indebtedness.
The Recreation Activity Fund accounts for the transaction of the City’s park and recreation activities financed, in
part, by user fees.
The Capital Improvements Fund accounts for the receipt and expenditure of the first ¼ of 1% real estate excise tax
authorized by State RCW 82.46. These revenues are dedicated for capital purposes defined in RCW 35.43.040,
including public buildings and facilities.
The Cumulative Reserve/Revenue Stabilization Fund is to provide monies for the stabilization of revenues in the
event of a revenue shortfall and in order to meet unanticipated expenditures incurred in connection with further
operations.
The Cumulative Reserve Fund accounts for all traffic and sidewalk mitigation fees collected from developers.
The Historic Downtown Poulsbo Association accounts for the assessments collected by the City for the use by the
downtown business improvement area expenses to promote downtown business.
The Marine Science Center Fund is to receipt and disburse lease payments for the Poulsbo Public Development
Authority Marine Science Center Building.
The Paths & Trails Fund receives its funding from the .5 of the State fuel taxes to be used specifically for paths and
trails reserves.
The Drug Enforcement Fund accounts for monies and property seized during drug investigations per RCW
69.50.505. All monies paid into the funds are to be used by the police department for drug enforcement purposes.
The Transient Occupancy Fund accounts for the City’s share of the hotel-motel taxes for the purpose of promoting
tourism.
The Police Restricted Fund accounts for various revenues to be used specifically for criminal justice activities.
Debt Service Funds
Debt Service Funds account for the accumulation of resources for and the payment of general obligation and special
assessment bonds.
The Miscellaneous Governmental Debt was created in 2003 to account for the revenue and debt expenditures
associated with miscellaneous governmental debt. Beginning in 2003 the Public Works Trust Fund Loans will be
accounted for in this fund. Previously the Public Works Trust Fund loan was accounted for in Fund 204 – Non-Voted
General Obligation Debt.

CITY OF POULSBO FINANCIAL SECTION
2008 COMPREHENSIVE ANNUAL FINANCIAL REPORT Page 76
The Non-Voted General Obligation Debt accounts for the debt service on Council approved general obligation debt.
Currently this includes two bond issues and the postage machine lease.
The Voted General Obligation Bonds accounts for the debt service on voter approved general obligation bonds. The
Fire Hall bonds are the only bonds outstanding.
The L.I.D. Fund includes the guaranty monies authorized by law to insure that no bonds or notes will be left unpaid
when all of the assessments from approved local improvement districts have been received. Revenue is from property
taxes and from money remaining on L.I.D.’s after all debt obligations have been met. The fund also provides
accounting for LID assessments collected and bonds paid. Currently all LID bonds and assessment accounts are paid.
Capital Projects Funds
Capital Projects Funds account for the acquisition or construction of capital facilities (except for those financed
primarily by proprietary funds). These funds are financed primarily by general obligation bonds, special assessments,
federal and state grants and contributions from other funds. Budget-to-Actual for the one major capital project funds
is also presented here. The fund name is italicized for identification purposes.
The Equipment Acquisition Fund was established to account for money used to replace existing capital equipment.
Funding for the purchases is from a percentage of sales tax revenues.
The Park Reserve Fund was established to account for money used for improvements to the City parks and the urban
forestry program. Funding is from a transfer from the General Fund.
The Library Improvement Fund was established to make improvements to the library. Currently funding is by
donation and transfers from the General Fund as needed.
The Recreation Reserve Fund was established to build reserves from donations from individuals and organizations
for park and recreation equipment.
The Park Acquisition Fund was established to account for park mitigation fees paid by developers.
The Museum Reserve Fund was established to account for donations toward the future creation of a city museum.
The Cemetery Reserve Fund was established to account for money collected from gravesite sales used to make
improvements to the City cemetery.
The Street Equipment Reserve Fund was established to build reserves for the purchase of street equipment.
Permanent Fund
Permanent funds are used to report resources that are legally restricted to the extent that only earnings, not principal,
may be used for purposes that support the reporting government’s programs.
The Bernice Borgen Beautification Fund is used to account for principal trust amounts received from Bernice
Bjorgen estate and related interest income. The interest portion of the trust can be used for the beautification of the
City.

CITY OF POULSBO FINANCIAL SECTION
2008 COMPREHENSIVE ANNUAL FINANCIAL REPORT Page 77
THIS PAGE INTENTIONALLY LEFT BLANK

CITY OF POULSBO FINANCIAL SECTION
2008 COMPREHENSIVE ANNUAL FINANCIAL REPORT Page 78
City Streets
Arterial
Streets
Recreation
Activity
Capital
Improvements
Cumulative
Reserve/Rev
Stablization
Assets
Cash and Cash Equivalents 13,494$ -$ 1,644$ 189$ 25,107$
Investments 702,465 - 84,203 187,577 1,699,544
Receivables:
Taxes - - - 35,661 -
Accounts 623 - 1,576 - -
Special Assesments - - - - -
Due from Other Governments - - - - -
Cash and Investments-Restricted - - - - -
Total Assets 716,582$ -$ 87,423$ 223,428$ 1,724,651$
Liabilities and Fund Balances
Liabilities
Accounts Payable 17,041$ -$ 8,436$ -$ -$
Custodial Accounts - - 100 - -
Deferred Revenue - - 71,877 - -
Total Liabilities 17,041 - 80,413 - -
Fund Balances
Reserved fund balance for debt service - - - - -
Reserved fund balance for city beautification - - - - -
Unreserved Fund Balance 699,542 - 7,011 223,428 1,724,651
Total Fund Balance 699,542 - 7,011 223,428 1,724,651
Total Liabilities and Fund Balances 716,582$ -$ 87,423$ 223,428$ 1,724,651$
COMBINING BALANCE SHEET
DECEMBER 31, 2008
NONMAJOR GOVERNMENTAL FUNDS
Page 1 of 6
Special Revenue

CITY OF POULSBO FINANCIAL SECTION
2008 COMPREHENSIVE ANNUAL FINANCIAL REPORT Page 79
Cumulative
Reserve
Historic
Downtown
Poulsbo
Association
Marine
Science
Center
Paths and
Trails
Drug
Enforcement
Transient
Occupancy
Police
Restricted
Funds
Total Non-
Major Special
Revenue
Funds
2,561$ 287$ 159$ 871$ 58$ 33$ 24$ 44,428$
212,788 12,515 84,637 6,872 17,446 31,200 207,214 3,246,461
- - - - - - 31 35,692
- - 2,156 - - - - 4,356
- 20,019 - - - - - 20,019
- - - - - - - -
- - - - - - - -
215,349$ 32,821$ 86,953$ 7,742$ 17,505$ 31,233$ 207,269$ 3,350,956$
-$ 2,557$ 16$ -$ 760$ 4,932$ 154$ 33,895$
- - - - - - - 100
- 11,130 - - - - - 83,007
- 13,687 16 - 760 4,932 154 117,002
- - - - - - - -
- - - - - - - -
215,349 19,134 86,937 7,742 16,744 26,301 207,114 3,233,954
215,349 19,134 86,937 7,742 16,744 26,301 207,114 3,233,954
215,349$ 32,821$ 86,953$ 7,742$ 17,505$ 31,233$ 207,269$ 3,350,956$
COMBINING BALANCE SHEET
NONMAJOR GOVERNMENTAL FUNDS
DECEMBER 31, 2008
Page 2 of 6
Special Revenue

CITY OF POULSBO FINANCIAL SECTION
2008 COMPREHENSIVE ANNUAL FINANCIAL REPORT Page 80
Misc
Governmental
Debt
Non-Voted
G.O. Debt
Voted G.O.
Bonds LID Fund
Total Non-
Major Debt
Service Funds
Assets
Cash and Cash Equivalents -$ 8,124$ 23$ -$ 8,147$
Investments 1,263 61,898 207 22 63,390
Receivables: -
Taxes - - 54 - 54
Accounts - 1 - - 1
Special Assesments - - - - -
Due from Other Governments - - - - -
Cash and Investments-Restricted - - - - -
Total Assets 1,263$ 70,023$ 284$ 22$ 71,592$
Liabilities and Fund Balances
Liabilities
Accounts Payable -$ -$ -$ -$ -$
Custodial Accounts - 1,728 - - 1,728
Deferred Revenue - 1,000 - - 1,000
Total Liabilities - 2,728 - - 2,728
Fund Balances
Reserved fund balance for debt service 1,263 67,296 284 22 68,865
Reserved fund balance for city beautification - - - - -
Unreserved Fund Balance - - - - -
Total Fund Balance 1,263 67,296 284 22 68,865
Total Liabilities and Fund Balances 1,263$ 70,023$ 284$ 22$ 71,592$
Debt Service
Page 3 of 6
COMBINING BALANCE SHEET
NONMAJOR GOVERNMENTAL FUNDS
DECEMBER 31, 2008

CITY OF POULSBO FINANCIAL SECTION
2008 COMPREHENSIVE ANNUAL FINANCIAL REPORT Page 81
Equipment
Acquisition
Park
Reserve
Library
Improvement
Recreation
Reserve
Park
Acquisition
Museum
Reserve
30,907$ 30,760$ -$ 289$ 68$ -$
435,107 178,476 109 1,164 182,527 6,526
- - - - - -
- 46,085 - - - -
- - - - - -
- 15,626 - - - -
- - - - - -
466,014$ 270,947$ 109$ 1,453$ 182,595$ 6,526$
-$ 42,758$ -$ -$ -$ -$
- - - - - -
- - - - - -
- 42,758 - - - -
- - - - - -
- - - - - -
466,014 228,189 109 1,453 182,595 6,526
466,014 228,189 109 1,453 182,595 6,526
466,014$ 270,947$ 109$ 1,453$ 182,595$ 6,526$
Capital Project
COMBINING BALANCE SHEET
NONMAJOR GOVERNMENTAL FUNDS
DECEMBER 31, 2008
Page 4 of 6
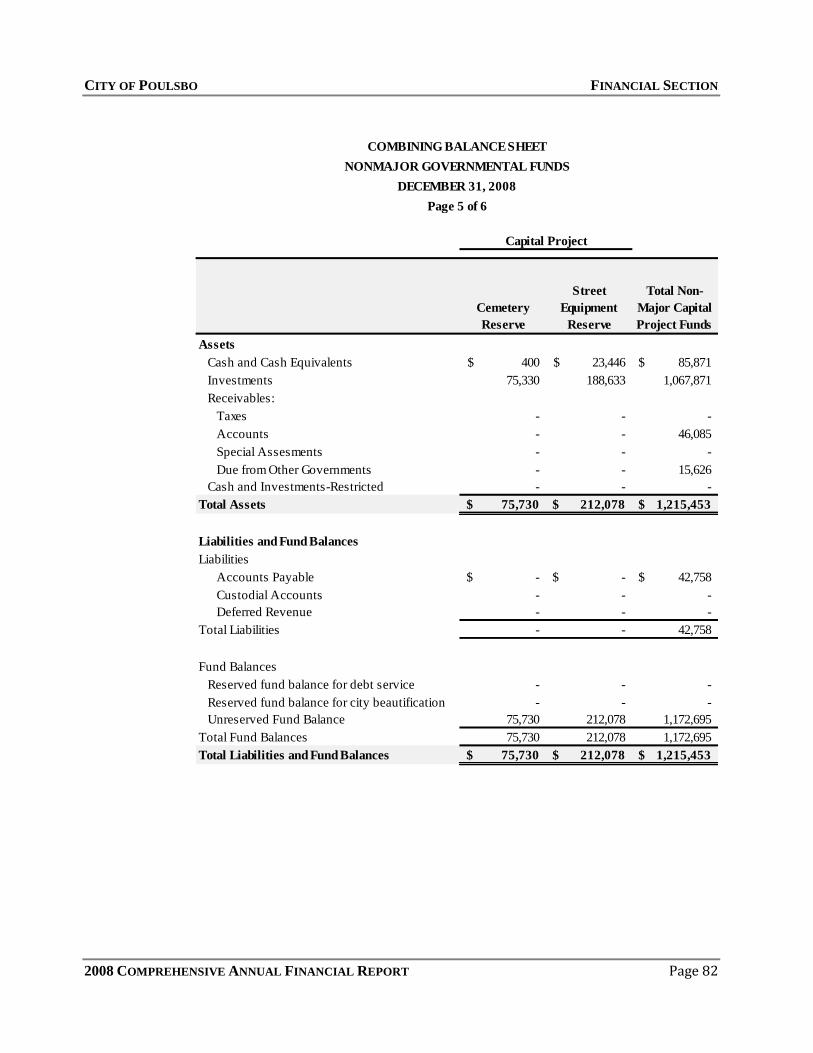
CITY OF POULSBO FINANCIAL SECTION
2008 COMPREHENSIVE ANNUAL FINANCIAL REPORT Page 82
Cemetery
Reserve
Street
Equipment
Reserve
Total Non-
Major Capital
Project Funds
Assets
Cash and Cash Equivalents 400$ 23,446$ 85,871$
Investments 75,330 188,633 1,067,871
Receivables:
Taxes - - -
Accounts - - 46,085
Special Assesments - - -
Due from Other Governments - - 15,626
Cash and Investments-Restricted - - -
Total Assets 75,730$ 212,078$ 1,215,453$
Liabilities and Fund Balances
Liabilities
Accounts Payable -$ -$ 42,758$
Custodial Accounts - - -
Deferred Revenue - - -
Total Liabilities - - 42,758
Fund Balances
Reserved fund balance for debt service - - -
Reserved fund balance for city beautification - - -
Unreserved Fund Balance 75,730 212,078 1,172,695
Total Fund Balances 75,730 212,078 1,172,695
Total Liabilities and Fund Balances 75,730$ 212,078$ 1,215,453$
Capital Project
COMBINING BALANCE SHEET
NONMAJOR GOVERNMENTAL FUNDS
DECEMBER 31, 2008
Page 5 of 6
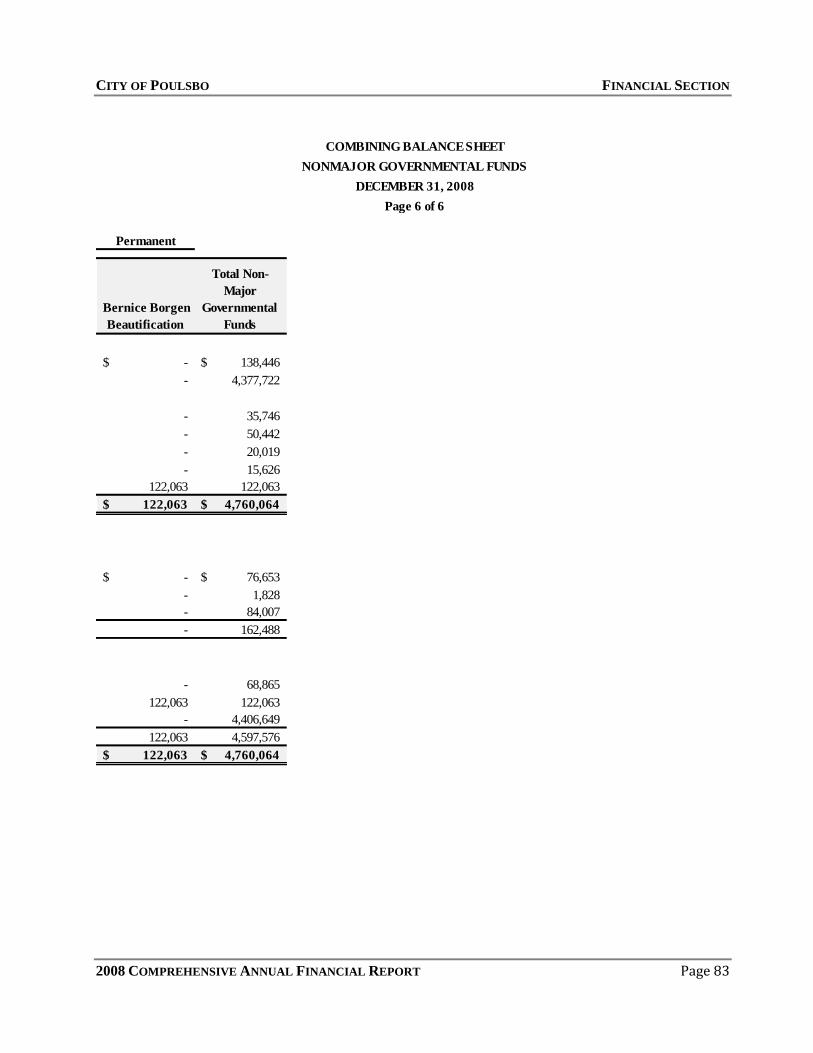
CITY OF POULSBO FINANCIAL SECTION
2008 COMPREHENSIVE ANNUAL FINANCIAL REPORT Page 83
Permanent
Bernice Borgen
Beautification
Total Non-
Major
Governmental
Funds
-$ 138,446$
- 4,377,722
- 35,746
- 50,442
- 20,019
- 15,626
122,063 122,063
122,063$ 4,760,064$
-$ 76,653$
- 1,828
- 84,007
- 162,488
- 68,865
122,063 122,063
- 4,406,649
122,063 4,597,576
122,063$ 4,760,064$
COMBINING BALANCE SHEET
NONMAJOR GOVERNMENTAL FUNDS
DECEMBER 31, 2008
Page 6 of 6

CITY OF POULSBO FINANCIAL SECTION
2008 COMPREHENSIVE ANNUAL FINANCIAL REPORT Page 84
City
Streets
Arterial
Streets Recreation
Capital
Improvements
Cumulative
Reserve
Revenue
Stabilization
Revenues
Taxes -$ -$ -$ 542,251$ -$
Licenses and Permits 7,096 - - - -
Intergovernmental 174,126 - - - -
Charges for Services - - 486,872 - -
Fines and Forfeitures - - - - -
Interest and Other Earnings 25,992 - 2,277 22,341 54,409
Miscellaneous - - 7,655 - -
Total Revenues 207,214 - 496,804 564,592 54,409
Expenditures
Current:
General Government - - - - -
Security of Persons & Property - - - - -
Utilit ies and Environment - - - - -
T ransportation 980,507 - - - -
Economic Environment - - - - -
Mental and Physical Health - - - - -
Culture and Recreation - - 657,583 - -
Debt Service:
Principal - - - - -
Interest & Fiscal Charges - - - - -
Capital Outlay - - - - -
Total Expenditures 980,507 - 657,583 - -
Excess of Revenues over Expenditures (773,293) - (160,780) 564,592 54,409
O ther Financing Sources (Uses)
Transfers In 864,799 - 161,006 - 934,372
T ransfers Out (406,083) - - (944,388) (301,205)
Disposal of Capital Assets - - - - -
Total O ther Financing Sources and Uses 458,715 - 161,006 (944,388) 633,167
Net Change in Fund Balances (314,578) - 226 (379,795) 687,576
Fund Balances - Beginning 994,409 19,711 6,785 603,223 1,037,076
Prior Year Adjustment
Fund Balances - Ending 699,542$ -$ 7,011$ 223,428$ 1,724,651$
Special Revenue
COMBINING STATEMENT OF REVENUES, EXPENDITURES AND CHANGES IN FUND BALANCES
NONMAJOR GOVERNMENTAL FUNDS
FOR YEAR ENDED DECEMBER 31, 2008
Page 1 of 6

CITY OF POULSBO FINANCIAL SECTION
2008 COMPREHENSIVE ANNUAL FINANCIAL REPORT Page 85
Cumulative
Reserve
Historic
Downtown
Poulsbo
Association
Marine
Science
Center
Paths
and Trails
Drug
Enforcement
Transient
O ccupancy
Police
Restricted
Funds
Total Non-
Major Special
Revenue Funds
-$ -$ -$ -$ -$ 126,246$ 99,984$ 768,481$
- - - - - - - 7,096
- - - - 4,643 - 17,438 196,206
44,428 - - - - - - 531,300
- - - - - - 580 580
3,821 1,161 1,894 117 252 670 4,005 116,939
- 46,910 - - 5,579 - - 60,144
48,249 48,071 1,894 117 10,474 126,917 122,006 1,680,747
- - - - - - - -
- - - - 6,105 - 10,177 16,282
- - - - - - - -
- - - - - - - 980,507
- - - - - - - -
- - - - - - - -
- 47,081 3,811 - - 133,683 - 842,158
- - - - - - - -
- - - - - - - -
- - - - - - 61,943 61,943
- 47,081 3,811 - 6,105 133,683 72,121 1,900,891
48,249 990 (1,917) 117 4,369 (6,766) 49,886 (220,145)
- - - 871 - - - 1,961,047
(35,000) - (30,030) - - - (28,000) (1,744,706)
- - - - - - - -
(35,000) - (30,030) 871 - - (28,000) 216,341
13,249 990 (31,947) 987 4,369 (6,766) 21,886 (3,804)
202,100 18,144 118,884 6,755 12,376 33,068 185,229 3,237,757
-
215,349$ 19,134$ 86,937$ 7,742$ 16,744$ 26,301$ 207,114$ 3,233,954$
COMBINING STATEMENT OF REVENUES, EXPENDITURES AND CHANGES IN FUND BALANCES
NONMAJOR GOVERNMENTAL FUNDS
FOR YEAR ENDED DECEMBER 31, 2008
Page 2 of 6
Special Revenue

CITY OF POULSBO FINANCIAL SECTION
2008 COMPREHENSIVE ANNUAL FINANCIAL REPORT Page 86
Misc
Government
al Debt
Non-Voted
G.O . Debt
Voted G.O .
Bonds
LID
Fund
Total Non-
Major Debt
Service
Funds
Revenues
Taxes -$ -$ 1,301$ -$ 1,301$
Licenses and Permits - - - - -
Intergovernmental - - - - -
Charges for Services - 10,634 - - 10,634
Fines and Forfeitures - - - - -
Interest and Other Earnings 366 22,296 1,054 0 23,716
Miscellaneous - - - - -
Total Revenues 366 32,930 2,356 0 35,651
Expenditures
Current:
General Government - - - - -
Security of Persons & Property - - - - -
Utilit ies and Enviroment - - - - -
T ransportation - - - - -
Economic Enviroment - - - - -
Mental and Physical Health - - - - -
Culture and Recreation - - - - -
Debt Service:
Principal 84,323 955,000 160,000 - 1,199,323
Interest & Fiscal Charges 29,004 269,827 4,360 - 303,190
Capital Outlay - - - - -
Total Expenditures 113,327 1,224,827 164,360 - 1,502,514
Excess of Revenues over Expenditures (112,961) (1,191,897) (162,004) 0 (1,466,862)
O ther Financing Sources (Uses)
Transfers In 113,455 613,922 - - 727,377
T ransfers Out - - (21,720) - (21,720)
Disposal of Capital Assets - - - - -
Total O ther Financing Sources and Uses 113,455 613,922 (21,720) - 705,657
Net Change in Fund Balances 494 (577,975) (183,724) 0 (761,205)
Fund Balances - Beginning 769 645,271 184,008 22 830,070
Prior Year Adjustment
Fund Balances - Ending 1,263$ 67,296$ 284$ 22$ 68,865$
Debt Service
COMBINING STATEMENT OF REVENUES, EXPENDITURES AND CHANGES IN FUND BALANCES
NONMAJOR GOVERNMENTAL FUNDS
FOR YEAR ENDED DECEMBER 31, 2008
Page 3 of 6

CITY OF POULSBO FINANCIAL SECTION
2008 COMPREHENSIVE ANNUAL FINANCIAL REPORT Page 87
Equipment
Acquisition
Park
Reserve
Library
Improvement
Recreation
Reserve
Park
Acquisition Museum Reserve
-$ -$ -$ -$ -$ -$
- - - - - -
- 152,493 - - - -
- 1,660 - - 27,400 -
- - - - - -
7,148 4,301 2 22 4,006 124
- 4,914 - 44 - -
7,148 163,368 2 66 31,406 124
48,883 - - - - -
- - - - - -
4,185 14,753 - - - -
- - - - - -
6,761 - - - - -
- - - - - -
9,118 399,104 - - - -
- - - - - -
- - - - - -
119,400 193,550 - - - -
188,346 607,407 - - - -
(181,198) (444,039) 2 66 31,406 124
308,688 434,649 - - - -
(30,000) - - - (40,740) -
- - - - - -
278,688 434,649 - - (40,740) -
97,490 (9,390) 2 66 (9,334) 124
368,524 237,579 107 1,387 191,930 6,402
466,014$ 228,189$ 109$ 1,453$ 182,595$ 6,526$
Capital Project
COMBINING STATEMENT OF REVENUES, EXPENDITURES AND CHANGES IN FUND BALANCES
NONMAJOR GOVERNMENTAL FUNDS
FOR YEAR ENDED DECEMBER 31, 2008
Page 4 of 6
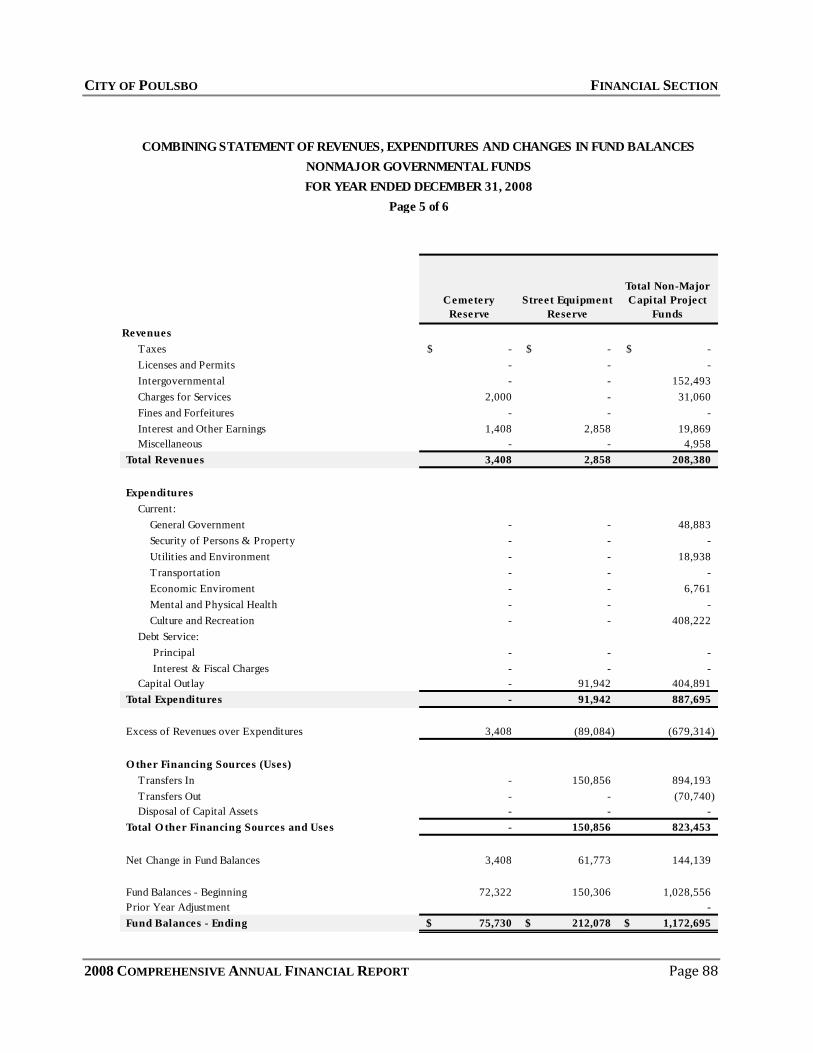
CITY OF POULSBO FINANCIAL SECTION
2008 COMPREHENSIVE ANNUAL FINANCIAL REPORT Page 88
Cemetery
Reserve
Street Equipment
Reserve
Total Non-Major
Capital Project
Funds
Revenues
Taxes -$ -$ -$
Licenses and Permits - - -
Intergovernmental - - 152,493
Charges for Services 2,000 - 31,060
Fines and Forfeitures - - -
Interest and Other Earnings 1,408 2,858 19,869
Miscellaneous - - 4,958
Total Revenues 3,408 2,858 208,380
Expenditures
Current:
General Government - - 48,883
Security of Persons & Property - - -
Utilit ies and Environment - - 18,938
T ransportation - - -
Economic Enviroment - - 6,761
Mental and Physical Health - - -
Culture and Recreation - - 408,222
Debt Service:
Principal - - -
Interest & Fiscal Charges - - -
Capital Outlay - 91,942 404,891
Total Expenditures - 91,942 887,695
Excess of Revenues over Expenditures 3,408 (89,084) (679,314)
O ther Financing Sources (Uses)
Transfers In - 150,856 894,193
T ransfers Out - - (70,740)
Disposal of Capital Assets - - -
Total O ther Financing Sources and Uses - 150,856 823,453
Net Change in Fund Balances 3,408 61,773 144,139
Fund Balances - Beginning 72,322 150,306 1,028,556
Prior Year Adjustment -
Fund Balances - Ending 75,730$ 212,078$ 1,172,695$
COMBINING STATEMENT OF REVENUES, EXPENDITURES AND CHANGES IN FUND BALANCES
NONMAJOR GOVERNMENTAL FUNDS
FOR YEAR ENDED DECEMBER 31, 2008
Page 5 of 6

CITY OF POULSBO FINANCIAL SECTION
2008 COMPREHENSIVE ANNUAL FINANCIAL REPORT Page 89
Permanent
Bernice Borgen
Beautification
Total Nonmajor
Governmental Funds
-$ 769,783$
- 7,096
- 348,699
- 572,994
- 580
4,520 165,044
- 65,102
4,520 1,929,299
- 48,883
- 16,282
- 18,938
- 980,507
- 6,761
- -
- 1,250,380
- 1,199,323
- 303,190
- 466,835
- 4,291,100
4,520 (2,361,801)
- 3,582,617
- (1,837,166)
- -
- 1,745,452
4,520 (616,349)
117,542 5,213,925
-
122,063$ 4,597,576$
COMBINING STATEMENT OF REVENUES, EXPENDITURES AND CHANGES IN FUND BALANCES
NONMAJOR GOVERNMENTAL FUNDS
FOR YEAR ENDED DECEMBER 31, 2008
Page 6 of 6

CITY OF POULSBO FINANCIAL SECTION
2008 COMPREHENSIVE ANNUAL FINANCIAL REPORT Page 90
THIS PAGE INTENTIONALLY LEFT BLANK

CITY OF POULSBO FINANCIAL SECTION
2008 COMPREHENSIVE ANNUAL FINANCIAL REPORT Page 91
Final Budget Actual Amounts
Variance with
Final Budget -
Positive (Negative)
Revenue
License and Permits 3,000$ 7,096$ 4,096$
Intergovernmental 189,680 174,126 (15,554)
Interest and Other Earnings - 25,992 25,992
Total Revenues 192,680 207,214 14,534
Expenditures
Transportation:
Street Maintenance 1,036,317 980,507 55,810
Total Expenditures 1,036,317 980,507 55,810
Excess of Revenues Under Expenditures (843,637) (773,293) 70,344
Other Financing Sources (Uses)
Transfers in 881,753 864,799 (16,954)
Transfers out (455,098) (406,083) (49,015)
Total Other Financing Sources (Uses) 426,655 458,715 32,060
Net Change in Fund Balance (416,982) (314,578) 102,404
Fund Balance Beginning of Year 1,014,119 994,409 (19,711)
Fund Balance End of Year 597,137$ 699,542$ 102,405$
CITY STREET FUND
SCHEDULE OF REVENUES, EXPENDITURES, AND CHANGES IN FUND BALANCES
BUDGET TO ACTUAL
FOR THE YEAR ENDED DECEMBER 31, 2008

CITY OF POULSBO FINANCIAL SECTION
2008 COMPREHENSIVE ANNUAL FINANCIAL REPORT Page 92
Final Budget Actual Amounts
Variance with
Final Budget -
Positive (Negative)
Revenues
Intergovernmental:
State fuel tax -$ -$ -$
Interest and Other Earnings - - -
Total Revenues - - -
Expenditures
General Administration - - -
Total Expenditures - - -
Excess of Revenues Over Expenditures - - -
Other Financing Sources (Uses)
Transfers out - - -
Total Other Financing Sources (Uses) - - -
Net Change in Fund Balance - - -
Fund Balance Beginning of Year - 19,711 19,711
Fund Balance End of Year -$ (0)$ (0)$
ARTERIAL STREET FUND
SCHEDULE OF REVENUES, EXPENDITURES, AND CHANGES IN FUND BALANCES
FOR THE YEAR ENDED DECEMBER 31, 2008
BUDGET TO ACTUAL

CITY OF POULSBO FINANCIAL SECTION
2008 COMPREHENSIVE ANNUAL FINANCIAL REPORT Page 93
Final Budget Actual Amounts
Variance with
Final Budget -
Positive (Negative)
Revenues
Culture and Recreation:
Amusement and Recreation 499,700$ 93,416$ (406,284)$
Adult Program - 14,856 14,856
Adventure Program - 22,273 22,273
Arts and Crafts Program - 15,483 15,483
Body & Mind Program - - -
Bus & Computer Program - 50 50
Dance Program - 27,128 27,128
Music Program - 31,940 31,940
Senior Program - 18,493 18,493
Sport and Fitness Program - 231,843 231,843
Youth Program - 39,046 39,046
Interest and Other Earnings 2,000 2,277 277
Total Revenues 501,700 496,804 (4,896)
Expenditures
Culture and Recreation:
Administration 440,322 433,142 7,181
Adventure Program 13,262 12,492 770
Adult Program 11,300 10,507 793
Arts and Crafts Program 8,700 8,799 (99)
Bus & Computer Program 600 - 600
Dance Program 19,000 15,147 3,853
Music Program 18,500 25,931 (7,431)
Senior Program 14,000 13,515 485
Sport and Fitness Program 123,750 124,841 (1,091)
Youth Program 13,200 13,209 (9)
Total Expenditures 662,634 657,583 5,051
Excess of Revenues Under Expenditures (160,934) (160,780) 155
Other Financing Sources (Uses)
Transfers in 161,006 161,006 0
Transfers Out - - -
Total Other Financing Sources (Uses) 161,006 161,006 0
Net Change in Fund Balance 72 226 155
Fund Balance Beginning of Year 6,830 6,785 (45)
Fund Balance End of Year 6,902$ 7,011$ 109$
RECREATION ACTIVITY FUND
SCHEDULE OF REVENUES, EXPENDITURES, AND CHANGES IN FUND BALANCES
BUDGET TO ACTUAL
FOR THE YEAR ENDED DECEMBER 31, 2008

CITY OF POULSBO FINANCIAL SECTION
2008 COMPREHENSIVE ANNUAL FINANCIAL REPORT Page 94
Final Budget Actual Amounts
Variance with
Final Budget -
Positive (Negative)
Revenues
Taxes:
Excise Tax 600,000$ 542,251$ (57,749)$
Interest and Other Earnings 5,000 22,341 17,341
Total Revenues 605,000 564,592 (40,408)
Expenditures
Current:
Miscellaneous - - -
Total Expenditures - - -
Excess of Revenues Over Expenditures 605,000 564,592 (40,408)
Other Financing Sources (Uses)
Transfers out (951,363) (944,388) (6,975)
Total Other Financing Sources (Uses) (951,363) (944,388) (6,975)
Net Change in Fund Balance (346,363) (379,795) (33,432)
Fund Balance Beginning of Year 603,223 603,223 -
Fund Balance End of Year 256,860$ 223,428$ (33,432)$
CAPITAL IMPROVEMENT FUND
SCHEDULE OF REVENUES, EXPENDITURES, AND CHANGES IN FUND BALANCES
FOR THE YEAR ENDED DECEMBER 31, 2008
BUDGET TO ACTUAL
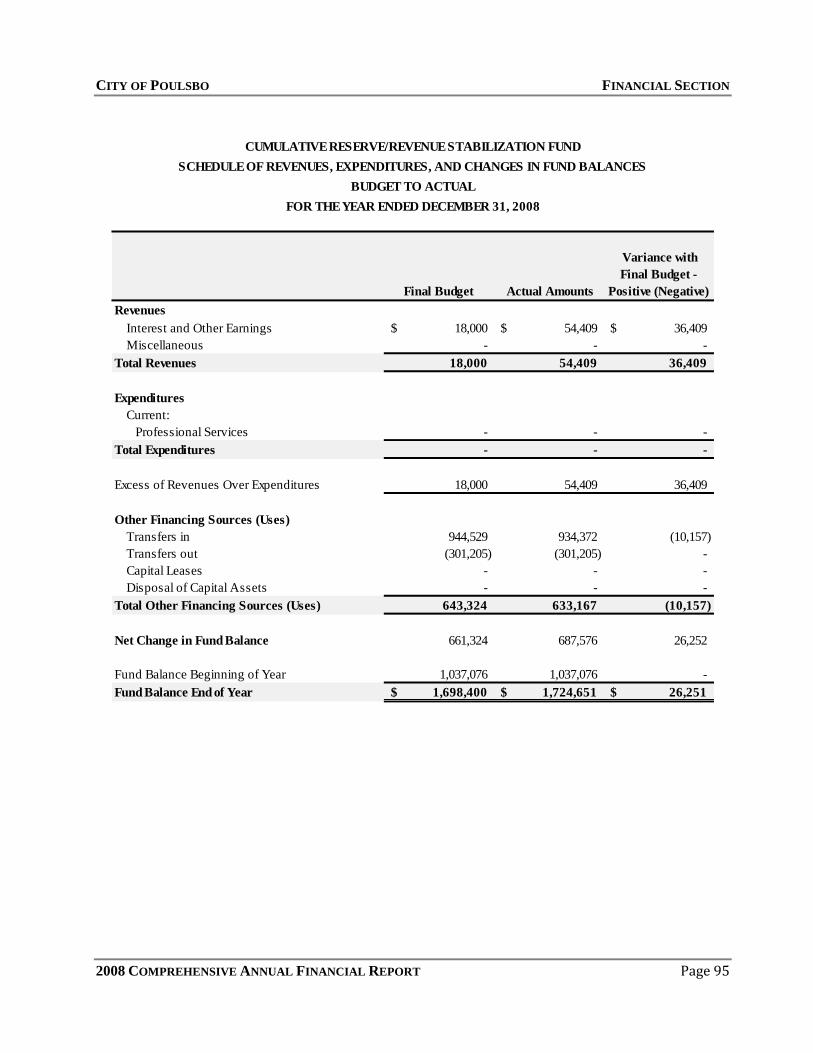
CITY OF POULSBO FINANCIAL SECTION
2008 COMPREHENSIVE ANNUAL FINANCIAL REPORT Page 95
Final Budget Actual Amounts
Variance with
Final Budget -
Positive (Negative)
Revenues
Interest and Other Earnings 18,000$ 54,409$ 36,409$
Miscellaneous - - -
Total Revenues 18,000 54,409 36,409
Expenditures
Current:
Professional Services - - -
Total Expenditures - - -
Excess of Revenues Over Expenditures 18,000 54,409 36,409
Other Financing Sources (Uses)
Transfers in 944,529 934,372 (10,157)
Transfers out (301,205) (301,205) -
Capital Leases - - -
Disposal of Capital Assets - - -
Total Other Financing Sources (Uses) 643,324 633,167 (10,157)
Net Change in Fund Balance 661,324 687,576 26,252
Fund Balance Beginning of Year 1,037,076 1,037,076 -
Fund Balance End of Year 1,698,400$ 1,724,651$ 26,251$
CUMULATIVE RESERVE/REVENUE STABILIZATION FUND
SCHEDULE OF REVENUES, EXPENDITURES, AND CHANGES IN FUND BALANCES
FOR THE YEAR ENDED DECEMBER 31, 2008
BUDGET TO ACTUAL
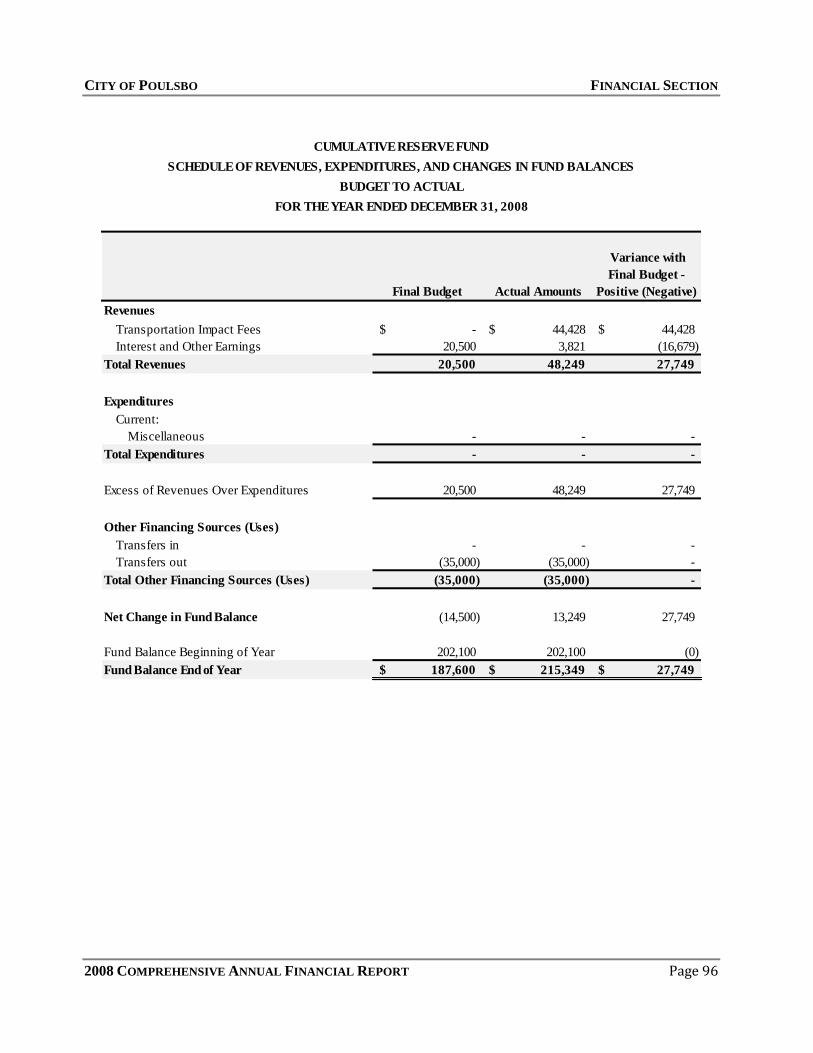
CITY OF POULSBO FINANCIAL SECTION
2008 COMPREHENSIVE ANNUAL FINANCIAL REPORT Page 96
Final Budget Actual Amounts
Variance with
Final Budget -
Positive (Negative)
Revenues
Transportation Impact Fees -$ 44,428$ 44,428$
Interest and Other Earnings 20,500 3,821 (16,679)
Total Revenues 20,500 48,249 27,749
Expenditures
Current:
Miscellaneous - - -
Total Expenditures - - -
Excess of Revenues Over Expenditures 20,500 48,249 27,749
Other Financing Sources (Uses)
Transfers in - - -
Transfers out (35,000) (35,000) -
Total Other Financing Sources (Uses) (35,000) (35,000) -
Net Change in Fund Balance (14,500) 13,249 27,749
Fund Balance Beginning of Year 202,100 202,100 (0)
Fund Balance End of Year 187,600$ 215,349$ 27,749$
CUMULATIVE RESERVE FUND
SCHEDULE OF REVENUES, EXPENDITURES, AND CHANGES IN FUND BALANCES
FOR THE YEAR ENDED DECEMBER 31, 2008
BUDGET TO ACTUAL
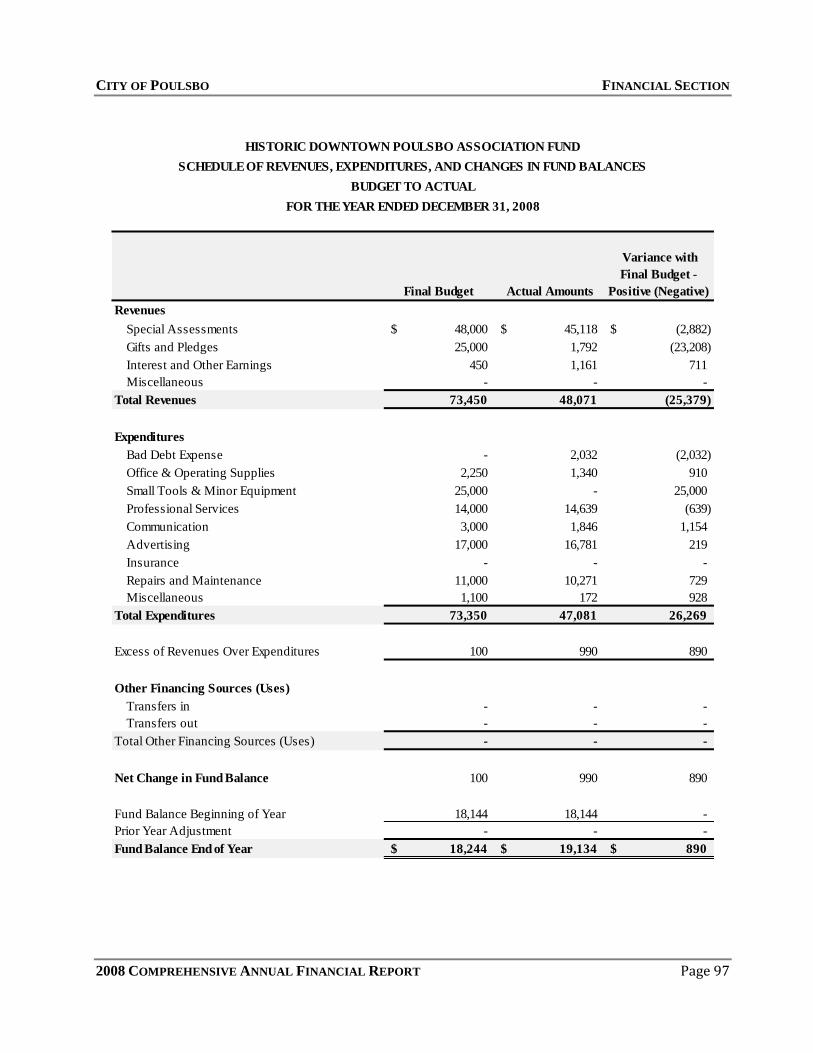
CITY OF POULSBO FINANCIAL SECTION
2008 COMPREHENSIVE ANNUAL FINANCIAL REPORT Page 97
Final Budget Actual Amounts
Variance with
Final Budget -
Positive (Negative)
Revenues
Special Assessments 48,000$ 45,118$ (2,882)$
Gifts and Pledges 25,000 1,792 (23,208)
Interest and Other Earnings 450 1,161 711
Miscellaneous - - -
Total Revenues 73,450 48,071 (25,379)
Expenditures
Bad Debt Expense - 2,032 (2,032)
Office & Operating Supplies 2,250 1,340 910
Small Tools & Minor Equipment 25,000 - 25,000
Professional Services 14,000 14,639 (639)
Communication 3,000 1,846 1,154
Advertising 17,000 16,781 219
Insurance - - -
Repairs and Maintenance 11,000 10,271 729
Miscellaneous 1,100 172 928
Total Expenditures 73,350 47,081 26,269
Excess of Revenues Over Expenditures 100 990 890
Other Financing Sources (Uses)
Transfers in - - -
Transfers out - - -
Total Other Financing Sources (Uses) - - -
Net Change in Fund Balance 100 990 890
Fund Balance Beginning of Year 18,144 18,144 -
Prior Year Adjustment - - -
Fund Balance End of Year 18,244$ 19,134$ 890$
HISTORIC DOWNTOWN POULSBO ASSOCIATION FUND
SCHEDULE OF REVENUES, EXPENDITURES, AND CHANGES IN FUND BALANCES
FOR THE YEAR ENDED DECEMBER 31, 2008
BUDGET TO ACTUAL

CITY OF POULSBO FINANCIAL SECTION
2008 COMPREHENSIVE ANNUAL FINANCIAL REPORT Page 98
Final Budget Actual Amounts
Variance with
Final Budget -
Positive (Negative)
Revenues
Interest and Other Earnings 2,500$ 1,894$ (606)$
Total Revenues 2,500 1,894 (606)
Expenditures
Current:
Education Service - - -
Facilities 6,060 3,811 2,249
Total Expenditures 6,060 3,811 2,249
Excess of Revenues Over Expenditures (3,560) (1,917) 1,643
Other Financing Sources (Uses)
Transfers in - - -
Transfers out (30,030) (30,030) -
Total Other Financing Sources (Uses) (30,030) (30,030) -
Net Change in Fund Balance (33,590) (31,947) 1,643
Fund Balance Beginning of Year 118,884 118,884 -
Fund Balance End of Year 85,294$ 86,937$ 1,643$
MARINE SCIENCE CENTER FUND
SCHEDULE OF REVENUES, EXPENDITURES, AND CHANGES IN FUND BALANCES
FOR THE YEAR ENDED DECEMBER 31, 2008
BUDGET TO ACTUAL

CITY OF POULSBO FINANCIAL SECTION
2008 COMPREHENSIVE ANNUAL FINANCIAL REPORT Page 99
Final Budget Actual Amounts
Variance with
Final Budget -
Positive (Negative)
Revenues
Interest and Other Earnings -$ 117$ 117$
Miscellaneous - - -
Total Revenues - 117 117
Expenditures
Current:
Miscellaneous - - -
Total Expenditures - - -
Excess of Revenues Over Expenditures - 117 117
Other Financing Sources (Uses)
Transfers in 948 871 (77)
Total Other Financing Sources (Uses) 948 871 (77)
Net Change in Fund Balance 948 987 39
Fund Balance Beginning of Year 6,755 6,755 -
Fund Balance End of Year 7,703$ 7,742$ 39$
PATH AND TRAILS RESERVE FUND
SCHEDULE OF REVENUES, EXPENDITURES, AND CHANGES IN FUND BALANCES
FOR THE YEAR ENDED DECEMBER 31, 2008
BUDGET TO ACTUAL

CITY OF POULSBO FINANCIAL SECTION
2008 COMPREHENSIVE ANNUAL FINANCIAL REPORT Page 100
Final Budget Actual Amounts
Variance with
Final Budget -
Positive (Negative)
Revenues
Kitsap County -Westnet Grant 10,000$ 4,643$ (5,357)$
Interest and Other Earnings 150 252 102
Miscellaneous - 5,579 5,579
Total Revenues 10,150 10,474 324
Expenditures
Current:
LIBNET Program 12,680 6,105 6,575
Drug Enforcement Agency - - -
Total Expenditures 12,680 6,105 6,575
Excess of Revenues Over Expenditures (2,530) 4,369 6,899
Other Financing Sources (Uses)
Disposal of Capital Assets - - -
Total Other Financing Sources (Uses) - - -
Net Change in Fund Balance (2,530) 4,369 6,899
Fund Balance Beginning of Year 12,376 12,376 (0)
Fund Balance End of Year 9,846$ 16,744$ 6,898$
DRUG ENFORCEMENT FUND
SCHEDULE OF REVENUES, EXPENDITURES, AND CHANGES IN FUND BALANCES
FOR THE YEAR ENDED DECEMBER 31, 2008
BUDGET TO ACTUAL
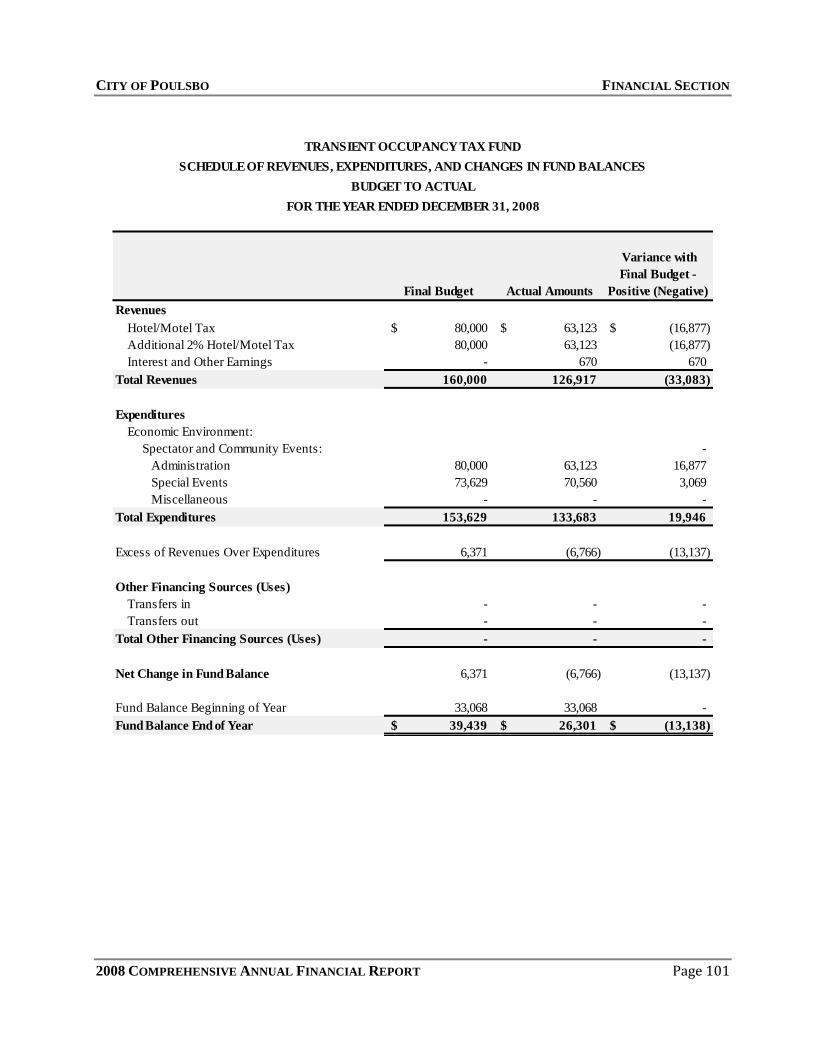
CITY OF POULSBO FINANCIAL SECTION
2008 COMPREHENSIVE ANNUAL FINANCIAL REPORT Page 101
Final Budget Actual Amounts
Variance with
Final Budget -
Positive (Negative)
Revenues
Hotel/Motel Tax 80,000$ 63,123$ (16,877)$
Additional 2% Hotel/Motel Tax 80,000 63,123 (16,877)
Interest and Other Earnings - 670 670
Total Revenues 160,000 126,917 (33,083)
Expenditures
Economic Environment:
Spectator and Community Events: -
Administration 80,000 63,123 16,877
Special Events 73,629 70,560 3,069
Miscellaneous - - -
Total Expenditures 153,629 133,683 19,946
Excess of Revenues Over Expenditures 6,371 (6,766) (13,137)
Other Financing Sources (Uses)
Transfers in - - -
Transfers out - - -
Total Other Financing Sources (Uses) - - -
Net Change in Fund Balance 6,371 (6,766) (13,137)
Fund Balance Beginning of Year 33,068 33,068 -
Fund Balance End of Year 39,439$ 26,301$ (13,138)$
TRANSIENT OCCUPANCY TAX FUND
SCHEDULE OF REVENUES, EXPENDITURES, AND CHANGES IN FUND BALANCES
FOR THE YEAR ENDED DECEMBER 31, 2008
BUDGET TO ACTUAL

CITY OF POULSBO FINANCIAL SECTION
2008 COMPREHENSIVE ANNUAL FINANCIAL REPORT Page 102
Final Budget Actual Amounts
Variance with
Final Budget -
Positive (Negative)
Revenues
Sales Tax 85,000$ 99,984$ 14,984$
Suquamish Indian Tribe Mitigation - - -
Vessel Registration 9,000 8,919 (81)
Criminal Justice 6,822 7,618 796
Interest and Other Earnings 600 4,005 3,405
Miscellaneous 2,000 1,480 (520)
Total Revenues 103,422 122,006 18,584
Expenditures
Security of Persons & Property:
Domestic Violence Program 1,800 2,106 (306)
Law Enforcement Sales Tax Program 70,125 68,698 1,427
Other Services 24,000 1,317 22,683
Total Expenditures 95,925 72,121 23,804
Excess of Revenues Over Expenditures 7,497 49,886 42,389
Other Financing Sources (Uses)
Transfers in - - -
Transfers out (28,000) (28,000) -
Total Other Financing Sources (Uses) (28,000) (28,000) -
Net Change in Fund Balance (20,503) 21,886 42,389
Fund Balance Beginning of Year 185,229 185,229 (0)
Fund Balance End of Year 164,726$ 207,114$ 42,388$
POLICE RESTRICTED FUND
SCHEDULE OF REVENUES, EXPENDITURES, AND CHANGES IN FUND BALANCES
BUDGET TO ACTUAL
FOR THE YEAR ENDED DECEMBER 31, 2008
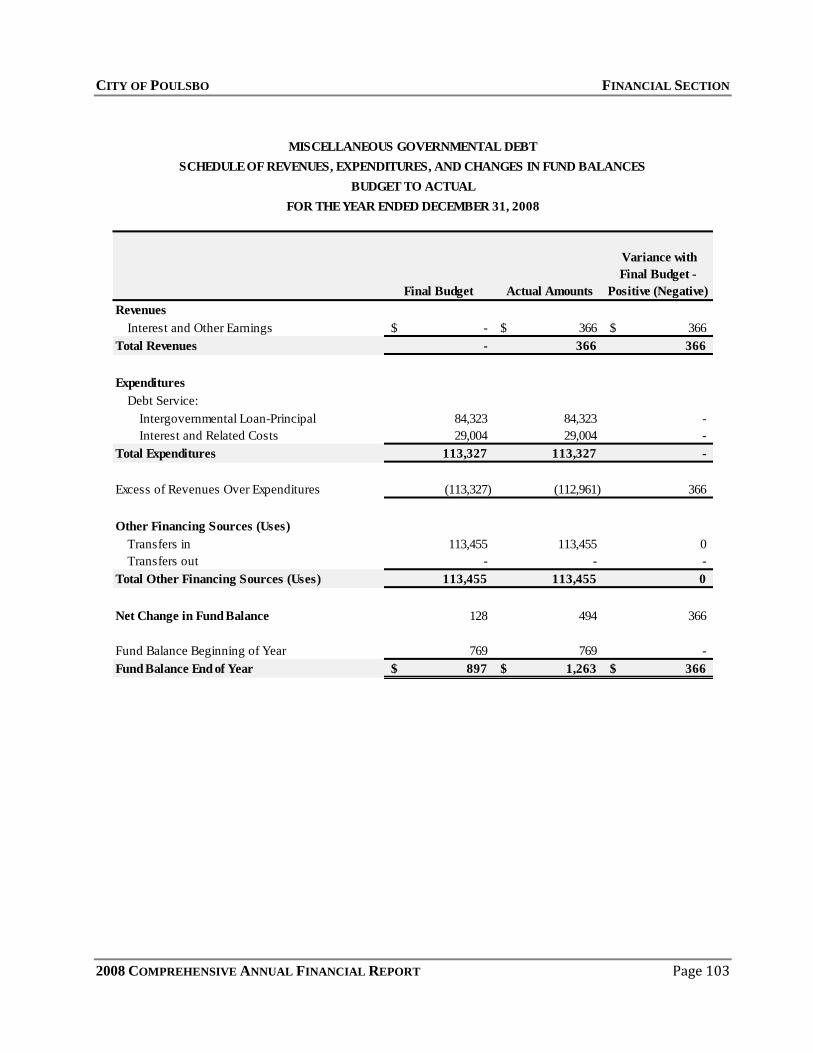
CITY OF POULSBO FINANCIAL SECTION
2008 COMPREHENSIVE ANNUAL FINANCIAL REPORT Page 103
Final Budget Actual Amounts
Variance with
Final Budget -
Positive (Negative)
Revenues
Interest and Other Earnings -$ 366$ 366$
Total Revenues - 366 366
Expenditures
Debt Service:
Intergovernmental Loan-Principal 84,323 84,323 -
Interest and Related Costs 29,004 29,004 -
Total Expenditures 113,327 113,327 -
Excess of Revenues Over Expenditures (113,327) (112,961) 366
Other Financing Sources (Uses)
Transfers in 113,455 113,455 0
Transfers out - - -
Total Other Financing Sources (Uses) 113,455 113,455 0
Net Change in Fund Balance 128 494 366
Fund Balance Beginning of Year 769 769 -
Fund Balance End of Year 897$ 1,263$ 366$
MISCELLANEOUS GOVERNMENTAL DEBT
SCHEDULE OF REVENUES, EXPENDITURES, AND CHANGES IN FUND BALANCES
BUDGET TO ACTUAL
FOR THE YEAR ENDED DECEMBER 31, 2008
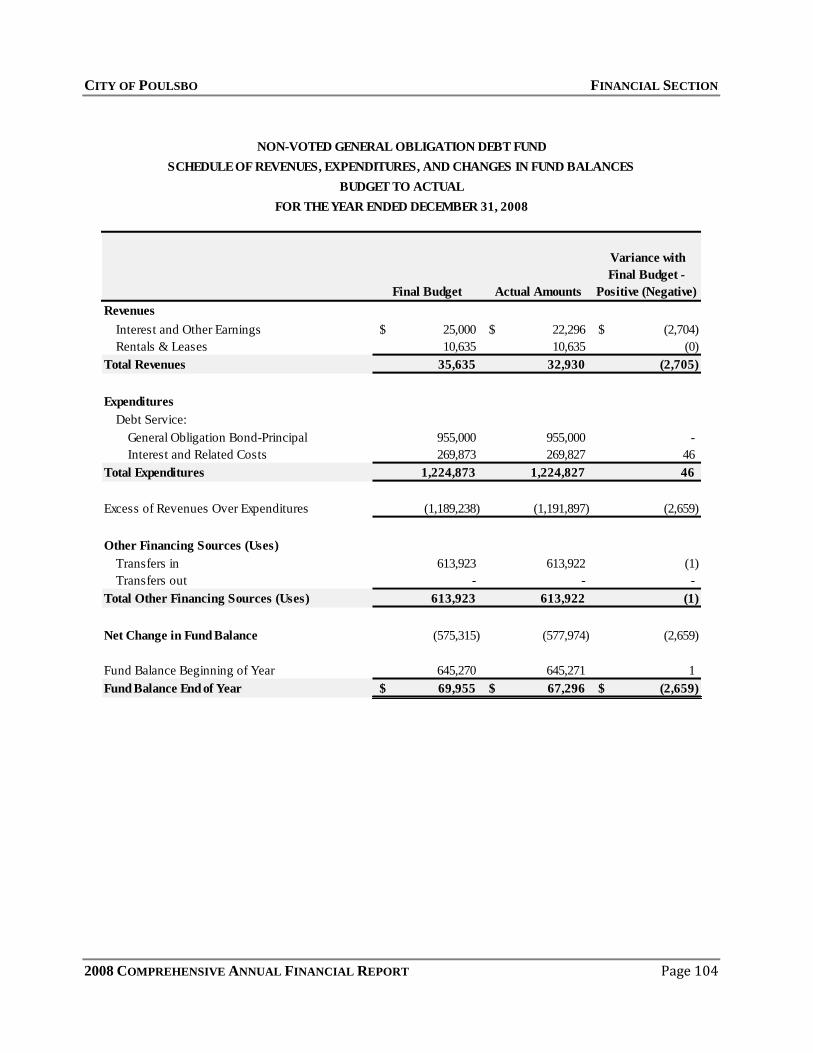
CITY OF POULSBO FINANCIAL SECTION
2008 COMPREHENSIVE ANNUAL FINANCIAL REPORT Page 104
Final Budget Actual Amounts
Variance with
Final Budget -
Positive (Negative)
Revenues
Interest and Other Earnings 25,000$ 22,296$ (2,704)$
Rentals & Leases 10,635 10,635 (0)
Total Revenues 35,635 32,930 (2,705)
Expenditures
Debt Service:
General Obligation Bond-Principal 955,000 955,000 -
Interest and Related Costs 269,873 269,827 46
Total Expenditures 1,224,873 1,224,827 46
Excess of Revenues Over Expenditures (1,189,238) (1,191,897) (2,659)
Other Financing Sources (Uses)
Transfers in 613,923 613,922 (1)
Transfers out - - -
Total Other Financing Sources (Uses) 613,923 613,922 (1)
Net Change in Fund Balance (575,315) (577,974) (2,659)
Fund Balance Beginning of Year 645,270 645,271 1
Fund Balance End of Year 69,955$ 67,296$ (2,659)$
NON-VOTED GENERAL OBLIGATION DEBT FUND
SCHEDULE OF REVENUES, EXPENDITURES, AND CHANGES IN FUND BALANCES
FOR THE YEAR ENDED DECEMBER 31, 2008
BUDGET TO ACTUAL

CITY OF POULSBO FINANCIAL SECTION
2008 COMPREHENSIVE ANNUAL FINANCIAL REPORT Page 105
Final Budget Actual Amounts
Variance with
Final Budget -
Positive (Negative)
Revenues
Property Taxes 2,000$ 1,301$ (699)$
Interest and Other Earnings 2,000 1,054 (946)
Total Revenues 4,000 2,356 (1,644)
Expenditures
Debt Service:
General Obligation Bonds-Principal 160,000 160,000 -
Interest and Related Costs 4,360 4,360 -
Total Expenditures 164,360 164,360 -
Excess of Revenues Over Expenditures (160,360) (162,004) (1,644)
Other Financing Sources (Uses)
Transfers in - - -
Transfers out (22,712) (21,720) (992)
Total Other Financing Sources (Uses) (22,712) (21,720) 992
Net Change in Fund Balance (183,072) (183,724) (652)
Fund Balance Beginning of Year 184,008 184,008 0
Fund Balance End of Year 936$ 284$ (652)$
VOTED GERNERAL OBLIGATION DEBT FUND
SCHEDULE OF REVENUES, EXPENDITURES, AND CHANGES IN FUND BALANCES
FOR THE YEAR ENDED DECEMBER 31, 2008
BUDGET TO ACTUAL

CITY OF POULSBO FINANCIAL SECTION
2008 COMPREHENSIVE ANNUAL FINANCIAL REPORT Page 106
Final Budget Actual Amounts
Variance with
Final Budget -
Positive (Negative)
Revenues
General property taxes -$ -$ -$
Interest and Other Earnings 2 0 (2)
Miscellaneous - - -
Total Revenues 2 0 (2)
Expenditures
Debt:
Debt service costs - - -
Total Expenditures - - -
Excess of Revenues Over Expenditures 2 0 (2)
Other Financing Sources (Uses)
Transfers in - - -
Transfers out - - -
Total Other Financing Sources (Uses) - - -
Net Change in Fund Balance 2 0 (2)
Fund Balance Beginning of Year 22 22 (0)
Fund Balance End of Year 24$ 22$ (2)$
LOCAL IMPROVEMENT DISTRICT (LID) FUND
SCHEDULE OF REVENUES, EXPENDITURES, AND CHANGES IN FUND BALANCES
FOR THE YEAR ENDED DECEMBER 31, 2008
BUDGET TO ACTUAL

CITY OF POULSBO FINANCIAL SECTION
2008 COMPREHENSIVE ANNUAL FINANCIAL REPORT Page 107
Final Budget Actual Amounts
Variance with
Final Budget -
Positive (Negative)
Revenues
Interest and Other Earnings -$ 7,148$ 7,148$
Total Revenues - 7,148 7,148
Expenditures
Small Tools and Minor Equipment:
General Government 39,700 48,883 (9,183)
Security of Persons & Property 4,000 - 4,000
Utilities and Environment 12,000 4,185 7,815
Economic Environment 11,000 6,761 4,239
Culture and Recreation 12,000 9,118 2,882
Capital Outlay 349,604 119,400 230,204
Total Expenditures 428,304 188,346 239,958
Excess of Revenues Over Expenditures (428,304) (181,198) 247,106
Other Financing Sources (Uses)
Transfers in 314,676 308,688 (5,988)
Transfers out (30,000) (30,000) -
Total Other Financing Sources (Uses) 284,676 278,688 (5,988)
Net Change in Fund Balance (143,628) 97,490 241,118
Fund Balance Beginning of Year 368,524 368,524 (0)
Fund Balance End of Year 224,896$ 466,014$ 241,118$
EQUIPMENT ACQUISITION FUND
SCHEDULE OF REVENUES, EXPENDITURES, AND CHANGES IN FUND BALANCES
FOR THE YEAR ENDED DECEMBER 31, 2008
BUDGET TO ACTUAL
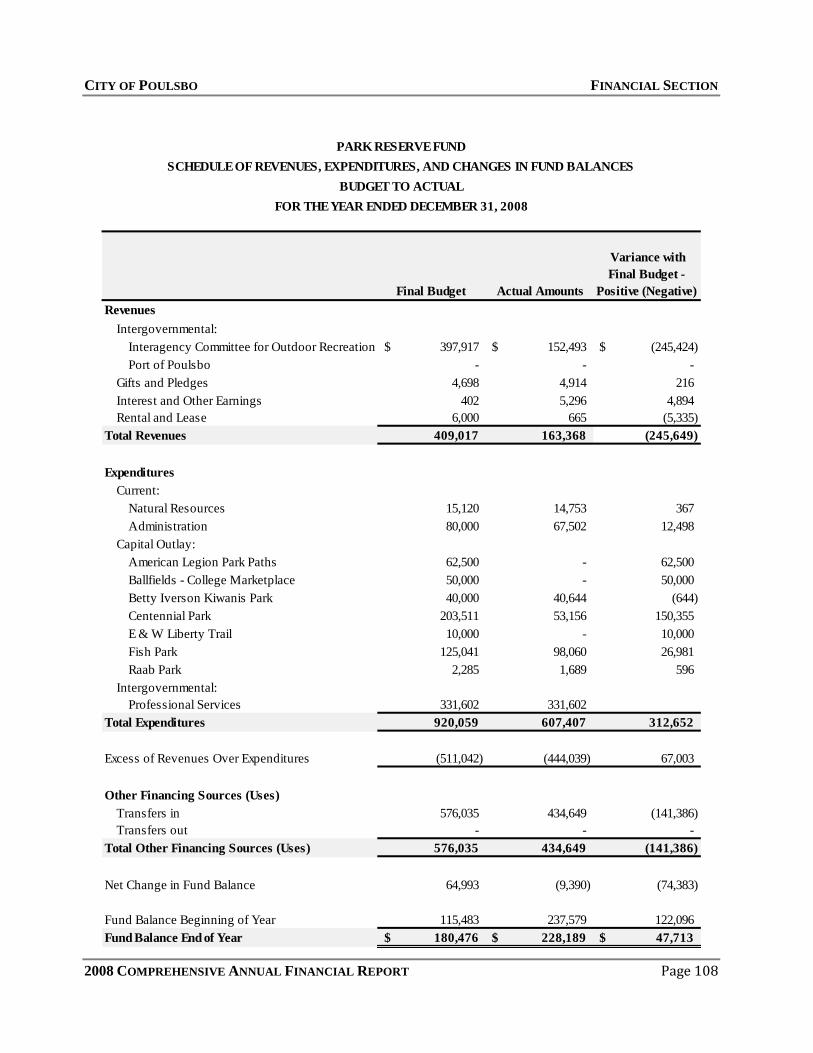
CITY OF POULSBO FINANCIAL SECTION
2008 COMPREHENSIVE ANNUAL FINANCIAL REPORT Page 108
Final Budget Actual Amounts
Variance with
Final Budget -
Positive (Negative)
Revenues
Intergovernmental:
Interagency Committee for Outdoor Recreation 397,917$ 152,493$ (245,424)$
Port of Poulsbo - - -
Gifts and Pledges 4,698 4,914 216
Interest and Other Earnings 402 5,296 4,894
Rental and Lease 6,000 665 (5,335)
Total Revenues 409,017 163,368 (245,649)
Expenditures
Current:
Natural Resources 15,120 14,753 367
Administration 80,000 67,502 12,498
Capital Outlay:
American Legion Park Paths 62,500 - 62,500
Ballfields - College Marketplace 50,000 - 50,000
Betty Iverson Kiwanis Park 40,000 40,644 (644)
Centennial Park 203,511 53,156 150,355
E & W Liberty Trail 10,000 - 10,000
Fish Park 125,041 98,060 26,981
Raab Park 2,285 1,689 596
Intergovernmental:
Professional Services 331,602 331,602
Total Expenditures 920,059 607,407 312,652
Excess of Revenues Over Expenditures (511,042) (444,039) 67,003
Other Financing Sources (Uses)
Transfers in 576,035 434,649 (141,386)
Transfers out - - -
Total Other Financing Sources (Uses) 576,035 434,649 (141,386)
Net Change in Fund Balance 64,993 (9,390) (74,383)
Fund Balance Beginning of Year 115,483 237,579 122,096
Fund Balance End of Year 180,476$ 228,189$ 47,713$
PARK RESERVE FUND
SCHEDULE OF REVENUES, EXPENDITURES, AND CHANGES IN FUND BALANCES
BUDGET TO ACTUAL
FOR THE YEAR ENDED DECEMBER 31, 2008
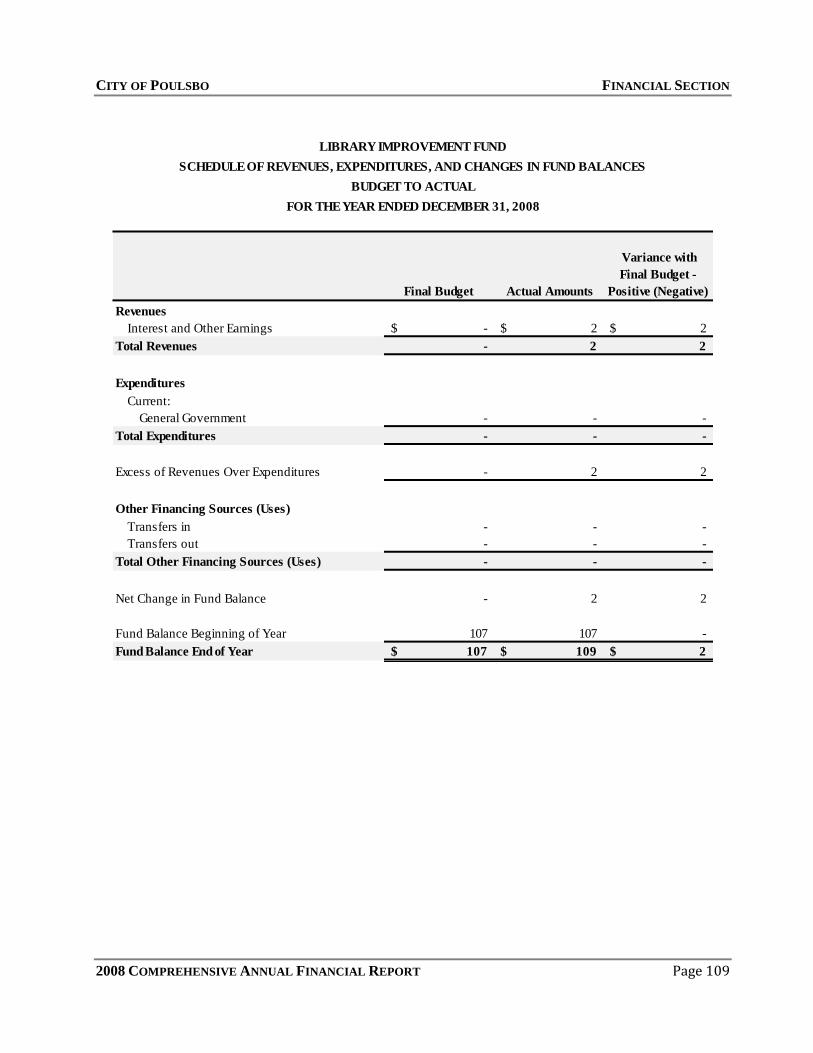
CITY OF POULSBO FINANCIAL SECTION
2008 COMPREHENSIVE ANNUAL FINANCIAL REPORT Page 109
Final Budget Actual Amounts
Variance with
Final Budget -
Positive (Negative)
Revenues
Interest and Other Earnings -$ 2$ 2$
Total Revenues - 2 2
Expenditures
Current:
General Government - - -
Total Expenditures - - -
Excess of Revenues Over Expenditures - 2 2
Other Financing Sources (Uses)
Transfers in - - -
Transfers out - - -
Total Other Financing Sources (Uses) - - -
Net Change in Fund Balance - 2 2
Fund Balance Beginning of Year 107 107 -
Fund Balance End of Year 107$ 109$ 2$
LIBRARY IMPROVEMENT FUND
SCHEDULE OF REVENUES, EXPENDITURES, AND CHANGES IN FUND BALANCES
FOR THE YEAR ENDED DECEMBER 31, 2008
BUDGET TO ACTUAL

CITY OF POULSBO FINANCIAL SECTION
2008 COMPREHENSIVE ANNUAL FINANCIAL REPORT Page 110
Final Budget Actual Amounts
Variance with
Final Budget -
Positive (Negative)
Revenues
Donations -$ 44$ 44$
Interest and Other Earnings - 22 22
Total Revenues - 66 66
Expenditures
Current:
General Government - - -
Total Expenditures - - -
Excess of Revenues Over Expenditures - 66 66
Other Financing Sources (Uses)
Transfers in - - -
Transfers out - - -
Total Other Financing Sources (Uses) - - -
Net Change in Fund Balance - 66 66
Fund Balance Beginning of Year 1,387 1,387 -
Fund Balance End of Year 1,387$ 1,453$ 66$
RECREATION RESERVE FUND
SCHEDULE OF REVENUES, EXPENDITURES, AND CHANGES IN FUND BALANCES
FOR THE YEAR ENDED DECEMBER 31, 2008
BUDGET TO ACTUAL

CITY OF POULSBO FINANCIAL SECTION
2008 COMPREHENSIVE ANNUAL FINANCIAL REPORT Page 111
Final Budget Actual Amounts
Variance with
Final Budget -
Positive (Negative)
Revenues
Indirect Federal Grants 350,000$ 90,187$ (259,813)$
State Dept of Ecology Grant 50,000 3,261 (46,739)
State Dept of Transportation Grant - - -
Transportation Improvement Board 1,513,270 1,513,270 (0)
North Kitsap School District 40,000 - (40,000)
Interest and Other Earnings - 17,085 17,085
Total Revenues 1,953,270 1,623,803 (329,467)
Expenditures
Current:
State Route 305 Project 1,664,397 1,677,117 (12,720)
Caldart Signal Project 22,681 7,878 14,803
Lindvig Bridge Beautificaton 50,000 - 50,000
Long Range Tip Planning 95,000 45,156 49,844
Mesford Sidewalk 400,000 19,609 380,391
7th Avenue 20,703 36,582 (15,879)
Noll Road Improvements 128,873 121,347 7,526
Viking Avenue at Bovela 48,446 49,241 (795)
Viking Avenue at McDonalds 198,572 74,916 123,656
Total Expenditures 2,628,672 2,031,846 596,826
Excess of Revenues Over Expenditures (675,402) (408,043) 267,359
Other Financing Sources (Uses)
Proceeds From Sale of Capital Assets - - -
Transfers in 542,969 467,252 (75,717)
Transfers out - - -
Total Other Financing Sources (Uses) 542,969 467,252 (75,717)
Net Change in Fund Balance (132,433) 59,209 191,642
Fund Balance Beginning of Year 851,556 900,154 48,598
Prior Year Adjustment 86,123 86,123
Fund Balance End of Year 719,123$ 1,045,486$ 326,363$
STREET RESERVE FUND
SCHEDULE OF REVENUES, EXPENDITURES, AND CHANGES IN FUND BALANCES
BUDGET TO ACTUAL
FOR THE YEAR ENDED DECEMBER 31, 2008

CITY OF POULSBO FINANCIAL SECTION
2008 COMPREHENSIVE ANNUAL FINANCIAL REPORT Page 112
Final Budget Actual Amounts
Variance with
Final Budget -
Positive (Negative)
Revenues
Park Mitigation -$ 27,400$ 27,400$
Interest and Other Earnings - 4,006 4,006
Total Revenues - 31,406 31,406
Expenditures
Current:
General Government - - -
Total Expenditures - - -
Excess of Revenues Over Expenditures - 31,406 31,406
Other Financing Sources (Uses)
Transfers in - - -
Transfers out (180,740) (40,740) (140,000)
Total Other Financing Sources (Uses) (180,740) (40,740) 140,000
Net Change in Fund Balance (180,740) (9,334) 171,406
Fund Balance Beginning of Year 191,930 191,930 -
Fund Balance End of Year 11,190$ 182,595$ 171,405$
PARK ACQUISITION FUND
SCHEDULE OF REVENUES, EXPENDITURES, AND CHANGES IN FUND BALANCES
BUDGET TO ACTUAL
FOR THE YEAR ENDED DECEMBER 31, 2008

CITY OF POULSBO FINANCIAL SECTION
2008 COMPREHENSIVE ANNUAL FINANCIAL REPORT Page 113
Final Budget Actual Amounts
Variance with
Final Budget -
Positive (Negative)
Revenues
Interest and Other Earnings -$ 124$ 124$
Miscellaneous - - -
Total Revenues - 124 124
Expenditures
Current:
General Government - - -
Total Expenditures - - -
Excess of Revenues Over Expenditures - 124 124
Other Financing Sources (Uses)
Transfers in - - -
Transfers out - - -
Total Other Financing Sources (Uses) - - -
Net Change in Fund Balance - 124 124
Fund Balance Beginning of Year 6,402 6,402 -
Fund Balance End of Year 6,402$ 6,526$ 124$
MUSEUM RESERVE FUND
SCHEDULE OF REVENUES, EXPENDITURES, AND CHANGES IN FUND BALANCES
BUDGET TO ACTUAL
FOR THE YEAR ENDED DECEMBER 31, 2008

CITY OF POULSBO FINANCIAL SECTION
2008 COMPREHENSIVE ANNUAL FINANCIAL REPORT Page 114
Final Budget Actual Amounts
Variance with
Final Budget -
Positive (Negative)
Revenues
Gravesites 800$ 2,000$ 1,200$
Interest and Other Earnings 500 1,408 908
Miscellaneous - - -
Total Revenues 1,300 3,408 2,108
Expenditures
Current:
General Government - - -
Total Expenditures - - -
Excess of Revenues Over Expenditures 1,300 3,408 2,108
Other Financing Sources (Uses)
Transfers in - - -
Transfers out - - -
Total Other Financing Sources (Uses) - - -
Net Change in Fund Balance 1,300 3,408 2,108
Fund Balance Beginning of Year 72,322 72,322 -
Fund Balance End of Year 73,622$ 75,730$ 2,108$
CEMETARY RESERVE FUND
SCHEDULE OF REVENUES, EXPENDITURES, AND CHANGES IN FUND BALANCES
BUDGET TO ACTUAL
FOR THE YEAR ENDED DECEMBER 31, 2008

CITY OF POULSBO FINANCIAL SECTION
2008 COMPREHENSIVE ANNUAL FINANCIAL REPORT Page 115
Final Budget Actual Amounts
Variance with
Final Budget -
Positive (Negative)
Revenues
Interest and Other Earnings 1,000$ 2,858$ 1,858$
Miscellaneous - - -
Total Revenues 1,000 2,858 1,858
Expenditures
Capital Outlay 275,000 91,942 183,058
Total Expenditures 275,000 91,942 183,058
Excess of Revenues Over Expenditures (274,000) (89,084) 184,916
Other Financing Sources (Uses)
Transfers in 150,325 150,856 531
Transfers out - - -
Total Other Financing Sources (Uses) 150,325 150,856 531
Net Change in Fund Balance (123,675) 61,773 185,448
Fund Balance Beginning of Year 149,704 150,306 602
Fund Balance End of Year 26,029$ 212,078$ 186,049$
CITY STREET EQUIPMENT RESERVE FUND
SCHEDULE OF REVENUES, EXPENDITURES, AND CHANGES IN FUND BALANCES
BUDGET TO ACTUAL
FOR THE YEAR ENDED DECEMBER 31, 2008
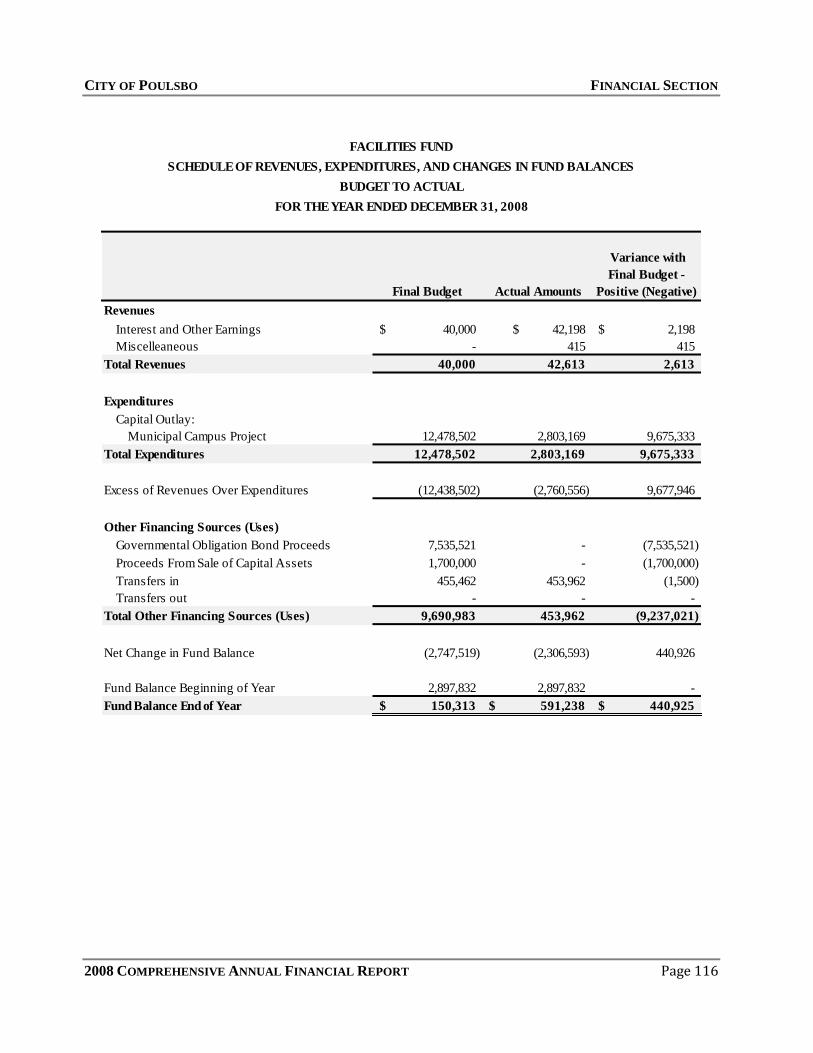
CITY OF POULSBO FINANCIAL SECTION
2008 COMPREHENSIVE ANNUAL FINANCIAL REPORT Page 116
Final Budget Actual Amounts
Variance with
Final Budget -
Positive (Negative)
Revenues
Interest and Other Earnings 40,000$ 42,198$ 2,198$
Miscelleaneous - 415 415
Total Revenues 40,000 42,613 2,613
Expenditures
Capital Outlay:
Municipal Campus Project 12,478,502 2,803,169 9,675,333
Total Expenditures 12,478,502 2,803,169 9,675,333
Excess of Revenues Over Expenditures (12,438,502) (2,760,556) 9,677,946
Other Financing Sources (Uses)
Governmental Obligation Bond Proceeds 7,535,521 - (7,535,521)
Proceeds From Sale of Capital Assets 1,700,000 - (1,700,000)
Transfers in 455,462 453,962 (1,500)
Transfers out - - -
Total Other Financing Sources (Uses) 9,690,983 453,962 (9,237,021)
Net Change in Fund Balance (2,747,519) (2,306,593) 440,926
Fund Balance Beginning of Year 2,897,832 2,897,832 -
Fund Balance End of Year 150,313$ 591,238$ 440,925$
FACILITIES FUND
SCHEDULE OF REVENUES, EXPENDITURES, AND CHANGES IN FUND BALANCES
BUDGET TO ACTUAL
FOR THE YEAR ENDED DECEMBER 31, 2008

CITY OF POULSBO FINANCIAL SECTION
2008 COMPREHENSIVE ANNUAL FINANCIAL REPORT Page 117
INTERNAL SERVICE FUNDS
Internal Service Funds are used to account for the financing of goods and services provided by one department or
agency to another department or agency of the City on a cost reimbursement basis.
The General Facilities Fund accounts for the cost of maintaining all City vehicles and construction equipment. All
costs, including depreciation, are included in establishing the rate to be charged to each department.
The Medical Reimbursement Plan Fund accounts for employee medical reimbursements on the city-funded portion
of the employee medical health plan deductible. This fund also provides a reserve for the State Public Employee
Retirement System Plan I retiree’s excess compensation expenses.
The Public Works Administration Fund accounts for administration support to the City’s Streets, Water/Sewer,
Solid Waste, Storm Drain, and General Facilities Departments.

CITY OF POULSBO FINANCIAL SECTION
2008 COMPREHENSIVE ANNUAL FINANCIAL REPORT Page 118
THIS PAGE INTENTIONALLY LEFT BLANK

CITY OF POULSBO FINANCIAL SECTION
2008 COMPREHENSIVE ANNUAL FINANCIAL REPORT Page 119
Governmental
Activities
Medical
Reimbursement
General
Facilities
Public Works
Admin Total
Assets
Current Assets:
Cash and Cash Equivalents 326$ 2,412$ 700$ 3,439$
Investments 99,363 58,386 155,044 312,793
Accounts Receivable 360 139 931 1,430
Inventories - 1,192 - 1,192
Total Current Assets 100,049 62,130 156,675 318,854
Noncurrent assets:
Investments - - - -
Capital Assets:
Land - - - -
Building and Structures - - - -
Machinery and Equipment - 9,000 56,218 65,218
Construction in Progress - - 1,100,172 1,100,172
Other Improvements - - 32,424 32,424
Less: Accumulated Depreciation - (9,000) (66,373) (75,373)
Total Noncurrent Assets - - 1,122,441 1,122,441
Total Assets 100,049$ 62,130$ 1,279,116$ 1,441,295$
Liabilities
Current Liabilities:
Accounts Payable 254$ 1,789$ 4,156$ 6,198$
Total Current Liabilities 254 1,789 4,156 6,198
Non Current Liabilities:
Compensated Absences - 10,891 51,075 61,966
Total Non Current Liabilites - 10,891 51,075 61,966
Total Liabilities 254 12,680 55,230 68,164
Net Assets
Invested in capital assets - - 1,122,441 1,122,441
Unrestricted 99,796 49,450 101,445 250,690
Total Net Assets 99,796$ 49,450$ 1,223,885$ 1,373,131$
COMBINING STATEMENT OF NET ASSETS - INTERNAL SERVICE FUNDS
Business-type Activities
DECEMBER 31, 2008
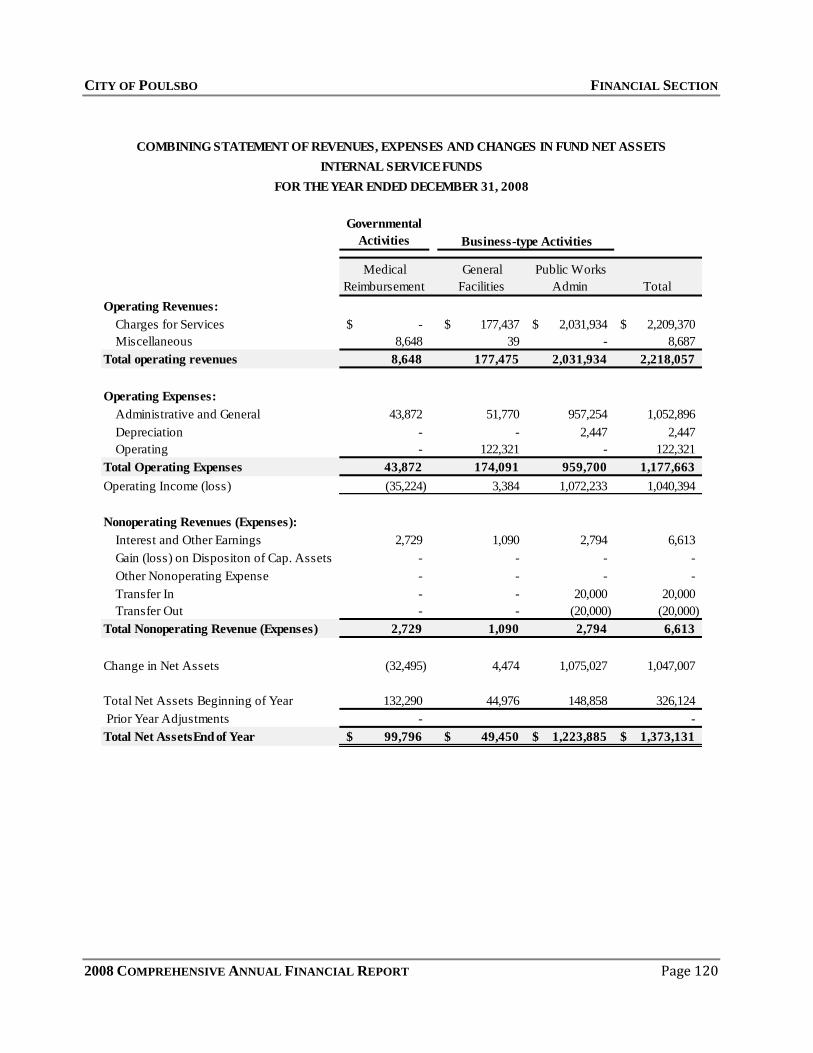
CITY OF POULSBO FINANCIAL SECTION
2008 COMPREHENSIVE ANNUAL FINANCIAL REPORT Page 120
Governmental
Activities
Medical
Reimbursement
General
Facilities
Public Works
Admin Total
Operating Revenues:
Charges for Services -$ 177,437$ 2,031,934$ 2,209,370$
Miscellaneous 8,648 39 - 8,687
Total operating revenues 8,648 177,475 2,031,934 2,218,057
Operating Expenses:
Administrative and General 43,872 51,770 957,254 1,052,896
Depreciation - - 2,447 2,447
Operating - 122,321 - 122,321
Total Operating Expenses 43,872 174,091 959,700 1,177,663
Operating Income (loss) (35,224) 3,384 1,072,233 1,040,394
Nonoperating Revenues (Expenses):
Interest and Other Earnings 2,729 1,090 2,794 6,613
Gain (loss) on Dispositon of Cap. Assets - - - -
Other Nonoperating Expense - - - -
Transfer In - - 20,000 20,000
Transfer Out - - (20,000) (20,000)
Total Nonoperating Revenue (Expenses) 2,729 1,090 2,794 6,613
Change in Net Assets (32,495) 4,474 1,075,027 1,047,007
Total Net Assets Beginning of Year 132,290 44,976 148,858 326,124
Prior Year Adjustments - -
Total Net AssetsEnd of Year 99,796$ 49,450$ 1,223,885$ 1,373,131$
COMBINING STATEMENT OF REVENUES, EXPENSES AND CHANGES IN FUND NET ASSETS
INTERNAL SERVICE FUNDS
FOR THE YEAR ENDED DECEMBER 31, 2008
Business-type Activities

CITY OF POULSBO FINANCIAL SECTION
2008 COMPREHENSIVE ANNUAL FINANCIAL REPORT Page 121
Governmental
Activities
Medical
Reimbursement
General
Facilities
Public Works
Admin Total
Cash Flows from O perating Activities
Receipts from customers and users 9,763$ 177,337$ 2,031,206$ 2,218,306$
Payments to suppliers for goods and services - (87,438) (504,313) (591,751)
Payments to employees (43,618) (83,359) (435,841) (562,819)
Net cash provided (used) by operating activities (33,855) 6,539 1,091,052 1,063,736
Cash Flows From Noncapital Financing Activities
Operating Transfer-In (out) - - - -
Net cash provided (used) by noncapital and related
financing activities - - - -
Cash Flows from Capital and Related
Financing Activities
Proceeds from sale of assets
Purchase of capital assets - - - -
Acquisition and construction of capital assets - - (1,057,749) (1,057,749)
Net Cash provided (used) by capital and related
financing actvities - - (1,057,749) (1,057,749)
Cash Flows from Investing Activities
Proceeds from sales and maturities of investments 139,020 8,849 94,401 242,271
Purchase of investments (109,390) (14,725) (215,026) (339,141)
Interest and dividends received 2,729 1,090 2,794 6,613
Net cash used by investing activities 32,360 (4,786) (117,831) (90,257)
Net increase in cash and cash equivalents (1,496) 1,754 (84,528) (84,270)
Cash and cash equivalents Beginning of Year 1,822 659 85,228 87,708
Cash and cash equivalents End of Year 326$ 2,412$ 700$ 3,439$
Reconciliation of operating income to net cash
provided (used) by operating activities:
Operating Income (35,224)$ 3,384$ 1,072,233$ 1,040,394$
Adjustments to reconcile operating income to net
cash provided (used) by operating activities:
Depreciation - - 2,447 2,447
(Increase) decrease in accounts receivable 1,115 (139) (727) 249
(Increase) decrease in inventories - 35 - 35
Increase (decrease) in accounts payable 254 1,282 59 1,595
Increase(decrease) in comp. absences payable - 1,977 17,040 19,017
Total Adjustments 1,369 3,155 18,819 23,342
Net Cash Provided By O perating Activities (33,855)$ 6,539$ 1,091,052$ 1,063,736$
FO R THE YEAR ENDED DECEMBER 31, 2008
CO MBINING STATEMENT O F CASH FLO WS
INTERNAL SERVICE FUNDS
Business-type Activities
CITY OF POULSBO FINANCIAL SECTION
2008 COMPREHENSIVE ANNUAL FINANCIAL REPORT Page 122
THIS PAGE INTENTIONALLY LEFT BLANK

CITY OF POULSBO STATISTICAL SECTION
2008 COMPREHENSIVE ANNUAL FINANCIAL REPORT Page 123
STATISTICAL SECTION
This part of the City of Poulsbo’s comprehensive annual financial report presents detailed
information as a context for understanding what the information in the financial statements, note
disclosures and required supplementary information say about the government’s overall financial
health. This information is unaudited.
Contents
Financial Trends
These schedules contain trend information to help the reader understand how the
government’s financial performance and well-being have changed over time.
Revenue Capacity
These schedules contain information to help the reader assess the government’s most
significant local revenue source, the property tax.
Debt Capacity
These schedules present information to help the reader assess the affordability of the
government’s current levels of outstanding debt and the government’s ability to issue
additional debt in the future.
Demographic and Economic Information
These schedules offer demographic and economic indicators to help the reader understand the
environment within which the government’s financial activities take place.
Operating Information
These schedules contain service and infrastructure data to help the reader understand how the
information in the government’s financial report relates to the services the government
provides and the activities it performs.
Data Sources: Unless otherwise noted, the information is these schedules are derived from the comprehensive
annual financial reports for the relevant year.

CITY OF POULSBO STATISTICAL SECTION
2008 COMPREHENSIVE ANNUAL FINANCIAL REPORT Page 124
THIS PAGE INTENTIONALLY LEFT BLANK

CITY OF POULSBO STATISTICAL SECTION
2008 COMPREHENSIVE ANNUAL FINANCIAL REPORT Page 125
2000 1
2001 2002 2003 2004 2005 2006 2007 2008
Governmental activities
Invested in capital assets, net of related debt 4,583,369$ 12,850,322$ 15,703,725$ 16,780,634$ 18,857,715$ 14,526,547$ 21,314,960$ 22,927,641$ 32,722,844$
Restricted 791,906 307,815 295,090 293,256 287,739 866,364 974,441 946,843 189,665
Unrestricted 4,690,009 5,238,632 5,535,830 6,992,026 6,221,541 12,367,678 10,640,044 10,460,327 7,360,966
Total governmental activities net assets 10,065,284$ 18,396,769$ 21,534,645$ 24,065,915$ 25,366,996$ 27,760,589$ 32,929,444$ 34,334,811$ 40,273,475$
Business-type activities
Invested in capital assets, net of related debt 12,729,523$ 11,612,215$ 15,991,448$ 16,641,475$ 16,903,395$ 17,250,848$ 25,702,744$ 25,907,276$ 35,722,443$
Restricted 666,500 666,500 595,500 595,000 - 496,499 623,042 491,489 492,011
Unrestricted 1,410,257 3,349,596 2,883,550 4,306,333 5,916,001 7,258,373 4,526,032 10,062,161 9,397,710
Total business-type activities net assets 14,806,280$ 15,628,311$ 19,470,497$ 21,542,808$ 22,819,397$ 25,005,720$ 30,851,818$ 36,460,925$ 45,612,163$
Primary government
Invested in capital assets, net of related debt 17,312,892$ 24,462,537$ 31,695,173$ 33,422,109$ 35,761,110$ 31,777,395$ 47,017,703$ 48,834,917$ 68,445,287$
Restricted 1,458,406 974,315 890,590 888,256 287,739 1,362,863 1,597,483 1,438,331 681,675
Unrestricted 6,100,266 8,588,228 8,419,379 11,298,359 12,137,543 19,626,051 15,166,076 20,522,488 16,758,676
Total primary government net assets 24,871,564$ 34,025,080$ 41,005,142$ 45,608,724$ 48,186,392$ 52,766,309$ 63,781,263$ 70,795,736$ 85,885,638$
1 First year Changes in Net Assets reported.
NET ASSETS BY COMPONENT
Last Ten Fiscal Years
-
10,000,000
20,000,000
30,000,000
40,000,000
50,000,000
2000 2001 2002 2003 2004 2005 2006 2007 2008
Total Net Assets
Governmental activities Business-type activities
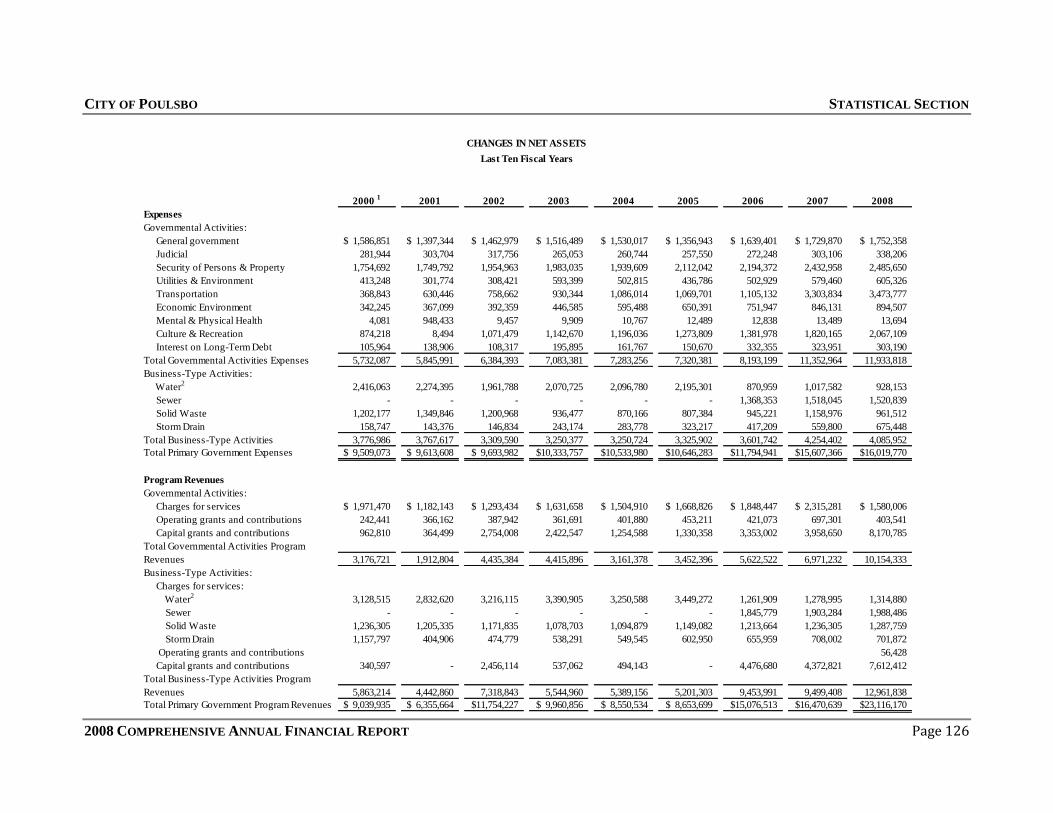
CITY OF POULSBO STATISTICAL SECTION
2008 COMPREHENSIVE ANNUAL FINANCIAL REPORT Page 126
2000 1
2001 2002 2003 2004 2005 2006 2007 2008
Expenses
Governmental Activities:
General government 1,586,851$ 1,397,344$ 1,462,979$ 1,516,489$ 1,530,017$ 1,356,943$ 1,639,401$ 1,729,870$ 1,752,358$
Judicial 281,944 303,704 317,756 265,053 260,744 257,550 272,248 303,106 338,206
Security of Persons & Property 1,754,692 1,749,792 1,954,963 1,983,035 1,939,609 2,112,042 2,194,372 2,432,958 2,485,650
Utilities & Environment 413,248 301,774 308,421 593,399 502,815 436,786 502,929 579,460 605,326
Transportation 368,843 630,446 758,662 930,344 1,086,014 1,069,701 1,105,132 3,303,834 3,473,777
Economic Environment 342,245 367,099 392,359 446,585 595,488 650,391 751,947 846,131 894,507
Mental & Physical Health 4,081 948,433 9,457 9,909 10,767 12,489 12,838 13,489 13,694
Culture & Recreation 874,218 8,494 1,071,479 1,142,670 1,196,036 1,273,809 1,381,978 1,820,165 2,067,109
Interest on Long-Term Debt 105,964 138,906 108,317 195,895 161,767 150,670 332,355 323,951 303,190
Total Governmental Activities Expenses 5,732,087 5,845,991 6,384,393 7,083,381 7,283,256 7,320,381 8,193,199 11,352,964 11,933,818
Business-Type Activities:
Water2
2,416,063 2,274,395 1,961,788 2,070,725 2,096,780 2,195,301 870,959 1,017,582 928,153
Sewer - - - - - - 1,368,353 1,518,045 1,520,839
Solid Waste 1,202,177 1,349,846 1,200,968 936,477 870,166 807,384 945,221 1,158,976 961,512
Storm Drain 158,747 143,376 146,834 243,174 283,778 323,217 417,209 559,800 675,448
Total Business-Type Activities 3,776,986 3,767,617 3,309,590 3,250,377 3,250,724 3,325,902 3,601,742 4,254,402 4,085,952
Total Primary Government Expenses 9,509,073$ 9,613,608$ 9,693,982$ 10,333,757$ 10,533,980$ 10,646,283$ 11,794,941$ 15,607,366$ 16,019,770$
Program Revenues
Governmental Activities:
Charges for services 1,971,470$ 1,182,143$ 1,293,434$ 1,631,658$ 1,504,910$ 1,668,826$ 1,848,447$ 2,315,281$ 1,580,006$
Operating grants and contributions 242,441 366,162 387,942 361,691 401,880 453,211 421,073 697,301 403,541
Capital grants and contributions 962,810 364,499 2,754,008 2,422,547 1,254,588 1,330,358 3,353,002 3,958,650 8,170,785
Total Governmental Activities Program
Revenues 3,176,721 1,912,804 4,435,384 4,415,896 3,161,378 3,452,396 5,622,522 6,971,232 10,154,333
Business-Type Activities:
Charges for services:
Water2
3,128,515 2,832,620 3,216,115 3,390,905 3,250,588 3,449,272 1,261,909 1,278,995 1,314,880
Sewer - - - - - - 1,845,779 1,903,284 1,988,486
Solid Waste 1,236,305 1,205,335 1,171,835 1,078,703 1,094,879 1,149,082 1,213,664 1,236,305 1,287,759
Storm Drain 1,157,797 404,906 474,779 538,291 549,545 602,950 655,959 708,002 701,872
Operating grants and contributions 56,428
Capital grants and contributions 340,597 - 2,456,114 537,062 494,143 - 4,476,680 4,372,821 7,612,412
Total Business-Type Activities Program
Revenues 5,863,214 4,442,860 7,318,843 5,544,960 5,389,156 5,201,303 9,453,991 9,499,408 12,961,838
Total Primary Government Program Revenues 9,039,935$ 6,355,664$ 11,754,227$ 9,960,856$ 8,550,534$ 8,653,699$ 15,076,513$ 16,470,639$ 23,116,170$
CHANGES IN NET ASSETS
Last Ten Fiscal Years
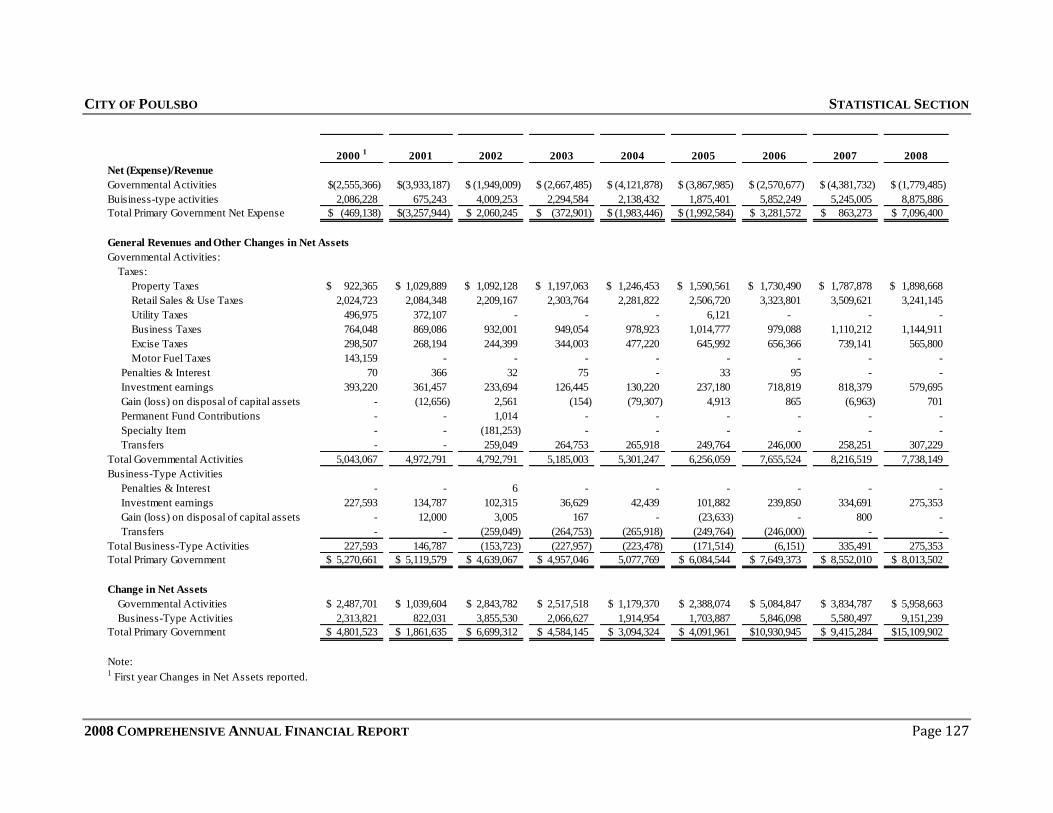
CITY OF POULSBO STATISTICAL SECTION
2008 COMPREHENSIVE ANNUAL FINANCIAL REPORT Page 127
2000 1
2001 2002 2003 2004 2005 2006 2007 2008
Net (Expense)/Revenue
Governmental Activities (2,555,366)$ (3,933,187)$ (1,949,009)$ (2,667,485)$ (4,121,878)$ (3,867,985)$ (2,570,677)$ (4,381,732)$ (1,779,485)$
Buisiness-type activities 2,086,228 675,243 4,009,253 2,294,584 2,138,432 1,875,401 5,852,249 5,245,005 8,875,886
Total Primary Government Net Expense (469,138)$ (3,257,944)$ 2,060,245$ (372,901)$ (1,983,446)$ (1,992,584)$ 3,281,572$ 863,273$ 7,096,400$
General Revenues and Other Changes in Net Assets
Governmental Activities:
Taxes:
Property Taxes 922,365$ 1,029,889$ 1,092,128$ 1,197,063$ 1,246,453$ 1,590,561$ 1,730,490$ 1,787,878$ 1,898,668$
Retail Sales & Use Taxes 2,024,723 2,084,348 2,209,167 2,303,764 2,281,822 2,506,720 3,323,801 3,509,621 3,241,145
Utility Taxes 496,975 372,107 - - - 6,121 - - -
Business Taxes 764,048 869,086 932,001 949,054 978,923 1,014,777 979,088 1,110,212 1,144,911
Excise Taxes 298,507 268,194 244,399 344,003 477,220 645,992 656,366 739,141 565,800
Motor Fuel Taxes 143,159 - - - - - - - -
Penalties & Interest 70 366 32 75 - 33 95 - -
Investment earnings 393,220 361,457 233,694 126,445 130,220 237,180 718,819 818,379 579,695
Gain (loss) on disposal of capital assets - (12,656) 2,561 (154) (79,307) 4,913 865 (6,963) 701
Permanent Fund Contributions - - 1,014 - - - - - -
Specialty Item - - (181,253) - - - - - -
Transfers - - 259,049 264,753 265,918 249,764 246,000 258,251 307,229
Total Governmental Activities 5,043,067 4,972,791 4,792,791 5,185,003 5,301,247 6,256,059 7,655,524 8,216,519 7,738,149
Business-Type Activities
Penalties & Interest - - 6 - - - - - -
Investment earnings 227,593 134,787 102,315 36,629 42,439 101,882 239,850 334,691 275,353
Gain (loss) on disposal of capital assets - 12,000 3,005 167 - (23,633) - 800 -
Transfers - - (259,049) (264,753) (265,918) (249,764) (246,000) - -
Total Business-Type Activities 227,593 146,787 (153,723) (227,957) (223,478) (171,514) (6,151) 335,491 275,353
Total Primary Government 5,270,661$ 5,119,579$ 4,639,067$ 4,957,046$ 5,077,769 6,084,544$ 7,649,373$ 8,552,010$ 8,013,502$
Change in Net Assets
Governmental Activities 2,487,701$ 1,039,604$ 2,843,782$ 2,517,518$ 1,179,370$ 2,388,074$ 5,084,847$ 3,834,787$ 5,958,663$
Business-Type Activities 2,313,821 822,031 3,855,530 2,066,627 1,914,954 1,703,887 5,846,098 5,580,497 9,151,239
Total Primary Government 4,801,523$ 1,861,635$ 6,699,312$ 4,584,145$ 3,094,324$ 4,091,961$ 10,930,945$ 9,415,284$ 15,109,902$
Note: 1 First year Changes in Net Assets reported.
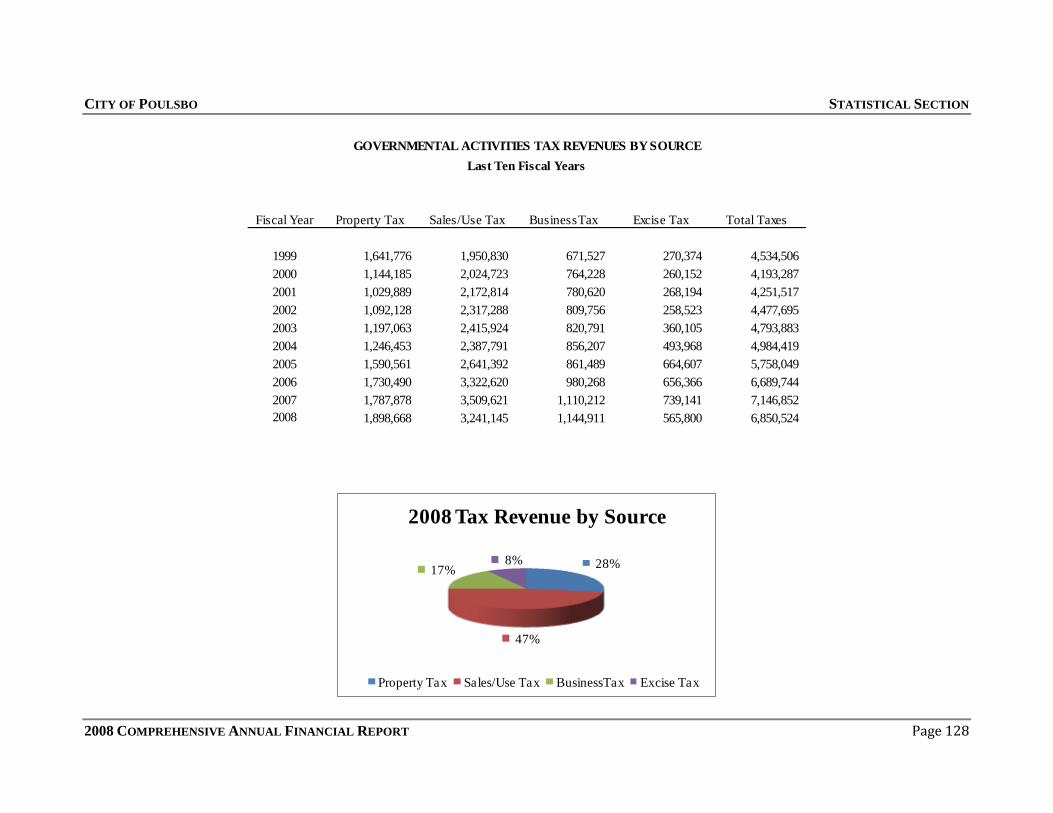
CITY OF POULSBO STATISTICAL SECTION
2008 COMPREHENSIVE ANNUAL FINANCIAL REPORT Page 128
Fiscal Year Property Tax Sales/Use Tax BusinessTax Excise Tax Total Taxes
1999 1,641,776 1,950,830 671,527 270,374 4,534,506
2000 1,144,185 2,024,723 764,228 260,152 4,193,287
2001 1,029,889 2,172,814 780,620 268,194 4,251,517
2002 1,092,128 2,317,288 809,756 258,523 4,477,695
2003 1,197,063 2,415,924 820,791 360,105 4,793,883
2004 1,246,453 2,387,791 856,207 493,968 4,984,419
2005 1,590,561 2,641,392 861,489 664,607 5,758,049
2006 1,730,490 3,322,620 980,268 656,366 6,689,744
2007 1,787,878 3,509,621 1,110,212 739,141 7,146,852
2008 1,898,668 3,241,145 1,144,911 565,800 6,850,524
GOVERNMENTAL ACTIVITIES TAX REVENUES BY SOURCE
Last Ten Fiscal Years
28%
47%
17%8%
2008 Tax Revenue by Source
Property Tax Sales/Use Tax BusinessTax Excise Tax

CITY OF POULSBO STATISTICAL SECTION
2008 COMPREHENSIVE ANNUAL FINANCIAL REPORT Page 129
General FundFiscal
Year Unreserved Total General Fund Reserved
Unreserved Special
Revenue Funds
Unreserved Capital
Projects Funds
Total All Other
Governmental
1999 428,634$ 428,634$ 447,173$ 2,258,464$ 480,203$ 3,185,840$
2000 665,091 665,091 269,905 2,672,437 641,214 3,583,556
2001 751,962 751,962 96,914 3,221,276 880,087 4,198,277
2002 751,962 751,962 295,090 3,310,231 996,336 4,601,657
2003 652,042 652,042 293,255 3,367,426 2,545,055 6,205,736
2004 505,964 505,964 287,739 3,407,958 1,981,860 5,677,557
2005 561,075 561,075 866,364 3,745,074 7,069,870 11,681,309
2006 1,250,070 1,250,070 974,441 5,224,094 3,842,259 10,040,794
2007 1,880,660 1,880,660 947,612 3,237,757 4,826,542 9,011,912
2008 969,008 969,008 190,927 3,220,467 2,841,921 6,253,316
Note: The City implemented GASB 44 in 2006 and has reported the information above retroactively.
Details regarding the City's outstanding debt can be found in the notes to the financial statements.
All Other Governmental Funds
FUND BALANCES OF GOVERNMENTAL FUNDS
Last Ten Fiscal Years

CITY OF POULSBO STATISTICAL SECTION
2008 COMPREHENSIVE ANNUAL FINANCIAL REPORT Page 130
-
2,000,000
4,000,000
6,000,000
8,000,000
10,000,000
12,000,000
1999 2000 2001 2002 2003 2004 2005 2006 2007 2008
Fund Balances Governmental Funds
General Fund All Other Governmental Funds
3%
97%
2008 Governmental Fund Balances
Reserved Governmental Funds
Unreserved Governmental Funds
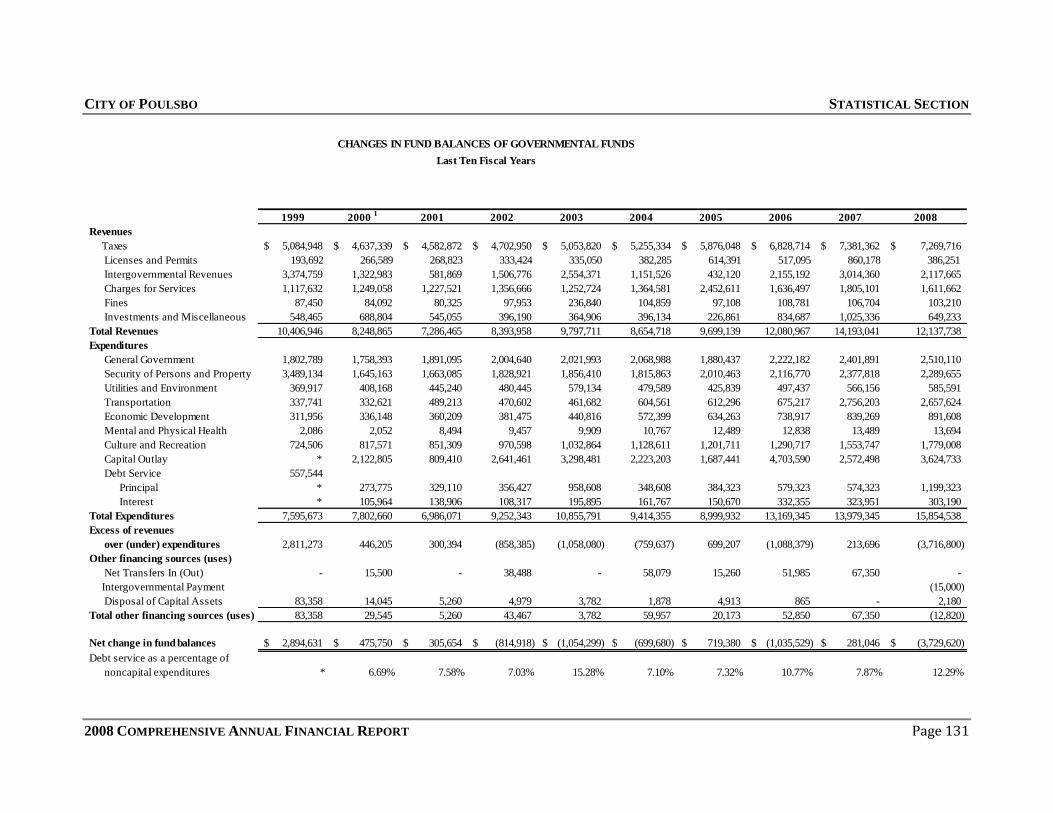
CITY OF POULSBO STATISTICAL SECTION
2008 COMPREHENSIVE ANNUAL FINANCIAL REPORT Page 131
1999 2000 1
2001 2002 2003 2004 2005 2006 2007 2008
Revenues
Taxes 5,084,948$ 4,637,339$ 4,582,872$ 4,702,950$ 5,053,820$ 5,255,334$ 5,876,048$ 6,828,714$ 7,381,362$ 7,269,716$
Licenses and Permits 193,692 266,589 268,823 333,424 335,050 382,285 614,391 517,095 860,178 386,251
Intergovernmental Revenues 3,374,759 1,322,983 581,869 1,506,776 2,554,371 1,151,526 432,120 2,155,192 3,014,360 2,117,665
Charges for Services 1,117,632 1,249,058 1,227,521 1,356,666 1,252,724 1,364,581 2,452,611 1,636,497 1,805,101 1,611,662
Fines 87,450 84,092 80,325 97,953 236,840 104,859 97,108 108,781 106,704 103,210
Investments and Miscellaneous 548,465 688,804 545,055 396,190 364,906 396,134 226,861 834,687 1,025,336 649,233
Total Revenues 10,406,946 8,248,865 7,286,465 8,393,958 9,797,711 8,654,718 9,699,139 12,080,967 14,193,041 12,137,738
Expenditures
General Government 1,802,789 1,758,393 1,891,095 2,004,640 2,021,993 2,068,988 1,880,437 2,222,182 2,401,891 2,510,110
Security of Persons and Property 3,489,134 1,645,163 1,663,085 1,828,921 1,856,410 1,815,863 2,010,463 2,116,770 2,377,818 2,289,655
Utilities and Environment 369,917 408,168 445,240 480,445 579,134 479,589 425,839 497,437 566,156 585,591
Transportation 337,741 332,621 489,213 470,602 461,682 604,561 612,296 675,217 2,756,203 2,657,624
Economic Development 311,956 336,148 360,209 381,475 440,816 572,399 634,263 738,917 839,269 891,608
Mental and Physical Health 2,086 2,052 8,494 9,457 9,909 10,767 12,489 12,838 13,489 13,694
Culture and Recreation 724,506 817,571 851,309 970,598 1,032,864 1,128,611 1,201,711 1,290,717 1,553,747 1,779,008
Capital Outlay * 2,122,805 809,410 2,641,461 3,298,481 2,223,203 1,687,441 4,703,590 2,572,498 3,624,733
Debt Service 557,544
Principal * 273,775 329,110 356,427 958,608 348,608 384,323 579,323 574,323 1,199,323
Interest * 105,964 138,906 108,317 195,895 161,767 150,670 332,355 323,951 303,190
Total Expenditures 7,595,673 7,802,660 6,986,071 9,252,343 10,855,791 9,414,355 8,999,932 13,169,345 13,979,345 15,854,538
Excess of revenues
over (under) expenditures 2,811,273 446,205 300,394 (858,385) (1,058,080) (759,637) 699,207 (1,088,379) 213,696 (3,716,800)
Other financing sources (uses)
Net Transfers In (Out) - 15,500 - 38,488 - 58,079 15,260 51,985 67,350 -
Intergovernmental Payment (15,000)
Disposal of Capital Assets 83,358 14,045 5,260 4,979 3,782 1,878 4,913 865 - 2,180
Total other financing sources (uses) 83,358 29,545 5,260 43,467 3,782 59,957 20,173 52,850 67,350 (12,820)
Net change in fund balances 2,894,631$ 475,750$ 305,654$ (814,918)$ (1,054,299)$ (699,680)$ 719,380$ (1,035,529)$ 281,046$ (3,729,620)$
Debt service as a percentage of
noncapital expenditures * 6.69% 7.58% 7.03% 15.28% 7.10% 7.32% 10.77% 7.87% 12.29%
CHANGES IN FUND BALANCES OF GOVERNMENTAL FUNDS
Last Ten Fiscal Years

CITY OF POULSBO STATISTICAL SECTION
2008 COMPREHENSIVE ANNUAL FINANCIAL REPORT Page 132
Fiscal Year Property Tax Sales/Use Tax
Business &
Occupation Tax Other Taxes Total Taxes
1999 1,641,776 1,870,704 1,135,112 350,651 4,998,243
2000 1,099,096 1,927,434 1,144,813 345,187 4,516,529
2001 1,032,573 2,046,240 1,015,592 356,375 4,450,781
2002 1,090,312 2,191,959 910,785 472,139 4,665,196
2003 1,194,413 2,312,039 931,099 583,586 5,021,137
2004 1,236,814 2,281,754 968,542 728,900 5,216,010
2005 1,570,036 2,413,746 942,396 897,892 5,824,070
2006 1,726,325 3,245,727 1,194,095 657,600 6,823,747
2007 1,871,056 3,509,621 1,408,073 739,141 7,527,890
2008 1,932,248 3,241,145 1,452,140 565,800 7,191,334
GENERAL GOVERNMENTAL TAX REVENUES BY SOURCE
Last Ten Fiscal Years
Property Tax
27%
Sales/Use Tax
45%
Business &
Occupation Tax
20%
Other Taxes
8%
2008 Tax Revenues by Source
Property Tax Sales/Use Tax Business & Occupation Tax Other Taxes

CITY OF POULSBO STATISTICAL SECTION
2008 COMPREHENSIVE ANNUAL FINANCIAL REPORT Page 133
(in thousands of dollars)
Fiscal Year
Ended
December 31 Real Property Personal Property
Less: Tax Exempt
Real Property
Total Taxable
Assessed Value1
Total Direct Tax
Rate
Estimated Actual
Taxable Value
Assessed Value
as a Percentage
of Actual Value
1999 416,872,104 29,751,046 64,283,066 382,340,084 14.7932 429,113,450 89.1
2000 589,744,678 23,831,267 76,838,467 536,737,478 13.7365 600,377,492 89.4
2001 609,434,614 38,229,154 76,722,244 570,941,524 14.1245 648,797,186 88.0
2002 631,605,477 35,662,271 76,893,725 590,374,023 13.8677 670,879,572 88.0
2003 687,861,685 34,377,866 81,937,703 640,301,848 13.5369 743,672,297 86.1
2004 811,445,976 32,598,832 104,902,292 739,142,516 12.9997 849,589,099 87.0
2005 998,820,555 37,296,158 130,764,431 905,352,282 11.3797 1,004,830,502 90.1
2006 1,359,944,770 37,817,375 202,658,963 1,195,103,182 9.5220 1,359,616,817 87.9
2007 1,500,268,177 55,589,284 218,520,151 1,337,337,310 9.1556 1,523,163,223 87.8
2008 1,524,122,775 40,675,295 186,579,815 1,378,218,255 9.6156 1,598,861,085 86.2
1 Figure represents current year assessed value payable in following year
Source: Kitsap County Assessor's Office
ASSESSED VALUE AND ESTIMATED ACTUAL VALUE OF TAXABLE PROPERTY
Last Ten Fiscal Years

CITY OF POULSBO STATISTICAL SECTION
2008 COMPREHENSIVE ANNUAL FINANCIAL REPORT Page 134
Fiscal
Year Operating
Debt
Service Total City
Kitsap
County
State
School
NK School
District
Port of
Poulsbo
Fire
District
#18
Public
Utility
Kitsap
Regional
Library
Poulsbo
Library
Total
Overlapping
Rates
Total Direct
&
Overlapping
1999 3.560 0.400 3.960 1.813 3.318 4.705 0.364 1.952 0.102 0.500 0.089 12.842 16.802
2000 3.581 0.368 3.949 1.855 3.281 4.612 0.402 2.000 0.101 0.500 0.094 12.844 16.793
2001 *
1.639 0.305 1.944 1.518 3.095 4.198 0.353 1.948 0.098 0.500 0.083 11.793 13.736
2002 1.633 0.286 1.919 1.670 3.148 4.495 0.347 1.881 0.106 0.483 0.077 12.206 14.125
2003 1.753 0.274 2.027 1.602 2.927 4.421 0.371 1.885 0.102 0.462 0.072 11.840 13.868
2004 1.709 0.251 1.960 1.413 3.080 4.291 0.356 1.826 0.100 0.453 0.058 11.577 13.537
2005 1.930 0.221 2.151 1.309 2.961 3.992 0.338 1.684 0.092 0.420 0.053 10.848 13.000
2006 1.712 0.179 1.891 1.131 2.599 3.497 0.300 1.476 0.080 0.362 0.044 9.489 11.380
2007 1.428 0.133 1.561 0.963 2.296 2.836 0.249 1.208 0.068 0.031 0.035 7.684 9.245
2008 1.440 - 1.440 0.119 2.028 2.594 0.236 1.607 0.062 0.280 0.031 6.958 8.398
*Note: In 2001, Washington State Voter Initiation 747 was passed limiting property taxes for taxing jurisdictions under 10,000 in population to 1% over the previous year's levy
Source: Kitsap County Assessor's Office - Statement of Assessments
PROPERTY TAX RATES - DIRECT AND OVERLAPPING GOVERNMENTS
Last Ten Fiscal Years
School Other Overlapping Rates
-
1.000
2.000
3.000
4.000
1999 2000 2001
*
2002 2003 2004 2005 2006 2007 2008
Ra
te
Year
Direct Property Tax Rate
-
3.000
6.000
9.000
12.000
15.000
18.000
1999 2000 2001
*
2002 2003 2004 2005 2006 2007 2008
Ra
te
Year
Overlapping Property Tax Rate

CITY OF POULSBO STATISTICAL SECTION
2008 COMPREHENSIVE ANNUAL FINANCIAL REPORT Page 135
Olhava Associates LMTD Partnership 25,727,810$ 1 1.87% Tim Ryan Enterprises 10,983,000$ 1 1.92%
Walmart LLC - Store #5272 21,634,250 2 1.57% Olhava Associates LMTD Partnership 9,324,000 2 1.63%
Laurelhurst Apartments Company 16,533,160 3 1.20% Poulsbo Retirement Center 9,260,000 3 1.62%
Tim Ryan Properties LP 13,389,850 4 0.97% Tim Ryan Properties LP 10,983,000 4 1.92%
Liberty Ridge Apartments LLC 13,228,420 5 0.96% Current Development LLC 7,855,000 5 1.38%
Capstone Homes Inc 12,433,880 6 0.90% Hattaland 7,758,000 6 1.36%
Current Development LLC 12,424,930 7 0.90% Puget Sound Energy 7,219,188 7 1.26%
HD Development of Maryland Inc 11,882,080 8 0.86% SFI LP 6,532,000 8 1.14%
College Marketplace LLC 10,591,100 9 0.77% PLB Associates LP 4,868,000 9 0.85%
Poulsbo Retirement Center 10,325,700 10 0.75% Liberty Bay Marina LLC 4,747,000 10 0.83%
TOTALS: 148,171,180$ 10.75% 79,529,188$ 13.93%
Source: Kitsap County Assessor's Office
*Note: Data from Nine Years past is not available therefore the earliest year available for comparison is shown.
% of Total
Assessed
ValuationTaxpayer
2008 2001*
PRINCIPAL TAXPAYERS
Current Year and Nine Years Ago*
Rank Rank
2008 Assessed
Valuation
% of Total
Assessed
Valuation
2001 Assessed
Valuation
17%
15%
11%
9%9%
9%
8%
8%
7%
7% Assessed Value of Top Ten Taxpayers
Olhava Associates LMTD Partnership Walmart LLC - Store #5272
Laurelhurst Apartments Company Tim Ryan Properties LP
Liberty Ridge Apartments LLC Capstone Homes Inc
Current Development LLC HD Development of Maryland Inc
College Marketplace LLC Poulsbo Retirement Center

CITY OF POULSBO STATISTICAL SECTION
2008 COMPREHENSIVE ANNUAL FINANCIAL REPORT Page 136
Fiscal
Year
Total Tax
Levy Amount % of Levy
Delinquent
Tax
Collected Amount % of Levy
Outstanding
Delinquent
Taxes (ODT)
ODT As %
of Current
Levy
1999 1,415,208 1,384,456 97.83% 29,637 1,414,093 99.92% 1,115 0.08%
2000 1,526,899 1,475,900 96.66% 49,726 1,525,626 99.92% 1,273 0.08%
20011
1,022,115 995,531 97.40% 25,814 1,021,345 99.92% 769 0.08%
2002 1,087,786 914,690 84.09% 171,687 1,086,377 99.87% 1,409 0.13%
2003 1,190,499 1,169,635 98.25% 19,017 1,188,652 99.84% 1,846 0.16%
2004 1,241,641 1,221,213 98.35% 18,949 1,240,162 99.88% 1,479 0.12%
2005 1,539,340 1,550,699 100.74% (13,829) 1,536,871 99.84% 2,469 0.16%
2006 1,672,273 1,685,921 100.82% (19,334) 1,666,587 99.66% 5,686 0.34%
2007 1,850,622 1,820,831 98.39% * 1,820,831 98.39% 29,791 1.61%
2008 1,931,528 1,873,648 97.00% 12,573 1,886,221 97.65% 45,307 2.35%
*Data not yet available as of publishing date
PROPERTY TAX LEVIES AND COLLECTIONS
Collected within the
Fiscal Year of the Levy Total Collections to Date
1999 - 2008
1 Washington State Voter Initiation 747 was passed limiting property taxes for taxing jurisdictions under 10,000 in population to
1% over the previous year's levy
-
200,000
400,000
600,000
800,000
1,000,000
1,200,000
1,400,000
1,600,000
1,800,000
2,000,000
1999 2000 2001 2002 2003 2004 2005 2006 2007 2008
Total Collections to Date
Total Collections to Date

CITY OF POULSBO STATISTICAL SECTION
2008 COMPREHENSIVE ANNUAL FINANCIAL REPORT Page 137
Fiscal
Year
General
Obligation
Bonds PWTF Loans Water Bonds Sewer Bonds PWTF Loans
Total Primary
Government
Percentage
of Personal
Income1
Per Capita1
1999 1,155,000 - 1,050,500 4,679,500 - 6,885,000 3.94% 1,068
2000 1,050,000 - 1,047,200 4,567,800 687,716 7,352,716 3.65% 1,079
2001 940,000 1,374,570 1,043,900 4,451,100 641,868 8,451,438 3.95% 1,213
2002 1,080,000 1,302,224 1,036,200 4,313,800 596,021 8,328,245 3.73% 1,189
2003 3,301,261 1,279,878 1,005,400 4,089,600 550,173 10,226,313 4.43% 1,459
2004 3,025,000 1,207,533 973,500 3,856,500 504,325 9,566,858 3.84% 1,329
2005 7,465,000 1,155,344 974,380 3,729,620 458,477 13,782,822 5.11% 1,850
2006 7,415,000 1,071,021 933,900 3,451,100 412,630 13,283,651 4.59% 1,774
2007 6,925,000 986,698 893,200 3,166,800 366,782 12,338,480 4.04% 1,632
2008 5,810,000 902,375 818,180 2,900,820 320,934 10,752,309 -- 1,371
Note: Details regarding the city's outstanding debt can be found in the notes to the financial statements.1 See the Schedule of Demographic and Economic Statistics on for personal income and population data.
RATIOS OF OUTSTANDING DEBT BY TYPE
Governmental Activities Business-Type Activities
Last Ten Fiscal Years
-
3,000,000
6,000,000
9,000,000
12,000,000
15,000,000
1999 2000 2001 2002 2003 2004 2005 2006 2007 2008
Primary
Government
Debt
Series1
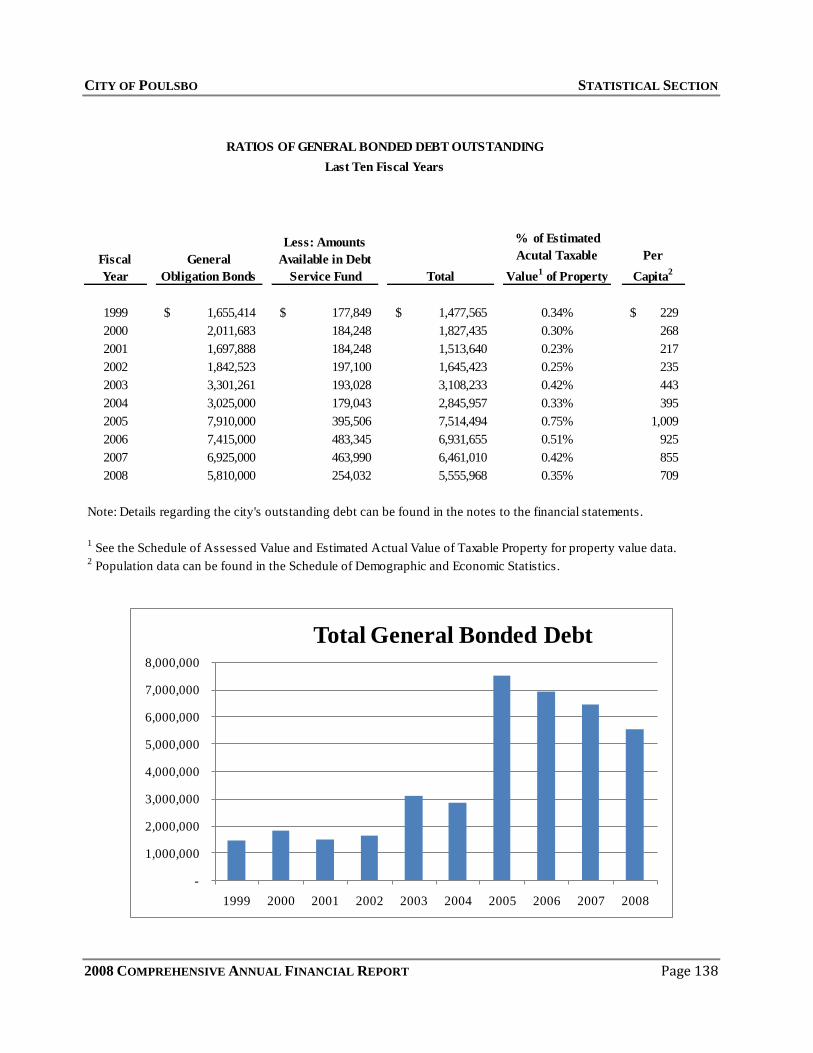
CITY OF POULSBO STATISTICAL SECTION
2008 COMPREHENSIVE ANNUAL FINANCIAL REPORT Page 138
Fiscal
Year
General
Obligation Bonds
Less: Amounts
Available in Debt
Service Fund Total
% of Estimated
Acutal Taxable
Value1 of Property
Per
Capita2
1999 1,655,414$ 177,849$ 1,477,565$ 0.34% 229$
2000 2,011,683 184,248 1,827,435 0.30% 268
2001 1,697,888 184,248 1,513,640 0.23% 217
2002 1,842,523 197,100 1,645,423 0.25% 235
2003 3,301,261 193,028 3,108,233 0.42% 443
2004 3,025,000 179,043 2,845,957 0.33% 395
2005 7,910,000 395,506 7,514,494 0.75% 1,009
2006 7,415,000 483,345 6,931,655 0.51% 925
2007 6,925,000 463,990 6,461,010 0.42% 855
2008 5,810,000 254,032 5,555,968 0.35% 709
Note: Details regarding the city's outstanding debt can be found in the notes to the financial statements.
1 See the Schedule of Assessed Value and Estimated Actual Value of Taxable Property for property value data.
2 Population data can be found in the Schedule of Demographic and Economic Statistics.
RATIOS OF GENERAL BONDED DEBT OUTSTANDING
Last Ten Fiscal Years
-
1,000,000
2,000,000
3,000,000
4,000,000
5,000,000
6,000,000
7,000,000
8,000,000
1999 2000 2001 2002 2003 2004 2005 2006 2007 2008
Total General Bonded Debt
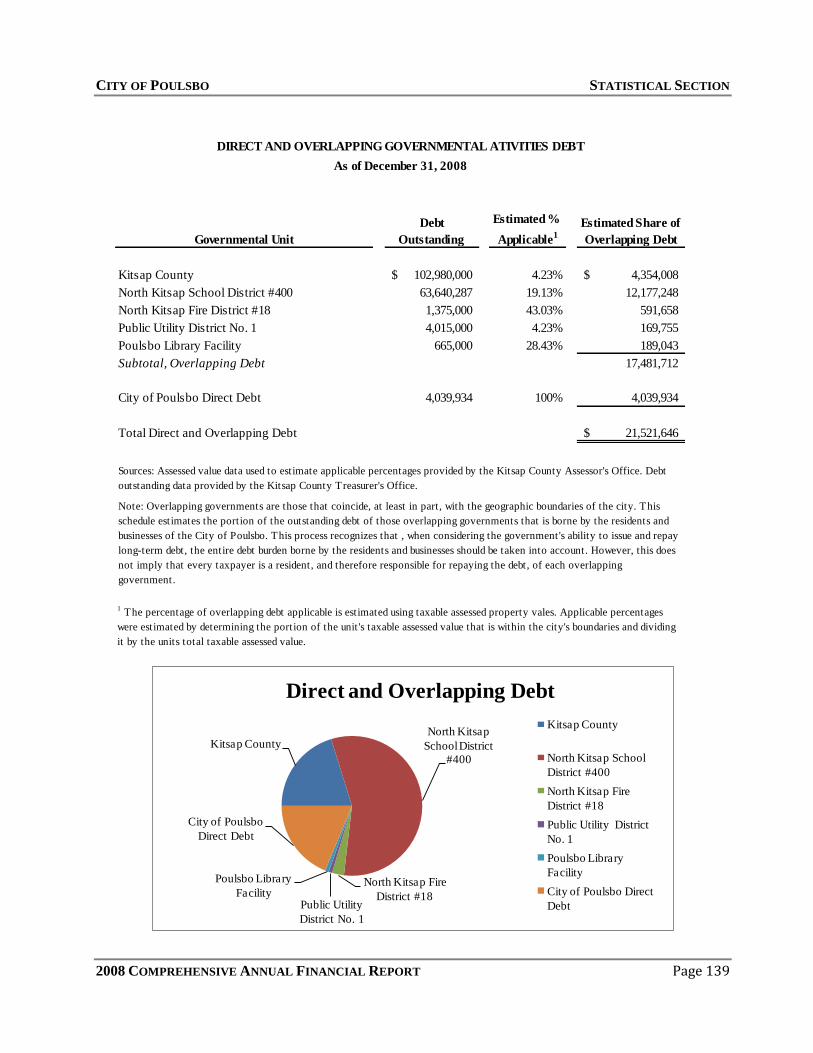
CITY OF POULSBO STATISTICAL SECTION
2008 COMPREHENSIVE ANNUAL FINANCIAL REPORT Page 139
Governmental Unit
Debt
Outstanding
Estimated %
Applicable1
Estimated Share of
Overlapping Debt
Kitsap County 102,980,000$ 4.23% 4,354,008$
North Kitsap School District #400 63,640,287 19.13% 12,177,248
North Kitsap Fire District #18 1,375,000 43.03% 591,658
Public Utility District No. 1 4,015,000 4.23% 169,755
Poulsbo Library Facility 665,000 28.43% 189,043
Subtotal, Overlapping Debt 17,481,712
City of Poulsbo Direct Debt 4,039,934 100% 4,039,934
Total Direct and Overlapping Debt 21,521,646$
Note: Overlapping governments are those that coincide, at least in part, with the geographic boundaries of the city. This
schedule estimates the portion of the outstanding debt of those overlapping governments that is borne by the residents and
businesses of the City of Poulsbo. This process recognizes that , when considering the government's ability to issue and repay
long-term debt, the entire debt burden borne by the residents and businesses should be taken into account. However, this does
not imply that every taxpayer is a resident, and therefore responsible for repaying the debt, of each overlapping
government.
1 The percentage of overlapping debt applicable is estimated using taxable assessed property vales. Applicable percentages
were estimated by determining the portion of the unit 's taxable assessed value that is within the city's boundaries and dividing
it by the units total taxable assessed value.
DIRECT AND OVERLAPPING GOVERNMENTAL ATIVITIES DEBT
As of December 31, 2008
Sources: Assessed value data used to estimate applicable percentages provided by the Kitsap County Assessor's Office. Debt
outstanding data provided by the Kitsap County Treasurer's Office.
Kitsap CountyNorth Kitsap
School District
#400
North Kitsap Fire
District #18Public Utility
District No. 1
Poulsbo Library
Facility
City of Poulsbo
Direct Debt
Direct and Overlapping Debt
Kitsap County
North Kitsap School
District #400
North Kitsap Fire
District #18
Public Utility District
No. 1
Poulsbo Library
Facility
City of Poulsbo Direct
Debt
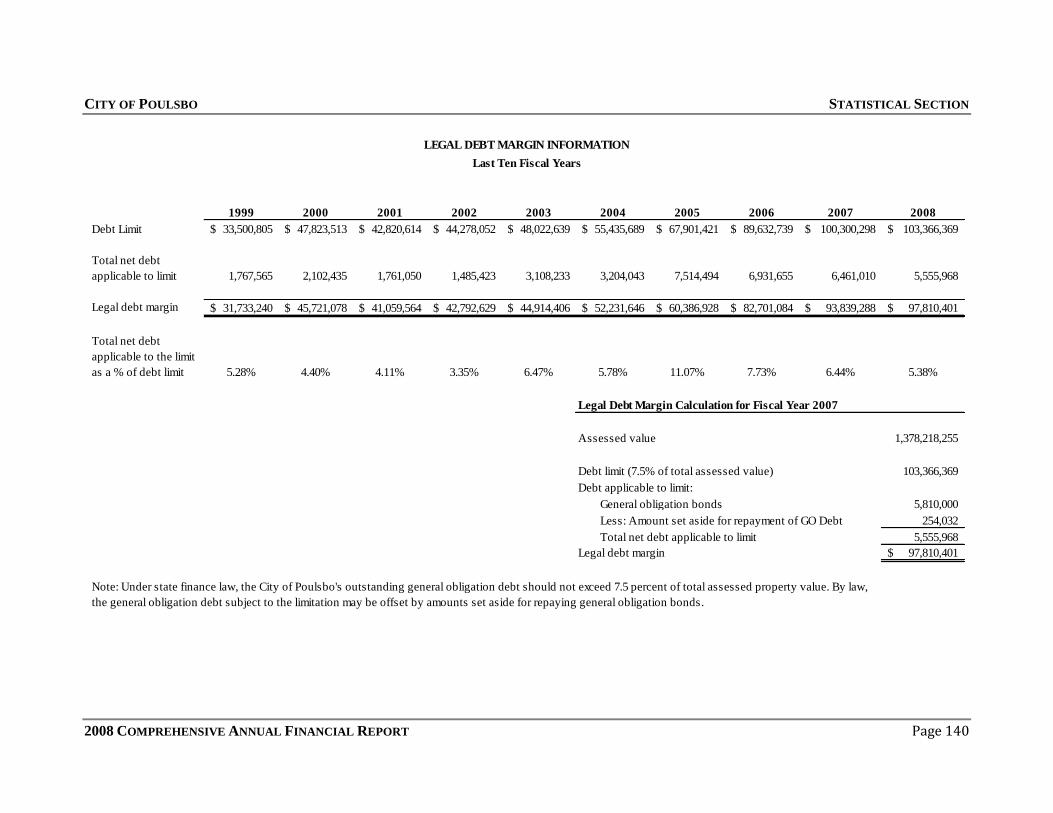
CITY OF POULSBO STATISTICAL SECTION
2008 COMPREHENSIVE ANNUAL FINANCIAL REPORT Page 140
1999 2000 2001 2002 2003 2004 2005 2006 2007 2008
Debt Limit 33,500,805$ 47,823,513$ 42,820,614$ 44,278,052$ 48,022,639$ 55,435,689$ 67,901,421$ 89,632,739$ 100,300,298$ 103,366,369$
Total net debt
applicable to limit 1,767,565 2,102,435 1,761,050 1,485,423 3,108,233 3,204,043 7,514,494 6,931,655 6,461,010 5,555,968
Legal debt margin 31,733,240$ 45,721,078$ 41,059,564$ 42,792,629$ 44,914,406$ 52,231,646$ 60,386,928$ 82,701,084$ 93,839,288$ 97,810,401$
Total net debt
applicable to the limit
as a % of debt limit 5.28% 4.40% 4.11% 3.35% 6.47% 5.78% 11.07% 7.73% 6.44% 5.38%
Legal Debt Margin Calculation for Fiscal Year 2007
Assessed value 1,378,218,255
Debt limit (7.5% of total assessed value) 103,366,369
Debt applicable to limit:
General obligation bonds 5,810,000
Less: Amount set aside for repayment of GO Debt 254,032
Total net debt applicable to limit 5,555,968
Legal debt margin 97,810,401$
Note: Under state finance law, the City of Poulsbo's outstanding general obligation debt should not exceed 7.5 percent of total assessed property value. By law,
the general obligation debt subject to the limitation may be offset by amounts set aside for repaying general obligation bonds.
LEGAL DEBT MARGIN INFORMATION
Last Ten Fiscal Years

CITY OF POULSBO STATISTICAL SECTION
2008 COMPREHENSIVE ANNUAL FINANCIAL REPORT Page 141
Charges for Less: Net
Fiscal Services & Operating Available
Year Other Expenses Revenue Principal Interest Coverage
1999 3,420,717 1,906,753 1,513,964 305,154 330,566 238%
2000 3,730,952 1,848,390 1,882,562 320,848 314,897 296%
2001 3,764,982 3,068,473 696,509 330,848 298,067 111%
2002 4,512,468 1,475,961 3,036,507 285,848 282,252 535%
2003 4,859,258 1,599,149 3,260,109 300,848 268,574 573%
2004 5,689,568 1,446,543 4,243,025 310,848 255,104 750%
2005 6,093,239 5,487,448 605,791 3,305,8481
226,266 17%
2006 3,108,704 2,195,044 913,660 364,848 210,721 159%
2007 3,182,279 2,355,900 826,379 325,000 177,073 165%
2008 3,188,562 2,850,000 338,562 341,000 165,567 67%
1 In 2005, A portion of the 1998 Revenue Bonds were refunded.
Water and Sewer Revenue Bonds
Debt Service
Note: Details regarding the government's outstanding debt can be found in the notes to the financial statements. Charges for
services and other includes plan checking fees but not tap fees and interest. Operating Expenses include depreciation but not
interest.
PLEDGED-REVENUE COVERAGE
Last Ten Fiscal Years

CITY OF POULSBO STATISTICAL SECTION
2008 COMPREHENSIVE ANNUAL FINANCIAL REPORT Page 142
FISCAL COUNTY PER CAPITA UNEMPLOYMENT SCHOOL
YEAR POPULATION POPULATION INCOME* RATE** ENROLLMENT***
1999 6,445 229,568 27,159 4.6% 3,325
2000 6,813 231,969 29,493 5.0% 3,507
2001 6,965 233,400 30,732 6.0% 3,365
2002 7,005 234,700 31,571 6.7% 3,405
2003 7,010 237,000 32,652 6.7% 3,433
2004 7,200 239,500 34,746 5.8% 3,324
2005 7,450 240,400 36,308 5.1% 3,367
2006 7,490 243,400 39,343 4.8% 3,524
2007 7,560 244,800 41,521 4.4% 3,330
2008 7,840 246,800 -- 5.4% 3,013
1 Thousands of Dollars
2 1998 is a total for all schools in North Kitsap County, 1999-2007 are totals for only schools in city limits
* Source: US Bureau of Economic Analysis-Kitsap County based on population of City
** Source: Washington State Department of Employment Security-Kitsap County
*** Source: North Kitsap School District & Office of Superintendent of Public Instruction WA State
DEMOGRAPHIC STATISTICS
Last Ten Fiscal Years

CITY OF POULSBO STATISTICAL SECTION
2008 COMPREHENSIVE ANNUAL FINANCIAL REPORT Page 143
EMPLOYER
North Kitsap School District 807 1 15.46% 873 1 21.38%
Walmart 523 2 10.02% - -
Martha & Mary Lutheran Services 426 3 8.16% 276 3 6.76%
Central Market 390 4 7.47% 350 2 8.57%
Sound Publishing 172 5 3.30% - -
Home Depot 140 6 2.68% - -
Gerneral Construction 130 7 2.49% - -
Harbor House at Liberty Shores 117 8 2.24% - -
Central Pizza & Hot Dog Co. 100 9 1.92% - -
Liberty Shores Assisted Living 97 10 1.86%
Raytheon Systems - - 200 4 4.90%
Courtesy Chevrolet - - 200 5 4.90%
EDS Corporation 2
- - 175 6 4.29%
City of Poulsbo - - 99 7 2.42%
Boxlight - - 97 9 2.38%
Frontier Bank - - 99 8 2.42%
Olympic Resource Mgmt. - - 75 10 1.84%
TOTALS: 2,902 55.59% 2,444 59.84%
Rank
% of Total
City
Employment
TOTAL
EMPLOYEES 1
PRINCIPAL EMPLOYERS
Current Year and Ten Years Ago
Rank
% of Total
City
Employment
2008 1999
TOTAL
EMPLOYEES 1
28%
18%
15%
13%
6%
5%
5% 4%
3%
3%
2008 Top Ten Principal Employers
North Kitsap School District
Walmart
Martha & Mary Lutheran Services
Central Market
Sound Publishing
Home Depot
General Construction
Harbor House at Libery Shores
Central Pizza & Hot Dog Company
Liberty Shores Assisted Living

CITY OF POULSBO STATISTICAL SECTION
2008 COMPREHENSIVE ANNUAL FINANCIAL REPORT Page 144
Function 2008 FTE's
General Government: Executive (Mayor) 1.63
Clerk's Department 4.00
Finance Department 8.00
Grant Writer 0.40
Municipal Court 4.26
Information Services 2.00
Personnel 1.00
Central Services & Library 2.50
Parks & Cemetery 3.25
Security: Police Department 22.00
Physical Environment: Engineering 6.45
Transportation: Streets 4.70
Economic Environment: Planning & Building 9.45
Culture & Recreation: Parks & Rec. 6.42
Utilities & Support: Water 2.90
Sewer 3.15
Solid Waste 3.55
Storm Drain 3.95
General Facilities 1.00
Administration 5.10
TOTALS: 95.71
FULL-TIME EQUIVALENT CITY GOVERNMENT EMPLOYEES BY FUNCTION
As of December 31, 2008
28%
23%
7%
5%
10%
7%
20%
Full-Time Equivalent Employees by
Function
General Government:
Security:
Physical Environment:
Transportation:
Economic Environment:
Culture & Recreation:
Utilities & Support:

CITY OF POULSBO STATISTICAL SECTION
2008 COMPREHENSIVE ANNUAL FINANCIAL REPORT Page 145
1999 2000 2001 2002 2003 2004 2005 2006 2007 2008
Governmental Functions
General Government Other
Number of Unions Represented 2 2 2 2 2 2 2 2 2 2
Number of passports processed 907 1,110 1,155 993 878 858 806 1,119 1,024 1,018
Number of Business Licenses Issued * * * * * 907 914 1,375 1,575 1,351
Number of City Council meetings 37 39 38 38 40 37 38 42 40 44
Number of public records requests processed * * * * * 56 57 44 73 79
Public Safety
Number of case reports filed 2,018 1,987 1,889 1,769 1,753 1,611 1,586 1,998 2,090 1,783
Number of citations issued 2,147 2,044 2,262 2,648 2,321 2,191 2,162 2,167 2,325 985
Number of calls for service 10,086 9,644 9,302 9,926 10,039 10,458 11,229 13,374 12,942 12,234
Number of responses to motor vehicle accidents 225 223 197 168 145 160 211 175 271 235
Number of driving impaired citations issued 65 59 72 83 78 49 58 110 72 71
Number of vacation house checks 1,800 1,900 1,700 1,605 1,819 1,350 909 1,034 1,049 847
Number of parking citations issued 100 110 117 101 155 171 177 231 63 230
Transportation
Miles of streets maintained * * 30 30 32 35 37 39 45 45
Miles of sidewalks maintained * * * * * 42 42 44 47 48
Number of hours spent street sweeping * * 30 396 420 420 490 546 550 468
Number of street signs maintained 889 895 900 910 1,213 1,553 1,805 1,875 2,174 2,174
Culture and Recreation
Number of parks maintained 12 12 12 12 13 16 16 16 16 17
Total acreage of parks/open space maintained 47 47 48 48 48 48 61 64 64 65
Economic Environment
Number of single family building permits issued 49 87 94 103 100 132 75 227 265 154
Number of commercial building permits 3 3 32 50 30 53 40 108 86 68
Number of all other building permits * * * * * * * 91 117 74
Physical Environment
Number of Right of Way Permits issued * * * * 35 37 47 41 42 46
OPERATING INDICATORS BY FUNCTION
Last Ten Fiscal Years

CITY OF POULSBO STATISTICAL SECTION
2008 COMPREHENSIVE ANNUAL FINANCIAL REPORT Page 146
1999 2000 2001 2002 2003 2004 2005 2006 2007 2008
Physical Environment (continued)
Number of Land Use Applications reviewed * * * * 52 97 108 96 156 89
Number of grading/site construction
permits/applications * * * * * * 20 19 10 42
Number of lots reviewed for commercial sites land
application * * * * * * 9 6 19 14
Number of lots reviewed for residential sites land
applications * * * * * * 217 1,189 500 8
Business-Type Functions
Total Number of Employees 26 26 26 26 26 27 27 30 29 29
Water
Number of active water services * 2,247 2,428 2,412 3,495 2,674 2,707 2,820 2,990 3,142
Miles of watermain lines maintained 45 45 45 47 53 57 58 60 61 61
Average number of water meters read monthly * 2,188 2,195 2,412 2,433 2,554 2,663 2,758 3,051 3,093
Sewer
Number of active sewer services * 2,123 2,502 2,349 2,600 2,525 2,561 2,631 2,778 2,869
Miles of sewermain lines maintained * * 27 27 28 31 31 32 33 34
Number of pump stations maintained * 7 7 7 8 8 8 8 9 9
Solid Waste
Number of residential garbage accounts 1,620 1,711 1,770 1,990 2,129 2,217 2,273 2,310 2,430 2,746
Number of multi-family garbage accounts 1,004 1,016 1,016 1,016 1,012 1,016 1,030 1,038 1,012 1,012
Number of dumpster accounts 168 184 181 182 182 192 224 229 201 231
Number of tons of waste to landfill 4,942 5,096 5,054 5,221 4,878 5,181 5,200 5,690 5,700 4,794 Number of 3 day free dumpsters for residential
clean-up provided * * * 341 393 420 363 326 350 308
Storm Drain
Number of detention ponds maintained 10 10 12 13 20 20 22 29 29 29
* The City implemented GASB 44 in 2006, prior year data is not readily available

CITY OF POULSBO STATISTICAL SECTION
2008 COMPREHENSIVE ANNUAL FINANCIAL REPORT Page 147
1999 2000 2001 2002 2003 2004 2005 2006 2007 2008
Governmental Functions
General Government
Number of City Vehicles (not listed below) * * * * * * * 15 3 2
Generators * * * * * * * 1 - -
Public Safety
Number of police vehicles 24 23 22
Number of police boats * * 1 1 1 1 1 1 1 1
Transportation
Number of Vehicles (not specified below) 6 11
Number of Street Sweepers 1 1 1 1 1 1 1 1 1 1
Number of Dump Trucks 7 8 8 8 8 8 8 8 4 4
Miles of streets 30 30 32 35 37 39 39 45
Number of Traffic Signals 7 8 8 8 8 8 8 8 9 8
Number of bridges - - 1 1 1 1 1 1 1 1
Culture and Recreation
Number of vehicles * * * 1 1 1 1 1 1 1
Neighborhood parks * * * * 2 3 3 3 3 8
Community parks * * * * 11 13 13 13 13 8
Indoor recreational facilities 1 1 1 1 1 1 1 1 1 1
Economic Environment
Number of Planning vehicles * * * * * 1 1 1 1 1
Physical Environment
Number of Engineering vehicles * * * * * * 3 4 4 4
CAPITAL ASSETS STATISTICS BY FUCTION
Last Ten Fiscal Years

CITY OF POULSBO STATISTICAL SECTION
2008 COMPREHENSIVE ANNUAL FINANCIAL REPORT Page 148
Business-Type Functions
Water
Generators 2 2 2 2 2 2 2 2 2 2
Miles of water mains 45 45 45 47 53 57 58 58 60 61
Number of vehicles * * * * * * * 4 4 4
Number of construction vehicles * * * * * * * 4 3 1
Number of hydrants * * * * * * * 299 315 399
Sewer
Generators * * * * * * * 3 3 5
Number of vehicles * * * * * * * 4 4 2
Number of construction vehicles * * * * * * * 3 3 6
Number of Vacuum Trucks 1 1 1 1 1 1 1 1 1 1
Sewer inspection camera * * * 1 1 1 1 1 1 1
Treatment plants (Pumping Stations) * 7 7 7 8 8 8 8 8 9
Miles of sewer mains * * 27 27 28 31 31 31 33 33
Solid Waste
Number of garbage trucks * * * * * 4 4 5 5 4
Storm Drain
Number of vehicles * * * * * * * 2 2 5
Number of Vacuum Trucks - - - - - 1 1 1 1 1
* The City implemented GASB 44 in 2006, prior year data is not readily available