city of tampa of tampa . energy efficiency ... tcea transportation concurrency exception area ......
TRANSCRIPT

City of Tampa Energy Efficiency and
Conservation Plan
June 2011 rev. August 15, 2011
Prepared for:
City of Tampa 315 E. Kennedy Blvd.
Tampa, Florida 33602
Prepared by:
formerly PBS&J
4030 West Boy Scout Blvd. Tampa, Florida 33607

A C K N O W L E D G E M E N T S
ACKNOWLEDGEMENTS
This City of Tampa Energy Efficiency and Conservation Plan is the outcome of work contributed by a
number of individuals. We wish to thank all individuals who contributed to the success of this report, in
particular:
■ Thomas Snelling, City of Tampa, Deputy Director of Growth Management and Development
Services and City of Tampa’s Green Officer
■ Loralee Morrow, Urban Designer, Land Development Coordination, City of Tampa
■ Tim Perry, Fleet Manager, City of Tampa
■ Greig Grotecloss, Engineer II, McKay Bay Refuse‐to‐Energy Facility, City of Tampa
■ Frank Pfister, Maintenance and Specifications Officer, Tampa Fire Rescue, City of Tampa
■ Brad L. Baird, Director, Water Department, City of Tampa
■ Andrea Roshaven, Environmental Specialist I/Water Conservation Coordinator, Water
Department, City of Tampa
■ Jim Corbett, Parking Division Manager, City of Tampa
■ David Bracciano, Demand Management Coordinator, Tampa Bay Water
1 B C O N T E N T S
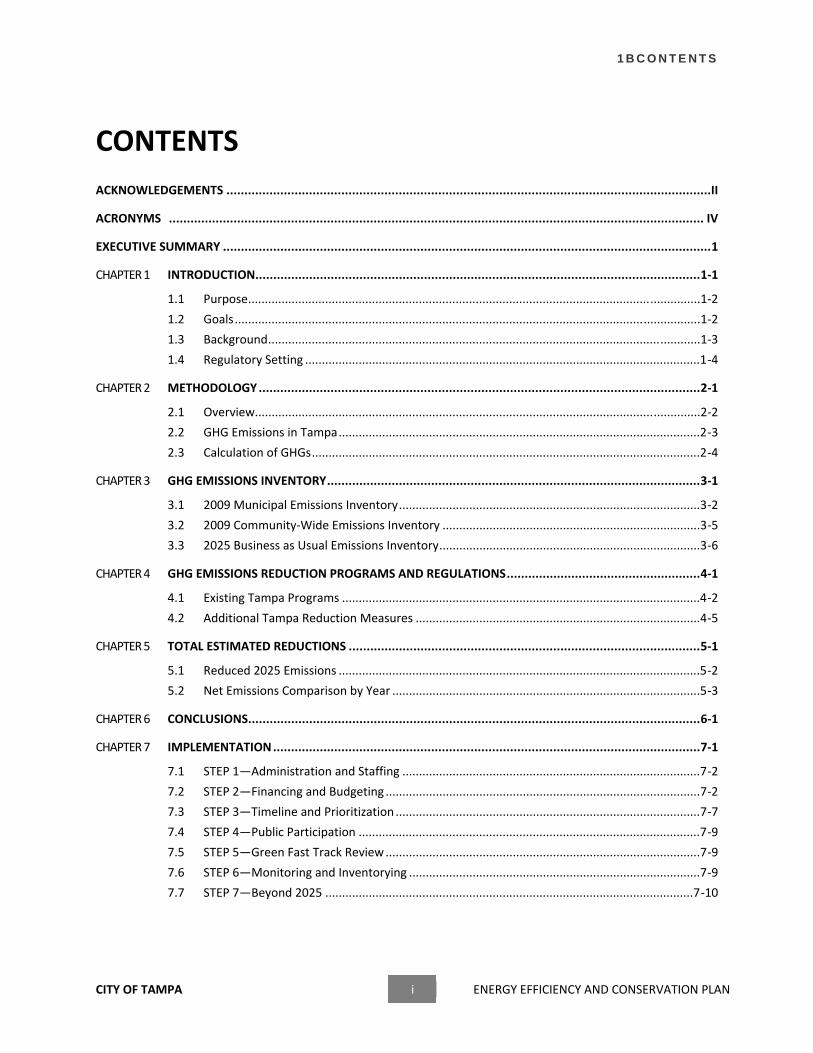
CONTENTS
ACKNOWLEDGEMENTS .......................................................................................................................................II
ACRONYMS ..................................................................................................................................................... IV
EXECUTIVE SUMMARY ........................................................................................................................................1
CHAPTER 1 INTRODUCTION............................................................................................................................1‐1
1.1 Purpose.......................................................................................................................................1‐2
1.2 Goals...........................................................................................................................................1‐2
1.3 Background.................................................................................................................................1‐3
1.4 Regulatory Setting ......................................................................................................................1‐4
CHAPTER 2 METHODOLOGY...........................................................................................................................2‐1
2.1 Overview.....................................................................................................................................2‐2
2.2 GHG Emissions in Tampa............................................................................................................2‐3
2.3 Calculation of GHGs....................................................................................................................2‐4
CHAPTER 3 GHG EMISSIONS INVENTORY........................................................................................................3‐1
3.1 2009 Municipal Emissions Inventory..........................................................................................3‐2
3.2 2009 Community‐Wide Emissions Inventory .............................................................................3‐5
3.3 2025 Business as Usual Emissions Inventory..............................................................................3‐6
CHAPTER 4 GHG EMISSIONS REDUCTION PROGRAMS AND REGULATIONS......................................................4‐1
4.1 Existing Tampa Programs ...........................................................................................................4‐2
4.2 Additional Tampa Reduction Measures .....................................................................................4‐5
CHAPTER 5 TOTAL ESTIMATED REDUCTIONS ..................................................................................................5‐1
5.1 Reduced 2025 Emissions ............................................................................................................5‐2
5.2 Net Emissions Comparison by Year ............................................................................................5‐3
CHAPTER 6 CONCLUSIONS..............................................................................................................................6‐1
CHAPTER 7 IMPLEMENTATION.......................................................................................................................7‐1
7.1 STEP 1—Administration and Staffing .........................................................................................7‐2
7.2 STEP 2—Financing and Budgeting ..............................................................................................7‐2
7.3 STEP 3—Timeline and Prioritization ...........................................................................................7‐7
7.4 STEP 4—Public Participation ......................................................................................................7‐9
7.5 STEP 5—Green Fast Track Review..............................................................................................7‐9
7.6 STEP 6—Monitoring and Inventorying .......................................................................................7‐9
7.7 STEP 7—Beyond 2025 ..............................................................................................................7‐10
CITY OF TAMPA i ENERGY EFFICIENCY AND CONSERVATION PLAN

2 B A P P E N D I C E S
CHAPTER 8 REFERENCES.................................................................................................................................8‐1
APPENDIX A: THE GREENHOUSE EFFECT, GREENHOUSE GASES, AND CLIMATE CHANGE IMPACTS ....................8‐1
APPENDIX B: MODELING COEFFICIENTS AND DATA ASSUMPTIONS .................................................................8‐2
APPENDIX C: COMMUNITY‐WIDE DATA INPUTS...............................................................................................8‐3
APPENDIX D: MUNICIPAL INVENTORY GHG CALCULATIONS .............................................................................8‐4
APPENDIX E: COMMUNITY‐WIDE INVENTORY GHG CALCULATIONS .................................................................8‐5
APPENDIX F: REDUCTION MEASURES, ASSUMPTIONS AND ATTRIBUTED REDUCTIONS.....................................8‐6
APPENDICES
Appendix A: The Greenhouse Effect, Greenhouse Gases, and Climate Change Impacts
Appendix B: Modeling Coefficients and Data Assumptions
Appendix C: Community‐Wide Data Inputs
Appendix D: Municipal Inventory GHG Calculations
Appendix E: Community‐Wide Inventory GHG Calculations
Appendix F: Reduction Measures, Assumptions and Attributed Reductions
TABLES Table ES‐1 Net Total 2025 Emissions Comparison ............................................................................ 2
Table 3‐1 2009 Total Municipal Emissions ...................................................................................3‐2
Table 3‐2 2009 Municipal Emissions by Department...................................................................3‐3
Table 3‐3 Estimated Municipal Energy Costs ...............................................................................3‐4
Table 3‐4 2009 Community‐Wide Net Total Emissions................................................................3‐5
Table 3‐5 2009 Community‐Wide Cost Estimates........................................................................3‐6
Table 3‐6 2025 Reduction Target .................................................................................................3‐6
Table 3‐7 2025 Community‐Wide BAU Net Total Emissions ........................................................3‐7
Table 3‐8 Net Total Emissions by Year .........................................................................................3‐8
Table 4‐1 GHG Emissions Reduced and Cost Savings .................................................................4‐16
Table 5‐1 Reduced 2025 Net Total Emissions ..............................................................................5‐2
Table 5‐13 Net Total 2025 Emissions Comparison .........................................................................5‐3
Table 7‐1 GHG Reduction Measure Timeline and Phasing Schedule ...........................................7‐8
CITY OF TAMPA ii ENERGY EFFICIENCY AND CONSERVATION PLAN

4 B F I G U R E S
FIGURES Figure 3‐1 2009 Municipal Emissions by Source (metric tons CO2e).............................................3‐3
Figure 3‐2 2009 Municipal Emissions by Department (metric tons CO2e) ....................................3‐4
Figure 3‐3 2009 Emissions Generated by Source (metric tons CO2e)............................................3‐5
Figure 3‐4 2025 Community‐Wide BAU Emissions by Source (metric tons CO2e) ........................3‐7
Figure 5‐1 Reduced 2025 Emissions by Emissions Category (metric tons CO2e)...........................5‐3
Figure 6‐1 Total Emissions by Year (metric tons CO2e) .................................................................6‐2
CITY OF TAMPA iii ENERGY EFFICIENCY AND CONSERVATION PLAN

5 B A C R O N Y M S
ACRONYMS
ADWF Average Daily Wastewater Flow
ARRA American Recovery & Reinvestment Act
BAU Business as usual
BACT Best Available Control Technology
BOD Biochemical oxygen demand
BTU British thermal unit
CAA Clean Air Act
CAFE Corporate Average Fuel Economy
CCTP Climate Change Technology Program
CFC Chlorofluorocarbons
C2F6 Hexafluoroethane
CF4 Carbon Tetrafluoride
CH4 Methane
CO Carbon Monoxide
CO2 Carbon Dioxide
CO2e Carbon Dioxide equivalent
COT City of Tampa
CREB Clean Renewable Energy Bonds
CSD Community Services District
DEP Department of Environmental Protection
DPM Diesel Particulate Matter
EECGB Energy Efficiency Community Block Grant
eGRID Emissions and Generation Resource Integrated Database
EISA Energy Independence and Security Act of 2007
ESCO Energy Service Company
FGBC Florida Green Building Council
FSC Forest Stewardship Council
GCC Global Climate Change
GHG Greenhouse Gas
GMDS Growth Management and Development Services
GWh Gigawatt Hours
GWP Global Warming Potential
HB House Bill
HFC Hydrofluorocarbons
HFC‐23 Trifluoromethane
HFC‐134 Hydrofluorocarbon 134
HFC‐152a Difluoroethane
CITY OF TAMPA iv ENERGY EFFICIENCY AND CONSERVATION PLAN

5 B A C R O N Y M S
CITY OF TAMPA v ENERGY EFFICIENCY AND CONSERVATION PLAN
HOV High Occupancy Vehicle
IPCC Intergovernmental Panel on Climate Change
ITS Intelligent Transportation Systems
LED Light Emitting Diode
LEED Leadership in Energy and Environmental Design
LGOP Local Government Operations Protocol
LRTP Long Range Transportation Plan
MMBTU Million BTUs
MMT Million Metric Tons
MMT CO2e Million Metric Tons Carbon Dioxide Equivalent
MOVES Motor Vehicle Emission Simulator
MPO Metropolitan Planning Organization
MT Metric Tons
MT CO2e Metric Tons Carbon Dioxide Equivalent
MWh Megawatt hours
MWh/year Megawatt hours per year
MY Model Year
N2O Nitrous Oxide
NHTSA National Highway Traffic Safety Administration
O3 Ozone
PACE Property Assessed Clean Energy
PFC Tetrafluoromethane
PSC Public Service Commission
PSD Prevention of Significant Deterioration
SIP State Implementation Plan
SF6 Sulfur Hexafluoride
STIP State Transportation Improvement Plan
TBARTA Tampa Bay Area Regional Transportation Authority
TBW Tampa Bay Water
TCEA Transportation Concurrency Exception Area
TCR The Climate Registry
TECO Tampa Electric Company
tpy Tons per year
EECP Tampa Energy Efficiency and Conservation Plan
TWD Tampa Water Department
ULEV Ultra Low Emissions Vehicle
UNFCCC United Nations Framework Convention on Climate Change
URBEMIS 2007 Urban Emissions Model, version 9.2 published in June 2007
USEPA United States Environmental Protection Agency
VMT Vehicle miles traveled


6 B E X E C U T I V E S U M M A R Y
EXECUTIVE SUMMARY
The City of Tampa is committed to providing a more livable, equitable, and economically vibrant
community through the incorporation of sustainability features and reduction of greenhouse gas (GHG)
emissions. By using energy more efficiently, harnessing renewable energy to power our buildings,
recycling our waste, conserving water, and enhancing access to sustainable transportation modes,
Tampa will keep dollars in our local economy, create new green jobs, increase energy independence,
and improve community quality of life. These efforts toward reducing GHG emissions described in this
report must be done in coordination with the City’s land use decisions. The foundation of planning land
use decisions is found in the Comprehensive Plan policies and programs.
Through this Energy Efficiency and Conservation Plan, Tampa has established goals and policies for the
year 2025 that continue to incorporate efficient use of resources into its daily management of
residential, commercial and industrial growth, education, energy and water use, air quality,
transportation, waste reduction, economic development, and open space and natural habitats to further
their commitment.
The first step in completing the Tampa Energy Efficiency and Conservation Plan was to inventory the
City’s GHG emissions. Two annual inventories for the year 2009 are included in this report: one
representing the community‐wide emissions and the other representing only emissions from the City
government’s municipal operations. Sources of emissions include transportation, electricity and natural
gas use, landscaping, water and wastewater pumping and treatment, and treatment and decomposition
of solid waste. Tampa’s inventories amounted to 8,972,139 metric tons of CO2e community‐wide and
246,087 metric tons of CO2e from municipal operations.
Following the state’s adopted GHG reduction target, Tampa has set a goal to reduce emissions back to
1990 levels by the year 2025. The projected business‐as‐usual emissions for the year 2025, based on
population and housing growth estimates, are 11,830,892 metric tons of CO2e. In order to reach the
reduction target, Tampa must offset this growth in emissions and reduce community‐wide emissions to
7,777,281 metric tons CO2e by the year 2025.
The City of Tampa has already demonstrated its commitment to sustainability through a variety of
programs and policies. These programs include the Tampa Green Resolution, EECBG‐funded energy
upgrade projects, collaboration with TECO Energy, Tampa Green Fast Track Review, and Tampa’s Water
Conservation Program.
Various state and federal policies have enacted programs that will also contribute to reduced GHG
emission in Tampa by the year 2025. Some of these policies are: updated building codes for energy
efficiency, statewide recycling goals, renewable fuel standard, and federal CAFE standards for vehicles.
By supporting the state in the implementation of these measures, Tampa will experience substantial
emissions reductions.
In order to reach the reduction target laid out in this Energy Efficiency and Conservation Plan, Tampa
needs to implement the additional reduction measures described in this report by the year 2025. These
CITY OF TAMPA ES‐1 ENERGY EFFICIENCY AND CONSERVATION PLAN
6 B E X E C U T I V E S U M M A R Y
CITY OF TAMPA ES‐2 ENERGY EFFICIENCY AND CONSERVATION PLAN
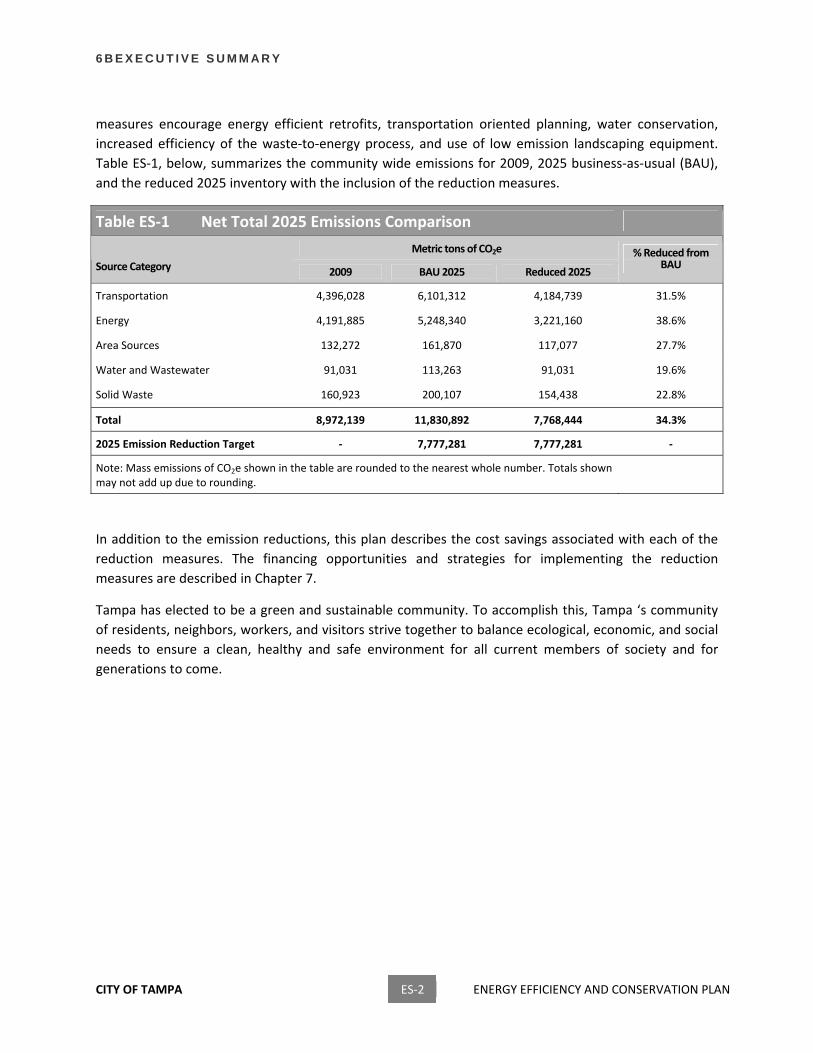
measures encourage energy efficient retrofits, transportation oriented planning, water conservation,
increased efficiency of the waste‐to‐energy process, and use of low emission landscaping equipment.
Table ES‐1, below, summarizes the community wide emissions for 2009, 2025 business‐as‐usual (BAU),
and the reduced 2025 inventory with the inclusion of the reduction measures.
Table ES‐1 Net Total 2025 Emissions Comparison
Metric tons of CO2e
Source Category 2009 BAU 2025 Reduced 2025
% Reduced from BAU
Transportation 4,396,028 6,101,312 4,184,739 31.5%
Energy 4,191,885 5,248,340 3,221,160 38.6%
Area Sources 132,272 161,870 117,077 27.7%
Water and Wastewater 91,031 113,263 91,031 19.6%
Solid Waste 160,923 200,107 154,438 22.8%
Total 8,972,139 11,830,892 7,768,444 34.3%
2025 Emission Reduction Target ‐ 7,777,281 7,777,281 ‐
Note: Mass emissions of CO2e shown in the table are rounded to the nearest whole number. Totals shown may not add up due to rounding.
In addition to the emission reductions, this plan describes the cost savings associated with each of the
reduction measures. The financing opportunities and strategies for implementing the reduction
measures are described in Chapter 7.
Tampa has elected to be a green and sustainable community. To accomplish this, Tampa ‘s community
of residents, neighbors, workers, and visitors strive together to balance ecological, economic, and social
needs to ensure a clean, healthy and safe environment for all current members of society and for
generations to come.

CITY OF TAMPA 1‐1 ENERGY EFFICIENCY AND CONSERVATION PLAN
CHAPTER 1 Introduction

C H A P T E R 1 1 3 B I N T R O D U C T I O N
The City of Tampa is committed to providing a more livable, sustainable, and economically vibrant
community through the preservation of natural resources and reduction of greenhouse gas (GHG)
emissions. By using energy more efficiently, harnessing renewable energy to power buildings, recycling
waste, and enhancing access to sustainable transportation modes, Tampa will keep dollars in the local
economy, create new green jobs and improve community quality of life. These efforts toward reducing
GHG emissions must be done in coordination with the City’s land use decisions. The foundation of
planning land use decisions is found in the Comprehensive Plan policies and programs. The Tampa
Energy Efficiency and Conservation Plan (EECP) considers the Comprehensive Plan policies and programs
as the GHG emissions are inventoried and reduction strategies are recommended.
This section describes the purpose and goals of the EECP, provides background information on GHG
emissions, and summarizes the regulatory framework surrounding GHG emissions and climate change.
1.1 Purpose The EECP was designed under the premise that the City and the community it represents are uniquely
capable of addressing both emissions from the City’s municipal operations as well as community‐wide
emissions from sources under the City’s jurisdiction. The City’s emission reduction efforts should
coordinate with the state strategies in order to accomplish emission reductions in an efficient and cost
effective manner. The City developed this document with the following purposes in mind:
■ Create a GHG baseline of both municipal emissions and community‐wide emissions from which to
benchmark GHG reductions
■ Provide a plan that is consistent with and complementary to the GHG emissions reduction efforts
being conducted by the Florida Department of Environmental Protection (DEP), the federal
government through the actions of the Environmental Protection Agency (EPA), and the global
community through the Kyoto Protocol
■ Guide the development, enhancement, and implementation of actions that reduce GHG
emissions and promote economic and environmental sustainability
■ Provide a policy document with specific implementation measures meant to be considered as part
of the planning process for future development projects
1.2 Goals To fulfill the purposes of the EECP, the City identified the following goals to be achieved:
■ Provide a list of specific actions that will reduce GHG emissions, giving the highest priority to
actions that provide the greatest reduction in GHG emissions and benefits to the community at
the least cost
CITY OF TAMPA 1‐2 ENERGY EFFICIENCY AND CONSERVATION PLAN
1 . 3 2 3 B B A C K G R O U N D
■ Reduce community‐wide emissions attributable to Tampa to levels at or below 1990 GHG
emissions by year 2025
1.3 Background The EECP achieves the purpose and goals described above by providing:
■ An analysis of GHG emissions and sources attributable to the City of Tampa.
■ Estimates on how those emissions are expected to increase.
■ Recommended policies and actions that can reduce GHG emissions to meet state, federal and
international targets.
■ A timeline of implementation.
■ A defined tracking and reporting mechanism that will measure progress toward the goals.
In order to understand this process, the reader needs to know a few facts about GHG emissions, the
climate change impacts anticipated within the City of Tampa, and the international, federal, state, and
regional regulatory framework designed to address climate change. The following information provides
a brief background on these topics. A more complete description of the greenhouse effect, GHG
emissions, and general climate change impacts can be found in Appendix A of this document.
Greenhouse Gases Parts of the Earth’s atmosphere act as an insulating “blanket” of just the right thickness, trapping
sufficient solar energy to keep the global average temperature in a suitable range. This blanket is a
collection of atmospheric gases called greenhouse gases, based on the idea that these gases also trap
heat similar to the glass walls of a greenhouse. These gases, consisting mainly of water vapor, carbon
dioxide (CO2), methane (CH4), nitrous oxide (N2O), ozone (O3), and chlorofluorocarbons (CFC), all act as
effective global insulators, reflecting back to earth infrared radiation. EPA has identified sources of GHG
emissions from activities such as producing electricity and driving internal combustion vehicles.
Tampa does not generate significant emissions of CFCs (primarily used as refrigerants, aerosol
propellants, and cleaning solvents) due to the successful global bans on these GHGs. This also includes
other synthesized gases such as hydrofluorocarbons (HFC) and carbon tetrafluoride (CF4), which have
been banned and are no longer available on the market. Because of the ban, the City will not generate
emissions of these GHGs and, therefore, they are not considered further in this document.
Another GHG is sulfur hexafluoride (SF6), which is mainly used as a gaseous dielectric medium in electric
switchgear of high‐voltage electric transmission lines, and for medical use in retinal detachment surgery
and ultrasound imaging. However, in both uses, SF6 is not released to the atmosphere and, therefore, it
is not considered further in this document.
CITY OF TAMPA 1‐3 ENERGY EFFICIENCY AND CONSERVATION PLAN

C H A P T E R 1 1 3 B I N T R O D U C T I O N
CITY OF TAMPA 1‐4 ENERGY EFFICIENCY AND CONSERVATION PLAN
Because GHGs have variable potencies, a common metric of carbon dioxide equivalents (CO2e) is used to
report the combined potency from all of the GHGs. The potency each GHG has in the atmosphere is
measured as a combination of the volume of its emissions and its global warming potential (GWP),1 and
is expressed as a function of the potency with respect to the same mass of CO2. Thus, by multiplying the
individual gas by its global warming potential, the emissions of each individual gas can be measured in
terms of metric tons of CO2e (MT CO2e). For example, methane has a GWP of 21, meaning it is 21 times
more effective at trapping heat as CO2. One metric ton of methane is equal to 21 metric tons of CO2e.
1.4 Regulatory Setting In an effort to stabilize GHG emissions and reduce impacts associated with climate change, international
agreements as well as federal and state actions were implemented beginning as early as 1988. The
international, federal, state, regional, and local government agencies discussed below work jointly, as
well as individually, to address GHG emissions through legislation, regulations, planning, policy‐making,
education, and a variety of programs.
International and Federal
KYOTO PROTOCOL The United States participated in the United Nations Framework Convention on Climate Change
(UNFCCC) signed on March 21, 1994. The Kyoto Protocol is a treaty made under the UNFCCC and was
the first international agreement to regulate GHG emissions. It has been estimated that if the
commitments outlined in the Kyoto Protocol are met, global GHG emissions could be reduced by an
estimated 5 percent from 1990 levels during the first commitment period of 2008–2012 (UNFCCC 1997).
It should be noted that although the United States is a signatory to the Kyoto Protocol, Congress has not
ratified the Protocol and the United States is not bound by the Protocol’s commitments.
In anticipation of providing an updated international treaty for the reduction of GHG emissions,
representatives from 170 countries met in Copenhagen in December 2009 to ratify an updated UNFCCC
agreement (Copenhagen Accord). The Copenhagen Accord, a voluntary agreement between the United
1 The potential of a gas or aerosol to trap heat in the atmosphere.

1 . 4 2 4 B R E G U L A T O R Y S E T T I N G
States, China, India, and Brazil, recognizes the need to keep global temperature rise to below 2 0C and
obliges signatories to establish measures to reduce greenhouse gas emissions and prepare to help
poorer countries in adapting to climate change. The countries met again in Cancun in December 2010
and adopted the Cancun Agreements, which reinforces and builds upon the Copenhagen Accord. The
nations agreed to recognize country targets, develop low‐carbon development plans and strategies, and
report inventories annually. In addition, agreements were made regarding financing for developing
countries and technology support and coordination among all nations. The next conference of the
parties is scheduled for December 2011 in South Africa.
CLIMATE CHANGE TECHNOLOGY PROGRAM The United States has opted for a voluntary and incentive‐based approach toward emissions reductions
in lieu of the Kyoto Protocol’s mandatory framework. The Climate Change Technology Program (CCTP) is
a multi‐agency research and development coordination effort (led by the Secretaries of Energy and
Commerce) that is charged with carrying out the President’s National Climate Change Technology
Initiative.
U.S. ENVIRONMENTAL PROTECTION AGENCY The EPA is responsible for implementing federal policy to address global climate change. The federal
government administers a wide array of public‐private partnerships to reduce GHG intensity generated
by the United States. These programs focus on energy efficiency, renewable energy, methane, and other
non‐CO2 gases, agricultural practices, and implementation of technologies to achieve GHG reductions.
EPA implements several voluntary programs that substantially contribute to the reduction of GHG
emissions. Programs include the State Climate and Energy Partner Network that allows for the exchange
of information between federal and state agencies regarding climate and energy, the Climate Leaders
program for companies, the Energy Star labeling system for energy‐efficient products, and the Green
Power Partnership for organizations interested in buying green power. All of these programs play a
significant role in encouraging voluntary reductions from large corporations, consumers, industrial and
commercial buildings, and many major industrial sectors.
State EXECUTIVE ORDERS OF 2007 In July 2007, Governor Charlie Crist issued three Executive Orders that outlined Florida’s commitment to
addressing climate change.
■ Executive Order 07‐126 directed state government to “lead by example” by quantifying
operational emissions and meeting specific reduction targets by implementing a range of GHG
emission reduction efforts.
■ Executive Order 07‐127 set emission reduction targets for the state as follow: by 2017, reduce
GHG emissions to 2000 levels; by 2025, reduce GHG emissions to 1990 level; and by 2050, reduce
GHG emissions by 80% of 1990 levels. The Order also assigned tasks to the Florida Department of
CITY OF TAMPA 1‐5 ENERGY EFFICIENCY AND CONSERVATION PLAN

C H A P T E R 1 1 3 B I N T R O D U C T I O N
Environmental Protection (DEP) and the Florida Public Service Commission (PSC) to work toward
adopting rules and regulations to achieve the reduction targets.
■ Executive Order 07‐128 instigated the formation of the Florida Climate Action Team whose main
objective was to create a comprehensive Energy and Climate Change Action Plan for the state of
Florida to achieve the state reduction target.
ENERGY, CLIMATE CHANGE, AND ECONOMIC SECURITY ACT OF 2008 The Energy, Climate Change, and Economic Security Act (House Bill 7135), passed in 2008, amended
several sections of the Florida Statutes to enact climate change and greenhouse gas reduction initiatives
and policies. Policies include the Florida Climate Protection Act, which authorizes the Department of
Environmental Protection to develop an electric‐utility GHG cap‐and‐trade program. The bill also directs
the Public Service Commission to adopt a Renewable Portfolio Standards for public utilities and
establishes the Florida Energy and Climate Commission, which will execute many of the statute’s
provisions. The Florida Energy Systems Consortium was established as a collaboration of the state
universities and tasked to develop and implement a strategic plan for the state. The bill also sets a
statewide 10‐percent ethanol Renewable Fuel Standard, increases energy efficiency targets in the
Florida Building Code by 50 percent by 2019, and mandates that all state‐financed building construction
and renovation comply with green building standards. The bill also amended Section 339.175 of the
Florida Statutes by stating, “Each MPO is encouraged to consider strategies that integrate transportation
and land use planning to provide for sustainable development and reduce greenhouse gas emissions.”
FLORIDA ENERGY AND CLIMATE CHANGE ACTION PLAN The final Energy and Climate Change Action Plan, finished in 2008, provides 50 separate policy
recommendations that will reduce harmful GHG emissions and provide a framework for climate change
adaptation strategies for the state. The Plan acknowledges Florida’s unique susceptibility to impacts of
climate change and encourages early actions toward energy conservation, energy efficiency,
investments in low‐carbon energy sources, and market‐oriented regulations to reduce GHG emissions.
The plan revealed that “in 2005, Florida’s gross emissions accounted for approximately 337 million
metric tons of carbon dioxide equivalent, this was a growth of 35 percent from 1990 to 2005 (roughly
twice the national average of 16 percent), driven largely by the growth of population and emissions
associated with economic development.” Emissions are also projected to rise steeply to about 463
million metric tons by 2025 (86 percent above 1990 levels) without the incorporation of actions to
control emissions. (CCS 2008a)
The Action Plan policy recommendations include a 20% by 2020 Renewable Portfolio Standard,
increased energy efficiency in buildings, forest restoration and management, increased municipal solid
waste technology, development and expansion of low‐GHG fuels, improved transportation
management, and transportation and land use planning policies among others. Florida is considered
especially susceptible to the impacts of climate change due to its low sea level, miles of coastline, and
delicate wildlife habitat. Strategies to adapt include addressing the following elements: protection of
ecosystems and biodiversity, water resource management, flood protection, emergency preparedness,
CITY OF TAMPA 1‐6 ENERGY EFFICIENCY AND CONSERVATION PLAN

1 . 4 2 4 B R E G U L A T O R Y S E T T I N G
human health considerations, social effects, state funding and financing, and public education and
outreach. (CCS 2008a)
ENERGY EFFIFICIENT LAND USE, ENERGY CONSERVATION, AND REDUCTION OF GREENHOUSE GASES, 2008 House Bill 697 (HB 697), signed by the Governor on June 17, 2008, made amendments to the Growth
Management Act which now requires several of the mandatory local comprehensive plan elements to
address greenhouse gas reduction and energy conservation. The following elements must now consider
greenhouse gas reduction strategies:
■ Future Land Use Element
■ Traffic Circulation Element
■ Transportation Element
■ Conservation Element
■ Housing Element
Efforts are currently being made at the state level to develop minimum criteria for compliance with HB
697.
FLORIDA DEPARTMENT OF ENVIRONMENTAL PROTECTION Following Executive Order 07‐127, the Florida Department of Environmental Protection (DEP) adopted
three rules addressing GHG emissions reduction.
■ Rule 62‐285.400 Adopts California Motor Vehicle Emission Standards
■ Rule 62‐285.420 is the Heavy‐Duty Vehicle Idling Reduction Rule ■ Rule 62‐285.421 initiates the Clean Diesel Rebate Program
The US EPA granted California their waiver request to regulate GHG emissions from motor vehicles
under the Clean Air Act. Other states can either follow the federal standards or choose to adopt
California’s emissions standards for passenger vehicles. Although the Florida DEP has adopted Rule 62‐
285.400, the Florida legislature has not yet ratified the California Motor Vehicle Standards. The Heavy
Duty Vehicle Idling Reduction Rule sets a limit of 5 consecutive minutes for a heavy‐duty vehicle to be
stopped with its engine running. Florida’s Clean Diesel Rebate Program allowed rebates in the amount
of $1,500 per qualifying vehicle to equip the vehicle with an auxiliary power unit. Applications were
accepted beginning March 15, 2009 and 55 rebates were issued during the first year; rebates are
currently available through June 30, 2011.
PROPERTY ASSESSED CLEAN ENERGY, 2010 HB 7179, passed in 2010, created a financing mechanism for energy improvements that is often referred
to as Property Assessed Clean Energy (PACE). Specifically, the legislation authorizes a property owner to
voluntarily enter into a financing agreement with a local government for the purpose of providing
financing for qualifying improvements to residential, commercial, or industrial property. Under the
program, property owners can elect to invest in energy efficiency retrofits or renewable energy, and the
CITY OF TAMPA 1‐7 ENERGY EFFICIENCY AND CONSERVATION PLAN

C H A P T E R 1 1 3 B I N T R O D U C T I O N
local government will then issue bonds or other lawful debt and pay for those improvements to an
owners’ property. The local government will then be paid back by the property owners through non‐ad
valorem assessments on participating property owners’ tax bills.
Regional HILLSBOROUGH COUNTY METROPOLITAN PLANNING ORGANIZATION The City of Tampa is located within the geographical jurisdiction of the Hillsborough County
Metropolitan Planning Organization (MPO). MPOs are responsible for maintaining and updating regional
transportation plans and will play a vital role in planning transportation policies for addressing climate
change. In Hillsborough County, the MPO completed a 2035 Long Range Transportation Plan (LRTP) in
April 2009. The LRTP includes a report on Sustainability and GHG Reduction Strategies which explains
the prominence of GHG emissions from transportation and the approach the MPO will take to reduce
those emissions.
The LRTP describes how the integration of transportation and land use planning efforts are critical for
reducing vehicles miles traveled (VMT) and hence, GHG emissions. Some strategies highlighted by the
MPO to reduce emissions include: pricing signals through tolling, fuel prices, fuel efficiency, and parking
costs; alternate mode infrastructure through highway operation, transit, carpool/vanpool, and
bike/pedestrian infrastructure; land use though concurrency initiatives, density, mix of uses, and design;
and transportation conservation programs such as incentives to drive less, demand management, and
education.
CITY OF TAMPA 1‐8 ENERGY EFFICIENCY AND CONSERVATION PLAN

1 . 4 2 4 B R E G U L A T O R Y S E T T I N G
CITY OF TAMPA 1‐9 ENERGY EFFICIENCY AND CONSERVATION PLAN
This page intentionally left blank.


CITY OF TAMPA 2‐1 ENERGY EFFICIENCY AND CONSERVATION PLAN
CHAPTER 2 Methodology
C H A P T E R 2 1 4 B M E T H O D O L O G Y
2.1 Overview The methodology to prepare the GHG inventories in the EECP incorporates the protocols, methods and
emission factors found in The Climate Registry (TCR) General Reporting Protocol and the Local
Government Operations Protocol (LGOP). The LGOP categorizes GHG emissions into three distinct
scopes that provide a way of organizing the EECP’s development.
Definition of Local Government Protocol:
■ Scope 1 Emissions includes all “direct” sources of community‐wide GHG emissions from sources
within the jurisdictional boundaries of the City. This includes fuel burned onsite in buildings and
equipment such as natural gas or diesel fuel; transportation fuels burned in motor vehicles and
airplanes; and wood‐burning emissions from household hearths. For inventories of only
municipal operations, these emissions are limited to activities under the operational control of
the local government.
■ Scope 2 Emissions account for “indirect” sources of GHG emissions resulting from the
consumption of purchased electricity that is electricity used by the residents, businesses, and
City’s facilities. These emissions are “indirect” as the GHG emissions arise distantly, for example at
an electric generating station in another city, county, or even state. Thus they are distinguished
from direct emissions (i.e., Scope 1 emissions), which are reported by the utility itself, in order to
avoid double counting.
■ Scope 3 Emissions is considered an optional reporting category that encompasses all other
“indirect emissions” that are a consequence of activities of the City’s residents and businesses,
but occur from sources out of the jurisdictional control of the local government. For example,
emissions from trucks hauling waste under a City contract. The inventory will include this
category if the emissions are “indirect or embodied emissions over which the local government
exerts significant control or influence.”
Scope 1 emissions are characterized in this report as “direct emissions” While Scope 2 emissions are
characterized as “indirect source emissions.” The Scope 3 emissions are only included in the government
operations inventory for the City, these include emissions from government employees’ commutes.
The analysis relative to the EECP employs both quantitative and qualitative components. The
quantitative analysis contains an inventory of the City’s GHG emissions, while the qualitative component
involves compliance with the emission reduction strategies contained in federal, state, and local
legislation. The analysis is tailored to include all historic, existing, and projected emission sources within
the City while providing, to the fullest extent feasible, a comprehensive analysis of GHG impacts and
mitigation measures available to reduce impacts.
CITY OF TAMPA 2‐2 ENERGY EFFICIENCY AND CONSERVATION PLAN

2 . 2 2 6 B G H G E M I S S I O N S I N T A M P A
2.2 GHG Emissions in Tampa This EECP includes both an inventory of Tampa’s municipal
operations and an inventory of community‐wide emissions in
the City’s jurisdiction. The municipal inventory categorizes the
major sources and quantities of GHG emissions produced by the
City’s energy and fuel use in city‐owned or operated buildings,
facilities, and vehicles. The City’s municipal emissions are also
tabulated for each government department. The community‐
wide inventory identifies and categorizes the major sources and
quantities of GHG emissions currently being produced by the
City’s residents, businesses and municipal operations. The EECP
established 2009 as the year on which to base the existing inventories; this is the most recent year for
which reliable data is available. Both inventories are presented in this report for the year 2009;
additionally, the community‐wide emissions are forecasted to 2025 in order to establish a business‐as‐
usual (BAU) scenario for Tampa’s future emissions. These inventories provide a framework on which to
design programs and actions that specifically target reductions by emissions sources. The inventories
also serve as references against which to measure the City’s progress towards reducing GHG emissions
over time, and documentation for potential emission trading opportunities. Regional GHG trading
programs already exist in the U.S. and a national cap‐and‐trade program could be implemented in the
future. The inventories included in this report will serve as a basis for Tampa to participate in a regional
or national carbon trading program.
Following the state’s reduction target laid out in Executive Order 07‐127, the EECP establishes a return
to 1990 emissions levels by 2025 as the reduction target for community‐wide emissions. Due to a lack of
sufficient fuel use and transportation data from 1990, Tampa’s 1990 emissions were estimated based on
the population change over the time period from 1990 to 2009; this value is also referred to as the
reduction target throughout this report. Finally, the EECP estimates the anticipated community‐wide
emissions for 2025 based on expected growth in population and employment.
In estimating Tampa’s total greenhouse gas emissions, data sources from the City, regional, and state
agencies were used. In cases where specific data for 2009 was not available, estimates were made by
extrapolating from data available. General estimate calculations and assumptions are compiled in
Appendices B through F. All of the contributors to greenhouse gas emissions (kilowatt‐hours of
electricity generated by fossil fuel combustion in power plants, natural gas in therms, vehicle travel in
vehicle miles traveled, and solid waste in tons) are expressed in the common unit of metric tons of
carbon dioxide equivalent (MT CO2e) released into the atmosphere in a given year.
Tampa’s main contribution to GHGs is carbon dioxide (CO2). The City directly generates emissions of CO2
primarily in the form of vehicle exhaust and consumption of natural gas for heating. Tampa also
generates methane (CH4) and nitrous oxide (N2O) emissions. Methane is directly generated from natural
gas and petroleum systems and wastewater treatment while nitrous oxide results predominantly from
motor vehicle use.
CITY OF TAMPA 2‐3 ENERGY EFFICIENCY AND CONSERVATION PLAN

C H A P T E R 2 1 4 B M E T H O D O L O G Y
2.3 Calculation of GHGs The following summarizes the basis of the GHG calculations by
emission source. The emissions calculations follow The Climate
Registry (TCR) General Reporting Protocol and the Local
Government Operations Protocol; these protocols are
consistent with the methodology and emission factors
endorsed by EPA. In cases where these protocols do not contain
specific source emission factors, current industry standards or
the US EPA’s AP 42 Compilation of Air Pollution Emission
Factors were used. Equations and coefficients used in the
calculations of GHG’s are included in Appendix B and the
community‐wide data inputs for the inventories are included in Appendix C. Appendices D and E contain
the inventory calculations for the municipal and community‐wide inventories, respectively.
GHG emissions are typically segregated into direct and indirect sources as discussed above. However,
direct and indirect sources are not completely independent of each other and are often combined into
other more encompassing categories. For example, although natural gas combustion is a direct source
and electricity generation is an indirect source, they both are typically discussed under a heading of
“Energy” when policies are put in place to reduce emissions. Therefore, this EECP discusses community‐
wide emissions with respect to the general source categories of Transportation, Energy, Area Source,
Water, and Solid Waste. The municipal operations are reported in the categories of electricity, natural
gas, vehicle fleet, employee commute, wastewater, and waste‐to‐energy.
In this EECP, BAU refers to continued operations and development of the City without the inclusion of
recently‐adopted or proposed sustainability initiatives. The BAU scenario describes how emissions
would be in year 2025, if the emissions continued to grow strictly based upon the population and
employment growth projections for the City and the naturally occurring events that might change the
character of emissions. Therefore, BAU follows a predominantly linear growth pattern.
In addition to emissions, where possible, the total costs were calculated for each sector. The costs were
based on the consumer fees for each fuel type included in the inventory. By including the costs, the City
of Tampa is able to see where consumers and local government departments are spending the most
money and utilize the information in making decisions on reduction measures.
Energy ELECTRICITY The City emits CO2, CH4, and N2O indirectly through the use of electricity provided by Tampa Electric
Company (TECO). For the municipal inventory, electricity use in government facilities and streetlights
was obtained from the City and categorized by department. The City also operates McKay Bay Refuse‐
to‐Energy facility. The energy produced by the facility is used in‐house, and excess energy is sold back to
CITY OF TAMPA 2‐4 ENERGY EFFICIENCY AND CONSERVATION PLAN

2 . 3 2 7 B C A L C U L A T I O N O F G H G S
the grid. 2009 community‐wide energy use was obtained from TECO, and 2025 BAU electricity use was
estimated based on anticipated growth in population and employment for the City.
TECO provides electricity from a variety of sources including natural gas, oil, and coal. Each of these
sources of electricity emits different levels of GHGs. The annual usage in megawatt hours per year
(MWh/year) was multiplied by the emission factors, obtained from EPA’s Emissions and Generation
Resource Integrated Database (eGRID), appropriate to the inventory year for CO2, CH4, and N2O to
determine emissions from these sources. Costs of electricity calculations were based on the annual kWh
use and price per kWh for each rate class. Electricity rates fluctuate throughout the year, so average
values were used.
NATURAL GAS COMBUSTION The City emits GHGs from the combustion of natural gas. The annual natural gas usage for the City in
therms was converted to million British Thermal Units (MMBTUs) and multiplied by the respective
emissions factors for CO2, CH4, and N2O to determine the emissions from natural gas combustion,
typically used for heating. Natural gas usage for both municipal and community‐wide activities for 2009
was obtained from Peoples Gas Company. Anticipated 2025 natural gas data was based on per unit
usage in 2009 and the anticipated unit growth by 2025. The costs associated with natural gas use were
calculated using the People Gas rate schedule.
Water WATER USE Electricity is needed to move and treat water. Tampa produces more than 26 billion gallons of drinking
water annually to meet Tampa’s drinking water needs. Raw water is obtained through the Hillsborough
River Reservoir, and then the water is treated at the David L. Tippin Water Treatment Facility before
being pumped through the 2,230 miles of pipe to distribute the water to the residents and businesses of
Tampa. The emissions associated with the electricity used to pump and treat the local water are
included in the electricity sections of both the community‐wide and municipal inventories described
above; the electricity data received from TECO includes this electricity.
When the reservoir is low, raw water is purchased from Tampa Bay Water (TBW) to replenish it; this
water is pumped from the Harney Canal to the Hillsborough River. Additionally, the Tampa Water
Department (TWD) purchases treated water from TBW via the connection at Morris Bridge. TBW water
is made up of a combination of groundwater, river water, and desalinated seawater. There is additional
electricity consumed outside the city boundaries and GHG emissions associated with this purchased
water, particularly the desalinated water, which is not accounted for in the community‐wide electricity
consumption data for the City of Tampa provided from TECO. The Water section of the community‐
wide inventory includes the emissions from the additional electricity used to pump the purchased water
from TBW to into TWD’s system. TWD provided data for the total gallons of water purchased from TBW
during the year 2009 and emission coefficients for CO2, CH4, and N2O were obtained from TBW’s GHG
Emissions Associated with Water Production Report presented in their Compilation of Members’ Five
Year Conservation Plans (TBW 2011).
CITY OF TAMPA 2‐5 ENERGY EFFICIENCY AND CONSERVATION PLAN

C H A P T E R 2 1 4 B M E T H O D O L O G Y
WASTEWATER TREATMENT All of the wastewater discharged to the City of Tampa system is treated in the Howard F. Curren
Advanced Wastewater Treatment Plant. The final product, or effluent water, is discharged to
Hillsborough Bay or used as reclaimed water for cooling and irrigation. GHG emissions arise from the
electricity used to pump and treat the effluent, the transportation fuel used to truck the biosolids to an
off‐site disposal area, and the direct methane emissions from the anaerobic digesters used in the
treatment process. The electricity and transportation emissions are included in their respective
categories. The emissions presented here are the direct emissions calculated based on the amount of
methane gas produced by the anaerobic digester and the amount of biochemical oxygen demand (BOD)
removed from the water.
Solid Waste Management Most of the municipal solid waste from the City’s residents and businesses is converted into electrical
energy at the McKay Bay Refuse‐to‐Energy Facility. A small portion of the City’s waste is transported to
the Southeast County Landfill. In the northern part of the City, the New Tampa Area has waste
management services provided by the County; this waste is converted to electrical energy as well at the
County’s waste‐to‐energy facility. Emissions from the refuse to energy facility are determined by the
annual tons of waste converted and the composition of the waste, which is a combination of fossil fuel
and non‐fossil fuel derived waste. Waste derived from fossil fuel includes petroleum products, plastics,
etc. Non‐fossil fuel waste is biogenic waste, derived from naturally occurring biomaterial. Emissions
included in the inventory include CO2, CH4, and N2O from the fossil fuel derived waste, and only CH4 and
N2O from the non‐fossil fuel derived waste. CO2 from biogenic waste can be reported, but it is not
included in the inventory because the CO2 would naturally release into the atmosphere as the material
decomposes; there is no additional CO2 injected into the atmosphere through the burning process.
Emissions from landfilled solid waste are determined as the sum of emissions generated by
transportation from its source to the landfill, the equipment used in its disposal at the landfill, and
fugitive emissions from decomposition in landfills. The City of Tampa does not own a landfill, so the
emissions included in this inventory are only from the transportation and decomposition of the waste;
the emissions from on‐site equipment are out of the control of the City. The transportation emissions
are included in the transportation section discussed above.
Fugitive emissions of methane from the decomposition of solid waste are calculated based on the
annual waste generation multiplied by the EPA emission factor for waste production for CH4. The
emission factor to determine CH4 generation varies if the landfill operations are known to operate a
methane flare or to generate electricity from methane capture. Carbon dioxide generated by
decomposition of waste in landfills is not considered anthropogenic because it would be produced
through the natural decomposition process regardless of its disposition in the landfill. Nitrous Oxide is
not a bi‐product of decomposition and therefore no fugitive emissions of nitrous oxide are anticipated
from this source.
CITY OF TAMPA 2‐6 ENERGY EFFICIENCY AND CONSERVATION PLAN

2 . 3 2 7 B C A L C U L A T I O N O F G H G S
Area Source Emissions LANDSCAPING Emissions of CO2, CH4, and N2O are generated by the use of landscape equipment through the
combustion of gasoline. CO2 emissions were determined directly through URBEMIS2007 for the existing
and 2025 inventories. URBEMIS2007 is a computer software package that is used for modeling
projected emissions of air quality pollutants including carbon dioxide. From the CO2 emissions, the
approximate number of gallons of gasoline consumed through landscape equipment use was calculated.
This number was then multiplied by emission factors presented in the General Reporting Protocol,
version 3.1 to determine both CH4 and N2O emissions.
Transportation ON‐ROAD VEHICLES For Tampa’s municipal inventory, CO2, CH4, and N2O emissions from the City’s municipal fleet were
calculated based on the fuel use and annual miles traveled by each vehicle owned by the City. CO2
emissions were calculated using the total fuel use multiplied by the emission factor for either gasoline or
diesel fuel. CH4 and N2O emissions are based on the vehicle’s age, model, and miles traveled. The
emissions were then organized by department.
The municipal inventory also includes emissions from vehicles driven by employees during their
commutes to and from work at the City. The employee commute patterns were gathered from a survey
of employees; then, based on the response rate, the responses were extrapolated to estimate emissions
for all City employees. The emissions of CO2, CH4, and N2O were calculated similarly to the municipal
vehicle fleet described above.
Tampa’s community‐wide emissions from transportation were based on the total vehicle miles traveled
(VMT). VMT for the City of Tampa was estimated based on VMT reported for Hillsborough County in the
Hillsborough County MPO’s Long Range Transportation Plan (LRTP) (Hillsborough MPO 2009). The
County VMT was proportioned to the City using an estimate of the percentage of Tampa lane‐miles in
the County. The total VMT was then multiplied by the emissions coefficient from the LRTP. This
emissions coefficient was calculated based on meteorological and traffic characteristics specific to the
Hillsborough area through EPA’s MOVES (Motor Vehicle Emission Simulator) model.
The estimates do not account for electrical, biodiesel (a blend of diesel and vegetable oil), or hydrogen
powered systems. Any electrically powered vehicle which draws power from a residence, commercial or
industrial land use will be accounted for in the electrical usage for the City. The County also predicted
VMT for 2035; under the assumption that the annual growth rate in VMT for the County is the same as
Tampa’s, this growth rate was used to predict 2025 VMT in the City of Tampa. Costs associated with
transportation were based on the diesel and gasoline fuel use and their associated per gallon costs in
2009.
CITY OF TAMPA 2‐7 ENERGY EFFICIENCY AND CONSERVATION PLAN

C H A P T E R 2 1 4 B M E T H O D O L O G Y
CITY OF TAMPA 2‐8 ENERGY EFFICIENCY AND CONSERVATION PLAN
This page intentionally left blank.

CITY OF TAMPA 3‐1 ENERGY EFFICIENCY AND CONSERVATION PLAN
CHAPTER 3 GHG Emissions Inventory

C H A P T E R 3 1 5 B G H G E M I S S I O N S I N V E N T O R Y
The following sections present Tampa’s municipal operations inventory and community‐wide inventory.
The municipal operations inventory includes sources and quantities of GHG emissions from government
owned or rented buildings, facilities, vehicles, and equipment. By having the municipal emissions
separated from the community as a whole, the City of Tampa local government can implement
reduction strategies in its own operations, where it has direct control; closely monitor the changes in
emissions over time; and set an example for the rest of the City. The community‐wide emissions
inventory identifies and categorizes the major sources and quantities of GHG emissions being produced
by residents, businesses, and municipal operations taking place in the City of Tampa. Using historic
emissions and business‐as‐usual (BAU) practices as a basis, the inventory includes GHG emissions from
2009 and projected for 2025. The Emissions Inventories are organized by Transportation, Energy, Area
Sources, Water and Wastewater, and Solid Waste.
3.1 2009 Municipal Emissions Inventory The City of Tampa emitted approximately 246,087 MT CO2e in 2009 through its municipal operations.
The emissions were calculated based on the vehicle and equipment fleet inventory and fuel use, energy
accounts, waste management, and a survey of the City’s employee commutes. The largest portion of the
City’s 2009 emissions was from the City’s Refuse‐to‐Energy Facility (35.9%), followed closely by
emissions associated with wastewater treatment (34.7%). Table 3‐1 summarizes the City’s net 2009
emissions of CO2e as broken down by emissions category. Figure 3‐1 is a graphical representation of
Table 3‐1. A detailed breakdown of 2009 emissions by category is available in Appendix D.
Table 3‐1 2009 Total Municipal Emissions
Category Metric tons of CO2e %
Electricity 30,475 12.4
Natural Gas 1,819 0.7
Vehicle Fleet 26,629 10.8
Wastewater 85,350 34.7
Waste‐to‐Energy 88,398 35.9
Employee Commute 13,416 5.5
Total 246,087 100
CITY OF TAMPA 3‐2 ENERGY EFFICIENCY AND CONSERVATION PLAN

3 . 1 2 8 B 2 0 0 9 M U N I C I P A L E M I S S I O N S I N V E N T O R Y
Figure 3‐1 2009 Municipal Emissions by Source (metric tons CO2e)
2009 Municipal Emissions and Costs by Department For the municipal inventory it is helpful to see which departments are generating the most emissions.
This helps to pinpoint from where emissions are coming. Table 3‐2 and Figure 3‐2, below, summarize the
electricity, natural gas, and vehicle fleet emissions by department. Appendix D includes details of the
data and coefficients used to calculate the municipal emissions and costs.
Table 3‐2 2009 Municipal Emissions by Department
Department Metric tons of CO2e Costs ($)
Public Works 35,688 $6,785,276
Police 17,114 $5,398,905
Solid Waste 6,836 $1,866,299
Fire 4,688 $1,445,893
Parks and Recreation 3,242 $1,126,182
Convention Center 2,240 $372,312
Administration 943 $517,023
GMDS 667 $306,747
Finance 494 $198,008
Code Enforcement 427 $166,449
Total 72,339 $18,183,094
CITY OF TAMPA 3‐3 ENERGY EFFICIENCY AND CONSERVATION PLAN

C H A P T E R 3 1 5 B G H G E M I S S I O N S I N V E N T O R Y
Figure 3‐2 2009 Municipal Emissions by Department (metric tons CO2e)
2009 Municipal Cost Estimates The costs associated with the inventory represent the municipal energy and fuel use costs. These cost
estimates give the City the perspective on where the City is spending the most money and help to
prioritize reduction measures toward the sectors that have the potential to both reduce emissions save
the most money. Table 3‐3 below summarizes the cost estimates for 2009.
Table 3‐3 Estimated Municipal Energy Costs
Category $
Electricity $4,305,700
Natural Gas $260,008
Vehicle Fleet $6,913,020
Employee Commute $6,407,365
Total $ 18,183,094
CITY OF TAMPA 3‐4 ENERGY EFFICIENCY AND CONSERVATION PLAN

3 . 2 2 9 B 2 0 0 9 C O M M U N I T Y - W I D E E M I S S I O N S I N V E N T O R Y
3.2 2009 Community‐Wide Emissions Inventory The City of Tampa as a whole emitted approximately 8.97 MMT CO2e in 2009. The emissions were
calculated based on VMT estimates, data from utilities, and land use (see Appendix C for the data
inputs). The largest portion of the City’s 2009 emissions were from transportation (49%), followed by
emissions from electricity and natural gas use in buildings (47%). Table 3‐4 summarizes the 2009
community‐wide emissions of CO2e as broken down by emissions category. Figure 3‐3 is a graphical
representation of Table 3‐4. A detailed breakdown of 2009 emissions by category is available in
Appendix E.
Table 3‐4 2009 Community‐Wide Net Total Emissions
Emissions Category Metric tons of CO2e
Transportation 4,396,028
Energy 4,191,885
Area Sources 132,272
Water and Wastewater 91,031
Solid Waste 160,923
Total 8,972,139
Figure 3‐3 2009 Emissions Generated by Source (metric tons CO2e)
CITY OF TAMPA 3‐5 ENERGY EFFICIENCY AND CONSERVATION PLAN

C H A P T E R 3 1 5 B G H G E M I S S I O N S I N V E N T O R Y
2009 Community-Wide Cost Estimates The costs associated with the existing community‐wide inventory represent the consumer costs
associated with energy, fuel, and water use. These cost estimates give the City the perspective on
where residents and business are spending the most money and help to prioritize reduction measures
toward the sectors that have the potential to both reduce emissions save the most money.
Transportation was the largest source of emissions and cost in 2009, while energy use in buildings
followed in emissions and cost. Table 3‐5 below summarizes the community‐wide cost estimates for
2009.
Table 3‐5 2009 Community‐Wide Cost Estimates
Sources $ (millions)
Transportation $1,130.7
Energy $555.8
Area Sources $0.2
Water and Wastewater $8.9
Total $1,695
Reduction Target The state of Florida has an emission reduction target to reduce emissions back to 1990 levels by the year
2025. For the purposes of this EECP, the reduction target for Tampa is determined based on the
population change that occurred from 1990 to 2009. Tampa’s population was 280,015 in 1990 and
350,210 in 2009. Using these numbers a growth in population of 25% was calculated and used to
determine Tampa’s emissions in 1990, which establishes the City’s 2025 reduction target. Table 3‐6
below summarizes the 2009 emissions total and the 2025 reduction target.
Table 3‐6 2025 Reduction Target
Source Metric tons of CO2e
2009 Emissions 8,972,139
2025 Reduction Target 7,777,281
3.3 2025 Business as Usual Emissions Inventory In 2025, Tampa is projected to emit a total of 11.8 MMT CO2e community‐wide from a business‐as‐usual
(BAU) standpoint. BAU refers to continued operations and development of the City according to 2009
policies, without the inclusion of proposed or recently‐adopted sustainability initiatives described in
Chapter 4. The 2025 BAU community‐wide emissions are estimated based on the projected growth in
Tampa from 2009 to 2025 (The Planning Commission 2010). These projections include a 21.61% increase
CITY OF TAMPA 3‐6 ENERGY EFFICIENCY AND CONSERVATION PLAN

3 . 3 3 0 B 2 0 2 5 B U S I N E S S A S U S U A L E M I S S I O N S I N V E N T O R Y
in population and a 27.23% increase in employment; these two growth rates were applied to residential
and non‐residential emissions, respectively, in order to estimate 2025 BAU emissions. The 2025
transportation emissions are based on the projected growth in the County’s VMT reported in the
Hillsborough County MPO Long Range Transportation Plan. (Hillsborough MPO 2009) Table 3‐7
summarizes the net 2025 City emissions of CO2e as broken down by Emissions category. Figure 3‐4 is a
graphical representation of Table 3‐7. A detailed breakdown of 2025 emissions by category is available
in Appendix E.
Table 3‐7 2025 Community‐Wide BAU Net Total Emissions
Emissions Category Metric tons of CO2e
Transportation 6,101,312
Energy 5,248,340
Area Sources 161,870
Water and Wastewater 113,263
Solid Waste 200,107
Total 11,830,892
Figure 3‐4 2025 Community‐Wide BAU Emissions by Source (metric tons CO2e)
CITY OF TAMPA 3‐7 ENERGY EFFICIENCY AND CONSERVATION PLAN

C H A P T E R 3 1 5 B G H G E M I S S I O N S I N V E N T O R Y
CITY OF TAMPA 3‐8 ENERGY EFFICIENCY AND CONSERVATION PLAN
Net Emissions Comparison by Year The 11.8 MMT CO2e of GHG emissions for 2025 is an estimated increase of 2.9 MMT CO2e above 2009
levels following BAU projections. The emissions growth from 2009 to 2025 is a 31.9% increase, which is
in line with estimates for Florida’s projected emissions2. Table 3‐8 shows a comparison of net total
emissions for 2009 and 2025 BAU emissions and the 2025 reduction target.
Table 3‐8 Net Total Emissions by Year
Metric tons of CO2e
Source Category 2009 2025 BAU
Transportation 4,396,028 6,107,312
Energy 4,191,885 5,248,340
Area Sources 132,272 161,870
Water and Wastewater 91,031 113,263
Solid Waste 160,923 200,107
Total 8,972,139 11,830,892
2025 Reduction Target ‐ 7,777,281
2 The Florida Energy and Climate Change Action Plan predicts the state’s emissions will increase by 37% from 2005 to 2025 following a BAU scenario.

CITY OF TAMPA 4‐1 ENERGY EFFICIENCY AND CONSERVATION PLAN
CHAPTER 4 GHG Emissions Reduction Programs and Regulations

C H A P T E R 4 1 6 B G H G E M I S S I O N S R E D U C T I O N P R O G R A M S A N D R E G U L A T I O N S
4.1 Existing Tampa Programs The City of Tampa has demonstrated its commitment to sustainability through a variety of programs and
policies. This commitment was first officially formalized on February 2, 2007 when Tampa signed on to
support the U.S. Conference of Mayor’s Climate Protection Agreement that urges the federal and state
governments to enact policies and programs to reduce GHG emissions and promote efforts to address
climate change at the municipal level. The following sections outline the programs and policies that
target GHG reductions for Tampa’s emissions both at a municipal level and community‐wide.
Tampa Green Resolution The Tampa Green Resolution, approved in May 2008, describes how the City will enact and implement
measures and employ environmentally sustainable practices, policies, and methods to achieve the goal
of being designated a Florida Green Local Government by the Florida Green Building Coalition (FGBC).
The Resolution also describes the role and duties of the City’s Green Officer to pursue additional
ordinances, land development regulations and regulatory standards to assure that further public and
private sector development is consistent with the City’s desire to create a more sustainable community.
Tampa aims to promote green building and sustainable design efforts by reviewing and amending land
development regulations, expediting permit applications with green building certifications (see
discussion of Tampa Green Fast Track Review below), and proposing revisions to the City of Tampa
Code, where appropriate. Also, the City will provide information to private property owners regarding
the various incentives available for adopting energy efficiency and renewable energy design features.
Tampa’s Green Resolution also details a plan for training City staff involved with development review
about green building and sustainable practices. (Tampa 2008)
EECBG Projects The Energy Efficiency and Conservation Block Grant (EECBG) Program was funded for the first time by
the American Recovery and Reinvestment Act (ARRA) of 2009 and managed by the Energy Efficiency and
Renewable Energy branch of the US Department of Energy. The program is designed to assist US cities,
counties, stats, territories, and Indian tribes to develop, promote, implement, and manage energy
efficiency and conservation project and programs. Eligible projects will reduce fossil fuel emissions,
reduce total energy use, improve energy efficiency in the transportation, building, and other
appropriate sectors, and create and retain jobs. Tampa has four projects funded by its EECBG:
■ Traffic signal and street sign upgrade to LED’s ■ Energy Management Systems for three buildings
■ Facility Lighting Upgrades (includes all city‐owned parking garages, exterior lighting on facilities, and exterior and interior lighting upgrade for fire stations)
■ Greenhouse Gas Emissions Baseline Inventory and Energy Efficiency and Conservation Plan
CITY OF TAMPA 4‐2 ENERGY EFFICIENCY AND CONSERVATION PLAN

4 . 1 3 1 B E X I S T I N G T A M P A P R O G R A M S
The traffic signal upgrades will reduce power demand by 70‐80% per lamp. At a cost of $5,500 to $7,700
per intersection, the city will use EECBG funds to convert 480 intersections; although a significant
upfront cost, Tampa will recoup that cost in reduced electrical and maintenance cost after the upgrades.
The Energy Management Systems will optimize electrical consumption in city facilities by controlling
operational hours of lighting, equipment, fresh air usage and the interior space temperature. Tampa will
use EECBG funds to upgrade existing parking lighting to high efficiency lighting. This conversion will
reduce electrical usage by 55% with an annual electrical savings of $213,000 and annual maintenance
savings of $103,000. Costs of this project will be partially offset with a rebate from TECO. The
completion of this Tampa Energy Efficiency and Conservation Plan is funded by the City’s EECBG as well.
(Tampa 2009)
Tampa Green Fast Track Review Tampa has established a system for projects that meet certain sustainability criteria to warrant a faster
plan review. Eligible projects can satisfy the requirements in one of two ways:
■ Option A: Third Party Certification (available for any project seeking Fast Track review, but required for commercial projects of 5,000 sq. ft. or more)
■ Option B: Tampa Green Checklist (available for all residential projects and commercial projects of
less than 5,000 sq. ft.)
Qualifying third party certifications may come from the Florida Green Building Coalition (FGBC),
Leadership in Energy Efficient Design (LEED), or another certification approved by the City. Option B
requires the applicant to identify sustainable design features in the project by completing the Tampa
Fast Track Review Checklist. Some examples of the design strategies include: recycling construction and
demolition waste, using recycled material in concrete, using Forest Stewardship Council (FSC) Certified
Wood for framing, installing graywater system, installing Energy Star‐qualified windows, and using
renewable flooring materials. After selecting features in the checklist, the applicant is then required to
demonstrate incorporation of the design strategy in the project’s plans and sign a commitment letter for
items included in the project that may not be evident in the plans.
Water Conservation Program Over the past five years, Tampa’s annual water demand has continued to trend downward, which, in
part, is associated with the City’s active, comprehensive approach to water conservation and efficiency.
Tampa’s Water Conservation activities are part of a long‐range water conservation planning process that
incorporates the goals of responsible stewardship of Tampa’s water supply, limited reliance on the
regional water resources to augment Tampa’s water needs during dry periods, and the use of
appropriate business practices to safeguard the fiscal well‐being of the Tampa Water Department while
retaining already achieved water use efficiencies. The overall goal of Tampa’s water conservation efforts
is to ensure a sustainable water supply to meet community demands and emergency conditions. Tampa
CITY OF TAMPA 4‐3 ENERGY EFFICIENCY AND CONSERVATION PLAN

C H A P T E R 4 1 6 B G H G E M I S S I O N S R E D U C T I O N P R O G R A M S A N D R E G U L A T I O N S
employs a variety of water conservation measures and best management practices included in
conservation planning materials provided by Conserve Florida (FDEP), Tampa Bay Water, and Southwest
Florida Water Management District. Tampa’s efforts include operational measures, educational and
program measures, and policy measures.
Other City Initiatives Tampa has introduced other “green” features into the community. These efforts incorporate renewable
energy technologies, promote pedestrian and bicycle‐friendly transit, and help to reduce waste being
sent to the landfill. Having these features already implemented throughout the City help to educate the
general public and make these technologies more common.
ELECTRIC VEHICLE CHARGING STATIONS
Tampa is part of a pilot program under a grant from Charge Point to install charging stations throughout
the City. These charging stations are for public use and will be installed in 10 public parking locations
through Tampa: Fort Brooke garage, Tampa Convention Center garage, South Regional garage, Twiggs
Street garage, Centro Ybor garage, Palm Avenue garage, William F. Poe garage and the Jackson Street
surface lot across from the municipal office building. All machines will be fully installed and operational
by October 1, 2011. Charge Point will collect data from the charging stations and use the information to
assess the use of electric vehicles in Tampa, as well as other cities in the program, and identify the best
locations for future charging stations.
TAMPA ENERGY CONSERVATION GOALS
The City of Tampa developed the following goals for expanding energy conservation in municipal
operations and in current City‐operated programs:
■ Following Tampa City Code, Chapter 17.5, continue to implement minimum energy conserving
practices, such as LEED Silver certification, for new construction and major renovations of existing
City buildings over 5,000 square feet.
■ Continue to require green and sustainable items into its Request for Proposal for participation in
the Neighborhood Stabilization Program and as part of the affordable housing design standards.
■ Be a leader in energy efficient facilities management by equipping buildings with Energy
Management Systems and select one of the City’s buildings as a high profile demonstration
project.
■ Encourage the expansion of solar‐thermal water heater and photovoltaic programs for residential
and commercial customers.
SOLAR POWERED COMPACTORS Solar compactors are improving the environment in major cities across the country and Tampa has
joined the list with a new pilot program. In December 2010 the City of Tampa Solid Waste Department
CITY OF TAMPA 4‐4 ENERGY EFFICIENCY AND CONSERVATION PLAN

4 . 2 3 2 B A D D I T I O N AL T A M P A R E D U C T I O N M E A S U R E S
installed four solar‐powered trash compactors and two solar‐powered recycling compactors in
downtown Tampa along Franklin Street.
The new compactors hold approximately five times as much waste and recyclables as a regular bin of
the same size. The compactors will save money and help reduce GHG emissions by requiring fewer
pickups. They have a wireless communication system that track the amount of waste and recyclables in
each bin indicating when they need to be emptied
GREENWAYS AND TRAILS MASTER PLAN The Tampa Greenway and Trails Master Plan will increase public access to recreational and non‐
motorized transportation opportunities. The system will link parks, schools, transit bus systems,
waterfront areas, and places of cultural and historical significance. The master planning process was
citizen‐driven and led by members of the Tampa community including local neighborhoods, businesses,
community organizations and public agencies. The Plan is consistent with the Hillsborough County
Metropolitan Planning Organization commitment to implementing a multi‐modal transportation system
that improves bicycle and pedestrian travel.
RECYCLING PROGRAMS Tampa has expanded its curbside recycling pickup program to reduce the amount of waste being sent to
the landfill. Tampa residents can dispose of yard waste and have it picked up once a week. The organic
wastes that are collected are taken to a private facility where they are processed into mulch and sold for
commercial use. Additionally, residents can recycle many other products including aluminum, glass,
plastics, paper, and cardboard. Tampa recently expanded its plastic containers recycling program to
include all #1‐7 plastics.
ELECTRICITY GENERATION AT HOWARD F. CURREN WASTEWATER TREATMENT FACILITY On average, the City of Tampa Wastewater Department produces approximately 1.18 million kilowatt
hours ($83,000 of electricity) per month by burning the methane gas from the digesters in the
cogeneration engines. This equates to approximately 25 percent of the total electrical energy consumed
at the Treatment Plant each month (approximately 4.8 million kilowatt hours). (Tampa 2008c)
4.2 Additional Tampa Reduction Measures The state of Florida has set specific targets for reducing GHG
emissions from the burning of fossil fuels in both power plants and
vehicles by adopting various regulations. In addition, state energy
efficiency and renewable requirements provide another level of
reductions. In order to provide credit to the City of Tampa for
regulatory actions already taken or planned by the state of Florida,
this EECP first evaluates the greenhouse gas reductions that will
occur within the City as a result of these actions. These will be
CITY OF TAMPA 4‐5 ENERGY EFFICIENCY AND CONSERVATION PLAN

C H A P T E R 4 1 6 B G H G E M I S S I O N S R E D U C T I O N P R O G R A M S A N D R E G U L A T I O N S
identified in the EECP as R1 reduction measures. The R1 measures are not administered or enforced by
the City, but the City‐ by describing them herein‐ substantiates the reductions applied in association
with these state measures.
R2 and R3 reduction measures are measures that will be incorporated at the City level by the year 2025
in order to provide additional reductions in GHG emissions. R2 measures are those measures that can be
quantified to show the value of the reduction from the incorporation of those measures. R3 measures
are measures that, although they provide a vehicle through which reductions in emissions will occur,
cannot be quantified at this time. The R3 measures are supportive measures or methods of
implementation for the R2 measures. Although R3 measures cannot be quantified, their implementation
provides a level of assurance that the reduction goals specified in the R2 measures will be achieved. A
complete list of assumptions and reductions for each of the R1 and R2 measures is included in
Appendix F.
The following reduction measures are organized herein by source category (energy, solid waste, area
source, and transportation) then by R1, R2, and R3 measure. The method to be used for numbering the
mitigation measures will be to list the R designation (R1, R2, or R3) then an abbreviation of the source
category, followed by the order number. So, R1‐E1 is the first R1 measure within the energy category,
R1‐E2 is the second measure within the energy category, and so on. The source category abbreviations
are as follows: E – energy; S – solid waste; A – area source; W – water and wastewater; and T –
transportation.
Energy
R1 ENERGY REDUCTION MEASURES The following R1 building energy efficiency related measure is a
measure that Florida has identified that will result in emission
reductions within the City.
R1‐E1: BUILDING CODES FOR ENERGY EFFICIENCY Florida’s Action Team on Energy and Climate Change estimated the
GHG reductions and cost effectiveness of the Building Codes for
Energy Efficiency legislation. They found that by 2025, the building
codes would reduce emissions by 15.4 MMTCO2e annually in 2025
statewide; this amounts to 8.4% of the state’s total emissions from
electricity and RCI fuel use in 2025. The cost effectiveness of this
reduction strategy is ‐$30/tCO2e, the negative indicates a cost savings
over the implementation of the measure.
R2 ENERGY REDUCTION MEASURES The following list of R2 measures are measures related to building energy efficiency that the City will
implement to reduce emissions back to 1990 levels by the year 2025.
CITY OF TAMPA 4‐6 ENERGY EFFICIENCY AND CONSERVATION PLAN
4 . 2 3 2 B A D D I T I O N AL T A M P A R E D U C T I O N M E A S U R E S
R2‐E1: EECBG – TRAFFIC SIGNAL UPGRADE TO LEDS The project provides for the upgrade of traffic signal displays to LED signal heads which will reduce
power demand by 70‐80% and also allow for the emergency operation of signals on backup power
systems. Current signals require too much power to operate on backup systems. The estimated cost for
converting an intersection is between $5,500 to $7,700, but the cost of the project will eventually be
recovered in reduced electrical and maintenance costs. 480 intersections will be converted using
funding from the City’s EECBG grant. Because the EECBG grant is covering the cost of this project, the
City will see immediate cost savings in electrical and maintenance costs.
R2‐E2: RENEWABLE ENERGY GOAL This strategy would set a goal for the City to have 25% of the City’s electricity use coming from
renewable energy sources by 2025. This measure relies heavily on coordination with the Tampa Electric
Company. The City must work with the Electric Company to promote and incentivize on site renewable
energy systems for residents and businesses. Although renewable energy systems have a large upfront
cost, there are various rebates available (discussed in Chapter 7) and the cost savings in monthly utility
bills typically offset the upfront cost in a few years.
R2‐E3: RESIDENTIAL ENERGY EFFICIENCY RETROFITS This measure involves the adoption of a program that facilitates energy efficient design for all residential
buildings so that 20% of existing homes will be retrofit with energy efficient technologies such that
energy use in the home is decreased by 25%.
Although not limited to these actions, this reduction goal can be achieved through the incorporation of
the following:
■ Replace inefficient air conditioning and heating units with new energy efficient models;
■ Replace older, inefficient appliances with new energy efficient models;
■ Replace old windows and insulation with top‐quality windows and insulation;
■ Install solar panels and/or solar water heaters;
■ Replace inefficient and incandescent lighting with energy efficient lighting; and
■ Weatherize the existing building to increase energy efficiency.
R2‐E4: RESIDENTIAL RENEWABLE ENERGY RETROFITS This measure facilitates the incorporation of renewable energy (such as photovoltaic panels) into
existing residential homes. The anticipated reductions from this measure were calculated under the
assumption that with incentives and other funding opportunities 20% of homes will have renewable
energy systems by the year 2025. For the participating homes, the renewable energy systems will, on
average, decrease the home’s energy use by 50%. TECO Energy offers some rebates and incentives for
residents and also offers net metering where residents are compensated for having a renewable energy
system that feeds energy back to the grid.
CITY OF TAMPA 4‐7 ENERGY EFFICIENCY AND CONSERVATION PLAN

C H A P T E R 4 1 6 B G H G E M I S S I O N S R E D U C T I O N P R O G R A M S A N D R E G U L A T I O N S
R2‐E5: COMMERCIAL ENERGY EFFICIENCY RETROFITS This measure encourages at least 20% commercial or industrial buildings undergoing major renovations
to reduce their energy consumption by a minimum of 25%. Although not limited to these actions, this
reduction goal can be achieved through the incorporation of the same measures as listed in the
residential retrofit section (R2‐E3).
R2‐E6: COMMERCIAL RENEWABLE ENERGY RETROFITS This measure would facilitate the incorporation of renewable (solar or other renewable) energy
generation into existing commercial and office buildings. Renewable energy generation shall be
incorporated such that a minimum of 50% of the project’s total energy needs are met by renewable
sources. The incentive program should provide enough funding and other incentives to result in
approximately 20% of commercial buildings participating in this program. TECO Energy also offers net
metering where businesses are compensated for having a renewable energy system that feeds energy
back to the grid.
R3 ENERGY REDUCTION MEASURES The following R3 measures enhance and/or insure the reductions from the R2 measures through
education programs or are measures that will reduce emissions but cannot be quantified.
R3‐E1: ENERGY EFFICIENT DEVELOPMENT, AND RENEWABLE ENERGY DEPLOYMENT FACILITATION AND STREAMLINING This measure would encourage the City to identify and remove regulatory and procedural barriers to the
implementation of green building practices and the incorporation of renewable energy systems. This
could include the updating of codes and zoning requirements and guidelines.
R3‐E2: ENERGY EFFICIENCY TRAINING & PUBLIC EDUCATION This measure would provide public education and publicity about energy efficiency measures and
reduction programs available within the City, including rebates and incentives available for residences
and businesses. In addition, this measure would provide training in green building materials, techniques,
and practices for all plan review and building inspection staff.
R3‐E3: ENERGY EFFICIENCY AND SOLAR ENERGY FINANCING This measure would facilitate the incorporation of innovative, grant funded or low‐interest financing
programs for energy efficiency and renewable energy projects for both existing and new developments.
This would include financing for heating, ventilation, air conditioning, lighting, water heating equipment,
insulation, weatherization, and residential and commercial renewable energy. A few potential options
for funding this measure include:
■ Use the money from offset purchases to provide grants to allow for the offset of some of the cost
to existing residents in making energy efficiency upgrades;
■ Target local funds to assist affordable housing developers to incorporate renewable energy sources and energy efficiency design features into low‐income housing during development or
through retrofit programs.
CITY OF TAMPA 4‐8 ENERGY EFFICIENCY AND CONSERVATION PLAN

4 . 2 3 2 B A D D I T I O N AL T A M P A R E D U C T I O N M E A S U R E S
■ Establish a Finance District, approve a bond purchase, and administer agreements to allow
property owners to implement energy efficiency retrofits or designs and/or install renewable
systems. Under this provision repayment could be incorporated as a special tax on the property
owner’s property tax bill.
■ Funding of other incentives to encourage the use of renewable energy sources and energy efficient equipment and lighting.
R3‐E4: CROSS‐JURISDICTIONAL COORDINATION Under this reduction measure the City would coordinate with other local governments, special districts,
nonprofits, and other organizations, such as Hillsborough County and other cities within Hillsborough
County in order to optimize energy efficiency and renewable resource development and usage
throughout the City. This would allow for economies of scale and shared resources to more effectively
implement these environmental enhancements.
R3‐E5: ALTERNATIVE ENERGY DEVELOPMENT PLAN The accomplishment of this measure would encourage the City to work with TECO Energy to explore the
possibilities for producing energy by renewable means within the built environment. This would be
developed to identify appropriate alternative energy facilities (i.e., photovoltaic) for use within
residential and commercial developments. This could also incorporate the use of wind or additional
solar installation in more remote areas. The Alternative Energy Development Plan will encourage the
establishment of City policies and ordinances to address how alternative energy production would be
conducted. This measure would identify the most optimal locations and the best means by which to
avoid noise, aesthetics and other land use compatibility conflicts. Another provision of this Plan could be
to identify possible sites for the production of renewable energy using local renewable sources such as
solar, wind, small hydro, and/or biogas. This would encourage adopting measures to protect these
resources and providing right‐of‐way easements, utility easements, or by setting aside land for future
development of these potential production sites.
R3‐E6: TAMPA FAST TRACK REVIEW The City of Tampa currently offers a fast track review of new development plans for those plans that
either meet third party certification qualifications or accumulate points assigned to various sustainable
design features. This program could be expanded to include certification of compliance with the R2
measures as well as providing incentives for the completion of energy audits and certification of existing
buildings. The measure enhances and supports the energy efficiency reduction programs R2‐E1 through
R2‐E6.
CITY OF TAMPA 4‐9 ENERGY EFFICIENCY AND CONSERVATION PLAN

C H A P T E R 4 1 6 B G H G E M I S S I O N S R E D U C T I O N P R O G R A M S A N D R E G U L A T I O N S
Solid Waste R1 SOLID WASTE MEASURE The following R1 solid waste related measure is a measure that Florida has identified that will result in
emission reductions within the City.
R1‐S1: 75% RECYCLING GOAL BY 2020, HOUSE BILL 7135 Each county shall implement a recyclable materials recycling
program that shall have a goal of recycling recyclable solid
waste by 40 percent by December 31, 2012; 50 percent by
December 31, 2014; 60 percent by December 31, 2016; 70
percent by December 31, 2018; and 75 percent by December
31, 2020. Counties and municipalities are encouraged to form
cooperative arrangements for implementing recycling
programs. – From Florida Statutes (403.706 Local
government solid waste responsibilities)
In order to promote the production of renewable energy from solid waste, each megawatt‐hour
produced by a renewable energy facility using solid waste as a fuel shall count as 1 ton of recycled
material and shall be applied toward meeting the recycling goals set forth in this section. If a county
creating renewable energy from solid waste implements and maintains a program to recycle at least 50
percent of municipal solid waste by a means other than creating renewable energy, that county shall
count 2 tons of recycled material for each megawatt‐hour produced.
Because Tampa sends most of its waste to the McKay Bay Refuse‐to‐Energy Facility, the City has already
met this state‐wide goal.
R2 SOLID WASTE MEASURES The following list of R2 measures are measures related to solid waste reduction that the City will
implement to reduce emissions back to 1990 levels by the year 2025.
R2‐S1: 12% WASTE REDUCTION GOAL BY 2018 Tampa’s Comprehensive Plan, adopted in February 2009, described the City’s solid waste reduction
goals. By the fiscal year 2012/2013, the City hopes to reduce waste by 5 percent from the baseline
disposal rate of 1.16 tons/person/year to 1.10 tons/person/year. By the fiscal year 2017/2018, Tampa
hopes to reduce waste by 12 percent from the baseline to a rate of 1.02 tons/person/year. Some
methods for achieving this reduction goal are described in Tampa’s Comprehensive Plan and include the
following:
■ Continue to provide curbside household recycling service to all single family, residential
customers.
■ Consider pilot programs to improve recycling rates.
CITY OF TAMPA 4‐10 ENERGY EFFICIENCY AND CONSERVATION PLAN

4 . 2 3 2 B A D D I T I O N AL T A M P A R E D U C T I O N M E A S U R E S
■ Coordinate with multi‐family and condominium complexes to encourage recycling activities.
■ Seek out and utilize grants for local governments from the Florida Department of Environmental
Protection to initiate and maintain waste recycling and separation programs.
■ Research and consider recycling ash products from the McKay Bay Refuse‐to‐Energy Facility.
R2‐S2: NO WASTE SENT TO LANDFILL This strategy would eliminate all waste that is currently sent to the landfill. Tampa’s waste‐to‐energy
facility offers an alternative to the landfill that creates energy from the City’s waste and delivers much
less emissions per pound of waste disposed as compared to the landfill. Currently, the City has some
waste that cannot be processed through the waste‐to‐energy system, such as large furniture. With the
purchase of a shredder, the City would be able to breakdown these large items into a size that can be
processed. The additional waste processed equates to more energy that can be purchased by TECO. All
waste‐to‐energy facilities produce large amounts of ash. Options for recycling the ash are currently
being explored; these options include utilizing the material in the production of roads, cinder blocks, and
other construction materials.
R3 SOLID WASTE MEASURE The following R3 measure enhances and/or insures the reductions accounted for within the R2
measures through education programs that help participation and compliance of the R2 measures
identified above.
R3‐S1: WASTE EDUCATION PROGRAM This measure would build on the existing Tampa Waste education programs to provide City‐wide public
education and increased publicity about commercial and residential recycling. This measure would
educate the public about waste reduction options available at both residential and commercial levels,
including composting, grass recycling, and waste prevention, and available recycling services.
Area Source Emissions R2 AREA SOURCE MEASURES The following R2 reduction measure is related to landscaping
emissions that the City will implement to reduce emissions
back to 1990 levels by the year 2025.
R2‐A1: ELECTRIC LANDSCAPING EQUIPMENT IN NEW DEVELOPMENTS This measure involves the inclusion electric sockets on the
exterior walls of new developments to make buildings ready for
the use of electric landscaping equipment. The gasoline used in traditional lawnmowers emits large
amounts of GHGs; electric‐powered equipment has a much lower emission level. Additionally, electric‐
powered equipment is cleaner from an air pollution standpoint. These emission calculations assume
CITY OF TAMPA 4‐11 ENERGY EFFICIENCY AND CONSERVATION PLAN

C H A P T E R 4 1 6 B G H G E M I S S I O N S R E D U C T I O N P R O G R A M S A N D R E G U L A T I O N S
that 25% of homes and 50% of commercial buildings will use electric powered equipment by the year
2025.
R3 AREA SOURCE MEASURES The following R3 measures are related to landscaping that will help reduce GHG emissions. These
measures strategically place trees and other landscape mechanisms that create shade to reduce the
heat island effect within parking lots and adjacent to buildings, which in turn, reduces the temperature
of buildings and cars during the summer.
R3‐A1: EXPAND CITY TREE PLANTING The City should evaluate the feasibility of expanding tree planting within the City. This includes the
evaluation of potential carbon sequestration (the process by which carbon is taken from the
environment and stored. In the case of trees and vegetation this occurs through the conversion of
carbon into biomass –leaves, wood, etc.) from different tree species, potential reductions of building
energy use from shading, and GHG emissions associated with pumping water used for irrigation.
Implement a forestry program if GHG emissions reductions exceed GHG emissions associated with
implementation and water use.
R3‐A2: HEAT ISLAND PLAN The implementation of this measure would include guidelines for cool roofs, cool pavements, and
strategically placed shade trees, and parking lot shading in the City. Further, City‐wide design guidelines
could to be amended to encourage new developments and major renovations (additions of 25,000
square feet or more) to incorporate the following strategies such that heat gain would be reduced for
50% of the non‐roof impervious site landscape (including parking, roads, sidewalks, courtyards, and
driveways). The strategies include:
■ Shading (within 5 years of occupancy); ■ Paving materials with a Solar Reflective Index (SRI)of at least 29;
■ Open grid pavement system; or
■ Covered parking (with shade or cover having an SRI of at least 29).
Transportation R1 TRANSPORTATION MEASURES
The following list of R1 transportation related measures are
those measures that Florida has identified that will result in
emission reductions within the City.
R1‐T1: “10 BY 10” RENEWABLE FUEL STANDARD HB 7135, passed in 2008, includes a provision to have a
minimum of 10 percent of ethanol blended into gasoline by
the year 2010. Florida’s Energy and Climate Change Action
Plan includes estimates for the greenhouse gas reductions and
CITY OF TAMPA 4‐12 ENERGY EFFICIENCY AND CONSERVATION PLAN

4 . 2 3 2 B A D D I T I O N AL T A M P A R E D U C T I O N M E A S U R E S
cost savings anticipated from this state policy. Developing and Expanding Low‐GHG Fuels is predicted to
reduce annual emissions by 12.62 MMtCO2e statewide in the year 2025; this amounts to a reduction of
6.3% from Florida’s transportation emissions in 2025. The strategy has a cost effectiveness or ‐
$142/tCO2e; the negative sign indicates a cost savings for the implementation of this measure over the
timeframe from 2010 to 2025.
R1‐T2: FEDERAL CAFE STANDARDS On May 19, 2009, President Obama announced a new plan to establish vehicle greenhouse gas
standards and to significantly increase fuel economy standards by model year (MY) 2016. As part of that
plan, the National Highway Traffic Safety Administration (NHTSA) and EPA worked together to
harmonize those standards to the extent possible, as they announced in a proposed rulemaking on
September 15, 2009. On April 1, 2010, the agencies announced a final rule for MY2012 through MY2016.
According to the Administration, the new greenhouse gas standards are equivalent to a Corporate
Average Fuel Economy (CAFE) increase to 35.5 mpg by MY2016, effectively implementing the CAFE level
required by the Energy Independence and Security Act (EISA) four years ahead of schedule. The
development of the new CAFE standards was integrated with new vehicle GHG standards proposed by
EPA, and with standards established by the state of California. EPA and NHTSA believe they have the
technical data to support a GHG standard of 250 grams/mile.
R2 TRANSPORTATION MEASURES The following list of R2 measures are measures related to transportation reduction that the City will
implement to reduce emissions back to 1990 levels by the year 2025.
R2‐T1: SMART GROWTH PLANNING The City of Tampa has updated its comprehensive plan and the Transportation Concurrency Exception
Area (TCEA). The strategy is to focus new development and redevelopment into three main locations –
Downtown, the Westshore business district, and around the University of South Florida (USF). The
concept is to create urban residential, commercial, and business locations that will support alternate
modes of transportation – walking, biking, and transit. The City has adopted land development
ordinances that promote transit‐oriented development, and provide incentives to those developments
that fit the TCEA concept. Supporting the City’s TCEA will have multiple impacts on GHG reductions.
First, more people can live in close proximity to the business locations in each area, thereby reducing
commuting distances. Second, the planned transit for these areas will provide connectivity and
encourage transit use both within and between these areas. Third, the availability and attractiveness of
other non‐motorized modes combined with compact, mixed‐use development will contribute to reduce
VMT.
R2‐T2: TBARTA MASTER PLAN Tampa Bay Area Regional Transportation Authority (TBARTA) is made up of representatives from seven
counties in the Tampa Bay region with Tampa’s Mayor serving as the City’s representative on TBARTA’s
governing board. The Master Plan visions an extensive transportation network of regional bus systems,
light rail, and local transit systems. The interconnectedness of the City of Tampa to other regions will
CITY OF TAMPA 4‐13 ENERGY EFFICIENCY AND CONSERVATION PLAN

C H A P T E R 4 1 6 B G H G E M I S S I O N S R E D U C T I O N P R O G R A M S A N D R E G U L A T I O N S
reduce emissions from residents traveling outside the City and especially from the large number of
commuters entering the City daily.
R2‐T3: EXPAND USE OF LOW/ZERO EMISSION VEHICLES Tampa can expand the use of low emission vehicles by offering discounted or preferred parking
privileges at City facilities and creating an ordinance for new development requirements to reserve
preferred parking spaces for ultra low emissions vehicle (ULEV) and/or high occupancy vehicles (HOV).
Tampa has plans for installing 10 charging stations throughout the City. The stations are part of the
Charge Point America program; the program is sponsored by Coulomb Technologies through the
American Recovery and Reinvestment Act and the Transportation Electrification Initiative administered
by the Department of Energy. The goal of the program is to provide electric vehicle charging
infrastructure to regions in the US and foster the adoption and readiness of EV’s throughout the
country.
Tampa’s charging stations will be located at the following public parking garages: Fort Brooke, Tampa
Convention Center, South Regional, Twiggs Street, Centro Ybor, Palm Avenue, William F. Poe, and
Jackson Street surface lot across from the municipal office building. All ten machines will be fully
installed and operational by October 1, 2011. The Charge Point program includes a data collection
phase from October 2011 until October 2013; the data will be used to determine how the stations are
being utilized and where additional charging stations can be installed.
R2‐T4: BICYCLE INFRASTRUCTURE Tampa can encourage residents to ride a bike rather than driving around town by providing the
infrastructure to do so. This involves increasing the mileage of bike lanes and bike paths throughout the
City and incorporating bicycle facilities at transit centers. Studies have shown that increasing the
accessibility of bicycle infrastructure increases the percentage of residents riding a bicycle over a single
occupancy vehicle. Tampa’s Comprehensive Plan and Greenway and Trails Master Plan outlines future
bicycle infrastructure in the City. As a conservative estimate, emission reduction calculations assume
that 15 miles of bikeways will be constructed by 2025.
R2‐T5: ENCOURAGE TELECOMMUTING AND ALTERNATIVE WORK SCHEDULES Encouraging telecommuting and alternative work schedules reduces the number of commute trips and
therefore VMT traveled by employees. Alternative work schedules could take the form of staggered
starting times, flexible schedules, or compressed work weeks.
Tampa can explore incentivizing this strategy for employers,
targeting large employers; Tampa can include a reduced
parking element on the City’s Green Fast Track Review
checklist in order to encourage employers. The emission
calculations assume a 3% participation rate of each type of
alternative work schedule: 9/80 work week, 4/40 work week,
and 1.5 days of telecommuting each week.
CITY OF TAMPA 4‐14 ENERGY EFFICIENCY AND CONSERVATION PLAN

4 . 2 3 2 B A D D I T I O N AL T A M P A R E D U C T I O N M E A S U R E S
R3 TRANSPORTATION MEASURE The following R3 measure enhances and/or insures the reductions accounted for within the R2
measures through education programs or are measures that will reduce emissions but cannot be
quantified.
R3‐T1: REGIONAL LAND USE & TRANSPORTATION COORDINATION Transportation is an inherently regional source of emissions. In order to accomplish the greatest
emissions reductions, Cities, Counties, and Regional agencies must all work together to create cohesive
systems for alternative forms of transportation.
Water The following R2 measure is related to water reduction that the City will implement to reduce emissions
back to 1990 levels by the year 2025.
R2‐W1: TAMPA WATER DEPARTMENT CONSERVATION EFFORTS In response to rapid population growth, record drought conditions and projected future water supply
deficits, the Tampa Water Department (TWD) implemented a formal Water Conservation Program that
has been recognized around the nation for its leadership, innovation, and achieved demand reductions
(Tampa 2010b). Since 1989, when the program was launched, the total population served by the TWD
has increased by nearly 30 percent while the average daily pumpage has increased by 10 percent or less
and per capita use has decreased. If the TWD can continue to implement policies to conserve water and
continue to decrease the per capita water use, this will help to maintain total water pumped and offset
the anticipated growth in emissions out to 2025. Policies to conserve water and reduce use from new
and existing buildings include, but are not limited to:
■ Promotion of low‐flow fixtures: toilets, showerheads, faucets, etc.
■ Incentive programs for efficient clothes washers and dishwashers
■ Green Fast Track Review incentive for inclusion of water‐saving designs in new construction ■ Offering water audits and leak detection services to residents and businesses
Emissions Reductions and Cost Savings Implementation of the measures described above will reduce Tampa’s emissions back to 1990 levels by
the year 2025. Additionally, these measures will equate to dollars saved throughout Tampa’s
community. Table 4‐1, below summarizes both the emissions saved and the annual dollars saved for
each measure described above. The dollars saved were calculated solely based on the fuel savings. For
example, if a measure reduces gallons of gasoline used, the cost savings were calculated by multiplying
the gallons saved by the average cost per gallon of gasoline. These dollar amount represent savings over
the course of a year, and fuel costs are representative of current costs.
Not all measures have a cost savings calculated; these measures do not have direct fuel savings and
would have much more speculation in determining the cost savings.
CITY OF TAMPA 4‐15 ENERGY EFFICIENCY AND CONSERVATION PLAN

C H A P T E R 4 1 6 B G H G E M I S S I O N S R E D U C T I O N P R O G R A M S A N D R E G U L A T I O N S
CITY OF TAMPA 4‐16 ENERGY EFFICIENCY AND CONSERVATION PLAN
Table 4‐1 GHG Emissions Reduced and Cost Savings
Reduction Measure MT CO2e Reduced $ Saved (millions)
Energy Reduction Measures
R1‐E1: Updated Building Codes 440,885 $57.7
R2‐E1: EECBG – Traffic Signal Upgrade to LEDs 4,806 $0.65
R2‐E2: Renewable Energy Goal: 25% by 2025 1,013,640 ‐
R2‐E3: Residential Energy Efficiency Retrofits 66,335 $8.7
R2‐E4: Residential Renewable Energy Retrofits 135,485 $17.7
R2‐E5: Commercial Energy Efficiency Retrofits 102,069 $13.3
R2‐E6: Commercial Renewable Energy Retrofits 199,546 $26.1
R2‐W1: Tampa Water Department Conservation Efforts (electricity emissions) 64,414 $8.8
Solid Waste
R2‐S1: 12% Waste Reduction Goal by 2018 21,926 ‐
R2‐S2: No Waste Sent to Landfill 23,744 ‐
Area Source
R2‐A1: Electric Landscaping Equipment in New Developments 44,793 $2.1
Transportation
R1‐T1: 10% less carbon by 2010 207,649 ‐
R1‐T2: CAFE Standards 1,179,933 ‐
R2‐T1: Smart Growth Planning 66,076 $21.9
R2‐T2: TBARTA Master Plan 190,800 $63.5
R2‐T3: Expand Use of Low/Zero Emission Vehicles 22,314 $7.4
R2‐T4: Bicycle Infrastructure 197,187 $65.6
R2‐T5: Encourage Telecommuting and Alternative Work Schedules 58,615 $19.5
Water
R2‐W1: Tampa Water Department Conservation Efforts 22,232 $2.2
TOTAL 4,062,448 $311.0

CITY OF TAMPA 5‐1 ENERGY EFFICIENCY AND CONSERVATION PLAN
CHAPTER 5 Total Estimated Reductions

C H A P T E R 5 1 7 B T O T A L E S T I M A T E D R E D U C T I O N S
In 2025, the City of Tampa is projected to emit a total of 11.8 MMT of CO2e without the incorporation of
the reduction measures shown in Section 4. With their incorporation, the City emissions for 2025 are
estimated to be reduced to 7.77 MMT CO2e. Emission reductions estimated for year 2025 were based
on the accomplishments likely to be achieved as based on the incorporation of the measures detailed in
Section 4. A detailed description of the reduction calculations, including assumptions and percentage
reduction, is included as Appendix F.
5.1 Reduced 2025 Emissions Table 5‐1 summarizes the net reduced 2025 City emissions of CO2e as broken down by Emissions
category. Figure 5‐1 is a graphical representation of Table 5‐1. A detailed breakdown of reduced 2025
emissions by category is available in Appendix E.
Table 5‐1 Reduced 2025 Net Total Emissions
Emissions Category Metric tons of CO2e
Transportation 4,184,739
Energy 3,221,160
Area Sources 117,077
Water and Wastewater 91,031
Solid Waste 154,438
Total 7,768,444
CITY OF TAMPA 5‐2 ENERGY EFFICIENCY AND CONSERVATION PLAN

5 . 2 3 4 B N E T E M I S S I O N S C O M P A R I S O N B Y Y E A R
Figure 5‐1 Reduced 2025 Emissions by Emissions Category (metric tons CO2e)
5.2 Net Emissions Comparison by Year The 7.77 MMT of CO2e of Reduced GHG emissions for 2025 are an estimated decrease of 4.06 MMT
CO2e from 2025 BAU and a decrease of 904,875 MT CO2e from 2009 levels. Table 5‐13 shows a
comparison between the 2009 and 2025 levels, including what the 2025 BAU emissions would have
been without the implementation of, and what they are anticipated to be with, the inclusion of the
proposed reduction measures.
Table 5‐13 Net Total 2025 Emissions Comparison
Metric tons of CO2e
Source Category 2009 BAU 2025 Reduced 2025
% Reduced from BAU
Transportation 4,396,028 6,101,312 4,184,739 31.5%
Energy 4,191,885 5,248,340 3,221,160 38.6%
Area Sources 132,272 161,870 117,077 27.7%
Water and Wastewater 91,031 113,263 91,031 19.6%
Solid Waste 160,923 200,107 154,438 22.8%
Total 8,972,139 11,830,892 7,768,444 34.3%
2025 Emission Reduction Target ‐ 7,777,281 7,777,281 ‐
Note: Mass emissions of CO2e shown in the table are rounded to the nearest whole number. Totals shown may not add up due to rounding.
CITY OF TAMPA 5‐3 ENERGY EFFICIENCY AND CONSERVATION PLAN

C H A P T E R 5 1 7 B T O T A L E S T I M A T E D R E D U C T I O N S
CITY OF TAMPA 5‐4 ENERGY EFFICIENCY AND CONSERVATION PLAN
This page intentionally left blank.

CITY OF TAMPA 6‐1 ENERGY EFFICIENCY AND CONSERVATION PLAN
CHAPTER 6 Conclusions

C H A P T E R 6 1 8 B C O N C L U S I O N S
CITY OF TAMPA
This Tampa Energy Efficiency and Conservation Plan serves as a guide to help the City continue
development with the objectives of conserving resources, creating a sustainable community, and
reducing GHG emissions. This document also serves as a technical resource for the preparation of land
use‐related documents that may require evaluation and documentation of GHG emissions. Figure 6‐1
shows a comparison between the 2009 emissions, 2025 BAU emissions, and 2025 reduced emissions.
Figure 6‐1 Total Emissions by Year (metric tons CO2e)
A target has been set to reduce GHG emission emissions to 1990 levels by the year 2025 City‐wide,
consistent with the state reduction goals in Florida’s Energy and Climate Change Action Plan. The City
has a reduction strategy, as described in Section 4, which will allow Tampa to achieve the state
reduction goal. Such programs include the City’s energy efficiency programs, solar rebates, conservation
programs, incentives and ordinances. In some cases, implementation will require the cooperation of
other agencies, private businesses, and residents. The success of these measures will be tracked using
indicators and targets such as those described in this EECP. Even with the anticipated growth in the City,
the modernization of vehicle fleets, combined with the continued implementation of the proposed R2
and R3 measures, will ensure a reduction of City‐wide GHG emissions by approximately 4.06 MMT CO2e
by 2025 from the levels expected under a 2025 Business as Usual (BAU) scenario and a reduction of
904,875 MT CO2e from 2009 levels.
6‐2 ENERGY EFFICIENCY AND CONSERVATION PLAN

CITY OF TAMPA 7‐1 ENERGY EFFICIENCY AND CONSERVATION PLAN
CHAPTER 7 Implementation

C H A P T E R 7 1 9 B I M P L E M E N T A T I O N
This section describes implementation steps for the EECP to support achievement of the GHG reduction
goals for the community at large. Success in meeting the City’s GHG emission reduction goal will depend
on cooperation, innovation, and participation by the City and residents, businesses, and government
entities in the City’s land use jurisdiction with regards to implementing the EECP. This section outlines
key steps that the City will follow for the implementation of this EECP.
7.1 STEP 1—Administration and Staffing Tampa has already designated a staff member as the City’s Green Officer (CGO) through the Green
Ordinance passed in May of 2008. The Ordinance outlined many of the CGO’s duties to promote
sustainability within the City’s own municipal operations as well as throughout the Tampa community.
The CGO is also tasked with monitoring and minimizing energy consumption, reducing and offsetting
GHG emissions, and promoting the development and use of renewable energy sources. The CGO will be
a vital staff member in coordinating, overseeing, and documenting implementation of the reduction
measures and providing periodic monitoring of emissions.
The CGO will, at a minimum, coordinate with the following departments, but will be expanded as
needed to ensure coordinated leadership in plan implementation:
■ Land Development Coordination— (LDC) can provide expertise in the Green Fast Track Review
process and provide long‐term planning support.
■ Public Works—Public Works can provide expertise in the City’s operations and collaborate with
the CGO to implement various aspects of the plan.
7.2 STEP 2—Financing and Budgeting The Implementation of the EECP will require creative, continuing, and committed financing in order to
work. Local, regional, state, and federal public sources of funding will be needed along with the
substantial involvement of the private sector. The following different financing options will be explored
by the City:
■ State and Federal Grants and Low‐interest Loans —As described below there are a variety of grant
and loan programs that exist in various sector areas.
■ Support from Local Businesses, Non‐Profits, and Agencies—Opportunities for public/private
partnerships (like the existing TECO partnerships) exist to provide cooperation on many aspects of
the EECP including energy efficiency retrofits, waste minimization, transit promotion, and
education.
■ Self‐Funding and Revolving Fund Programs—Innovative programs to fund residential solar
investments.
CITY OF TAMPA 7‐2 ENERGY EFFICIENCY AND CONSERVATION PLAN
C H A P T E R 7 1 9 B I M P L E M E N T A T I O N
■ Agreements with Private Investors—Energy service companies (ESCOs) and other private
companies can finance up‐front investments in energy efficiency and then be reimbursed through
revenues from energy savings.
■ Taxes and Bonds—Various municipalities have used targeted finance instruments for solar,
transportation, vehicle improvements, and landfill methane controls.
Given that financing is key to implementing many measures, a review of current and potential funding
sources was completed for the different sectors covered in this EECP and is presented below to help
early phase implementation of the EECP. Whether at the federal, regional, or state level, it appears
likely that there will be some form of a cap and trade system in place within several years. This system,
depending on its particular character, is likely to influence energy prices (such as for electricity, natural
gas, and vehicle fuels), and may make currently cost‐ineffective measures more economically feasible in
the medium term and allow the financing of a broader range of plan measures.
Energy Efficiency and Renewable Energy Financing FEDERAL ENERGY EFFICIENCY COMMUNITY BLOCK GRANTS (EECBG) As part of the stimulus package (the “American Recovery and Reinvestment Act” or ARRA), signed into
law by President Obama in spring 2009, block grants became available for energy efficiency planning
and improvements in the building, transportation, and other sectors. The purpose of the EECBG
Program is to assist eligible entities in creating and implementing strategies to: reduce fossil fuel
emissions in a manner that is environmentally sustainable and that maximizes, to the greatest extent
practicable, benefits for local and regional communities; reduce the total energy use of the eligible
entities; and improve energy efficiency in the building sector, the transportation sector, and other
appropriate sectors. Eligible activities include: development of an energy efficiency and conservation
strategy; technical consultant services; residential and commercial building energy audits; financial
incentive programs; energy efficiency retrofits; energy efficiency and conservation programs for
buildings and facilities; development and implementation of certain transportation programs; building
codes and inspections; certain distributed energy projects; material conservation programs; reduction
and capture of methane and greenhouse gases from landfills and dairies; efficiency traffic signals and
street lighting; renewable energy technologies on government buildings; and other appropriate activity.
Tampa received EECBG funds to be used for traffic signal upgrades, parking light upgrades, and
advancement of energy management systems.
FEDERAL TAX CREDITS FOR ENERGY EFFICIENCY On October 3, 2008, President Bush signed into law the “Emergency Economic Stabilization Act of 2008.”
This bill extended tax credits for energy efficient home improvements (windows, doors, roofs,
insulation, HVAC, and non‐solar water heaters). These residential products during 2008 were not eligible
for a tax credit, as tax credits had expired at the end of 2007. The bill also extended tax credits for solar
CITY OF TAMPA 7‐3 ENERGY EFFICIENCY AND CONSERVATION PLAN
C H A P T E R 7 1 9 B I M P L E M E N T A T I O N
energy systems and fuel cells to 2016. New tax credits were established for small wind energy systems
and plug‐in hybrid electric vehicles. Tax credits for builders of new energy efficient homes and tax
deductions for owners and designers of energy efficient commercial buildings were also extended. (See:
http://www.energysavers.gov/financial/.)
TECO ENERGY EFFICIENCY / RENEWABLE ENERGY INCENTIVES ■ Residential Programs
- Free energy audits
- Building envelope improvement incentives: ceiling insulation, wall insulation, window replacement, window film
- Heating and cooling program: earn rebates for replacing old, inefficient air conditioning systems with new, energy‐efficient heat pumps
- Free duct system evaluation and repair of leaks
- Low income weatherization program (partnership with The Centre for Women)
- Similar incentives also offered for new residential construction
■ Business Programs
- Free energy audits
- Building envelope improvement incentives: Solar window film installation, wall and ceiling insulation
- Upgraded chiller, lighting, cooling, refrigeration, and water heating
- Commercial duct repair
- Lighting occupancy sensors
- Conservation Value Program: earn up to $250 per average kW reduction
- Load Management Program: earn credit for allowing Tampa Electric to temporarily interrupt power to the equipment chosen (such as air conditioning or refrigeration) during high peak demand.
CLEAN RENEWABLE ENERGY BONDS Clean renewable energy bonds (CREBs) can be used by certain entities—primarily in the public sector—
to finance renewable energy projects. The list of qualifying technologies is generally the same as that
used for the federal renewable energy production tax credit. CREBs may be issued by electric
cooperatives, government entities (states, cities, counties, territories, Indian tribal governments, or any
political subdivision thereof), and certain lenders. The advantage of CREBs is that they are issued—
theoretically—with a zero (0) percent interest rate. The borrower pays back only the principal of the
CITY OF TAMPA 7‐4 ENERGY EFFICIENCY AND CONSERVATION PLAN

C H A P T E R 7 1 9 B I M P L E M E N T A T I O N
bond, and the bondholder receives federal tax credits in lieu of the traditional bond interest. (See
http://www.irs.gov/irb/2007‐14_IRB/ar17.html.)
HB 7179 ENERGY FINANCING House Bill 7179 establishes the Property Assessed Clean Energy (PACE) Program for Florida. PACE allows
local governments to finance renewable energy and storm‐resistance improvements for local residents
and businesses. Qualifying improvements include: energy conservation and efficiency improvements,
renewable energy improvements, and wind resistant improvements. Under the Bill, local governments
can adopt either an ordinance or resolution which will allow local governments to provide upfront funds
to cover the costs for the qualifying improvements. Financing is repaid through the property tax bill and
repayment obligations remain with the property when it is sold to a new owner. The PACE program is
currently on hold, but is expected to remain an option for energy financing in the future.
CAPITAL INVESTMENT TAX CREDIT FOR CLEAN ENERGY In 2008, Florida established the Capital Investment Tax Credit for high‐impact sectors with the purpose
of attracting and growing capital‐intensive industries to Florida. The annual tax credit is 5% of eligible
capital costs generated by qualifying projects for a maximum of 20 years. A qualifying project is a new or
expanding facility located in Florida that is in a high‐impact sector, as defined by Enterprise Florida, Inc.
Currently, high‐impact sectors include clean energy, biomedical technology, financial services,
information technology, silicon technology and transportation equipment manufacturing. Projects must
include an investment of at least $25 million in eligible capital costs, among other criteria.
The annual tax credit is limited by the annual corporate income tax liability of the project. The following
tax credit limits apply:
■ Capital investment of at least $100 million: 100% of the annual corporate tax liability
■ Capital investment between $50 million and $100 million: 75% of the annual corporate tax liability
■ Capital investment between $25 million and $50 million: 50% of the annual corporate tax liability
Solar manufacturing facilities may transfer tax credits earned through this program. In order to qualify
for this transfer, solar manufacturing companies must create at least 400 jobs within six months of
beginning operations. The average annual salary of employees must be $50,000 or higher.
SOLAR ENERGY EQUIPMENT SALES TAX EXEMPTION Solar energy systems have been exempt from Florida's sales and use tax since July 1, 1997. The term
"solar energy system" means the equipment and requisite hardware that provide and are used for
collecting, transferring, converting, storing or using incidental solar energy for water heating, space
heating and cooling, or other applications that would otherwise require the use of a conventional source
of energy such as petroleum products, natural gas, manufactured gas or electricity. Vendors of solar
energy systems or components are required to document exempt sales.
This exemption was originally set to expire July 1, 2002, but was extended an additional three years. In
May 2005, the exemption was made permanent with the enactment of HB 805.
CITY OF TAMPA 7‐5 ENERGY EFFICIENCY AND CONSERVATION PLAN
C H A P T E R 7 1 9 B I M P L E M E N T A T I O N
The Florida Solar Energy Center certifies to the Department of Revenue a list of eligible equipment and
hardware. The list is provided here. Sellers of solar energy systems or components thereof are required
to document exempt sales. The Department of Revenue recommends that a form be completed by the
purchaser and presented to the seller.
Transportation Financing FEDERAL ENERGY EFFICIENCY COMMUNITY BLOCK GRANTS (EECBG) As described above, eligible activities include development and implementation of certain
transportation programs and efficiency traffic signals and street lighting.
STATE TRANSPORTATION IMPROVEMENT PROGRAM (STIP) The State Transportation Improvement Program (STIP) is a federally mandated document which must
include a listing of projects planned with federal participation in the next four fiscal years. Although the
STIP is approved annually by FHWA at the beginning of each federal fiscal year (October 1st), FHWA
allows FDOT to report these four years on a state fiscal year basis (July 1st thru June 30th). This is
because the report is based upon the federally funded projects listed in the first four years of FDOT's
Adopted Five Year Work Program.
TRANSPORTATION IMPROVEMENT PROGRAM (TIP) Hillsborough MPO develops the Transportation Improvement Program (TIP). The TIP is a listing of all
capital transportation projects proposed over a five‐year period for the Hillsborough region. Projects
include highway improvements, transit, rail and bus facilities, carpool lanes, signal synchronization,
intersection improvements, freeway ramps, and other related improvements. The TIP report is
developed annually.
ELECTRIC VEHICLE CHARGING EQUIPMENT FINANCING Property owners may apply to their local government for funding to help finance installations of EV
charging equipment at their property or enter into a financing agreement with the local government for
the same purpose. (Reference House Bill 7179, 2010, and Florida Statutes 163.08)
Water Conservation and Treatment Financing CLEAN WATER STATE REVOLVING FUNDS CWSRFs fund water quality protection projects for wastewater treatment, nonpoint source pollution
control, and watershed and estuary management. CWSRFs have funded over $74 billion, providing over
24,688 low‐interest loans to date. (See http://www.epa.gov/owm/cwfinance/cwsrf/index.htm for more
details.) CWSRF’s offer:
CITY OF TAMPA 7‐6 ENERGY EFFICIENCY AND CONSERVATION PLAN

C H A P T E R 7 1 9 B I M P L E M E N T A T I O N
■ Low Interest Rates, Flexible Terms—Nationally, interest rates for CWSRF loans average 2.1
percent, compared to market rates that average 4.3 percent. For a CWSRF program offering this
rate, a CWSRF funded project would cost 18 percent less than projects funded at the market rate.
CWSRFs can fund 100 percent of the project cost and provide flexible repayment terms up to 20
years.
■ Funding for Nonpoint Source Pollution Control and Estuary Protection—CWSRFs provided more
than $240 million in 2007 to control pollution from nonpoint sources and for estuary protection,
more than $2.6 billion to date.
■ Assistance to a Variety of Borrowers—The CWSRF program has assisted a range of borrowers
including municipalities, communities of all sizes, farmers, homeowners, small businesses, and
nonprofit organizations.
■ Partnerships with Other Funding Sources—CWSRFs partner with banks, nonprofits, local
governments, and other federal and state agencies to provide the best water quality financing
source for their communities.
7.3 STEP 3—Timeline and Prioritization The City will develop an implementation schedule based on the completion of the full cost effectiveness
analysis financing availability. Prioritization will be based on the following factors:
■ Cost effectiveness; ■ GHG reduction efficiency; ■ Availability of funding; ■ Level of City Control; ■ Ease of implementation; and
■ Time to implement.
In general consideration of these factors, the following is an outline of key priorities for three (3) phases
starting in 2011 through 2025.
■ Phase 1 (2011–2015): Development of key ordinances (such as a green building ordinance,
expansion of waste reduction goals, etc.), completion of key planning efforts (e.g., Climate
Finance Plan, regional land use/transportation planning); implementation of most cost‐effective
measures (e.g. EECBG projects, energy efficiency retrofits, electric vehicle charging stations,
rideshare/carpool measures, etc.); and support of voluntary efforts.
■ Phase 2 (2015–2020): Continued implementation of first tier measures, implementation of second
tier measures (new building solar requirements, expansion of renewable energy, etc.); and
implementation of key planning outcomes from Phase 1 (regional transportation planning, etc.)
CITY OF TAMPA 7‐7 ENERGY EFFICIENCY AND CONSERVATION PLAN

C H A P T E R 7 1 9 B I M P L E M E N T A T I O N
■ Phase 3 (2020–2025): Continued implementation of first and second tier measures,
implementation of third tier of measures (expand renewable energy use, further bicycle
infrastructure improvements, etc.).
Flexibility in Implementation Because the goals of this EECP are aggressive, success in meeting the EECP goals depend on some
flexibility in the GHG reduction actions. The City is committed to flexibility in implementing the
reduction measures, meeting the goals of this EECP, and saving money through energy efficiency and
independence. Not all reduction measures will be implemented immediately; some will be phased in
over time up to 2025 and beyond. Many of the reduction measures in this Plan may be implemented
through a menu of options; the goals of each reduction measure can often be achieved through a
variety of means, especially those related to building energy efficiency. For example, the City will
develop energy efficient design programs (measures R2‐E3 and R2‐E5), and compliance with the energy
efficient design programs can be achieved through many combinations of actions including (but not
limited to): installing energy efficient appliances, lighting, and HVAC systems; installing solar panels and
solar water heaters; siting and orienting buildings to optimize conditions for natural heating, cooling,
and lighting; installing top‐quality windows and insulation; and incorporating natural shading, skylights,
and reflective surfaces.
Table 7‐1 presents the potential timeline and phasing schedule for the GHG reduction measures. Note
that some of the reduction measures occur within all three phases. Reduction measures, such as energy
efficiency retrofits will be staged within the three phases to allow for staggered funding of the retrofit
incentives.
Table 7‐1 GHG Reduction Measure Timeline and Phasing Schedule
Reduction Measure Phase
Energy Reduction Measures
R2‐E1: EECBG – Traffic Signal Upgrade to LEDs 1
R2‐E2: Renewable Energy Goal: 25% by 2025 1,2,3
R2‐E3: Residential Energy Efficiency Retrofits 1, 2, 3
R2‐E4: Residential Renewable Energy Retrofits 1, 2, 3
R2‐E5: Commercial Energy Efficiency Retrofits 1
R2‐E6: Commercial Renewable Energy Retrofits 2
Solid Waste
R2‐S1: 12% Waste Reduction Goal by 2018 1, 2
R2‐S2: No Waste Sent to Landfill 1, 2, 3
Area Source
R2‐A1: Electric Landscaping Equipment in New Developments 1
CITY OF TAMPA 7‐8 ENERGY EFFICIENCY AND CONSERVATION PLAN

C H A P T E R 7 1 9 B I M P L E M E N T A T I O N
CITY OF TAMPA 7‐9 ENERGY EFFICIENCY AND CONSERVATION PLAN
Table 7‐1 GHG Reduction Measure Timeline and Phasing Schedule
Reduction Measure Phase
Transportation
R2‐T1: Smart Growth Planning 1, 2, 3
R2‐T2: TBARTA Master Plan 2, 3
R2‐T3: Expand Use of Low/Zero Emission Vehicles 1
R2‐T4: Bicycle Infrastructure 1, 2, 3
R2‐T5: Encourage Telecommuting and Alternative Work Schedules 1, 2, 3
Water
R2‐W1: Tampa Water Department Conservation Efforts 1, 2, 3
7.4 STEP 4—Public Participation The citizens and businesses in Tampa are integral to the success of GHG reduction efforts. Their
involvement is essential in order to reach the reduction goals because this EECP depends on a
combination of state and local government efforts, public and private sources of finance, and the
voluntary commitment, creativity, and participation of the community at large. The City will educate
stakeholders such as businesses, business groups, residents, developers, and property owners about the
EECP and encourage participation in efforts to reduce GHG emissions in all possible sectors.
7.5 STEP 5—Green Fast Track Review Tampa’s Green Fast Track Review process (described in Chapter 4) will play a key role in incentivizing
new development projects as they include sustainable design features in the project. The Fast Track
Review will be particularly critical in encouraging the implementation of the following reduction
measures: energy efficient design features, renewable energy systems, electric landscaping
infrastructure, and the telecommuting and alternative work schedules. These are in addition to the
GHG‐reducing features already included in the Fast Track Review checklist.
7.6 STEP 6—Monitoring and Inventorying The City will create a system for monitoring the implementation of this EECP and adjusting the plan as
opportunities arise. As the plan is implemented and as technology changes, the EECP should be revised
to take advantage of new and emerging technology. If promising new strategies emerge, the City will
evaluate how to incorporate these strategies into the EECP. Further, state and federal action will also
result in changes which will influence the level of Tampa emissions.
The GHG inventory will be periodically updated in coordination with the three (3) phases noted above:
2015, to review progress after Phase efforts; 2020, to review Phase 2 progress, allow for course

C H A P T E R 7 1 9 B I M P L E M E N T A T I O N
CITY OF TAMPA 7‐10 ENERGY EFFICIENCY AND CONSERVATION PLAN
corrections to keep progress on target for 2025, and to develop post‐2025 forecasts for use in planning
for after 2025); and 2025 (to establish baseline for post‐2025 GHG reduction planning). The City will also
implement a monitoring and reporting program to evaluate the effectiveness of reduction measures
with regards to progress towards meeting the goals of the EECP.
To provide periodic updates to the EECP inventory of GHG emissions, the City will use an Excel‐based
emissions inventory tool. This tool will include all the emission factors and emission sources specific to
the City of Tampa. The tool will be designed such that City staff can input selected vehicle count, and the
level of energy consumed in the City provided to them by the utilities, and the tool will quantify
emissions for the City as a whole.
The CGO shall be responsible for maintaining records of reduction measure implementation and insuring
that the periodic updates to the emissions inventory are completed using the Excel‐based emissions
inventory tool.
7.7 STEP 7—Beyond 2025 As described above under the discussion of Reduction Goals, 2025 is only a milestone in GHG reduction
planning. Executive Order 07‐127 calls for a reduction of GHG emissions to a level 80 percent below
1990 levels by 2050, and this level is consistent with the estimated reductions needed to stabilize
atmospheric levels of CO2 at 450 parts per million (ppm). Thus, there will be a need to start planning
ahead for the post‐2025 period.
However, there are many uncertainties in predicting emissions in post‐2025. Federal programs and
policies for the near term are likely to be well underway; market mechanisms like a cap and trade
system may be in force and will be influencing energy and fuel prices; and continuing technological
change in the fields of energy efficiency, alternative energy generation, vehicles, fuels, methane capture,
and other areas will have occurred. In addition, by 2018, the City will be at the approximate midway
point between plan implementation and the reduction target and after development of key ordinances
and implementation of cost‐effective measures. At that point, the City will have implemented the first
phase of this EECP, will be well in to the second phase, and will have a better understanding of the
effectiveness and efficiency of different reduction strategies and approaches. For all of these reasons, it
is important that the City prepare and update the EECP for the post 2025 period toward the latter half of
the EECP implementation period.
The City will then be able to take the local, regional, state, and federal context into account. The new
plan will include a specific target for GHG reductions for 2035, 2040, and 2050. The targets will be
consistent with broader state and federal reduction targets and with the scientific understanding of the
needed reductions by 2050.

CITY OF TAMPA 8‐1 ENERGY EFFICIENCY AND CONSERVATION PLAN
CHAPTER 8 References

C H A P T E R 8 2 0 B R E F E R E N C E S
Association of Environmental Professionals (AEP) White Paper: Alternative Approaches to Analyzing
Greenhouse Gases and Global Climate Change Impacts in CEQA Documents, June 2007.
Association of Environmental Professionals (AEP) White Paper: Community‐wide Greenhouse Gas Emission Protocols, November 2010.
Center for Climate Strategies, Florida’s Energy and Climate Action Plan, 2008. [2008a]
Center for Climate Strategies, Florida GHG Inventory and Reference Case Projection, October 2008. [2008b]
Department of Environmental Protection (DEP), Chapter 62‐285 Greenhouse Gas Reduction, 2009.
Hillsborough County City‐County Planning Commission (The Planning Commission), Hillsborough County Summary Totals, Population and Housing, 2010.
Hillsborough County Metropolitan Planning Organization (MPO), 2035 Long Range Transportation Plan: LRTP Sustainability and GHG Reduction Strategies, April 2009.
Intergovernmental Panel on Climate Change, Climate Change 2007: The Physical Scientific Basis,
Contribution of Working Group I to the Fourth Assessment Report of the Intergovernmental
Panel on Climate Change, http://www.ipcc.ch/publications_and_data/publications_and_data_
reports.shtml#1, 2007
Tampa, City of, Energy Efficiency and Conservation Strategy, June 19, 2009.
Tampa, City of, Green Fast Track Review, 2008. [2008a]
Tampa, City of, Green Resolution, May 15, 2008. [2008b]
Tampa, City of, Green Tampa: Tracking Tampa’s Path to Sustainability, April 12, 2008. [2008c]
Tampa, City of, Mayor’s Citizen/TECO Energy Conservation Task Force Final Recommendations, February
24, 2010. [2010a]
Tampa, City of, Tampa Water Department FY10 Water Conservation Program Summary, 2010. [2010b]
Tampa Bay Water, Greenhouse Gas Emissions Associated with Water Production, February 2, 2010.
United Nations Framework Convention on Climate Change (UNFCCC), Kyoto Protocol, December 11,
1997.
U.S. Environmental Protection Agency (EPA), Emissions and Generation Resource Integrated Database (eGRID2007), version 1.1, December 31 2007. [2007a]
U.S. Environmental Protection Agency, Final GHG Tailoring Rule, 40 CFR Parts 51, 52, 70, et al., May 2010. [2010a]
CITY OF TAMPA 8‐2 ENERGY EFFICIENCY AND CONSERVATION PLAN

C H A P T E R 8 2 0 B R E F E R E N C E S
U.S. Environmental Protection Agency, Mandatory Reporting of Greenhouse Gases Rule, 40 CFR Part 98, October 2009.
U.S. Environmental Protection Agency, Solid Waste Management and Greenhouse Gases: A Life‐Cycle Assessment of Emissions and Sinks, Third Edition, September 2006.
U.S. Environmental Protection Agency, U.S. Greenhouse Gas Inventory Report, Section 6 Agriculture, http://www.epa.gov/climatechange/emissions/downloads09/Agriculture.pdf, accessed February 2010. [2010b]
U.S. Supreme Court, Massachusetts et al. v. Environmental Protection Agency et al., No. 05‐1120,
Decided April 2, 2007. [2007b]
CITY OF TAMPA 8‐3 ENERGY EFFICIENCY AND CONSERVATION PLAN

C H A P T E R 8 2 0 B R E F E R E N C E S
CITY OF TAMPA 8‐4 ENERGY EFFICIENCY AND CONSERVATION PLAN
This page intentionally left blank.

APPENDIX A: THE GREENHOUSE EFFECT, GREENHOUSE
GASES, AND CLIMATE CHANGE IMPACTS
CITY OF TAMPA ENERGY EFFICIENCY AND CONSERVATION PLAN

APPENDIX B: MODELING COEFFICIENTS AND
DATA ASSUMPTIONS
CITY OF TAMPA ENERGY EFFICIENCY AND CONSERVATION PLAN

APPENDIX C: COMMUNITY‐WIDE
DATA INPUTS
CITY OF TAMPA ENERGY EFFICIENCY AND CONSERVATION PLAN

APPENDIX D: MUNICIPAL INVENTORY
GHG CALCULATIONS
CITY OF TAMPA ENERGY EFFICIENCY AND CONSERVATION PLAN

APPENDIX E: COMMUNITY‐WIDE INVENTORY
GHG CALCULATIONS
CITY OF TAMPA ENERGY EFFICIENCY AND CONSERVATION PLAN

CITY OF TAMPA ENERGY EFFICIENCY AND CONSERVATION PLAN
APPENDIX F: REDUCTION MEASURES, ASSUMPTIONS
AND ATTRIBUTED REDUCTIONS