city research online_bingyu.pdf · 1.2.4 web-welded stud shear connection 22 1.3 composite action...
TRANSCRIPT

City, University of London Institutional Repository
Citation: Huo, B. Y. (2012). Experimental and analytical study of the shear transfer in composite shallow cellular floor beams. (Unpublished Doctoral thesis, City University London)
This is the unspecified version of the paper.
This version of the publication may differ from the final published version.
Permanent repository link: http://openaccess.city.ac.uk/1965/
Link to published version:
Copyright and reuse: City Research Online aims to make research outputs of City, University of London available to a wider audience. Copyright and Moral Rights remain with the author(s) and/or copyright holders. URLs from City Research Online may be freely distributed and linked to.
City Research Online: http://openaccess.city.ac.uk/ [email protected]
City Research Online

Experimental and Analytical Study of the Shear Transfer in
Composite Shallow Cellular Floor Beams
by
Bingyu HUO
Dissertation submitted in fulfilment of the requirement for the award of
PhD
in
Structural Engineering
City University London
School of Engineering and Mathematical Sciences
November 2012

2
Table of contents
Page
Table of content 2
Acknowledgements 8
Declaration 9
Abstract 10
Notations 11
Abbreviations 14
Chapter 1 Introduction
1.1 Background of the composite shallow cellular floor beams 15
1.1.1 Manufacturing process 17
1.2 Shear transferring mechanism 20
1.2.1 Concrete-infill-only shear connection 20
1.2.2 Tie-bar shear connection 21
1.2.3 Ducting shear connection 21
1.2.4 Web-welded stud shear connection 22
1.3 Composite action 22
1.4 Methodologies of investigation 23
1.4.1 Push-out tests 24
1.4.2 Flexural tests 24
1.4.3 Analytical study 25
1.4.3.1 Analytical study of push-out test results 26
1.4.3.2 Analysis of flexural tests 26
1.4.4 Finite Element Analysis 26
1.5 Objectives 27
1.6 Aims 27
1.7 Structure of the thesis 28
Chapter 2 Literature review
2.1 Introduction 30
2.2 Slim-floor beams 30
2.2.1 The Slimflor beam 31
2.2.2 Asymmetric Slimflor beam (ASB) 33
2.2.3 ITECH composite beam 34
2.3 Shear connection 35
2.3.1 Codes of practice 36
2.3.2 Headed stud shear connection 37

3
2.3.2.1 Headed studs used in solid slab 37
2.3.2.2 Headed studs used with profiled decking 39
2.3.3 Other types of shear connection 41
2.3.3.1 Horizontal lying shear studs 41
2.3.3.2 Concrete dowel in Deltabeam 42
2.3.3.3 Perfobond rib shear connection 44
2.3.3.4 Crestbond rib shear connection 47
2.3.3.5 Concrete dowel in composite bridge girder 48
2.4 Flexural composite beam tests 50
2.4.1 Slimflor and ASB composite beam tests 50
2.4.2 Tests of downstand composite beams with web openings 51
2.4.3 Tests of composite beams with encased web openings 55
2.5 Conclusions 57
Chapter 3 Push-out test series-I
3.1 Introduction 60
3.2 Test specimens 61
3.2.1 Steel sections 61
3.2.2 Concrete slab 62
3.2.3 Test groups 62
3.2.3.1 Specimens of test group T1, concrete-infill-only shear
connection 63
3.2.3.2 Specimens of test group T2, tie-bar shear connection 64
3.2.3.3 Specimens of test group T3, ducting shear connection 65
3.2.3.4 Specimens of test group T4, web-welded stud shear connection
66
3.2.4 Preparation and construction 67
3.3 Set up and testing procedures 68
3.3.1 Testing procedures 69
3.4 Test results 70
3.4.1 Load-slip curves 70
3.4.2 Load-separation curves 70
3.4.3 Result evaluation 75
3.4.4 Results of test group T1, concrete-infill-only shear connection 76
3.4.4.1 Behaviour analysis 82
3.4.4.2 Failure mechanism study 82
3.4.5 Results of test group T2, tie-bar shear connection 83
3.4.5.1 Behaviour analysis 89
3.4.5.2 Failure mechanism study 90
3.4.6 Results of test group T3, ducting shear connection 91
3.4.6.1 Behaviour analysis 97
3.4.6.2 Failure mechanism study 97

4
3.4.7 Results of test group T4, web-welded stud shear connection 98
3.4.7.1 Behaviour analysis 99
3.4.7.2 Failure mechanism study 104
3.5 Conclusions 105
3.6 Recommendations 106
Chapter 4 Push-out test series-II
4.1 Introduction 108
4.2 Test specimens 109
4.2.1 Steel sections 109
4.2.2 Concrete slab 109
4.2.3 Test groups 110
4.2.3.1 Specimens of test group T5, concrete-infill-only shear
connection 110
4.2.3.2 Specimens of test group T6, tie-bar (Ø16mm) shear connection
111
4.2.4 Preparation and construction 112
4.3 Set up and testing procedures 113
4.3.1 Testing procedures 113
4.4 Test results 114
4.4.1 Result evaluation 117
4.4.2 Results of test group T5, concrete-infill-only shear connection 118
4.4.2.1 Behaviour analysis 122
4.4.2.2 Response to loading cycles 123
4.4.2.3 Failure mechanism study 123
4.4.3 Results of test group T6, tie-bar (Ø16mm) shear connection 125
4.4.3.1 Behaviour analysis 125
4.4.3.2 Response to loading cycles 129
4.4.3.3 Failure mechanism study 130
4.5 Conclusions 131
4.6 Recommendations 133
Chapter 5 Analytical study and Finite Element Analysis of the shear
connection
5.1 Introduction 134
5.2 Mathematical analysis 135
5.3 FEA of the concrete-infill-only shear connection 143
5.3.1 Geometrical modelling 143
5.3.2 Material modelling 144
5.3.2.1 Concrete material model 145
5.3.2.2 Steel material model 149

5
5.3.3 Boundary conditions 150
5.3.4 Contact model 150
5.3.5 Application of load 152
5.3.6 The calibration results 152
5.3.7 Parametric study 156
5.3.8 Verification of the shear resistance calculation method 161
5.4 Conclusion of design method 166
Chapter 6 Flexural test of composite shallow cellular floor beams
6.1 Introduction 168
6.2 Test specimen 169
6.2.1 Steel section 171
6.2.2 Concrete slab 172
6.2.3 Layout of shear connection 173
6.2.4 Preparation and construction 173
6.3 Flexural tests 175
6.3.1 Four-point symmetric bending test 176
6.3.1.1 Objectives and aims 177
6.3.1.2 Set up and instrumentation 179
6.3.1.3 Testing procedure 181
6.3.2 Three-point asymmetric bending test 182
6.3.2.1 Objectives and aims 183
6.3.2.2 Set up and instrumentation 183
6.3.2.3 Testing procedure 184
6.3.3 Possible failure modes 186
6.4 Test results 189
6.4.1 Results of four-point symmetric bending test 189
6.4.1.1 Bending moment 190
6.4.1.2 Deflection 191
6.4.1.3 Slip 193
6.4.1.4 Strain and stress 197
6.4.1.5 Cracking pattern 200
6.4.2 Results of three-point asymmetric bending test 203
6.4.2.1 Bending moment 203
6.4.2.2 Deflection 204
6.4.2.3 Slip 207
6.4.2.4 Strain and stress 210
6.4.2.5 Cracking pattern 213
6.4.2.6 Failure mode and failure mechanism 217
6.4.3 Geometric limits 217
6.5 Conclusions of the flexural tests 218

6
Chapter 7 Analysis of the flexural tests
7.1 Introduction 221
7.2 Deflection analysis 222
7.2.1 Uncracked and cracked sections 223
7.2.2 Deflection study 224
7.2.3 Conclusion for deflection check method 231
7.3 Back analysis of four-point symmetric bending test 235
7.3.1 Stress block method 235
7.3.1.1 Determination of degree of shear connection 240
7.3.2 Shear performance of the shear connection 241
7.4 Back analysis of three-point asymmetric bending test 242
7.4.1 Stress block method 242
7.4.2 Shear performance of the shear connection 243
7.5 Design method for moment resistance 244
7.6 Conclusions 248
Chapter 8 Conclusions and recommendations
8.1 Conclusions 250
8.1.1 Conclusions of experimental studies 251
8.1.1.1 Push-out tests 251
8.1.1.2 Flexural tests 254
8.1.2 Conclusions of analytical studies 256
8.1.2.1 Analytical studies of push-out test results 256
8.1.2.2 Analytical studies of flexural test results 257
8.2 Recommendations 260
8.2.1 Recommendations for the shear connection 260
8.2.2 Recommendations for future research 260
Appendix A: Synthetic fibre reinforcement and superplasticizer 262
Appendix B: Concrete strength 264
Appendix C: Results of coupon tests 266
Appendix D: FEA element size analysis 269
Appendix E: Contour plots of the FEA 272
Appendix F: Back analysis of the four-point bending test 279
Appendix G: Calculated moment resistance in four-point bending test 280
Appendix H: Moment resistance of the different cross sections 286
Appendix J: Calculated moment resistance in three-point bending test 291
Appendix K: Design moment capacity of the flexural test beam specimen using
BS5950 and EC4 298

7
Appendix L: Concrete stress-strain curves 306
Bibliography 308

8
Acknowledgements
I would like to express my profound gratitude to my supervisor Dr Cedric D’Mello for
his constant support and encouragement. His clear and constructive guidance have been
invaluable throughout the duration of my research.
I would like to thank Dr Brett McKinley for his numerous advices on the
experimental studies at the beginning of my research. My gratitude is also extended to
my colleague Dr Konstantinos Tsavdaridis for his experimental and technical advices.
The supply of the steel sections by the Westok Limited is gratefully
acknowledged. I am truly grateful to Mr Mike Hawes, the former technical director of
the Westok limited, for his many valuable suggestions and discussion.
I am truly indebted to Mr Phil Beckwith and Mr Jim Hooker for their unfailing
technical support throughout my research. Additional gratitude is to Mr Jim Hooker for
his proof reading of my thesis. I am also very grateful to Mr Ahmed Saeed and Mr Gary
Austin for their technical support.
My sincere gratitude is extended to Mr Mark Crossley and Mr Joe Pann for their
proof reading of my thesis and Dr Shiqiang for his help binding the thesis during their
busy working schedules.
Finally, I thank my mother, my sister, my brother-in-law for their continuous love
and support. I would also like to thank my wife and her family for their constant care
and encouragement.

9
Declaration
I grant powers of discretion to the University Library to allow this thesis to be copied in
full or in part without further reference to me. This permission covers only single copies
made for study purpose, subject to normal conditions of acknowledgements.

10
Abstract
This research investigated the longitudinal shear transfer mechanism in composite
shallow cellular floor beams. The shear transfer mechanism is different with the headed
shear studs used in composite construction. The shear resisting properties and behaviour
of the shear transfer mechanism has not been studied previously. Experimental and
analytical studies were carried out with the aims of improving and optimizing the design
details, and advancing the method of shear connection in shallow floor beam
construction.
The composite shallow cellular floor beam investigated in this research is a new
type of beam fabricated by welding two highly asymmetric cellular tees along the web.
The shear connections of this type of composite beam are formed by the web openings,
which transfer longitudinal shear force. Four types of these shear connections were
studied: concrete-infill-only, tie-bar, ducting and web-welded-stud shear connections.
In total, 24 push-out tests were performed in two test series to investigate the
load-slip behaviour and shear resistance of the shear connections under direct shear
force. The failure mechanisms of the two forms of shear connections were extensively
studied, which lead to the development of a design method for the composite action.
The concrete infill element passing through the web opening is subject to a
complex three-dimensional stress state, and it is difficult to analyse it using the
mathematical model rather than empirical formula. Finite Element Analysis of the
concrete-infill-only shear connection was performed with a parametric study to further
verify the design method that has been developed.
Two flexural tests were carried out on a full-scale composite shallow cellular floor
beam with a solid slab. The shear connections investigated in the flexural tests were:
concrete-infill-only and tie-bar shear connections passed through the web. The
behaviour and performance of the shear connections in the flexural tests were compared
with those in the push-out tests.
The degree of shear connection of the two flexural tests was determined in the
back analysis using plastic theory with measured material properties. Based on the
findings of the push-out tests and flexural tests, two design methods of deflection check
and moment resistance were developed for composite shallow cellular floor beams at
the serviceability limit state and the ultimate limit state respectively. The deflection
check design method is based on the uncracked section properties of the composite
beam. The moment resistance design method developed in this thesis is compatible with
the design methods of BS5950 and Eurocode 4 (EC4).

11
Notations
Ac area of the concrete infill element in compression
At area of the concrete infill element in tensile splitting
Be effective width of the concrete slab
D depth of the P.N.A; diameter of the web opening
Dd diameter of ducting
Dtb diameter of the tie-bar
d diameter of the shank of the stud; depth of concrete in compression
E Young’s Modulus of steel
Ecm mean secant modulus of the elasticity of concrete
F a function of the principle stress state (σxp, σyp, σzp,)
f1 ultimate compressive strength for a state of biaxial compression
superimposed on σha
f2 ultimate compressive strength for a state of uniaxial compression
superimposed on σha
fc uniaxial crushing or compressive strength (used in FEA)
fcb ultimate biaxial compressive strength (used in FEA)
fck characteristic cylinder compressive strength of concrete
fct concrete tensile splitting strength
fcu concrete compressive cube strength
ft ultimate uniaxial tensile strength
fu strength of material of the stud but not greater than 500N/mm2
fy yield strength of the tie-bar
hsc overall nominal height of the stud
I the second moment of area
K stiffness of the shear connections; degree of shear connection
Mc moment resistance of composite section in partial shear connection
Mcomp additional moment resistance due to the composite action
Mpc moment resistance of composite section in full shear connection
Mpl,a,Rd plastic moment resistance of the steel section
Mpl,Rd design moment resistance of composite section in full shear connection

12
MRd design moment resistance of composite section in partial shear connection
Ms moment resistance of the steel section
PRd design shear resistance of the shear stud
Pu ultimate shear capacity of the shear connection
Pc shear resistance of the shear connection
Puc design shear resistance of the shear connection
Radd shear resistance of the additional elements (i.e. tie-bar or shear studs)
Rc compressive resistance of the concrete slabs in full shear connection
Rce shear resistance of the concrete infill element
Rq longitudinal shear resistance of the shear connections in composite section
Rtb tensile resistance of the tie-bar
S is the failure surface expressed in terms of principle stresses and five
parameters (ft, fc, fcb, f1 and f2)
t thickness of the web
Greek symbols
αc shear performance of the shear connection in composite beam
βc shear transfer coefficient for a close crack
βt shear transfer coefficient for an open crack
δc deflection of the composite beam with full shear connection
δc’ deflection of the composite beam with partial shear connection
δs deflection of the steel beam acting alone
δu slip capacity of the shear connections
η degrees of shear connection
εc concrete compressive strain
εc1 concrete compressive strain at the peak stress
γv partial factor
μs stiffness multiplier for cracked tensile condition (default=0.6)
υ Poisson’s ratio
σc concrete compressive stress
σc,Rd design concrete compressive stress
σha
ambient hydrostatic stress state

13
τ equivalent shear stress
τmax maximum equivalent shear stress

14
Abbreviations
ASB Asymmetric Slimflor Beam
BS British Standard
EC Eurocode
FEA Finite Element Analysis
ULS Ultimate Limit State
SLS Serviceability Limit State
ATS Automatic Time Stepping
P.N.A Plastic Neutral Axis
e.n.a elastic neutral axis

Chapter 1 Introduction
15
Chapter 1 Introduction
The properties of shear connection are fundamentally important for the behaviour and
strength of the composite structure, as it transfers longitudinal shear force along the
interface of the concrete and steel elements. This thesis presents investigations of
unique shear transferring mechanism of composite shallow cellular floor beams. The
shear transferring mechanism is different with the conventional shear studs and has not
been investigated previously. Experimental and analytical studies were carried out with
the aims of advancing the method of shear connection in shallow floor beam
construction. The shear transferring mechanism and methodologies of the investigations
will be discussed in this chapter.
1.1 Background of composite shallow cellular floor beams
In recent years, the increasing demands on shallow floor beam had led to the
development of the Slimflor and Asymmetric Slimflor Beam (ASB). However, the
thickness and width of the top flange increases with increase of the span; this often
results in the steel sections being heavier than required. Composite shallow cellular
floor beam is a new type of beam commercially developed by Westok Limited, under
the trade mark of Ultra Shallow Floor Beam. The composite shallow cellular floor beam
is fabricated by welding two highly asymmetric cellular tees together along the web.
Regularly spaced openings are formed on the web post. The top and bottom tees are cut
from different parent sections. Generally, the top tee is cut from the universal column
(UC) or universal beam (UB); and the bottom tee is cut from the UC. The weight of the
steel section is reduced by having a smaller top tee. The precast floor units or profiled
steel decking sit on the bottom flange, creating a shallow floor construction system
(Huo et al 2010), as illustrated in Figure 1.1.
The composite shallow cellular floor beam is a construction system that fits in the
range of flat slab beam used in steel building technologies. The composite shallow
cellular floor beam is similar to the Slimflor beam and ASB. The common feature of
these beams is the flat slab structure which minimises the overall floor depth. However

Chapter 1 Introduction
16
the manufacturing process and the web opening feature of the composite shallow
cellular floor beam gives three key advantages when compared with the Slimflor and
ASB. The first one is the flexibility owing to the manufacture process, so the depth of
this beam section is not fixed and can be designed according to the required floor depth.
The second advantage is the service integration which provided by the unique feature of
web openings. The third advantage is the enhanced composite action due to the concrete
plug passing through the web opening transfers longitudinal shear force.
The composite shallow cellular floor beam creates a profile of encased section
with only the bottom flange is being exposed. Typical proportion of this composite
beam is 190mm to 350mm for a span of 6m to 12m (Westok Ltd). There is no fixed
depth for a span as the beam section is fabricated from two different parent sections.
The section depth and arrangement of the web openings are dependent on the
specifications of the construction. The manufacturing process of the beam sections are
explained in Section 1.1.1. Apart from the three advantages mentioned in the above
paragraph, the other benefits of using the composite shallow cellular floor beams are:
flat and shallow floor structure, flexibility of floor layout and fast construction time.
A flat and shallow floor structure is achieved by the asymmetric section allowing
either pre-cast units or metal decks to sit on the bottom flange. The construction details
are depicted in Figure 1.2. The composite shallow cellular floor beam has regularly
spaced cells in the web to permit the passage of reinforcement tie bars. The web
openings can also be used for the passage of building services if it is required. This
further minimises the overall floor depth and eliminates unwanted floor depth needed to
accommodate the building services passing underneath the beam structures.
The composite shallow cellular floor beams create a flat floor structure to enable
the layout of the floor to be designed with flexibility. This floor beam further improves
the application of the flat slab beams in the steel building constructions. The speed of
the construction time is also improved as the beam can be used with pre-cast units and
metal deck floors. This method of construction eliminates the time spent for concrete
hardening in the traditional downstand composite beam constructions. Hence,
concreting is no longer on the critical paths.

Chapter 1 Introduction
17
Figure 1.1 Schematic drawing of the composite shallow cellular floor beam
(a) (b)
Figure 1.2 Shallow cellular floor beam used with (a) profiled steel decking (b) precast
floor units (courtesy of Westok Limited)
The web openings of the composite shallow cellular floor beams provide the
passage for the reinforcing tie-bars, building services and ducting through the structural
depth, minimising the overall floor depth. Full service integration can be achieved when
the deep profile decking is employed for the ducting passing between the ribs of the
decking. The in-situ concrete fills the web openings when the floors are being cast. The
concrete infill passing through the web openings, with or without tie-bars, interacts with
the web openings transferring the longitudinal shear force. The objectives of this
research are to investigate the unique shear transferring mechanism.
1.1.1 Manufacturing process
The composite shallow cellular floor beams do not have a standard section. The depth
of the beams can be designed according to the required floor depth. The bespoke design
of the section depth is benefited from the manufacturing process, as the beam section is
formed by welding two asymmetric cellular tees, which are cut from different parent
sections. Oxycutting technology is used in cutting the parent sections into the cellular

Chapter 1 Introduction
18
tees, as shown in Figure 1.3. The schematic for the manufacturing process of the beam
sections is illustrated in Figure 1.4.
The profile cutting (or ribbon cutting) is the technology used to fabricate the
cellular steel beams, as illustrated in Figure 1.3. The ribbon cutting can maximise the
depth of the cellular tees from a parent section. The cellular tees are cut and re-welded
along the web to create the cellular beams with increased depth when compared with the
parent sections. The asymmetric tees of the shallow cellular floor beams are ribbon cut
from different parent sections, i.e. UB for the top tees and UC for the bottom tees. The
required depth of the beam sections is achieved in the design process for the asymmetric
tees, as the depths of the top and bottom tees comprise the total depth for the beam
sections. The depths of the tees are also bonded with the loading specifications for the
composite sections. The ribbon cutting technology allows the cellular tees to be cut with
the desired depth. Hence, the required beam depth can be obtained from the two parent
sections.
The design of the asymmetric tees first is to select the parent sections to enable the
tees to have the required depths, and the diameter and spacing of the web openings.
Each parent section produces two identical cellular tees. The top and bottom tees are
designed to share the same diameter and spacing of the web openings. The cutting
process for the cellular tees ensures the regular spaced web openings are formed when
the asymmetric tees are welded together. The re-welding process takes place once the
asymmetric tees are cut, as illustrated in Figure 1.4.
Overall, the manufacturing process provides many advantages for the shallow
cellular floor beams. It reduces the weight of the beam sections, and also enhances the
design flexibilities of the composite beams, e.g. the depth and strength of the beam
sections. The beam sections with greater capacity can be designed by selecting the
stronger parent sections.

Chapter 1 Introduction
19
Figure 1.3 Oxycutting technology used for fabrication of the cellular tee sections
(courtesy of Westok Limited)
Figure 1.4 Schematic for the manufacturing process of cutting and re-welding

Chapter 1 Introduction
20
1.2 Shear transferring mechanism
A shear connection is an interconnecting element between the concrete and steel of a
composite structure that has sufficient strength and stiffness to enable the two elements
to be designed as a single structure (EC4, EN1994-1-1: 2004). The most common type
of shear connection is the headed shear studs, which are normally welded on the top
flange of the downstand composite beams. The shear transferring mechanism of the
composite shallow cellular floor beams is formed uniquely by incorporating with the
web openings. Four types of the shear transferring mechanism are investigated in this
thesis, as listed below. The concrete-infill-only and tie-bar shear connection are the
most commonly used shear transferring mechanism in this type of composite beam.
Concrete-infill-only shear connection
Tie-bar shear connection
Ducting shear connection
Web-welded stud shear connection
1.2.1 Concrete-infill-only shear connection
The web openings of the composite shallow cellular floor beams provide the passage for
the tie-bars and building services within the structural depth. The in-situ concrete
completely fills the web openings, if there are no tie-bars or building services passing
through the openings, as shown in Figure 1.5. The concrete infill elements interact with
the web post transferring the longitudinal shear force. This concrete infill element is
called concrete-infill-only shear connection. The shear transferring mechanism of the
shear connection is illustrated in the figure below.
Figure 1.5 Schematic drawing of the concrete-infill-only shear connection

Chapter 1 Introduction
21
1.2.2 Tie-bar shear connection
One of the functions of the tie-bars used in the composite shallow cellular floor beams
is to provide the tie force for the concrete slabs on both sides of the web post. Generally,
high yield reinforcing bars of Ø16mm with 1m in length are used to pass through every
alternative web openings. However, in the situation of the length of the tie-bars is
constrained to be less than 1m; two Ø12mm tie-bars are used instead of one Ø16mm tie-
bar. The in-situ concrete fills the web openings with the tie-bars. The combination of the
concrete infill element and tie-bars forms tie-bar shear connection; its shear transferring
mechanism is illustrated in Figure 1.6.
Figure 1.6 Schematic drawing of the tie-bar shear connection
1.2.3 Ducting shear connection
The ducting used for the heating, ventilation and air conditioning (HVAC) is one of the
essential elements for the building services. Normally, the ducting is under-slung from
the floor above; this leads to increased floor depth. The circular or elongated web
openings of the composite shallow cellular floor beams provide the passage for the
ducting within the structural depth, minimising the overall floor depth. Generally, the
diameter of the ducting is smaller than that of the web openings; hence, there are voids
between the ducting and web opening. The in-situ concrete fills the voids, creating a
ring-shaped concrete element around the ducting, as illustrated in Figure 1.7. The
concrete element combined with the ducting resist the longitudinal shear force; this type
of shear transferring mechanism is called ducting shear connection.
Ø16mm tie-bar of 1m length

Chapter 1 Introduction
22
Figure 1.7 Schematic drawing of the ducting shear connection
1.2.4 Web-welded stud shear connection
The headed shear studs used for the composite shallow cellular floor beams are to
provide additional shear resistance in the region where high shear occurs. The headed
shear studs are welded on the web post of the top tee, as illustrated in Figure 1.8. The
studs and the concrete infill element simultaneously resist the longitudinal shear force.
The combination of these two elements forms the web-welded stud shear connection.
(a) (c)
Figure 1.8 (a) Schematic drawing of the floor beam with additional headed studs;
(b) The cross sectional view; (c) Shear transferring mechanism
1.3 Composite action
The unique shear transferring mechanism used for the composite shallow cellular floor
beams consist of concrete plugs with or without other elements, i.e. tie-bar, ducting and
Headed shear stud
(b)
Ducting

Chapter 1 Introduction
23
studs. The shear transferring mechanism enables the steel beam and concrete elements
to interact with each other. This interaction makes the beams behave compositely. As
results of the composite action, the steel beam and concrete slab act together resisting
bending. The moment resistance and stiffness of the composite beam are much
increased comparing with the bare steel section. The amount of increase in strength and
stiffness is also dependent on the degree of composite action. One of the experimental
investigations presented in this thesis demonstrated that the typical increase of 50% in
moment resistance and stiffness due to the composite action for the shallow cellular
floor beams.
Because of the significant composite action achieved by the shear transferring
mechanism, the shallow cellular floor beams can be designed as composite sections.
Thus, the steel section sizes used for this type of composite beam are reduced
comparing with the non-composite beams. The other benefits due to the composite
action for the shallow cellular floor beams are:
The depths of the composite beams are kept shallow. The unique shear
transferring mechanism is formed without the increase of the structural
depth, unlike the Slimflor beams which achieve the composite action with
the studs welded on the top flange.
The robustness of the composite action is enhanced by the tie-bar passing
through the opening. The flexural tests presented in this thesis showed that
the use of tie-bar prevented brittle failure and increased the ductility and
shear performance of the shear connection. The shear transferring
mechanism is different from that of the ASB which relies on shear-bond
action between the concrete and steel section with embossed top flange.
1.4 Methodologies of investigation
The shear connection of the composite shallow cellular floor beams is different with the
conventional headed shear studs. The behaviour and shear resisting properties of the
shear connection have not been investigated previously. In order to provide information
for design and further research on the shear connection, this research is carried out by
using the methods of: push-out test, flexural composite beam test, analytical study and
Finite Element Analysis. Details of these methodologies are summarised in the
following four sections.

Chapter 1 Introduction
24
1.4.1 Push-out tests
Push-out test is an elemental test applies direct longitudinal shear force to the shear
connection. The shear resisting capacity and load-slip behaviour of the shear connection
can be obtained from the push-out test. The standard push-out test for the headed shear
studs and its load-slip curve are shown in Figure 1.9. Eurocode 4 (EN1994-1-1: 2004)
provides detailed specifications for the push-out test of the headed shear studs.
Push-out tests were carried out in this research to investigate the shear resisting
capacity and load-slip behaviour of the shear connection used for the composite shallow
cellular floor beams. Specimens of the push-out tests were designed to represent the
actual configurations and shear behaviour of the shear connection. Set up and testing
procedures were designed to create desired loading conditions, and to be in compliance
with the specifications of Eurocode 4. The results of the push-out tests were evaluated.
The behaviour and failure mechanism of the shear connection were extensively studied.
The shear resisting capacities of the shear connection were analysed to establish a
design method for the shear resistance of the shear connection.
(a) (b)
Figure 1.9 (a) Standard push-out test for the headed studs; (b) Load-slip curve of the
headed studs (EC4, EN1994-1-1: 2004)
1.4.2 Flexural tests
In order to further study the shear connection, two flexural tests were carried out to
investigate the shear connection when subject to bending load. A full-scale composite
beam specimen was designed to represent the actual shallow cellular floor beams with a

Chapter 1 Introduction
25
common span range. One half span of the test beam specimen had solely the concrete-
infill-only shear connection. The other half span had the combination of the concrete-
infill-only and tie-bar shear connection. This layout enabled the both types of shear
connection to be investigated discretely by the two flexural tests: four-point symmetric
and three-point asymmetric bending tests. The results of push-out test were used in the
design of the shear connection for the test beam.
The four-point symmetric bending test created a bending moment profile that was
similar to that of the uniformly distributed loading (UDL). The concrete-infill-only
shear connection was particularly investigated in this test phase. The four-point bending
test was carried out without the plastic failure, only up to the plastification of deflection
at the mid-span. This was to preserve the stiffness of the beam specimen, so that the
next flexural test, three-point asymmetric bending test, could be carried out.
The three-point asymmetric bending test created a high shear within the shorter
shear span, which had the combination of the concrete-infill-only and tie-bar shear
connection. This flexural test was carried out to the ultimate failure. The additional tie-
bar was expected to provide an enhanced composite action.
The behaviour of the shear connection in the flexural tests was compared with that
in the push-out tests. The results of the flexural tests were analysed to determine the
degree of shear connection and the contribution of the shear connection to the
composite action.
1.4.3 Analytical study
The results of the push-out tests and flexural tests were analysed. Design methods for
the shear connection and shallow cellular floor beams were developed, as listed in Table
1.1. Methodologies of the analytical studies were summarised in the following sections.
Design methods
Push-out tests Design method for shear resistance of the shear connection
Flexural tests
Design method for deflection check at the serviceability limit
state (SLS)
Design method for moment resistance at the ultimate limit
state (ULS)
Table 1.1 Design methods developed in the analytical studies

Chapter 1 Introduction
26
1.4.3.1 Analytical study of push-out test results
Base on the failure mechanism of the shear connection, a method for determining the
shear resistance of the shear connection was proposed first. The test results were
analysed to establish the formula for the design method. The calculated results using the
established the formula was then verified with the test results, to conclude the design
method for shear resistance of the shear connection.
1.4.3.2 Analysis of flexural tests
The results of the flexural tests were analysed to develop design methods at the
serviceability limit state (SLS) and ultimate limit state (ULS). The flexural tests
demonstrated the effect of partial shear connection on the deflections of the test beam.
The calculated deflections using the method for deflection check specified in both
BS5950 and EC4 were about 50% lower than the test deflections. Based on the
principles of the linear partial interaction method, the method specified in BS5950 and
EC4 were modified. The modified method for deflection check of the shallow cellular
floor beams was then verified with the test deflections and further calculations.
The degrees of shear connection for the both flexural tests were determined in the
back analysis using the plastic stress block with the measured material properties. An
optimum cross section of the shallow cellular floor beams was concluded for calculating
the moment resistance. By combining the findings of the push-out tests and flexural
tests, a design method for moment resistance of the shallow cellular floor beams was
developed which was compatible with the conventional design methods specified in
both BS5950 and Eurocode 4.
1.4.4 Finite Element Analysis
Because of a complex three-dimensional stress-strain state of the concrete infill element,
it is very difficult to analyse it using mathematical models. Hence, Finite Element
Analysis (FEA) was carried out to perform a parametric study on the concrete-infill-
only shear connection. Results of the parametric study further verify the developed
design method for shear resistance of the shear connection. The variables investigated in
the FEA parametric study were the diameter of the web opening and concrete strength.

Chapter 1 Introduction
27
1.5 Objectives
In order to investigate the shear transferring mechanism of the composite shallow
cellular floor beams, with the aims of providing information on the behaviour and shear
resisting properties of the shear connection, the following objectives are carried out:
1. To carry out a literature review on topics of the composite floor beams and shear
connection, with emphasis on experimental studies, i.e. push-out tests and
flexural tests;
2. To design and carry out two series of push-out tests. The first series of the tests
was to investigate the four types of the shear connection: concrete-infill-only,
tie-bar, ducting and web-welded stud shear connection. The recommendations
of the first series of the tests were used to design the second series of the tests
which was to further investigate the concrete-infill-only and tie-bar shear
connection with the effects of loading cycles;
3. To carry out two flexural tests, four-point symmetric and three-point asymmetric
bending tests, to investigate the flexural behaviour of the shallow cellular floor
beams, and to investigate the concrete-infill-only and tie-bar shear connection
when subject to bending load;
4. To perform analysis on results of the push-out tests and flexural tests, with the
aims to develop design methods for the shear connection and shallow cellular
floor beams;
5. To carry out a FEA parametric study on the shear connection to further verify
the developed design method for shear resistance of the shear connection.
1.6 Aims
The experimental and analytical studies were carried out to investigate the unique shear
transferring mechanism of the shallow cellular floor beams with the aims of:
Providing information on behaviour and shear resisting properties of the unique
shear connection;
Achieving better understanding towards failure mechanism of the shear
connection, which leads to improvements for the shear connection;
Developing design methods for the shear connection and shallow cellular floor
beams;
Advancing the method of shear connection in shallow floor beam construction.

Chapter 1 Introduction
28
1.7 Structures of the thesis
Chapter 1 Introduction
Presented the background information of the composite shallow cellular
floor beams and shear connection. The methodologies of the
investigations with the objectives and aims were also emphasized.
Chapter 2 Literature review
Publications were reviewed mainly on the shear connection and
composite floor beams. Emphasis was given to the investigations of the
push-out tests and flexural tests. The reviewed composite floor beams
were similar or have similarities to the shallow cellular floor beams. The
review extended to the shear connection other than the headed shear
studs.
Chapter 3 Push-out test series-I
Presented the investigations on four types of the shear connection used
for the shallow cellular floor beams. The test specimens had variables in
the diameter of the web opening and concrete strength. The relationship
between the shear resistance of the shear connection and the diameter of
web opening, also the concrete strength were studied. The behaviour and
failure mechanism of the shear connection were particularly analysed.
Chapter 4 Push-out test series-II
The concrete-infill-only and tie-bar shear connection were further
investigated in push-out test series-II, based on the recommendations of
the push-out test series-I. Loading cycles were introduced into this test
series. Its effects on the shear connection were examined.
Chapter 5 Analytical study and Finite Element Analysis of the shear connection
The results of the push-out tests were analysed. A design method for
shear resistance of the shear connection was developed. Because of the
complex stress state of the concrete infill element, a parametric study was

Chapter 1 Introduction
29
carried out using the FEA, which further verified the developed shear
resistance design method.
Chapter 6 Flexural tests of composite shallow cellular floor beam
A full-scale specimen of the composite shallow cellular floor beam was
investigated in two flexural tests: four-point symmetric and three-point
asymmetric bending tests. Composite behaviour and flexural properties
of the beam was studied. The concrete-infill-only and tie-bar shear
connection were investigated in the flexural tests. Behaviour and shear
performance of the shear connection were compared with that in the
push-out tests.
Chapter 7 Analysis of the flexural tests
The results of the flexural tests were analysed. Two design methods were
developed for the composite shallow cellular floor beams at the
serviceability limit state (SLS) and ultimate limit states (ULS). The
modified method for deflection check at the SLS was concluded based on
the principle of the conventional deflection check method, which
included the effect of partial shear connection. The design method for
moment resistance at the ULS was compatible with the design methods
of BS5950 and EC4 and implemented the developed shear resistance
design method for the shear connection.
Chapter 8 Conclusions and recommendations
Findings of the push-out tests and flexural tests for the shear connection
and the composite shallow cellular floor beams were summarised,
together with the developed design methods. The recommendations were
made in the areas of: improvement for the shear connection and future
research topics.

Chapter 2 Literature review
30
Chapter 2 Literature review
In the context of investigating the shear connection of the shallow cellular floor beams,
this chapter presents a review of publications about the slim-floor beams, shear
connection and experimental investigations. Particular emphasis was given to
experimental investigations, i.e. push-out tests and flexural bending tests. The current
design codes of practice were also discussed.
2.1 Introduction
The shear connection is one of the fundamental components of a composite member. Its
stiffness and capacity are primarily dependent on the performance of the shear
connection. The shear connection of the shallow cellular floor beams are new types of
shear connection formed by the web openings of the beam. The shear connection has
not been investigated previously. A literature review on slim-floor beams, headed shear
studs and other types of shear connection will nonetheless provide guidance for
investigating the shear connection and the composite shallow cellular floor beams.
There are three main sections in this literature review: (1) slim-floor beams, (2)
shear connection and push-out tests and (3) flexural composite beam tests.
2.2 Slim-floor beams
The slim-floor construction has become popular throughout Europe in recent years, as
the concrete slabs are within the structural depth of the steel beam, thus reducing the
depth of the floor construction. Hicks (2003) reviews the various composite floor beams
developed for steel frame buildings: the composite downstand beam, the Slimflor beam
and Slimdek beam. The span, structural depth and method of composite action of these
composite beams are compared, and the comparison is summarised in Table 2.1. The
optimum spans of the slim-floor construction are in the region of 6-8m. The principle
benefits of the slim-floor construction are the elimination of downstand beams, leading
to a flat or ribbed floor of minimum depth and the requirement for less fire protection.

Chapter 2 Literature review
31
Lawson et al (1999) briefly review other forms of the slim-floor constructions, as
shown in Figure 2.1. The ‘integrated beam’ construction is the generic title of the slim-
floor construction used in continental Europe: ‘poutre à talon’ in France, or
‘Flachdecken mit integrierten Stahltragern’ in Germany. This publication states that the
design of the slim-floor (or integrated) beam complies with the principle rules of
Eurocodes 3 and 4, and the design of all forms of the composite slabs is covered by the
principles and application rules of Eurocode 4.
Figure 2.1 Various types of slim-floor or integrated beams (Lawson et al 1999)
Span Overall Depth
Method of
Composite Action
Composite
downstand beam > 15m
steel beam + 120 to
160mm slab Headed studs
Slimflor beam 5-10m 280-320mm Headed studs
Slimdek beam
(ASB) 6-7.5m* 310-340mm*
embossment on top
flange
* Lawson et al (1997)
Table 2.1 General comparisons between different types of composite beam
2.2.1 The Slimflor beam
The Slimflor beam consists of a Universal Column (UC) section with a plate welded to
its bottom flange, as shown in Figure 2.2; the plate supports the floor slabs directly.
Mullett (1998) covers the general characteristics of Slimflor beams. The moment
resistance of Slimflor beams can be determined based on two main categories: non-
composite and composite sections. Design formulas of Slimflor beams are also
discussed. Mullett (1992) presents design guidance for Slimflor beams using hollow
core precast units. The design guidance outlined is in accordance with the BS5950: Part
1: 1990 and worked examples are also included. Mullett and Lawson (1993) present

Chapter 2 Literature review
32
design guidance on Slimflor beams using profiled deep decking. Design tables and
worked examples are also included.
(a) (b)
Figure 2.2 (a) Cross section of the Slimflor beam with precast units (courtesy of Precast
Floor Federation); (b) The Slimflor beam with deep decking (Lawson et al 1999)
Slimflor beams using deep profile decking were experimentally investigated by
Mullett and Lawson (1993), Lu and Makelainen (1995), Queiroz et al (1998), Chen et al
(2002), Wang et al (2009) and Yang et al (2010). Slimflor beams using precast floor
units were investigated by Bode et al (Dorka and Stengel) (1996) and Hegger et al
(2009).
The results of full-scale Slimflor beam tests carried out at City University London
are discussed by Mullett (1998). The test specimen had a span of 7.5m with an overall
depth of 300mm, and consists of original CF210 deep decking. No shear connection
were provided in the specimen. The four loading points simulated the uniformly
distributed load. The test was discontinued at the total load of 1016kN with mid-span
deflection of 150mm (span/50). The maximum bending moment was 925kNm, which is
1.68 of the capacity of bare steel. This increase in moment capacity due to composite
action without shear connection has lead to the development of the Asymmetric
Slimflor Beam (ASB).
Wang et al (2009) present experimental investigations on flexural behaviour of
two Slimflor beams using deep decking with fixed end connection to a column frame.
The two specimens span over 6m with an overall depth of 290mm. The width of the
concrete slab is 0.75m. One of the specimens has a higher reinforcement ratio, which
has no influence on the stiffness but induces a slight higher failure load, which is 476kN
compared with 446kN of its counterpart. A formula for moment capacity (Mc,hog) in the
hogging moment region is proposed, together with an existing formula for the sagging
moment (Mc,sag). The failure load (F) of the Slimflor frame beams (span of L) is derived
as Eqn. 2.1 and verified with test results.

Chapter 2 Literature review
33
L
MMF
hogcsagc )(4 ,, (2.1)
Hegger et al (2009) present four full-scale tests carried out on continuous two-
span floor systems (6m x 10m) consisting of 10 slabs. In the middle of the two-span
system, the slabs were supported by a Slimflor beam. The tests investigated the load
bearing behaviour of Slimflor beams using prestressed hollow core slabs. The
conclusions are that large deformations due to plastification of the supporting beam will
cause premature failure of the slabs and that 60-70% of the shear strength of the slabs if
rigid supported can be utilised.
2.2.2 The Asymmetric Slimflor Beam (ASB)
The Asymmetric Slimflor Beam (ASB) is a rolled section with a narrow top flange. The
welding of an additional plate is not required. Lawson et al (1997) discuss the benefits
of using ASB sections and its design procedures, which are in accordance with BS5950:
Parts 1 & 3. The effective width of floor slabs is suggested as beam span/8 (or half of
the value for conventional composite design in BS5950: Part 3. This is to avoid over-
estimating the degree of composite action. The publication presents two full-scale tests
on 280ASB and 300ASB composite beams using deep decking. Both specimens have a
span of 7.5m and a width of 1m (span/8). Full shear connection is demonstrated, which
is partly due to the shear-bond action, as illustrated in Figure 2.3. Design shear-bond
strength of 0.6N/mm2 is concluded. The failure moments of 280ASB and 300ASB beam
specimens are 790 and 956kNm respectively.
Lawson et al (1999) review the design principles of both the Slimflor and Slimdek
constructions in accordance with Eurocodes 3 and 4. Three full-scale tests on ASB
composite beams are presented. Two of the tests are also presented in Lawson et al
(1997) previously reviewed. The specimen of the other test has the same span of 7.5m,
but with a light steel section (280ASB/100). The major differences to the other two
beam specimens are the slab width of 2m and a series of elongated web openings
(160mm x 240mm). However, similar conclusions are drawn from all three tests. The
plastic moment resistance (Mpl,Rd,o) of a composite ASB section with web openings is
concluded as Eqn. 2.2, where Mpl,Rd,c is the plastic moment of regular composite ASB;
do is the opening depth (do<160mm) and d is the depth of web post.
)4.01(,,,,d
dMM o
cRdploRdpl (2.2)

Chapter 2 Literature review
34
Lawson et al (1999) also present a major load test on a two-bay (6m x 6m)
Slimdek floor system, using 280ASB/100 beams and 300mm square RHS edge beams
with a 300mm-deep composite slab in between. The results provide more information
on the serviceability performance.
Figure 2.3 (a): Shear bond transfer around the internal surface of the ASB section;
(b): Elastic shear transfer along the beam subject to UDL (Lawson et al 1997)
Rackham et al (2006) present guidance on the design of ASB using precast
concrete hollow core slabs, covering two types of construction: with or without concrete
structural topping. Practical guidance is given on tolerances that affect the bearing of the
PC units and on the end preparation which provides clearance for the concrete
encasement.
2.2.3 ITECH composite beam
The iTECH beam, shown in Figure 2.4 (a), is a new composite floor beam system
developed by a Korean research group in 2002. The asymmetric steel section is
fabricated by welding a top plate on to a bottom tee cut with cells of half hexagon
pattern. Non-structural channels are fitted on the bottom flange supporting the decking.
Both sides of the web are filled with in-situ concrete. Shear connection are not used.
The composite action is provided by the bond strength at the interface between the steel
beam and concrete slab, and by the bearing strength of the concrete passing through the
openings. Ju et al (2003) and Ju et al (2009) investigated the flexural behaviour of the
iTECH beam by carrying out full-scale composite beam tests. A slim-floor beam and a
bare steel beam were also tested for comparison. The span of the specimens was 5m and

Chapter 2 Literature review
35
the span-to depth ratio of the composite specimens was 5.35. The ultimate strength of
the iTECH beam exceeded the design value. Complete composite action and partial
composite action was demonstrated before the yield and after the yield respectively. The
bare steel beam failed when the top flange within the web openings buckling. Hence,
the top flange is the critical member at the construction stage.
Ju et al (2005) present an experimental investigation on the shear strength of the
iTECH beam. Four composite specimens with a short span of 1m were tested to
determine the vertical shear contribution of the steel web, inner concrete panel and outer
concrete panel. The results show that shear stirrup has a slight contribution to the
vertical shear strength. However, for safety and simplicity purposes, the outer concrete
panel is excluded in the proposed design method, which includes only the inner concrete
panel and steel web, as illustrated in Figure 2.4 (b). Ju at al (2004) also investigated the
behaviour of the moment resisting connection at the joint between an iTECH beam and
a reinforced concrete column.
(a) (b)
Figure 2.4 (a) Schematic of the iTECH beam (Ju et al 2004); (b) Design vertical shear
force components (Ju et al 2005)
2.3 Shear connection
Headed shear studs have been extensively investigated since their initial use as shear
connection in the 1950s. The current codes of practice provide detailed specifications on
the use and design of headed studs. Other types of shear connection have also been
developed for particular constructions. Publications for both headed shear studs and
other types of shear connection will be reviewed, with emphasis on experimental
investigations or push-out tests. Codes of practice will also be discussed.

Chapter 2 Literature review
36
2.3.1 Codes of practice
Eurocode 4 (EN1994-1-1: 2004) requires that the ultimate tensile strength of headed
studs, fu, should not be greater than 500N/mm2 for studs used in solid slabs and concrete
encasement, and 450N/mm2 for studs used with profiled steel decking. The design shear
resistance (PRd) of a headed shear stud used in a solid slab and concrete encasement can
be calculated using the following formulas given in the Eurocode 4, where fu is the
specified ultimate strength of the steel, d is the diameter of the stud, γv is the partial
factor (1.25), fck is the concrete cylinder compressive strength, Ecm is the elastic
modulus of concrete, and hsc is the height of the stud.
V
U
Rd
dfP
4/8.0 2
(2.3)
V
cmck
Rd
EfdP
229.0 (whichever is smaller)
British Standard BS5950-3.1: 1990 also provides detailed specifications for
headed shear studs in terms of dimensions and spacing. Their design shear resistance is
given as a value in BS5950, with corresponding stud dimensions and concrete strength,
as illustrated in Table 2.2.
Table 2.2 Characteristic shear resistance of the headed studs (BS5950-3.1: 1990)
The American Institute of Steel Construction (AISC 1994) provides a formula for
calculating the ultimate strength of headed studs (Qu), Eqn. 2.4, where Asc is the stud
cross-section area (mm2), fc’ is the concrete cylinder compressive strength (MPa), Ec is
the elastic modulus of concrete (MPa), and Fu is the specified tensile strength of the stud
(MPa). The shear strength obtained according to AISC is about 40% higher than that of
Eurocode 4 (Johnson (2008)).
uscccscu FAEfAQ '5.0 (2.4)

Chapter 2 Literature review
37
2.3.2 Headed stud shear connection
Since the initial use of headed studs as shear connection in the 1950s (Davies (1975)), it
has become the most common type of shear connection in both bridge and building
construction. Many investigations of headed studs have been carried out. This review
focuses on experimental studies of the studs used in both solid slabs and profiled
decking.
2.3.2.1 Headed studs used in solid slabs
Chinn (1965) carried out 10 push-out tests using headed studs of 1/2,
5/8,
3/4 and
7/8 in.
(13, 16, 19 and 22mm) diameter. The lengths of the stud are approximately four times
its diameter. Flanges of the steel section were greased. Shear failure mode was
demonstrated by studs of all diameters except the 22mm, which demonstrated slab
cracking. The ultimate strength of the studs in push-out tests was found 18% to 43%
higher than their direct shear strength. It was concluded that concrete strength had no
effect on the ultimate strength of the studs (Qu), as demonstrated in the concluded
formula, Eqn. 2.5, where d is the stud diameter. However, this was later disapproved by
conclusions of other investigations, i.e. Ollgaard et al (1971) and Hawkins (1973).
766.122.39 dQu (2.5)
Slutter and Driscoll (1965) present nine push-out tests using solid slabs, 12
composite beam (span of 4.5m) tests, and one two-span continuous beam test. The
conclusions are that the ultimate flexural strength of the beam is related to the ultimate
strength of the stud shear connection, and that the stud’s diameter (ds) and concrete
cylinder compressive strength (fc’) directly govern the ultimate strength of the stud (qu)
as:
'2930 csu fdq (2.6)
Davies (1967) studied the spacing and layout pattern of the studs by conducting
20 half-scale push-out tests using solid slabs. The studs were 10mm in diameter and
50mm in height. The results demonstrated that two studs per flange placed
perpendicular to the direction of load had a 25% higher failure load than that of the
studs placed parallel to the direction of load, and the ultimate strength of the studs
varied linearly with the longitudinal spacing of the studs.
Goble (1968) reported an investigation into the behaviour of thin flange push-out
specimens using 1/2,
5/8 and
3/4 in. (13, 16 and 19mm) diameter studs. In total, 41

Chapter 2 Literature review
38
specimens were tested. It was found that the shift in failure mode from stud shearing to
flange full-out occurred at a stud diameter-to-flange thickness ratio of 2.7. The studs of
the thinner flange specimens were more flexible in the lower load ranges; and there was
no difference in ductility between the two failure modes. The ultimate strength of studs
concluded by Goble (1968) is very close to the conclusion of Slutter and Driscoll (1965)
only with a different coefficient, namely 882 rather than the 930 of Eqn. 2.6.
Ollgaard et al (1971) carried out 48 push-out tests on headed studs of 5/8 and
3/4 in.
(16 and 19mm) diameter. Normal and lightweight concrete were used. In total, seven
parameters were studied: compressive and tensile strength of concrete, stud diameter,
number of studs per slab, elastic modulus of concrete, type of aggregate, and density of
concrete. The test results demonstrated that the strength of studs was more influenced
by the concrete compressive strength and elastic modulus than by the tensile strength
and density of concrete. Studs in both types of concrete showed considerable
deformation after the ultimate loads were reached. The strength of studs in the
lightweight concrete was 15% to 25% lower than that in the normal concrete. Three
failure modes were observed: stud shearing, concrete failure and a combination of both.
A formula for the ultimate strength of the stud (Qu), Eqn. 2.7, was developed. Its
simplified formula, Eqn. 2.4, achieved by rounding the exponents, was adopted by the
AISC specifications. Moreover, the load-slip behaviour of the studs was mathematically
expressed in Eqn. 2.8, where Q is the load (kip) and Δ is the slip (in.).
44.03.0'106.1 ccsu EfAQ (2.7)
52
181 eQQ u (2.8)
Hawkins (1973) conducted 47 push-out tests using solid slabs. The different
parameters were: stud steel (cold formed and hot forged), stud diameter (19 and 22mm),
concrete type (normal and lightweight), and concrete strength. The results show that
concrete strength is the prime factor governing the capacity of studs for a given slip
value, and that the properties of stud steel have a less significant effect. The important
property of stud steel is its ultimate tensile strength rather than its yield strength. The
other variables have considerably less influence on the capacity of studs than the
strengths of concrete and steel. The author states that the behaviour of studs at low loads
can be predicted by modelling studs as a flexible elastic dowel on an elastic foundation.
For slips of more than 0.02 in. and for studs with a height/diameter ratio greater than
4.0, the shear stress can be predicted by empirical expression. Four distinctive failure

Chapter 2 Literature review
39
modes were observed: shearing of studs, punch-out of studs, pull-out of studs, and
cracking of the unreinforced slab.
Johnson and Oehlers (1981) present statistical analyses of results of 125 push-out
tests from 11 sources, 101 new push-out tests and 4 composite beam tests. The
statistical analyses conclude that the strength of studs in push-out tests is strongly
influenced by the width of the slabs, and that little of the scatter found in the results is
due to experimental error. One of the parameters in the new tests is the height of the
weld collar. The results show that a weld collar of 1.34ds in diameter and 0.25ds in
height resists about 70% of the total shear, where ds is the shank diameter. The shank
failure strength of a stud increases continuously as the height of weld collar increases
from 0 to 0.35ds. The overall conclusions are that the stiffness and strength of studs are
highest when shank failure occurs and that it is possible to base the spacing of studs on
shank failure loads whenever sufficient breadth of concrete slab can be provided. The
minimum breadth is about twice the longitudinal spacing of the studs. Whether the
maximum shear flow can be transferred to the slab without splitting the concrete
depends on the layout of the studs. They should be spread as uniformly as practicable
over the whole available width of the steel flange, and should never be located in a
single straight line above the web.
2.3.2.2 Headed studs used with profiled decking
Grant et al (1977) present the results of 17 composite beam tests using profiled steel
decking and 3/4 in. (19mm) diameter studs. The variables considered were yield strength
of the steel beam, geometry of steel decking and degree of partial shear connection. The
specimens have spans of 24ft or 32ft (7.3m or 9.8m), with a constant thickness of 2.5 in.
(64mm) for the solid part of the slabs. Four points loading was used for all beam tests.
Monotonic load was applied up to the estimated working load, and then cycled 10 times.
The results were analysed in conjunction with 58 additional tests conducted by other
investigators, treating variables such as weight and strength of concrete, diameter and
height of studs, type of reinforcement, and type of loading. It was concluded that the
flexural capacity of a composite beam with profiled steel decking could be more
accurately and conservatively estimated if the slab force was considered to act at the
mid-depth of the solid portion above the ribs, rather than at the centroid of the concrete
stress block. The capacity of a stud in ribs of composite beams with profiled steel
decking (Qrib) could be determined from Eqn. 2.9, where N is the number of studs in a

Chapter 2 Literature review
40
rib, H and h is the height of the studs and rib respectively, W is the average rib width,
and Qsol is the strength of the stud in a flat soffit slab (Eqn. 2.4).
solsolrib QQh
W
h
hH
NQ
85.0 (2.9)
Easterling et al (1993) state that one of the important parameters identified in
some of the studies to date is the position of the studs relative to the stiffener in the
bottom flange of the deck. Most decks have a stiffener in the middle of the bottom
flange, thus making it necessary to weld the stud off centre. This publication presents a
research project conducted at Virginia Tech to evaluate the strong vs. weak stud
position issue, as illustrated in Figure 2.5 (a). Four composite beam tests and eight push-
out tests were carried out. All beam specimens had a span of 30ft (9.1m), a width of
81in. (2m), and a total of 12 studs of 3/4 in. (19mm) diameter. The only difference in
specimens was the position of the studs. The push-out test specimens were constructed
using the same deck and studs used in the beam tests. Four specimens had studs in
strong position and four specimens had studs in weak position. The behaviour of the
studs was distinctively different between the strong and weak positions. The strong
position studs failed by developing concrete shear cones or by shearing off the shank
and weak position studs failed by punching through the deck rib. The response of the
studs in the weak position, in terms of load vs. slip, was more ductile than that of the
studs in the strong position, as shown in Figure 2.5 (b). The results of both tests, beam
tests and push-out tests, were consistent with other studies to date, which showed values
calculated using Eqn. 2.9 (Grant et al 1977) were higher than measured values.
Modifications of Eqn. 2.9 were not proposed by the author, as further evaluation was
required.
(a) (b)
Figure 2.5 (a) Weak and strong positions of studs; (b) Load-slip curves of the studs in
the strong and weak positions (Easterling et al 1993)

Chapter 2 Literature review
41
Johnson (2008) proposed a simple modification to the current formula in
ANSI/AISC 360-05 for calculating stud strength in a trough of transverse decking. Due
to the increase in yield strength of the profiled decking which was reported in Bradford
et al (2006), the predication using the ANSI/AISC 360-05, Eqn. 2.10, was
unconservative compared with 187 test results. The proposed modification replaces the
term of AscFu with ccsc EfA '5.0 . Lower predictions are obtained. In Eqn. 2.10, where
Asc and Fu is the cross-section area and tensile strength of the stud respectively, Rg is a
factor which depends on the number of studs in a trough, and Rp is a factor which
depends on the distance between the stud in the weak position and the deck.
)( uscpgn FARRQ (2.10)
2.3.3 Other types of shear connection
Apart from headed studs shear connection, there are a few other types of shear
connection developed for particular constructions with specific properties. This section
reviews the publications on the shear connection which are similar to those used in the
shallow cellular floor beams. The reviewed shear connection consisted of: horizontal
studs, concrete dowels in Deltabeam and composite bridge girders, Perfobond ribs, and
Crestbond rib shear connection.
2.3.3.1 Horizontally lying shear studs
Kuhlmann and Breuninger (2000) and Kuhlmann and Kürschner (2004) present studies
of horizontally lying studs shear connection, where the studs are welded on the web post
of a composite girder or slim-floor tee sections, as shown in Figure 2.6. This type of
shear connection eliminates the less efficient steel top flange.
Kuhlmann and Breuninger (2000) present an investigation into lying studs subject
to longitudinal shear. In total, 50 push-out tests were carried out. Failure of these lying
studs was mainly due to the splitting of the concrete. The splitting action of the tension
force creates cracks, as illustrated in Figure 2.7 (a). Hence, vertical stirrups are used to
prevent the concrete from expanding. The results show that the most important
parameters for the shear strength of the lying studs are: concrete compressive strength,
stud diameter, the distance from the studs to the top surface of concrete slab, and the
amount and arrangement of reinforcement. The characteristic slip value of the lying
studs at failure is 17.4mm, which is much higher than the specified value of 6mm in

Chapter 2 Literature review
42
Eurocode 4 (EN1994-1-1: 2004) which is the classification for a ductile shear
connection.
In continuation of the previous paper, Kuhlmann and Kürschner (2004) further
studied lying studs subjected to vertical shear, a combination of vertical and
longitudinal shear, and cyclic longitudinal shear. A total of 19 cyclic push-out tests
showed that a higher peak load close to static resistance causes a decrease of fatigue
life, and that a rise of concrete strength leads to a slight increase of fatigue life.
However, the significant influence of the stirrup diameter could not be demonstrated.
(a) (b)
Figure 2.6 (a) Horizontal lying studs in a composite girder without top flange;
(b) Slim-floor tee section with lying studs (Kuhlmann and Breuninger 2000)
(a) (b)
Figure 2.7 (a) Lying studs subject to longitudinal shear (Kuhlmann and Breuninger
2000); (b) Concrete failure due to cyclic loading (Kuhlmann and Kürschner 2004)
2.3.3.2 Concrete dowel in Deltabeam
The Deltabeam is a type of integrated floor beam consisting of a steel boxed section
with web holes, as shown in Figure 2.8. The holes are uniformly spaced and form a
shear connection with the concrete that fills the steel box section. There are two sizes of
web opening in the Deltabeam: Ø75mm and Ø150mm. The openings have lipped edges
that project inwards.
Peltonen and Leskelä (2004) carried out 75 push-out tests investigating the
capacity of the concrete dowel using the parameters of web hole diameter, geometry of
the lip (mainly the lip depth), and concrete strength. The push-out tests, as illustrated in
Figure 2.9 (a), were designed based on a main assumption that only the concrete outside

Chapter 2 Literature review
43
of the steel box plus the concrete dowel within the lip depth are effective to the shear
resistance mechanism. Hence, there was a foil parting the concrete infill to simulate the
concrete dowel shear connection in the push-out test specimens. The tests demonstrated
the ductile load-slip behaviour of the concrete dowel, with average maximum slips of 6-
9mm. The disassembled specimens show that failure of all specimens was due to the
shearing off of the concrete dowel, as shown in Figure 2.9 (b). The depth of the lip is
the depth of the concrete dowel, and has less effect on the resistance of the 75mm
diameter web holes. The authors developed the following shear resistance model for
concrete dowel:
WctmctmR AffkP )(max (2.11)
Where fctm is the mean tensile strength of the concrete, kR(fctm) is a resistance
factor that depends on the geometry of the hole (depth and diameter), and AØw is the
area of the hole. Three sets of the kR(fctm) were concluded for both diameters.
(a) (b)
Figure 2.8 (a) Schematic of the Deltabeam; (b) Cross-section of the Deltabeam
(Peltonen and Leskelä (2004)
(a) (b)
Figure 2.9 (a) Schematic of the push-out test; (b) Failure profile of the concrete dowel
(Peltonen and Leskelä 2004)

Chapter 2 Literature review
44
2.3.3.3 Perfobond rib shear connection
The Perfobond rib shear connection, shown in Figure 2.10, was first developed by the
German firm Leonhardt, Andra and Partners as an alternative connection to eliminate
progressive slips of studs in bridges that often resulted from fatigue. The perforated
holes on the rectangular plate form a series of concrete dowels which provide
longitudinal shear resistance.
Leonhardt et al (1987) carried out a series of push-out tests with static and fatigue
loading. Perfobond ribs with two diameters of holes, 35 and 40mm, with constant
spacing of 50mm and plate thickness of 12mm, were investigated. Three types of failure
modes were observed: shearing of concrete dowels, bearing failure of concrete dowels
within the holes, and shearing of steel strips between the holes. There was virtually no
slip under static or service loading, and no fatigue problems due to dynamic loading.
The load was adequately maintained after failure. Three design equations for the
ultimate shear resistance of Perfobond rib, Vu, were developed representing the three
potential failure modes.
)3.1(4
2 '2
cuu fD
V
(shearing of concrete dowels) (2.12)
)57.8( '
cuu fDtV (bearing failure of concrete dowels) (2.13)
3
sy
su
fAV (shearing of steel strips between holes) (2.14)
Where D is the diameter of the holes (mm), fcu’ is the cube compressive strength
(Pa), t is the plate thickness (mm), As is the area of steel between adjacent holes (mm2),
and fsy is the yield stress of the steel plate (Pa). However, these equations are only valid
for a plate thickness of 12mm, and for 35 and 40mm diameter holes spaced at 50mm.
(a) (b)
Figure 2.10 (a) Details of the Perfobond rib; (b) Positioning of the Perfobond rib
(Leonhardt et al 1987)
Veldanda and Hosain (1992) carried out 56 push-out tests as a part of an
investigation to determine the feasibility of using Perfobond rib shear connection in
composite floor beams. It was found the capacity of a Perfobond rib with holes of

Chapter 2 Literature review
45
35mm diameter was equivalent to approximately five studs of 16mm diameter. An
approximately 50% increase in shear capacity of the Perfobond rib was demonstrated
with the addition of a rebar passing through the hole. A shallow rib of less than 60mm
in height was relatively ineffective. The stiffness of the Perfobond rib connection is
greater than that of the headed shear studs under service loading. The failure was
triggered by the longitudinal splitting of the floor slabs followed by the crushing of the
concrete in front of the rib.
Oguejiofor and Hosain (1992) (1) tested six composite beams to verify the push-
out test results of Veldanda and Hosain (1992). Three specimens had headed studs and
three specimens had Perfobond rib shear connection. The same ductile behaviour was
demonstrated by all specimens. The failure mode of the Perfobond rib connection in
composite beam tests was the same as that in the push-out tests, namely the longitudinal
splitting of concrete slabs. However, using more smaller Perfobond rib connection may
result in a delay of concrete crushing and a higher ultimate load.
Oguejiofor and Hosain (1992) (2) carried out 42 further push-out tests to establish
design guidelines for calculating the capacity of Perfobond rib connection. The
variables investigated were: reinforcing, positioning of the holes, number of the holes,
and concrete strength. An increase in shear capacity was demonstrated for an increase in
the spacing of the hole up to about twice the diameter of the hole. Four holes within a
375mm length rib have less capacity than that of three holes within the length. The
design formula, Eqn. 2.15, was developed, where Ac is the area of concrete in the plane
of the rib (mm), fc’ is the concrete cylinder compressive strength (Pa), Atr and fy are the
area and yield strength of the transverse reinforcement respectively, and Ahs is the total
area of concrete dowels in shear.
'' 6396.11673.16348.0 chsytrccu fAfAfAV (2.15)
The first term represents the concrete splitting, the second term represents the
degree of confinement due to the transverse reinforcement, and the third term is the
shear strength of the concrete dowels. This design formula was then twice modified by
the same authors based on further experimental and numerical investigations. The two
modified formulas, Eqn. 2.16 and 2.17 have these similar three terms; where n and d are
the number and diameter of the holes respectively, and h and t are the height and
thickness of the rib respectively.

Chapter 2 Literature review
46
'2' 871.2233.159.0 cytrccu fndfAfAV (2.16)
Oguejiofor and Hosain (1994)
'2' 31.391.05.4 cytrcu fndfAhtfV (2.17)
Oguejiofor and Hosain (1997)
Valente and Cruz (2004) investigated Perfobond rib shear connection in
lightweight concrete slabs. Four push-out tests were carried out. The specimens had
variables in concrete strength and position of transverse reinforcement. One specimen
eliminated the bearing of the rib to the slab. The dimensions of the Perfobond ribs and
concrete slabs are constant and are 375x100x13mm and 650x600x150mm respectively.
The rib has three 50mm diameter holes with 112.5mm spacing. Very small slips of 1.4-
2.2mm were demonstrated at the maximum load, where the failure occurred. The author
concluded that Perfobond rib connection could only be used with full shear connection
in lightweight concrete slabs, as the ductile of the connection was not demonstrated.
The tests results were not as good as the predicted strengths obtained using the Eqn.
2.16 or 2.17 for the Perfobond rib in normal concrete. The average difference was 60-
70%.
Ahn et al (2008) present a study of Perfobond rib shear connection under static
and cyclic loading. A total of 18 push-out tests were carried out investigating the effects
of concrete dowel, transverse rebar through rib holes, and cyclic loading. The geometry
of the Perfobond rib was 500mm in length and 129mm in height with four 55mm
diameter holes spaced at interval of 125mm. The same failure mechanisms were
demonstrated by all specimens for both loading cases, as the initial longitudinal cracks
occurred in concrete slabs on the bottom of the interface between the rib and concrete.
The average slip of specimens with and without transverse rebar in static loading tests
was 21mm and 3mm respectively. Similar slips were also obtained in cyclic loading
tests. The effect of the concrete dowel was observed as 65% of the static shear capacity
of the specimens without the transverse rebars, and the transverse rebar increased the
shear capacity about twofold. In the cyclic loading tests, the residual shear capacity of
the specimens without the rebar decreased to about 65% of the capacity in the static
tests. However, the transverse rebar had not been shown to have had an effect on the
shear capacity due to the cyclic loading.

Chapter 2 Literature review
47
2.3.3.4 Crestbond rib shear connection
The Crestbond rib shear connection, shown in Figure 2.11, has indented cuts which
provide an easier disposition of reinforcing bars. The re-entrant angles provide
resistance to longitudinal shear and transverse separation. Veríssimo et al (2006) carried
out 26 push-out tests investigating the shear capacity and ductility of the Crestbond rib
shear connection. The parameters of the specimens were: diameter of the circle
inscribed in the rib’s dent, amount of transverse reinforcement, and concrete strength.
The lengths of the ribs were 252, 315, 378, and 413mm. The heights of the ribs were 70,
81, and 93mm. The results show good load bearing capacity after the maximum load.
The shear resisting capacity of a Crestbond rib is approximately equal to four 19mm
headed shear studs. For an increase of 81% in concrete strength, there is a gain of 35%
in the shear capacity of the Crestbond rib connection. The variation in concrete strength
has a small influence on ductility when there is rebar passing through the rib.
The effect of concrete dowel is very significant, contributing to an increase of
66% in the shear capacity of the Crestbond rib. This conclusion is very similar to the
65% increase concluded by Ahn et al (2008) for the Perfobond rib connection. The
presence of the rebar in the rib increases the shear capacity by 29% and 40% for
concrete strength of C20/25 and C35/45 respectively. This conclusion is very different
with the twofold increase of shear capacity due to rebar concluded by Ahn et al (2008)
for Perfobond rib connection. The ductile behaviour of the Crestbond rib was
demonstrated with an average characteristic slip of 7-8mm. The author of this thesis
summarised that the slip stiffness and elastic shear resistance of both Crestbond rib and
Perfobond rib connection are higher than those of headed shear studs.
(a) (b)
Figure 2.11 (a) Profile of the Crestbond rib shear connection; (b) Illustration of the
push-out test (Veríssimo et al 2006)

Chapter 2 Literature review
48
2.3.3.5 Concrete dowel in composite bridge girders
Mangerig and Zapfe (2003) investigated the effects of concrete dowels in composite
bridge girders. A total of 102 push-out tests were carried out to develop a design
procedure for the concrete dowels, as shown in Figure 2.12. An additional 16 push-out
tests were performed with cyclic loading investigating the fatigue properties of the
concrete dowels. The different variables of the specimens were: geometry of the
perforation, concrete strength, and reinforcement. A further six flexural tests were
carried out on composite girders without top flange, Figure 2.12 (a). The variables of
the specimens were: span, dowel arrangement and utilization degree of the concrete
dowel.
One of the failure modes of the concrete dowel is the punch cone, as illustrated in
Figure 2.13 (a), which results from the transverse tensile stress. Its failure criterion can
be defined by applying shear stress along the surface of a regular cone. The authors
disagree with the general concept of the double shearing off of the concrete dowels
along the planes of the web. It is suggested that the shearing surfaces are not completely
parallel to the web plane, as shown in Figure 2.13 (b). The authors acknowledge that big
concrete dowels require a reduction of the shear surface. A design formula of local
pressure (or compressive) failure, as shown in Figure 2.12 (c), was developed:
V
ckwdRD fthP
17.72 (2.18)
Where hd is the height of the concrete dowel, tw is the thickness of the web, fck is
the concrete cylinder compressive strength, and γv = 1.25. The ultimate load results and
observed failure mechanisms in the composite girder tests demonstrated the effective
shear transferring mechanism of the concrete dowel.
(a) (b) (c)
Figure 2.12 (a) Top-flangeless girder with web side filing; (b) Girder with open circular
shaped plate welded on the top flange; (c) Compressed concrete in the zone of
maximum local pressure (Mangerig and Zapfe 2003)

Chapter 2 Literature review
49
(a) (b)
Figure 2.13 (a) Punch cone failure mode; (b) Bearing surface of the concrete dowel in
plane view (tw is the thickness of the web, bi is the diameter of the opening) (Mangerig
and Zapfe 2003)
Jurkiewiez and Hottier (2005) investigated a type of shear connection
incorporating a dovetail-shaped cut on the web post with horizontal bars attached, as
shown in Figure 2.14. This shear connection is similar to the Crestbond rib shear
connection, but with a bigger rib formed on the web. Its original form has a very deep
perforated cut, depicted in Figure 2.14 (a), providing a transverse passage for building
services. However, the shallow web increases the stress concentration and reduces the
vertical shear resistance. It was then modified with a shallow cut, as illustrated in Figure
2.14 (b), especially for its application in bridges. This paper presents the results of three
push-out tests and a flexural composite beam test. For simplicity of fabrication in both
tests, the rib was chosen as rectangular rather than curved shape. The results of the
push-out tests showed that the ultimate shear capacity of one rib attached with 6 rebars
of Ø16mm and 4 welded-wires of Ø10mm (depicted in Figure 2.21) was about 860kN.
The failure mode was the splitting of the slabs initiated in the middle of the rib. The slip
at maximum load was about 2-3mm, which was very similar to that of the Perfobond rib
connection. The results of the flexural composite beam test will be reviewed in Section
2.4.3.
(a) (b)
Figure 2.14 (a) Dovetail-shaped web with hollows below the slab; (b) Modified with
shallow cut (Jurkiewiez and Hottier 2005)

Chapter 2 Literature review
50
2.4 Flexural composite beam tests
The review of flexural composite beam tests will focus on tests of: slim-floor beams,
conventional downstand composite beams with web openings, and composite beams
with encased web openings. This is because all these three types of composite beam
have similarities with the shallow cellular floor beams, which consists of concrete slabs
within the structural depth of the steel section, and encased web openings.
2.4.1 Slimflor and ASB composite beam tests
Mullett (1998) presents a flexural test of a full-scale Slimflor beam. The test was briefly
reviewed in Section 2.2.1. The specimen represents a typical Slimflor beam with a deep
decking composite slab. There are holes constructed on the web post providing a
passage for short lengths of cylinder, as shown in Figure 2.15. However, the interaction
between the cylinders and the web post was not investigated in the test. Four loading
jacks were used to simulate a uniformly distributed load over the 7.5m span. Composite
action was clearly demonstrated with a 68% increase of moment resistance over the
steel section, although the specimen has no shear connection. The maximum bending
moment including self-weight was 925kNm, which was then converted into a load
intensity of 21.9kN/m2 for a typical 6m x 7.5m bay. The composite Slimflor beam
specimen could have supported an imposed load of 10.9kN/m2 compared with the
design value of 5.0kN/m2.
Figure 2.15 Illustration of the Slimflor beam test (Mullett 1998)
Lawson et al (1997) and Lawson et al (1999) present the flexural tests of the
Asymmetric Slimflor Beam (ASB). In total, three full-scale ASB beams were tested,
which were briefly reviewed in Section 2.2.2. The span of all the specimens was 7.5m.

Chapter 2 Literature review
51
The first two specimens had a slab width of 1m (or 1/8 of the span). The third specimen
had the slab width increased to 2m (or ¼ of the span). There was a series of elongated
web openings (160mm deep x 240 wide) in the third specimen, as shown in Figure 2.16.
All beam specimens were effectively subjected to a uniform distributed load applied by
four jacks. All tests were first carried out with 1000 cycles of dynamic loading between
0 and 1.2 times the calculated working load, and then tested with monotonic loading up
to the failure.
The results of the tests showed that the bending resistance of the ASB was
increased by 30-50% due to the composite action, which did not deteriorate under the
repeated loading. The actual degree of shear connection was high at 75-100%. The
back-calculation using the measured material properties showed the longitudinal shear
bond was in the range of 1.1-1.5N/mm2. Design shear bond strength of 0.6N/mm
2 was
concluded. The initial stiffness of the composite section was maintained up to 70% of
the failure load. The measured stiffness was very close to the design stiffness based on
the uncracked section. The effect of the elongated openings on the performance of the
beam was relatively small. The shear and Vierendeel bending resistance of the reduced
section were enhanced by local composite action.
Figure 2.16 Illustration of the third ASB test (Lawson et al 1999)
2.4.2 Tests of downstand composite beams with web openings
Clawson and Darwin (1982) present an experimental investigation of downstand
composite beams with rectangular web openings. Six composite beams and one steel
beam were tested. Sections of W14x34 (UB356x171x51), W18x45 (UB457x191x67)
and W18x46 (UB457x152x67) were used. The rectangular web openings were

Chapter 2 Literature review
52
concentric to the centroid of all steel sections, as shown in Figure 2.17. Opening sizes
were fixed; their depths were equal to 60% of the depth of the steel beam, and their
lengths were equal to twice the depth of the opening (the opening lengths were between
406mm and 550mm). The concrete slab dimensions are identical for all composite
beams, namely 102mm thickness x 1220mm width. Full shear connection was provided
by 19mm diameter and 76mm height headed studs placed in pairs at pitches between
203mm and 380mm. Beams with high moment-shear ratios (M/V) showed little
Vierendeel effect. Beams with lower M/V ratios showed Vierendeel effect, as more
shear was transferred through the opening at failure. In all cases, the compressive strains
in the concrete remained low until well after the steel had begun to yield. The failure of
all beams was due to the failure of the concrete. Strain hardening of steel in bottom and
top tees occurred prior to the failure.
The results of the tests indicate that concrete slab significantly contributes to the
flexural and shear strength of composite beams at web openings. The nature of the
failure of composite beams with web openings is ductile. The concrete and steel exhibit
large slips prior to the failure at the web openings. It is not clear whether this has an
important effect on the strength. The M/V ratio at an opening has a pronounced effect
on the mode of failure. Beams with high M/V ratios fail by the general yielding in the
steel below the neutral axis and by the crushing in the concrete above the neutral axis.
Beams with medium to low M/V ratios fail by the formation of plastic hinges in the
bottom tee, accompanied by the diagonal tensile failure in the concrete.
Figure 2.17 Illustration of the flexural tests of downstand composite beams with
rectangular web openings (Clawson and Darwin 1982)
Redwood and Wong (1982) present an experimental investigation of the effects of
web openings on downstand composite beams with steel decking. Five composite

Chapter 2 Literature review
53
beams were tested, as illustrated in Figure 2.18. Sections of W250x22 (UB254x102x22)
and W360x51 (UB356x171x51) were used. The slabs were identical as consisted of
76mm deep steel decking with 65mm concrete cover. Shear connection was provided by
headed studs of 19mm diameter and 124mm original length. The Beam 0 was a pilot
beam providing guidance for designing the remaining beams. There is an eccentric
opening, Hole 5, in Beam 1, offsetting upward. The effect of partial shear connection
was investigated in the test of Beam 4.
Three beams with high or moderate M/V ratios (Beams 2, 3 and 4) demonstrated
flexural failure mode. Local bending of the top and bottom tees due to Vierendeel action
was visible, and became increasingly evident as the M/V ratio decreased. With low M/V
ratios (Beams 0 and 1), the Vierendeel action at the web opening dominated the failure
mode and resulted in flexural cracking of the slab. The deflection profile of Beam 1
showed large vertical displacement within the length of the opening which dominated
beam behaviour. Slips were very small in the opening region at high M/V ratios, but
were significant (between 2.8 and 3.6mm) near the opening at low M/V ratios. Large
slips were also present near the opening of Beam 4 which had partial shear connection.
In contrast, small slips were induced near the opening of Beam 3 which had a much
higher degree of shear connection.
Rib separation occurred in all cases, leading to the compressive failure of the
cover slab at medium and high M/V ratios and to almost complete separation of the slab
at low M/V ratios. Overall, these beams exhibited some similar behaviour similar to that
of the beams with solid slabs tested by Clawson and Darwin (1982). In particular, the
rib separation corresponded to the inclined cracks observed in the beams of solid slabs.
An improved estimation of the ultimate strength can be obtained by including additional
slab compressive stresses. More information about the effect of different degrees of
shear connection over the length of the opening is desirable.

Chapter 2 Literature review
54
Figure 2.18 Illustration of the flexural tests presented in Redwood and Wong (1982)
Bode et al (Stengel and Zhou) (1996) present a full scale test of a downstand
composite beam containing several large rectangular and circular web openings, as
shown in Figure 2.19. The specimen had a total span of 12.5m. The depth and width of
the composite slab was 130mm and 3m respectively. Super-Holorib decking was used
with light weight concrete. Shear connection was provided by headed studs of 22mm
diameter. Initial yielding of the steel beam occurred under web opening No.3, and
resulted in a decrease of the stiffness of the composite beam. Due to the high M/V ratio,
the behaviour of the openings was dominated by bending and a small Vierendeel effect
was observed.
The mid-span deflection at the end of the test was very large at 350mm (L/35).
However, no brittle or premature failure of the concrete slab was shown. The slip was
very small, less than 0.9mm, at the ultimate limit state. The test results were compared
with the design model which was based on the beam theory, the Vierendeel mechanism,
and the inclusion of the additional contribution of the concrete slab. The calculated
loading capacity using the design model with the measured material strength was
564kN. The ultimate load of the test was730kN.
Figure 2.19 Illustration of the flexural test presented in Bode et al (1996)

Chapter 2 Literature review
55
2.4.3 Tests of composite beams with encased web openings
Ju et al (2009) present a flexural test of the iTECH beam, which is a new composite
beam consisting of an asymmetric steel section with web openings, as illustrated in
Figure 2.4 (a). A slim-floor beam and a bare steel beam were also tested for comparison,
as shown in Figure 2.20. The span of all the specimens was 5m and the depth of all the
steel sections was 309mm. The overall depth of the iTECH and slim-floor beam was
355mm, (span-to-depth ratio of 5.35). Four-point bending with 1.2m of pure bending
region was applied to all the specimens.
The upper flange of the bare steel beam buckled without lateral torsional
deformations. A buckling length of 400mm with an effective length factor of 0.75 was
concluded for predicting the buckling load of the bare steel section. The iTECH beam
test demonstrated full composite behaviour until yielding and sufficient longitudinal
shear strength until the peak load. Buckling of its steel section was not observed before
the peak load. Wide cracks were induced within the pure bending region, as there was
no rebar placed within the web encasement. The end slip was 10mm at the peak load.
The ultimate flexural strength exceeded the calculated value by 17%. Similar behaviour
was shown by the slim-floor beam specimen, with the ultimate strength exceeding the
calculated value by 8%.
The concluded design model of longitudinal shear resistance for the iTECH beam,
consists of a bond strength at the interface between the concrete and steel of 0.6N/mm2
(concluded by Lawson et al (1997)), and a bearing strength of the concrete within the
web opening of 2x0.85fc’ (where fc’ is the concrete compressive strength).
(a)
(b)
(c)
Figure 2.20 Schematic of the flexural tests of (a): iTECH beam, (b): slim-floor beam,
and (c): bare steel beam (Ju et al 2009)

Chapter 2 Literature review
56
Jurkiewiez and Hottier (2005) present an experimental investigation of a
composite beam with an encased dovetail-shaped cut on the web post, as illustrated in
Figure 2.13. The longitudinal shear transferring is provided by the interaction between
the dovetail-shaped rib and the concrete encasement. The push-out tests carried out by
these authors were reviewed in Section 2.3.3.5. The results of the push-out tests were
used in the design of the composite beam specimen. The span and width of the
specimen was 8.5m and 800mm respectively. The shear connection (or the ribs) was
uniformly distributed along the beam, as shown in Figure 2.21. The beam specimen was
subjected to a three-point bending test. Elastic behaviour was demonstrated first and
followed by significant ductile behaviour before the peak load of 532kN was reached.
The non-elastic behaviour of the beam seemed to originate from the development of
nonlinear behaviour of the upper fibre in the concrete at the mid-span. The failure was
initiated by the crushing of the concrete. The flexural failure mode of the plastic hinge
at the loading point was observed. However, failure of the shear connection was not
observed. The slip at the end of the elastic deflection domain was 0.2mm, and 1.8mm at
the peak load. Hence, the stiffness of the shear connection was confirmed as the same as
the stiffness shown in the push-out tests.
Figure 2.21 Illustration of the flexural tests presented in Jurkiewiez and Hottier (2005)

Chapter 2 Literature review
57
2.5 Conclusion
Although, the shear transferring mechanism of the composite shallow cellular floor
beam had not been investigated previously, however the review of publications on other
types of shear connection and composite floor beams had provided many useful
guidelines. The collected information used in the later research was:
methodologies of testing and analysis;
findings of testing, i.e. characteristic behaviour, failure mechanism, shear
capacities and flexural strengths;
findings of analysis, i.e. design formulas and methods;
benefits and disadvantages of other forms of shear connection and
composite floor beams.
From the review on the shear connection, information of push-out tests was used
in the current work. The shear resistance of the conventional headed studs was
dependent on several parameters, i.e. stud diameter, concrete compressive strength and
ultimate tensile strength of stud steel. The approach for investigating the shear
connection in this thesis was first to identify the parameters that would be effective to
the shear resistance of the shear connection, and then push-out tests were designed and
carried out. The review on the shear connection similar to that used for the shallow
cellular floor beams also provided comparable information, such as the failure modes,
slip values and design formulas. For instance, the Perfobond rib shear connection had a
similar configuration with concrete dowels passing through the perforated plate. The
design formulas for the Perfobond rib shear connection were used in the later research
to verify the developed method for shear resistance of the shear connection used for the
shallow cellular floor beams.
Relevant information of flexural tests was collected in the review on the
composite floor beams. The flexural tests for the composite shallow cellular floor beam
were designed with the reference in the areas of: loading configurations, effective width
and testing arrangement. For instance, the effective width for the concrete slab of the
test specimen was designed less than the span/4 specified by both BS5950 and EC4.
This was based on the approach presented in Lawson et al (1997) to avoid over-
estimating the degree of composite action. And, the additional loading cycles were
introduced for the flexural tests to destruct the local bond between the concrete and
steel. This was similar to the testing arrangement presented in Lawson et al (1999).

Chapter 2 Literature review
58
Furthermore, the review of the publications on the downstand composite beams with
web openings had provided information for analysing the failure modes of flexural tests,
and for predicting the possible failure modes for the beam specimens when constructed
with the ribbed slab.
Overall, the literature review had collected useful information for the later
experimental and analytical studies. The links between the publications and information
used for the later research are summarised in the table below.

59
Information used for later research Publications
Code of practice for headed studs Design formulas and design table Eurocode 4, British Standard BS5950,
American Institute of Steel Construction (AISC 1994)
Push-out tests
Headed studs Parameters effect to the shear
composite and design formulas
Chinn (1965), Slutter and Driscoll (1965), Davies (1967),
Goble (1968), Ollgaard et al (1971), Hawkins (1973),
Johnson and Oehlers (1981), Grant et al (1977), Easterling
et al (1993), Johnson (2008)
Horizontal lying studs Important parameters and
characteristic slips Kuhlmann and Breuninger (2000)
Concrete dowel in
Deltabeam
Load-slip behavior, slips, failure
mechanism and design formula Peltonen and Leskelä (2004)
Perfobond rib shear
connection
Parameters, contribution of additional
re-bar, failure mechanism, failure
modes and design formulas
Leonhardt et al (1987), Oguejiofor and Hosain (1992),
Veldanda and Hosain (1992)
Composite
floor beams
Slimflor beams Design methods Mullett (1992)
Asymmetric Slimflor
Beam (ASB)
Advantages, benefits and design
methods Lawson et al (1997), Rackham et al (2006)
ITECH beam Construction system Ju et al (2003), Ju et al (2009)
Flexural tests
Slimflor beams Span, decking slab, test configuration,
test results and flexural strength Mullett (1992)
Asymmetric Slimflor
Beam (ASB)
Effective width, decking slab, loading
procedures, composite action and
failure mode
Lawson et al (1997), Lawson et al (1999)
Downstand composite
beams with
rectangular web
openings
Solid slab, decking slab and failure
modes Clawson and Darwin (1982), Redwood and Wong (1982)
Table 2.3 Links between the publications and information used in the later research

Chapter 3 Push-out test series-I
60
Chapter 3 Push-out test series-I
Push-out tests investigate the shear connection by applying direct longitudinal shear
force. The shear connection of the shallow cellular floor beams is different with the
conventional headed shear studs, formed uniquely by the web openings. Four types of
the unique shear connection were studied in the push-out test series-I, i.e. concrete-
infill-only, tie-bar, ducting and web-welded stud shear connection. The results of the
push-out tests were evaluated. Particular emphasis was given to the slip behaviours and
failure mechanism of the shear connection with the aim of optimizing and improving
the design details. The shear resistance of the shear connection will be further analysed
in Chapter 5 to develop a shear resistance design method.
3.1 Introduction
The push-out test series-I had 16 full-scale specimens investigating the concrete-infill-
only, tie-bar, ducting and web-welded stud shear connection. The test specimens were
designed to represent the actual configurations of the shear connection in the
construction practice. The design principle was that the shear connection of the test
specimens was subjected to the direct longitudinal shear force. Hence, the shear
resisting capacity and load-slip behaviour of the shear connection were obtained. Set up
and procedures of the push-out tests were carried out to create the desired static loading
conditions and to be in compliance with the specifications of Eurocode 4.
In order to provide information on factors that influence the shear resisting
capacity of the shear connection, the push-out tests specimens were designed to have
two types of variables: the diameter of the web openings and concrete strength. There
were two sizes of the web openings: Ø150mm and Ø200mm. This enabled the study of
the relationship between the web opening diameter and shear resisting capacity of the
shear connection. Two types of concrete were used to cast the slabs, i.e. the normal
concrete and fibre-reinforced concrete. This enabled the study of the relationship
between the concrete strengths and shear resisting capacity of the shear connection.

Chapter 3 Push-out test series-I
61
The push-out tests were carried out by applying monotonic loading up to the
ultimate failure of the shear connection. Measurements of the longitudinal slip and
transverse separation were obtained.
3.2 Test specimens
The push-out test specimens consisted of a steel section and concrete slabs flush with
the steel flanges, as depicted in Figure 3.1. There were three openings fabricated on the
web post of the steel section. Concrete infill passed through these web openings
connecting the concrete slabs on both sides of the web post, creating the actual
configuration of the shear connection. The design philosophy for the test specimens was
to suitably represent the shear connection and to avoid any undesirable variables, such
as the asymmetric steel section.
(a) (b)
Figure 3.1 (a) Steel sections of the push-out test specimen; (b) Cast specimen for the
push-out tests
3.2.1 Steel sections
The steel section of the push-out test specimen was a short universal column (UC).
Three web openings were perforated on the web post. The use of the ordinary UC
sections was to prevent eccentric loading, which might be created if the actual
asymmetric steel section for the shallow cellular floor beams was used.
In order to study the relationship between the shear resisting capacity of the shear
connection and diameter of the web opening, the steel sections were designed to have
two diameters of the web openings. The web openings of Ø150mm and Ø200mm were
perforated on the sections of 254x254x73UC and 305x305x97UC respectively, as
Shear
stud

Chapter 3 Push-out test series-I
62
shown in Figure 3.2. A steel plate of 20mm thick was welded on the top of the steel
section to evenly spread the load.
(a) (b)
Figure 3.2 (a) the steel section of 254x254x73UC with Ø150mm openings; (b) the steel
section of 305x305x97UC with Ø200mm openings
3.2.2 Concrete slabs
The total width of the concrete slabs of all specimens in the push-out test series-I was
600mm. This was to avoid undesirable variables due to the different width of the
concrete slab. The depth of the slabs was the same as that of the steel section, as slabs
flushed with the steel flanges.
Two types of concrete were used to cast the slabs, i.e. the normal concrete and
fibre-reinforced concrete. The purpose of using the two types of concrete was to study
the relationship between the shear resisting capacity of the shear connection and
concrete strength. The tensile strength of the fibre-reinforced concrete was higher than
that of the normal concrete with the same compressive strength. This was concluded
from the concrete strength tests carried out in this research. The concrete strength
comparison for the two types of concrete was shown in Appendix A. The details of
synthetic fibres and superplasticizer used for the fibre-reinforced concrete were
presented in Appendix A.
3.2.3 Test groups
Four types of the shear connection used for the composite shallow cellular floor beams
were investigated in the push-out test series-I. There were four test groups representing
each type of the shear connection, i.e. concrete-infill-only, tie-bar, ducting and web-

Chapter 3 Push-out test series-I
63
welded stud shear connection. Each test group had four push-out test specimens. The
variable parameters of the test specimens and their labels are summarised in Table 3.1.
Test Group Specimen No. Web Opening Concrete Type
T1, T2, T3, T4*
T1-A-N Ø150mm (A)
Normal (N)
T1-A-F Fibre-reinforced (F)
T1-B-N Ø200mm (B)
Normal (N)
T1-B-F Fibre-reinforced (F)
*T1: concrete-infill-only T2: tie-bar T3: ducting T4: web-welded stud
Table 3.1 Specimen labels and variable parameters of the test groups
3.2.3.1 Specimens of test group T1, concrete-infill-only shear connection
The specimens of the test group T1 represented the concrete-infill-only shear
connection which had no other elements, i.e. tie-bar or ducting, passing through the web
openings. The in-situ concrete completely filled the web opening, resisting the
longitudinal shear force. The specimens were designed so that the load applied on the
steel section would be directly resisted by the concrete infill elements. Hence, the shear
resisting capacity and behaviour of the concrete-infill-only shear connection could be
investigated. Each specimen of the test group T1 had three concrete-infill-only shear
connection. Dimensions of the specimens are shown in the figure below.
(a) (b)

Chapter 3 Push-out test series-I
64
(c) (d)
Figure 3.3 Drawings of the T1 specimens: (a) with Ø150mm web openings, (b) with
Ø200mm web openings, (c) Schematic of the T1 specimens, (d) Cast test specimens
3.2.3.2 Specimens of test group T2, tie-bar shear connection
Tie-bar shear connection of the test group T2 represented the general practice of two
Ø12mm tie-bars passing through each web openings when the length of the tie-bars was
less than 1m (the width of the concrete slab was 600mm). The two tie-bars were
positioned close to the perimeter of the web opening, as shown in Figure 3.4. The top
tie-bar within each opening would be in direct contact with the movements of the steel
section (or slips); hence, it would show the shear failure mode.
(a) (b)

Chapter 3 Push-out test series-I
65
(c) (d)
Figure 3.4 Drawings of the T2 specimens: (a) with Ø150mm web openings, (b) with
Ø200mm web openings, (c) Schematic of the T2 specimens, (d) Cast test specimens
3.2.3.3 Specimens of test group T3, ducting shear connection
The ducting shear connection of the test group T3 was designed to represent the actual
details of the shear connection used for the shallow cellular floor beams. In general, the
diameter of the ducting would be smaller than that of the web opening. Hence, the in-
situ concrete filled the voids between the ducting and web opening, creating a concrete
infill element combined with the ducting resisting the longitudinal shear force.
The Ø125mm ducting was used to pass through the Ø150mm web openings; the
Ø150mm ducting was used to pass through the Ø200mm web openings, as shown in
Figure 3.5. The ducting was formed of 0.5mm thickness galvanised steel sheet. The
ducting shear connection was expected to fail at low loads; this was due to the geometry
and thickness of the ducting, which could not provide much of the shear resistance.
Tie-bar
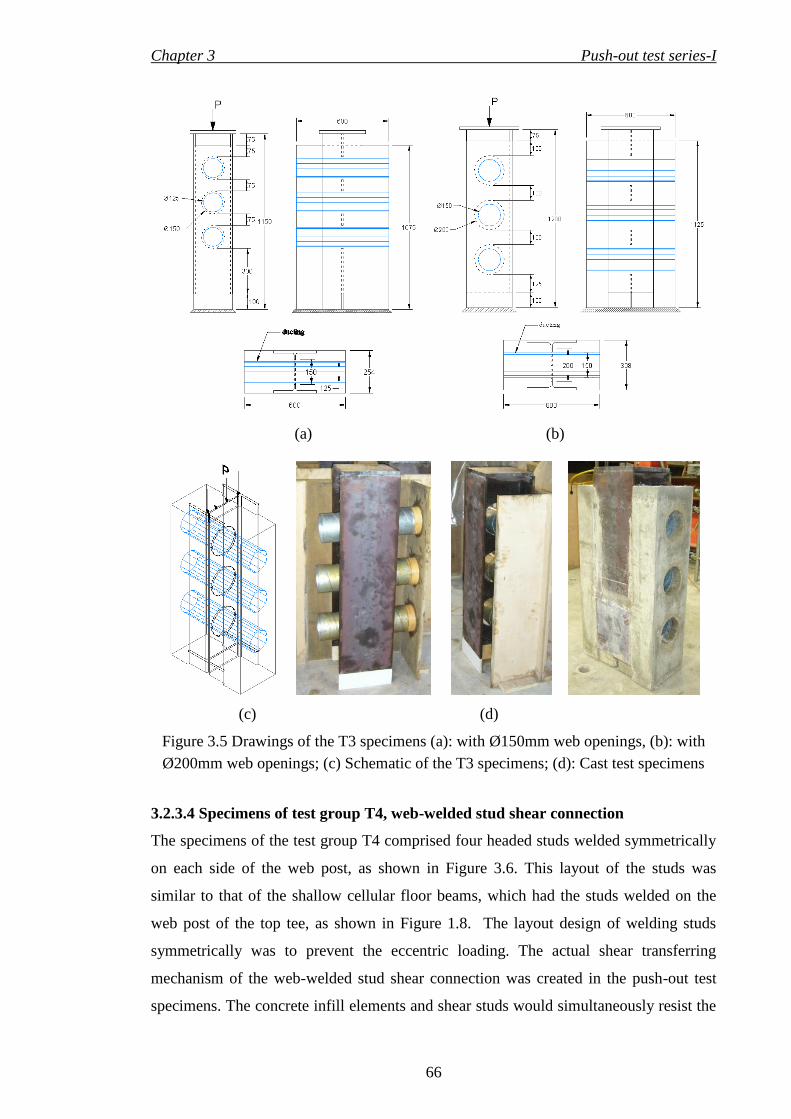
Chapter 3 Push-out test series-I
66
(a) (b)
(c) (d)
Figure 3.5 Drawings of the T3 specimens (a): with Ø150mm web openings, (b): with
Ø200mm web openings; (c) Schematic of the T3 specimens; (d): Cast test specimens
3.2.3.4 Specimens of test group T4, web-welded stud shear connection
The specimens of the test group T4 comprised four headed studs welded symmetrically
on each side of the web post, as shown in Figure 3.6. This layout of the studs was
similar to that of the shallow cellular floor beams, which had the studs welded on the
web post of the top tee, as shown in Figure 1.8. The layout design of welding studs
symmetrically was to prevent the eccentric loading. The actual shear transferring
mechanism of the web-welded stud shear connection was created in the push-out test
specimens. The concrete infill elements and shear studs would simultaneously resist the

Chapter 3 Push-out test series-I
67
longitudinal shear force. The diameter of the studs was 19mm and the after welding
height was 127mm, as shown in Figure 3.6.
(a) (b)
(c) (d)
Figure 3.6 Drawings of the T4 specimens (a): with Ø150mm web openings, (b): with
Ø200mm web openings; (c) Schematic of the T4 specimens; (d): Cast test specimens
3.2.4 Preparation and construction
The steel sections were applied with grease to prevent the development of the bond
between the concrete and steel. But, grease was not applied on the steel sections of the
T1 specimens (concrete-infill-only shear connection). This was to particularly
investigate the effect of the bond on the behaviour of the shear connection.
Stud

Chapter 3 Push-out test series-I
68
All the push-out test specimens were cast in the Structure Laboratory of the City
University London. Cubes and cylinders specimens were prepared from the same mix of
the concrete used for the push-out test specimens. All the push-out test specimens,
cubes and cylinders were cured under the same condition and were covered with wet
sacks and plastic sheets.
3.3 Set up and testing procedures
A rig of 1900kN (200ton) capacity, depicted in Figure 3.7 (a), was used for the push-out
tests. Two identical 880kN (90ton) hydraulic jacks were used to apply load. A load cell
was placed under each jack, as shown in Figure 3.7 (b). Digital dial gauges were used to
obtain the measurements of slips and separations. Four digital dial gauges were
positioned on the top of the steel section measuring the slips in the vertical direction.
Four digital dial gauges were positioned on both sides of the slabs measuring the
separations in the horizontal direction. The resolution of the digital dial gauges was
0.01mm.
(a)
Reaction platform
Push-out test
specimen
Reaction beam

Chapter 3 Push-out test series-I
69
(b)
Figure 3.7 (a): The rig for the push-out tests; (b): Set up and instrumentations of the
push-out tests
3.3.1 Testing procedures
The push-out tests were carried out in accordance with the specifications of Eurocode 4
(EN1994-1-1: 2004). The specimens were settled onto a layer of plaster (gypsum). This
was to eliminate the uneven contact between the specimens and reaction platform.
Monotonic loading was applied onto the steel sections; hence, the incremental shear
force was applied to the shear connection.
The push-out tests were load-controlled. The load increments for specimens of
each test groups are listed in Table 3.2. The specimens were tested until the destructive
failure of the shear connection. The duration of the push-out tests was 2 hour on
average, which was more than the minimum duration of 15 minutes specified in
Eurocode 4. The slips were measured until the load dropped to at least 20% below the
maximum load.
Test Group Load Increment As % of the Expected Failure Load
T1 (concrete-infill-only) 19.6kN (2ton) 2%
T2 (tie-bar) 19.6kN (2ton) 2%
T3 (ducting) 9.8kN (1ton) 3%
T4 (web-welded stud) 19.6kN (2ton) 2%
Table 3.2 Load increments of the test groups
Direction of
separation
Jack
Load cell
Dial gauge
(separations)
Dial gauge
(slips) Direction
of slip

Chapter 3 Push-out test series-I
70
3.4 Test results
Load-slip and load-separation curves were obtained from the push-out tests. The load-
slip curves represented the characteristic behaviour of the shear connection in response
to the direct longitudinal shear force. The load-separation curves represented the tie-
resisting behaviour of the shear connection. The concrete strengths of all specimens are
presented in Appendix B. The test results were evaluated with the aims of providing
information on the specific properties of the shear connection. The criteria of the
evaluation were base on Eurocode 4. The behaviour and failure mechanism of the shear
connection are particularly studied with the aims of optimizing and improving the
design details. The shear resisting capacities of the shear connection were further
analysed in Chapter 5 to establish a shear resistance design model.
3.4.1 Load-slip curves
The load-slip curves of all test groups are shown in Figures 3.8-3.11. The load shown in
these load-slip curves was the load per shear connection. Each specimen had three shear
connection, as there were three web openings fabricated on the steel section. However,
in the specimens of test group T4, each concrete infill element combined with 2.67
headed studs to form a web-welded stud shear connection, since there were eight studs
and three concrete infill elements in each specimen, as shown in Figure 3.6.
3.4.2 Load-separation curves
The load-separation curves of all test groups are shown in Figures 3.12-3.15. The load
shown in the load-separation curves was the load per shear connection. The scales of the
load-separation curves were the same as those of the load-slip curves; hence, the
comparison between the slips and separations could be shown. The separations of the
ducting shear connection (test group T3) are very small; the enlarged load-separation
curves are shown in Section 3.4.6.

Chapter 3 Push-out test series-I
71
0
100
200
300
400
500
600
0 5 10 15 20 25 30Slip (mm)
Load
(kN)
T1-A-N
T1-A-F
T1-B-N
T1-B-F
Figure 3.8 Load-slip curves of the concrete-infill-only shear connection (test group T1)
0
100
200
300
400
500
600
0 5 10 15 20 25 30Slip (mm)
Load
(kN)
T2-A-N
T2-A-F
T2-B-N
T2-B-F
Figure 3.9 Load-slip curves of the tie-bar shear connection (test group T2)

Chapter 3 Push-out test series-I
72
0
100
200
300
400
500
600
0 5 10 15 20 25 30Slip (mm)
Load
(kN)
T3-A-N
T3-A-F
T3-B-N
T3-B-F
Figure 3.10 Load-slip curves of the ducting shear connection (test group T3)
0
100
200
300
400
500
600
0 5 10 15 20 25 30
Slip (mm)
Load
(kN)
T4-A-N
T4-A-F
T4-B-N
T4-B-F
Figure 3.11 Load-slip curves of the web-welded stud shear connection (test group T4)

Chapter 3 Push-out test series-I
73
0
100
200
300
400
500
600
0 5 10 15 20 25 30Separation (mm)
Load
(kN)
T1-A-N
T1-A-F
T1-B-N
T1-B-F
Figure 3.12 Load-separation curves of the concrete-infill-only shear connection (T1)
0
100
200
300
400
500
600
0 5 10 15 20 25 30Separation (mm)
Load
(kN)
T2-A-N
T2-A-F
T2-B-N
T2-B-F
Figure 3.13 Load-separation curves of the tie-bar shear connection (T2)

Chapter 3 Push-out test series-I
74
0
100
200
300
400
500
600
0 5 10 15 20 25 30Separation (mm)
Load
(kN)
T3-A-N
T3-A-F
T3-B-N
T3-B-F
Figure 3.14 Load-separation curves of the ducting shear connection (T3)
0
100
200
300
400
500
600
0 5 10 15 20 25 30Separation (mm)
Load
(kN)
T4-A-N
T4-A-F
T4-B-N
T4-B-F
Figure 3.15 Load-separation curves of the web-welded stud shear connection (T4)

Chapter 3 Push-out test series-I
75
3.4.3 Result evaluation
The results of the push-out tests series-I were evaluated in accordance with the
specifications of Eurocode 4. The methods and criteria used in the evaluation are
outlined below.
The ultimate shear capacity of the shear connection, Pu, was obtained by
dividing the ultimate load of the specimens by the number of the shear
connection;
The slip capacity of the shear connection, δu, was the slip value at the load level
dropped 10% below the ultimate load (EC4, EN1994-1-1: 2004). The concrete-
infill-only and ducting shear connection, which showed no plastic deformations
after the ultimate load was reached, as shown in Figure 3.8 and 3.10 respectively.
Hence, their slip capacities, δu, were taken as the slip values at the ultimate load
levels;
The stiffness of the shear connection, K, was the linear stiffness of the load-slip
curves;
The criterion of tie resistance check is that the transverse separations at 80% of
the ultimate load should be less than half of the slip at that load level (EC4,
EN1994-1-1: 2004).

Chapter 3 Push-out test series-I
76
Table 3.3 Result evaluation of the push-out test series-I
3.4.4 Results of test group T1, concrete-infill-only shear connection
The concrete-infill-only shear connection was investigated in the test group T1. The de-
bonding grease was not applied onto the steel sections. This was to investigate the
effects of the bond on the behaviour of the shear connection. The results of the ultimate
load and slip of the specimens are summarised in Table 3.4. The load-slip and load-
separation curves of each specimen are shown in Figures 3.16-3.19. The load value of
these curves was the load per shear connection.
The results of the test group T1 showed that the shear resisting capacity of the
shear connection increased with the increase of web opening diameter. The failure loads
of the specimens with Ø200mm web openings, T1-B-N & T1-B-F, were higher than
Shear
connection
Specimen
No.
Ultimate shear
capacity
Pu (kN)
Slip
capacity δu
(mm)
Stiffness
K
(kN/mm)
Tie resistance
check
(pass/fail)
Concrete-
infill-only
T1-A-N 118 2.85 41 Pass
T1-A-F 131 4.09 40 Pass
T1-B-N 362 4.92 74 Pass
T1-B-F 397 7.70 62 Pass
Tie-bar
T2-A-N 309 16.00 45 Pass
T2-A-F 305 15.50 49 Pass
T2-B-N 390 14.70 50 Pass
T2-B-F 372 12.20 47 Pass
Ducting
T3-A-N 47 2.07 31 Pass
T3-A-F 50 1.45 35 Pass
T3-B-N 125 3.37 37 Pass
T3-B-F 137 3.21 43 Pass
Web-welded
stud
T4-A-N 504 8.11 66 Pass
T4-A-F 427 14.80 58 Pass
T4-B-N* -- -- 70 --
T4-B-F 497 14.40 49 Pass
* The specimen, T4-B-N was not failed, as the capacity of the jacks was reached.

Chapter 3 Push-out test series-I
77
that of the specimens with Ø150mm web openings, T1-A-N & T1-A-F, respectively.
The comparison was base on the same concrete strengths. Furthermore, the test results
demonstrated that the shear resisting capacity of the shear connection increased with the
increase of concrete strength. The failure loads of the specimens with higher strength of
concrete, T1-A-F & T1-B-F, were higher than that of the specimens with lower strength
of concrete, T1-A-N & T1-B-N, respectively. This comparison was based on the same
diameter of web openings.
Slips of the concrete-infill-only shear connection were moderate, between 3-8mm.
But separations were very small, close to zero. This indicated the strong tie resistance of
the concrete-infill-only shear connection. The specimens, T1-A-F & T1-B-N
demonstrated that the separation started at load level of the sudden slip increase. The
other two specimens, T1-A-N & T1-B-F, demonstrated no separation response until the
ultimate loads were reached.
Specimen
No.
Web
Opening Concrete Type
fcu*
(MPa)
fct ~
(MPa)
Ultimate
Load (kN)
Slip (mm) at
Ultimate Load
T1-A-N Ø150mm
Normal 56.5 4.53 354 2.85
T1-A-F Fibre-reinforced 58.1 4.85 393 4.09
T1-B-N Ø200mm
Normal 56.5 4.53 1086 4.92
T1-B-F Fibre-reinforced 58.1 4.85 1191 7.70
* cube compressive strength of concrete ~ tensile splitting strength of concrete
Table 3.4 Result summary of the test group T1

Chapter 3 Push-out test series-I
78
0
50
100
150
200
250
300
350
400
0 4 8 12 16 20Slip (mm)
Load
(kN)
T1-A-N
0
50
100
150
200
250
300
350
400
0 2 4 6 8 10Separation (mm)
Load
(kN)
T1-A-N
Figure 3.16 Load-slip and load-separation curves of specimen T1-A-N
(Ø150mm web opening, normal concrete)

Chapter 3 Push-out test series-I
79
0
50
100
150
200
250
300
350
400
0 4 8 12 16 20Slip (mm)
Load
(kN)
T1-A-F
0
50
100
150
200
250
300
350
400
0 2 4 6 8 10Separation (mm)
Load
(kN)
T1-A-F
Figure 3.17 Load-slip and load-separation curves of specimen T1-A-F
(Ø150mm web opening, fibre-reinforced concrete)

Chapter 3 Push-out test series-I
80
0
50
100
150
200
250
300
350
400
0 4 8 12 16 20Slip (mm)
Load
(kN)
T1-B-N
0
50
100
150
200
250
300
350
400
0 2 4 6 8 10Separation (mm)
Load
(kN)
T1-B-N
Figure 3.18 Load-slip and load-separation curves of specimen T1-B-N
(Ø200mm web opening, normal concrete)

Chapter 3 Push-out test series-I
81
0
50
100
150
200
250
300
350
400
0 4 8 12 16 20Slip (mm)
Load
(kN)
T1-B-F
0
50
100
150
200
250
300
350
400
0 2 4 6 8 10Separation (mm)
Load
(kN)
T1-B-F
Figure 3.19 Load-slip and load-separation curves of specimen T1-B-F
(Ø200mm web opening, fibre-reinforced concrete)

Chapter 3 Push-out test series-I
82
3.4.4.1 Behaviour analysis
A uniform behaviour of the concrete-infill-only shear connection was shown by the four
specimens. The shear connection deformed elastically until the rupture failure at the
maximum load without any plastic deformations. The specimens, T1-A-F & T1-B-N,
clearly demonstrated the effects of the bond (between the concrete and steel) to the slip
behaviour of the shear connection, as local bond failure occurred with sudden slip
increase. However, the effects of the bond did not initiate the entire failure of the
specimens, as the elastic deformations resumed after the sudden slip increase.
The concrete-infill-only shear connection ultimately failed at the maximum load
levels without any plastic deformations. This brittle failure mode was due to the
inherent brittle material properties of concrete, as the concrete-infill-only shear
connection consisted of solely the concrete infill element.
3.4.4.2 Failure mechanism study
The failed specimens were examined to study the failure profiles of the concrete-infill-
only shear connection, as shown in Figure 3.20. These failure profiles showed that the
top part of the concrete infill element was crushed by the web opening in the direction
of the longitudinal shear force, and that the rest of the concrete infill element was
ruptured due to the tensile splitting force in the transverse direction. The fibre
reinforcements were pulled in the transverse direction, as depicted in Figure 3.20 (b),
further illustrated the tensile failure mechanism. Hence, the failure mechanism of the
concrete-infill-only shear connection was the combination of crushing and tensile
rupture.

Chapter 3 Push-out test series-I
83
(a)
(b)
Figure 3.20 Failure profiles of the concrete-infill-only shear connection with
(a) normal concrete, (b) fibre reinforcement
3.4.5 Results of test group T2, tie-bar shear connection
The tie-bar shear connection of the test group T2 consisted of two Ø12mm tie-bars
passing through each web openings. The top tie-bar within each opening would be in
directly contact with the longitudinal shear force, as the tie-bars were positioned close to
the perimeter of the web opening. Hence, the failure profile of the top tie-bar was
expected to be shear failure. The results of the ultimate loads and slips are listed in
Table 3.5. The load-slip and load-separation curves of the each specimen are shown in
Figures 3.21-3.24. The load values of these curves were load per shear connection.
Crushing
Direction of shear force
Tensile splitting
Shear
direction
Transverse separation

Chapter 3 Push-out test series-I
84
Specimen
No.
Web
Opening Concrete type
fcu*
(MPa)
fct ~
(MPa)
Ultimate
Load (kN)
Slip (mm) at
Ultimate Load
T2-A-N Ø150mm
Normal 54.5 4.54 927 10.68
T2-A-F Fibre-reinforced 51.9 4.07 915 11.62
T2-B-N Ø200mm
Normal 54.5 4.54 1170 12.85
T2-B-F Fibre-reinforced 51.9 4.07 1116 8.41
* cube compressive strength of concrete ~ tensile splitting strength of concrete
Table 3.5 Result summary of the test group T2
The slips of the tie-bar shear connection at the ultimate load were significant,
between 8-13mm. This demonstrated the desired ductility for the shear connection. The
slip stiffness of the tie-bar shear connection among the four specimens was constant. It
was shown that the slip stiffness was not influenced by the diameter of web opening or
the strengths of concrete. The separations at the ultimate loads were small, less than
2mm. This indicated the strong tie resistance of the tie-bar shear connection.
The relationship between the shear resisting capacity of the shear connection and
web opening diameter was shown from the results. The failure loads of the specimens
with Ø200mm web openings, T2-B-N & T2-B-F, were higher than that of the
specimens with Ø150mm web openings, T2-A-N & T2-A-F, respectively. This
comparison was base on the same concrete strengths. The test results also showed the
effect of concrete strength on the shear resisting capacity of the shear connection. The
failure loads of the specimens with higher concrete strength, T2-A-N & T2-B-N, was
higher than that of the specimens with lower concrete strength, T2-A-F & T2-B-F,
respectively. This comparison was made between the specimens with the same
diameters of web opening.

Chapter 3 Push-out test series-I
85
0
50
100
150
200
250
300
350
400
0 5 10 15 20 25 30Slip (mm)
Load
(kN)
T2-A-N
0
50
100
150
200
250
300
350
400
0 3 6 9 12 15Separation (mm)
Load
(kN)
T2-A-N
Figure 3.21 Load-slip and load-separation curves of specimen T2-A-N
(Ø150mm web opening, normal concrete)

Chapter 3 Push-out test series-I
86
0
50
100
150
200
250
300
350
400
0 5 10 15 20 25 30Slip (mm)
Load
(kN)
T2-A-F
0
50
100
150
200
250
300
350
400
0 3 6 9 12 15Separation (mm)
Load
(kN)
T2-A-F
Figure 3.22 Load-slip and load-separation curves of specimen T2-A-F
(Ø150mm web opening, fibre-reinforced concrete)

Chapter 3 Push-out test series-I
87
0
50
100
150
200
250
300
350
400
0 5 10 15 20 25 30Slip (mm)
Load
(kN)
T2-B-N
0
50
100
150
200
250
300
350
400
0 3 6 9 12 15Separation (mm)
Load
(kN)
T2-B-N
Figure 3.23 Load-slip and load-separation curves of specimen T2-B-N
(Ø200mm web opening, normal concrete)

Chapter 3 Push-out test series-I
88
0
50
100
150
200
250
300
350
400
0 5 10 15 20 25 30Slip (mm)
Load
(kN)
T2-B-F
0
50
100
150
200
250
300
350
400
0 3 6 9 12 15Separation (mm)
Load
(kN)
T2-B-F
Figure 3.24 Load-slip and load-separation curves of specimen T2-B-F
(Ø200mm web opening, fibre-reinforced concrete)

Chapter 3 Push-out test series-I
89
3.4.5.1 Behaviour analysis
The ductile behaviour was shown by the tie-bar shear connection, which initially
deformed elastically before underwent plastic deformations with significant slips. Load
dropped gradually and extensive slips were also occurred after the ultimate load was
reached. There were minor sudden slip increases in the region of elastic deformations.
This was due to the local failure of the tie-bars, as the top tie-bar within each opening
was in direct contact with the slip of the steel section. However, the local failure of the
tie-bars did not cause the entire failure of the specimen, as the elastic deformation
resumed thereafter.
It was clearly demonstrated by all specimens of the test group that the separations
(or splitting) occurred at the load levels when the slip behaviour became nonlinear. This
mechanism indicated that the failure resistance (or shear strength) of the shear
connection were contributed by both compressive (bearing) and tensile splitting
resistances.
The cracking noise was initially heard at the end of elastic deformations. And then
it was intensified during the plastic deformations. A bang went off at the end of the test,
as the top of the tie-bars was sheared off.

Chapter 3 Push-out test series-I
90
(a)
(b)
Figure 3.25 Failure profiles of the tie-bar shear connection with
(a) normal concrete, (b) fibre reinforcement
3.4.5.2 Failure mechanism study
The top tie-bar within each web opening sheared off, as shown in Figure 3.25, because
the tie-bars were positioned close to the perimeter of the web openings. The top tie-bars
were in direct contact with the slip of the steel section. The bottom tie-bar within the
each opening remained intact from the shear failure. The bottom tie-bar was in the
mechanism of providing the tensile force (or tie force) to the concrete slabs.
The failure profiles of the concrete infill element of the tie-bar shear connection
were the same as that of the concrete-infill-only shear connection. The top part of the
concrete infill element was crushed by the web opening in the direction of the
Concrete crushing
Direction of shear force
Concrete splitting
Top tie-bar sheared off
Bottom tie-bar

Chapter 3 Push-out test series-I
91
longitudinal shear force. The rest of the concrete infill element was ruptured by the
tensile splitting force in the transverse direction.
3.4.6 Results of test group T3, ducting shear connection
The ducting shear connection of the test group T3 were formed as the concrete infill
element combined with the ducting resisting the longitudinal shear force. The Ø125mm
ducting was used to pass through the Ø150mm web openings of the test specimens.
Similarly, the Ø150mm ducting was used to pass through the Ø200mm web openings.
The results of the ultimate loads and slips are listed in Table 3.6. The load-slip and load-
separation curves of each specimen are shown in Figures 3.26-3.30.
Specimen
No.
Web
Opening Concrete Type
fcu*
(MPa)
fct ~
(MPa)
Ultimate
Load (kN)
Slip (mm) at
Ultimate Load
T3-A-N Ø150mm
Normal 55.2 3.91 141 2.07
T3-A-F Fibre-reinforced 51.5 3.89 150 1.45
T3-B-N Ø200mm
Normal 55.2 3.91 375 3.37
T3-B-F Fibre-reinforced 51.5 3.89 411 3.21
* cube compressive strength of concrete ~ tensile splitting strength of concrete
Table 3.6 Result summary of the test group T3
The specimens with the Ø150mm web openings and Ø125mm ducting, T3-A-N &
T3-A-F, had less amount of concrete infill (between the ducting and web opening) than
the other two specimens, T3-B-N & T3-B-F. The test results demonstrated the
relationship between the shear resisting capacity of the shear connection and the amount
of concrete infill. The failure loads of the specimens with the bigger concrete infill, T3-
B-N & T3-B-F, were higher than that of the specimens with the smaller concrete infill,
T3-A-N & T3-A-F. The slips at the ultimate loads were very small, less than 3.5mm.
The separations were less than 0.5mm. The uniform slip stiffness of the ducting shear
connectors was shown among the four specimens, as illustrated in Figure 3.26.
However, it was shown that the shear resisting capacities of the ducting shear
connectors did not increase with the increase of concrete strengths. This might be due to
the difference in concrete strengths was small between the specimens, and also the
amount of the concrete infill was much less than other types of shear connection. Hence
the effect of concrete strength was not clear.

Chapter 3 Push-out test series-I
92
0
30
60
90
120
150
0 4 8 12 16 20Slip (mm)
Load
(kN)
T3-A-N
T3-A-F
T3-B-N
T3-B-F
0
30
60
90
120
150
0 1 2 3 4 5Separation (mm)
Load
(kN)
T3-A-N
T3-A-F
T3-B-N
T3-B-F
Figure 3.26 Load-slip and load-separation curves of the ducting shear connection

Chapter 3 Push-out test series-I
93
0
30
60
90
120
150
0 4 8 12 16 20Slip (mm)
Load
(kN)
T3-A-N
0
30
60
90
120
150
0 1 2 3 4 5Separation (mm)
Load
(kN)
T3-A-N
Figure 3.27 Load-slip and load-separation curves of specimen T3-A-N
(Ø150mm web opening, Ø125mm ducting, normal concrete)

Chapter 3 Push-out test series-I
94
0
30
60
90
120
150
0 4 8 12 16 20Slip (mm)
Load
(kN)
T3-A-F
0
30
60
90
120
150
0 1 2 3 4 5Separation (mm)
Load
(kN)
T3-A-F
Figure 3.28 Load-slip and load-separation curves of specimen T3-A-F
(Ø150mm web opening, Ø125mm ducting, fibre-reinforced concrete)

Chapter 3 Push-out test series-I
95
0
30
60
90
120
150
0 4 8 12 16 20Slip (mm)
Load
(kN)
T3-B-N
0
30
60
90
120
150
0 1 2 3 4 5Separation (mm)
Load
(kN)
T3-B-N
Figure 3.29 Load-slip and load-separation curves of specimen T3-B-N
(Ø200mm web opening, Ø150mm ducting, normal concrete)

Chapter 3 Push-out test series-I
96
0
30
60
90
120
150
0 4 8 12 16 20Slip (mm)
Load
(kN)
T3-B-F
0
30
60
90
120
150
0 1 2 3 4 5Separation (mm)
Load
(kN)
T3-B-F
Figure 3.30 Load-slip and load-separation curves of specimen T3-B-F
(Ø200mm web opening, Ø150mm ducting, fibre-reinforced concrete)

Chapter 3 Push-out test series-I
97
3.4.6.1 Behaviour analysis
A uniform behaviour of the ducting shear connection was shown by the specimens. The
ducting shear connection deformed elastically up to the ultimate loads. But the complete
rupture failure mode was not shown by the ducting shear connection. Extensive slips
were induced after the ultimate loads were reached. The presence of the ducting reduced
attendance of brittle rupture failure mode, although the duct would not provide much of
the shear resistance.
3.4.6.2 Failure mechanism study
The concrete infill element within the voids was initially crushed by the web opening.
This led to the deformation of ducting in the direction of the longitudinal shear force, as
shown in Figure 3.31 (b). Because of the thickness and geometry of the ducting, the
spiral locking was eventually ruptured when the steel section further advanced in the
longitudinal direction, as shown in Figure 3.31 (c).
Although, the separation values were very small, less than 0.5mm, but it indicated
the tensile failure of the concrete infill element. Thus, the failure mechanism of the
ducting shear connection was due to the crushing failure of the concrete infill element in
the direction of the longitudinal shear force and tensile failure of the concrete infill
element in the transverse direction.

Chapter 3 Push-out test series-I
98
(a) (b)
(c) (d)
Figure 3.31 Failure profiles of the ducting shear connection (a) prior to testing, (b)
deformation profile, (c) rupture profile, (d) failure profile of concrete infill element
3.4.7 Results of test group T4, web-welded stud shear connection
There were eight headed studs welded on both sides of the web post, as shown in Figure
3.6. Hence, each concrete infill element combined with 2.67 studs to form a web-
welded stud shear connection. The results of the ultimate load and slip are summarised
in Table 3.7. The load-slip and load-separation curves of each specimen are shown in
Figures 3.32-3.35. The load of these curves was the load per shear connection.
The specimen, T4-B-N, was not failed in the push-out test, as the capacity of the
hydraulic jacks was reached. Its results in Table 3.7 are the maximum value reached,
but not the ultimate values. Large slips were demonstrated by all specimens. The
separations were very small, which indicated the strong tie resistance of the web-welded
stud shear connection.
Direction of shear force
Direction of shear force

Chapter 3 Push-out test series-I
99
Specimen
No.
Web
Opening Concrete Type
fcu*
(MPa)
fct ~
(MPa)
Ultimate
Load (kN)
Slip (mm) at
Ultimate Load
T4-A-N Ø150mm
Normal 67.0 4.66 1521 8.11
T4-A-F Fibre-reinforced 50.2 4.08 1281 10.79
T4-B-NΔ
Ø200mm Normal 67.0 4.66 (1791) (8.63)
T4-B-F Fibre-reinforced 50.2 4.08 1491 14.43
* cube compressive strength of concrete ~
tensile splitting strength of concrete Δ
specimen, T4-B-N, was not failed, as the capacity of the jacks was reached
Table 3.7 Result summary of the test group T4
The test results showed the influence of the diameter of web opening and concrete
strength on the shear resisting capacity of the shear connection. The failure loads of the
specimens with bigger web openings (Ø200mm), T4-B-N & T4-B-F, were higher than
that of the specimens with the smaller web openings (Ø150mm), T4-A-N & T4-A-F,
respectively. This comparison was based on the same concrete strengths. The failure
loads of the specimens with higher concrete strengths, T4-A-N & T4-B-N, were higher
than that of the specimens with lower concrete strengths, T4-A-F & T4-B-F
respectively. This comparison was based on the same diameter of web openings.
3.4.7.1 Behaviour analysis
Ductile behaviour of the web-welded stud shear connection was shown by the
specimens. The shear connection deformed elastically then followed by plastic
deformations. Large slips were induced during the plastic deformations before and after
the ultimate loads were reached. The ultimate failure of the shear connection, as the
studs sheared off, occurred after the load dropped to 85-93% of the maximum loads.
The slip behaviour of the web-welded stud shear connection was very similar to that of
the headed studs in the standard push-out tests, as illustrated in Figure 1.9. This similar
behaviour indicated that the behaviour of the web-welded stud shear connection was
much influenced by the headed studs. The specimens with fibre reinforcement, T4-A-F
& T4-B-F, demonstrated additional ductility comparing with the specimen, T4-A-N.
Loud cracking noises were heard as the ultimate loads were reached. The cracking
noise then became intensified. A large bang went off at the destructive failure, as the
shear-studs were sheared off.

Chapter 3 Push-out test series-I
100
0
100
200
300
400
500
600
0 4 8 12 16 20Slip (mm)
Load
(kN)
T4-A-N
0
100
200
300
400
500
600
0 1 2 3 4 5Separation (mm)
Load
(kN)
T4-A-N
Figure 3.32 Load-slip and load-separation curves of specimen T4-A-N
(Ø150mm web opening, normal concrete)

Chapter 3 Push-out test series-I
101
0
100
200
300
400
500
600
0 4 8 12 16 20Slip (mm)
Load
(kN)
T4-A-F
0
100
200
300
400
500
600
0 1 2 3 4 5Separation (mm)
Load
(kN)
T4-A-F
Figure 3.33 Load-slip and load-separation curves of specimen T4-A-F
(Ø150mm web opening, fibre-reinforced concrete)

Chapter 3 Push-out test series-I
102
0
100
200
300
400
500
600
0 4 8 12 16 20Slip (mm)
Load
(kN)
T4-B-N
0
100
200
300
400
500
600
0 1 2 3 4 5Separation (mm)
Load
(kN)
T4-B-N
Figure 3.34 Load-slip and load-separation curves of specimen T4-B-N
(Ø200mm web opening, normal concrete)

Chapter 3 Push-out test series-I
103
0
100
200
300
400
500
600
0 4 8 12 16 20Slip (mm)
Load
(kN)
T4-B-F
0
100
200
300
400
500
600
0 1 2 3 4 5Separation (mm)
Load
(kN)
T4-B-F
Figure 3.35 Load-slip and load-separation curves of specimen T4-B-F
(Ø200mm web opening, fibre-reinforced concrete)

Chapter 3 Push-out test series-I
104
3.4.7.2 Failure mechanism study
The headed studs were sheared off with bending near its root, as depicted in Figure
3.36. This failure profile was one of the main failure profile shown in the standard push-
out tests, as reviewed in the Chapter 2. The concrete around the studs was crushed in the
shear direction, as shown in Figure 3.36. The failure mechanism of the concrete infill
element was crushing of the top part of the infill element and tensile rupture of the rest
part of the infill element.
Figure 3.36 Failure profiles of the web-welded stud shear connection
Concrete crushed near
the stud
Direction of shear force
Concrete splitting
Studs sheared off
Concrete crushing

Chapter 3 Push-out test series-I
105
3.5 Conclusions
The four types of the shear connection used for the shallow cellular floor beams were
investigated in the push-out test series-I. The test results were studied and the following
conclusions were made.
(1) The concrete-infill-only shear connection showed a distinctive brittle failure
mode, as the rupture failure occurred without any plastic deformations. This
brittle failure mode was due to the shear connection consisted of only the
concrete infill element, and that concrete was a brittle material.
(2) The ducting shear connection showed the similar brittle behaviour mode.
The ducting deformed extensively in the direction of the slips by the
crushing of the concrete infill element. Large slips occurred after the
ultimate loads were reached. The ducting itself had little shear resistance
due to its geometry and thickness. However, the presence of the ducting
reduced the attendance of the brittle failure mode.
(3) Both tie-bar and web-welded stud shear connection demonstrated the ductile
behaviour and failure mode. Plastic deformations with large slips occurred
before and after the ultimate loads were reached.
(4) Shear failure of the tie-bar was shown in the tie-bar shear connection. This
were due to the tie-bars were positioned close to the perimeter of the web
opening, and the tie-bars were in direct contact with the steel section in the
direction of the longitudinal shear force.
(5) The headed studs showed major influence on the behaviour of the web-
welded stud shear connection, as its behaviour was the same as that of the
headed studs in the standard push-out tests.
(6) The same failure profiles of the concrete infill element were shown in four
types of the shear connection. The concrete infill element was crushed in the
shear direction, and was ruptured in the transverse direction. The crushing
represented the compressive failure mechanism; and the rupture represented
the tensile failure mechanism.
(7) The additional elements of the tie-bars and studs used in combination with
the concrete infill element had significantly increased the ductility, slip
capacity and shear strength of the shear connection.
(8) Strong tie resistance were shown by all four types of the shear connection,
as very little separations were shown in the push-out tests.

Chapter 3 Push-out test series-I
106
(9) The effect of the bond between the steel section and concrete slabs to the
behaviour of the shear connection was shown, as sudden slip increase
occurred. But this local bond failure had no effect on the overall shear
strengths of the shear connection, as the local bond failure did not cause the
failure of the shear connection.
(10) The results of the push-out tests showed that the shear resisting capacity of
the shear connection was dependent on the diameter of the web opening and
concrete strength.
(11) The shear resisting capacity of the shear connection increased with increase
of the web opening diameter and concrete strength.
3.6 Recommendations
The results of the push-out test series-I provided comprehensive information on the
behaviour and shear resisting properties of the shear connection used for the shallow
cellular floor beams. But the design details for some of the shear connection could be
improved, and also that some design details for the push-out tests needed adjustment.
The following recommendations were made.
(1) In order to provide information towards the design calculation for the shear
connection, it was recommended that a minimum of three identical specimens
should be tested for a particular shear connection.
(2) Due to the demonstrated effects of the bond on the behaviour of the shear
connection, it was recommended that the steel section should be greased for
future similar push-out tests.
(3) Due to the brittle failure mode of the concrete-infill-only shear connection, it
was recommended that the concrete-infill-only shear connection should not be
used as a sole mean to provide shear connection. It should be used in
combination with other additional elements, i.e. tie-bars or studs, to provide
the necessary ductility.
(4) The shear failure of the tie-bar was shown in the push-out tests because the
tie-bars were positioned close to the perimeter of the web openings. It was
recommended that the tie-bars should be positioned away from the perimeter
of the web openings with a minimum distance of 20mm. This recommended
minimum distance was based on the maximum slip capacity of the tie-bar
shear connection, 16mm, shown in the push-out tests. Furthermore, if an

Chapter 3 Push-out test series-I
107
Ø16mm tie-bar was used passing through the web opening, it should be
positioned at the centre of the web opening.
(5) The low shear resistance of the ducting shear connection was shown in the
push-out tests. It was recommended that the ducting shear connection should
be used only in the region of low shear. The extensive deformations of the
ducting were shown at the slips of 1.5-3.5mm. It was recommended that the
ducting shear connection should not be used in the region where large slips
were expected.

Chapter 4 Push-out test series-II
108
Chapter 4 Push-out test series-II
Four types of the shear connection used for the shallow cellular floor beams were
investigated in the push-out test series-I. The test results provided comprehensive
information on behaviour and shear resisting properties of the shear connection. Based
on the recommendations of push-out test series-I, push-out test series-II was carried out
to further investigate the concrete-infill-only and tie-bar shear connection. Loading
cycles were introduced to investigate its effects on the behaviour and shear resisting
capacity of the shear connection. The test results were evaluated to provide specific
information for the design calculation. The behaviour and failure mechanism of the
shear connection were studied. The shear resisting capacity of the shear connection
were analysed together with the results of the push-out test series-I to develop a design
method for the shear resistance of the shear connection.
4.1 Introduction
The push-out test series-I recommended that:
A minimum three identical specimens should be tested for a particular
shear connection.
If Ø16mm tie-bar is used, it should pass through the centre of the web
opening.
Base on these two recommendations, push-out test series-II were designed to
further investigate the concrete-infill-only and tie-bar shear connection. These two types
of shear connection were also the most commonly used shear connection for the shallow
cellular floor beams. There were two test groups in the push-out test series-II. Each test
group had four identical specimens. The tie-bar shear connection had an Ø16mm tie-bar
passing through the centre of the web opening.
The specimens of the push-out test series-II were modified based on the
specimens of the push-out test series-I. The push-out test series-II were carried out in
the same manner of the push-out test series-I. The additional loading cycles of 25 times
were applied to one specimen of each test group. Load-slip behaviour of these two types

Chapter 4 Push-out test series-II
109
of shear connection was analysed. The failure mechanism of the tie-bar (Ø16mm) shear
connection were studied, and compared with that of the tie-bar (Ø12mm) shear
connection in the previous test series. The results of the tests were studied to establish
the increased shear resistance due to the additional Ø16mm tie-bars.
4.2 Test specimens
The configuration of the specimens was the same as that of the push-out test series-I.
The concrete slabs on both sides of the web post were connected by the concrete infill
elements with or without the tie-bars. The width of the concrete slabs was increased to
1m from the previous 600mm for the push-out test series-I. This was to accommodate
the increased length of the Ø16mm tie-bars. All other dimensions of the specimens were
same as that of the push-out test series-I. The dimensions of specimens of both test
groups were the same. This was to avoid any undesirable variables between the two test
groups. The concrete strengths of the both test groups were designed at about 30N/mm2.
4.2.1 Steel section
There was only one size of the steel section used for the specimens of the push-out test
series-II. This steel section was the same steel section of 254x254x73UC used for the
previous test series. There were three Ø150mm opening perforated on the web post, as
shown in Figure 4.1.
Figure 4.1 Steel section used for the push-out test series-II
4.2.2 Concrete slabs
Normal concrete was used to cast the concrete slabs for the push-out test series-II. The
width of the concrete slabs was 1m, which was increased from the previous 600mm, to

Chapter 4 Push-out test series-II
110
accommodate the 1m length of the Ø16mm tie-bars. The 1m length was primarily to
provide adequate anchorage for the Ø16mm tie-bars. The concrete slab width was the
same for both test groups. The depth of the concrete slabs was 254mm. The concrete
slabs flushed with the steel flanges.
4.2.3 Test groups
The two test groups of the push-out test series-II were: T5 and T6, investigating the
concrete-infill-only and tie-bar (Ø16mm) shear connection respectively. Each test group
had four identical specimens. This conformed to one of the recommendations of the
push-test series-I.
(a)
(b) (c)
Figure 4.2 (a) Drawing of the T5 specimen; (b) 3-D illustration; (c) Cast specimens
4.2.3.1 Specimens of test group T5, concrete-infill-only shear connection
The steel sections of the test group T5 specimens were applied with de-bonding grease
to prevent the load bond failure shown in the push-out test series-I. This was based on

Chapter 4 Push-out test series-II
111
one of the recommendations of the push-out test series-I. The dimensions of the
specimen are shown in Figure 4.2. The in-situ concrete completely filled the web
opening, so that applied longitudinal shear force would be directly resisted by the
concrete-infill-only shear connection. The load-slip behaviour and the shear resisting
capacity of the shear connection were obtained in the push-out tests.
4.2.3.2 Specimens of test group T6, tie-bar (Ø16mm) shear connection
The tie-bar shear connection of the test group T6 consisted of the concrete infill element
combined with one Ø16mm tie-bar passing through the centre of each web opening, as
shown in Figure 4.3. The length of the Ø16mm tie-bars was 1m, which was the same as
that of the Ø16mm tie-bar used for the shallow cellular floor beams. The purpose of
having the 1m length was to provide adequate anchorage resistance to the Ø16mm tie-
bars, so that the tensile strength of the tie-bar would become effective.
(a)
(b) (c)
Figure 4.3 (a) Drawing of the T6 specimen; (b) 3-D illustration; (c) Cast specimen
Tie-bar

Chapter 4 Push-out test series-II
112
4.2.4 Preparation and construction
The de-bonding grease was applied to the steel sections of both test groups. Hence, the
development of the bond between the concrete and steel was prevented. All specimens
of the push-out test series-II were cast in the Structure Laboratory of City University
London. Specimens of the cubes and cylinders were prepared by using the same batch
of concrete used for the push-out test specimens. The cubes, cylinders and push-out test
specimens were cured under the same conditions and covered with wet sacks and plastic
sheets.
(a)
(b)
Figure 4.4 (a) Set up of the push-out test series-II; (b) Instrumentations of the test
Jack
Load cell
Dial gauge
(separations)
Dial gauge
(slips)
Direction of
separation
Direction
of slip

Chapter 4 Push-out test series-II
113
4.3 Set up and testing procedures
The same testing rig, hydraulic jacks and load cells used in the previous test series were
used for the push-out test series-II. The load cells were re-calibrated before use in the
push-out test series-II. The measurements of slip and separation were obtained by using
digital dial gauges. Four digital dial gauges were positioned on the top of the steel
section to measure slips in the vertical direction. Four digital dial gauges were
positioned on the either side of the concrete slabs, as shown in Figure 4.4 (b), to
measure the separations in the transverse direction. The resolution of the digital dial
gauges was 0.01mm.
4.3.1 Testing procedures
Push-out test series-II was carried out in the same manner of the previous test series.
The monotonic loads were applied onto the steel section; thus, the direct shear force was
applied onto the shear connection. The specimens were settled onto a layer of plaster
(gypsum) creating an even contact surface between the specimens and reaction
platform.
The first three specimens of each test group were tested with monotonic loads up
to the destructive failure of the shear connection. The fourth specimen of each test
group was tested with additional loading cycles, 25 times between 5-40% of the
expected failure loads. The load increments for all specimens are shown in Table 4.1.
Test group Specimens
No.
Load
increment
As % of the expected
failure loads
T5
Concrete-infill-only
shear connection
T5-1
19.6kN
(2ton) 4%
T5-2
T5-3
T5-4*
* loading cycles were applied between 29.4-205.8kN (3-
21ton) with the same load increment of 19.6kN (2ton)
T6
Tie-bar (Ø16mm)
shear connection
T6-1
39.2kN
(4ton) 4%
T6-2
T6-3
T6-4 ~
~ loading cycles are applied between 49-392kN (5-40ton)
with the same load increment of 39.2kN (4ton)
Table 4.1 Load increments of the push-out test series-II

Chapter 4 Push-out test series-II
114
4.4 Test results
The results obtained in the push-out test series-II were presented in the load-slip and
load-separation curves, as shown in Figures 4.5-4.8. The load-slip and load-separation
curves were in the same scales, to enable the comparison between the slips and
separations. The load-slips curves represented the behaviour of the shear connection in
resisting the direct longitudinal shear force. The load-separation curves represented the
tie resisting behaviour of the shear connection in the transverse direction. The load
value of these curves was the load per shear connection. The concrete strengths of the
specimens are presented in Appendix B.
The load-slip behaviour of the concrete-infill-only and tie-bar (Ø16mm) shear
connection were analysed with the aim of optimizing the design details. The increased
shear resistance due to the additional Ø16mm tie-bars were determined. The results of
the tests were evaluated to provide specific information for design calculation. The
shear resisting capacity of the shear connection together with the results of the previous
test series were further analysed in Chapter 5 to establish a design method for the shear
resistance of the shear connection.
The distinctive brittle failure mode of the concrete-infill-only shear connection
was shown by specimens of the test group T5. In contrast, the ductile failure mode of
the tie-bar (Ø16mm) shear connection was shown by specimens of the test group T6.
The increased shear resistance and slip capacity due to the tie-bars were clearly
illustrated in Figure 4.9. It was shown that the additional Ø16mm tie-bars increased the
shear resistance of the shear connection by 100%. The slip stiffness of the two types of
shear connection was the same.

Chapter 4 Push-out test series-II
115
0
50
100
150
200
250
300
350
400
450
0 5 10 15 20 25 30
Slip (mm)
Load
(kN)
T5-1
T5-2
T5-3
T5-4
Figure 4.5 Load-slip curves of the concrete-infill-only shear connection (test group T5)
0
50
100
150
200
250
300
350
400
450
0 5 10 15 20 25 30
Slip (mm)
Load
(kN)
T6-1
T6-2
T6-3
T6-4
Figure 4.6 Load-slip curves of the tie-bar (Ø16mm) shear connection (test group T6)

Chapter 4 Push-out test series-II
116
0
50
100
150
200
250
300
350
400
450
0 5 10 15 20 25 30
Separations (mm)
Load
(kN)
T5-1
T5-2
T5-3
T5-4
Figure 4.7 Load-separation curves of the concrete-infill-only shear connection (T5)
0
50
100
150
200
250
300
350
400
450
0 5 10 15 20 25 30
Separation (mm)
Load
(kN)
T6-1
T6-2
T6-3
T6-4
Figure 4.8 Load-separation curves of the tie-bar (Ø16mm) shear connection (T6)

Chapter 4 Push-out test series-II
117
0
50
100
150
200
250
300
350
400
450
0 5 10 15 20 25 30
Slip (mm)
Load
(kN)
T5-1
T5-2
T5-3
T5-4
T6-1
P6-2
P6-3
P6-4
Figure 4.9 Comparison of load-slip curves between the two types of shear connection
4.4.1 Result evaluation
The results of the push-out tests series-II were evaluated with the same method
and criterions that were used for the previous test series. Eurocode 4 (EN1994-1-1:
2004) specified that the slip capacity, δu, was the slip at the load level dropped 10%
below the maximum load. The slip capacity of the concrete-infill-only shear connection
was taken as the slip at the maximum load, as the rupture failure occurred at the
maximum load without plastic deformations and load dropped to zero instantaneously.
The slip capacity of the tie-bar shear connection was also taken as the slip at the
maximum load. This was because the shear connection showed no loading dropping
after the maximum loads were reached. The ultimate load levels were sustained by the
tie-bar (Ø16mm) shear connection with significant slips, as shown in Figure 4.6. The
evaluated properties of the concrete-infill-only and tie-bar shear connection are shown
in Table 4.2.
The tie-bar (Ø16mm) shear connection showed significant slip capacity, which
was three times that of the concrete-infill-only shear connection. Both types of shear
connection demonstrated the strong tie resistance, as the separations were very small.
Consistent results of shear resisting capacity, slip capacity and slip stiffness were shown
by the shear connection of both test groups.
T5, concrete-infill-only
shear connection

Chapter 4 Push-out test series-II
118
Table 4.2 Result evaluations of the push-out test series-II
4.4.2 Results of test group T5, concrete-infill-only shear connection
The test group T5 had four identical specimens with the concrete-infill-only shear
connection of Ø150mm diameter. The steel sections were applied with de-bonding
grease to prevent the local bond failure, which was shown in the previous test series.
The specimen, T5-4, was tested with the additional loading cycles of 25 times. The
concrete strengths, ultimate loads and slips of the specimens are shown in Table 4.3.
The load-slip and load-separation curves of each specimen are shown in Figures 4.10-
4.13. The load value of these curves was the load per shear connection.
Specimen
No.
fcu*
(MPa)
fct ~
(MPa)
Ultimate Load
(kN)
Slip (mm) at
Ultimate Load
T5-1 35 3.21 677 4.9
T5-2 35 3.21 581 3.9
T5-3 32 2.9 546 3.9
T5-4 30 3.02 525 4.4
* cube compressive strength of concrete ~
tensile splitting strength of concrete
Table 4.3 Result summary of the test group T5
The slips at the ultimate loads were 4.0-5.0mm, which were very similar to the
3.0-4.0mm slips shown in the previous push-out test series. It was shown that the shear
Shear
connection
Specimen
No.
Ultimate shear
capacity Pu
(kN)
Slip
capacity,
δu (mm)
Stiffness
K
(kN/mm)
Tie resistance
check
(pass/fail)
Concrete-
infill-only
T5-1 226 4.9 47 Pass
T5-2 194 3.9 54 Pass
T5-3 182 3.9 47 Pass
T5-4 175 4.4 36 Pass
Tie-bar
(Ø16mm)
T6-1 391 13.0 44 Pass
T6-2 386 12.2 42 Pass
T6-3 327 13.7 45 Pass
T6-4 358 13.7 40 Pass

Chapter 4 Push-out test series-II
119
resistance of a concrete-infill-only shear connection of Ø150mm was 1.75 times the
shear resistance of a headed stud with Ø19mm and 100mm height. This comparison was
based on the concrete strength of 30N/mm2. The shear resistance of the headed studs
was taken as the value given in British Standard 5950 (BS5950-3.1: 1990), as shown in
Table 2.2.
0
50
100
150
200
250
0 2 4 6 8 10
Slip (mm)
Load
(kN)
T5-1
0
50
100
150
200
250
0 1 2 3 4 5
Separations (mm)
Load
(kN)
T5-1
Figure 4.10 Load-slip and load-separation curves of specimen T5-1

Chapter 4 Push-out test series-II
120
0
50
100
150
200
250
0 2 4 6 8 10
Slip (mm)
Load
(kN)
T5-2
0
50
100
150
200
250
0 1 2 3 4 5
Separations (mm)
Load
(kN)
T5-2
Figure 4.11 Load-slip and load-separation curves of specimen T5-2

Chapter 4 Push-out test series-II
121
0
50
100
150
200
250
0 2 4 6 8 10
Slip (mm)
Load
(kN)
T5-3
0
50
100
150
200
250
0 1 2 3 4 5
Separations (mm)
Load
(kN)
T5-3
Figure 4.12 Load-slip and load-separation curves of specimen T5-3

Chapter 4 Push-out test series-II
122
0
50
100
150
200
250
0 2 4 6 8 10
Slip (mm)
Load
(kN)
T5-4
0
50
100
150
200
250
0 1 2 3 4 5
Separations (mm)
Load
(kN)
T5-4
Figure 4.13 Load-slip and load-separation curves of specimen T5-4 with loading cycles
4.4.2.1 Behaviour analysis
A uniform behaviour was shown by all specimens including the specimen, T5-4, which
was applied with the additional loading cycles of 25 times. The shear connection
deformed elastically up to the ultimate load without any plastic deformations. The load
drops instantaneously when the ultimate load was reached, as shown in the load-slip

Chapter 4 Push-out test series-II
123
curves. This brittle failure mode of the concrete-infill-only shear connection was mainly
due to the brittle material properties of the concrete, as the shear connection consisted of
solely the concrete infill element. The local bond failure or sudden slip increase shown
in the push-out test series-I did not occur, because the bond was eliminated by de-
bonding grease applied onto the steel sections.
4.4.2.2 Response to loading cycles
The concrete-infill-only shear connection showed the elastic behaviour during the
loading cycles of 25 times, as demonstrated in Figure 4.14. The total slip increase of
0.18mm was created by these loading cycles. The slip increases were due to the
crushing of the concrete as a response of the shear connection to the loading cycles. The
loading cycles had no effect on the overall behaviour of the shear connection, as the
elastic deformations were continued after the loading cycles.
The slip increase due to the loading cycles would be greater if the number of the
cycles was higher. By analysing the increased slips over the 25 times of cycles, it was
shown that the amount of slip increase during the first three cycles was almost 10 times
that of the last three cycles. In other words, the rate of slip increase was reduced with
the higher number of loading cycles. It was predicted that slip increase due to the
loading cycles would reach a certain level if the number of the loading cycles was
exceeded by a certain limit.
4.4.2.3 Failure mechanism study
The failure profiles of the concrete-infill-only shear connection, shown in Figure 4.15,
demonstrated that the top part of the concrete infill element was crushed by the web
post in the direction of the longitudinal shear force, and that the rest of the infill element
was ruptured by the tensile splitting in the transverse direction. The failure profiles of
the concrete infill element were the same as those shown in the push-out test series-I.

Chapter 4 Push-out test series-II
124
0
20
40
60
80
100
0.0 0.5 1.0 1.5 2.0 2.5 3.0
Slip (mm)
Load
(kN)
T5-4
0
20
40
60
80
100
-0.3 -0.2 -0.1 0.0 0.1 0.2 0.3
Separations (mm)
Load
(kN)
T5-4
Figure 4.14 Load-slip and load-separation response of the concrete-infill-only shear
connection during the loading cycles
Figure 4.15 Failure profiles of the concrete-infill-only shear connection
Crushing
Tensile splitting

Chapter 4 Push-out test series-II
125
4.4.3 Results of test group T6, tie-bar (Ø16mm) shear connection
The test group T6 investigated the tie-bar (Ø16mm) shear connection, which consisted
of the concrete infill element combined with an Ø16mm tie-bar passing through the
centre of each web opening. The specimen, T6-4, was tested with the additional loading
cycles of 25times. The results of concrete strength, ultimate load and slip of the
specimens are shown in Table 4.4. The load-slip and load-separation curves of the
individual shear connection of each specimen are shown in Figures 4.16-4.19.
Specimen No. fcu*
(MPa) fct
~ (MPa)
Ultimate load
(kN)
Slip (mm) at
ultimate load
T6-1 29 2.85 1173 13.0
T6-2 32 2.92 1159 12.2
T6-3 28 2.49 982 13.7
T6-4 27 2.57 1075 13.7
* cube compressive strength of concrete ~
tensile splitting strength of concrete
Table 4.4 Result summary of the test group T6
Slips at the ultimate loads were 12-14mm. The consistent shear resisting capacity
of the shear connection was shown by the specimens. It was shown that the shear
resistance of a tie-bar (Ø16mm) shear connection of Ø150mm opening was 3.7 times
the shear resistance of the headed studs with Ø19mm and 100mm height. This
comparison was based on the concrete strength of 30N/mm2. The shear resistance of the
headed studs was taken as the values given in British Standard BS5950 ((BS5950-3.1:
1990), as shown in Table 2.2. It was shown that the shear resistance of the tie-bar
(Ø16mm) shear connection was two times that of the concrete-infill-only shear
connection.
4.4.3.1 Behaviour analysis
A uniform behaviour of the tie-bar (Ø16mm) shear connection was demonstrated by all
specimens, including the specimen, T6-4, which was applied with the additional loading
cycles of 25 times. The shear connection deformed elastically then followed by the
plastic deformations with large slips before and after the ultimate loads. The shear
connection sustained the ultimate load levels while significant slips were induced, as
shown in the load-slip curves. This mechanism of maintaining the shear strength during

Chapter 4 Push-out test series-II
126
the plastic deformations was further demonstrated during the unloading and re-loading
of the specimen, T6-2, as shown in Figure 4.17. The ductile behaviour and failure mode
of the shear connection indicated the tensile strength of the tie-bar had become
effective. The adequate anchorage resistance of the Ø16mm tie-bar was provided by the
1m length, as no anchorage failure occurred in the push-out test.
0
50
100
150
200
250
300
350
400
450
0 5 10 15 20 25 30
Slip (mm)
Load
(kN)
T6-1
0
50
100
150
200
250
300
350
400
450
0 1 2 3 4 5
Separation (mm)
Load
(kN)
T6-1
Figure 4.16 Load-slip and load-separation curves of specimen T6-1

Chapter 4 Push-out test series-II
127
0
50
100
150
200
250
300
350
400
450
0 5 10 15 20 25 30
Slip (mm)
Load
(kN)
T6-2
0
50
100
150
200
250
300
350
400
450
0 1 2 3 4 5
Separation (mm)
Load
(kN)
T6-2
Figure 4.17 Load-slip and load-separation curves of specimen T6-2

Chapter 4 Push-out test series-II
128
0
50
100
150
200
250
300
350
400
450
0 5 10 15 20 25 30
Slip (mm)
Load
(kN)
T6-3
0
50
100
150
200
250
300
350
400
450
0 1 2 3 4 5
Separation (mm)
Load
(kN)
T6-3
Figure 4.18 Load-slip and load-separation curves of specimen T6-3

Chapter 4 Push-out test series-II
129
0
50
100
150
200
250
300
350
400
450
0 5 10 15 20 25 30
Slip (mm)
Load
(kN)
T6-4
0
50
100
150
200
250
300
350
400
450
0 1 2 3 4 5
Separation (mm)
Load
(kN)
T6-4
Figure 4.19 Load-slip and load-separation curves of specimen T6-4
4.4.3.2 Response to loading cycles
The loading cycles of 25 times between 5-40% of the expected failure load were applied
to the specimen, T6-4. This was to investigate the effects of the loading cycles on the
anchorage of the tie-bars and overall behaviour of the shear connection.

Chapter 4 Push-out test series-II
130
The response of the tie-bar (Ø16mm) shear connection to the loading cycles was
elastic deformations, as shown in Figure 4.20. It was shown that the anchorage of the
tie-bars was not affected by the loading cycles, as no load drop or sudden slip increase
occurred. The overall behaviour and failure mode of the shear connection were also not
affected by the loading cycles, as the elastic deformation was continued and the ductile
failure mode was illustrated thereafter.
Tie-bar (Ø16mm) shear connection had slip increase of 0.19mm during the
loading cycles. This was due to the crushing of the concrete infill element in the
response to the loading cycles. The analysis showed that the slip increase during the
first three cycles was about 8 times the slip increase during the last three cycles. The
rate of slip increase became smaller with the higher number of loading cycles. Again, it
was predicted that slip increase due to the loading cycles would reach a certain level if
the number of the loading cycles exceeded by a certain limit.
4.4.3.3 Failure mechanism study
The tested specimens of the test group T6 could not be dissembled, as the tie-bars did
not failed and concrete slabs were tied firmly together. The load-slip curves had
provided comprehensive information to predict the failure profile of the shear
connection.
The load-slip curves demonstrated the ductile failure mode of the shear
connection with significant slips. The characteristic behaviour of maintaining the
ultimate loads during the plastic deformations and no anchorage failure of the tie-bars
indicated that the tensile strength of the tie-bars had became effective. The possible
failure mechanism of the tie-bars would be tensile failure rather than the anchorage
failure.
The large slips indicated that the significant crushing was induced by the
longitudinal shear force. The separations of the specimen were shown at the ultimate
load levels. The failure mechanism of the concrete infill element of the tie-bar (Ø16mm)
shear connection was the crushing in the longitudinal direction force and tensile
splitting in the transverse direction.

Chapter 4 Push-out test series-II
131
0
50
100
150
200
0.0 0.5 1.0 1.5 2.0 2.5 3.0 3.5 4.0 4.5 5.0
Slip (mm)
Load
(kN)
T6-4
0
50
100
150
200
0.0 0.1 0.2
Separation (mm)
Load
(kN)
T6-4
Figure 4.20 Load-slip and load-separation response of the tie-bar (Ø16mm) shear
connection during the loading cycles
4.5 Conclusions
The push-out test series-II further investigated the concrete-infill-only and tie-bar
(Ø16mm) shear connection. The push-out tests were designed and carried out based on
the recommendations of the push-out test series-I. The tie-bar (Ø16mm) shear
connection had an additional Ø16mm tie-bar passing through the centre of each web
opening. There were four identical specimens in each test group. One specimen of both
test groups was tested with the additional loading cycles of 25 times. The geometry of
the specimens was the same between the two test groups. The results of the push-out
tests were studied. The following conclusions were made:

Chapter 4 Push-out test series-II
132
(12) The concrete-infill-only shear connection showed the distinctive brittle
failure mode with the slip capacity of 4-5mm. The brittle failure mode was
due to that the shear connection consisted of solely the concrete infill element,
and that concrete was a brittle material.
(13) In contrast, the tie-bar (Ø16mm) shear connection showed the ductile
failure mode with the slip capacity of 12-14mm. It was shown that the tensile
strength of the tie-bar became effective combining with the concrete infill
element in the tie-bar shear connection, and that the 1m length provided the
adequate anchorage resistance to the Ø16mm tie-bar.
(14) Both types of the shear connection showed a very small amount of slip
increase during the loading cycles of 25 times, 0.18 or 0.19mm. The slip
increases were due to the crushing of the concrete infill element in the
longitudinal shear direction. It showed that the loading cycles had no effects
on the overall behaviour of the shear connection and anchorage of the tie-bars.
(15) By comparing the two types of the shear connection, the additional tie-
bars significantly increased the shear resisting capacity and ductility of the
shear connection. But the tie-bars had no influence on the slip stiffness of the
shear connection.
(16) The additional Ø16mm tie-bars increased the shear resisting capacity of
the shear connection by twofold. It was base on the shear connection of
Ø150mm web opening with 30N/mm2 concrete strength.
(17) The shear resistance of a concrete-infill-only shear connection of
Ø150mm web opening was 1.75 times the shear strength of a headed stud of
Ø19mm and 100mm height. This comparison was base on the concrete
strength of 30N/mm2.
(18) Similarly, the shear resistance of a tie-bar (Ø16mm) shear connection of
Ø150mm web opening was 3.7 times the shear strength of a headed stud of
Ø19mm and 100mm height. This comparison was base on the concrete
strength of 30N/mm2.
(19) This tie-bar (Ø16mm) shear connection showed both desired shear
resistance and ductility. This type of shear connection required no additional
welding which was required for the web-welded stud shear connection. Hence,
the tie-bar (Ø16mm) shear connection was an optimum shear connection for
the composite shallow cellular floor beams.

Chapter 4 Push-out test series-II
133
4.6 Recommendation
The brittle failure mode of concrete-infill-only shear connection was again shown in the
push-out test series-II.
It was recommended that the concrete-infill-only shear connection should
not be used alone to provide shear connection. It should be used in
combination with other elements, i.e. tie-bars or studs, to provide the
necessary ductility.
The optimum shear resistance and ductility of tie-bar (Ø16mm) shear connection
was shown in the push-out test series-II.
It was recommended the tie-bar (Ø16mm) shear connection should be
further investigated in the flexural test.
The push-out tests applied the direct longitudinal shear force to the shear
connection. This loading configuration might not fully represent the actual loading of
the shear connection in a composite beam.
It was recommended that flexural tests for the composite shallow cellular
floor beams should be carried out to investigate the behaviour and
performance of the shear connection in the composite beams.
It was recommended that the flexural test beam specimen should be
designed to represent the actual composite shallow cellular floor beams
with a common span range.
It was recommended that the web opening sizes of the flexural test beam
specimen should be the same as that of the push-out test specimens, so that
the results of the push-out test could be used in the design for the beam
specimen. And the behaviour and performance of shear connection shown
in the flexural tests could be compared with that in the push-out tests.

Chapter 5 Analytical study and FEA of the shear connection
134
Chapter 5 Analytical study and Finite Element Analysis
of the shear connection
The push-out tests, series-I and series-II, provided comprehensive information on the
behaviour and shear resisting capacity of the shear connection used for the composite
shallow cellular floor beams. The results of the push-out tests were analysed to conclude
a calculation method for shear resistance of the shear connection. A parametric study
was then carried out using Finite Element Analysis (FEA), to further verify the
calculation method in order to establish a design method for shear resistance of the
shear connection.
5.1 Introduction
The mathematical analysis on the results of the push-out tests was carried out in order to
conclude a calculation method for shear resistance of the shear connection. Base on the
failure mechanism shown in the push-out tests, the shear resistance of the shear
connection were calculated and compared with the test results. The calculation method
is then verified with results of the FEA to establish a design method for shear resistance
of the shear connection.
Because of the complex three-dimensional stress-strain state of the concrete infill
element, it was difficult to analyse it by using the mathematical model rather than the
empirical formula. The FEA of the concrete-infill-only shear connection was carried out
to further verify the calculation method concluded in the mathematical analysis. Firstly,
a calibrated FEA model of the concrete-infill-only shear connection was developed.
Then a parametric study was performed by using the calibrated FEA model to
investigate the variables of concrete strength and diameter of web opening. Finally, the
results of the FEA parametric study were compared with the calculated shear resistance
using the concluded calculation method.

Chapter 5 Analytical study and FEA of the shear connection
135
5.2 Mathematical analysis
The push-out test series-I investigated four types of the shear connection used for the
shallow cellular floor beams, i.e. concrete-infill-only, tie-bar (Ø12mm), ducting and
web-welded stud shear connection. The push-out test series-II further investigated the
concrete-infill-only and tie-bar (Ø16mm) shear connection based on the
recommendations of the push-out test series-I. The shear connection of both test series
were formed by the concrete infills with or without other additional elements, i.e. tie-bar
or shear studs, resisting the longitudinal shear force.
Type of Shear connection Failure Mechanism
Push-out test
series-I
Concrete-infill-only
Top part was crushed in the longitudinal shear
direction and the rest of concrete infill was ruptured
by tensile splitting in the transverse direction.
Tie-bar (Ø12mm)
One of tie-bars was sheared off, as it was in direct
contact with the web post; the other one remained
intact (there were two bars passing each opening).
The failure mechanism of the concrete infill element
was the same as that of the concrete-infill-only shear
connection.
Ducting
Crushing of the concrete infill element led to the
deformations of the ducting.
Concrete infill element was crushed with tensile
splitting.
Web-welded stud
The headed studs were sheared off with bending near
the root.
Concrete around the studs was crushed.
The failure mechanism of the concrete infill element
was the same as that of the concrete-infill-only shear
connection.
Push-out test
series-II
Concrete-infill-only
The failure mechanism were the same as that of the
concrete-infill-only shear connection in the push-out
test series-I.
Tie-bar (Ø16mm)
The tie-bar did not fail; the possible failure
mechanism was tensile failure.
The failure mechanism of the concrete infill element
was the same as those of the concrete-infill-only
shear connection.
Table 5.1 Summary of the failure mechanism of the shear connection

Chapter 5 Analytical study and FEA of the shear connection
136
The development of calculation method for the shear resistance of the shear
connection was based on the failure mechanism shown in the push-out tests. The push-
out tests demonstrated that the shear connection gained additional strength from the
elements of tie-bar or studs, and there was no isolated failure between the concrete
infills and the additional elements. Hence, the shear strength of the shear connection
should be the combination of the resistance of both concrete infills and additional
elements.
The failure mechanism of the shear connection shown in the push-out tests are
summarised in Table 5.1. The failure mechanism of the concrete infill element of all
shear connection was the same. The top part of the concrete infill element was crushed
by the web opening in the longitudinal shear direction and the rest of the concrete infill
element was ruptured by tensile splitting in the transverse direction. The cross sectional
areas of the concrete infill element in compression (bearing) and tensile splitting are
illustrated in Figure 5.1. The shear resistance of the concrete infill element could be
calculated by taking account of both compressive (bearing) and tensile (splitting)
resistance. This is expressed by a mathematical equation as Eqn. 5.1. For the shear
connection other than the concrete-infill-only shear connection, the total shear
resistance of the shear connection was the combination of the resistance of the concrete
infill element with the resistance of other additional elements (i.e. tie-bar or studs). This
mathematical combination is expressed in Eqn. 5.2.
There were two unknown coefficients within the Eqns. 5.1 and 5.2. The steps to
obtain these two unknown coefficients are:
(1) To substitute the actual test data into Eqn. 5.2 (the test data includes the shear
resisting capacity of the shear connection, concrete strengths and dimensions
of the web opening);
(2) To form sets of simultaneous equations with the test data of any two
specimens;
(3) Then to solve these sets of simultaneous equations to obtain the two
coefficients of a and b ;
(4) To calculate the averages of a and b ;
(5) Finally, to substitute the calculated a and b back into Eqn. 5.2 to calculate the
shear resistance of the shear connection, and to compare with the test results.

Chapter 5 Analytical study and FEA of the shear connection
137
tctccuce AfbAfaR (5.1)
Where: Ac = tD, 4
2DAt
Rce is the shear resistance of the concrete infill element;
fcu is the concrete compressive cube strength in N/mm2;
Ac is the area of concrete in the compression;
fct is the concrete tensile splitting strength in N/mm2;
At is the area of concrete in the tensile splitting;
t is the thickness of the web;
D is the diameter of the web opening;
a, b are the coefficients.
addtctccuc RAfbAfaP (5.2)
Where: Ac = tD, 4
2DAt
Pc is the shear resistance of the shear connection;
fcu is the concrete cube compressive strength in N/mm2;
fct is the concrete tensile splitting strength in N/mm2;
Ac is the area of concrete in the compression;
At is the area of concrete in the tensile splitting;
t is the thickness of the web;
D is the diameter of the web opening;
Radd is the shear resistance of the additional elements i.e. tie-
bar or shear studs;
a, b are the coefficients.
(a) (b)
Figure 5.1 Cross sectional areas of the concrete infill element in: (a) compression
(bearing), (b) tension (splitting)

Chapter 5 Analytical study and FEA of the shear connection
138
The ductile behaviour and failure mode of the tie-bar shear connection clearly
showed that the tensile strength of the tie-bars became effective and contributed to the
overall shear strength of the shear connection. The tensile resistance of the tie-bar, as
expressed in Eqn.5.3, was used in the above calculations for the coefficients of a and
b . The material strength of the tie-bars used in the calculation was the results of the
coupon tests. The yield strength obtained from the coupon tests for the Ø12mm and
Ø16mm tie-bars was 440N/mm2 and 442N/mm
2 respectively. Details of the coupon
tests are presented in Appendix C.
4
2
tbytb
DfR
(5.3)
Where: Rtb is the tensile resistance of the tie-bar;
fy is the yield strength of the tie-bar;
Dtb is the diameter of the tie-bar.
The failure mechanism of the studs in the web-welded stud shear connection was
shear failure, which was one of the dominant failure mechanism in the standard push-
out tests for the shear studs. The resistance of studs as the additional resistance, Radd, in
the above calculations for the coefficients of a and b was determined by using Eqn. 5.4
without the partial safety factor, γv. The Eqn. 5.4 was the formula given in Eurocode4
(EN1994-1-1:2004) for the design shear resistance of the headed studs. The stud’s
material strength used in the calculations was the results of the coupon tests. The yield
strength of the studs was 452N/mm2. There were eight studs combined with three
concrete infill elements to form the shear connection for each specimen of the test group
T4. Thus, the shear resistance of each shear connection was the combination of the
resistance of one concrete infill element with 2.67 studs.
V
U
Rd
dfP
4/8.0 2
(5.4)
Where PRd is the design shear resistance of the stud;
fu is the strength of material of the stud;
d is the diameter of the shank of the stud;
γv is the partial factor.
By substituting the test data into Eqn. 5.2, a total of 204 sets of simultaneous
equations were formed between any two push-out test specimens. There were in total of
24 test specimens in the two test series, but test results of 21 test specimens were used in

Chapter 5 Analytical study and FEA of the shear connection
139
the analysis. The results of specimens, T1-A-N and T1-A-F (test group T1), were
omitted from the analysis, as the set up of the push-out tests for these two specimens
was different from all other specimens. No plaster (gypsum) was applied on the rig
platform for these two specimens; hence, eccentric loading might have caused the
specimens to fail at lower load levels. Also, specimen of T4-B-A was omitted from the
analysis, as the specimen was not failed due to the capacity of the hydraulic jack was
reached.
The coefficients a and b were obtained by solving the simultaneous equations of
Eqn.5.2. Then the empirical values of a and b were calculated by taking averages;
a =1.6758 and b =1.4355. Hence, Eqns. 5.1 and 5.2 became Eqns. 5.5 and 5.6,
respectively as:
tctccuce AfAfR 355.41758.61 (5.5)
addtctccuc RAfAfP 355.41758.61 (5.6)
Where: Ac = tD
4
2DAt
Rce is the shear resistance of the concrete infill element;
Pc is the shear resistance of the shear connection;
fcu is the concrete cube compressive strength in N/mm2;
fct is the concrete tensile splitting strength in N/mm2;
Ac is the area of concrete in the compression;
At is the area of concrete in the tensile splitting;
t is the thickness of the web;
D is the diameter of the web opening;
Radd is the shear resistance of the additional elements i.e. tie-
bar or shear studs.
Finally, the push-out test results were compared with the calculated shear
resistance of the shear connection using Eqn. 5.6. The actual concrete strengths of the
specimens were used in the calculations. The comparison is shown in Table 5.2. It was
shown that the results of the calculations were very close to the test results. The overall
ratio of calculated shear resistance to test results was 0.935. This demonstrated that the
empirical coefficients determined for Eqn. 5.6 was reliable. Also, it was further
demonstrated that the method was valid for expressing shear resistance of the shear

Chapter 5 Analytical study and FEA of the shear connection
140
connection using the compressive and tensile resistance of the concrete infill element
combined with the resistance of other additional elements (i.e. tie-bar and studs).
The two specimens omitted from the analysis, T1-A-N and T1-A-F, also showed
higher ratios of calculated shear resistance to test results, as listed in Table 5.2. It was
necessary to discuss for the ducting shear connection, which showed very small shear
resistance in the push-out tests. The ducting itself provided very small shear resistance
due to its geometry and thickness. The other factor causing the small shear resistance
for the ducting shear connection was the amount of the concrete infill element
surrounding the ducting was very small. The ducting buckled when the concrete infill
was crushed by the web opening in the direction of the longitudinal shear force. As the
shear resistance of the ducting shear connection would barely contribute towards the
overall shear transferring mechanism, hence the shear resistance of the ducting shear
connection should not be included into the future design calculation.
The shear connection investigated in this research were similar to the Perfobond
rib shear connection reviewed in Chapter 2, which had concrete dowels passing through
the holes that perforated on the ribs. The ribs were welded onto the top flange of the
steel section. The concrete dowels combined with or without rebar to transfer
longitudinal shear force. But the concrete dowels of the Perfobond rib shear connection
were about 35mm to 50mm in diameter which were much smaller than the concrete
infills of 150 and 200mm diameter investigated in this research. The failure mechanism
of the concrete dowels of the Perfobond rib was mainly due to the shear failure with
crushing. Oguejiofor and Hosain (1992) (2) concluded a design formula, Eqn. 2.15, for
the shear capacity of the Perfobond rib shear connection, using '
cf to represent the
shear strength and the compressive (bearing) strength of the concrete dowels;
where '
cf is the concrete compressive strength. Nevertheless, Oguejiofor and Hosain
(1997) modified (or corrected) the design formula, as shown in Eqn. 2.17, using'
cf to
represent the shear strength and '
cf to represent the compressive strength of the concrete
dowels.
As the push-out tests demonstrated the compressive and tensile splitting failure of
the concrete infill elements, therefore it was incorrect to calculate the resistance of the
concrete infill elements based on the shear failure mechanism. Thus, the term of

Chapter 5 Analytical study and FEA of the shear connection
141
'
cf should not be used to calculate the resistance of the concrete infill elements, as
'
cf represented the shear strength, rather than the compressive or tensile strength.
The method of calculation and formula, Eqn. 5.6 concluded for the shear
resistance of the shear connection in the above mathematical analysis would be further
verified by using the Finite Element Analysis (FEA) presented in the next section.

142
Specimen
No.
fcu
(N/mm2)
fct
(N/mm2)
Ac
(mm2)
At
(mm2)
fcuAc
(kN)
fctAt
(kN)
Radd
(kN)
Calculation *
Pc (kN) Test results
(kN) Ratio
(cal/test)
T1-A-N 56.5 4.53 1290 17671 72.89 80.05 -- 237 118 2.009
T1-A-F 58.1 4.85 1290 17671 74.95 85.71 -- 249 131 1.898
T1-B-N 56.5 4.53 1980 31416 111.87 142.31 -- 392 362 1.082
T1-B-F 58.1 4.85 1980 31416 115.04 152.37 -- 412 397 1.037
T2-A-N 54.5 4.54 1290 17671 70.31 80.23 100 333 309 1.078
T2-A-F 51.9 4.07 1290 17671 66.95 71.92 100 315 305 1.034
T2-B-N 54.5 4.54 1980 31416 107.91 142.63 100 486 390 1.245
T2-B-F 51.9 4.07 1980 31416 102.76 127.86 100 456 372 1.225
T3-A-N 55.2 3.91 215 ^ 5400 11.87 21.11 -- 50 47 1.068
T3-A-F 51.5 3.89 215 ^ 5400 11.07 21.00 -- 49 50 0.974
T3-B-N 55.2 3.91 495 ^ 13744 27.32 53.74 -- 123 125 0.983
T3-B-F 51.5 3.89 495 ^ 13744 25.49 53.47 -- 119 137 0.872
T4-A-N 67.0 4.66 1290 17671 86.43 82.35 272 535 504 1.062
T4-A-F 50.2 4.08 1290 17671 64.76 72.10 272 484 427 1.134
T4-B-N 67.0 4.66 1980 31416 132.66 146.40 272 -- -- --
T4-B-F 50.2 4.08 1980 31416 99.40 128.18 272 623 497 1.253
P5-1 35.0 3.21 1290 17671 45.15 56.73 -- 157 227 0.693
P5-2 35.0 3.21 1290 17671 45.15 56.73 -- 157 194 0.808
P5-3 32.0 2.9 1290 17671 41.28 51.25 -- 143 179 0.798
P5-4 30.0 3.02 1290 17671 38.70 53.37 -- 141 164 0.865
P6-1 29.0 2.85 1290 17671 37.41 50.36 90 225 391 0.575
P6-2 32.0 2.92 1290 17671 41.28 51.60 90 233 386 0.604
P6-3 28.0 2.49 1290 17671 36.12 44.00 90 214 327 0.654
P6-4 27.0 2.57 1290 17671 34.83 45.42 90 214 358 0.597
* Calculation uses Eqn. 5.6 with coefficients of a = 1.6758 and b = 1.4355. ^ Compressive area, Ac,
calculated by using t (D-Dd) where t is web thickness, D is web opening diameter, Dd is diameter of ducting. Overall ratio 0.935
Table 5.2 Comparison of test results with calculated shear resistance using Eqn. 5.6

Chapter 5 Analytical study and FEA of the shear connection
143
5.3 FEA of the concrete-infill-only shear connection
The shear connection used for the composite shallow cellular floor beams was formed
by the unique feature of the web openings. The shear transferring mechanism was
different from the conventional shear studs. Two series of push-out tests were carried
out to investigate the behaviour and shear resisting capacity of the shear connection. In
order to further verify the concluded method of calculation for shear resistance of the
shear connection, the FEA was performed.
The tests results showed that the concrete infill elements were difficult to analyse
using conventional mathematical models, as the concrete infill elements were in a
complex stress-strain state. For this reason, the FEA was used to study the concrete-
infill-only shear connection. A software package, ANSYS (11.0), was used to carry out
the FEA. The results of the FEA were compared with the results of the push-out tests to
establish a calibrated FEA model. A parametric study was then carried out using
calibrated FEA model to investigate variables of concrete strength and diameter of the
web openings. The FEA parametric study enables the verification of the shear resistance
calculation method developed in the mathematical analysis.
5.3.1 Geometrical modelling
The concrete-infill-only shear connection of 150mm diameter was first geometrically
modelled using the geometrical properties of the push-out test specimens. Due to the
symmetric geometry of the test specimens, only a quarter of the specimen was modelled
with appropriate boundary conditions. The model, as shown in Figure 5.2a, contained
only one shear connection rather than three shear connection in the push-out test
specimens. The purpose was to save the computing cost of the FEA.
The concrete slabs were modelled using Solid65, a three-dimensional solid
element. The schematic illustration of the element is shown in Figure 5.3a. This element
had plasticity, creep, swelling, stress stiffening, large deflection and large strain
capabilities. Most significantly, the element was capable of modelling cracking in
tension and crushing in compression. The element was defined by eight nodes with
three degrees of freedom at each node: translations in the nodal x, y and z directions.
The steel section was modelled using Solid95, a solid element. The schematic
illustration of this 3-D element is shown in Figure 5.3b. The element tolerated irregular
shapes without losing much of its accuracy. This element was well suited to model
curved boundaries. The Solid95 element was defined by 20 nodes with three degrees of

Chapter 5 Analytical study and FEA of the shear connection
144
freedom per node: translations in the nodal x, y and z directions. The element had
plasticity, creep, stress stiffening, large deflection and large strain capabilities.
The geometry model was then meshed using the designated mesh tool with
controlled element sizes. The steel volume was meshed using a size of 12mm elements.
The concrete volume was meshed using three different sizes of the element, i.e. 15, 30
and 50mm, as shown in Figure 5.2b. The region close to the steel section and containing
the concrete-infill-only shear connection was meshed using the element size of 15mm.
The regions away from the shear connection were meshed with 30mm elements and
50mm elements for far end section. The element size of 15mm used to mesh the shear
connection was determined base on the element size analysis shown in Appendix D.
The 15mm was an optimum element size for modelling concrete material, as bigger
element sizes would lose accuracy and smaller element sizes would increase
computational cost without the increase of accuracy.
(a) (b)
Figure 5.2 FEA model of a 1/4 of the test specimen with one concrete-infill-only shear
connection of Ø150mm (a) geometry model, (b) meshed model
5.3.2 Material modelling
The measured material properties obtained in the push-out test were used as the material
property inputs for the FEA calibration. The theoretical backgrounds of the concrete and
steel material model are explained in the following two sections.

Chapter 5 Analytical study and FEA of the shear connection
145
(a) (b)
Figure 5.3 (a) Concrete element of Solid65; (b) Steel element of Solid 95
5.3.2.1 Concrete material model
The concrete element of Solid65, shown in Figure 5.3a, predicted brittle failure with
cracking and crushing failure modes. The concrete material was assumed to be initially
isotropic. The modulus of the elasticity of concrete, Ecm and the Poisson’s ratio, υ, were
defined for the elastic behaviour of the concrete. The input of the Ecm for the FEA
calibration was determined based on Eurocode 2 (EN1992-1-1:2004), as shown in Eqn.
5.7. In accordance with the Eurocode 2 (EN1992-1-1:2004), the Poisson’s ratio of
concrete was taken as 0.2 for all strengths of concrete.
3.010/22 ccm fE (5.7)
Where: Ecm is the modulus of elasticity of concrete in 103N/mm
2;
fc is the mean compressive strength in N/mm2.
The material nonlinearity for concrete was discribed by a stress-strain curve
implemented in the FEA. This stress-strain curve was considered as an isotropic
material property together with the failure surface model defined by the FEA to model
the concrete material. The concrete stress-strain curve for the FEA, as shown in Figure
5.4, had three sections, namely: linear elastic, parabolic nonlinearity and constant stress
plateau. In accordance with Eurocode 2 (EN1992-1-1:2004), the linear elastic region
was defined by the modulus of elasticity of concrete, Ecm, and 40% of the compressive
strength as the stress limit for linear elastic. Within the parabolic region up to the peak
stress, the stress and strain were determined by using Eqn. 5.8 given in Eurocode2
(EN1992-1-1:2004). Beyond the peak stress, fc, the concrete strain would reach the
maximum value of 0.0035 for all strength classes of concrete.

Chapter 5 Analytical study and FEA of the shear connection
146
The actual declining strength of concrete after a strain of 0.0035 was not included
in the material model for the FEA. It was very difficult or impossible to obtain the
convergence by including the declining strength, as the numerical solution for the FEA
would become highly discontinuous if the declining strength of concrete was included.
These local instabilities often generated large amount of crushing which caused the
model fail prematurely. The FEA used the maximum strain criteria to determine the
concrete whether destruction. Crushing of the concrete started to develop in the
elements located directed under the loads. Subsequently, adjacent elements crushed as
load increases. Finally, the FEA model converged or the global solution finished when
the convergence criteria were satisfied. These convergence criteria consisted of force
and displacement tolerances. The values of these convergence criteria for the FEA were
the default setting of the FEA program. The default setting was demonstrated as
adequate in the later calibration study on the concrete-infill-only shear connection, as no
convergence difficulties were encountered.
Figure 5.4, Concrete stress-strain curve for the FEA
21
2
k
k
f c
c (5.8)
Where: σc is the concrete compressive stress in N/mm2;
fc is the compressive strength in N/mm2;
ccm fEk c105.1
1cc
εc is the concrete compressive strain;

Chapter 5 Analytical study and FEA of the shear connection
147
εc1 is the concrete compressive strain at the peak stress;
331.0
1 10/7.0 cc f
The failure behaviour of concrete was defined as a failure surface model in the
FEA. The criterion for the failure surface model due to multiaxial stress state is
expressed in Eqn. 5.9 (ANSYS 11.0) as:
0 Sf
F
c
(5.9)
Where: F is a function of the principle stress state (σxp, σyp, σzp,);
S is the failure surface expressed in terms of principle
stresses and five parameters (ft, fc, fcb, f1 and f2) defined
in Table 5.4;
fc is the uniaxial crushing (compressive) strength.
If Eqn. 5.9 was not satisfied, the material would not crack or crush. Otherwise, the
material would crack if any principle stress was tension, while crushing would occur if
all principle stresses were compression. A total of five input strength parameters were
needed to define the failure surface, i.e. ft, fc, fcb, f1 and f2, as listed in Table 5.3. The
failure surface could be specified with a minimum of two parameters, ft and fc. The
other three were defaults determined by Willam and Warnke (1974) as:
fcb = 1.2 fc (5.10)
f1 = 1.45 fc (5.11)
f2 =1.725 fc (5.12)
However, these default values were valid only for stress states where the
following condition was satisfied:
ch f3 (5.13)
Where: σh = hydrostatic state = zpypxp
3
1.
A shear transfer coefficient, βt, for open cracks was defined in the concrete
material model, representing a shear strength reduction factor for loads which induced
sliding across the crack face. If the cracks closed, then all compressive stresses normal
to the crack plane were transmitted across the crack and only a shear transfer
coefficient, βc, for close cracks was used in the model. Typical shear transfer
coefficients ranged from 0 to 1.0, with 0 representing a smooth crack (complete loss of

Chapter 5 Analytical study and FEA of the shear connection
148
shear transfer) and 1.0 representing a rough crack (no loss of shear transfer). This
specification was made for both the closed and open cracks.
The concrete material inputs for the FEA calibration are summarised in Table 5.3.
The uniaxial compressive strength, fc, was the mean compressive strength obtained in
the push-out tests. The uniaxial tensile strength, ft, was the mean cylinder splitting
strength obtained in the push-out tests. The biaxial compressive strength, fcb, was
determined by using Eqn. 5.10. The concrete stress-strain curves for uniaxial
compressive strength of 30, 32 and 35N/mm2 are shown in Appendix L.
The input of βt and βc were 0.25 and 0.75 respectively, which enabled some shear
transfer for the material model. The results of the FEA calibration showed that the
variation in these two parameters had almost no influence on the behaviour and results
of the shear connection.
The input of the parameters of σha, f1 and f2 should have been omitted, as the push-
out tests were not carried out in a hydrostatic stress state. However, the model was
unable to run if these inputs were left blank or zero. A very small input of 10E-6 was
chosen for these parameters. The input of the stiffness multiplier, μs, was the default
value of 0.6.
Parameters Descriptions Input
Ecm Modulus of the elasticity of concrete (103N/mm
2) 32800 33300 34000
υ Poisson’s ratio 0.2 0.2 0.2
βt Shear transfer coefficient for an open crack 0.25 0.25 0.25
βc Shear transfer coefficient for a close crack 0.75 0.75 0.75
ft Ultimate uniaxial tensile strength (N/mm2) 2.85 3.0 3.25
fc Ultimate uniaxial compressive strength (N/mm2) 30 32 35
fcb Ultimate biaxial compressive strength (N/mm2) 36 38.4 42
σha Ambient hydrostatic stress state 10E-6 10E-6 10E-6
f1 Ultimate compressive strength for a state of
biaxial compression superimposed on σha
10E-6 10E-6 10E-6
f2 Ultimate compressive strength for a state of
uniaxial compression superimposed on σha
10E-6 10E-6 10E-6
μs Stiffness multiplier for cracked tensile condition
(default=0.6) 0.6 0.6 0.6
Table 5.3 Concrete material property inputs for the FEA calibration
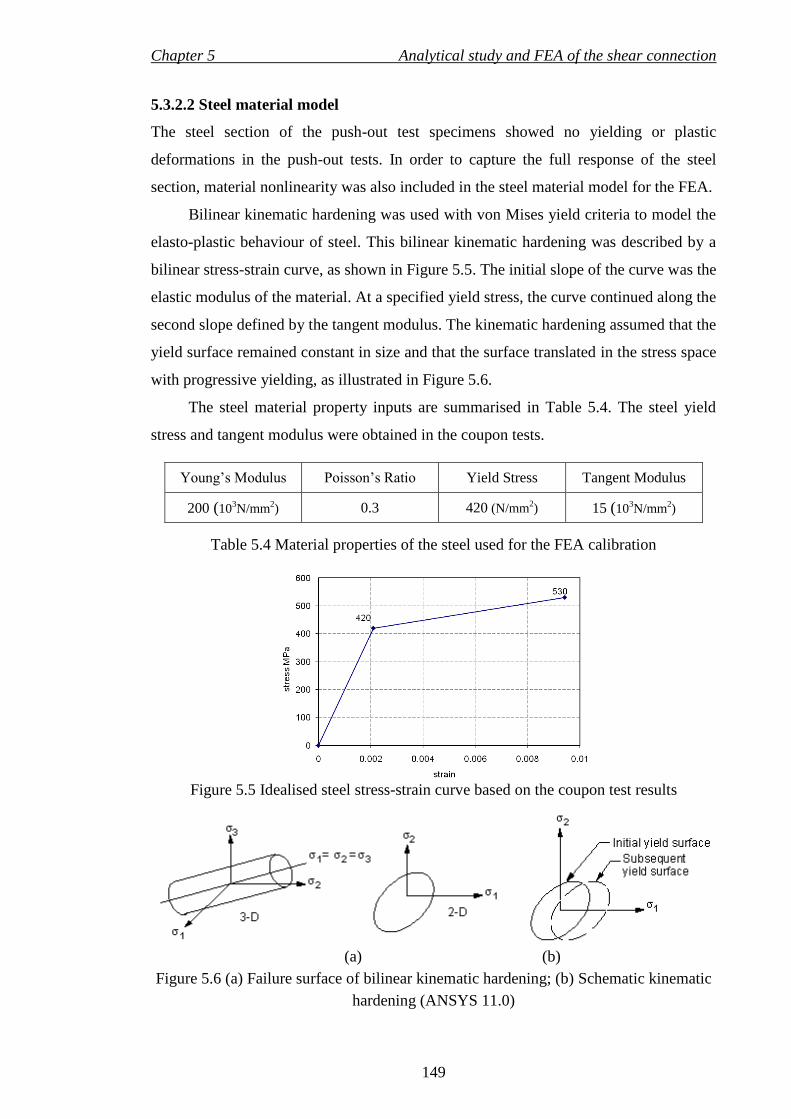
Chapter 5 Analytical study and FEA of the shear connection
149
5.3.2.2 Steel material model
The steel section of the push-out test specimens showed no yielding or plastic
deformations in the push-out tests. In order to capture the full response of the steel
section, material nonlinearity was also included in the steel material model for the FEA.
Bilinear kinematic hardening was used with von Mises yield criteria to model the
elasto-plastic behaviour of steel. This bilinear kinematic hardening was described by a
bilinear stress-strain curve, as shown in Figure 5.5. The initial slope of the curve was the
elastic modulus of the material. At a specified yield stress, the curve continued along the
second slope defined by the tangent modulus. The kinematic hardening assumed that the
yield surface remained constant in size and that the surface translated in the stress space
with progressive yielding, as illustrated in Figure 5.6.
The steel material property inputs are summarised in Table 5.4. The steel yield
stress and tangent modulus were obtained in the coupon tests.
Young’s Modulus Poisson’s Ratio Yield Stress Tangent Modulus
200 (103N/mm
2) 0.3 420 (N/mm
2) 15 (10
3N/mm
2)
Table 5.4 Material properties of the steel used for the FEA calibration
Figure 5.5 Idealised steel stress-strain curve based on the coupon test results
(a) (b)
Figure 5.6 (a) Failure surface of bilinear kinematic hardening; (b) Schematic kinematic
hardening (ANSYS 11.0)

Chapter 5 Analytical study and FEA of the shear connection
150
5.3.3 Boundary conditions
Boundary conditions were applied on the support and planes of symmetry. All degrees
of freedom were restricted for the nodes on the support. The nodes on the cutting plane
of the steel web and concrete infill element were restricted in the x direction due to
symmetry. Similarly, the nodes on the cutting plane of the concrete slab were restricted
in the y direction due to symmetry, as shown in Figure 5.7.
Figure 5.7 Planes of symmetry for the boundary conditions
5.3.4 Contact model
The interaction between the steel elements and concrete element was modelled using
contact elements for the FEA calibration. Contact models were highly nonlinear and
their response could have made solution convergence difficult. It was therefore
paramount to define a correct contact model for the FEA, as the amount of penetration
between the two materials should be equal to the slip results of the shear connection.
The model used for the FEA was treated as a rigid-to-flexible contact problem.
The steel section was considered as a rigid volume, which had a higher stiffness relative
to the deformable concrete volume. The steel elements at the interface were modelled as
a target surface using the element, TARGE170. The concrete elements at the interface
were modelled as a contact surface using the element, CONTA174. Both contact
elements were capable of modelling 3-D curved surfaces and permitting large sliding.
The behaviour of the contact model for the FEA was largely influenced by several
factors, which are discussed in the following three sections.
Planes of symmetry
Y
Z
X

Chapter 5 Analytical study and FEA of the shear connection
151
Initial contact conditions
The rigid body motions were constrained only by the presence of the contact elements
in the FEA for the shear connection. It had to be designed in such a way that the contact
pairs would be in contact in the initial geometry. In the other words, the contact pairs
had to be “just touching”. The initial penetration was excluded in the contact model for
the FEA calibration to ensure the correct initial contact. These small initial penetrations
were caused by numerical round-off during the mesh generation.
Penetration tolerance
The penetration tolerance, FTOLN, was used in conjunction with the augmented
Lagrangian method, the default contact algorithm for surface-to-surface contact
elements. FTOLN was a factor based on the thickness of the element to specify an
allowable maximum penetration for the augmented Lagrangian method. If any
penetration larger than this tolerance was detected, the global solution would be
unconverged, even though the residual forces and displacements were within the
convergence criteria. The default FTOLN was 0.1. The FEA calibration showed that the
default, 0.1, caused an excessive number of iterations and non-convergence at very
small slips. By using an FTOLN of 1.0, a good comparison for the slips between the
FEA and the push-out tests was achieved.
Contact stiffness
The amount of penetration between the two surfaces was dependent on contact stiffness.
Higher contact stiffness could lead to a decrease in the amount of penetration and
convergence difficulties. The FEA program estimated a default value for the contact
stiffness based on the material properties of the underlying deformable elements. A real
constant, FKN, was used to specify either a scaling factor or an absolute value for
contact stiffness. If the FKN was underestimated, global convergence difficulties might
be caused by too much penetration rather than by residual forces. If the FKN was
overestimated, global convergence might require many equilibrium iterations for
achieving convergence tolerance of forces and displacement rather than penetration. An
optimum FKN of 0.08 was achieved for the FEA calibration.

Chapter 5 Analytical study and FEA of the shear connection
152
5.3.5 Application of load
The pressure was applied as load to the steel section in the FEA. The total amount of
load was divided into a number of substeps in the FEA to simulate the incremental loads
applied in the push-out tests. The Automatic Time Stepping (ATS) was enabled in the
FEA to ensure that the optimum load increment was used when the nonlinear response
of the model occurred. The ATS option also permitted bisection to allow recovery if
convergence failed.
By default, the FEA automatically enabled the Newton-Raphson option. The line
search option in the FEA was turned on to improve a Newton-Raphson solution by
scaling the solution vector by a scalar value called the line search parameter.
5.3.6 The calibration results
The FEA of the concrete-infill-only shear connection was carried out by using the
material strengths obtained in the push-out tests. The results of the FEA were calibrated
with the results of the push-out tests. The results of the test group T5 were used in the
calibration to compare with the results of FEA, as the test group had four identical
specimens and the test results were consistent.
The comparisons for the failure loads and slips between the push-out tests and the
FEA are summarised in Table 5.5. The identical slip stiffness was shown between the
results of the FEA and push-out tests are illustrated in Figures 5.8 and 5.9. Both failure
loads and slips of the FEA were very close to those of the push-out tests. The average
ratio for the failure loads between the results of the FEA and push-out tests was 0.9. The
average ratio for the slips between the results of the FEA and push-out tests was 1.01.
Test
Reference
Concrete
strength
fc (MPa)
Failure load Slip
Push-out
Test (kN)
FEA
(kN)
Ratio
(Test/FEA)
Push-out
Test (mm)
FEA
(mm)
Ratio
(Test/FEA)
T5-1 35 227 221 1.03 4.84 4.51 1.07
T5-2 35 194 221 0.88 3.90 4.51 0.86
T5-3 32 182 212 0.86 3.92 4.21 0.93
T5-4 30 164 196 0.84 4.44 3.83 1.16
average 0.90 average 1.01
Table 5.5 Comparisons between the results of the push-out tests and FEA

Chapter 5 Analytical study and FEA of the shear connection
153
The brittle failure mode of the concrete-infill-only shear connection was shown by
the FEA, as illustrated in Figures 5.8 and 5.9. The FEA models converged at the failure
point as the maximum load was reached. The slip and stress contour plots of the FEA
for the model with fc of 30N/mm2 are shown in Figures 5.10 and 5.11, respectively. The
Figure 5.11 contained stress plots of three different dimensions, namely vertical
direction (compression), direction in line with the web post, and transverse direction
(tensile splitting).
The stress plots clearly demonstrated the compression and tension region of the
concrete infill shear connection when subjected to the direct longitudinal shear force.
The compression region was at the top part of the concrete infill, as shown in Figure
5.11a. It was shown that the ultimate compressive strength of the concrete was reached,
but the yield stress of the steel was not reached. The tensile splitting region of the shear
connection was also clearly shown in the stress plot, Figure 5.11c, as the tensile stress
reaches 2.969N/mm2 which was slightly greater than the concrete tensile strength of
2.90N/mm2. These stress results of the FEA confirmed the failure mechanism of the
shear connection concluded from the push-out tests, which the failure of the concrete
infill element was due to the combination of compression and tension. The contour plots
for the FEA models with the concrete compressive strength, fc, of 32N/mm2 and
35N/mm2 are shown in Appendix E.
The calibration had shown the excellent agreements between the results of the
FEA and push-out tests, in the terms of the failure load, slip, stress results and failure
mode. It was demonstrated that the FEA model used for the calibration was reliable and
could be used to carry out a parametric study on the concrete-infill-only shear
connection, in order to further verify the Eqn. 5.6 which was the formula obtained for
the shear resistance of the shear connection from the mathematical analysis, as shown in
Section 5.2.

Chapter 5 Analytical study and FEA of the shear connection
154
0
50
100
150
200
250
300
350
400
0 2 4 6 8 10
Slip (mm)
Load
(kN)
T5-1
T5-2
T5-3
T5-4
FEA-fc(30)
FEA-fc(32)
FEA-fc(35)
Figure 5.8 Comparison of load-slip curves between FEA models and push-out tests
0
50
100
150
200
250
300
350
400
0 2 4 6 8 10
Slip (mm)
Load
(kN)
T5-1
T5-2
FEA-fc(35)
Figure 5.9 Comparisons of load-slip curves between the FEA model and push-out tests
for the concrete compressive strength, fc, of 35 N/mm2
Failure point
of FEA

Chapter 5 Analytical study and FEA of the shear connection
155
(a) (b)
Figure 5.10 Contour plots of: (a) vertical displacement (slips); (b) cracks
(a)

Chapter 5 Analytical study and FEA of the shear connection
156
(b)
(c)
Figure 5.11 Stress contour plots of concrete and steel volumes: (a) compression (vertical
direction), (b) stress in line with web post (y-directional), (c) tensile (x-direction)
5.3.7 Parametric study
The calibrated FEA model of the concrete-infill-only shear connection was used to carry
out a parametric study. The variable parameters investigated in the FEA parametric
study were strength of concrete and diameter of the web opening. The concrete strength
was varied between 25 to 60N/mm2, and the web opening diameter was varied between
100, 150 and 200mm.
The FEA models for the concrete-infill-only shear connection with Ø100mm and
Ø200mm web openings were developed. These FEA models contained the same types
of elements, boundary conditions and contact model with that calibrated FEA model

Chapter 5 Analytical study and FEA of the shear connection
157
with Ø150mm web opening. The FEA model with Ø100mm web opening, as shown in
Figure 5.12a, had the same geometry properties as that of the calibrated FEA model
with Ø150mm web opening apart from the size of the web opening. The FEA model
with Ø200mm web opening was developed by using the geometry properties of the
push-out test specimens, T1-B-N or T1-B-F, which had web openings of Ø200mm. The
meshed FEA model with Ø200mm web opening is shown in Figure 5.12b.
The results of the FEA parametric study are summarised in Table 5.6. The load-
slip curves of the FEA models with the web opening diameter of 100, 150 and 200mm,
are illustrated in Figures 5.13, 5.14 and 5.15 respectively. These load-slip curves
demonstrated that the FEA models with the same web opening diameter had the same
slip stiffness, but the failure loads and slips varied with the concrete strengths.
The slip results were also compared for the FEA models with different web
opening diameters at the concrete strengths of 30, 45 and 60N/mm2, as shown in Figures
5.16, 5.17 and 5.18 respectively. It was shown that slip stiffness of the concrete-infill-
only shear connection was influenced by the diameters of the web openings, as the slip
stiffness of the FEA models increased with the increase of web opening diameter. The
FEA of the concrete-infill-only shear connection also demonstrated that the failure loads
were dependent on the diameter of the web opening. For the shear connection with the
same concrete strengths, the failure loads increased with the increase of web opening
diameters.
(a) (b)
Figure 5.12 FEA models of the concrete-infill-only shear connection with web opening
diameters of (a) 100mm, (b) 200mm

Chapter 5 Analytical study and FEA of the shear connection
158
Concrete Strength Failure Load (kN) of the
FEA Model
Ultimate Slip (mm) of the
FEA Model
fc (MPa) ft (MPa) Ø100mm Ø150mm Ø200mm Ø100mm Ø150mm Ø200mm
25 2.56 82 171.4 263.6 2.62 3.19 3.93
28 2.77 84.1 187.0 276.5 2.68 3.56 4.22
30 2.90 86.3 196.4 286.3 2.76 3.84 4.43
32 3.02 91.5 212.4 299.1 2.92 4.21 4.63
35 3.21 94.2 221.7 311.5 3.01 4.51 4.83
38 3.39 97.1 237.1 324.2 3.12 4.95 5.07
40 3.51 99.8 249.3 336.8 3.18 5.28 5.36
42 3.62 104.6 268.0 347.6 3.38 5.87 5.59
45 3.80 108.6 280.5 361.3 3.54 6.21 5.85
48 3.96 113.2 286.3 375.1 3.71 6.45 6.04
50 4.07 120.1 301.7 382.7 3.96 6.84 6.21
52 4.12 125.8 307.9 398.8 4.14 7.11 6.49
55 4.21 132.1 314.1 406.2 4.39 7.34 6.78
58 4.30 137.5 329.4 423.0 4.67 7.79 7.27
60 4.35 143.2 332.5 430.9 4.83 7.95 7.47
fc is the concrete compressive strength , ft is the concrete tensile strength
Table 5.6 Results of the failure loads and slips of the FEA parametric study
0
50
100
150
200
250
300
350
400
0 2 4 6 8 10
Slip (mm)
Load
(kN)
T5-1 T5-2
T5-3 T5-4
FEA-fc(25) FEA-fc(28)
FEA-fc(30) FEA-fc(32)
FEA-fc(35) FEA-fc(38)
FEA-fc(40) FEA-fc(42)
FEA-fc(45) FEA-fc(48)
FEA-fc(50) FEA-fc(52)
FEA-fc(55) FEA-fc(58)
FEA-fc(60)
Figure 5.13 Load-slip curves of the FEA concrete-infill-only shear connection with
Ø150mm web opening
Push-out
tests results

Chapter 5 Analytical study and FEA of the shear connection
159
0
50
100
150
200
250
300
350
400
450
500
0 2 4 6 8 10 12 14 16 18 20
Slip (mm)
Load
(kN)
T1-B-F FEA-fc(25)
FEA-fc(28) FEA-fc(30)
FEA-fc(32) FEA-fc(35)
FEA-fc(38) FEA-fc(40)
FEA-fc(42) FEA-fc(45)
FEA-fc(48) FEA-fc(50)
FEA-fc(52) FEA-fc(55)
FEA-fc(58) FEA-fc(60)
Figure 5.14 Load-slip curves of the FEA concrete-infill-only shear connection with
Ø200mm web opening
0
25
50
75
100
125
150
175
200
0 1 2 3 4 5 6
Slip (mm)
Load
(kN)
FEA-fc(25) FEA-fc(28)
FEA-fc(30) FEA-fc(32)
FEA-fc(35) FEA-fc(38)
FEA-fc(40) FEA-fc(42)
FEA-fc(45) FEA-fc(48)
FEA-fc(50) FEA-fc(52)
FEA-fc(55) FEA-fc(58)
FEA-fc(60)
Figure 5.15 Load-slip curves of the FEA concrete-infill-only shear connection with
Ø100mm web opening
Push-out
tests result

Chapter 5 Analytical study and FEA of the shear connection
160
0
50
100
150
200
250
300
350
400
450
500
0 2 4 6 8 10
Slip (mm)
Load
(kN)
Ø150mm-FEA-
fc(30)
Ø200mm-FEA-
fc(30)
Ø100mm-FEA-
fc(30)
Figure 5.16 Load-slip curves of the FEA concrete-infill-only shear connection with
concrete strength of 30N/mm2 but different diameters of web opening
0
50
100
150
200
250
300
350
400
450
500
0 2 4 6 8 10
Slip (mm)
Load
(kN)
Ø150mm-FEA-
fc(45)
Ø200mm-FEA-
fc(45)
Ø100mm-FEA-
fc(45)
Figure 5.17 Load-slip curves of the FEA concrete-infill-only shear connection with
concrete strength of 45N/mm2 but different diameters of web opening

Chapter 5 Analytical study and FEA of the shear connection
161
0
50
100
150
200
250
300
350
400
450
500
0 2 4 6 8 10
Slip (mm)
Load
(kN)
Ø150mm-FEA-
fc(60)
Ø200mm-FEA-
fc(60)
Ø100mm-FEA-
fc(60)
Figure 5.18 Load-slip curves of the FEA concrete-infill-only shear connection with
concrete strength of 60N/mm2 but different diameters of web opening
5.3.8 Verification of the shear resistance calculation method
The method for calculating the shear resistance of the shear connection, Eqn. 5.6, was
the sum of three terms: the compressive resistance and tensile resistance of the concrete
infill element, and the resistance of the additional elements, i.e. re-bar or studs. The first
two terms constituted the shear resistance of the concrete infill element. The method of
combining the compressive and tensile resistance to calculate the shear resistance of the
concrete infill element was based on the failure mechanism shown in the push-out tests.
This failure mechanism was further confirmed by the FEA, as analysed in Section 5.3.6.
The method of combining the shear resistance of the concrete infill element with
the resistance of the additional elements to calculate the total shear resistance of the
shear connection was based on a number of grounds.
The push-out tests showed the significantly gained shear resistance from
the additional elements, i.e. tie-bar or studs. The calculation for the
additional shear resistance was based on the failure mechanism of the
additional elements.
The test group T4 and T6 for the web-welded stud and tie-bar (Ø16mm)
shear connection showed there was no isolated failure between the
additional elements and concrete infill elements. Hence, the shear resisting

Chapter 5 Analytical study and FEA of the shear connection
162
mechanism of the shear connection was due to the combined effect of both
the concrete infills and the additional elements; and they both contributed
to the shear resistance of the shear connection.
Although, the test group T3 for the tie-bar (Ø12mm) shear connection
showed the local shear failure of the tie-bar positioned close to the edge of
the web openings. But a minimum distance of 20mm between the tie-bar
and web openings was recommended for the construction practice in order
to prevent the shear failure for the tie-bar and to utilise its tensile
resistance.
By comparing the results of test group T5 (concrete-infill-only) and T6
(tie-bar Ø16mm), as illustrated in Figure 4.9, the combined effect of the
concrete infill and the tie-bar was very apparent. The only difference
between the specimens of these two test groups was the additional Ø16mm
tie-bar passing through the centre of the web openings. The shear
resistance of the shear connection increased by twofold with the additional
Ø16mm tie-bar. Nevertheless, the slip stiffness of the two types of shear
connection was the same. Thus the additional tie-bar had no contribution
toward to the slip stiffness of the shear connection. If the additional tie-bar
altered the shear resisting mechanism of the concrete infill element, then
the slip behaviour of the shear connection would be different. Therefore,
the method for calculating the shear resistance of the concrete infill (used
in combination with the tie-bar) should be unchanged as expressed in
Eqn.5.5.
Comparing with the concrete-infill-only shear connection, ductile slip
behaviour was shown by the shear connection with the additional tie-bar.
It was indicated that the tensile resistance of the tie-bar became effective
and contributed to the overall performance of the shear connection.
Moreover, there was no anchorage failure of the tie-bar, nor the shear
failure of the tie-bar as positioned at the centre of the web opening.
Therefore, the resisting mechanism of the tie-bar combined with the
concrete infill element in transferring the longitudinal shear force was the
tensile resistance, as illustrated in Figure 5.19b.

Chapter 5 Analytical study and FEA of the shear connection
163
The tensile resistance of the tie-bar was in the same direction as the tensile
splitting force of the concrete infills, as shown in Figure 5.19b, thus the
additional tie-bar eliminated the brittle failure mode. The tie-bar acted
together with the concrete infill providing much increased resistance in the
transverse direction (or horizontal direction shown in Figure 5.19).
Based on the above evidence, the tensile resistance of the tie-bar could be
added to the shear resistance of the concrete infill element to calculation
the shear resistance of the shear connection.
The FEA did not consider the combined effect of the tie-bar reinforcement. The
main reasons were:
The shear resisting mechanism of the reinforcing tie-bar and its
contributions towards to shear resistance of the shear connection were
shown in the push-out tests.
Unlike the concrete infill element whose shear resisting mechanism need
to be confirmed by the FEA, and the empirical formula concluded for the
shear resistance of the concrete infill element need to be further verified by
the FEA parametric study.
As the tensile resisting mechanism and contributions of the tie-bar was
clearly shown in the push-out tests, hence, it would be certain to add the
tensile resistance of the tie-bar to the combined shear resistance.
(a) (b)
Figure 5.19 Illustration of the failure mechanism for (a) concrete infill element,
(b) concrete infill element with the additional tie-bar
Longitudinal
shear force
Compression
Tensile splitting
Web post
Concrete infill
passing through
web opening
Web post
Tensile splitting
Compression
Longitudinal
shear force
Concrete infill
passing through
web opening
Tensile force Tensile force
Tie-bar

Chapter 5 Analytical study and FEA of the shear connection
164
The results of the FEA parametric study was used to further verify the
mathematical formula, Eqn. 5.5, obtained for calculating the shear resistance of the
concrete infill element. The FEA parametric study investigated concrete-infill-only
shear connection with the concrete strengths varied between 25 to 60N/mm2 and web
opening diameters of 100, 150 and 200mm. The results of the FEA were compared with
the calculated results using Eqn. 5.5, the method obtained from the mathematical
analysis.
The comparison showed that the calculated shear resistance of the shear
connection using Eqn. 5.5 were lower than that obtained in the FEA, as demonstrated in
the Tables 5.7, 5.8 and 5.9. The average ratios for the shear resistance of the calculation
to FEA were 0.935, 0.703 and 0.863 for the web opening diameters of 100, 150 and
200mm, respectively. The results of the FEA represented the shear resisting capacity of
the shear connection in the push-out tests, as the FEA models were calibrated with the
push-out tests. Based on the above verifications, the calculation method, Eqn. 5.5, could
be further developed into a design method for shear resistance of the shear connection.
fcu
(N/mm2)
fct
(N/mm2)
Ac
(mm2)
At
(mm2)
Pc *
(kN)
FEA
(kN)
Ratio
Cal/FEA
Web
opening
100mm,
and web
thickness
8.6mm
25 2.56 860 7854 64.9 82.0 0.792
28 2.77 860 7854 71.5 84.1 0.851
30 2.90 860 7854 75.9 86.3 0.879
32 3.02 860 7854 80.2 91.5 0.877
35 3.21 860 7854 86.6 94.2 0.920
38 3.39 860 7854 93.0 97.1 0.958
40 3.51 860 7854 97.2 99.8 0.974
42 3.62 860 7854 101.4 104.6 0.969
45 3.80 860 7854 107.6 108.6 0.991
48 3.96 860 7854 113.8 113.2 1.006
50 4.07 860 7854 118.0 120.1 0.982
52 4.12 860 7854 121.4 125.8 0.965
55 4.21 860 7854 126.8 132.1 0.960
58 4.30 860 7854 132.1 137.5 0.961
60 4.35 860 7854 135.6 143.2 0.947
* calculated using Eqn. 5.6 Average 0.935
Table 5.7 Comparison between results of calculation and FEA for web opening of 100mm

Chapter 5 Analytical study and FEA of the shear connection
165
fcu
(N/mm2)
fct
(N/mm2)
Ac
(mm2)
At
(mm2)
Pc *
(kN)
FEA
(kN)
Ratio
Cal/FEA
Web
opening
150mm,
and web
thickness
8.6mm
25 2.56 1290 17671 119.1 171.4 0.695
28 2.77 1290 17671 130.7 187.0 0.699
30 2.90 1290 17671 138.3 196.4 0.704
32 3.02 1290 17671 145.9 212.4 0.687
35 3.21 1290 17671 157.1 221.7 0.709
38 3.39 1290 17671 168.2 237.1 0.709
40 3.51 1290 17671 175.5 249.3 0.704
42 3.62 1290 17671 182.7 268.0 0.682
45 3.80 1290 17671 193.6 280.5 0.690
48 3.96 1290 17671 204.3 286.3 0.714
50 4.07 1290 17671 211.4 301.7 0.701
52 4.12 1290 17671 217.0 307.9 0.705
55 4.21 1290 17671 225.8 314.1 0.719
58 4.30 1290 17671 234.5 329.4 0.712
60 4.35 1290 17671 240.2 332.5 0.722
* calculated using Eqn. 5.6 Average 0.703
Table 5.8 Comparison between results of calculation and FEA for web opening of 150mm
fcu
(N/mm2)
fct
(N/mm2)
Ac
(mm2)
At
(mm2)
Pc *
(kN)
FEA
(kN)
Ratio
Cal/FEA
Web
opening
200mm,
and web
thickness
9.9mm
25 2.56 1980 31416 198.6 263.6 0.754
28 2.77 1980 31416 217.7 276.5 0.787
30 2.90 1980 31416 230.2 286.3 0.804
32 3.02 1980 31416 242.5 299.1 0.811
35 3.21 1980 31416 260.9 311.5 0.838
38 3.39 1980 31416 279.0 324.2 0.861
40 3.51 1980 31416 291.0 336.8 0.864
42 3.62 1980 31416 302.8 347.6 0.871
45 3.80 1980 31416 320.5 361.3 0.887
48 3.96 1980 31416 338.0 375.1 0.901
50 4.07 1980 31416 349.5 382.7 0.913
52 4.12 1980 31416 358.5 398.8 0.899
55 4.21 1980 31416 372.5 406.2 0.917
58 4.30 1980 31416 386.5 423.0 0.914
60 4.35 1980 31416 395.5 430.9 0.918
* calculated using Eqn. 5.6 Average 0.863
Table 5.9 Comparison between results of calculation and FEA for web opening of 200mm

Chapter 5 Analytical study and FEA of the shear connection
166
5.4 Conclusion of design method
The calculation method for the shear resistance of the shear connection was obtained
from the mathematical analysis; it was based on the failure mechanism of the shear
connection shown in the push-out tests. The calculation method combined the shear
resistance of the concrete infill element with resistance of the additional elements, i.e.
tie-bar or studs, to calculate the total shear resistance of the shear connection. The
mathematical formula of the method was expressed in Eqn. 5.6. The results of the
calculation method compared well with the results of the push-out tests. The ratio for
the shear resistance of the calculation to test results was 0.935.
The FEA further verified the empirical formula obtained for the shear resistance
of the concrete infill element, as expressed in Eqn. 5.5. The calculated results were very
close to the results of the FEA parametric study, as the average ratios of the calculated
shear resistance to results of the FEA were 0.935, 0.703 and 0.863 for web opening
diameters of 100, 150 and 200mm, respectively.
Overall the shear resistance of the shear connection obtained from the calculation
method, Eqn. 5.6, were very close to the results of the push-out tests. In order to
develop a design method for the shear resistance of the shear connection, a partial safety
factor was added into the mathematical formula, Eqn. 5.6, as expressed in Eqn. 5.14.
addtctccuc
RAfAfP
355.41758.61u (5.14)
Where: Ac = tD
4
2DAt
Puc is the design shear resistance of the shear connection;
fcu is the concrete cube compressive strength in N/mm2;
fct is the concrete tensile splitting strength in N/mm2;
Ac is the area of concrete in the compression;
At is the area of concrete in the tensile splitting;
t is the thickness of the web;
D is the diameter of the web opening;
Radd is the shear resistance of the additional elements i.e. tie-
bar or shear studs;
γ is the partial safety factor.

Chapter 5 Analytical study and FEA of the shear connection
167
The shear resistance obtained from the design method, Eqn. 5.14, with the partial
safety factor of 1.5 were compared with the results of the push-out tests, as shown in
Table 5.10. The ratio of the design shear resistance (Puc) to test results was 0.624 for the
partial safety factors of 1.5.
Specimen
No.
fcu
(N/mm2)
fct
(N/mm2)
Ac
(mm2)
At
(mm2)
Test
results
(kN)
Partial safety factor γ = 1.5
Design resistance Puc (kN) *
Ratio
(Puc /test)
T1-A-N 56.5 4.53 1290 17671 118 158 1.339
T1-A-F 58.1 4.85 1290 17671 131 166 1.265
T1-B-N 56.5 4.53 1980 31416 362 261 0.721
T1-B-F 58.1 4.85 1980 31416 397 274 0.691
T2-A-N 54.5 4.54 1290 17671 309 222 0.718
T2-A-F 51.9 4.07 1290 17671 305 210 0.689
T2-B-N 54.5 4.54 1980 31416 390 324 0.830
T2-B-F 51.9 4.07 1980 31416 372 304 0.817
T3-A-N 55.2 3.91 215 5400 47 33 0.712
T3-A-F 51.5 3.89 215 5400 50 32 0.649
T3-B-N 55.2 3.91 495 13744 125 82 0.656
T3-B-F 51.5 3.89 495 13744 137 80 0.581
T4-A-N 67.0 4.66 1290 17671 504 357 0.708
T4-A-F 50.2 4.08 1290 17671 427 323 0.756
T4-B-N 67.0 4.66 1980 31416 -- -- --
T4-B-F 50.2 4.08 1980 31416 497 415 0.835
P5-1 35.0 3.21 1290 17671 227 105 0.462
P5-2 35.0 3.21 1290 17671 194 105 0.539
P5-3 32.0 2.9 1290 17671 179 95 0.532
P5-4 30.0 3.02 1290 17671 164 94 0.576
P6-1 29.0 2.85 1290 17671 391 150 0.384
P6-2 32.0 2.92 1290 17671 386 156 0.403
P6-3 28.0 2.49 1290 17671 327 142 0.436
P6-4 27.0 2.57 1290 17671 358 142 0.398
* Design shear resistance calculated using Eqn. 5.14. Ratio 0.624
Table 5.10 Comparison for shear resistance between the design values and test results

Chapter 6 Flexural tests of composite shallow cellular floor beam
168
Chapter 6 Flexural tests of composite shallow cellular
floor beam
The behaviour and shear resisting capacity of the shear connection used for the
composite shallow cellular floor beams were investigated in two push-out tests series,
which applied the direct longitudinal shear force to the shear connection. In order to
further investigate the characteristic of the shear connection in the actual composite
beam, two flexural tests were carried out: four-point symmetric and three-point
asymmetric bending tests. The concrete-infill-only and tie-bar shear connection were
investigated in the flexural tests. Behaviour and shear performance of the shear
connection were compared with those shown in the push-out tests. Composite behaviour
and flexural strength of the shallow cellular floor beam were studied.
6.1 Introduction
A full scale test beam specimen was designed to represent the actual composite shallow
cellular floor beams of a common span range with solid concrete slab. The reasons of
using the solid slab are explained in Section 6.2. The two most commonly used shear
connection for the composite shallow cellular floor beams were investigated in the
flexural tests, namely the concrete-infill-only and tie-bar shear connection. The two
flexural tests carried out in this research were: four-point symmetric and three-point
asymmetric bending tests. The results of the push-out tests were used in the design for
the shear connection of the beam specimen.
The layout of the shear connection was designed to enable the discrete
investigation of the both types of the shear connection in two flexural tests. In order to
particularly investigate the concrete-infill-only shear connection in the four-point
symmetric bending test, only one half span of the beam specimen had solely the
concrete-infill-only shear connection. In order to investigate the combined effect of the
concrete-infill-only and tie-bar shear connection in the three-point asymmetric bending
test, the other half span of the beam had a combination of both shear connection; there
was an Ø16mm tie-bar of 1m passing through every alternative web opening.

Chapter 6 Flexural tests of composite shallow cellular floor beam
169
The four-point symmetric bending test created a loading profile that was similar to
the uniformly distributed load (UDL), with a region of constant bending moment and
regions of constant shear within the shear spans. This flexural test was to particularly
investigate the concrete-infill-only shear connection. The four-point symmetric bending
test was carried out only up to plastification of deflection at the mid-span without failure
of the beam specimen. It was to preserve the stiffness of the beam specimen, so that the
three-point asymmetric bending test could be carried out thereafter.
The three-point asymmetric bending test created a region of high shear within the
shorter shear span, which had the combination of concrete-infill-only and tie-bar shear
connection. This flexural test was a failure test to particularly investigate the combined
effect of both shear connection.
The behaviour and shear performance of the shear connection in the flexural tests
were compared with that in the push-out tests. The flexural behaviour and failure
mechanism of the shallow cellular floor beam were studied. The flexural test results
were back analysed by using the measured material properties to determine the degrees
of shear connection. By combining with the findings of the push-out tests, the results of
the flexural tests were further analysed in Chapter 7 with the aims of establishing design
methods for the composite shallow cellular floor beams at the serviceability limit and
ultimate limit states.
6.2 Test specimen
The full-scale composite beam specimen for the flexural tests was designed to
represent the composite shallow cellular floor beams used in the construction practice.
The composite action of the composite beam specimen was provided by both the
concrete-infill-only and tie-bar shear connection. The composite beam specimen had an
asymmetric steel section with circular web openings and cast with solid concrete slab.
The overall length of the specimen was 6.2m. The span between the supports was 6m.
The total width of the concrete slab is 1m. The reasons for using the solid slab rather
than the ribbed slab are:
To be consistent with the push-out tests where the solid slab were used;
the shear resistance and behaviours of the shear connection obtained from
the push-out tests could be used to design the shear connection of the
composite beam specimen.

Chapter 6 Flexural tests of composite shallow cellular floor beam
170
The characteristics of the shear connection shown in the flexural tests
could be compared with those in the push-out tests.
To accommodate the Ø16mm tie-bar of 1m length for the tie-bar shear
connection; the required anchorage length for the tie-bar was 1m.
To simplify the tests and reduce the number of variables in the study.
If using the ribbed slab for the composite beam specimen, the following results
might be different.
The main differences would be the failure mode, stiffness and degree of
composite action.
The failure modes for the beam specimen with solid slab would be
different with the ribbed slab; this was explained more in Section 6.3.3.
The elastic stiffness of the composite beam specimen with the ribbed slab
would be less than that of using the solid slab. This was demonstrated in
stiffness calculations carried out in Section 7.2.2.
The degree of shear connection would be increased for using the ribbed
slab. The compressive resistance of the ribbed slab in full shear
connection, Rc, was reduced comparing with that of the solid slab. For the
same longitudinal shear resistance of the shear connection, Rq, the degree
of shear connection, η = Rq/Rc, would be therefore increased. The increase
in composite action would reduce the slips of the beam specimen.
One of the reasons for the using the ribbed slab was to represent the
construction practice for service integration, such as ducting passing
through the web openings; this would lead to web openings unfilled,
which would complicate the flexural tests. The unfilled web openings
would make the section less resistance to Vierendeel bending effects,
especially for the region of low Moment/Shear (M/V) ratio. As the steel
section used for the composite beam specimen was shallow, with big web
openings and its web thickness is unmodified (unlike the ASB with the
modified web); hence the Vierendeel bending would very likely to occur at
the unfilled web openings. Furthermore, the Vierendeel bending effect was
not part of the investigations for the flexural tests, as the main purposes
were to investigate performance of the shear connection and its
contributions to the composite action.

Chapter 6 Flexural tests of composite shallow cellular floor beam
171
The width of the concrete slab of 1m was designed for the effective width
and Ø16mm tie-bar used for the tie-bar shear connection. Thus, transverse
reinforcements should be needed to control cracking for the thin concrete
flanges when using the ribbed slab. This reinforcement would increase the
degree of shear connection for the composite beam specimen as was
demonstrated in the ASB flexural tests (Lawson et al 1999).
For the case of topping was constructed over the top flange for the ribbed
slab, the concrete cover would also increase the degree of shear connection
as it was also shown in the ASB flexural tests (Lawson et al 1999).
6.2.1 Steel section
The steel section was fabricated by welding two highly asymmetric cellular tees
together along the web. The top tee was cut from the 305x165x54UB and the bottom tee
was cut from the 305x305x97UC. The width of the top flange was 167mm and the
width of the bottom flange was 305mm. The degree of asymmetry in flange width was
55%. The net projection between the two flanges was 69mm. The dimensions of the
steel section are shown in Figure 6.1 (a) & (b).
The diameter of the web openings was 150mm, which was the same as that of the
push-out test series-II. There were 22 web openings spaced at 265mm. The steel section
had no end plates. It was to avoid confinement of the slips. The steel grade of the steel
section was S355. The actual strengths were obtained from the coupon tests, as shown
in Appendix C. Coupons were cut from the leftover of the actual steel sections. The
average yield and ultimate strengths were 414 and 527 N/mm2 respectively.
(a)

Chapter 6 Flexural tests of composite shallow cellular floor beam
172
(c)
Figure 6.1 Steel section of the composite beam specimen: (a) drawing of cross section,
(b) drawing of side view, (c) actual steel section
6.2.2 Concrete slab
The total width of the concrete slab was 1m, which was the same as that of the push-out
test series-II. It was to accommodate the 1m length of Ø16mm tie-bar used for the tie-
bar shear connection. For beam span of 6m, this concrete width was smaller than the
effective width of 1.5m (1/4 span) calculated in accordance with both Eurocode 4
(EN1994-1-1:2004) and BS5950 (BS5950-3.1:1990). The smaller concrete width was
also based on the approach presented in Lawson et al (1997) to avoid over-estimating
the degree of composite action.
The concrete slab sit on the bottom flange of the steel section and flushed with the
top flange of the steel section, as depicted in Figure 6.2 (a). The depth of the concrete
slab was 215mm. The concrete slab on both sides of the web post were connected by the
(b)

Chapter 6 Flexural tests of composite shallow cellular floor beam
173
concrete infill elements with or without the Ø16mm tie-bars. The 28-day concrete cube
compressive strength was designed at 30N/mm2.
6.2.3 Layout of shear connection
Both the concrete-infill-only and tie-bar (Ø16mm) shear connection were investigated
in the flexural tests. The layout of the shear connection enabled discrete investigations
of the two types of shear connection in two flexural tests. In order to particularly
investigate the concrete-infill-only shear connection in the four-point symmetric
bending test, one half of the beam span had solely the concrete-infill-only shear
connection. In order to investigate the combined effect of the concrete-infill-only and
tie-bar shear connection in the three-point asymmetric bending test, the other half of the
beam span had the combination of both shear connection; there was an Ø16mm tie-bar
of 1m passing through every alternative web opening, as illustrated in Figure 6.2b.
The longitudinal shear resistance of the shear connection were calculated based on
the results of the push-out tests. The loading configurations for both flexural tests were
designed to show the full composite action of the test beam.
6.2.4 Preparation and construction
The full-scale flexural test beam specimen was constructed in the Structural Laboratory
of City University London. The steel section was greased to prevent the development of
bond between the steel section and concrete. The elimination of the shear-bond strength
would enable the flexural tests to demonstrate the shear transferring mechanism of the
shear connection without the influence of other mechanism. The test beam specimen
was propped during the concreting and curing. The test beam was cast using concrete of
Ordinary Portland cement with 20mm maximum size of coarse aggregate. The cube and
cylinder specimens were cast from the same batch of concrete used for the test beam
specimen. All the specimens were cured under the same conditions and covered with
plastic sheets.

Chapter 6 Flexural tests of composite shallow cellular floor beam
174
(a)
(b)
Figure 6.2 (a) Drawing of the test beam specimen, (b) Layout of the tie-bars
Tie-bar

Chapter 6 Flexural tests of composite shallow cellular floor beam
175
Figure 6.3 Casting and curing of the test beam specimen
6.3 Flexural tests
Two flexural tests, four-point symmetric bending and three-point asymmetric bending
tests, were carried out to investigate the behaviour and performance of the composite
shallow cellular floor beam and its shear connection. The loading positions were
designed based on the results of the push-out test and in accordance with the design
methods specified in the codes of practice, i.e. Eurocode 4 (EN1994-1-1:2004) and
BS5950 (BS5950-3.1:1990).
Four-point symmetric bending test was carried out first without the failure of the
beam specimen. Thereafter, three-point asymmetric bending test was carried out up to
the failure of the beam specimen. Details of the two flexural tests are presented in the
following two sections.

Chapter 6 Flexural tests of composite shallow cellular floor beam
176
6.3.1 Four-point symmetric bending test
The four-point symmetric bending test created a bending moment profile that was
similar to that of the UDL, with a region of constant moment. The four-point symmetric
bending test was not a failure test. Three incremental loading cycles were applied before
the test beam was loaded up to the occurrence of plastification in the mid-span
deflection. It was to preserve the stiffness of the test beam for the next flexural test,
three-point asymmetric bending test. The applied loading cycles were to establish the
residual deflections and slips within the elastic loading range and also to break local
bond, although de-bonding grease was applied onto the steel section.
The loading position of the four-point symmetric bending test is shown in Figure
6.4. There were nine web openings within each shear span and four web openings
within the region of constant moment.
Figure 6.4 Loading position, shear force and bending moment diagrams of the four-
point symmetric bending test
The shear connection within the left and right shear spans provided 1575kN and
2545kN longitudinal shear resistance respectively, which were calculated by using the
results of the push-out test series-II. The required longitudinal shear resistance for full
shear connection was 898kN, calculated in according with Eurocode 4 and BS5950. The
full composite action was expected for both shear spans. The shear resistance of the
shear connection was assumed not affected by depth of plastic neutral axis of the beam
specimen. The design full moment resistances for both shear spans were the same,
which was 354kNm calculated in accordance with the methods of Eurocode 4 and

Chapter 6 Flexural tests of composite shallow cellular floor beam
177
BS5950. The calculation details of the design moment resistance are shown in
Appendix K.
The deflection stiffness of both shear spans under the elastic loading was expected
to be the same, as the two shear spans had the same elastic (uncracked) section
properties. The four-point symmetric bending test created the same magnitude of
constant shear force within each shear span. Hence, the slip distribution along both
shear spans was expected to be uniform. The elastic slip stiffness of the two types of
shear connection shown in the push-out tests was the same. Therefore, the elastic slip
values of the shear connection within both shear spans were expected to be the same.
The shear span/depth ratio of the four-point symmetric bending test was 10.7,
which was much greater than the minimum limit of 2.5 (Oehlers and Bradford (1995))
for creating the flexural failure mode. Although the four-point symmetric bending was
not a failure test, yielding of the bottom flange at the loading point was expected. This
prediction was based on the conclusion of the publications reviewed in the literature as
that the dominate failure mechanism of the composite beams was yielding of the steel
beam occurred prior to the failure of the concrete slab.
6.3.1.1 Objectives and aims
The objectives and aims of the four-point symmetric bending test were:
1. To demonstrate the composite action for the test beam of the composite shallow
cellular floor beam;
2. To provide results for determining the degree of shear connection and shear
performance of the shear connection, with the aim of establishing design
methods for the composite shallow cellular floor beams;
3. To observe the yielding in the steel bottom flange as an indication of the flexural
failure mode;
4. To demonstrate the same elastic deflection stiffness of the two shear spans;
5. To demonstrate the uniform slips distribution within both shear spans;
6. To demonstrate the same elastic slip stiffness of the two shear spans as predicted
based on the same slip stiffness of the two types of shear connection shown in
the push-out tests.

Chapter 6 Flexural tests of composite shallow cellular floor beam
178
(a)
(b)
(c)
Figure 6.5 Set up of the four-point symmetric bending test: (a) illustration drawing,
(b) loading arrangement, (c) end support
Jacks
Reaction
beam
Load cell
Neoprene
Steel flange
Roller
Chapter 6 Flexural tests of composite shallow cellular floor beam
179
6.3.1.2 Set up and instrumentation
The set up for the four-point symmetric bending test is illustrated in Figure 6.5a. The
specimen was simply supported by the footings. The steel bottom flange was in contact
with the rollers. The concrete slab was not in contact with the rollers. There was
neoprene placed between the rollers and concrete slab, as depicted in Figure 6.5c. It was
to create even supports for the concrete slab as the test beam might tilt during the
flexural tests.
A 498kN (50ton) hydraulic jack was attached to each reaction beam which was
held by high tensile Macalloy bars that were connected through the reaction floor. A
load cell was placed beneath the hydraulic jack, as shown in Figure 6.5b. There was a
small load spreader placed between the load cell and steel top flange.
Applied load was measured by using the load cell, which was calibrated prior to
the flexural test. Deflections were measured by using digital dial gauges and linear
voltage displacement transducers (LVDT) at mid-span and quarter-spans, as illustrated
in Figure 6.6a. Both the digital dial gauges and LVDTs were positioned at the same
locations, as shown in Figure 6.6b. The dial gauges measured the deflections at the
beginning of the test with a high resolution of 0.01mm. After the range of the dial
gauges was exceeded, the deflections were measured by the LVDTs with a resolution of
1mm.
The slips between the steel section and concrete slab were measured by using the
digital dial gauges at mid-span, quarter-spans and end supports, as illustrated in Figure
6.6a. Tags were cast in the concrete slab. The digital dial gauges were attached to the
steel section, as depicted in Figure 6.6c. Hence, the relative movements or slips were
measured.
The strain of the steel section was measured by using strain gauges at various
locations, as shown in Figure 6.7. The strain measurements were acquired via a data
logger. At each location, there were strain gauges glued on the top flange, the web posts
of the top and bottom tees, and the bottom flange.

Chapter 6 Flexural tests of composite shallow cellular floor beam
180
(a)
(b)
(c)
Figure 6.6 Instrumentation for deflections and slips: (a) measuring locations,
(b) deflection instrumentation, (c) slip instrumentation
Tag
LVDT
Dial gauge

Chapter 6 Flexural tests of composite shallow cellular floor beam
181
6.3.1.3 Testing procedure
Three incremental loading cycles were applied before the test beam was loaded up to
the occurrence of plastification in the mid-span deflection. The four-point symmetric
bending test was load-controlled, with load increments of 9.8kN (1ton) applied to a load
level of 49kN (5ton). Smaller load increments of 4.9kN (0.5ton) were then applied up to
the designated load levels. The load reached at each stage in the four-point symmetric
bending test is shown below.
Load Reached*
1st loading cycle 54kN (5.5ton)
2nd
loading cycle 69kN (7ton)
3rd
loading cycle 88kN (9ton)
The end of the test 106kN (10.8ton)
* load at each loading point
(a)
(b)
Figure 6.7 (a) Locations of the strain gauges; (b) Positions of the strain gauges

Chapter 6 Flexural tests of composite shallow cellular floor beam
182
6.3.2 Three-point asymmetric bending test
The three-point asymmetric bending test was carried out after the four-point symmetric
bending test. The loading point was placed between the fifth and sixth web opening, as
shown in Figure 6.8. There were two concrete-infill-only shear connection and three tie-
bar shear connection within the shorter shear span. The total longitudinal shear
resistance of the shear connection was 1475kN, which was much greater than the
required longitudinal shear resistance, 898kN, for the full composite action. Hence, full
degree of shear connection was expected. This was based on the following two
assumptions:
1. The shear resistance of the shear connection was not affected by the
position of the plastic neutral axis.
2. There was a uniform behaviour and non-discrete failure between the two
types of shear connection which would have a combined effect towards the
composite action.
Figure 6.8 Loading position, shear force and bending moment diagrams of the three-
point asymmetric bending test
At the end of the four-point symmetric bending test, the residual deflection at the
mid-span was 16mm (=span/372), which was less than the deflection limit of span/360
at the serviceability limit state. The residual slip of the shear span that had both types of
shear connection was 0.5mm, which was negligible. Hence, the shear connection within
this shear span remained intact and could be further investigated.

Chapter 6 Flexural tests of composite shallow cellular floor beam
183
The three-point asymmetric bending test created a high shear within the shorter
shear span. This high shear might induce the Vierendeel bending, which generally
occurred at the web opening of low moment-shear ratio. The Vierendeel bending failure
mode was shown at rectangular web openings in flexural tests on the downstand
composite beams carried out by Clawson and Darwin (1982) and Redwood and Wong
(1982) reviewed in the literature. However, the steel section of the test specimen for the
composite shallow cellular floor beams was partially encased, which increased the
vertical shear capacity of the beam specimen. The web openings of the beam specimen
were filled with in-situ concrete, which enhanced the shear resistance of the web
opening. Furthermore, the shear span/depth ratio of the three-point bending test was
6.5, which was greater than the minimum limit of 2.5 (Oehlers and Bradford (1995)) for
creating the flexural failure mode. Hence, the flexural failure mode of the beam
specimen, rather than the Vierendeel bending, was expected in the three-point
asymmetric bending test.
6.3.2.1 Objectives and aims
The objectives and aims of the three-point asymmetric bending test were:
1. To provide results for determining the degree of shear connection and shear
performance of the shear connection;
2. To establish design methods for the composite shallow cellular floor beam by
combining the results of the four-point symmetric bending test;
3. To observe the flexural behaviour and failure mode of the composite beam
specimen under high shear;
4. To observe the behaviour of the combined shear connection and to demonstrate
the combined effect of the two types of shear connection to the composite
action.
6.3.2.2 Set up and instrumentation
The three-point asymmetric bending test was set up by moving the loading position of
the previous flexural test, without changing the conditions of support. The set up is
shown in Figure 6.9. The same hydraulic jack and reaction beam were used. The same
load cell was re-calibrated prior to the flexural test.
The deflection measurements were taken at loading point, maximum deflection
point and quarter-span, as shown in Figure 6.10a. The maximum deflection point,

Chapter 6 Flexural tests of composite shallow cellular floor beam
184
367mm off the mid-span, was an approximate location determined by using the
McCaulay’s method with the steel section properties. The objective was to demonstrate
the amount of deflections rather than the actual location.
The slips were measured by using the dial gauges at various locations, as shown
in Figure 6.10a. The slip differences between the top and bottom of the slab and
between slab on both sides of the web post were monitored.
The strains of the steel section were measured by using the same strain gauges
used in the previous flexural test. The locations of the strain gauges are shown in Figure
6.7. The location IV, between the fourth and fifth cells, was the previously planned
loading point for the three-point asymmetric bending test. The strains under the actual
loading point were not obtained. Nevertheless, the strains at the location IV would show
the similar strain development to that of the actual loading point.
6.3.2.3 Testing procedure
Two incremental loading cycles were applied before the beam specimen was tested up
to the ultimate failure. The three-point asymmetric bending test was load-controlled.
Load increments of 9.8kN (1ton) were applied to the load level of 49kN (5ton). Smaller
load increments of 4.9kN (0.5ton) were then applied up to the designated load levels.
The designated load level for each loading stage and the ultimate load level are listed
below.
Load Reached
1st loading cycle 144kN (15ton)
2nd
loading cycle 191kN (20ton)
Maximum load 340kN (34.5ton)

Chapter 6 Flexural tests of composite shallow cellular floor beam
185
(a)
(b)
Figure 6.9 Set up for the three-point asymmetric bending test: (a) illustration drawing,
(b) loading arrangement
Jack
Reaction
beam
Load cell
Loading point

Chapter 6 Flexural tests of composite shallow cellular floor beam
186
(a)
(b)
Figure 6.10 (a) Locations for slip and deflection measurement, (b) Instrumentation of
slip and deflection at the loading point
6.3.3 Possible failure modes
The composite beam specimen was tested in two discrete flexural tests. The possible
modes of failure for the test beam specimen are listed below. The possible failure modes
for a beam specimen with ribbed slab were also discussed.
Four-point symmetric bending test
Flexural failure mode was expected in the four-point symmetric bending test, as
the shear span/depth ratio of 10.7 which was much higher than the minimum
limit of 2.5 for the flexural failure mode. Yielding on the bottom flange should
be the initial indication for flexural failure mode. Crushing failure of the
concrete slab was not expected as the test was not an ultimate failure test.
Dial gauge
(deflection)
Dial gauge
(slip)
LVDT
Chapter 6 Flexural tests of composite shallow cellular floor beam
187
Vierendeel bending was not the possible failure mode for the beam specimen, as
the flexural test created low shear with a high M/V ratio at the web openings
close to the loading points. Furthermore the concrete slab increased the shear
resistance of the composite section, and the concrete infills passing through the
openings strengthened the shear capacity of the web opening; hence the
Vierendeel bending effect should be prevented.
For test beam with the ribbed slab in four-point bending test
A possible failure mode was the flexural failure with crushing of the concrete
thin flange and yielding of the steel bottom flange at the loading points.
If there were web opening unfilled to represent the composite beam for service
integration, the Vierendeel bending effect might be noticeable at the web
openings close to the loading points, as the steel section was shallow, with large
web openings. This might lead to diagonal inclining cracking or diagonal tensile
failure of the thin concrete flange. (The cross section for the beam specimen
with the ribbed slab and web openings unfilled would be very similar to the
cross sectional drawings illustrated in Figures 2.15 and 2.16.)
Three-point asymmetric bending test
One of the possible failure modes was the flexural failure, as the shear
span/depth ratio for the three-point asymmetric bending test was 6.5 which was
much higher than the minimum limit of 2.5 for the flexural failure mode.
The occurring of the Vierendeel bending was due to the transfer of shear forces
across the web openings. The three-point asymmetric bending test created high
shear with low M/V ratio, which was very likely to create the Vierendeel
bending effect at the web openings. However, the web openings of the
composite beam specimen were filled with in-situ concrete which enhanced the
shear resistance of the web opening. Furthermore, the section was partially
encased with solid slab, which increased the vertical shear capacity of the
composite section and might prevent the Vierendeel bending. Nevertheless,
Vierendeel bending was one of the possible failure modes of the beam specimen
in the three-point asymmetric bending test. If the Vierendeel effect occurred,
there would be diagonal cracks in the solid slab at the web opening.

Chapter 6 Flexural tests of composite shallow cellular floor beam
188
For test beam with the ribbed slab in three-point bending test
The reduced cross section for the ribbed slab increased the possibility of the
Vierendeel bending effect at the web openings under the high shear created in
the three-point bending test.
Moreover, the Vierendeel bending effect would be more likely if there were web
openings unfilled to represent for service integration. The Vierendeel bending
moments would be resisted by local bending of the top and bottom tees, when
the shear force was transferred across the openings. As the top tee had increased
resistance from the composite action, a plastic hinge was likely to occur in the
bottom tee. It would be followed by diagonal tensile failure of the thin concrete
flange.

Chapter 6 Flexural tests of composite shallow cellular floor beam
189
6.4 Test results
In this section, the results of the four-point symmetric and three-point asymmetric
bending tests were presented in terms of bending moment, deflection, slip, strain, stress,
cracking pattern and failure mode.
6.4.1 Results of four-point symmetric bending test
The results of the four-point symmetric bending test at the final load level are listed in
Table 6.1. The final load at the two loading points was almost the same, 104kN and
108kN. The shear forces (SF) and bending moments (BM) were calculated by including
the self weight of the beam specimen. The SF and BM diagrams are shown in Figure
6.12.
Load
(kN) SF (kN)
BM
(kNm)
Mid-span
Deflection
(mm)
Quarter-span
Deflection
(mm)
End Slip*
(mm)
Left loading point 104 -108 -285
64.9
44.6 5.96
Right loading point 108 109 -287 41.4 0.41
* slip at end span
Table 6.1 Results of the four-point symmetric bending test
123109
1
-5
-122-108
-150
-50
50
150
SF
(kN)
-287-285-300
-200
-100
0
BM
(kNm)
Figure 6.12 SF and BM diagrams for the four-point symmetric bending test

Chapter 6 Flexural tests of composite shallow cellular floor beam
190
A uniform shear force was shown within each shear span. A small variation of the
shear force along the shear span was due to the self weight of the beam specimen. The
quarter-span deflections at final load level were very similar, 46.4mm and 41.4mm. This
confirmed the prediction of the same deflection stiffness for the two shear spans, as
their elastic (uncracked) section properties were the same. The residual deflection of the
beam specimen at the mid-span was 16mm after the test. The state of the beam
specimen after the four-point symmetric bending test is depicted in Figure 6.13. The
two end slips at the final load were in complete contrast, 5.96mm and 0.41mm. These
test results were further discussed in the following five sections.
Figure 6.13 The state of the beam specimen after the four-point symmetric bending test
6.4.1.1 Bending moment
Bending moments at the loading points were 285kNm and 287kNm. The test bending
moments and calculated moment resistances were compared in Table 6.2. The moment
resistance of the beam specimen in full composite action and moment resistance of the
steel section were calculated by using plastic stress block method with measured

Chapter 6 Flexural tests of composite shallow cellular floor beam
191
material properties. The details of the calculation are shown in Appendix G. The
comparisons are further shown in the deflection curve, Figure 6.14.
The significant composite action of the beam specimen was shown in the four-
point symmetric bending test. The test bending moment was 1.5 times the plastic
moment resistance of the steel section. The actual degree of shear connection and
performance of the shear connection are further determined in Chapter 7.
Test Moment*
(kNm)
Full Moment Resistance of
the Test Beam (kNm)
Plastic Moment Resistance
of the Steel Section (kNm)
286 348 196
* average bending moment of the two loading points
Table 6.2 Comparison for moment resistance of the four-point bending test
6.4.1.2 Deflection
The deflections were measured at mid-span and quarter-spans, as shown in Figure 6.6a.
The deflections were plotted with the mid-span moments, which included the self
weight of the beam specimen. The deflection curves are shown in Figures 6.14 - 6.17.
The beam specimen was essentially elastic when the serviceability deflection limit of
span/360 was reached. The test was stopped when the plastification of the mid-span
deflection occurred. The residual mid-span deflection was 16mm (=span/372) after the
test, which was less than span/360. The deflections at the different loading stages are
illustrated in Figure 6.17.
The elastic behaviour of the beam specimen was clearly demonstrated well after
the serviceability deflection limit of span/360 and plastic moment resistance of the steel
section was exceeded, as shown in the deflection curves. After the third loading cycle,
the residual deflection at mid-span was 5mm, which was negligible. This indicated there
was no local failure of the beam specimen occurred within the loading cycles. The
deflection behaviour of the beam specimen after the third loading cycle was slightly
different, as the deflection stiffness dropped. This might be caused by local failure of
the shear connection.
The deflection stiffness of both shear spans was the same. This confirmed the
prediction made, in Section 6.3.1, based on the two shear spans had the same elastic
(uncracked) section properties.

Chapter 6 Flexural tests of composite shallow cellular floor beam
192
0
50
100
150
200
250
300
350
400
450
0 20 40 60 80 100
Deflection (mm)
Mid-span
Moment
(kNm)
Mid-span
1/4-span(concrete)
1/4-span(tie-bar)
span
/36
0
full moment resistance
(measured properties)
bare steel resistance
(measured properties)
Figure 6.14 Deflections at mid-span and quarter-spans of the four-point bending test
0
50
100
150
200
250
300
350
400
450
0 20 40 60 80 100
Deflection (mm)
Mid-span
Moment
(kNm)
Mid-span
span
/36
0
full moment resistance
(measured properties)
bare steel resistance
(measured properties)
Figure 6.15 Deflections at the mid-span of the four-point bending test
0
50
100
150
200
250
300
350
400
450
0 20 40 60 80 100
Deflection (mm)
Mid-span
Moment
(kNm)
1/4-span(concrete)
1/4-span(tie-bar)
Figure 6.16 Deflections at the quarter-spans of the four-point bending test

Chapter 6 Flexural tests of composite shallow cellular floor beam
193
0
50
100
150
200
250
300
350
400
450
0 20 40 60 80 100
Deflection (mm)
Mid-span
Moment
(kNm)
Mid-span
1/4-span(concrete)
1/4-span(tie-bar)
span
/36
0
bare steel resistance
(measured properties)
full moment resistance
(measured properties)
(1): 1st cycle
(2): 2nd cycle
(3): 3rd cycle
(4): end of test
(1)
(3)
(4)
(2)
Figure 6.17 Deflections at different loading stages in the four-point bending test
6.4.1.3 Slips
The slips were measured at the end-spans, quarter-spans and mid-span, as shown in
Figure 6.18. The slips over the span at the different loading stages were plotted in
Figure 6.19. It was shown that both shear spans had the same uniform slip distributions
during the first two loading cycles. This was due to the longitudinal shear force was
uniform along the two shear spans, and the elastic slip stiffness of the two types of shear
connection was the same in the push-out tests; hence the same uniform slip distributions
should be shown for the two shear spans. The slip at the end of the first two loading
cycles was 0.25mm, where the mid-span deflection was 26mm exceeding the
serviceability deflection limit of span/360, 16.7mm. Therefore the slips of the shear
connection were negligible when the serviceability limit state was reached.
The shear span had solely the concrete-infill-only shear connection showed a
major slip increase at the third loading cycle, as shown in Figure 6.19. The end-span slip
curves, depicted in Figure 6.20, further demonstrated the failure of the concrete-infill-
only shear connection at the end of the third loading cycle. This indicated that the drop
of deflection stiffness after the third loading cycle was due to the failure of the shear
connection. The brittle failure mode of the concrete-infill-only shear connection was
further demonstrated in the flexural test, was the same as that shown in the push-out
tests.
The distinctive slip difference between the two shear spans at the end of the
flexural test was illustrated in Figure 6.19. The end-span slip of the left shear span was
6mm, which was similar to the 5mm slip capacity of the concrete-infill-only shear

Chapter 6 Flexural tests of composite shallow cellular floor beam
194
connection shown in the push-out tests. The slip of the right shear span at the end of the
flexural test was 0.41mm, which was negligible. The combination of the concrete-infill-
only and tie-bar (Ø16mm) shear connection within the right shear spans remained
intact. It was demonstrated that the additional tie-bars significantly increased the
longitudinal shear resistance for the composite beam specimen. The elastic slip stiffness
of the two shear spans were the same, as shown in Figure 6.21b. The slip behaviour
between the top and bottom of the slab, and between the slab on both sides of the web
post were the same, as shown in Figure 6.22.
Figure 6.18 Locations of slip instrumentation and labels of the dial gauges
0
1
2
3
4
5
6
0 1 2 3 4 5 6span (m)
slip
(mm)
(1): 1st cycle
(2): 2nd cycle
(3): 3rd cycle
(4): end of test(4)
(3)
(1) (2)
Figure 6.19 Slips over the span at the different loading stages

Chapter 6 Flexural tests of composite shallow cellular floor beam
195
0
50
100
150
200
250
300
350
400
450
0 1 2 3 4 5 6slip (mm)
Mid-span
Moment
(kNm)
end-slip/concrete-span(G-1)
end-slip/concrete-span(G-2)
(a)
0
50
100
150
200
250
300
350
400
450
0 1 2 3 4 5 6slip (mm)
Mid-span
Moment
(kNm)
end-slip/concrete-span(G-1)
end-slip/concrete-span(G-2)
(1)
(3)
(4)
(2)
(1): 1st cycle
(2): 2nd cycle
(3): 3rd cycle
(4): end of test
(b)
Figure 6.20 End-span slip curves of the left shear span with the concrete-infill-only
shear connection: (a) slip curves, (b) slips reached at different loading stages
0
50
100
150
200
250
300
350
400
450
0 1 2 3 4 5 6slip (mm)
Mid-span
Moment
(kNm)
end-slip/tiebar-span(G-3)
end-slip/tiebar-span(G-4)
(a)

Chapter 6 Flexural tests of composite shallow cellular floor beam
196
0
50
100
150
200
250
300
350
400
450
0 1 2 3 4 5 6slip (mm)
Mid-span
Moment
(kNm)
end-slip/concrete-span(G-1)
end-slip/concrete-span(G-2)
end-slip/tiebar-span(G-3)
end-slip/tiebar-span(G-4)
(4)(3)
(4)
(2)
(1)(1): 1st cycle
(2): 2nd cycle
(3): 3rd cycle
(4): end of test
(3)
(b)
Figure 6.21 (a) End-span slip curves of the right shear span with the combination of
shear connection; (b) Comparison of the slips between the two shear spans
0
50
100
150
200
250
300
350
400
450
0 1 2 3 4 5 6slip (mm)
Mid-span
Moment
(kNm)
top (G-10)
bottom (G-6)
bottom (G-7)
(a)
0
50
100
150
200
250
300
350
400
450
0 1 2 3 4 5 6slip (mm)
Mid-span
Moment
(kNm)
top (G-10)
bottom (G-6)
bottom (G-7)
(1)
(4)
(2)
(3)
(1): 1st cycle
(2): 2nd cycle
(3): 3rd cycle
(4): end of test
(b)
Figure 6.22 Quarter-span slips of the left shear span with the concrete-infill-only shear
connection: (a) slip curves, (b) slips reached at different loading stages

Chapter 6 Flexural tests of composite shallow cellular floor beam
197
6.4.1.4 Strain and stress
Strains of the steel section were measured at various locations, as shown in Figure 6.7.
The strain curves at these locations are presented in Figure 6.23. It was shown there
were nonlinear strains on the top flange and the web post of the top and bottom tees.
Linear strains were shown on the bottom flange at all locations. Significant nonlinear
compressive strains were shown on the top flange at the left loading point, location II.
This indicated possible buckling of the top flange due to compression. Nonlinear strains
with large residuals of 75-80% were shown on the web posts at both loading points. At
the end of the test, small nonlinear tensile strain was also shown on the bottom flange at
left loading point, location II. This was an initial indication of the flexural failure mode,
as the bottom flange started to yield.
Location (I)
0
150
300
450
-3500 -3000 -2500 -2000 -1500 -1000 -500 0 500 1000 1500 2000 2500 3000 3500
Strain (µE)
Mid-span
Moment
(kNm)
top flangeweb/top teeweb/bottom teebottom flange
Location (II)
0
150
300
450
-3500 -3000 -2500 -2000 -1500 -1000 -500 0 500 1000 1500 2000 2500 3000 3500
Strain (µE)
Mid-span
Moment
(kNm)
top flangeweb/top teeweb/bottom teebottom flange

Chapter 6 Flexural tests of composite shallow cellular floor beam
198
Location (III)
0
150
300
450
-3500 -3000 -2500 -2000 -1500 -1000 -500 0 500 1000 1500 2000 2500 3000 3500
Strain (µE)
Mid-span
Moment
(kNm)
top flangeweb/top teeweb/bottom teebottom flange
Location (IV)
0
150
300
450
-3500 -3000 -2500 -2000 -1500 -1000 -500 0 500 1000 1500 2000 2500 3000 3500
Strain (µE)
Mid-span
Moment
(kNm)
top flange
bottom flange
Figure 6.23 Strain curves of the different locations
The strain profiles of the cross section were obtained by taking the strain values at
the different loading stages and plotted with the depth of the beam section, as shown in
Figure 6.24. The strain profiles illustrated the strain developments of the beam section
at the different loading stages, i.e. three loading cycles and the final loading stages.
However the strain profile at the location IV was not obtained as the strains gauges on
the web posts were not connected to the data logger due to its limited channels,
nonetheless the location IV was the least critical location. These strain profiles showed:
The strains on the web posts were negligible during the three loading
cycles, which were the elastic loading. It indicated that elastic neutral axis
of the test beam was within the depth of the web opening.
Overall, the strain profiles were similar at both loading points.
Compressive strains on the web posts were developed at the end of the
test. The depth of the neutral axis at both loading points shown at the end
of the test was the same, 178mm.
The neutral axis was moved downwards when nonlinear behaviour of the
beam specimen was developed.

Chapter 6 Flexural tests of composite shallow cellular floor beam
199
Location (I)
0
50
100
150
200
-3500 -3000 -2500 -2000 -1500 -1000 -500 0 500 1000 1500 2000 2500 3000 3500Strain µE
Depth
(mm)
1st cycle
2nd cycle
3rd cycle
end of test
web opening depth
Location (II)
0
50
100
150
200
-3500 -3000 -2500 -2000 -1500 -1000 -500 0 500 1000 1500 2000 2500 3000 3500Strain µE
Depth
(mm)
1st cycle
2nd cycle
3rd cycle
end of test
web opening depth
depth of neutral axis
Location (III)
0
50
100
150
200
-3500 -3000 -2500 -2000 -1500 -1000 -500 0 500 1000 1500 2000 2500 3000 3500Strain µE
Depth
(mm)
1st cycle
2nd cycle
3rd cycle
end of test
web opening depth
depth of neutral axis
Figure 6.24 Strain profiles of the cross section at different measuring locations
The tensile stresses of the bottom flange at the different loading stages were
calculated by using the linear tensile strains with the Young’s Modulus of 2e5N/mm2 as
listed in Table 6.3. The small nonlinear tensile strain at the left loading point (location
II) at the end of the test was omitted in the calculation; the linear strain value prior to the
nonlinear behaviour was used instead.

Chapter 6 Flexural tests of composite shallow cellular floor beam
200
Tensile Stress (N/mm2)
1
st Loading
Cycle
2nd
Loading
Cycle
3rd
Loading
Cycle Final loading
Location (I) 89 116 151 164
Location (II)* 148 184 246 324
Location (III)* 145 187 247 309
Location (IV) 71 92 120 146
* loading points
Table 6.3 Tensile stresses on the steel bottom flange at different loading stages
6.4.1.5 Cracking pattern
The cracks of the concrete slab were vertical tensile cracks. No diagonal shear cracks
were observed. The cracks were mainly in the regions of the constant moment and close
to the loading points. The cracks were uniformly distributed in the region of constant
moment, as depicted in Figure 6.25; these cracks were induced by the pure bending.
Only two cracks were shown on the top side of the slab. Several cracks were shown on
the bottom side of the slab.
The cracks lose to the left loading point, depicted in Figure 6.26, were longer and
wider than those within the pure bending region. These cracks propagated with the
increase of load. The cracks lose to the right loading point, depicted in Figure 6.27,
were smaller and less concentrated than those close to the left loading point, as the
additional tie-bars reduced the development of the cracks. There was an Ø16mm tie-
bars passing through every alternative openings in the right half of the beam span.
The first crack occurred at the mid-span deflection of 14mm, which was less than
the span/360 of 16.7mm. Hence, the concrete slab cracked before the serviceability limit
state was reached. The cracked section was suggested for the deflection analysis, which
is carried out in Section 7.2 to develop a design method for deflection check of the
composite shallow cellular floor beams.
The transverse separations between the concrete slab and steel section at the end
of the left shear span were 2.6mm and 5.2mm, as shown in Figure 6.28. The separation
values were the same as that shown in the push-out tests, ranging from 2.3mm to
5.2mm. It further indicated the ultimate failure of the concrete-infill-only shear
connection in the left shear span.

Chapter 6 Flexural tests of composite shallow cellular floor beam
201
(a)
(b) (c)
Figure 6.25 Cracking pattern in the pure bending region: (a) vertical tensile cracks,
(b) two cracks on the top of the slab, (c) many cracks on the bottom of the slab
Figure 6.26 Cracking pattern lose to the left loading point

Chapter 6 Flexural tests of composite shallow cellular floor beam
202
Figure 6.27 Cracking pattern lose to the right loading point
(a) (b)
(c)
Figure 6.28 Transverse separations at the end of left shear span: (a) prior to the test, (b)
separations at the end of test, (c) separation values

Chapter 6 Flexural tests of composite shallow cellular floor beam
203
6.4.2 Results of three-point asymmetric bending test
The three-point asymmetric bending test created high shear within the shorter shear
span, which had the combination of the concrete-infill-only and tie-bar (Ø16mm) shear
connection. Two loading cycles were applied before the test beam was tested to the
ultimate failure. The test results at the ultimate failure are summarised in Table 6.4. The
SF and BM were calculated by including the self weight of the beam specimen. The SF
and BM diagrams are shown in Figure 6.29.
Load (kN) SF*
(kN)
BM
(kNm)
Deflection at
Loading Point
(mm)
Deflection at
Max-deflection
point (mm)
End Slip ~
(mm)
340 267 -385 65 80 3.82
* SF of the shorter shear span, ~ end-span slip of the shorter shear span
Table 6.4 Results of the three-point asymmetric bending test
269 277
-71-97
-300
-150
0
150
300
SF
(kN)
-385
-400
-200
0
BM
(kNm)
Figure 6.29 SF and BM diagrams of the three-point asymmetric bending test
6.4.2.1 Bending moment
The bending moment of 385kNm was reached at the ultimate failure. The bending
moment of the flexural test is compared with the calculated moment resistances in Table
6.5. The moment resistance in full composite action and moment resistance of the steel

Chapter 6 Flexural tests of composite shallow cellular floor beam
204
section were calculated by using plastic stress block method with measured material
properties. The details of the calculation are shown in Appendix J. The comparisons are
further illustrated in the deflection curves, Figure 6.30.
It was shown that significant composite action was achieved in the three-point
asymmetric bending test. The test moment was 1.5 times the plastic moment resistance
of the steel section. The actual degree of shear connection and shear performance of the
shear connection were determined in Chapter 7.
Test Moment (kNm) Full Moment Resistance of the
Test Beam (kNm)
Plastic Moment Resistance of
the Steel Section (kNm)
385 440 255
Table 6.5 Comparison between the test moment and calculated moment resistances
6.4.2.2 Deflection
The deflections of the three-point asymmetric bending test were measured at the loading
point, maximum deflection point and quarter-span, as shown in Figure 6.10a. The
deflection curves of the beam specimen are shown in Figure 6.30. The vertical axis was
the bending moment at the loading-point, or the applied bending moment calculated by
including the self weight of the beam specimen. The plateau region with large residual
deflections was clearly shown in the deflection curves. This indicated the plastic
flexural failure mode of the beam specimen. The residual deflections of the previous
flexural test, four-point symmetric bending test, were not included in the deflection
curves, as the deflection analysis was not part of the objectives for the three-point
asymmetric bending test. This flexural test was to investigate the flexural behaviour of
the beam specimen and shear performance of the shear connection under high shear.
At the ultimate failure (or the maximum load level), the deflections at the loading
point and the max-deflection point were 65mm and 80mm respectively. The deflection
profiles of the beam specimen are shown in Figure 6.34. The deflected shape of the
beam specimen in the flexural test is depicted in Figure 6.35.

Chapter 6 Flexural tests of composite shallow cellular floor beam
205
0
50
100
150
200
250
300
350
400
450
0 20 40 60 80 100Deflection (mm)
Loading-
point
Moment
(kNm)
1/4-span concrete
Max-defl point
loading-point
(2)
(1)
(3)
(1): 1st cycle
(2): 2nd cycle
(3): ultimate load
Full moment resistance 440kNm
bare steel resistance 255kNm
Figure 6.30 Deflections of the three-point asymmetric bending test
0
50
100
150
200
250
300
350
400
450
0 20 40 60 80 100
Deflection (mm)
Loading-
point
Moment
(kNm)
Max-defl point
(2)
(1)
(3)
(1): 1st cycle
(2): 2nd cycle
(3): ultimate load
full moment resistance 440kNm
bare steel resistance 255kNm
Figure 6.31 Deflections at the maximum deflection point in the three-point bending
0
50
100
150
200
250
300
350
400
450
0 20 40 60 80 100
Deflection (mm)
Loading-
point
Moment
(kNm)
loading-point
(2)
(1)
(3)
(1): 1st cycle
(2): 2nd cycle
(3): ultimate load
full moment resistance 440kNm
bare steel resistance 255kNm
Figure 6.32 Deflections at the loading point in the three-point bending test

Chapter 6 Flexural tests of composite shallow cellular floor beam
206
0
50
100
150
200
250
300
350
400
450
0 20 40 60 80 100
Deflection (mm)
Loading-
point
Moment
(kNm)
1/4-span concrete
(2)
(1)
(3)
(1): 1st cycle
(2): 2nd cycle
(3): ultimate load
full moment resistance 440kNm
bare steel resistance 255kNm
Figure 6.33 Deflections at the quarter-span in the three-point bending test
Deflection profile
0
20
40
60
80
100
0 1 2 3 4 5 6span (m)
Deflection
(mm)
1st cycle (144kN)
2nd cycle (191kN)
ultimate load (340kN)
Figure 6.34 Deflection profiles of the three-point asymmetric bending test

Chapter 6 Flexural tests of composite shallow cellular floor beam
207
Figure 6.35 Deflected shape of the beam specimen in the three-point bending test
6.4.2.3 Slip
There were two concrete-infill-only and three tie-bar (Ø16mm) shear connection within
the shorter shear span. The slips between the concrete slab and steel section were
measured at various locations, as shown in Figure 6.36. The slips over the span at the
different loading stages are shown in Figure 6.37. The residual slip of the shorter shear
span in the previous flexural test was 0.1mm (negligible); hence, it was omitted in the
slip curves of this test. The residual slip of the long shear span was 3.5mm in the
previous flexural test; however it was not included in the slip curves of this test, as the
slips of the longer shear span was not part of the investigation for this flexural test.
The slip of the shorter shear span during the first two loading cycles (essentially
the elastic loading) was 0.45mm. The overall slip behaviour of the combined shear
connection was elastic then followed by plastic deformation with extensive slips, as
shown in Figure 6.38a. This ductile slip behaviour and failure mode of the combined
shear connection was very similar to that of the tie-bar (Ø16mm) shear connection in
the push-out test series-II. It was shown that the additional tie-bars increased the
ductility of the shear connection in the flexural test. The slip behaviour and failure mode
of the combined shear connection were completely different with those of the concrete-

Chapter 6 Flexural tests of composite shallow cellular floor beam
208
infill-only shear connection in the four-point symmetric bending test. At the ultimate
load, the end slip of the shorter shear span was 4mm, which was similar to the failure
slip of the concrete-infill-only shear connection shown in the four-point symmetric
bending test.
Uniform behaviour and no-discrete failure (or separate failure) of the two types of
shear connection was shown, which had a combined effect towards the composite
action. This approved the assumption (made in Section 6.3.2) for the non-discrete
failure of the combined shear connection when they were used in combination.
A small amount of ductility was shown by the shear connection in the longer
shear span, as illustrated in Figure 6.39. As there were eight un-damaged shear
connection in the longer shear span; three of the shear connection had the additional tie-
bars which provided the ductility.
Figure 6.36 Locations of slip instrumentation and labels of the dial gauges

Chapter 6 Flexural tests of composite shallow cellular floor beam
209
0
1
2
3
4
5
6
0 1 2 3 4 5 6span (m)
slip
(mm)
(1): 1st cycle
(2): 2nd cycle
(3): ultimate load
(4): ultimate defl
(1) (2)
(3)
(4)
Figure 6.37 Slips over the span at the different loading stages of the three-point
asymmetric bending test
0
50
100
150
200
250
300
350
400
450
0 1 2 3 4 5 6
slip (mm)
Loading-
point
Moment
(kNm)
end-span/tiebar(G-3)
end-span/tiebar(G-4)
(a)
0
50
100
150
200
250
300
350
400
450
0 1 2 3 4 5 6slip (mm)
Loading-
point
Moment
(kNm)
loading-point/top(G-11)
loading-point/btm(G-8)
loading-point/btm(G-9)
(b)
Figure 6.38 (a) End slips of the shorter shear span with the combined shear connection;
(b) Slips at the loading point

Chapter 6 Flexural tests of composite shallow cellular floor beam
210
0
50
100
150
200
250
300
350
400
450
0 1 2 3 4 5 6slip (mm)
Loading-
point
Moment
(kNm)
end-span/concrete(G-1)
end-span/concrete(G-2)
(a)
0
50
100
150
200
250
300
350
400
450
0 1 2 3 4 5 6slip (mm)
Loading-
point
Moment
(kNm)
1/4-span-top(G-10)
1/4-span-btm(G-6)
1/4-span-btm(G-7)
(b)
Figure 6.39 Slips of the longer shear span (a) end-span, (b) quarter-span
6.4.2.4 Strain and stress
The strains were measured at various locations, as shown in Figure 6.40. The location
IV was the previously planned loading point. The strains under the actual loading point
for the three-point asymmetric bending were not obtained. However, the strains at
location IV would show the similar strain development to that of the actual loading
point. The strain curves at these locations are presented in Figure 6.40. The residual
strains of the previous flexural test, four-point symmetric bending test, were not
included in these strain curves which were in the aim to demonstrate the strain
development for the three-point asymmetric bending test.
The strain patterns shown at locations of I, II and III, apart from IV were the
same. Linear strains were developed in the cross section at the location, I, II and III.

Chapter 6 Flexural tests of composite shallow cellular floor beam
211
Non-linear and chaotic strain pattern was shown at location IV, which was near the
loading point. This might be due to the possible disruption of the strain gauges caused
by the slips of the concrete slab.
However, the linear strain on the bottom flange was shown at location IV. Its
maximum linear tensile strain was 1633με; hence the linear tensile stress was
327N/mm2. By assuming the tensile strain varied linearly along the shear span, and was
proportional to the bending moment, the tensile stress of 400N/mm2 at the loading point
was calculated. This calculated tensile stress was very close to the coupon test yield
stress of 414N/mm2. As the permanent deflections were observed at the end of the test,
thus the yield stress of 414N/mm2 was considered been reached on the bottom flange at
the loading point.
The strain profiles of the cross section were also obtained by taking the strain
values at the different loading stages and plotted with the depth of the beam section, as
shown in Figure 6.41. The strain profile at the location I was not obtained, as the strain
gauges on the web posts were not connected with the data logger due to its limited
channels; nonetheless, location I was the least critical location in the three-asymmetric
bending test. The strain profiles were very similar at the location II and III. However,
zigzag strain profile was shown at the location III, as the strain gauges at this location
might had been disturbed by the slips of the concrete slab.
Location (I)
0
50
100
150
200
250
300
350
400
450
-3500 -3000 -2500 -2000 -1500 -1000 -500 0 500 1000 1500 2000 2500 3000 3500
Strain (µE)
Loading-
point
Moment
(kNm)
top flange
bottom flange

Chapter 6 Flexural tests of composite shallow cellular floor beam
212
Location (II)
0
50
100
150
200
250
300
350
400
450
-3500 -3000 -2500 -2000 -1500 -1000 -500 0 500 1000 1500 2000 2500 3000 3500
Strain (µE)
Loading-
point
Moment
(kNm)
top flangeweb/top teeweb/bottom teebottom flange
Location (III)
0
50
100
150
200
250
300
350
400
450
-3500 -3000 -2500 -2000 -1500 -1000 -500 0 500 1000 1500 2000 2500 3000 3500
Strain (µE)
Loading-
point
Moment
(kNm)
top flangeweb/top teeweb/bottom teebottom flange
Location (IV)
0
50
100
150
200
250
300
350
400
450
-3500 -3000 -2500 -2000 -1500 -1000 -500 0 500 1000 1500 2000 2500 3000 3500
Strain (µE)
Loading-
point
Moment
(kNm)
top flangeweb/top teeweb/bottom teebottom flange
Figure 6.40 Strain curves at the different locations

Chapter 6 Flexural tests of composite shallow cellular floor beam
213
Location (II)
0
50
100
150
200
-3500 -3000 -2500 -2000 -1500 -1000 -500 0 500 1000 1500 2000 2500 3000 3500Strain µE
Depth
(mm)
peak 1st cycle
peak 2nd cycle
ultimate load
web opening depth
Location (III)
0
50
100
150
200
-3500 -3000 -2500 -2000 -1500 -1000 -500 0 500 1000 1500 2000 2500 3000 3500Strain µE
Depth
(mm)
peak 1st cycle
peak 2nd cycle
ultimate load
web opening depth
Location (IV)
0
50
100
150
200
-3500 -3000 -2500 -2000 -1500 -1000 -500 0 500 1000 1500 2000 2500 3000 3500Strain µE
Depth
(mm)
peak 1st cycle
peak 2nd cycle
ultimate load
web opening depth
Figure 6.41 Strain profiles of the cross section at the different locations
6.4.2.5 Cracking pattern
Large cracks occurred under the loading point, as depicted in Figure 6.42; the widths of
the cracks were 4.0-6.2mm. Small vertical tensile cracks of 0.15mm width were induced
in the longer shear span. The overall cracking pattern of the beam specimen in the three-
point asymmetric bending is shown in Figure 6.43. The cracks from the previous

Chapter 6 Flexural tests of composite shallow cellular floor beam
214
flexural test were propagated in the mid-span region, as shown in Figure 6.44. Cracks of
width up to 2mm occurred near the support of the short shear span, as depicted in Figure
6.45; they were first induced on the top side of the concrete slab, and then propagated
towards the bottom of the slab.
Figure 6.42 Cracks at the loading point in the three-point asymmetric bending test
Loading point
Macalloy bar

Chapter 6 Flexural tests of composite shallow cellular floor beam
215
(a)
(b)
Figure 6.43 Cracking pattern of the three-point asymmetric bending test
(a) shorter shear span, (b) longer shear span
Figure 6.44 Propagation of the cracks at the mid-span (blue lines are the new cracks)

Chapter 6 Flexural tests of composite shallow cellular floor beam
216
Figure 6.45 Cracks near the support of the shorter shear span
Figure 6.46 Failure profile of the beam specimen in the three-point bending test

Chapter 6 Flexural tests of composite shallow cellular floor beam
217
6.4.2.6 Failure mode and failure mechanism
The flexural failure mode of the beam specimen was shown in the three-point
asymmetric bending test. It was demonstrated by the permanent deflection profile, as
depicted in Figure 6.46. The flexural failure mode confirmed the prediction made in
Section 6.3.2. Although, the three-point asymmetric bending test created high shear,
which could induce the Vierendeel bending. However, the section was partially encased
by solid slab which increased the vertical shear capacity of the composite section, and
the web openings were filled with in-situ concrete which enhanced the shear resistance
of the web openings and prevented the Vierendeel bending.
The flexural failure mechanism of the beam specimen in the three-point
asymmetric bending test was due to the ductile failure of the shear connection. The full
plastic moment resistance of the specimen had not been reached, as the plastic strain of
the bottom flange was not observed. One of the indications for the full plastic flexural
failure of a composite beam was the crushing of the concrete slab. This was not
observed in the flexural test. Hence, the beam specimen of the composite shallow
cellular floor beam was not failed by the full plastic moment resistance, but due to the
failure of the shear connection. The slip curves, Figure 6.38, also demonstrated the
ductile failure of the combined shear connection in the three-point asymmetric bending
test.
6.4.3 Geometric limits
The test beam specimen was constructed using the steel section with regular spaced
circular web openings and solid slab. The web opening diameter was 150mm with
265mm spacing. The size of the steel section represented the actual steel section used
for the span of 6m. The concrete slab flushed with the top flange of the steel section and
sit on the bottom flange. There was no concrete topping above the steel top flange. The
total width of the solid slab was 1m. There was no end plate welded on the steel section,
otherwise it would confine the slips of the test beam. The following geometric limits
were imposed on the flexural test results, as the configurations of the test beam could
not fully represent all aspects of the composite shallow cellular floor beams used in the
practice.
By using solid slab, the test data could not represent the composite beams with
ribbed slab, in terms of failure modes, serviceability check (deflection) and
composite interaction, as discussed in Section 6.2;

Chapter 6 Flexural tests of composite shallow cellular floor beam
218
By greasing the steel section for the test beam, the shear bond strength was
eliminated from the flexural tests. Although it was to particularly investigate the
shear transferring mechanism of the unique shear connection, but the shear bond
resistance was also part of the longitudinal shear resistance of the composite
shallow cellular floor beams;
By having the wide spacing of 265mm, the test beam eliminated the possibility
for the failure modes of the web-post buckling and web-post horizontal shear
failure, which would be the case especially for the beam with web openings
unfilled to represent service integration;
By having the concrete slab flushed with the steel top flange, the test beam could
not represent the use of concrete topping above the steel top flange, which had
shown its contribution towards composite action in the ASB flexural tests
presented in Lawson et al 1999;
By having the test beam without the end plated, the test data could only
represent the unconfined slip movements.
Finally, the steel section used for the test beam also imposed geometric limits on
the test data, as listed below.
Parameter Limits
Beam depth/opening diameter 1.5
Spacing/opening diameter 1.8
Beam depth/span 1/26
6.5 Conclusions of the flexural tests
The four-point symmetric bending was first carried out without the failure of the beam
specimen, only up to the plastification of the mid-span deflection. This flexural test
created a bending moment profile similar to that of the UDL, with a pure bending
region. The concrete-infill-only shear connection was particularly investigated in the
four-point symmetric bending test. The three-point asymmetric bending test was then
carried out up to the ultimate failure of the beam specimen. The test created high shear
in the shorter shear span, which had the combination of concrete-infill-only and tie-bar
(Ø16mm) shear connection. The following conclusions were made from both flexural
tests.

Chapter 6 Flexural tests of composite shallow cellular floor beam
219
Both flexural tests showed significant composite action due to the unique shear
transferring mechanism. The test moment resistances were 1.5 times the plastic
moment resistance of the steel section.
The brittle failure mode of the concrete-infill-only shear connection was shown
in the four-point symmetric bending test. The failure slip and transverse
separation of the concrete-infill-only shear connection was the same as that
obtained in the push-out tests.
The four-point symmetric bending test clearly demonstrated the difference
between the concrete-infill-only shear connection and combined shear
connection (with the tie-bar shear connection), in terms of the slip behaviour and
shear resistance. Brittle failure of the concrete-infill-only shear connection was
shown in one shear span. The combined shear connection in the other shear span
demonstrated complete elastic slip behaviour with negligible slip.
The ductile failure mode of the combined shear connection was shown in the
three-point asymmetric bending test. This failure mode was the same as that of
the tie-bar (Ø16mm) shear connection shown in the push-out tests. The
additional tie-bar had directly influence on the failure mode of the combined
shear connection.
Overall, the additional tie-bar significantly increased the ductility and shear
performance of the shear connection in the flexural test.
Although the behaviours and shear resistances of the two types of shear
connection were complete different in the push-out tests. But, a uniform (non-
discrete) behaviour of the combined shear connection was demonstrated in the
flexural tests, which showed a combined effect towards the composite action for
the test beam. This result confirmed the approach of using a combination of the
two types of shear connection as one unit in design calculation.
The cracked section properties of the beam specimen were suggested for the
deflection analysis at the serviceability limit state, as cracks occurred before the
serviceability deflection limit of span/360 was reached.
The flexural failure mode of the beam specimen was shown in both flexural
tests. Although the four-point symmetric bending test was not failure test, which
was only up to the plastification of the mid-span deflection, but the yielding of

Chapter 6 Flexural tests of composite shallow cellular floor beam
220
the steel bottom flange was observed as an initial indication for the flexural
failure mode.
The flexural failure mode of the beam specimen was observed under high shear
in the three-point asymmetric bending test, which tested to the ultimate failure of
the test beam. The failure mechanism of the beam specimen was due to the
ductile failure of the shear connection, rather than the plastic moment resistance
failure of the beam specimen. The steel bottom flange was yielded with
permanent deflected shape and large cracks were shown at the loading point, but
crushing of the concrete slab was not observed.
Although the two shear spans in the four-point symmetric bending test had
different shear connection. One shear span had solely the concrete-infill-only
shear connection; the other shear span had the additional tie-bar (Ø16mm)
passing through every alternative openings. The elastic deflection stiffness of the
two shear spans was the same in the flexural test, as the elastic (uncracked)
section properties of the two shear spans were the same.
The same uniform elastic slip was shown for the two shear spans in the four-
point symmetric bending test. This was due to that the elastic slip stiffness of the
two types of the shear connection was the same, and that the shear force in the
two shear spans was the same.

Chapter 7 Analysis of the flexural tests
221
Chapter 7 Analysis of the flexural tests
The results of the flexural tests were analysed to conclude design methods for the
composite shallow cellular floor beams at the serviceability limit sate (SLS) and
ultimate limit states (ULS). A method for deflection check at the SLS was established in
deflection analysis based on elastic theory. A method for moment resistance at the ULS
was established in back analysis based on plastic theory. The developed design method
for moment resistance of the composite shallow cellular floor beams was compatible
with the design methods of BS5950 and Eurocode 4.
7.1 Introduction
The full-scale composite shallow cellular floor beam was investigated in the two
flexural tests: four-point symmetric and three-point asymmetric bending tests. Both
flexural tests showed significant composite action due to the unique shear transferring
mechanism. The flexural tests demonstrated the behaviour of the beam specimen was
essentially elastic at the SLS. The effect of partial shear connection (due to slips) was
clearly shown when the test deflections compared with calculated deflections using
elastic section properties. A method for deflection check of the shallow cellular floor
beams was modified based on the principle of the deflection check method specified in
BS5950 and EC4, which was the linearly partial interaction method. The modified
method for deflection check was then verified with different composite sections.
The result of the flexural tests were back analysed to determine the composite
action of the beam specimen and shear performance of the shear connection. The back
analysis was carried out by using measured material properties with all partial safety
factors set to unity. Based on results of the back analysis and findings of both the
flexural tests and push-out tests, a design method for moment resistance of the shallow
cellular floor beams was proposed and then verified with the test results. This design
method was compatible with the plastic stress block method specified in both BS5950
and EC4 for determining the design moment resistance of the composite shallow
cellular floor beams.

Chapter 7 Analysis of the flexural tests
222
7.2 Deflection analysis
The deflections of a composite beam due to unfactored imposed loads were emphasised
at the SLS. Deflections of the flexural tests were analysed using cracked and uncracked
section properties of the beam specimen, with the aim of developing a design method
for deflection check of the composite shallow cellular floor beams at the SLS.
Normally, the deflections of a composite beam consisted of two components:
The deflections of steel section due to self weight of the composite beam;
The deflections of composite beam due to the imposed loads.
The deflections of the steel section due to self weight of the beam specimen were
not investigated in the deflection analysis, as deflections of the steel section could be
calculated by using elastic theory with good accuracy. Moreover, the deflection due to
self weight of the beam specimen was not measured in the flexural tests, as the
deflections had already been induced after the test beam was set up on the supports.
The deflections of the test beam specimen due to the unfactored imposed loads
were analysed at the SLS. The deflections were calculated by using both uncracked and
cracked section properties of the beam specimen, and then compared with the test
deflections. British Standard BS5950-1:2000 specified span/360 was the deflection limit
for composite beams carrying brittle or plaster finishes, and span/200 for all other
beams. The lower deflection limit of span/360 was used in the deflection analysis of the
beam specimen. The procedures of the deflection calculation are outlines below:
1. To convert the cross sectional area of the concrete slab into an equivalent
area of steel by dividing a modular ratio of 6.5, which was specified by
Eurocode 4 (EN1994-1-1:2004) for short term loading;
2. To calculate the second moment of areas, I, of both uncracked and cracked
sections using the converted cross sectional areas (the method for
determining the depth of concrete slab for the cracked section is explained
in Table 7.1);
3. To determine the deflections using elastic theory with I and steel Young’s
Modulus, E;
4. To compare the calculated deflections with the test deflections.

Chapter 7 Analysis of the flexural tests
223
7.2.1 Uncracked and cracked sections
Both uncracked and cracked sections of the beam specimen are illustrated in Figure 7.1.
The difference in applying the two cross sections for the deflection calculation are
summarised in Table 7.1. The calculated depths of the elastic neutral axis (e.n.a) and the
second moment of area, I, are shown in Table 7.2.
Uncracked section
Cracked section
Figure 7.1 Uncracked and cracked sections of the beam specimen
Uncracked section
By assuming the entire concrete slab was
uncracked, the converted cross sectional area was
used in the determination for the depth of e.n.a.
Cracked section
The e.n.a of the cracked section was assumed to be
coincided with crack line of the concrete slab, as
shown in Figure 7.1;
The concrete below the crack line was neglected;
The converted cross sectional area was also used
in the determination for the depth of e.n.a.
Table 7.1 Summary of the uncracked and cracked sections
The Depth of
e.n.a (mm)
The Second Moment of
Area, I, (m4)
Uncracked section 115 2.14E-4
Cracked section 82 1.39E-4
Table 7.2 Section properties of the uncracked and cracked sections

Chapter 7 Analysis of the flexural tests
224
7.2.2 Deflection study
The uncracked section represented the full composite action. By using the uncracked
section properties, deflections of the beam specimen was calculated by using load level
at the SLS in the flexural test, as span/360 = 16.7mm. The following formula was used
in the calculation, where E is the Young’s Modulus, I is the second moment of area, v is
the deflection, x is the longitudinal distance, and M is the bending moment.
Mdx
vdEI
2
2
The load level was 45kN for the test mid-span deflection of 16.7mm in the four-
point bending flexural test. By using this load level of 45kN, the calculated deflection
for the uncracked section was 9.04mm, which was 54% of the test deflection. This
indicated that the slips had affected the stiffness of the beam specimen at the SLS. If
the beam specimen had full composite action, then the calculated deflection would be
the same or very close to the test deflections. The deflection results further
demonstrated the partial shear connection of the test beam specimen.
Furthermore, the test deflection at the end of the flexural test was compared with
the calculated deflection using the uncracked section properties. At the end of the test,
the load was 106kN with the mid-span deflection of 64.9mm. The calculated deflection
was 21.3mm, which was 33% of the test deflection.
Location
Deflection (mm)
Flexural Test (at SLS) Uncracked Section Cracked Section
Four-point
Bending
Mid-span 16.7 9.0 14.0
1/4-span 11.1 6.3 9.7
Three-point
bending
Max-defl point 16.6 6.8 10.5
Loading point 13.2 5.3 8.1
1/4-span 10.1 4.2 6.5
Table 7.3 Comparison between test deflections and calculations
The calculated deflections using both uncracked and cracked section properties
were also compared with the test deflections at the SLS, as shown in Table 7.3. The test
mid-span deflections were taken as span/360 (16.7mm) at the SLS. The deflections of
both uncracked and cracked sections were smaller than the test deflections. Although
the cracked section properties yielded better deflections, but it could not represent
partial shear connection, which had dominant effect on the deflections. Therefore, the

Chapter 7 Analysis of the flexural tests
225
deflection check for the composite test beam specimen required another method which
should include the effect of partial shear connection.
Johnson and May (1975) presented a method for the design of composite beams
with partial shear connection. The method assumed that the additional strength and
stiffness of the beam due to the composite action varied linearly with degree of shear
connection. This method was known as the ‘linear partial interaction method’. The
relationship for both the moment resistance and stiffness with the degree of shear
connection is illustrated in Figure 7.2. The deflections of a simple composite beam
under serviceability loads, where the interaction was incomplete, could be determined
from Eqn. 7.1. This formula was also documented in both British Standard BS 5950-3.1
and Eurocode 4 EN 1994-1-1 for determining the increased deflections due to partial
shear connection.
Eurocode 4, unlike BS 5950, allows this increase in deflection to be ignored in
unpropped construction where either degree of shear connection is not less than 0.5, or
the forces on the connectors do not exceed 0.7PRK, where PRK is their characteristic
resistance, and for slab with transverse ribs, the height of the ribs does not exceed
80mm. The arbitrary nature of these rules underlines the difficulty of predicting
deflections accurately (Johnson 1994).
Figure 7.2 Linear interaction concepts (Narayanan 1988)

Chapter 7 Analysis of the flexural tests
226
))(1(5.0'
cscc K for propped beams
))(1(3.0'
cscc K for unpropped beams (7.1)
Where: δc’ is the deflection of the composite beam with partial
shear connection;
δc is the deflection of the composite beam with full shear
connection;
δs is the deflection of the steel beam acting alone;
K is the degree of shear connection.
The test deflections were back checked with the method presented in Eqn. 7.1
which included the effect of partial shear connection. The deflections of the test beam
specimen with full shear connection, δc, and deflections of the bare steel section, δs,
were calculated as listed in Table 7.4. The former term was actually the deflections of
the uncracked section. The ratios of cs
cc
'
should readily yield degrees of shear
connection. The test deflections at different load levels up to the SLS were used in the
back check. The SLS was taken as span/360, 16.7mm, at the mid-span deflection.
It was shown that the calculated degrees of shear connection using Eqn. 7.1 were
unrealistic. The back calculated degree of shear connection was 0.07 at the SLS. This
could not represent the actual degree of composite action. The slips at the SLS were
0.1mm or 0.2mm, thus the actual degree of interaction would be much higher than 0.07.
The calculated results using the method of Eqn. 7.1 could not justify the results of the
flexural test, as the method was developed based on the traditional downstand
composite beams.
The flexural tests demonstrated the partial shear connection of the beam
specimen. A modified method for deflection check should be developed based on the
principle of the method presented in Eqn. 7.1, which takes incomplete interaction into
account. The method of Eqn. 7.1, or so called linear partial interaction method,
simplified the relationship between the ratio of cs
cc
'
and degree of shear connection
into a linear function; and this linear relationship was illustrated in Figure 7.2. Based on
this simplified relationship, the deflection ratio of the test beam specimen should be in a
proportional relationship with its degree of shear connection. It can be expressed as:

Chapter 7 Analysis of the flexural tests
227
baKcs
cc
'
(7.2)
Where: δc’ is the deflection of the composite beam with partial
shear connection;
δc is the deflection of the composite beam with full shear
connection;
δs is the deflection of the steel beam acting alone;
K is the degree of shear connection;
a, b are the coefficients.
The two unknown coefficients of a and b in Eqn. 7.2 could be determined by
using the test data, i.e. test deflections and degrees of shear connection shown in the
flexural test. The degree of shear connection was considered as full and taken as 1.0 at
the start of the four-point bending test with the load of 8.65kN and 2mm of mid-span
deflection. At the end of the test with the plastification of mid-span deflection, the
degree of shear connection was taken as 0.46 which calculated in the back analysis in
Section 7.3.1.1. This degree of shear connection was determined by using the stress
block method with the measured material properties. However it could approximately
represent the degree of composite action at that load level. As the flexural test showed
major end slips of 6mm at the end of the four-point bending test; hence, the interaction
was much reduced at that load level.
By solving the simultaneous equations with the test data at the load level of
8.65kN for full shear connection, and at the load of 106kN for partial shear connection
of 0.46, the coefficients of a and b were obtained, as -1.919 and 2.003, respectively. The
a and b were taken as -2 and 2 respectively to simplify the formula. Hence, Eqn. 7.2
becomes as:
))(1(2'
cscc K (7.3)
Where: δc’ is the deflection of the composite beam with partial
shear connection;
δc is the deflection of the composite beam with full shear
connection;
δs is the deflection of the steel beam acting alone;
K is the degree of shear connection.

Chapter 7 Analysis of the flexural tests
228
By using the modified method for deflection check, Eqn. 7.3, the degrees of shear
connection at different load levels were back calculated, as listed in Table 7.4. It
showed that the degree of shear connection was 0.77 at the SLS with the load level of
45kN. This result could approximately represent the actual flexural test, as both slips
and cracks were mobilised at the SLS; hence the degree of shear connection would be
moderately reduced from the full composite action.
Load
(kN)
Deflections (mm)
cs
cc
'
Degree of
shear
connection,
K *
Degree of
shear
connection,
K ^
Steel
section, δs
Full
composite,
δc
Test
deflection, δc’
8.65 4.92 1.74 2.0 0.083 0.83 1#
18.27 10.38 3.67 5.99 0.346 0.31 0.83
28.84 16.39 5.79 10.14 0.410 0.18 0.79
45 § 25.58 9.04 16.7 0.463 0.07 0.77
52.88 30.05 10.62 19.61 0.463 0.07 0.77
67.30 38.25 13.51 25.61 0.489 0.02 0.76
85.56 48.63 17.18 34.78 0.560 -0.12 0.72
106 ∆ 60.25 21.29 64.9 1.119 -1.24 0.46
#
§ Load level at the SLS. * K calculated using Eqn. 7.1 (Johnson).
# Test results
∆ Load level at the end of test. ^ K calculated using Eqn. 7.3. (modified)
Table 7.4 Calculated deflections and degrees of shear connection
The modified method for deflection check, Eqn. 7.3, needed to be further verified
with different composite sections of the shallow cellular floor beams. The two main
procedures of the verifications are:
1. To design different composite sections of the shallow cellular floor beams.
The steel sections were designed to have the same depth and web opening
diameter as that of the test beam. These steel sections had different second
moments of area, I, compared with the test beam. The concrete slab was
designed as same as that of the test beam: solid slab of 1m width flushed
with the top flange and sit on the bottom flange. Overall, these composite
sections were designed to have the different stiffness compared with the
test beam, but all other parameters were kept same, i.e. depth, web opening
diameter and concrete slab.
2. To compute the deflections of these composite sections using both
methods of deflection check, i.e. Eqn. 7.1 (Johnson 1975) and Eqn. 7.3

Chapter 7 Analysis of the flexural tests
229
(modified). The calculations were based on the loading configuration of
the four-point symmetric flexural test. The mid-span deflections of these
composite sections were determined at the different load levels of the
flexural test up to the SLS, with the corresponding degrees of shear
connection, as listed in Table 7.4. The degrees of shear connection were
assumed to be the same for the different composite sections at a load level.
Thus the calculated deflections using the two methods were compared with
the test deflections for the different composite sections.
The purpose of carrying out these comparisons was to verify whether Eqn. 7.1, the
method for deflection check presented in Johnson and May 1975 (also adopted by both
BS5950 and EC4), was suitable for the composite shallow cellular floor beams. It was
also to further validate the modified method for deflection check, Eqn. 7.3. The
comparisons for the deflections are shown in Table 7.5.
A total of five different composite sections were selected for the verification. Two
of the composite sections, #1 and #2, had smaller the second moments of area, I,
compared with that of the test beam. Hence, they had weaker stiffness than the test
beam. One of the composite sections, #3, had the similar second moment of area as that
of the test beam. The other two composite sections, #4 and #5, had greater the second
moments of area than that of the test beam.
By using both methods, Eqn. 7.1 (Johnson) and Eqn. 7.3 (modified), the
deflections of these composite sections with partial shear connection were calculated
and compared with the test deflections. The comparisons were carried out at the load
levels in the flexural test up to the SLS. The degrees of shear connection used in the
calculations were assumed the same as that of the test beam at a load level. The
comparison results are summarised as:
For the composite section, #3, which had the similar stiffness as the test beam,
the calculated deflections using Eqn. 7.3 (modified) were very close to the test
deflections. But the deflections for the composite section, #3, obtained by using
the method of Eqn. 7.1 (Johnson) were far off the test deflections and
consistently smaller, about 50% less.
For the composite sections, #1 and #2, which had the weaker stiffness than the
test beam, the results of Eqn. 7.3 (modified) correctly showed the increased
deflections compared with the test deflections. But the calculated deflections of

Chapter 7 Analysis of the flexural tests
230
Eqn. 7.1 (Johnson) were smaller than the test deflections. This could not
demonstrate that the sections of weaker stiffness were to have greater
deflections.
For the comparisons between the test beam and composite sections, #4 and #5,
the results of Eqn. 7.3 (modified) accurately showed the trend of reduction in
deflections due to the increase in stiffness.
Overall, the calculated deflections using the modified method, Eqn. 7.3, showed
good comparison with the test deflections for composite sections of different stiffness. It
correctly demonstrated the increase and decrease in deflections due to the variation in
stiffness. However, the results obtained by using the method of Eqn. 7.1 (Johnson)
could not represent the test deflections of the composite shallow cellular floor beams. Its
deflection calculations were impractically lower than the test deflections. This could be
due to several factors:
1. Eqn. 7.1, the method for deflection check presented in Johnson and May
1975, was developed for the traditional downstand composite beams. In
general, the downstand composite beams were much deeper than the shallow
cellular floor beams, as its depth consisted of the depth of steel section with
an additional slab depth of 120 - 160mm. Hence, the stiffness of the
downstand composite beams was generally greater than that of the composite
shallow cellular floor beams. This was one of the reasons that calculated
deflections using Eqn. 7.1 (Johnson) were consistently smaller than the test
deflections.
2. For a cellular beam with 15 - 20 openings, the total deflections were typically
10% to 15% more than that of the equivalent unperforated downstand
composite beams (Lawson et al 2006). The calculated deflections using Eqn.
7.1 (Johnson) with added 15% due to the openings were compared with the
test deflections, as shown in Table 7.6. The calculated deflections with the
15% correction were still incomparable with the test deflections, about 30%
less. Hence, the use of Eqn. 7.1 with the correction factor of 1.15 was not a
suitable method for deflection check of the shallow cellular floor beams.
Nevertheless, it was certain that the opening reduced the stiffness for both
downstand composite beams and shallow floor beams.
3. The use of the solid slab for the test beam could impose limitations on the
results, which could not represent the beam sections with ribbed slab. Further

Chapter 7 Analysis of the flexural tests
231
calculations were carried out to compute the stiffness of the composite
section, #1, 2 and 3, with the ribbed slab profile of Multideck 146. The depth
of Multideck 146 was 160mm. The width of the slab was kept as 1m. The
calculation showed that the composite sections with ribbed slab had much
reduced the second moments of area, I, as listed in Table 7.7. Hence, the
deflections of the composite sections with ribbed slab would be greater than
that with solid slab. The calculated deflections are listed in Table 7.7. The
composite sections with ribbed slab were assumed to have the same degree of
shear connection as the composite sections with solid slab at a load level.
Increased deflections were shown by the composite sections with ribbed slab
compared with their counterparts. But the increase in deflections was
moderate, about 10%.
However, it was shown the reduced differences between the calculated
deflections using the method of Eqn. 7.3 (modified) and Eqn. 7.1 (Johnson)
with the correction factor of 1.15. The differences were about 15% for the
composite sections with ribbed slab, compared with 30% differences for the
composite sections with solid slab. This comparison indicated that both
methods, i.e. Eqn. 7.3 (modified) and Eqn. 7.1 (Johnson) with the correction
factor of 1.15, might be justified for deflection check of the shallow cellular
floor beams with ribbed slab. With the lack of experimental data, this
conclusion could not be validated; hence further flexural tests on the shallow
cellular floor beams with ribbed slab were desired.
7.2.3 Conclusion for deflection check method
The flexural tests on the shallow cellular floor beam showed the effect of partial shear
connection on the deflections of the beam specimen. The back check using Eqn. 7.1 the
method for deflection check presented in Johnson and May 1975 (also adopted by both
BS5950 and EC4) showed about 50% variation between the calculations and test
deflections. Based on the principle of the linear partial interaction method, a method for
deflection check of the shallow cellular floor beam was modified, as expressed in Eqn.
7.3.
This modified method was then verified with different composite sections of the
shallow cellular floor beams. These different composite sections were selected to have
different stiffness than that of the test beam, i.e. similar, smaller and greater stiffness.

Chapter 7 Analysis of the flexural tests
232
The calculated deflections using the modified method, Eqn. 7.3, showed the close
comparison with the test deflections. It also correctly demonstrated the increase and
decrease of deflections due to the variation in stiffness.
The modified method, Eqn. 7.3, was developed based on the principles of the
linear partial interaction method and further verified with calculations, but there were
limitations imposed by the test data. As the geometry of the test beam only represented
the shallow cellular floor beams with solid slab, the modified method needs to be
further validated for deflection check of this type of floor beams with ribbed slab. This
could be achieved by additional flexural tests and deflection analysis.

233
Test beam UB305x165/54
UC305x305/97
I (m4): 2.14E-4
Composite section #1 UB305x165/46
UC254x254/89
I (m4): 1.94E-4
Composite section #2 UB305x127/48
UC254x254/107
I (m4): 2.02E-4
Composite section #3 UB356x171/57
UC305x305/118
I (m4): 2.13E-4
Composite section #4 UB406x178/60
UC356x368/129
I (m4): 2.22E-4
Composite section #5 UB406x178/74
UC356x368/153
I (m4): 2.43E-4
Load
(kN)
Degree of
shear
connection,
K
Test
deflection
(mm)
δc’
(Eqn. 7.3)
δc’
(Johnson)
δc’
(Eqn. 7.3)
δc’
(Johnson)
δc’
(Eqn. 7.3)
δc’
(Johnson)
δc’
(Eqn. 7.3)
δc’
(Johnson)
δc’
(Eqn. 7.3)
δc’
(Johnson)
8.65 1 2 1.92 1.92 1.84 1.84 1.75 1.75 1.68 1.68 1.53 1.53
18.27 0.83 5.99 6.75 4.73 6.57 4.56 5.80 4.22 5.55 4.05 4.70 3.60
28.84 0.79 10.14 11.45 7.66 11.17 7.40 9.78 6.81 9.35 6.53 7.86 5.79
45 0.77 16.7 18.89 12.21 18.44 11.79 16.06 10.83 15.34 10.38 12.82 9.18
Table 7.5 Deflection check for different composite sections
Test beam
UB305x165/54
UC305x305/97
I (m4): 2.14E-4
Composite section #1
UB305x165/46
UC254x254/89
I (m4): 1.94E-4
Composite section #2
UB305x127/48
UC254x254/107
I (m4): 2.02E-4
Composite section #3
UB356x171/57
UC305x305/118
I (m4): 2.13E-4
Load
(kN)
Degree of
shear
connection,
K
Test
deflection
(mm)
δc’
(Eqn. 7.3)
δc’
(Johnson)
δc’+ 15%
(Johnson)
δc’
(Eqn. 7.3)
δc’
(Johnson)
δc’+ 15%
(Johnson)
δc’
(Eqn. 7.3)
δc’
(Johnson)
δc’+ 15%
(Johnson)
8.65 1 2 1.92 1.92 2.21 1.84 1.84 2.12 1.75 1.75 2.01
18.27 0.83 5.99 6.75 4.73 5.44 6.57 4.56 5.24 5.80 4.22 4.85
28.84 0.79 10.14 11.45 7.66 8.81 11.17 7.40 8.51 9.78 6.81 7.84
45 0.77 16.7 18.89 12.21 14.04 18.44 11.79 13.56 16.06 10.83 12.46
Table 7.6 Comparison for deflection check using the method of Eqn. 7.1 (Johnson) with added 15% deflections

234
Test beam UB305x165/54
UC305x305/97
I (m4): 2.14E-4
Composite section #1
with ribbed slab Multideck 146
UB305x165/46 UC254x254/89
I (m4): 1.33E-4 (ribbed slab)
I (m4): 1.94E-4 (solid slab)
Composite section #2
with ribbed slab Multideck 146
UB305x127/48 UC254x254/107
I (m4): 1.46E-4 (ribbed slab)
I (m4): 2.02E-4 (solid slab)
Composite section #3
with ribbed slab Multideck 146
UB356x171/57 UC305x305/118
I (m4): 1.61E-4 (ribbed slab)
I (m4): 2.13E-4 (solid slab)
Load
(kN) K
Test
deflection
(mm)
δc’
(Eqn. 7.3)
δc’
(Johnson)
δc’+ 15%
(Johnson) δc
’
(Eqn. 7.3)
δc’
(Johnson)
δc’+ 15%
(Johnson) δc
’
(Eqn. 7.3)
δc’
(Johnson)
δc’+ 15%
(Johnson)
8.65 1 2 2.80 2.80 3.22 2.55 2.55 2.93 2.31 2.31 2.66
18.27 0.83 5.99 7.97 6.42 7.39 7.55 5.92 6.81 6.58 5.31 6.10
28.84 0.79 10.14 13.18 10.29 11.83 12.56 9.51 10.94 10.89 8.50 9.78
45 0.77 16.7 21.34 16.25 18.69 20.41 15.05 17.30 17.64 13.43 15.44
Table 7.7 Deflection check for composite sections with ribbed slab

Chapter 7 Analysis of the flexural tests
235
7.3 Back analysis of four-point symmetric bending test
The results of the four-point symmetric bending test were back analysed to determine
the degree of shear connection and shear performance of the shear connection. The back
analysis was carried out using measured material properties with all partial safety
factors set to unity.
Although the plastic failure of the beam specimen was not reached in the four-
point symmetric bending test, plastic theory was used for the back analysis as the
concrete-infill-only shear connection within the left shear span failed. Plastic stress
block method was used in the back analysis with the assumptions of:
Concrete tensile strength was neglected;
The local buckling of the web post was prevented by the concrete
encasement;
The steel section was stressed to a uniform stress in both tension and
compression;
The concrete was stressed to a uniform compression over the depth
between the plastic neutral axis (P.N.A) and most compressed fibre of the
concrete.
The data used in this back analysis were the tests results and measured material
properties obtained at the final loading stage in the four-point symmetric bending test:
Bending moment at the left loading point of 285kNm,
Steel tensile stress of 324N/mm2,
Concrete cube compressive strength of 30N/mm2.
7.3.1 Stress block method
In order to verify the accuracy of using the cross section with the full web opening for
calculation of moment resistance, the moment resistances of the left shear span of the
beam specimen in various degrees of shear connection was first determined. The stress
block diagram of the cross section with the full web opening is shown in Figure 7.3.
The stress block method was used with the measured material properties. The
methodology for determining the moment resistance of the beam specimen in various
degrees of shear connection is summarised in the following steps.

Chapter 7 Analysis of the flexural tests
236
1. To determine the compressive resistance of the concrete slab in full shear
connection, Rc, using the stress block method with the equilibrium of
tension and compression;
2. To determine the longitudinal shear resistance of the shear connection, Rq,
using η = Rq/Rc, where η is the degrees of shear connection;
3. To determine the depth of concrete in compression, d, using the concrete
compressive resistance in partial shear connection is equal to Rq;
4. To determine the depth of plastic neutral axis (P.N.A) in partial shear
connection using the equilibrium of the tension and compression within
the cross section;
5. To determine the moment resistances by taking moments about P.N.A.
Figure 7.3 Stress block diagram of the cross section with the full web opening
By using the cross section with the full web opening, the calculated moment
resistances of the beam specimen in various degrees of shear connection is shown in
Figure 7.4. The calculated depths of P.N.A in the various degrees of shear connection
are illustrated in Figure 7.5. It was shown that P.N.A was within the bottom flange or
below the web opening for all degrees of shear connection. In the other words, the beam
specimen should have the full shear connection at the test P.N.A of 178mm in the four-
point symmetric bending test. However, the flexural test showed that the full shear
connection was not achieved in the left shear span, as the concrete-infill-only shear
connection failed. Hence, it was not correct to use the cross section with the full web
opening to determine the moment resistance of the beam specimen.

Chapter 7 Analysis of the flexural tests
237
150
200
250
300
350
400
0 0.2 0.4 0.6 0.8 1
Degree of shear connection, η
Moment
resistance
(kNm)Full web opening
test result 285 (kNm)
150
200
250
300
350
400
0 0.2 0.4 0.6 0.8 1
Degree of shear connection, η
Moment
resistance
(kNm)Full web opening
test result 285 (kNm)
Figure 7.4 Moment resistance of the cross section with the full web opening in various
degrees of shear connection
0
58
115
173
230
0 0.2 0.4 0.6 0.8 1
Degree of shear connection, η
Depth of
USFB
specimen
Full web opening
depth of web
opening
Test P.N.A
0
58
115
173
230
0 0.2 0.4 0.6 0.8 1
Degree of shear connection, η
Depth of
USFB
specimen
Full web opening
depth of web
opening
Test P.N.A
Figure 7.5 Depths of P.N.A for cross section with the full web opening in various
degrees of shear connection
Figure 7.6 Cross sections with different depths of the web opening
beam

Chapter 7 Analysis of the flexural tests
238
Figure 7.7 Stress block diagrams of the different cross sections
In order to conclude an optimum cross section for determining the moment
resistance of the beam specimen, the cross sections at different positions of the web
opening, as shown in Figure 7.6, were used to calculate the moment resistance and
depth of P.N.A and then to compare with the test results. The stress block diagrams of
these different cross sections were illustrated in Figure 7.7.
The calculated moment resistances of these different cross sections in various
degrees of shear connection were compared with the test moment of 285kNm, as shown
in Figure 7.8. It was shown that the moment resistance was increased with the reduction
in the size of the web opening for a degree of shear connection. The calculated depths of
P.N.A in the different cross sections were compared with the depth of P.N.A shown in
the flexural test, as illustrated in Figure 7.9. It was shown that the P.N.A depths moved
upwards with higher degrees of shear connection for a cross section, and that the profile
of P.N.A became close to linear for the cross section without the web opening.
The degrees of shear connection of these different cross sections at the test
moment of 285kNm and test P.N.A of 178mm are summarised in Table 7.8. The cross
section without the web opening showed very low degree of shear connection at the test
moment and the P.N.A, which was below the minimum degree of shear connection, 0.4,
specified by BS5950 and EC4. Hence, the cross section without the web opening would
overestimate the moment resistance by taking into account of the entire web post, and
could not represent the actual cross section of the beam specimen.
Among these different cross sections, the cross section with 1/2 depth of the web
opening showed the closest comparison for the degrees of shear connection at the test

Chapter 7 Analysis of the flexural tests
239
moment and test P.N.A depth, as listed in Table 7.8. Therefore, the cross section with
1/2 depth of the web opening was the optimum cross section of the beam specimen for
determining the moment resistance.
The calculated moment resistances and the depths of P.N.A for the different cross
sections in various degrees of shear connection were shown in Appendix H. Calculation
details for the moment resistances and P.N.A depth of the cross section with 1/2 depth
of the web opening in the degrees of shear connection, 0.5, 0.7 and 1.0, were shown in
Appendix G.
150
200
250
300
350
400
0 0.2 0.4 0.6 0.8 1
Degree of shear connection, η
Moment
resistance
(kNm)
Full web opening
3/4 web opening
1/2 web opening
1/4 web opening
without web opening
test result 285 (kNm)
Figure 7.8 Moment resistances of the different cross sections in various degrees of shear
connection
0
58
115
173
230
0 0.2 0.4 0.6 0.8 1
Degree of shear connection, η
Depth of
USFB
specimen
Full web opening
3/4 web opening
1/2 web opening
1/4 web opening
without web opening
depth of web
opening
Test P.N.A
Figure 7.9 Depths of P.N.A for the different cross sections in various degrees of shear
connection
beam

Chapter 7 Analysis of the flexural tests
240
Cross Section with
Different Depths
of the Web Opening
Degree of Shear
Connection, η, at
Test Moment of
285kNm
Degree of shear
Connection, η, at
Test P.N.A of
178mm
Ratio of η
(at test moment/
at test P.N.A)
Full web opening 0.65 0.99 0.65
3/4 web opening 0.57 0.88 0.65
1/2 web opening 0.48 0.7 0.69
1/4 web opening 0.35 0.55 0.64
Without web opening 0.3 0.38 0.79
Table 7.8 Degrees of shear connection for the different cross sections at the test moment
and the test P.N.A
7.3.1.1 Determination of degree of shear connection
By using the concluded optimum cross section with 1/2 depth of the web opening, the
results of the four-point symmetric bending test were back analysed to determine the
degree of shear connection. The plastic stress block diagram of the cross section is
illustrated in Figure 7.10. The methodology of the back analysis was summarised in the
following steps:
1. To calculate the moment resistance of the steel section, Ms, using the
P.N.A depth of 178mm shown in the flexural test. The measured steel
stress of 324N/mm2 at the final loading stage was used as the stress for
both tension and compression;
2. To calculate the additional moment resistance due to the composite action,
Mcomp, by subtracting the Ms from test moment of 285kNm;
3. By using the result of the Mcomp, to calculate the compressive resistance of
the concrete slab in partial shear connection, which was also equal to the
longitudinal shear resistance of the shear connection, Rq;
4. To determine the degree of shear connection, η, using η = Rq/Rc, where Rc
is compressive resistance of the concrete slab in full shear connection.
The determined degree of shear connection of left shear span in the four-point
symmetric bending test was 0.46. The calculation details are shown in Appendix F.

Chapter 7 Analysis of the flexural tests
241
Figure 7.10 Stress block diagram of the optimum cross section at test P.N.A
The calculated moment resistance of the cross sections in various degrees of shear
connection, as shown in Figure 7.8, could also be used to check the determined degree
of shear connection of 0.46. The moment resistance shown in Figure 7.8 was calculated
by using the plastic stress block method with different degrees of shear connection. For
the optimum cross section of 1/2 web opening, the degree of shear connection of 0.48
was shown in Figure 7.8 for the test moment of 285kNm. This further confirmed the
back calculated degree of shear connection, 0.46, for the four-point symmetric bending
test.
7.3.2 Shear performance of the shear connection
The shear performance of the shear connection, αc, as expressed in Eqn. 7.4, represented
the contribution of the shear connection to the composite action in the flexural test.
αc = Rq/ Pu (7.4)
Where: αc is the shear performance of the shear connection;
Rq is the longitudinal shear resistance of the shear
connection in the flexural test;
Pu is the shear resistance of the shear connection in the
push-out tests.
At the degree of shear connection of 0.46 (as determined above), the longitudinal
shear resistance of the concrete-infill-only shear connection, Rq, was 446kN, as the
compressive resistance of the concrete slab in full shear connection, Rc, was 969kN
(obtained in Appendix G), since Rq = ηRc. There were nine concrete-infill-only shear
connection within the left shear span of the four-point symmetric bending test. The
longitudinal shear force was uniformly distributed within the shear span, as the constant
shear force within the shear span was created by the four-point bending test and uniform
slips were shown within the shear span. Hence:
Rq: The longitudinal shear resistance of each concrete-infill-only shear
connection in the flexural test was 446/9=50kN.

Chapter 7 Analysis of the flexural tests
242
Pu: The shear resistance of each concrete-infill-only shear connection in the
push-out tests was 175kN.
Therefore, the shear performance of the concrete-infill-only shear connection, αc,
in the four-point symmetric bending test was 29%, or approximately 30%.
7.4 Back analysis of three-point asymmetric bending test
The beam specimen was tested to the ultimate failure in the three-point asymmetric
bending test. The failure mode of the beam specimen was flexural failure. The slip
curves demonstrated the plastic ductile failure of the shear connection in the shear span.
The degree of shear connection and the shear performance of the shear connection in the
three-point asymmetric bending test were determined in the back analysis based on the
plastic theory.
The measured material properties were used in the back analysis with all partial
safety factors set to unity. Plastic stress block method was used in the back analysis.
The same assumptions made for the back analysis of the four-point symmetric bending
test were also applied for this back analysis. The test results and measured material
properties obtained at the ultimate failure of the flexural test were:
Bending moment at the loading point was 385kNm,
Coupon test yield strength was 414N/mm2.
Concrete cube compressive strength was 31N/mm2.
The coupon test yield strength of 414N/mm2 was used in the back analysis, as the
steel tensile stress at the loading point was not obtained in the three-point asymmetric
bending. This was due to the change of loading point after the strain gauges were glued.
However, the yield stress was considered reached in the steel bottom flange at the
loading point, as the permanent deformations with large residual deflections were
observed at the end of the flexural test.
7.4.1 Stress block method
The moment resistances of the beam specimen in various degrees of shear connection
were calculated by using the plastic stress block method with the measured material
properties obtained at the ultimate failure, as shown in Figure 7.11. The optimum cross
section with 1/2 depth of the web opening was used in the calculations. The calculation

Chapter 7 Analysis of the flexural tests
243
results are listed at the end of Appendix J. The calculation details for the moment
resistances with degrees of shear connection, 0.5, 0.7 and 1.0, are shown in Appendix J.
The test moment of 385kNm was compared with the calculated moment
resistances for various degrees of shear connection, as shown in Figure 7.11. The degree
of shear connection in the three-point asymmetric bending test was 0.56.
150
200
250
300
350
400
450
500
0 0.2 0.4 0.6 0.8 1
Degree of shear connection, η
Moment
resistance
(kNm)
test result 385 (kNm)
Figure 7.11 Moment resistances for various degrees of shear connection
7.4.2 Shear performance of the shear connection
The shear performance of the shear connection, αc, in the three-point asymmetric
bending test was determined by using Eqn. 7.4. There were three tie-bar (Ø16mm) shear
connection and two concrete-infill-only shear connection within the shorter shear span.
At degree of shear connection of 0.56 (as determined above), the longitudinal shear
resistance of the combined shear connection, Rq, was 662kN, as Rc=1182kN (obtained
in Appendix J), since Rq = ηRc.
The three-point asymmetric bending test showed that the uniform and non-
discrete failure behaviour between these two types of shear connection, namely, the
concrete-infill-only and tie-bar (Ø16mm) shear connection. The use of the tie-bar
prevented the brittle failure of the concrete-infill-only shear connection; so that these
two types of shear connection demonstrated the uniform behaviour and combined effect
towards the composite action of the beam specimen. It could be considered that the
longitudinal shear resistance within the shear span was equally distributed between the
shear connection, as the constant shear force was created within the shear span. Hence:

Chapter 7 Analysis of the flexural tests
244
Rq: The longitudinal shear resistance of each shear connection in the flexural
test was 132kN.
Pu: The shear resistance of each concrete-infill-only and tie-bar (Ø16mm)
shear connection in the push-out tests was 175kN and 369kN
respectively.
Therefore, the individual shear performance of the concrete-infill-only and tie-bar
(Ø16mm) shear connection in the three-point asymmetric bending test was 75% and
36% respectively. It was shown that the use of the tie-bar not only contributed towards
the ductility of the shear connection, also significantly increased the performance of the
shear connection. The shear performance of the concrete-infill-only shear connection in
the four-point bending test was about 30%, which was much lower then the shear
performance of 75% when used in combination with the tie-bar shear connection.
Another way to describe the shear performance of the combined shear connection
was to consider the concrete-infill-only and tie-bar shear connection as one unit, as non-
discrete failure behaviour and combined effects towards the composite action was
shown by the two types of shear connection.
Rq: The longitudinal shear resistance of a combined shear connection in the
flexural test was 132 x 2 = 264kN.
Pu: The shear resistance of the concrete-infill-only and tie-bar (Ø16mm)
shear connection in the push-out tests was 175kN and 369kN
respectively, hence, the combined shear strength was 544kN.
Thus, the shear performance of a combined shear connection in the three-point
asymmetric bending test was 49%, or approximately 50%.
7.5 Design method for moment resistance
Based on findings of the push-out tests and flexural tests, a design method for moment
resistance of the composite shallow cellular floor beams was proposed. The proposed
design method disregarded the case which the composite action was solely provided by
the concrete-infill-only shear connection, as brittle failure of the shear connection was
shown in both the push-out tests and four-point bending test. The design method
considered both the partial and full composite action provided by the combination of the
concrete-infill-only and tie-bar shear connection, as ductile failure behaviour of the
combined shear connection was shown in the flexural test.

Chapter 7 Analysis of the flexural tests
245
Findings of the push-out tests and flexural tests used for the proposed design
method were:
The developed design method for shear resistance of the shear connection,
Eqn. 5.14;
The concluded optimum cross section, 1/2 depth of the web opening, for
determining moment resistance of the composite section using plastic
stress block method;
The shear performance of the combined shear connection (the concrete-
infill-only and tie-bar shear connection), 50%, shown in the flexural test.
The design methods specified in both BS5950 and EC4 for moment resistance of
a composite beam were implemented into the proposed design method. The steps in
using the proposed design method to compute the design moment resistance of the
shallow cellular floor beams are summarised as:
1. To calculate the design shear resistance of the shear connection, Puc, using
the shear strength design method of Eqn. 5.14;
2. To calculate the longitudinal shear resistance of the combined shear
connection in the composite sections, Rq, by using the shear performance
of 50%;
3. By using the optimum cross section of 1/2 web opening depth, to
determine compressive resistance of the concrete slab in full shear
connection, Rc, in accordance with the plastic stress block method
specified in BS5950 and EC4;
4. To calculate the degree of shear connection, η, as η=Rq/Rc;
5. If the composite section is in full shear connection, the design moment
resistance, MRd, is determined by using the plastic stress block method in
accordance with BS5950 and EC4;
6. If the composite section is in partial shear connection, the design moment
resistance, MRd, is determined by using the linear interaction method in
accordance with BS5950 and EC4.
The moment resistance of the beam specimen in the three-point asymmetric
bending test was calculated by using the proposed design method. The calculated design
moment resistance was then verified with the flexural test results.
1. Puc=808kN, obtained by using Eqn. 5.14;

Chapter 7 Analysis of the flexural tests
246
2. Rq=404kN, obtained by using the shear performance of the combined
shear connection as 50%;
3. Rc=898kN, obtained in accordance with BS5950 and EC4, with the
optimum cross section of 1/2 web opening depth (calculation details are
shown in Appendix K);
4. η=0.45, which is partial shear connection, as η=Rq/Rc;
5. MRd=280kN, obtained by using the linear interaction method in accordance
with BS5950 and EC4.
The flow chat of the proposed design method for moment resistance of the
composite shallow cellular beams is illustrated in Chart 7.1. The calculated design
moment resistance of the beam specimen using the proposed design method was 280kN,
which was 27% lower than the test moment of 385kN. Although the proposed design
method for moment resistance was verified with the flexural test results, however it
would be better to further validate the design method with more flexural tests for
different composite sections and various opening diameters. Nevertheless, this type of
full-scale tests are time consuming and expensive to carry out. The other approach to
further verify the design method is the Finite Element Analysis (FEA), again the
accurate FEA models of the large scale tests are also time consuming to develop, as the
concrete behaviour is difficult to predict. For the future research, the FEA for the
flexural behaviour of different composite sections would be desirable.

Chapter 7 Analysis of the flexural tests
247
Chart 7.1 Flow chart of the design method for moment resistance of the composite
shallow cellular floor beams
Longitudinal shear
resistance of the shear
connection, Rq,
as (Rq=αPu)
Shear performance of the
combined shear connection, α,
as 50%
Design moment resistance in
full shear connection, Mpl,Rd,
using stress block method in
accordance with BS5950 or
EC4
Design moment resistance in
partial shear connection, MRd,
using linear interaction
method in accordance with
BS5950 or EC4
Design method for shear resistance of the shear connection,
Eqn. 5.14
Shear resistance of the shear
connection, Puc
Compressive resistance of the
concrete slab in full shear
connection, Rc, calculated in
accordance with BS5950 &
EC4
Degree of shear
connection, η, as
η=Rq/Rc
Partial shear
connection Full shear
connection

Chapter 7 Analysis of the flexural tests
248
7.6 Conclusions
The flexural tests on the composite shallow cellular beams demonstrated that significant
composite action due to the unique shear transferring mechanism. The behaviour of the
test beam was essentially elastic at the SLS, but the deflection calculations based on the
uncracked or cracked section properties showed the effects of partial shear connection
on the deflections. The calculated deflections using the method for deflection check
presented in Johnson and May 1975, also adopted in both BS5950 and EC4, were
consistently lower than the test deflections, about 50% lower. Based on the principle of
this established method, or so called the ‘linear partial interaction method’, a modified
method for deflection check of the shallow cellular floor beams was developed and
verified with the deflection calculations of different composite sections.
The degree of composite interaction and shear performance of the shear
connection were determined in the back analysis in the aims to develop a design method
for moment resistance of the shallow cellular floor beams. The calculated moment
resistance and depth of P.N.A using the cross section with the full web opening did not
compare well with the flexural test results. An optimum cross section with 1/2 depth of
the web opening was concluded for determining the moment resistance of the shallow
cellular floor beams using the plastic stress block method.
The use of the tie-bar demonstrated the significant increase in shear performance
for the shear connection. The shear performance of the concrete-infill-only shear
connection in the four-point bending test was about 30%, which was much lower than
the shear performance of 75% when used in combination with the tie-bar shear
connection. Another way to describe the shear performance of the combined shear
connection was to consider the concrete-infill-only and tie-bar shear connection as one
unit. The shear performance of the combined shear connection shown in the flexural test
was 50%, which was adopted in the design calculation for moment resistance of the
shallow cellular floor beams. Also, the concluded design method for shear resistance of
the shear connection was used in the design method for the moment resistance; the flow
chat was shown in Chat 7.1.
The calculations using both developed design methods, i.e. deflection check and
moment resistance, were verified with the test results. But there was limitation imposed
on the test data. As the test beam only represented the shallow cellular floor beams with
solid slab; hence for future research, it would be desirable to investigate the flexural
performance of the composite beams with ribbed slab.

Chapter 7 Analysis of the flexural tests
249
Test Moment
(kNm)
Degree of Shear
Connection, η
Shear Performance of
Shear Connection, α
Four-point bending test 285 0.46 30% *
Three-point bending test 385 0.56 50% ~
* shear performance of the concrete-infill-only shear connection
~ shear performance of the combined shear connection
Table 7.9 Results of the flexural tests and back analysis

Chapter 8 Conclusions and recommendations
250
Chapter 8 Conclusions and recommendations
The shear transferring mechanism for composite shallow cellular floor beams is
different from those systems with the conventional headed shear studs and has not been
studied previously. The experimental and analytical studies carried out in this research
provide comprehensive information on the behaviour and shear resisting properties of
the unique shear transferring mechanism and has achieved better understanding of the
failure mechanism of the shear connection. Overall this research has advanced the
method of shear connection in shallow floor beam construction.
8.1 Conclusions
The unique shear transferring mechanism is formed by the web opening features of the
composite shallow cellular floor beams. The steel sections of the composite beams are
fabricated by welding two asymmetric cellular tees along the web. There are regularly
spaced openings on the web post. The in-situ concrete fills the opening with or without
the additional element of tie-bar, resisting longitudinal shear force.
Two series of push-out tests were carried out to investigate the shear connection
under the direct longitudinal shear force. Two flexural tests were carried out to
investigate the composite shallow cellular floor beams and its shear connection under
the bending load. Analytical studies were performed to establish design methods for
both shear connection and composite shallow cellular floor beams. The conclusions
from the experimental and analytical studies are presented in two sections as:
Section 8.1.1
Experimental
studies
Behaviour and failure mechanism of the shear connection
in both push-out tests and flexural tests;
Flexural behaviour and composite action of the composite
shallow cellular floor beam in the flexural tests;
Section 8.1.2
Analytical
studies
Design methods for the shear connection and composite
shallow cellular floor beams.

Chapter 8 Conclusions and recommendations
251
8.1.1 Conclusions of experimental studies
Two types of tests were carried out to investigate the unique shear transferring
mechanism, namely the push-out tests and flexural tests. The push-out tests applied the
direct longitudinal shear force to the shear connection. The load-slip behaviour and
shear resisting properties of the shear connection were obtained in the push-out tests.
The specimens of the push-out tests were designed to represent the actual configurations
of the shear connection used for the composite shallow cellular floor beams, and to
create the desired loading conditions for the shear connection.
There were two series of push-out test. The push-out test series-I investigated the
four types of the shear connection, i.e. concrete-infill-only, tie-bar (Ø12mm), ducting
and web-welded stud shear connection. Comprehensive information was obtained from
the push-out tests; however there were aspects of the tests could be improved, i.e.
avoiding local bond failure, minimum three identical specimens for a type of shear
connection and preventing the shear failure for the tie-bar. In the light of the push-out
test series-I, the second groups of push-out tests, series-II, were designed and carried out
to further investigate the concrete-infill-only and tie-bar (Ø16mm) shear connection.
The conclusions of both push-out test series are presented in the following section.
8.1.1.1 Push-out tests
The conclusions for the shear connection are presented in the areas of behaviour and
failure mechanism. The findings of both push-out test series were also summarised.
Concrete-infill-only shear connection
Behaviour: In both push-out test series, the concrete-infill-only shear
connection showed a distinctive brittle failure mode, as the
rupture failure occurred without any plastic deformations. This
brittle failure mode was due to the fact that the concrete-infill-
only shear connection consisted of solely the concrete infill
element, and that concrete was a brittle material.
Failure mechanism:
The top section of the concrete infill element was crushed by the
web in the longitudinal shear direction, and the other part of the

Chapter 8 Conclusions and recommendations
252
concrete infill element was ruptured by the tensile splitting in
the transverse direction.
Tie-bar shear connection
Behaviour: Both Ø12mm and Ø16mm tie-bar shear connection showed the
ductile load-slip behaviour and failure mode. Large slips
occurred before and after the ultimate loads. The tie-bar
(Ø16mm) shear connection demonstrated a mechanism of
sustaining the ultimate load while large slips were induced. It
was shown that the tensile strength of the Ø16mm tie-bar was
more effective.
Failure mechanism:
The Ø12mm tie-bars were positioned close to the perimeter of
the web opening. One of the tie-bars was sheared off, as it was
in direct contact with the movement of the web post (or slips)
while the other tie-bar remained intact.
The tie-bar did not fail in the tie-bar (Ø16mm) shear
connection. The shear resisting mechanism of the tie-bar would
be the tensile strength, as the ductile slip behaviour and
significantly gained strength were shown by the additional tie-
bar. Anchorage failure was not seen in the tie-bar.
The failure mechanism of the concrete infill element in both
tie-bar shear connection was the same as that of the concrete-
infill-only shear connection.
Ducting shear connection
Behaviour: The ducting shear connection showed brittle failure mode,
similar to that of the concrete-infill-only shear connection. The
ducting deformed extensively. Large slips occurred after the
ultimate loads were reached. The ducting itself had little shear
resistance due to its geometry and thickness. Nonetheless, the
presence of the ducting reduced the tendency of brittle failure
mode.

Chapter 8 Conclusions and recommendations
253
Failure mechanism:
Crushing of the concrete infill element led to the deformations
of the ducting. Concrete infill element was crushed together
with tensile splitting.
Web-welded stud shear connection
Behaviour: The web-welded stud shear connection showed ductile load-slip
behaviour and failure mode. Plastic deformations with large
slips occurred before and after the ultimate loads. The headed
studs demonstrated great influence on the behaviour of the web-
welded studs shear connection, whose behaviour was the same
as that of the headed studs in the standard push-out tests.
Failure mechanism:
The headed studs were sheared off with bending near the root;
concrete around the studs was crushed. The failure mechanism
of the concrete infill element was the same as those of the
concrete-infill-only shear connection.
Findings of both push-out test series are summarised below.
The additional elements of the tie-bars and studs used in combination
with the concrete infill element had significantly increased the ductility,
slip capacity and shear resisting capacity of the shear connection.
Strong tie resistance was shown by all four types of the shear connection,
as very little separation was shown in the push-out tests.
The push-out tests showed that the shear resistance of the shear
connection increased with increase of the web opening diameter and
concrete strength.
The concrete-infill-only shear connection showed the distinctive brittle
failure mode with the slip capacity of 4-5mm. The brittle failure mode
was due to that the shear connection consisted of solely the concrete infill
element, and that concrete was a brittle material.
In contrast, the tie-bar (Ø16mm) shear connection showed the ductile
failure mode with the slip capacity of 12-14mm. It was shown that the

Chapter 8 Conclusions and recommendations
254
tensile resistance of the tie-bar became effective in the tie-bar shear
connection, and that the 1m length provided adequate anchorage
resistance to the Ø16mm tie-bar.
The additional tie-bars of Ø16mm increased the shear resistance of the
shear connection by twofold. The comparison was base on the shear
connection of Ø150mm web opening with 30N/mm2 concrete strength.
The shear resistance of a concrete-infill-only shear connection with
Ø150mm web opening was 1.75 times the shear resistance of a headed
stud of Ø19mm and 100mm height. This comparison was base on the
concrete strength of 30N/mm2.
Similarly, the shear resistance of a tie-bar (Ø16mm) shear connection
with Ø150mm web opening was 3.7 times the shear resistance of a
headed stud of Ø19mm and 100mm height. This comparison was base on
the concrete strength of 30N/mm2.
This tie-bar (Ø16mm) shear connection showed both desired shear
resistance and ductility. This type of shear connection required no
additional welding which was required for the web-welded stud shear
connection. Hence, the tie-bar (Ø16mm) shear connection was the
optimum shear connection for the composite shallow cellular floor beams.
8.1.1.2 Flexural tests
The full-scale flexural test beam specimen was designed to represent the actual
composite shallow cellular floor beams of a common span range with solid concrete
slab. Two flexural tests were carried out on the test beam, i.e. the four-point symmetric
and three-point asymmetric bending tests. The test beam was designed to further
investigate the concrete-infill-only and tie-bar (Ø16mm) shear connection. The four-
point symmetric bending was first carried out without the failure of the beam specimen,
only up to the plastification of the mid-span deflection. The test created a bending
moment profile similar to that of the UDL. The concrete-infill-only shear connection
was particularly investigated in the four-point symmetric bending test. The three-point
asymmetric bending test was then carried out up to the ultimate failure of the beam
specimen. The test created high shear in the shorter shear span, which had the

Chapter 8 Conclusions and recommendations
255
combination of concrete-infill-only and tie-bar (Ø16mm) shear connection. The
conclusions made from both flexural tests were:
Significant composite action due to the unique shear transferring
mechanism was demonstrated in both flexural tests. The test moment
resistances were 1.5 times the plastic moment resistance of the steel
section only.
Partial shear connection was shown before the yielding of the steel
section. The behaviour of the beam specimen was essentially elastic
when the serviceability limit state was reached.
The flexural failure mode of the beam specimen was shown in both
flexural tests. Although the four-point symmetric bending test was not
failure test, but the yielding of the steel bottom flange was observed as an
initial indication for the flexural failure mode. The failure mechanism of
the beam specimen in the three-point asymmetric bending test was due to
the ductile failure of the shear connection, rather than the plastic moment
resistance. The steel bottom flange had yielded with permanent deflected
shape, and large cracks were shown at the loading point but crushing of
the concrete slab was not observed.
The brittle failure mode of the concrete-infill-only shear connection was
shown in the four-point symmetric bending test. The failure slip and
transverse separation of the shear connection was the same as that shown
in the push-out tests.
The four-point symmetric bending test clearly demonstrated the
difference between the concrete-infill-only shear connection and
combined shear connection (with the tie-bar shear connection), in terms
of the slip behaviour and shear resistance. Brittle failure of the concrete-
infill-only shear connection was shown in one shear span. The combined
shear connection in the other shear span demonstrated complete elastic
slip behaviour with negligible slips.
The ductile failure mode of the combined shear connection was shown in
the three-point asymmetric bending test. This failure mode was the same
as that of the tie-bar (Ø16mm) shear connection in the push-out tests. The

Chapter 8 Conclusions and recommendations
256
additional tie-bar had direct influence on the failure mode of the
combined shear connection.
Overall, the additional tie-bar significantly increased the ductility and
shear performance of the shear connection in the flexural tests.
The behaviours and shear resistance of the two types of shear connection
were different in the push-out tests. However, a uniform (non-discrete)
behaviour of the combined shear connection was demonstrated in the
flexural tests, which showed a combined effect towards the composite
action for the test beam.
8.1.2 Conclusions of analytical studies
The results of the push-out tests and flexural tests were analysed. Design methods for
the shear connection and shallow cellular floor beams were developed, as listed in the
table below. The details of the design methods are presented in the next two sections.
Design methods
Push-out tests Design method for shear resistance of the shear connection
Flexural tests
Design method for deflection check at the serviceability limit
state (SLS)
Design method for moment resistance at the ultimate limit
state (ULS)
8.1.2.1 Analytical studies of push-out test results
The mathematical analysis on the results of the push-out tests was carried out in the
aims of developing a design method for shear resistance of the unique shear connection.
Base on the failure mechanism shown in the push-out tests, a method was proposed first
by combining the shear resistance of the concrete infill element with resistance of the
additional elements, i.e. tie-bar or studs, to calculate the total shear resistance of the
shear connection. The empirical formula of the method was resulted from the
mathematical analysis. The calculated shear resistance using the concluded formula
compared well with the results of the push-out tests. The ratio for the shear resistance of
the calculation to test results was 0.935.
Because of the complex three-dimensional stress-strain state of the concrete infill
element, it was difficult to analyse it by using the mathematical model rather than the
empirical formula. The FEA of the concrete-infill-only shear connection was carried out

Chapter 8 Conclusions and recommendations
257
to further verify the formula obtained from the mathematical analysis. Firstly, a
calibrated FEA model of the concrete-infill-only shear connection was developed. Then
a parametric study was performed by using the calibrated FEA model to investigate the
variables of concrete strength and diameter of web opening. Finally, the results of the
FEA parametric study were compared with the calculated shear resistance using the
developed formula.
The calculated results were very close to the results of the FEA parametric study,
as the average ratios of the calculated shear resistance to results of the FEA were 0.935,
0.703 and 0.863 for web opening diameters of 100, 150 and 200mm, respectively. In
order to develop a design method for the shear resistance of the shear connection, a
partial safety factor was added into the mathematical formula as expressed below. The
shear resistance obtained from the design method with the partial safety factor of 1.5
were compared with the results of the push-out tests. The ratio of the design shear
resistance (Puc) to test results was 0.624 for the partial safety factors of 1.5.
addtctccuc
RAfAfP
355.41758.61u
Where: Ac = tD
4
2DAt
Puc is the design shear resistance of the shear connection;
fcu is the concrete cube compressive strength in N/mm2;
fct is the concrete tensile splitting strength in N/mm2;
Ac is the area of concrete in the compression;
At is the area of concrete in the tensile splitting;
t is the thickness of the web;
D is the diameter of the web opening;
Radd is the shear resistance of the additional elements i.e. tie-
bar or shear studs;
γ is the partial safety factor.
8.1.2.2 Analytical studies of flexural test results
The results of the flexural tests were analysed to develop design methods for the
composite shallow cellular floor beams at the serviceability limit sate (SLS) and
ultimate limit states (ULS). A method for deflection check at the SLS was established in

Chapter 8 Conclusions and recommendations
258
a deflection analysis based on elastic theory. A method for moment resistance at the
ULS was established in back analysis based on plastic theory.
Design method for deflection check
The flexural tests on the composite shallow cellular beams demonstrated
significant composite action due to unique shear transferring mechanism. The behaviour
of the test beam was essentially elastic at the SLS, but the deflection calculations based
on the uncracked or cracked section properties showed the effects of partial shear
connection on the deflections. The calculated deflections using the method for
deflection check presented in Johnson and May 1975, also adopted in both BS5950 and
EC4, were 50% lower than the test deflections. Based on the principle of this
established method, or so called ‘linear partial interaction method’, a modified method
for deflection check of the shallow cellular floor beams was developed as shown below.
))(1(2'
cscc K
Where: δc’ is the deflection of the composite beam with partial
shear connection;
δc is the deflection of the composite beam with full shear
connection;
δs is the deflection of the steel beam acting alone;
K is the degree of shear connection.
This modified method was then verified with different composite sections of the
shallow cellular floor beams. These different composite sections were selected to have
different stiffness than that of the test beam. The calculated deflections using the
modified method showed close comparison with the test deflections. It also correctly
demonstrated the increase and decrease of deflections due to the variation in stiffness.
Design method for moment resistance
The degree of shear connection and shear performance of the shear connection
were determined in the back analysis in the aims to develop a design method for
moment resistance of the shallow cellular floor beams. The calculated moment
resistance and depth of P.N.A using the cross section with the full web opening did not
compare well with the flexural test results. An optimum cross section with 1/2 depth of

Chapter 8 Conclusions and recommendations
259
web opening was calculated for determining the moment resistance of the shallow
cellular floor beams using the plastic stress block method.
The use of the tie-bar demonstrated a significant increase in shear performance for
the shear connection. The shear performance of the concrete-infill-only shear
connection in the four-point bending test was about 30%, which was much lower than
the shear performance of 75% when used in combination with the tie-bar shear
connection. The uniform (non-discrete) behaviour of the combined shear connection
was demonstrated in the flexural tests and another way to describe the shear
performance of the combined shear connection was to consider the concrete-infill-only
and tie-bar shear connection as one unit.
The shear performance of the combined shear connection shown in the flexural
test was 50%, which was adopted in the design calculation for moment resistance of the
shallow cellular floor beams. The resulting shear resistance design method for the shear
connection was implemented in developing the design method for the moment
resistance. The design model was compatible with the conventional design methods of
BS5950 and EC4. The flow chat of the design method is shown below.
Longitudinal shear resistance of the
shear connection, Rq, as (Rq=αPu)
Shear performance of the
combined shear connection, α,
as 50%
Design moment resistance in full shear
connection, Mpl,Rd, using stress block
method in accordance with BS5950 or
EC4
Design moment resistance in partial
shear connection, MRd, using linear
interaction method in accordance with
BS5950 or EC4
Design method for shear resistance of
the shear connection, Eqn. 5.14
Shear resistance of the shear
connection, Puc
Compressive resistance of the
concrete slab in full shear
connection, Rc, calculated in
accordance with BS5950 & EC4 Degree of shear connection, η,
as η=Rq/Rc
Partial shear connection Full shear connection

Chapter 8 Conclusions and recommendations
260
8.2 Recommendations
The recommendations made in this research were discussed in the areas of:
improvement of the shear connection and future research topics.
8.2.1 Recommendations for the shear connection
The results of the push-out tests provided comprehensive information on the behaviour
and shear resisting properties of the shear connection. However the design details for
some of the shear connection could be improved. The following recommendations were
made.
(6) It is recommended that the concrete-infill-only shear connection should not be
used as the sole mean to provide shear connection to the composite shallow
cellular floor beams, as the brittle failure mode of the shear connection was
shown in the push-out tests. The concrete-infill-only shear connection should
be used in combination with other additional elements, i.e. tie-bars or studs, to
provide the necessary ductility.
(7) The shear failure of the tie-bar (Ø12mm) was shown in the push-out tests, as
the tie-bars were positioned close to the perimeter of the web openings. It was
recommended that the tie-bars should be positioned away from the perimeter
of the web openings with a minimum distance of 20mm. This recommended
minimum distance is based on the maximum slip capacity of the tie-bar shear
connection shown in the push-out tests.
(8) It is recommended that the ducting shear connection should be used only in
the region of low shear, as low shear resistance of the ducting shear
connection was shown in the push-out tests. Also, it is recommended that the
ducting shear connection should not be used in the region where large slips are
expected, as buckling of the ducting occurred at the slip value of 1.5-3.5mm.
8.2.2 Recommendations for future research
(1) The behaviour and shear resistance of the shear connection used for the
composite shallow cellular floor beams under direct static shear force were
extensively investigated in the two push-out test series. The fatigue properties
of the shear connection had not been investigated previously. Push-out tests
with dynamic loading on the shear connection is recommended as a future
research topic. The findings of the dynamic loading test will provide specific

Chapter 8 Conclusions and recommendations
261
information for design calculation where the composite shallow cellular floor
beams might subject to repeated loading. The results of the dynamic loading
test could also be used to compare with those of the push-out tests with static
loading performed in this research.
(2) It was recommended that FEA of the composite shallow cellular floor beams
should be carried out in order to further verify the developed design methods
for both deflection check and moment resistance. The FEA should investigate
the composite beams with ribbed slab and variations in the size of the beam
section and web opening diameter.

Appendix A Synthetic fibre reinforcement and superplasticizer
262
Appendix A
Synthetic fibre reinforcement and superplasticizer
The synthetic fibre, STRUX 90/40, was used for the fibre-reinforced concrete of
specimens of the push-out test series-I. This synthetic fibre reinforcement was a product
of Grace Construction Products Limited. The fibres were 40mm in length with an aspect
ratio of 90, as depicted in Figure A-1. The synthetic fibre was a replacement of the
traditional welded wire mesh or steel fibre reinforcement in flooring and formwork
applications. Its benefits for construction process were: ease of use, rapid dispersion,
good finishing and improved pumpability. The advantages for performance of the
concrete were: non-corrosive, ductility and durability.
Figure A-1 Synthetic fibres, STRUX 90/40
(courtesy of Grace Construction Products Limited)
The fundamental mechanism of this synthetic fibre was a mechanical action, not a
chemical reaction between the fibres and cement paste. Therefore, it had no effect on
the hydration process of the cement. Although, the Grace Construction Limited stated
the synthetic fibres only improves the cracking control, not compressive or flexural
strengths of the concrete. The concrete strength tests carried out in this research showed
the tensile strength of the fibre-reinforced concrete was higher than that of the normal
concrete with the same compressive strength, as shown in the table below.
Compressive strength
(MPa)
Tensile strength
(MPa)
Fibre-reinforced concrete 35 4.06
Normal concrete 35 3.26
Table A-1 Strength comparison between the normal and fibre-reinforced concrete

Appendix A Synthetic fibre reinforcement and superplasticizer
263
The normal dosage rate of the STRUX
90/40 was 1.8-7.0kg/m3 of concrete
volume. This is dependent on the specifications of the application. The dosage rate used
for the push-out test series-I specimens was 5.3kg/m3. The material properties of the
synthetic fibres are:
Specific gravity 0.92
Absorption None
Modulus of elasticity 9.5GPa
Tensile strength 540MPa
Melting point 1600C
Alkali, Acid and Salt resistance High
The superplasticizer, ADVA Flow 410, was used for the fibre-reinforced concrete
of the push-out test series-I specimens to improve its workability. The ADVA Flow 410
was also a product of Grace Construction Products Limited. The dosage rate of 650ml
per 100kg cement mass was used for the fibre-reinforced concrete of the push-out test
series-I specimens. The slump of the fibre-reinforced concrete was increased from
50mm to 120mm, which was the designed workability.

Appendix B Concrete strength
264
Appendix B
Concrete strength of push-out test series-I
The concrete strength of all push-out test series-I specimens was determined at 7-day,
28-day and on-the-day of the push-out tests. The concrete compressive cube tests were
carried out in accordance with British Standard, BS1881:116: 1983. The concrete
cylinder tensile splitting tests were carried out in accordance with British Standard,
BS1881:117: 1983. The results of the concrete strength are shown in table below.
Specimen
No.
Cube compressive strength,
fcu, (MPa)
Tensile splitting strength,
fct, (MPa)
7-day 28-day On-the-day
of the test 7-day 28-day
On-the-day
of the test
T1-A-N 36.2 45.2 56.5 2.89 3.62 4.53
T1-A-F 37.2 46.5 58.1 3.10 3.88 4.85
T1-B-N 36.2 45.2 56.5 2.89 3.62 4.53
T1-B-F 37.2 46.5 58.1 3.10 3.88 4.85
T2-A-N 34.9 43.6 54.5 2.89 3.62 4.54
T2-A-F 33.2 41.5 51.9 2.60 3.26 4.07
T2-B-N 34.9 43.6 54.5 2.89 3.62 4.54
T2-B-F 33.2 41.5 51.9 2.60 3.26 4.07
T3-A-N 35.3 44.2 55.2 2.50 3.13 3.91
T3-A-F 32.9 41.2 51.5 2.49 3.11 3.89
T3-B-N 35.3 44.2 55.2 2.50 3.13 3.91
T3-B-F 32.9 41.2 51.5 2.49 3.11 3.89
T4-A-N 42.9 53.6 67.0 2.98 3.73 4.66
T4-A-F 32.1 40.2 50.2 2.61 3.26 4.08
T4-B-N 42.9 53.6 67.0 2.98 3.73 4.66
T4-B-F 32.1 40.2 50.2 2.61 3.26 4.08

Appendix B Concrete strength
265
Concrete strength of push-out test series-II
The concrete strength of all push-out test series-II specimens was determined at 7-day,
28-day and on-the-day of the push-out tests. The concrete compressive cube tests were
carried out in accordance with BS1881:116: 1983. The concrete cylinder tensile
splitting tests were carried out in accordance with, BS1881:117: 1983. The results of the
concrete strength are shown in table below.
Specimen
No.
Cube compressive strength,
fcu, (MPa)
Tensile splitting strength,
fct, (MPa)
7-day 28-day On-the-day
of the test 7-day 28-day
On-the-day
of the test
T5-1 24 30 35 2.00 2.49 3.21
T5-2 25 33 35 2.11 2.79 3.21
T5-3 22 31 32 2.31 3.26 2.90
T5-4 23 29 30 1.99 2.51 3.02
T6-1 21 27 29 2.06 2.65 2.85
T6-2 21 29 32 1.92 2.65 2.92
T6-3 18 24 28 1.60 2.13 2.49
T6-4 15 23 27 1.43 2.19 2.57
Concrete strength of flexural tests
Concrete strength of the flexural test specimen was determined at 7-day, 14-day, 28-day
and on-the-day of the flexural tests. The concrete cube compressive tests were carried
out in accordance with BS1881:116: 1983. The concrete cylinder tensile splitting tests
were carried out in accordance with BS1881:117: 1983. The results are list in the table
below.
Compressive Cube
Strength, fcu, (MPa)
Cylinder Tensile Splitting
Strength, fct, (MPa)
7-day 21 2.2
14-day 24 2.6
28-day 28 2.7
Four-point bending test
(on-the-day ) 30 2.9
Three-point bending test
(on-the-day ) 31 2.9

Appendix C Results of coupon tests
266
Appendix C
Coupon test results of Ø16mm & Ø12mm tie-bars
Ø16mm tie-bar coupon test
Diameter 7.95 (mm)
Cross-sectional area 49.64 (mm2)
Failure load 26.9 (kN)
Yield strength (MPa) 441.7
Tensile strength (MPa) 542.2
Ø12mm tie-bar coupon test
Diameter 6.33 (mm)
Cross-sectional area 31.47 (mm2)
Failure load 13.85 (kN)
Yield strength (MPa) 440.1
Tensile strength (MPa) 525.6

Appendix C Results of coupon tests
267
Coupon test results of headed studs
Ø19mm headed stud coupon test
Diameter 6.6 (mm)
Cross-sectional area 34.22 (mm2)
Failure load 18.14 (kN)
Yield strength (MPa) 452.1
Tensile strength (MPa) 530.2
Steel section of the push-out test series-II
Six coupons were machined from the steel section of the push-out test series-II. Four of
the coupons were cut from the flanges and two were cut from web post. Overall average
strengths were:
Yield strength, 420MPa
Ultimate strength, 530MPa

Appendix C Results of coupon tests
268
Steel section of the flexural test beam specimen
Six coupons were machined from the steel section. Two coupons were cut from either
the top or bottom flange. One coupon was cut from either the top or bottom web post.
Overall average strengths were:
Yield strength, 414MPa
Ultimate strength, 527MPa

Appendix D FEA element size analysis
269
Appendix D
FEA element size analysis
A concrete cube of 100 x 100mm was used to carry out the element size analysis. Only
a quarter of the cube was modelled using the symmetric boundary conditions. The
concrete element Solid65 was used with the same concrete material properties as those
of the calibration model of the push-out tests. The meshed model of the 1/4 concrete
cube is shown in Figure D-1. Four different element sizes were used in order to
determine the optimum size of the concrete element for the FEA push-out tests. These
four element sizes were 20, 15, 10 and 5mm.
The concrete strength for the cube model was 32MPa. Pressure of 31MPa was
applied to the cube model. Vertical displacements at the centre of the cube top face were
compared between the models of different element sizes, as shown in Figure D-2.
Element stresses at the centre of the cube bottom face were compared with the models
of different element sizes, as shown in Figure D-3. The results of the models with the
four element sizes were listed in Tables D-1, D-2, D-3 and D-1.
The results of vertical displacement and element stresses were almost identical
between the models of different elements. Hence, all four element sizes could be used to
model the FEA push-out tests. The computational cost was increased using the fine
element size, i.e. 5mm and 10mm. On the other hand, the element of 20mm would be
too coarse for the modelling the concrete infill. Therefore, element size of 15mm was
chosen as the optimum element size for the FEA push-out tests.
Figure D-1 Meshed model of a 1/4 concrete cube with 15mm elements

Appendix D FEA element size analysis
270
0
5
10
15
20
25
30
35
0 0.02 0.04 0.06 0.08 0.1 0.12
Vertical Displacement (mm)
Applied
Pressure
(MPa)
element 20mm
element 15mm
element 10mm
element 5mm
Figure D-2 Vertical displacements of models with different element sizes
0
5
10
15
20
25
30
35
-30 -25 -20 -15 -10 -5 0
Element Stresss (MPa)
Applied
Pressure
(MPa)
element 20mm
element 15mm
element 10mm
element 5mm
Figure D-3 Elemental stresses of models with different element sizes
Applied
Pressure
(MPa)
Vertical
Displacement
(mm)
Elemental
Stress
(MPa)
1.6 0.0051 -1.42
6.2 0.0203 -5.70
12.4 0.0406 -11.39
15.5 0.0507 -14.24
20.2 0.0660 -18.51
29.1 0.0942 -26.37
31.0 0.0995 -27.89
Table D-1 Results of the FE model with element size of 20mm

Appendix D FEA element size analysis
271
Applied
Pressure
(MPa)
Vertical
Displacement
(mm)
Elemental
Stress
(MPa)
1.6 0.0051 -1.44
6.2 0.0205 -5.75
12.4 0.0410 -11.51
15.5 0.0512 -14.39
20.2 0.0666 -18.70
29.5 0.0968 -27.05
31.0 0.0998 -28.47
Table D-2 Results of the FE model with element size of 15mm
Applied
Pressure
(MPa)
Vertical
Displacement
(mm)
Elemental
Stress
(MPa)
1.6 0.0051 -1.43
6.2 0.0203 -5.72
12.4 0.0405 -11.45
15.5 0.0507 -14.31
20.2 0.0659 -18.60
29.5 0.0953 -26.86
31.0 0.0999 -28.22
Table D-3 Results of the FE model with element size of 10mm
Applied
Pressure
(MPa)
Vertical
Displacement
(mm)
Elemental
Stress
(MPa)
1.6 0.0051 -1.42
6.2 0.0203 -5.66
12.4 0.0406 -11.33
15.5 0.0508 -14.16
20.2 0.0660 -18.41
29.1 0.0941 -26.23
31.0 0.1003 -27.92
Table D-4 Results of the FE model with element size of 5mm

Appendix E Contour plots of the FEA
272
Appendix E
Contour plots of the calibration model with concrete strength, fc, of 32MPa
(b) (b)
(a) Contour plot of vertical displacement (slips); (b) Contour plot of cracks
Contour plots of the calibration model with concrete strength, fc, of 35MPa
(a) (b)
(a) Contour plot of vertical displacement (slips); (b) Contour plot of cracks

Appendix E Contour plots of the FEA
273
Stress contour plots of the concrete and steel for calibration model with fc, of 32MPa
(a)
(b)
(c)
(a) Compression (vertical direction), (b) y-direction stress in line with web post,
(c) Separation (x-direction)

Appendix E Contour plots of the FEA
274
Stress contour plots of the concrete and steel for calibration model with fc, of 35MPa
(a)
(b)
(c)
(a) Compression (vertical direction), (b) y-direction stress in line with web post,
(c) Separation (x-direction)

Appendix E Contour plots of the FEA
275
Contour plot of the FEA model with Ø200mm web opening and concrete strength of
38MPa
(a) (b)
(a) Contour plot of vertical displacement (slips); (b) Contour plot of cracks
(a)

Appendix E Contour plots of the FEA
276
(b)
(c)
Stress contour plot of the concrete and steel volumes: (a) Compression (vertical
direction), (b) y-direction stress in line with web post, (c) Separation (x-direction)

Appendix E Contour plots of the FEA
277
Contour plot of the FEA model with Ø100mm web opening and concrete strength of
30MPa
(a) (b)
(a) Contour plot of vertical displacement (slips); (b) Contour plot of cracks
(a)

Appendix E Contour plots of the FEA
278
(b)
(c)
Stress contour plot of the concrete and steel volumes: (a) Compression (vertical
direction), (b) y-direction stress in line with web post, (c) Separation (x-direction)

Appendix F Back analysis of four-point bending test
279
Appendix F
Back analysis of the four-point bending test using the stress block method
Step 1 Moment resistance of the steel section
The moment resistance of the steel section, Ms, was calculated using the test P.N.A of
178mm. The optimum cross section, with 1/2 depth of the web opening, was used in the
calculation. The measured steel stress of 324N/mm2, at the final loading stage, was used
as the stress for both tension and compression. The stress block diagram of the steel
section was shown in Figure F-1. The moment resistance of the steel section, Ms, was
210kNm, determined by taking moments about P.N.A.
Figure F-1 Stress block diagram of the steel cross section at the test P.N.A
Step 2 Additional moment resistance due to composite action
The additional moment resistance due to the composite action, Mcomp, was 75kNm
determined by subtracting Ms of 210kNm from the test moment of 285kNm.
Step 3 Longitudinal shear resistance of the shear connections
The longitudinal shear resistance of the shear connections, Rq, was equal to the
compressive resistance of the concrete slabs in partial shear connection. Hence, the
Rq=1000(0.67fcu)d, where d is the depth of concrete in compression. Based on
Mcomp=Rq(178 – d/2), the Rq of 450kN was obtained. The 0.67fcu was the concrete
compressive strength in bending. The depth of concrete in compression, d, was 22.3mm.
Step 4 Degree of shear connection
The degree of shear connection, η, was determined using η = Rq/Rc, where Rc was the
compressive resistance of the concrete slabs in full shear connection. The Rc was 969kN
determined in Appendix G. Hence, the degree of shear connection was 0.46.

Appendix G Calculated moment resistance in four-point bending test
280
Appendix G
Calculated moment resistance of the beam specimen in four-point bending test
The moment resistance of the beam specimen in the four-point symmetric bending test
was calculated in the degrees of shear connection, 0, 0.5, 0.7 and 1.0. The stress block
method was used in the calculation with the measure material properties at the final
loading stage and the concluded optimum cross section (with the 1/2 depth of the web
opening). The moment resistance in zero degree of shear connection was the moment
resistance of the steel section alone. The results of the calculation are summarised in the
table below. The calculation details are shown in the following sections.
Degree of Shear
Connection, η
Shear Resistance of
Shear Connections,
Rq (kN)
Depth of Concrete
in Compression, d
(mm)
Depth of
P.N.A
(mm)
Moment
Resistance, (kNm)
0 -- -- 217.1 196.3
0.5 485 24.1 207.6 290.7
0.7 679 33.8 179.6 321.2
1.0 969 48.3 48.3 347.6
G.1 Moment resistance of the steel section (Ms)
The plastic stress block method was used to determine moment resistance of the steel
section. The stress block diagram is illustrated in Figure G-1. The measured tensile
stress of 324N/mm2 at the final loading stage was used as both tension and compression.
Figure G-1 Stress block diagram of the steel section
Step 1 Determine the depth of plastic neutral axis (P.N.A)
The equilibrium of tension and compression, expressed in Eqn. G.1, was used to
determine the depth of P.N.A, D.
Rt/f + Rt/w + Rb/w + K = Rb/f – K (G.1)
Where: Rt/f is the resistance of the top flange (At/fPy);

Appendix G Calculated moment resistance in four-point bending test
281
Rt/w is the resistance of the web post of the top tee (At/wPy);
Rb/w is the resistance of the web post of the bottom tee
(Ab/wPy)
Rb/f is the resistance of the bottom flange (Ab/fPy)
K is the bottom flange in compression [305.3Py (D-215)].
By substituting the steel stress and the cross sectional areas of the steel elements
into Eqn. G.1, hence D = 217.1mm, which was within the bottom flange.
Step 2 Determine plastic moment capacity
Taking moments about P.N.A,
Ms = Rt/fDt/f + Rt/wDt/w + Rb/wDb/w + K(D-215)/2 + (Rb/f – K)(230-D)/2
(G.2)
Where: Ms is the plastic moment resistance of the steel section
Dt/f is the distance between the Rt/f and P.N.A,
Dt/w is the distance between the Rt/w and P.N.A,
Db/w is the distance between the Rb/w and P.N.A,
Db/f is the distance between the Rb/f and P.N.A.
By substituting the resistance of the steel elements and their distances to P.N.A
into Eqn. G.2, hence, Ms = 196.3kNm.
G.2 Moment resistance of the cross section in full shear connection (Mpc)
The plastic stress block diagram of the cross section is illustrated in Figure G-2. The
moment resistance of the cross section was determined using the measured material
properties at the final loading stage, i.e. steel stress of 324N/mm2 and concrete strength
of 30N/mm2. The shear strength of the shear connections was assumed unaffected by
the depth of P.N.A. The results of the push-out tests were used in the calculation.
Figure G-2 Stress block diagram of the cross section in full shear connection

Appendix G Calculated moment resistance in four-point bending test
282
Step 1 Determine the depth of P.N.A
The equilibrium of tension and compression, expressed in Eqn. G.3, was used to
determine the depth of P.N.A, D.
Rt/f + (Rt/w – K) + Rc = K + Rb/w + Rb/f (G.3)
Where: Rt/f is the resistance of the top flange (At/fPy);
Rt/w is the resistance of the web post of the top tee (At/wPy);
Rc is the compressive resistance of the concrete slab in full
shear connection (1000*0.67fcuD)
Rb/w is the resistance of the web post of the bottom tee
(Ab/wPy);
Rb/f is the resistance of the bottom flange (Ab/fPy);
K is the web post of the top tee in tension [7.9(77.5-D)Py]
By substituting the cross sectional areas of the steel elements, Py = 324N/mm2 and
fcu = 30N/mm2 into the Eqn. G.3, hence, D = 48.3mm
Also, the compressive resistance of the concrete slab in full shear connection, Rc,
of 969kN was obtained.
Step 2 Determine the plastic moment capacity
Taking moments about P.N.A,
Mpc=Rt/fDt/f + (Rt/w–K)(D-Dt/f)/2 + RcDc + K(77.5-D)/2 + Rb/wDb/w + Rb/fDb/f
(G.4)
Where: Mpc is the full plastic moment of the composite section
Dt/f is the distance between the Rt/f and P.N.A,
Dt/w is the distance between the Rt/w and P.N.A,
Dc is the distance between the Rc and P.N.A,
Db/w is the distance between the Rb/w and P.N.A,
Db/f is the distance between the Rb/f and P.N.A.
By substituting the resistance of the steel elements, their distance to P.N.A and Rc,
into Eqn. G.4, hence, Mpc = 347.6kNm.

Appendix G Calculated moment resistance in four-point bending test
283
G.3 Moment resistance of the cross section in degree of shear connection of 0.5
The stress block diagram of the cross section in degree of shear connection of 0.5 is
illustrated below.
Figure G-3 Stress block diagram of the cross section in degree of shear connection of
0.5
Step 1 Determine the depth of P.N.A
The longitudinal shear resistance of the shear connections, Rq, was calculated first using
the compressive resistance of the concrete slabs, Rc, and degree of shear connection, η,
as η = Rq/Rc.
Rc=969kN,
η = 0.5,
Hence Rq = 485kN.
The depth of P.N.A, D, was determined using the equilibrium of tension and
compression, expressed in Eqn. G.5.
Rt/f + Rt/w + Rq + K = Rb/w – K + Rb/f (G.5)
Where: Rt/f is the resistance of the top flange (At/fPy);
Rt/w is the resistance of the web post of the top tee (At/wPy);
Rq is the longitudinal shear resistance of shear
connections;
Rb/w is the resistance of the web post of the bottom tee
(Ab/wPy)
Rb/f is the resistance of the bottom flange (Ab/fPy)
K is the bottom web in compression.
By substituting the Rq and the cross sectional areas of the steel elements into Eqn.
G.5, hence D = 207.6mm.
The depth of concrete in compression, d, was determined using the Rq of 485kN,
as the longitudinal shear resistance of the shear connections, Rq, was equal to the
compressive resistance of the concrete slabs in partial shear connection. The d of
24.1mm was obtained.

Appendix G Calculated moment resistance in four-point bending test
284
Step 2 Determine the plastic moment capacity
Taking moments about P.N.A
M = Rt/fDt/f + Rt/wDt/f + RqDq + KDk + (Rb/w-k)(215-D) + Rb/fDb/f
(G.6)
Where: M is the moment resistance of the composite section
Dt/f is the distance between the Rt/f and P.N.A,
Dt/w is the distance between the Rt/w and P.N.A,
Dq is the distance between the Rq and P.N.A,
Dk is the distance between the K and P.N.A,
Db/w is the distance between the Rb/w and P.N.A,
Db/f is the distance between the Rb/f and P.N.A.
By substituting the resistance of the steel elements, their distance to P.N.A and the
Rq into Eqn. G.6, hence, M = 290.7kNm.
G.4 Moment resistance of the cross section in degree of shear connection, 0.7
The stress block diagram of the cross section in degree of shear connection of 0.7 is
illustrated below.
Figure G-4 Stress block diagram of the cross section in degree of shear connection of
0.7
Step 1 Determine the depth of P.N.A
The longitudinal shear resistance of the shear connections, Rq, was calculated first using
the compressive resistance of the concrete slabs, Rc, and the degree of shear connection,
η, as η = Rq/Rc.
Rc=969kN,
η = 0.7,
Hence Rq = 679kN.
The depth of P.N.A, D, was determined using the equilibrium of tension and
compression, expressed in Eqn. G.7.
Rt/f + Rt/w + Rq + K = Rb/w – K + Rb/f (G.7)

Appendix G Calculated moment resistance in four-point bending test
285
Where: Rt/f is the resistance of the top flange (At/fPy);
Rt/w is the resistance of the web post of the top tee (At/wPy);
Rq is the longitudinal shear resistance of shear
connections;
Rb/w is the resistance of the web post of the bottom tee
(Ab/wPy)
Rb/f is the resistance of the bottom flange (Ab/fPy)
K is the bottom web in compression.
By substituting the Rq and the cross sectional areas of the steel elements into Eqn.
G.7, hence D = 179.6mm.
The depth of concrete in compression, d, was determined using Rq of 679kN, as
the longitudinal shear resistance of the shear connections, Rq, was equal to the
compressive resistance of the concrete slabs in partial shear connection. The d of
33.8mm was obtained.
Step 2 Determine the plastic moment capacity
Taking moments about P.N.A
M = Rt/fDt/f + Rt/wDt/f + RqDq + KDk + (Rb/w-k)(215-D) + Rb/fDb/f
(G.8)
Where: M is the moment resistance of the composite section
Dt/f is the distance between the Rt/f and P.N.A,
Dt/w is the distance between the Rt/w and P.N.A,
Dq is the distance between the Rq and P.N.A,
Dk is the distance between the K and P.N.A,
Db/w is the distance between the Rb/w and P.N.A,
Db/f is the distance between the Rb/f and P.N.A.
By substituting the resistance of the steel elements, their distance to P.N.A and the
Rq into Eqn. G.8, hence, M = 321.2kNm.

Appendix H Moment resistance of the different cross sections
286
Appendix H
Moment resistance of the different cross sections
Degree of Shear
Connection, η
Shear Resistance of
the Shear
Connectors, Rq (kN)
Depth of Concrete
in Compression, d
(mm)
Depth of
P.N.A
(mm)
Moment
Resistance, (kNm)
0 -- -- 218.2 178.6
0.4 319 15.9 216.6 245.4
0.5 399 19.8 216.2 261.2
0.6 478 23.8 215.8 276.7
0.65 518 25.8 215.6 284.3
0.7 558 27.8 215.4 291.8
0.75 598 29.7 215.2 299.2
0.8 638 31.7 214.6 306.6
0.85 678 33.7 208.4 313.7
0.9 717 35.7 202.2 320.5
0.95 757 37.7 195.9 327.0
0.96 765 38.1 194.7 328.2
0.97 773 38.5 193.5 329.5
Table H-1 Results of the cross section with full web opening

Appendix H Moment resistance of the different cross sections
287
Degree of Shear
Connection, η
Shear Resistance of
the Shear
Connectors, Rq (kN)
Depth of Concrete
in Compression, d
(mm)
Depth of
P.N.A
(mm)
Moment
Resistance, (kNm)
0 -- -- 217.7 185.1
0.4 353 17.6 215.9 257.2
0.45 397 19.8 215.7 265.7
0.5 442 22.0 215.4 274.1
0.55 486 24.2 215.2 282.4
0.56 495 24.6 215.1 284.1
0.58 512 25.5 215.0 287.4
0.6 530 26.4 213.9 290.6
0.61 539 26.8 212.3 292.3
0.62 548 27.3 211.5 293.9
0.63 556 27.7 210.1 295.5
0.64 565 28.1 209.2 297.0
0.65 574 28.6 207.9 298.6
0.7 618 30.8 202.1 306.1
0.75 662 33.0 195.2 313.3
0.8 707 35.2 187.0 320.1
0.82 724 36.0 184.9 322.7
0.84 742 36.9 181.5 325.2
0.86 760 37.8 178.7 327.7
0.88 777 38.7 174.7 330.1
0.9 795 39.6 172.2 332.4
0.91 804 40.0 169.6 333.6
0.93 821 40.9 159.6 334.9
0.95 839 41.8 145.0 337.6
Table H-2 Results of the cross section with 3/4 depth of the web opening

Appendix H Moment resistance of the different cross sections
288
Degree of Shear
Connection, η
Shear Resistance of
the Shear
Connectors, Rq (kN)
Depth of Concrete
in Compression, d
(mm)
Depth of
P.N.A
(mm)
Moment
Resistance, (kNm)
0 -- -- 217.1 196.3
0.4 388 19.3 215.2 272.8
0.45 436 21.7 212.5 282.0
0.5 485 24.1 207.6 290.7
0.55 533 26.5 200.8 299.1
0.56 543 27.0 199.8 300.7
0.57 553 27.5 198.6 302.2
0.58 562 28.0 197.0 303.8
0.59 572 28.5 195.6 305.4
0.6 582 28.9 194.8 306.9
0.65 630 31.4 187.5 314.3
0.7 679 33.8 179.6 321.2
0.75 727 36.2 171.8 327.6
0.8 776 38.6 163.3 333.5
0.81 785 39.1 161.8 334.7
0.82 795 39.6 158.7 335.8
0.83 805 40.0 156.8 336.9
0.84 814 40.5 154.6 337.9
0.86 834 41.5 149.3 339.0
0.88 853 42.5 140.5 341.6
0.9 873 43.4 130.8 344.1
0.91 882 43.9 123.6 345.2
0.93 902 44.9 112.8 345.5
0.95 921 45.8 100.3 345.8
Table H-3 Results of the cross section with 1/2 depth of the web opening

Appendix H Moment resistance of the different cross sections
289
Degree of Shear
Connection, η
Shear Resistance of
the Shear
Connectors, Rq (kN)
Depth of Concrete
in Compression, d
(mm)
Depth of
P.N.A
(mm)
Moment
Resistance, (kNm)
0 -- -- 216.6 205.9
0.4 422 21.0 197.6 289.8
0.42 443 22.1 194.6 293.4
0.44 464 23.1 192.2 296.9
0.45 475 23.6 191.2 298.7
0.46 486 24.2 188.3 300.4
0.48 507 25.2 185.6 303.7
0.5 528 26.3 182.6 306.9
0.56 591 29.4 172.6 316.2
0.58 612 30.5 169.3 319.0
0.6 633 31.5 166.9 321.8
0.65 686 34.1 158.1 328.5
0.7 739 36.8 148.5 334.5
0.76 802 39.9 138.5 341.0
0.78 823 41.0 135.8 343.0
0.8 845 42.0 130.8 344.4
0.82 866 43.1 127.5 345.5
0.84 887 44.1 123.3 348.5
0.86 908 45.2 117.7 349.3
0.88 929 46.2 111.7 350.0
0.9 950 47.3 105.2 352.0
0.91 961 47.8 101.4 352.3
0.93 982 48.8 94.6 352.7
0.95 1003 49.9 86.7 353.0
Table H-4 Results of the cross section with 1/4 depth of the web opening

Appendix H Moment resistance of the different cross sections
290
Degree of Shear
Connection, η
Shear Resistance of
the Shear
Connectors, Rq (kN)
Depth of Concrete
in Compression, d
(mm)
Depth of
P.N.A
(mm)
Moment
Resistance, (kNm)
0 -- -- 216.0 216.5
0.4 457 22.7 175.4 302.8
0.42 480 23.9 171.8 306.2
0.44 502 25.0 168.2 309.4
0.45 514 25.6 166.5 311.0
0.5 571 28.4 157.6 318.6
0.55 628 31.2 148.7 325.5
0.56 639 31.8 146.9 326.8
0.58 662 33.0 143.3 329.3
0.6 685 34.1 139.8 331.7
0.65 742 36.9 130.9 337.3
0.7 799 39.8 122.0 344.0
0.72 822 40.9 118.4 345.8
0.73 834 41.5 116.6 346.6
0.74 845 42.0 114.8 347.5
0.75 856 42.6 112.6 348.3
0.76 868 43.2 110.3 349.0
0.78 891 44.3 105.9 350.5
0.8 913 45.5 101.4 351.8
0.82 936 46.6 97.0 353.0
0.84 959 47.7 92.5 354.1
0.85 971 48.3 90.3 354.6
0.9 1028 51.1 79.1 358.3
0.95 1085 54.0 68.0 359.5
Table H-5 Results of the cross section without web opening

Appendix J Calculated moment resistance in three-point bending test
291
Appendix J
Calculated moment resistance of the beam specimen in three-point asymmetric
bending test
The moment resistance of the beam specimen was determined using the cross section
with 1/2 depth of the actual web opening in the degrees of shear connection, 0, 0.5, 0.7
and 1.0. The measured material properties, i.e. steel stress of 414N/mm2 and concrete
strength of 31N/mm2 were used in the calculation. The moment resistance in zero
degree of shear connection was the moment resistance of the steel section alone. The
calculation details are shown in the following sections.
J1 Moment resistance of the steel section (Ms)
The stress block method was used to determine the moment capacity of the steel
section. The stress block diagram is illustrated in Figure J-1. The measured tensile stress
of 414N/mm2 was used as both tension and compression.
Figure J-1 Stress block diagram of the steel section
Step 1 Determine the depth of plastic neutral axis (P.N.A)
The equilibrium of tension and compression, expressed in Eqn. J.1, was used to
determine the depth of the P.N.A, D.
Rt/f + Rt/w + Rb/w + K = Rb/f – K (J.1)
Where: Rt/f is the resistance of the top flange (At/fPy);
Rt/w is the resistance of the web post of the top tee (At/wPy);
Rb/w is the resistance of the web post of the bottom tee
(Ab/wPy)
Rb/f is the resistance of the bottom flange (Ab/fPy)
K is the bottom flange in compression [305Py (D-215)].

Appendix J Calculated moment resistance in three-point bending test
292
By substituting the cross sectional areas of the steel elements and steel yield
strength of 414N/mm2 into Eqn. J.1, hence D = 217.1mm, which was within the bottom
flange.
Step 2 Determine the plastic moment capacity
Taking moments about the P.N.A,
Ms = Rt/fDt/f + Rt/wDt/w + Rb/wDb/w + K (D-215)/2 + (Rb/f – K) (230-D)/2
(J.2)
Where: Ms is the plastic moment of the steel section
Dt/f is the distance between the Rt/f and the P.N.A,
Dt/w is the distance between the Rt/w and the P.N.A,
Db/w is the distance between the Rb/w and the P.N.A,
Db/f is the distance between the Rb/f and the P.N.A.
By substituting the resistance of the steel elements and their distances to the
P.N.A into Eqn. J.2, hence, Ms = 254.8kNm.
J2 Moment resistance of the cross section in full shear connection (Mpc)
The stress block diagram of the cross section is illustrated in Figure J-2. The moment
resistance of the cross section was determined using the measured material properties,
i.e. steel stress of 324N/mm2 and concrete strength of 31N/mm
2. The shear resistance
strength of the shear connectors was assumed unaffected by the depth of the P.N.A. The
results of the push-out tests were used in the calculation.
Figure J-2 Stress block diagram of the cross section in full shear connection
Step 1 Determine the depth of P.N.A
The equilibrium of tension and compression, expressed in Eqn. J.3, was used to
determine the depth of the P.N.A, D.
Rt/f + (Rt/w – K) + Rc = K + Rb/w + Rb/f (J.3)
Where: Rt/f is the resistance of the top flange (At/fPy);
Rt/w is the resistance of the web post of the top tee (At/wPy);

Appendix J Calculated moment resistance in three-point bending test
293
Rc is the compressive resistance of the concrete slab in full
shear connection (1000*0.67fcuD)
Rb/w is the resistance of the web post of the bottom tee
(Ab/wPy);
Rb/f is the resistance of the bottom flange (Ab/fPy);
K is the web post of the top tee in tension [7.9(77.5-D)Py]
By substituting the cross sectional areas of the steel elements, Py = 414N/mm2 and
fcu = 31N/mm2 the Eqn. J.3, hence, D = 56.9mm
Also, the compressive resistance of the concrete slab in full shear connection, Rc,
of 1182kN was obtained.
Step 2 Determine the plastic moment capacity
Taking moments about the P.N.A,
Mpc=Rt/fDt/f+(Rt/w–K)(D-Dt/f)/2 + RcDc + K(77.5-D)/2 + Rb/wDb/w + Rb/fDb/f
(J.4)
Where: Mpc is the full plastic moment of the composite section
Dt/f is the distance between the Rt/f and the P.N.A,
Dt/w is the distance between the Rt/w and the P.N.A,
Dc is the distance between the Rc and the P.N.A,
Db/w is the distance between the Rb/w and the P.N.A,
Db/f is the distance between the Rb/f and the P.N.A.
By substituting the Rc, the resistance of the steel elements and their distance to the
P.N.A into Eqn. J.4, hence, Mpc = 440kNm
J.3 Moment resistance of the cross section in the degree of shear connection of 0.5
The stress block diagram of the cross section in the degree of shear connection of 0.5 is
illustrated below.
Figure J-3 Stress block diagram of the cross section in degree of shear connection of 0.5

Appendix J Calculated moment resistance in three-point bending test
294
Step 1 Determine the depth of P.N.A
The longitudinal shear resistance of the shear connectors, Rq, was calculated first using
the compressive resistance of the concrete slabs, Rc, and the degree of shear connection,
η, as η = Rq/Rc.
Rc=1182kN,
η = 0.5,
Hence Rq = 591kN.
The depth of the P.N.A, D, was determined using the equilibrium of the tension
and compression, as expressed in Eqn. J.5.
Rt/f + Rt/w + Rq + K = Rb/w – K + Rb/f (J.5)
Where: Rt/f is the resistance of the top flange (At/fPy);
Rt/w is the resistance of the web post of the top tee (At/wPy);
Rq is the longitudinal shear resistance of shear connectors;
Rb/w is the resistance of the web post of the bottom tee
(Ab/wPy)
Rb/f is the resistance of the bottom flange (Ab/fPy)
K is the bottom web in compression.
By substituting the Rq and the cross sectional areas of the steel elements into Eqn.
J.5, hence D = 211.3mm.
The depth of concrete in compression, d, was determined using the Rq of 591kN,
as the longitudinal shear resistance of the shear connectors, Rq, was equal to the
compressive resistance of the concrete slabs in partial shear connection. The d of
28.5mm was obtained.
Step 2 Determine the plastic moment capacity
Taking moments about the P.N.A
M = Rt/fDt/f + Rt/wDt/f + RqDq + KDk + (Rb/w-k)(215-D) + Rb/fDb/f
(J.6)
Where: M is the moment resistance of the composite section
Dt/f is the distance between the Rt/f and the P.N.A,
Dt/w is the distance between the Rt/w and the P.N.A,
Dq is the distance between the Rq and the P.N.A,
Dk is the distance between the K and the P.N.A,

Appendix J Calculated moment resistance in three-point bending test
295
Db/w is the distance between the Rb/w and the P.N.A,
Db/f is the distance between the Rb/f and the P.N.A.
By substituting the Rq, the resistance of the steel elements and their distance to the
P.N.A into Eqn. J.6, hence, M = 373.8kNm.
J.4 Moment resistance of the cross section in the degree of shear connection of 0.7
The stress block diagram of the cross section in the degree of shear connection of 0.7 is
illustrated below.
Figure J-4 Stress block diagram of the cross section in degree of shear connection of 0.7
Step 1 Determine the depth of P.N.A
The longitudinal shear resistance of the shear connectors, Rq, was calculated first using
the compressive resistance of the concrete slabs, Rc, and the degree of shear connection,
η, as η = Rq/Rc.
Rc=1182kN,
η = 0.7,
Hence Rq = 827kN.
The depth of the P.N.A, D, was determined using the equilibrium of the tension
and compression, as expressed in Eqn. J.7.
Rt/f + Rt/w + Rq + K = Rb/w – K + Rb/f (J.7)
Where: Rt/f is the resistance of the top flange (At/fPy);
Rt/w is the resistance of the web post of the top tee (At/wPy);
Rq is the longitudinal shear resistance of shear connectors;
Rb/w is the resistance of the web post of the bottom tee
(Ab/wPy)
Rb/f is the resistance of the bottom flange (Ab/fPy)
K is the bottom web in compression.
By substituting the Rq and the cross sectional areas of the steel elements into Eqn.
J.7, hence D = 182.0mm.

Appendix J Calculated moment resistance in three-point bending test
296
The depth of concrete in compression, d, was determined using the Rq of 827kN,
as the longitudinal shear resistance of the shear connectors, Rq, was equal to the
compressive resistance of the concrete slabs in partial shear connection. The d of
39.8mm was obtained.
Step 2 Determine the plastic moment capacity
Taking moments about the P.N.A
M = Rt/fDt/f + Rt/wDt/f + RqDq + KDk + (Rb/w-k)(215-D) + Rb/fDb/f
(J.8)
Where: M is the moment resistance of the composite section
Dt/f is the distance between the Rt/f and the P.N.A,
Dt/w is the distance between the Rt/w and the P.N.A,
Dq is the distance between the Rq and the P.N.A,
Dk is the distance between the K and the P.N.A,
Db/w is the distance between the Rb/w and the P.N.A,
Db/f is the distance between the Rb/f and the P.N.A.
By substituting the Rq, the resistance of the steel elements and their distance to the
P.N.A into Eqn. J.8, hence, M = 411.6kNm.

Appendix J Calculated moment resistance in three-point bending test
297
Degree of Shear
Connection, η
Shear Resistance of
the Shear
Connectors, Rq (kN)
Depth of Concrete
in Compression, d
(mm)
Depth of
P.N.A
(mm)
Moment
Resistance, (kNm)
0 -- -- 217.1 254.8
0.4 473 22.8 215.2 351.6
0.42 496 23.9 215.2 356.2
0.44 520 25.0 215.1 360.7
0.45 532 25.6 215.0 362.9
0.5 591 28.5 211.3 373.8
0.55 650 31.3 204.0 384.2
0.57 674 32.4 201.0 388.1
0.58 686 33.0 199.6 390.1
0.59 697 33.6 198.1 392.0
0.6 709 34.2 196.7 393.9
0.65 768 37.0 189.3 403.0
0.7 827 39.8 182.0 411.6
0.75 887 42.7 174.7 419.5
0.8 946 45.5 165.9 426.9
0.82 969 46.7 163.0 429.7
0.84 993 47.8 159.1 432.3
0.88 1040 50.1 150.0 437.4
0.9 1064 51.2 143.5 438.6
0.91 1076 51.8 139.8 438.8
0.93 1099 52.9 129.3 439.3
0.95 1123 54.1 114.8 439.6
Table J-1 Results of the partial shear connection in three-point bending test

Appendix K Design moment capacity using BS5950 and EC4
298
Appendix K
Design moment capacity of the flexural test beam specimen using BS5950 and EC4
British Standard (BS5950-3.1:1990) and Eurocode 4 (EN1994-1-1:2004) determine the
design moment capacity of a composite section by using both stress block and linear
interaction methods. These two methods are based on plastic theory, which assumes the
stresses within the cross section reach a constant value in both tension and compression.
The methodologies of the two methods are summarised in the following sections.
K.1 Stress block method
The assumptions specified by the BS5950 and EC4 in applying the stress block methods
are:
The structural steel is stressed to a uniform yield stress in both tension and
compression;
The concrete tensile strength is neglected;
In full shear connection, the concrete is stressed to a uniform compression
over the depth above the plastic neutral axis (P.N.A);
In partial shear connection, the concrete is stressed to a uniform
compression up to the depth that concrete can develop the compressive
resistance equals to the longitudinal shear resistance of the shear
connectors.
The BS5950 specifies that the yield stress of 355N/mm2 should be used as the
steel stress of both tension and compression. The different formulas of the concrete
compressive stress, σc,Rd, are specified in the BS5950 and EC4, as shown in Table K-1.
BS5950 σc,Rd=0.45fcu fcu is the concrete characteristic cube
strength (N/mm2)
EC4 σc,Rd=0.85fcd fcd is the concrete design compressive
cylinder strength (N/mm2)
Table K-1 Concrete compressive stress, σc,Rd, specified by BS5950 and EC4
The stress block diagrams of a typical downstand composite beam are shown in
Figure K-1. The forces within the cross sections are in equilibrium state. The moment
capacity of the cross sections is calculated by taking moments about the plastic neutral

Appendix K Design moment capacity using BS5950 and EC4
299
axis (P.N.A). The stress block diagrams of the flexural test beam specimen are shown in
Figure K-2. The optimum cross section with 1/2 depth of the actual web opening is used
to determine the design moment resistance of the flexural test beam specimen.
Figure K-1 Stress block diagrams of downstand composite beam (EN1994-1-1:2004)
Figure K-2 Stress block diagram of the optimum cross sections of the flexural test beam
specimen in full shear connection
K.2 Linear interaction method
The linear interaction method, as expressed in Eqn. K-1, is a simplified relationship of
the moment resistance and the degree of shear connection. The comparison between the
linear interaction and stress block methods is illustrated in Figure K-3. It is shown that
the linear interactive method yields conservative results.
MRd = Mpl,a,Rd + η(Mpl,Rd – Mpl,a,Rd) (K-1)
Where: MRd is the design moment resistance of the composite
section in partial shear connection;
Mpl,a,Rd is the plastic moment resistance of the steel section;
η is the degree of shear connection;

Appendix K Design moment capacity using BS5950 and EC4
300
Mpl,Rd is the design moment resistance of the composite
section in full shear connection.
Figure K-3 Comparisons between the stress block and linear interaction methods
(EN1994-1-1:2004)
K.3 Design moment capacity
The design moment capacity of the flexural test beam specimen in full and partial shear
connections is calculated, in accordance with the BS5950 and Eurocode 4. The stress
block method is used to calculate the design moment capacities of the both full and
partial shear connections. The linear interactive method is used to calculate the design
moment capacities of the partial shear connection. The concrete mean compressive cube
strength of 30N/mm2 is used to calculate the concrete compressive stress, σc,Rd. The
steel yield stress of 355N/mm2 is used as both tension and compression.
K.3.1 Full shear connection
The criterion of the full shear connection is that the longitudinal shear resistance of the
shear connectors, Rq, is greater than or equal to the full compressive resistance of the
concrete slabs due to the full composite action, Rc, as Rq≥Rc. The assumptions made in
applying the full shear connection for the design moment capacity calculation of the
flexural test beam specimen are:
Concrete tensile strength is neglected;
Local web post buckling of the steel section is prevented by the partially
concrete encasement;
The structural steel is stressed to a uniform yield stress in both tension and
compression;
1: Stress Block Method
2: Linear Interaction Method

Appendix K Design moment capacity using BS5950 and EC4
301
The concrete is stressed to a uniform compression over the depth above
the P.N.A;
The shear resisting capacities of the shear connectors are not affected by
the position of the P.N.A;
The steps in applying the stress block method for determining the design moment
capacities of the flexural test beam specimen in full shear connection are:
1. To calculate the compressive resistance of the concrete slabs in full
composite action, Rc, by using the equilibrium of the forces within the
cross section;
2. To determine the depth of the P.N.A;
3. To calculate the design moment capacity in full shear connection, Mpl,Rd,
by taking moments about the P.N.A.
There are two types of cross sections in the flexural test beam specimen: cross
sections with concrete-infill-only and tie-bar shear connectors, as shown in Figure K-2.
The full compressive resistance, Rc, between the both cross sections are the same,
because the steel section of the both cross sections are the same. This leads to the same
depths of the P.N.A for the both cross sections. Furthermore, the design moment
capacities in full shear connection, Mpl,Rd, between the both cross sections are the same,
as the moment capacities are calculated by taking moment about the P.N.A. The details
of the calculation are shown below.
Step 1, Full compressive resistance of the concrete slabs, Rc
The equilibrium of the forces within the cross section, expressed in Eqn. K-2, is used to
determine the full compressive resistance of the concrete slabs, Rc.
Rt/f + Rt/w + Rc =Rb/w + Rb/f (K-2)
Where: Rt/f is the resistance of the top flange (At/fPy);
Rt/w is the resistance of the web post of the top tee (At/wPy);
Rc is the full compressive resistance of the concrete slabs
due to full composite action;
Rb/w is the resistance of the web post of the bottom tee,
(Ab/wPy);
Rb/f is the resistance of the bottom flange (Ab/fPy)

Appendix K Design moment capacity using BS5950 and EC4
302
By substituting the cross sectional areas of the steel elements and steel stress, Py =
355N/mm2, into Eqn. K-2, Hence, Rc=898kN.
Step 2, Depth of the P.N.A, D
The depth of the P.N.A is calculated using the full compressive resistance of the
concrete slabs, Rc, and the concrete compressive stress, σc,Rd.
Rc= σc,Rd Be D (K-3)
Where: Rc is the full compressive resistance of the concrete slabs
due to full composite action;
σc,Rd is the concrete compressive stress;
Be is the effective width of the concrete slab;
D is the depth of the P.N.A.
The concrete compressive stress, σc,Rd, is converted using the mean compressive
cube strength of 30N/mm2, in accordance with the BS5950 and EC4. The same result of
the σc,Rd is obtained, as shown in Table K-2. This shows the consistency between the
BS5950 and EC4. The effective width of the flexural test beam specimen is 1m. The full
compressive resistance of the concrete slabs, Rc, is 898kN. The results of the depth of
the P.N.A are listed in Table K-2.
Mean Compressive
Cube Strength (N/mm2)
σc,Rd
(N/mm2)
Rc (kN) D (mm)
BS5950 (σc,Rd=0.45fcu) 30 9 898 99.8
EC4 (σc,Rd=0.85fcd) 30 9 898 99.8
Table K-2 Depths of the P.N.A of the flexural test beam specimen in full shear
connection
Step 3, Design moment capacities of full shear connection, Mpl,Rd
The design moment capacities of the flexural test beam specimen in full shear
connection, Mpl,Rd, are determined by taking moments about the P.N.A. The results are
shown in Table K-3. The design moment capacity, Mpl,Rd, obtained using the BS5950
and EC4 are the same.

Appendix K Design moment capacity using BS5950 and EC4
303
Concrete Cube
Strength (N/mm2)
Py
(N/mm2)
Rc
(kN)
Depth of
P.N.A (mm)
Mpl,Rd
(kNm)
BS5950 30 355 898 99.8 354
EC4 30 355 898 99.8 354
Table K-3 Design moment capacities of the beam specimen in full shear connection
K.3.2 Partial shear connection
The criterion of the partial shear connection is that the longitudinal shear resistance of
the shear connectors, Rq, is less than the compressive resistance of slabs due in full
composite action, Rc, as Rq<Rc. The ratio of the Rq to the Rc is defined as the degree of
shear connection, η (η=Rq/Rc). The limits of the degree of shear connection specified by
both BS5950 and EC4 are 0.4≤η ≤1.0.
The design moment capacity in partial shear connection is determined using both
stress block and linear interaction methods. The concrete compressive resistance
developed in partial shear connection equals to the longitudinal shear resistance of the
shear connector, Rq. The stress block diagrams of the flexural test beam cross sections in
partial shear connection are illustrated in Figure K-4. The optimum cross section with
1/2 depth of the web opening is used to determine the design moment capacities of the
flexural test beam specimen in partial shear connection. The steps in applying the stress
block method are:
1. To calculate the longitudinal shear resistance of the connectors, Rq, at a
degree of shear connection, η, as η= Rq/Rc, where Rc is the full
compressive resistance of the concrete slabs;
2. To calculate the depth of concrete in compression, d;
3. To calculate the depth of the P.N.A using the equilibrium of the forces
within the cross section;
4. To determine the design moment capacities in partial shear connection,
MRd, by taking moments about the P.N.A.

Appendix K Design moment capacity using BS5950 and EC4
304
Figure K-4 Stress block diagrams of the cross sections of the beam specimen in partial
shear connection
The previous section showed that the compressive resistance of the concrete slabs
in full shear connection, Rc, between the two cross sections (with or without tie-bar) is
the same. Hence, for a given degree of shear connection, the longitudinal shear
resistance of the shear connectors, Rq, between the both cross sections is the same, as
η=Rq/Rc. This leads to the same depths of the P.N.A. Furthermore, for a given degree of
shear connection, the design moment capacities in partial shear connection, MRd,
between the both cross sections are the same, as the moment capacities are determined
by taking moments about the P.N.A. The design moment capacities of the flexural test
beam specimen in various degrees of shear connection are shown in Figure K-5.
150
200
250
300
350
400
0 0.2 0.4 0.6 0.8 1
Degree of shear connection, η
Moment
resistance
(kNm)
Figure K-5 Design moment capacities of the beam specimen over various degrees of
shear connection

Appendix K Design moment capacity using BS5950 and EC4
305
K.3.2.1 Linear interaction method
The linear interaction method, as expressed in Eqn. K.1, is a simplified method to
determine the design moment capacity in partial shear connection. The optimum cross
section with 1/2 depth of the web opening and the measured material properties of the
flexural test beam specimen are used in the linear interaction method. The plastic
moment capacity of the steel section, Mpl,a,Rd, of 219kNm is calculated using the stress
block method, with the design yield stress of 355N/mm2 as both tension and
compression. The design moment capacity in full shear connection, Mpl,Rd, is 354kNm,
which is determined in Table K-3.
The results of the linear interaction method are compared with that of the stress
block and linear interaction is Figure K-6. The conservative design moment capacities
are obtained by using the linear interaction method; however, the maximum difference
at the region of 0.5-0.6 degrees of shear connection is quite small, 6%.
150
200
250
300
350
400
0 0.2 0.4 0.6 0.8 1
Degree of shear connection, η
Moment
resistance
(kNm)
Stress Block Method
Linear Interaction Method
Figure K-6 Comparison between the stress block method and linear interaction method

Appendix L Concrete stress-strain curves
306
Appendix L
Stress-strain curves of concrete material for FEA
Figure L1 Stress-strain curve for concrete compressive strength of 30N/mm
2
Figure L2 Stress-strain curve for concrete compressive strength of 32N/mm
2

Appendix L Concrete stress-strain curves
307
Figure L3 Stress-strain curve for concrete compressive strength of 35N/mm
2

Bibliography
308
Bibliography
American Institute of Steel Construction, AISC 1994, “Manual of Steel Construction-
Load and Resistance Factor Design”, Second Edition, 1994, Chicago.
American Institute of Steel Construction, ANSI/AISC 360-05, “Specification for
Structural Steel Buildings”, March 2005, Chicago.
ANSYS, “Release 11.0 Documentation for ANSYS”, ANSYS Inc., Pennsylvania.
Ahn, J.-H., Kim, S.-H. and Jeong, Y.-J., “Shear Behaviour of Perfobond Rib Shear
Connector under Static and Cyclic Loadings”, Magazine of Concrete Research, V60,
n5, 2008, pp. 347-357, ISSN: 0024-9831.
Bode, H., Dorka, U.E., Stengel, J., Sedlacek, G. and Feldmann, M., “Composite Action
in Slim Floor System”, Proceedings of Conference: Composite Construction in Steel
and Concrete III, ASCE, Germany, June 1996, pp. 472-485, ISBN: 9780784402566.
Bode, H., Stengel, J. and Zhou, D., “Composite Beam Test for a New High-rise
Building in Frankfurt”, Proceedings of Conference: Composite Construction in Steel
and Concrete III, ASCE, Germany, June 1996, pp. 448-461, ISBN: 9780784402566.
Bradford, M.A., Filonov, A., Hogan, T.J., Ranzi, G. and Uy, B., “Strength and Ductility
of Shear Connection in Composite T-Beams”, Proceedings of the 8th
International
Conference, Steel, Space and Composite Structures, Kuala Lumpur, 2006, pp. 15-26.
British Standard, BS5950-3.1: 1990, “Structural Use of Steel Work in Building, Part 3:
Design in Composite Construction, Section 3.1 Code of Practice for Design of Simple
and Continuous Composite Beams”.
Chen, Q., Shi, Y.J., Wang, Y.Q., Chen, H. and Zhang, Y., “Structural Analysis on Light
Steel Frame with Steel-Concrete Composite Slim Beam”, Journal of Building
Structures, V32, n2, 2002, pp. 17-20, ISSN: 10006869.

Bibliography
309
Chinn, J., “Push-out Tests on Lightweight Composite Slabs”, AISC Engineering
Journal, American Institute of Steel Construction (AISC), V2, n4, 1965, pp. 129-134,
ISSN: 0013-8029.
Clawson, W.C. and Darwin, D., “Tests on Composite Beams with Web Openings”,
Journal of the Structural Division, ASCE, V108, n1, 1982, pp. 145-162, ISSN: 0044-
8001.
Davies, C., “Small-Scale Push-out Tests on Welded Stud Shear Connectors”, Concrete,
Sep 1967, pp. 311-316.
Davies, C., “Steel-Concrete Composite Beams for Buildings”, George Godwin, 1975,
ISBN: 0711449066.
Dowling, P., Owens, G. and Burgan, B., “Developments in European Steel
Construction”, Journal of Steel Structures, V1, 2001, pp. 75-90, ISSN: 1598-2351.
Easterling, W.S., Gibbings, D.R. and Murray, T.M., “Strength of Shear Studs in Steel
Deck on Composite Beams and Joists”, AISC Engineering Journal, AISC, V30, n2,
1993, pp. 44-55, ISSN: 0013-8029.
Eurocode 4, EN1994-1-1: 2004, “Design of Composite Steel and Concrete Structures,
Part 1-1: General Rules and Rules for Buildings”, December 2004.
Eurocode 2, EN1992-1-1: 2004, “Design of Concrete Structures, Part 1-1: General
Rules and Rules for buildings”, December 2004.
Goble, G.G., “Shear Strength of Thin Flange composite Specimens”, AISC Engineering
Journal, AISC, V5, n2, 1968, pp. 62-65, ISSN: 0013-8029.
Grant, J.A., Fisher, J.W. and Slutter, R.G., “Composite Beams with Formed Steel
Deck”, AISC Engineering Journal, AISC, V14, n1, 1977, pp. 24-43, ISSN: 0013-8029.

Bibliography
310
Hawkins, N.M., “Strength of Stud Shear Connectors”, Institute of Engineering,
Australia, Civil Engineering Transactions, 1973, pp 46-52.
Hegger, J., Roggendorf, T. and Kerkeni, N., “Shear Capacity of Prestressed Hollow
Core Slabs in Slim Floor Constructions”, Journal of Engineering Structures, V31, n2,
Feb 2009, pp. 551-559, ISSN: 0141-0296.
Hicks, S., “Current Trend in Modern Floor Construction”, The Magazine of British
Constructional Steelwork Association (BCSA), Vol. 11, No.1, 2003, pp. 32-33.
Huo, B.Y., Tsavdaridis, K.D. and D’Mello, C., “Experimental and Analytical Study of
Push-out Shear Tests in Ultra Shallow Floor Beams”, Proceedings of the 34th
International Symposium on Bridge and Structural Engineering, IABSE, Venice, Italy,
2010, pp. 174 (abstract) full paper in CD, ISBN. 978385748122.
Johnson, R. P. and May, I. M., “Partial-Interaction Design of Composite Beams”
Structural Engineer, Vol. 53, No. 8, August 1975, PP. 305-311, ISSN: 00392553.
Johnson, R.P., “Composite Structures of Steel and Concrete, Volume 1: Beams, Slabs,
Columns, and Frames for Buildings”, Second Edition, Blackwell Scientific
Publications, 1994, ISBN: 0632025077.
Johnson, R.P., “Prediction of Shear Resistance of Headed Studs in Troughs of Profiled
Sheeting”, Proceedings of Conference: Composite Construction in Steel and Concrete
VI, ASCE, Colorado USA, 2008, ISBN: 9780784411421.
Johnson, R.P. and Oehlers, D.J., “Analysis and Design for Longitudinal Shear in
Composite T-Beams”, Proceedings of Institute of Civil Engineering, Part 2, V71, n4,
1981, pp. 989-1021, ISSN: 03078361.
Ju, Y.K., Chun, S.C., Kim, S.E., Kim, D.H., Kim, S.D. and Chung, K.R., “ Structural
Performance of I-TECH Composite Beam Steel with Web Openings”, Proceedings of
the CIB-CTBUH International Conference on Tall Buildings, Kuala Lumpur, 2003, pp.
411-418, ISBN: 9834128304.

Bibliography
311
Ju, Y.K., Lee, C.H., Chun, S.C. and Kim, S.D., “Structural Behaviour of Reinforced
Concrete Column to ITECH Composite Beam Joint”, Proceedings of the 13th
World
Conference on Earthquake Engineering, Vancouver, 2004.
Ju, Y.K., Kim, D.H. and Kim, S.D., “Experimental Assessment of the Shear Strength of
an Asymmetric Steel Composite Beam with Web Openings”, Canadian Journal of Civil
Engineering, V32, n2, 2005, pp. 314-328, ISSN: 1208-6029.
Ju, Y.K., Chun, S.C. and Kim, S.E., “Flexural Test of a Composite Beam using
Asymmetric Steel Section with Web Openings”, Journal of Structural Engineering,
ASCE, V135, n4, 2009, pp. 448-458, ISSN: 0733-9445.
Jurkiewiez, B. and Hottier, J.M., “Static Behaviour of a Steel–Concrete Composite
Beam with an Innovative Horizontal Connection”, Journal of Constructional Steel
Research, V61, n9, Sep 2005, pp. 1286-1300, ISSN: 0143974X.
Kuhlmann, U. and Breuninger, U., “Behaviour of Horizontally Lying Studs with
Longitudinal Shear Force”, Proceedings of Conference: Composite Construction in
Steel and Concrete IV, ASCE, Alberta, 2000, pp. 438-449, ISBN-13: 9780784406168.
Kuhlmann, U. and Kürschner, K., “Structural Behaviour of Horizontally Lying Shear
Studs”, Proceedings of Conference: Composite Construction in Steel and Concrete V,
ASCE, South Africa, 2004, pp. 534-543, ISBN-13: 9780784408261.
Lawson, R.M., Lim, J., Hicks, S.J. and Simms, W.I., “Design of Composite
Asymmetric Cellular Beams and Beams with Large Web Openings”, Journal of
Constructional Steel Research, V62, n6, June 2006, pp. 614-629, ISSN: 0143974X.
Lawson, R.M., Mullett, D.L. and Rackham, J.W., “Design of Asymmetric Slimflor
Beams Using Deep Composite Decking”, The Steel Construction Institute, SCI
Publication P175, 1997, ISBN: 1859420443.

Bibliography
312
Lawson, R.M., Bode, H., Brekelmans, J.W.P.M., Wright, P.J. and Mullett, D.L.,
“‘Slimflor’ and ‘Slimdek’ Construction: European Developments”, Journal of Structural
Engineer, V77, n8, 1999, pp. 22-30, ISSN: 00392553.
Leonhardt, E.F., Andra, W., Andra, H-P. and Harre, W., “New Improved Shear
Connector with High Fatigue Strength for Composite Structures (Neues, vorteilhaftes
Verbundmittel für Stahlverbund-Tragwerke mit hoher Dauerfestigkeit)”, Beton-Und
Stahlbetonbau, V12, 1987, pp.325-331, ISSN: 1437-1006.
Lu, X. and Makelainen, P., “Strength and Stiffness of Composite Slim Floor Beams”,
Proceedings of the 4th
Pacific Structural Steel Conference, Singapore, 1995, pp. 93-100,
ISBN-10: 0080422659.
Mangerig, I. and Zapfe, C., “Concrete Dowels in Composite Construction”, Proceedings
of the 5th
Japanese-German Joint Symposium on Steel and Composite Bridge, Osaka,
2003.
Mullett, D.L., “Slim Floor Design and Construction”, The Steel Construction Institute,
SCI Publication P110, 1992, ISBN: 9781870004695.
Mullett, D.L., “Composite Floor System”, Blackwell Science Ltd, 1998, ISBN:
0632041439.
Mullett, D.L. and Lawson, R.M., “Slim Floor Construction Using Deep Decking”, The
Steel Construction Institute, SCI Publication P127, 1993, ISBN: 9781870004893.
Narayanan, R., “Steel-Concrete Composite Structures: Stability and Strength”, Elsevier
Applied Science Publishers, 1988, ISBN: 1851661344.
Oehlers, D.J. and Bradford, M.A., “Composite Steel and Concrete Structural Members:
Fundamental Behaviour”, Pergamon Press, 1995, ISBN: 0080419194.

Bibliography
313
Oguejiofor, E.C. and Hosain, M.U., “Behaviour of Perfobond Rib Shear Connectors in
Composite Beams: Full Size Tests”, Canadian Journal of Civil Engineering, V19, n2,
1992, pp. 224-235, ISSN: 1208-6029.
Oguejiofor, E.C. and Hosain, M.U., “Perfobond Rib Shear Connectors for Composite
Beams”, Proceedings of Engineering Foundation Conference: Composite Construction
in Steel and Concrete II, ASCE, Potosi, 1992, pp. 883-898, ISBN-13: 9780872629806.
Oguejiofor, E.C. and Hosain, M.U., “A Parametric Study of Perfobond Rib Shear
Connectors”, Canadian Journal of Civil Engineering, V21, n4, 1994, pp. 614-625,
ISSN: 1208-6029.
Oguejiofor, E.C. and Hosain, M.U., “Numerical Analysis of Push-out Specimens with
Perfobond Rib Shear Connectors”, Computers and Structures, V62, n4, 1997, pp. 617-
624, ISSN: 0045-7949.
Ollgaard, J.G., Slutter, R.G. and Fisher, J.W., “Shear Strength of Stud Connectors in
Lightweight and Normal-Weight Concrete”, AISC Engineering Journal, AISC, V8, n2,
1971, pp. 55-64, ISSN: 0013-8029.
Peltonen, S. and Leskelä, M.V., “Connection Behaviour of a Concrete Dowel in a
Circular Web Hole of a Steel Beam”, Proceedings of Conference: Composite
Construction in Steel and Concrete V, ASCE, South Africa, 2004, pp. 544-552, ISBN-
13: 9780784408261.
Queiroz, G., Pimenta, R.J., Calixto, J.M. and Da Mata, L.A.C., “New Type of Slim
Floor”, Journal of Constructional Steel Research, V46, n1, April 1998, pp. 213-214,
ISSN: 0143974X.
Rackham, J.W., Hicks, S. and Newman, G.M., “Design of Asymmetric Slimflor Beams
with Precast Concrete Slabs”, The Steel Construction Institute, SCI Publication P342,
2006, ISBN: 9781859421680.

Bibliography
314
Redwood, R.G. and Wong, P.K., “Web Holes in Composite Beams with Steel Deck”,
Proceedings of Canadian Structural Engineering Conference, Canadian Steel
Construction Council, Montreal, 1982, ISBN-13: 9780888110503.
Slutter, R.G. and Driscoll, G.C., “Flexural Strength of Steel-Concrete Composite
Beams”, Journal of Structural Engineering, ASCE, V91, n2, 1965, pp. 71-99, ISSN:
0733-9445.
Tsavdaridis, K.D., D’Mello, C. and Huo B.Y., “Computational Study Modelling the
Experimental Work Conducted on the Shear Capacity of Perforated Concrete-Steel
Ultra Shallow Floor Beams (USFB)”, Proceedings of 16th Hellenic Concrete
Conference, Paphos, Cyprus, 2009, pp. 159 (abstract) full paper in CD.
Wang, Y., Yang, L., Shi, Y. and Zhang, R., “Loading Capacity of Composite Slim
Frame Beams”, Journal of Constructional Steel Research, V65, 2009, pp. 650-661,
ISSN: 0143974X.
Willam, K.J. and Warnke, E.D., “Constitutive Model for the Triaxial Behaviour of
Concrete”, Proceeding of International Association for Bridge and Structural
Engineering (IABSE), V19, ISMES, Bergamo, Italy, 1974, pp. 174.
Valente, I. and Cruz, P.J.S., “Experimental Analysis of Perfobond Shear Connection
between Steel and Lightweight Concrete”, Journal of Constructional Steel Research,
V60, 2004, pp. 465-479, ISSN: 0143974X.
Veldanda, M.R. and Hosain, M.U., “Behaviour of Perfobond Rib Shear Connectors in
Composite Beams: Push-out Tests”, Canadian Journal of Civil Engineering, V19, n1,
1992, pp. 1-10, ISSN: 1208-6029.
Veríssimo, G.S., Paes, J.L.R, Valente, I., Cruz, P.J.S. and Fakury, R.H., “Design and
Experimental Analysis of a New Shear Connector for Steel and Concrete Composite
Structures”, Proceedings of the 3rd
International Conference on Bridge Maintenance,
Safety and Management, IABMAS, Porto, July 2006.

Bibliography
315
Viest, I.M., “Investigation of Stud Shear Connectors for Composite Concrete and Steel
T-Beams”, Journal of the American Concrete Institute, V52, n8, April 1956, pp 875-
892.
Yang, L., Wang, Y.Q. and Shi, Y.J., “Loading Capacity of Simply Supported Steel-
concrete Composite Slim Beams”, Journal of Advanced Materials Research, V163-167,
Dec 2010, pp 2185-2193, ISSN: 1662-8985.