city resilience index shimla, india - shimlamc.org city resilience index shimla, india the...
TRANSCRIPT

City Resilience IndexShimla, India
The Rockefeller Foundation
April 2016
Site Investigations City Resilience Index | Shimla2
Acknowledgements
Arup extends our warmest gratitude to the Municipal Corporation of Shimla, particularly the Deputy Mayor Tikender Singh Panwar and Komal Kantariya for hosting and supporting the City Resilience Index pilot. In addition, we would like to thank Sunandan Tiwari, Bedoshruti Sadhukhan, Ramiz Khan and Abhinav Sharma from ICLEI South Asia for their invaluable contribution to the assessment.
Our particular thanks go to The Rockefeller Foundation for giving Arup International Development the opportunity to undertake this study.
Finally, our deep appreciation to the following Shimla-ites for their time and valuable input to this pioneering initiative.
Amit Thakur, HP State Police; Ashish Kohli, HP State Department of Education; Balbir Singh Jaswal, HP State Police; Baldev Bharti, MCS; Bhagat Ram Vyas, MCS; Bharti Kathalia, MCS; Devarsen Negi, HRTC; Dr. Anjali Chauhan, IGMC; Dr. H.R. Thakur, Shimla District Health Office; Dr. Sonam Negi, MCS; Dr. Vikrant Sood, Shimla District Health Office; H.K. Sharma, HPSEB; J.C. Sharma, HP State Fire Department; Mamta Goyal, MCS; Mohit Chawla, HP State Anti-corruption Bureau; Naresh Thakur, HIMUDA; Pradeep Chauhan, HP State Department of Economics and Statistics; Rajeev Sharma, MCS; Rajesh Kashyap, HP State Irrigation and Public Health Department; Rajinder Chauhan, HP State Department of Industries; Rajinder Kumar, HPSEB; Ramesh C Gangotra, District Controller for Food and Civil Supplies; Rati Ram, HP State Forest Department; Sanjeeva Pandey, HP State Forest Department; Sarabjeet Singh, Vyapar Mandal; Seema Thakur, HP State Department of Women and Children Welfare; Shriniwas Joshi, SAGES;Sudhir Gupta, MCS; Vinod Rana, HP State Department of Economics and Statistics

Site Investigations The Rockefeller Foundation | Arup 3
Contents
(Cover Photo)
The Ridge, Shimla India 2015
Introduction 5
Approach 7
Shimla resilience profile 13
Key lessons 23
Qualitative data 25

Site Investigations City Resilience Index | Shimla4
© Map Wagner
Shimla
Concepcion
New Orleans
Seattle
Detroit
Cali
Quito
Lima
Sao Paulo
Cape Town
Brazzaville
Rio de Janeiro
New York
Arusha
Pilot Cities
Research Cities
Dar es Salaam
Kampala
Dubai
Madrid Chengdu
Doha
Liverpool
Hong Kong
Ho Chi Minh City
Semerang
Melbourne
Buiding a Global Model
Researchers across the world, from cities of every type and scale, have contributed to the CRI’s underlying data, insights and thinking.

Site Investigations The Rockefeller Foundation | Arup 5
Internationally, cities are facing increasing risk as a result of rapid urbanisation, concentration of assets, and a range of natural and man-made pressures – including climate change, terrorism, and increasing vulnerability to natural hazards. Many of these pressures are complex, interrelated, and difficult to predict with any accuracy into the future; leading to a growing interest in the notion of resilience and the capacity of cities to survive and thrive no matter what shocks and stresses they face.
The City Resilience Index (CRI) is being developed by Arup with support from The Rockefeller Foundation in order to help city administrations, investors and other stakeholders to measure and understand the systems, processes and functions that shape their resilience profile. The CRI operationalises extensive research undertaken by Arup to establish an accessible, evidence-based definition of urban resilience; published in 2014 as the City Resilience Framework (CRF)1.
The CRI generates Qualitative and Quantitative Resilience Profiles based on assessments of 156 Scenarios and 156 Metrics, respectively. The detailed results are aggregated to summarise the cities performance across 58 Indicators within 12 Goals.
Piloting the CRI
From July - October 2015, the CRI was piloted in the cities of Hong Kong, China; Liverpool, England; Arusha, Tanzania; Concepción, Chile; and Shimla, India. The purpose of the Pilot program was to validate the content of the CRI (scenarios and metrics), to test the proposed assessment approach and to inform finalisation of the CRI Online Platform (beta-version). The Pilot program was designed around a set of research questions to test both the usability and effectiveness of the CRI.
Arup undertook up to three weeks of fieldwork in each city in partnership with city governments and a range of local organisations. The assessment approach in each city was customised to suit the local context, but based upon a standardised methodology which involved extensive multi-stakeholder engagement.
This report provides an overview of assessment findings from Shimla, where an assessment was carried out by Arup and Shimla Municipal Corporation (MCS) with support from ICLEI South Asia. The findings from this assessment provide valuable insight into city resilience challenges, strengths, and opportunities to inform future policy and planning in Shimla. The results also provide a baseline from which to understand the city’s resilience trajectory over time.
Introduction
(1) Arup (2014), City Resilience Framework.

Site Investigations City Resilience Index | Shimla6
The City Resilience Framework provides a holistic and evidence-based lens through which city resilience can be measured and understood. The 12 goals of the Index describe the fundamental attributes of a resilient city across four key dimensions.
A Resilient City is a city where there is or are…
Health & wellbeingLe
ader
ship
& strategy
Economy & so
ciety
Infrastructure & ecosystems
Integrated
economy
Empo
wered
security & ru
le of
law
Effe
ctiv
e le
ader
ship
& co
mm
unity
sup
port & com
munications
Effective safeguards to
of critical services
Diverse livelihoods
& fragility
Minimal human
development planning
Sustainable
stak
eh
olders
Compre
hens
ive
& m
anag
emen
t
Colle
ctiv
e id
entit
y R
eliable mobility
human health & life
Effective provision
& employment
Reduced exposure
vulnerability
Flexible
RedundantRobust
Resourceful
Reflective
Inclusive
Integrated
City Resilience Framework
1. Minimal human vulnerability
This relates to the extent to which everyone’s basic needs are met.
2 Diverse livelihoods and employment
This is facilitated by access to finance, ability to accrue savings, skills
training, business support, and social welfare.
3. Effective safeguards to human health and life
This relies on integrated health facilities and services, and responsive emergency service.
12. Integrated development planning
This is indicated by the presence of a vision, an integrated development strategy, and plans that are regularly reviewed and updated by crossdepartmental groups.
11 Empowered stakeholders
This is underpinned by education for all, and relies on access to up-to-date information and knowledge to enable people and organisations to take action.
10. Effective leadership and management
This is enabled by trusted individuals, multi-stakeholder consultation evidence-based decision-making and disaster risk reduction activities.
4. Collective identity and community
support
This is observed as active community engagement,
strong social networks and social integration.
5. Comprehensive security and rule of law
This includes law enforcement, fair justice, and prevention of crime and corruption.
6. Sustainable economy
This is observed in sound management of city finances, diverse revenue streams, and the ability to attract business investment, allocate capital, and build emergency funds.
9. Reliable mobility and communications
This is enabled by diverse and affordable multi-modal transport systems and information and communication technology (ICT) networks, and contingency planning.
8. Effective provision of critical services
This results from active management and maintenance of ecosystems, and from diversity of provision, redundant capacity, and adequate maintenance of essential utility services, combined with robust contingency planning.
7. Reduced exposure and fragility
This relies on a comprehensive understanding of the hazards and risks to which a city is exposed, the extent to which this understanding that informs the development of integrated strategies to physically protect the city combining sound environmental stewardship, robust design and maintenance of man-made infrastructure, and enforcement of appropriate building codes and regulations.

Site Investigations The Rockefeller Foundation | Arup 7
Qualitative 156 Scenarios
The Assessor assigns a score on a linear scale between 1 and 5, based upon consideration of a 'best case' and 'worst case' scenario relevant to a
particular area of city performance.
Quantitative 156 Metrics
The Assessor provides relevant city data in a specific unit as a proxy measure of reilience. A score from 1 to 5 is then automated, based on a
standardised performance scale.
What matters
City resilience outcomes are understood at Goal and Dimension level
What to observe
Performance is observed at Indicator level
How to measure
Prompt Questions provide a proxy measurement of city resilience
4 Dimensions
12 Goals
(3 per Dimension)
52 Indicators(3-5 per Goal)
156 Prompt Questions
(1-7 per Indicator, distributed within Questionnaires)
ApproachStructure of assessment
Visual outputs
Qualitative Profile
The qualitative profile is generated by city responses to qualitative questions that were scored based on guidance identifying worst and best case scenario.
Quantitative Profile
The quantitative profile is generated by the data supplied in response to our quantitative questions.
Qualities
The qualities profile represents a set of qualities that describes the behaviour or performance of the urban systems in relation to resilience. These qualities enable cities to withstand, respond and adapt more readily to shocks and stresses.
Completeness
The completeness diagram show the extent to which the city provided answers and data in order to generate the quantitative profile.
The City Resilience Index is composed of four complementary perspectives that enable cities to develop a deeper understanding of the systems, processes and functions that shape a city’s resilience profile. Armed with this knowledge, they will be able to understand their current performance and assess their future trajectories, identify appropriate action to strengthen resilience and monitor progress over time.

Site Investigations City Resilience Index | Shimla8
Pilot overview
Pilot duration
Fieldwork duration
City partner
Local partner
No. of Arup fieldwork staff
No. of ICLEI fieldwork staff
No. of government participants
No. of departments engaged in pilot
9 weeks
3 weeks
Municipal Corporation of Shimla (MCS)
ICLEI South Asia
2
4
55
35 (from city and state government, academia and NGOs)

Site Investigations The Rockefeller Foundation | Arup 9
The CRI pilot was launched in Shimla in September of 2015. The Municipal Corporation of Shimla demonstrated strong commitment to the pilot process. The Mayor provided a letter of written endorsement which improved access to stakeholders and data sources, and the Deputy Mayor acted as a champion or ‘lead’ for the pilot.
Arup’s time in Shimla was extended from two to three weeks, largely due to the time required for stakeholder engagement and a need to provide greater levels of support to help government assessors interpret and complete questionnaires in hard copy. ICLEI South Asia played an important role in identifying local stakeholders and data sources, coordinating meetings, collecting data and way finding.
Outcomes
The CRI pilot in Shimla achieved strong levels of engagement across all stakeholders, and was successful in developing a comprehensive, holistic resilience profile for the city.
Data collection gathered momentum once City Assessors were provided with support to understand different components of questions and advice regarding how answers might be calculated from multiple sources.
The pilot was successful in obtaining input from 35 departments in city and state government along with civil society and academic stakeholders. The range of this muli-stakeholder engagement was unprecedented in the city’s experience.
Challenges
In a few cases, identifying the appropriate government personnel with the right experience and technical expertise to obtain quantitative data.
Identifying data sources to complete the quantitative assessments – often data was from sourced from informal records or expert opinion.
Overcoming strong silos between different government departments to gather data and expert opinions.
Undertaking the assessment

Site Investigations City Resilience Index | Shimla10
Site Investigations The Rockefeller Foundation | Arup 11
In order to understand a greater variety of perspectives on resilience, a Workshop was held on 30 September. This was attended by 42 stakeholders from government, NGOs and development organisations. Through interactive discussions, participants collectively completed high level qualitative resilience assessments of the city. They were also provided with the opportunity to reflect on the Resilience Profile that was produced by the city Assessors.
Key themes which emerged during the workshop related to Livelihoods and employment and Integrated development planning. Similar to feedback provided by government assessors, these scores reflect local challenges in planning, zoning, and poor economic diversity.Discussion around these issues was valuable in unpacking complexities and resilience outcomes associated with this issue.
Other emerging themes included a need for proactive interdepartmental coordination within government, and improved provision of critical services.
In general, workshop participants endorsed the scores provided by government assessors and there was strong overall alignment between views on city resilience. Participants provided positive feedback in relation to the value of the assessment process. They suggested that the level of engagement and cooperation would not have been possible just ten years earlier, and that it demonstrates a ‘city in the making.’ Participants also suggested that reassessing over time will be useful to understand the impact of forthcoming urban development initiatives such as the Atal Mission for Rejuvenation and Urban Transformation (AMRUT).
Resilience Workshop

Site Investigations City Resilience Index | Shimla12

Site Investigations The Rockefeller Foundation | Arup 13
City Resilience IndexShimla Resilience Profile
Site Investigations City Resilience Index | Shimla14
(c) 2013 Google
Site Investigations The Rockefeller Foundation | Arup 15
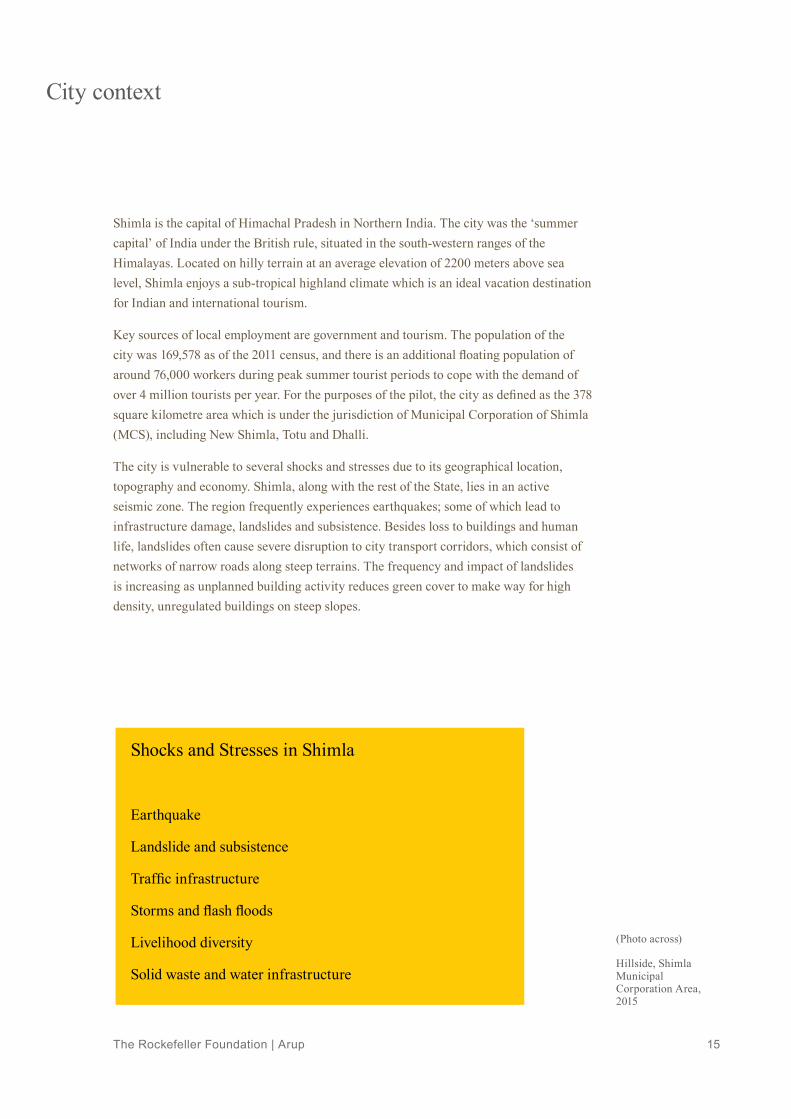
Shimla is the capital of Himachal Pradesh in Northern India. The city was the ‘summer capital’ of India under the British rule, situated in the south-western ranges of the Himalayas. Located on hilly terrain at an average elevation of 2200 meters above sea level, Shimla enjoys a sub-tropical highland climate which is an ideal vacation destination for Indian and international tourism.
Key sources of local employment are government and tourism. The population of the city was 169,578 as of the 2011 census, and there is an additional floating population of around 76,000 workers during peak summer tourist periods to cope with the demand of over 4 million tourists per year. For the purposes of the pilot, the city as defined as the 378 square kilometre area which is under the jurisdiction of Municipal Corporation of Shimla (MCS), including New Shimla, Totu and Dhalli.
The city is vulnerable to several shocks and stresses due to its geographical location, topography and economy. Shimla, along with the rest of the State, lies in an active seismic zone. The region frequently experiences earthquakes; some of which lead to infrastructure damage, landslides and subsistence. Besides loss to buildings and human life, landslides often cause severe disruption to city transport corridors, which consist of networks of narrow roads along steep terrains. The frequency and impact of landslides is increasing as unplanned building activity reduces green cover to make way for high density, unregulated buildings on steep slopes.
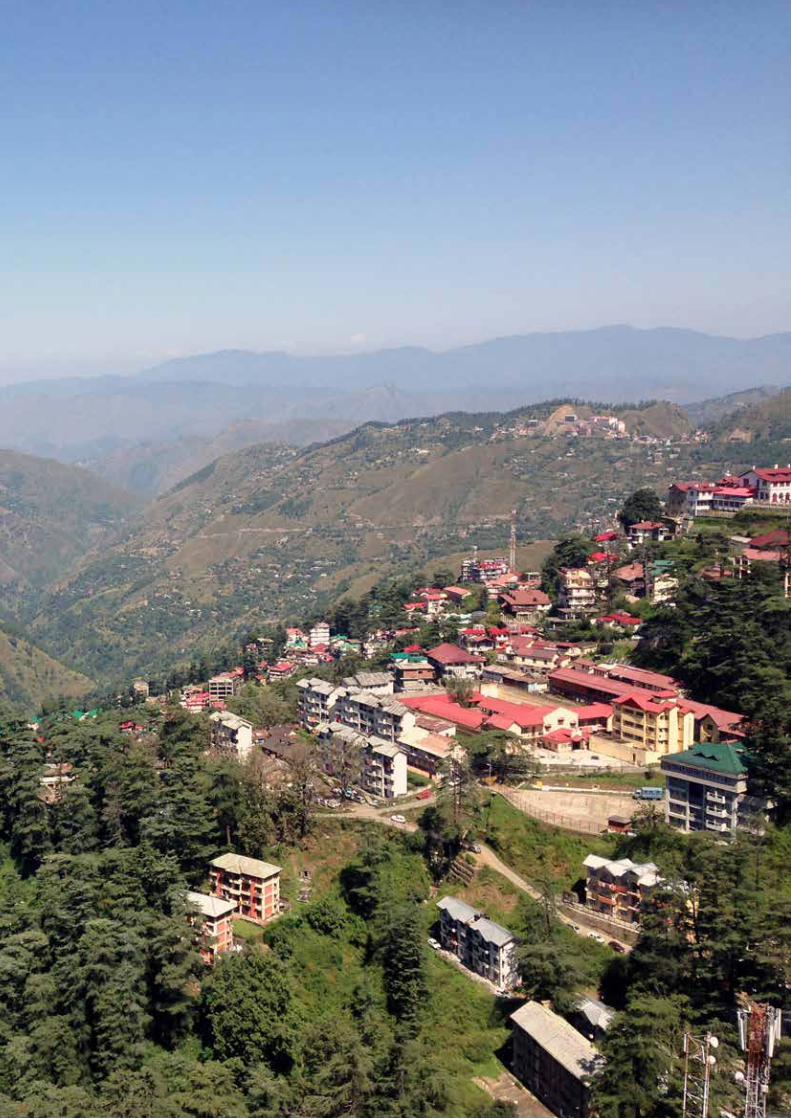
(Photo across)
Hillside, Shimla Municipal Corporation Area, 2015
Shocks and Stresses in Shimla
Earthquake
Landslide and subsistence
Traffic infrastructure
Storms and flash floods
Livelihood diversity
Solid waste and water infrastructure
City context

Site Investigations City Resilience Index | Shimla16
Integrated
economy
Empo
wered
security an
d rule
of la
w
Effe
ctiv
e le
ader
ship
& m
utua
l sup
port
& comm
unications
Effective safeguards to
of critical services
Diverse livelihood
& fragility
Minimal human
development planning
Sustainable
stak
eh
olders
Compre
hens
ive
& m
anag
emen
t
Colle
ctiv
e id
entit
y R
eliable mobility
human health & life
Effective provision
& employment
Reduced exposure
vulnerability
Health & wellbeing
Lead
ersh
ip & str
ategy
Economy & s
ocie
ty
Infrastructure & environment
ShimlaSubjective
Qualitative resilience profile
The Qualitative Resilience Profile provides a diagnostic summary of city perspectives on resilience.
Dimensions
Shimla’s profile demonstrates moderate outcomes across all Dimensions. In relation to Infrastructure & environment, participants emphasised that Shimla (alongside many other Indian cities) experiences a severe shortfall in infrastructure. Pilot Participants showed a keen interest in understanding how the CRI can help unlock issues in this area.
Goals and Indicators
The Qualitative profile for Shimla demonstrates good performance across Minimal human vulnerability, Safeguards to human health & life, Comprehensive security & rule of law, and
Empowered stakeholders. Assessor stakeholder feedback illustrates a city with a strong sense of community, social cohesion and wellbeing, security, and good access to basic services.
Weaker areas of performance include Sustainable economy and Integrated development planning. These scores reflect poor economic diversity and challenges in planning and zonation respectively. A combination of local governance structures and a lack of major recent shocks (e.g. physical, economic) may contribute to the city’s limited consideration of safeguards and risk reduction in planning and policy is limited.
At Indicator level, inconsistent results are observed within Effective leadership and management.Proactive multi-stakeholder collaboration is an area particularly highlighted for improvement.
Integrated
economy
Empo
wered
and rule
of la
w
Effe
ctiv
e le
ader
ship
& m
utua
l sup
port
& comm
unications
Safeguards to
critical services
Livelihoods
and fragility
Minimal human
development planning
Sustainable
stak
eh
olders
Comprehens
ive se
curit
y
& m
anag
emen
t
Colle
ctiv
e id
entit
y R
eliable mobility
human life & health
Effective provision of
& employment
Reduced exposure
vulnerability
Health & wellbeing
Lead
ersh
ip & str
ategy
Economy & s
ocie
ty
Infrastructure & environment
City AssessorGoal scoresThe coloured bar alongside each Goal illustrates the aggregate score, generatedbased upon subjective assessments completed by City Assessors.
Scores should be interpreted as follows:
Excellent
Good
Moderate
Poor
Very poor
CRI WorkshopGoal scoresThe solid circles indicateaggregate Goal scoresbased upon the high level assessments completed byCRI Workshop attendees. This allows users to compareand contrast differences andsimilarities in scoring profiles.

Site Investigations The Rockefeller Foundation | Arup 17
Minimum human vulnerability1.1 Safe and accessible housing1.2 Adequate affordable energy supply1.3 Inclusive access to safe drinking water1.4 Effective Sanitation1.5 Sufficient affordable food supply
Diverse livelihoods and employment2.1 Inclusive labour policies2.2 Relevant skills and training 2.3 Dynamic local business development and innovation2.4 Supportive financing mechanisms 2.5 Diverse protection of livelihoods following a shock
Effective safeguards to human health and life3.1 Robust public health systems3.2 Adequate access to quality healthcare3.3 Emergency medical care3.4 Effective emergency response services
Collective identity and mutual support4.1 Local Community Support4.2 Cohesive communities 4.3 Strong city-wide identity and culture4.4 Actively engaged citizens
Comprehensive security and rule of law5.1 Effective systems to deter crime5.2 Proactive corruption prevention 5.3 Competent policing5.4 Accessible criminal and civil justice
Sustainable economy6.1 Well-managed public finances 6.2 Comprehensive business continuity planning6.3 Diverse economic base6.4 Attractive business environment6.5 Strong integration with regional and global economies
Reduced exposure & fragility7.1 Comprehensive hazard and exposure mapping7.2 Appropriate codes, standards and enforcement7.3 Effectively managed protective ecosystems7.4 Robust protective infrastructure
Effective provision of critical services8.1 Effective stewardship of ecosystems8.2 Flexible infrastructure8.3 Retained spare capacity8.4 Diligent maintenance and continuity 8.5 Adequate continuity for critical assets and services
Reliable mobility & communications9.1 Diverse and affordable transport networks9.2 Effective transport operation & maintenance 9.3 Reliable communications technology9.4 Secure technology networks
Effective leadership & management10.1 Appropriate government decision-making 10.2 Effective co-ordination with other government bodies10.3 Proactive multi-stakeholder collaboration10.4 Comprehensive hazard monitoring and risk assessment10.5 Comprehensive government emergency management
Empowered stakeholders11.1 Adequate education for all11.2 Widespread community awareness and preparedness11.3 Effective mechanisms for communities to engagewith government
Integrated development planning12.1 Comprehensive city monitoring and data management12.2 Consultative planning process 12.3 Appropriate land use and zoning12.4 Robust planning approval process

Site Investigations City Resilience Index | Shimla18
Integrated
economy
Empo
wered
security an
d rule
of la
w
Effe
ctiv
e le
ader
ship
& m
utua
l sup
port
& comm
unications
Effective safeguards to
of critical services
Diverse livelihood
& fragility
Minimal human
development planning
Sustainable
stak
eh
olders
Compre
hens
ive
& m
anag
emen
t
Colle
ctiv
e id
entit
y R
eliable mobility
human health & life
Effective provision
& employment
Reduced exposure
vulnerability
Health & wellbeing
Lead
ersh
ip & str
ategy
Economy & s
ocie
ty
Infrastructure & environment
ShimlaObjective
Quantitative resilience profile
The Quantitative Resilience Profile provides a baseline from which to understand the city’s resilience trajectory over time.
Dimensions
The Quantitative Profile illustrates poor performance across the Health & wellbeing Dimension, and moderate or varied results across other dimensions.
Goals and Indicators
Results are varied across the 12 CRI goals. Effective safeguards to human health & life and sustainable economy are areas of poor performance. The latter resonates with stakeholder feedback, and reflects poor diversity of livelihoods in the city.
Whilst, the Quantitative Profile has similar overall trends to the Qualitative assessor and workshop profiles, there are some key areas of variance. E.g., Safeguards to human health and life. Possible reasons for this difference may include:
1. Shimla has not experienced a major recent shock. Positive qualitative scoring may reflect limited understanding as to the appropriateness of emergency healthcare safeguards (e.g.for increased casualties and damage to hospitals).
2. There is no public data available for private healthcare. If public and private data collection were to be coordinated, metric scores for questions such as ‘number of hospital beds’ might improve.
3. Whilst quantitative performance for the healthcare metrics might fare well against other cities in the region, they may not do as well against other cities globally.
Regardless, healthcare may be an area for investigation, as rapid urbanisation and climate change create increased hazard likelihood and unpredictability.
Reduced exposure and fragility actually scores better quantitatively. Whilst the city rates its performance in areas such as ecosystem management as adequate, the metric score suggests strong performance.
Integrated
economy
Empo
wered
and rule
of la
w
Effe
ctiv
e le
ader
ship
& m
utua
l sup
port
& comm
unications
Safeguards to
critical services
Livelihoods
and fragility
Minimal human
development planning
Sustainable
stak
eh
olders
Comprehens
ive se
curit
y
& m
anag
emen
t
Colle
ctiv
e id
entit
y R
eliable mobility
human life & health
Effective provision of
& employment
Reduced exposure
vulnerability
Health & wellbeing
Lead
ersh
ip & str
ategy
Economy & s
ocie
ty
Infrastructure & environment
City AssessorGoal scoresThe coloured bar alongside each Goal illustrates the aggregate score, generatedbased upon subjective assessments completed by City Assessors.
Scores should be interpreted as follows:
Excellent
Good
Moderate
Poor
Very poor
CRI WorkshopGoal scoresThe solid circles indicateaggregate Goal scoresbased upon the high level assessments completed byCRI Workshop attendees. This allows users to compareand contrast differences andsimilarities in scoring profiles.

Site Investigations The Rockefeller Foundation | Arup 19
Minimum human vulnerability1.1 Safe and accessible housing1.2 Adequate affordable energy supply1.3 Inclusive access to safe drinking water1.4 Effective Sanitation1.5 Sufficient affordable food supply
Diverse livelihoods and employment2.1 Inclusive labour policies2.2 Relevant skills and training 2.3 Dynamic local business development and innovation2.4 Supportive financing mechanisms 2.5 Diverse protection of livelihoods following a shock
Effective safeguards to human health and life3.1 Robust public health systems3.2 Adequate access to quality healthcare3.3 Emergency medical care3.4 Effective emergency response services
Collective identity and mutual support4.1 Local Community Support4.2 Cohesive communities 4.3 Strong city-wide identity and culture4.4 Actively engaged citizens
Comprehensive security and rule of law5.1 Effective systems to deter crime5.2 Proactive corruption prevention 5.3 Competent policing5.4 Accessible criminal and civil justice
Sustainable economy6.1 Well-managed public finances 6.2 Comprehensive business continuity planning6.3 Diverse economic base6.4 Attractive business environment6.5 Strong integration with regional and global economies
Reduced exposure & fragility7.1 Comprehensive hazard and exposure mapping7.2 Appropriate codes, standards and enforcement7.3 Effectively managed protective ecosystems7.4 Robust protective infrastructure
Effective provision of critical services8.1 Effective stewardship of ecosystems8.2 Flexible infrastructure8.3 Retained spare capacity8.4 Diligent maintenance and continuity 8.5 Adequate continuity for critical assets and services
Reliable mobility & communications9.1 Diverse and affordable transport networks9.2 Effective transport operation & maintenance 9.3 Reliable communications technology9.4 Secure technology networks
Effective leadership & management10.1 Appropriate government decision-making 10.2 Effective co-ordination with other government bodies10.3 Proactive multi-stakeholder collaboration10.4 Comprehensive hazard monitoring and risk assessment10.5 Comprehensive government emergency management
Empowered stakeholders11.1 Adequate education for all11.2 Widespread community awareness and preparedness11.3 Effective mechanisms for communities to engagewith government
Integrated development planning12.1 Comprehensive city monitoring and data management12.2 Consultative planning process 12.3 Appropriate land use and zoning12.4 Robust planning approval process
Data not availableKey

Site Investigations City Resilience Index | Shimla20
Qualities of urban systems
The Qualitative Resilience Profile provides a diagnostic summary of city perspectives on resilience.
The above profile represents a set of qualities that describes the behaviour or performance of the systems in Shimla in relation to resilience. These are the qualities our that our research suggets enable the city to withstand, respond and adapt more readily to shocks and stresses.
In the qualitative assessment completed by city assessors, no one quality particularly stands out and the city systems exhibit average performance across each of the 7 CRI qualities. However, Flexibility and Inclusivity are slightly more evident within Shimla than the other CRI qualities.
Inclusivity is also demonstrated within Shimla by the city’s ability to effectively deliver both energy and education to its citizens.
The flexibility of Shimla’s urban systems is demonstrated through a high level of performance across several indicators associated with this quality. This includes the city’s ability to proviide water and energy from various supply sources, along with its production of city food supply from a combination of local and national supply chains.
Flexibility implies that systems can change, evolve and adapt in response to changing circumstances. This may favour decentralised and modular approaches to infrastructure or ecosystem management. Flexibility can be achieved through the introduction of new knowledge and technologies, as needed. It also means considering and incorporating indigenous or traditional knowledge and practices in new ways.
Inclusion emphasises the need for broad consultation and engagement of communities, including the most vulnerable groups. Addressing the shocks or stresses faced by one sector, location, or community in isolation of others is an anathema to the notion of resilience. An inclusive approach contributes to a sense of shared ownership or a joint vision to build city resilience.
Integrated
economy
Empo
wered
and rule
of la
w
Effe
ctiv
e le
ader
ship
& m
utua
l sup
port
& comm
unications
Safeguards to
critical services
Livelihoods
and fragility
Minimal human
development planning
Sustainable
stak
eh
olders
Comprehens
ive se
curit
y
& m
anag
emen
t
Colle
ctiv
e id
entit
y R
eliable mobility
human life & health
Effective provision of
& employment
Reduced exposure
vulnerability
Health & wellbeing
Lead
ersh
ip & str
ategy
Economy & s
ocie
ty
Infrastructure & environment
City AssessorGoal scoresThe coloured bar alongside each Goal illustrates the aggregate score, generatedbased upon subjective assessments completed by City Assessors.
Scores should be interpreted as follows:
Excellent
Good
Moderate
Poor
Very poor
CRI WorkshopGoal scoresThe solid circles indicateaggregate Goal scoresbased upon the high level assessments completed byCRI Workshop attendees. This allows users to compareand contrast differences andsimilarities in scoring profiles.
Inte
grat
edIn
clus
ive
Refle
ctiv
eRe
sour
cefu
lRo
bust
Redu
ndan
tFl
exib
le
5
4
3
2
1

Site Investigations The Rockefeller Foundation | Arup 21
Integrated
contingency funds
Empo
wered
& se
curity
Effe
ctiv
e le
ader
ship
& m
utua
l sup
port
& comm
unications
Safeguards to
critical services
Livelihoods
exposure
Minimal human
development planning
Finance including
stak
eh
olders
Social s
tabilit
y
& m
anag
emen
t
Colle
ctiv
e id
entit
y R
eliable mobility
human life & health
Continuity of
& employment
Reduced physical
vulnerability
Health & wellbeing
Lead
ersh
ip & str
ategy
Economy & s
ocie
ty
Infrastructure & environment
Pro�le based on completeness of strong, primary metric data
Quantitative data availability
The CRI pilot collected data across a range of Quantitative questions. City Assessors concentrated on collecting ‘primary’ data (data which is most relevant to understanding resilience), however where necessary questions were answered using secondary or alternative data.
A large amount of data was gathered, which resulted in completion of 74% of the quantitative assessment, mostly using primary metrics. However, many quantitative assessments were completed based on non-published departmental figures and expert opinion; this must be taken into account when data is used as a baseline for future reassessment, and as such has been noted carefully within assessment records.
In order to improve the city’s understanding of resilience and track performance over time, there is an opportunity to improve data management and collection in the following areas:
• Diverse livelihoods and employment (2)
• Collective identity and mutual support(4)
• Comprehensive security and rule of law (5)
• Integrated development planning (12)

Site Investigations City Resilience Index | Shimla22

Site Investigations The Rockefeller Foundation | Arup 23
Key LessonsLessons for Shimla
Lessons for the CRI
• To complete another assessment MCA will need support from a suitable party with good local knowledge and a physical presence throughout the assessment. City assessors should be involved in future assessment as much as possible as this provides a capacity building opportunity.
• As Shimla has not historically experienced any major shocks, risk reduction activities to date have been limited. The CRI outcomes advocate the need for proactive, comprehensive risk-reduction activity through strategic resilience building.
• Other important areas to address for future resilience-building activities include safeguards to human health and life, and sustainable economy. Activities should be
• Obtaining senior city leadership buy-in was a critical factor in getting the pilot off the ground, particularly to share messages on the importance of the process and mobilising stakeholders.
• The pilot would have benefited from more time invested in a stakeholder mapping exercise, spanning both local and state government departments.
• Support from a partner with knowledge of local politics and good relationships with city officials was important to identify stakeholders and data.
• City Assessors suggested the CRI questionnaires could benefit from a simplified structure and language. Support was needed to translate between English and Hindi. Many challenges were navigated with coaching and support. Future challenges may be overcome through use of a simplified online platform.
delivered through proactive and integrated government departmental coordination.
• The CRI pilot highlighted an opportunity to improve data sharing between different levels of government as a way to better inform a range of activities such as integrated planning and policy development.
• Feedback from participants suggests that the CRI pilot was a significant capacity building experience for city assessors. The pilot also helped to embed knowledge regarding resilience and systems thinking within the MCA and its stakeholders.
• Quantitative and Qualitative Profiles align in many areas, providing a strong starting point and evidence base for future resilience building activities.
• City officials and the officials from the local supporting partner – ICLEI South Asia, pointed out that the number of questions in qualitative analysis can be reduced. They have suggested that some of the questions are repetitive and can be avoided by clubbing with other related questions.
• Embedding the concept of resilience at the outset proved important. Though the concept is well understood by many senior government officials, some technical staff did not initially understand the concept solely from the perspective of climate hazards.
• Although there was consensus between Workshop Participants and City Assessor scores, the workshop was still very valuable in order to unpack resilience issues, encourage proactive thought and debate around city challenges, and gain stakeholder buy-in for future resilience building activities.

Site Investigations City Resilience Index | Shimla24
Site Investigations The Rockefeller Foundation | Arup 25
City Resilience IndexQualitative data

Indicator 1
MINIMAL HUMAN VULNERABILITY
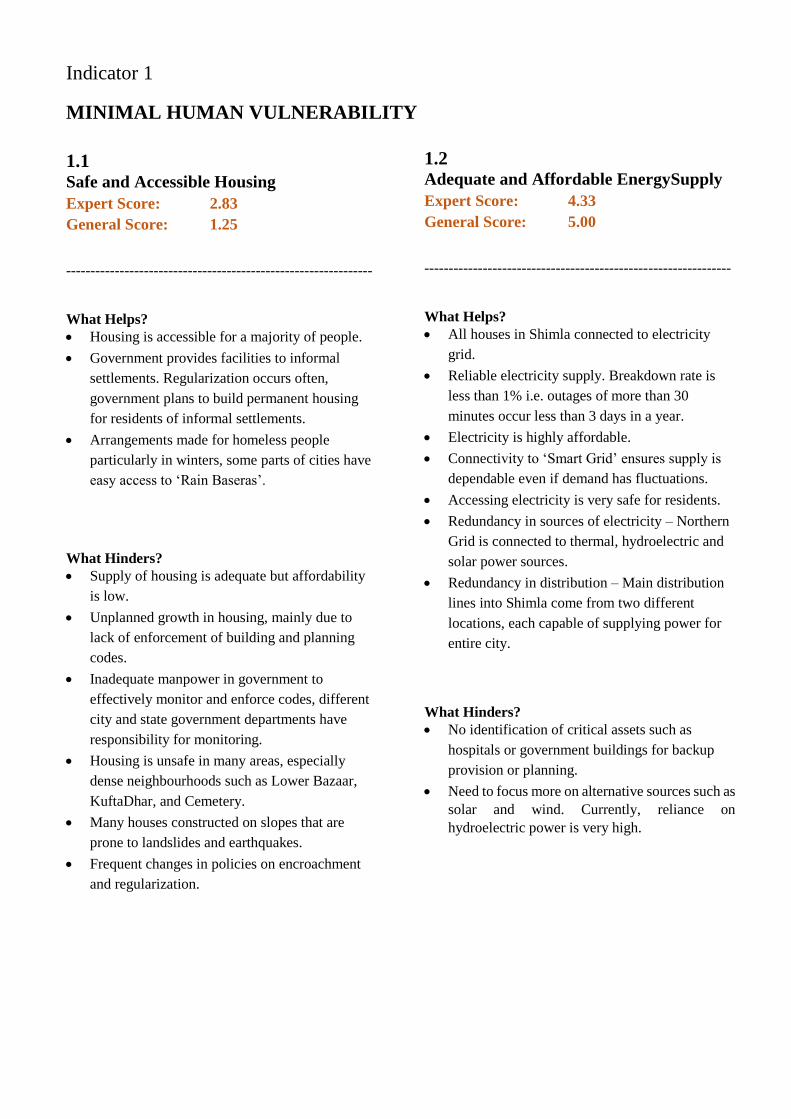
1.1 Safe and Accessible Housing
Expert Score: 2.83
General Score: 1.25
---------------------------------------------------------------
What Helps?
Housing is accessible for a majority of people.
Government provides facilities to informal
settlements. Regularization occurs often,
government plans to build permanent housing
for residents of informal settlements.
Arrangements made for homeless people
particularly in winters, some parts of cities have
easy access to ‘Rain Baseras’.
What Hinders?
Supply of housing is adequate but affordability
is low.
Unplanned growth in housing, mainly due to
lack of enforcement of building and planning
codes.
Inadequate manpower in government to
effectively monitor and enforce codes, different
city and state government departments have
responsibility for monitoring.
Housing is unsafe in many areas, especially
dense neighbourhoods such as Lower Bazaar,
KuftaDhar, and Cemetery.
Many houses constructed on slopes that are
prone to landslides and earthquakes.
Frequent changes in policies on encroachment
and regularization.
1.2 Adequate and Affordable EnergySupply
Expert Score: 4.33
General Score: 5.00
---------------------------------------------------------------
What Helps?
All houses in Shimla connected to electricity
grid.
Reliable electricity supply. Breakdown rate is
less than 1% i.e. outages of more than 30
minutes occur less than 3 days in a year.
Electricity is highly affordable.
Connectivity to ‘Smart Grid’ ensures supply is
dependable even if demand has fluctuations.
Accessing electricity is very safe for residents.
Redundancy in sources of electricity – Northern
Grid is connected to thermal, hydroelectric and
solar power sources.
Redundancy in distribution – Main distribution
lines into Shimla come from two different
locations, each capable of supplying power for
entire city.
What Hinders?
No identification of critical assets such as
hospitals or government buildings for backup
provision or planning.
Need to focus more on alternative sources such as
solar and wind. Currently, reliance on
hydroelectric power is very high.
Indicator 1
MINIMAL HUMAN VULNERABILITY
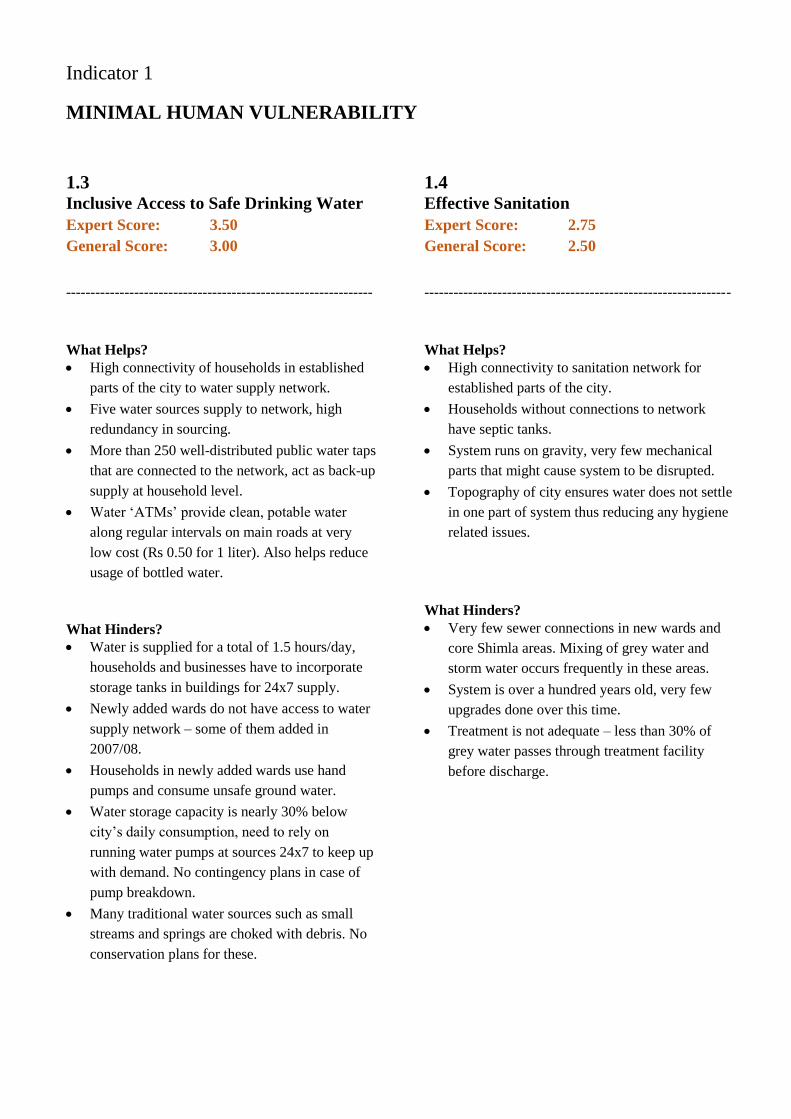
1.3 Inclusive Access to Safe Drinking Water
Expert Score: 3.50
General Score: 3.00
---------------------------------------------------------------
What Helps?
High connectivity of households in established
parts of the city to water supply network.
Five water sources supply to network, high
redundancy in sourcing.
More than 250 well-distributed public water taps
that are connected to the network, act as back-up
supply at household level.
Water ‘ATMs’ provide clean, potable water
along regular intervals on main roads at very
low cost (Rs 0.50 for 1 liter). Also helps reduce
usage of bottled water.
What Hinders?
Water is supplied for a total of 1.5 hours/day,
households and businesses have to incorporate
storage tanks in buildings for 24x7 supply.
Newly added wards do not have access to water
supply network – some of them added in
2007/08.
Households in newly added wards use hand
pumps and consume unsafe ground water.
Water storage capacity is nearly 30% below
city’s daily consumption, need to rely on
running water pumps at sources 24x7 to keep up
with demand. No contingency plans in case of
pump breakdown.
Many traditional water sources such as small
streams and springs are choked with debris. No
conservation plans for these.
1.4 Effective Sanitation
Expert Score: 2.75
General Score: 2.50
---------------------------------------------------------------
What Helps?
High connectivity to sanitation network for
established parts of the city.
Households without connections to network
have septic tanks.
System runs on gravity, very few mechanical
parts that might cause system to be disrupted.
Topography of city ensures water does not settle
in one part of system thus reducing any hygiene
related issues.
What Hinders?
Very few sewer connections in new wards and
core Shimla areas. Mixing of grey water and
storm water occurs frequently in these areas.
System is over a hundred years old, very few
upgrades done over this time.
Treatment is not adequate – less than 30% of
grey water passes through treatment facility
before discharge.
Indicator 1
MINIMAL HUMAN VULNERABILITY
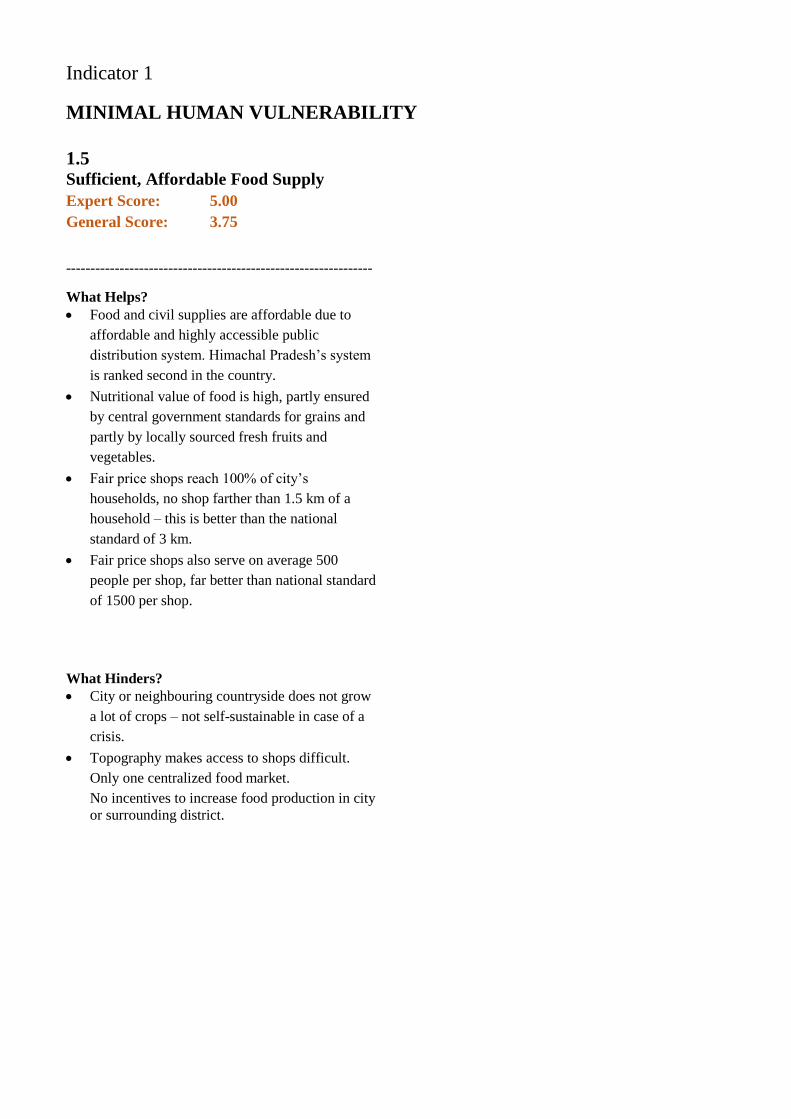
1.5 Sufficient, Affordable Food Supply
Expert Score: 5.00
General Score: 3.75
---------------------------------------------------------------
What Helps?
Food and civil supplies are affordable due to
affordable and highly accessible public
distribution system. Himachal Pradesh’s system
is ranked second in the country.
Nutritional value of food is high, partly ensured
by central government standards for grains and
partly by locally sourced fresh fruits and
vegetables.
Fair price shops reach 100% of city’s
households, no shop farther than 1.5 km of a
household – this is better than the national
standard of 3 km.
Fair price shops also serve on average 500
people per shop, far better than national standard
of 1500 per shop.
What Hinders?
City or neighbouring countryside does not grow
a lot of crops – not self-sustainable in case of a
crisis.
Topography makes access to shops difficult.
Only one centralized food market.
No incentives to increase food production in city
or surrounding district.

Indicator 2
DIVERSE LIVELIHOODS AND EMPLOYMENT
2.1 Inclusive Labour Policies
Expert Score: 3.75
General Score: 2.50
---------------------------------------------------------------
What Helps?
Right to Employment is a fundamental right,
this has led to a number of policies to address
discrimination at the workplace.
Fair minimum wage policies in place.
Employment exchanges established in every
district to help job seekers.
Workforce is relatively high skilled compared to
other places.
What Hinders?
Large proportion – nearly 60% - of workforce in
the informal sector where labour protections
cannot be enforced unless labour is organized.
Informal sector employs mostly low income
labour, who are usually more vulnerable.
No formal or informal support systems in place
to help labour manage disputes or increase
awareness about rights.
Low social support for women at the workplace.
2.2 Relevant Skills and Training
Expert Score: 2.75
General Score: 2.00
---------------------------------------------------------------
What Helps?
Highly employable resident population owing to
high literacy, high professional/college
completion rates, and programs at Industrial
Training Institutes.
Labour supply is high for unskilled jobs,
especially floating population from
neighbouring districts and states.
Job security is high in formal sector owing to
enforcement of policies and high employment in
government sector.
What Hinders?
Employment availability in city does not match
skill level of resident population.
Lack of industry in the city leads to low
employment opportunities, migration of skilled
populace to other cities.
City has the right opportunities to develop
knowledge-based industries but no impetus in
this direction from state or central government.
Government employs most people in city, but
opportunities for new government jobs
shrinking.
Other dominant sectors such as tourism and
horticulture do not need highly skilled
workforce.

Indicator 2
DIVERSE LIVELIHOODS AND EMPLOYMENT
2.3 Local Business Development
and Innovation
Expert Score: 2.88
General Score: 1.50
---------------------------------------------------------------
What Helps?
Generally high purchasing power of residents
and tourists encourages new businesses and
provides stability.
What Hinders?
High tourist influx, but not attracting high
spending tourists for business development.
State policies does not encourage good business
environment compared to neighbouring states –
transportation costs are higher, higher taxes.
Many border cities in neighbouring states do
well at the expense of Shimla.
Low infrastructure support – road network does
not lend to easy movement of goods, land
shortage within and near city due to topography.
Online shopping has hampered local markets.
Socially, high aspiration for working in the
government sector, diverts skilled people from
businesses.
Lack of skilled job opportunities in city leads to
migration of youth to other cities, ‘brain drain’
leading to loss of innovation as well.
Public-private partnership models for service
provision have not worked in the city so far,
many enterprises thus reluctant to engage with
government for business.
2.4 Supportive Financing Mechanisms
Expert Score: 3.50
General Score: 1.50
---------------------------------------------------------------
What Helps?
State and central government policies for
financing small businesses in place through
various programs: NULM, JNNURM, AMRUT.
Banks are supportive in providing credit to
businesses.
What Hinders?
Awareness of opportunities is low, especially
among small businesses.
Documentation is cumbersome, not suited to
type of economy – for example, businesses with
mainly cash dealings find it difficult to provide
income documentation.
No support for new businesses or informal small
businesses to navigate system.
Socially, people are risk-averse and not
entrepreneurial.

Indicator 2
DIVERSE LIVELIHOODS AND EMPLOYMENT
2.5 Diverse Protection of Livelihoods
Following a Shock
Expert Score: 3.33
General Score: 1.50
---------------------------------------------------------------
What Helps?
High confidence in insurance amongst
organized businesses, high proportion with
insurance coverage.
Risk-averse nature of population leads to more
savings that can be used during emergencies.
Central and state government provides relief
directly in case of landslides and earthquakes.
What Hinders?
High proportion of businesses in unorganized
sector where insurance is difficult to obtain.
Low insurance coverage among residents, only
10-20% of houses are insured.
Government aid after disasters is not a
sustainable model, susceptible to political
influence.
Many low-income people and small businesses
cannot qualify for insurance coverage even if
there is desire.

Indicator 3
EFFECTIVE SAFEGUARDS TO HUMAN HEALTH AND LIFE
3.1 Robust Public Health Systems
Expert Score: 3.50
General Score: 3.50
---------------------------------------------------------------
What Helps?
Good containment and control of epidemics.
Political will and support for public health
issues – for example, ban on public smoking
strictly followed and enforced.
High literacy rate among residents allows public
health system to spread awareness about risks
effectively.
What Hinders?
No active monitoring of vector borne diseases
or other community health risks.
Infrastructure issues at every government
hospitals, mainly lack of space.
Specialized facilities to manage substance
addiction not available due to lack of space.
Healthcare workers are overburdened,
manpower lacking to deal with public health
emergencies.
3.2 Adequate Access to Quality Healthcare
Expert Score: 3.63
General Score: 3.00
---------------------------------------------------------------
What Helps?
Free consultation at government hospitals and
clinics, prescribed drugs are normally cheap
High amount of faith in public system, over
96% of medical needs in city fulfilled by public
hospitals and clinics.
City serves high proportion of patients from
other parts of the state, can serve entire state’s
needs.
Maternal and neonatal care quality is very high,
no out of pocket costs for maternal care makes it
affordable.
High number of specialist doctors graduating in
city, many continue practicing in city.
Low income patients helped by number of state
government schemes to defray costs of
prescribed medicines.
Presence of different levels of healthcare in
government system: community healthcare
centres, primary health centres, government
hospitals.
What Hinders?
Lack of awareness among residents of city for
long-term health issues such as lifestyle diseases
and mental health issues.
Lack of specialist staff in government hospitals.
Most specialists start own practices, creates
affordability concerns.

Indicator 3
EFFECTIVE SAFEGUARDS TO HUMAN HEALTH AND LIFE
3.3 Emergency Medical Care
Expert Score: 3.13
General Score: 2.50
---------------------------------------------------------------
What Helps?
Capacity to manage minor emergencies very
effective.
Trained manpower and infrastructure to manage
emergencies.
What Hinders?
No capacity to manage large emergencies – 40
to 50 emergency care patients taken to hospitals
at the same time will overwhelm system.
Plans for upgrade and improvement of services
not carried out effectively.
Land and space shortages affect expansion of
services.
3.4 Effective Emergency Response Services
Expert Score: 3.80
General Score: 4.00
---------------------------------------------------------------
What Helps?
Well-trained, well-equipped ambulance
services. Each ambulance has trained paramedic
and pharmacist for emergency care.
Fire station density and staffing best in state.
Manned police booths at regular intervals on
main roads help response time for all emergency
systems.
Emergency services are affordable for all
income levels.
Restricted roads, sealed roads in some areas
improve emergency vehicle response times.
Trained disaster response staff, along with
volunteers in each ward.
Large proportion of city departments have
emergency response training.
What Hinders?
Road access is low due to topography,
emergency vehicles cannot get to all parts of
city quickly.
Topography creates limited options for access to
different areas, possible for entire parts of city
to be cut off due to landslides.
Manpower issues – constables work long shifts,
large fires necessitate bringing fire officers from
neighbouring areas.
Emergency response planning is not complete,
and plan has gaps – for example, food relief and
basic goods not part of response.

Indicator 4
COLLECTIVE IDENTITY AND MUTUAL SUPPORT
4.1 Local Community Support
Expert Score: 3.00
General Score: 4.00
---------------------------------------------------------------
What Helps?
At household level, strong family and
community support to vulnerable individuals.
Highly educated, mostly religious populace,
tends to care for vulnerable members of
community.
At city level, social justice committee formed
that suggests policies and improvements for
scheduled caste/tribe communities.
State/central policies to provide pensions for
seniors, disabled people, religious minorities
and scheduled castes/tribes and other backward
castes.
Active presence of informal welfare and social
organizations that provide free services to
vulnerable individuals.
What Hinders?
Increasing substance addiction among youth is a
concern.
No formal mechanisms to bring different
members of communities together.
Social welfare/support schemes are not
adequately funded, individual pensions and
disability payments are not sufficient for
support.
4.2 Cohesive Communities
Expert Score: 3.33
General Score: 3.00
---------------------------------------------------------------
What Helps?
No tension, division or discrimination on basis
of religion or caste in city.
All major religious events and festivals are
celebrated together in city.
City has programs aimed to increase
cohesiveness between different community
groups.
What Hinders?
Lack of shared public recreational amenities –
parks, gyms, libraries etc.
High proportion of low-income households,
slum dwellers tend to be from scheduled caste
or tribe groups.

Indicator 4
COLLECTIVE IDENTITY AND MUTUAL SUPPORT
4.3 Strong City-wide Identity and Culture
Expert Score: 3.50
General Score: 3.50
---------------------------------------------------------------
What Helps?
Relatively small city population, stable resident
base creates a sense of common identity.
Strong sense of civic pride contributes to city
functions – for example, residents informally
police spitting or littering on streets.
Pride in city’s blend of cultures – colonial,
Punjabi, Himachali.
Pride in cultural artefacts – Kangra tea,
KinnauriRajma.
What Hinders?
Himachali culture is not very visible in city,
although most residents are Himachali.
Most residents lack exposure to outside cultures.
4.4 Actively Engaged Citizenry
Expert Score: 2.67
General Score: 3.00
---------------------------------------------------------------
What Helps?
Constitutional freedoms are protected,
particularly freedom of speech.
City is capital of state and centre of student
politics, tends to attract politically active people.
High voter turnouts in elections for city
government.
What Hinders?
Very little participation in political matters from
private sector or groups.
Apart from SAGES and Rotary Club, few
nongovernmental organizations involved in
advocacy or governance issues.
Indicator 5
COMPREHENSIVE SECURITY AND RULE OF LAW
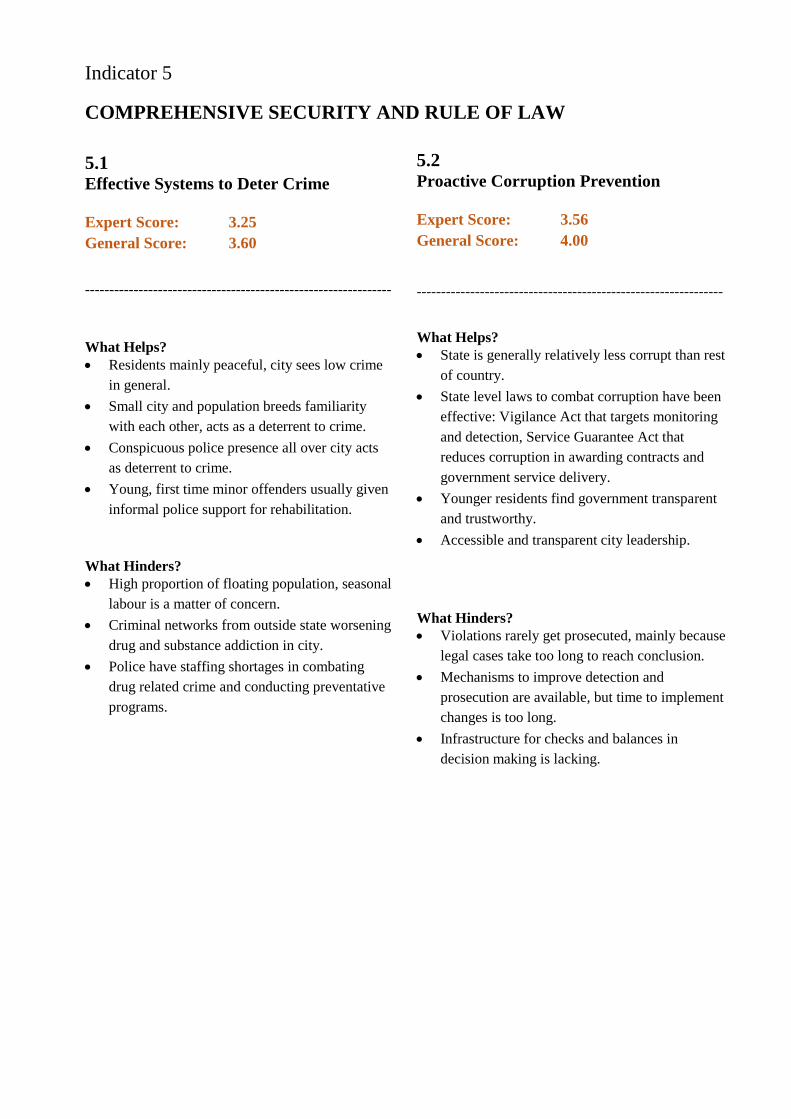
5.1 Effective Systems to Deter Crime
Expert Score: 3.25
General Score: 3.60
---------------------------------------------------------------
What Helps?
Residents mainly peaceful, city sees low crime
in general.
Small city and population breeds familiarity
with each other, acts as a deterrent to crime.
Conspicuous police presence all over city acts
as deterrent to crime.
Young, first time minor offenders usually given
informal police support for rehabilitation.
What Hinders?
High proportion of floating population, seasonal
labour is a matter of concern.
Criminal networks from outside state worsening
drug and substance addiction in city.
Police have staffing shortages in combating
drug related crime and conducting preventative
programs.
5.2 Proactive Corruption Prevention
Expert Score: 3.56
General Score: 4.00
---------------------------------------------------------------
What Helps?
State is generally relatively less corrupt than rest
of country.
State level laws to combat corruption have been
effective: Vigilance Act that targets monitoring
and detection, Service Guarantee Act that
reduces corruption in awarding contracts and
government service delivery.
Younger residents find government transparent
and trustworthy.
Accessible and transparent city leadership.
What Hinders?
Violations rarely get prosecuted, mainly because
legal cases take too long to reach conclusion.
Mechanisms to improve detection and
prosecution are available, but time to implement
changes is too long.
Infrastructure for checks and balances in
decision making is lacking.
Indicator 5
COMPREHENSIVE SECURITY AND RULE OF LAW
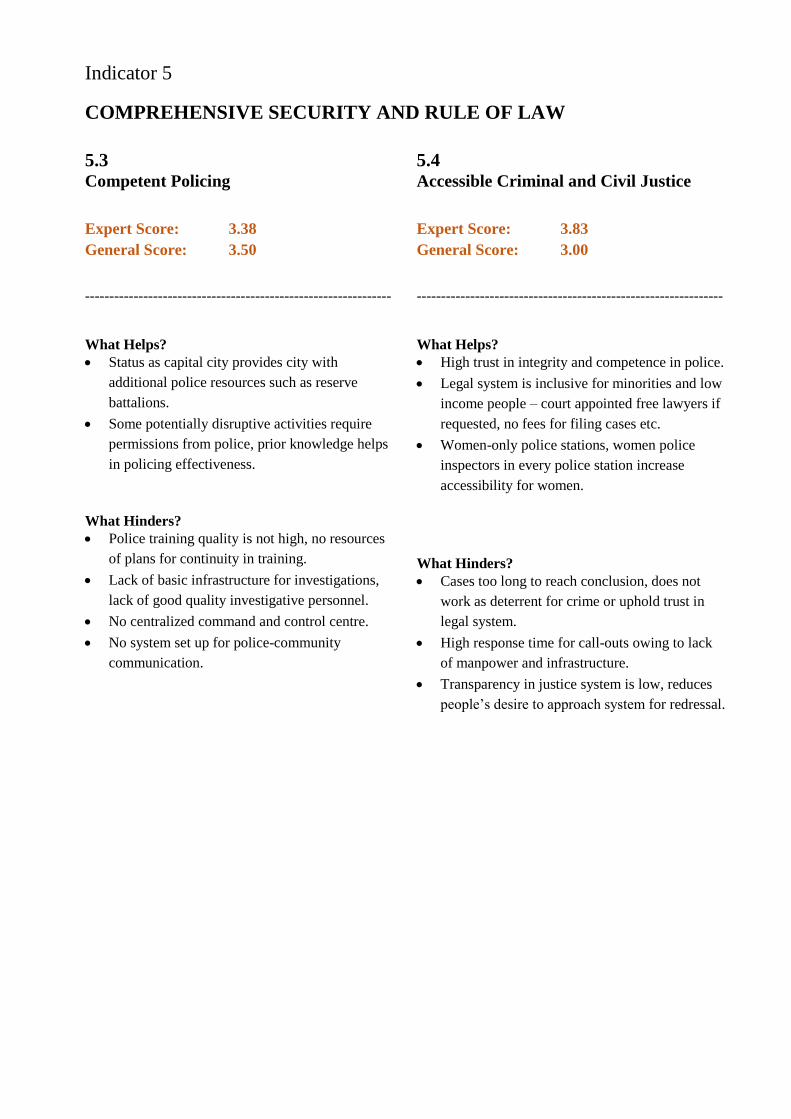
5.3 Competent Policing
Expert Score: 3.38
General Score: 3.50
---------------------------------------------------------------
What Helps?
Status as capital city provides city with
additional police resources such as reserve
battalions.
Some potentially disruptive activities require
permissions from police, prior knowledge helps
in policing effectiveness.
What Hinders?
Police training quality is not high, no resources
of plans for continuity in training.
Lack of basic infrastructure for investigations,
lack of good quality investigative personnel.
No centralized command and control centre.
No system set up for police-community
communication.
5.4 Accessible Criminal and Civil Justice
Expert Score: 3.83
General Score: 3.00
---------------------------------------------------------------
What Helps?
High trust in integrity and competence in police.
Legal system is inclusive for minorities and low
income people – court appointed free lawyers if
requested, no fees for filing cases etc.
Women-only police stations, women police
inspectors in every police station increase
accessibility for women.
What Hinders?
Cases too long to reach conclusion, does not
work as deterrent for crime or uphold trust in
legal system.
High response time for call-outs owing to lack
of manpower and infrastructure.
Transparency in justice system is low, reduces
people’s desire to approach system for redressal.

Indicator 6
SUSTAINABLE ECONOMY
6.1 Well Managed Public Finances
Expert Score: 3.00
General Score: 3.50
---------------------------------------------------------------
What Helps?
Consistency in tax and fee structure for any
activity in the city.
State and central government schemes that
incentivize city to match funds.
Revenue collection and funding is regular and
rarely delayed.
What Hinders?
Revenues from commercial activities rely
heavily on tourism industry, revenues see
drastic reduction in off-season.
Shortage of staff hinders tax collection and
monitoring.
Few sources of revenue and funding are entirely
under city’s control.
City has to rely on state and central government
grants for capital projects as well as routine
operations.
6.2 Comprehensive Business
Continuity Planning
Expert Score: 1.67
General Score: 2.50
---------------------------------------------------------------
What Helps?
Tourism is a reliable sector to generate demand
for businesses.
Opportunities to cater to different tourist groups
could see this sector expanding further.
What Hinders?
Space constraints inhibit infrastructure
development to cater to tourism – for example,
lack of parking spaces.
Space constraints also limit the number and
scope of industrial or commercial activities that
can take place in the city.
High reliance on tourism for business, very little
local demand or any other industry located near
city.
No centralized agency in government that
businesses can work with to resolve issues.

Indicator 6
SUSTAINABLE ECONOMY
6.3 Diverse Economic Base
Expert Score: 2.00
General Score: 3.50
---------------------------------------------------------------
What Helps?
As centre of government in state, economic
stability is provided by government sector
employment.
What Hinders?
High reliance on tourism to generate
employment and business.
No policies in place to either expand and
stabilize tourism sector or invest in other
sectors.
Government and tourism account for majority of
employment and revenue generation, no
flexibility in economy.
6.4 Attractive Business Environment
Expert Score: 2.33
General Score: 3.50
---------------------------------------------------------------
What Helps?
Highly educated, skilled residents act as
valuable human resource for business activity.
High income levels in city imply high demand
for goods and services.
City has good accessibility from other parts of
the state.
Good economic linkages and infrastructure for
tourism and horticulture related businesses.
What Hinders?
Space constraints are deterrents – lack of
parking, lack of space for larger set ups.
Climate and topography do not allow easy year
round operation of businesses.
Shortage of unskilled and semi-skilled labour
that can work in dominant economic sectors.
Very little inward investment.
Better business environment in neighbouring
states hampers growth in city.

Indicator 6
SUSTAINABLE ECONOMY
6.5 Strong Integration with Regional and
Global Economies
Expert Score: 2.50
General Score: 4.00
--------------------------------------------------------------
What Helps?
Climate and quality of life make city highly
attractive to live and work in.
High accessibility to other cities and other parts
of state, in spite of topographic constraints.
Educational hub for region.
Centre for horticultural produce from rest of
state.
What Hinders?
Weak economic links to other cities as localized
tourism is key business and employment
generator.
Business activity is concentrated within
different communities, few links to other
communities even within same neighbourhood.
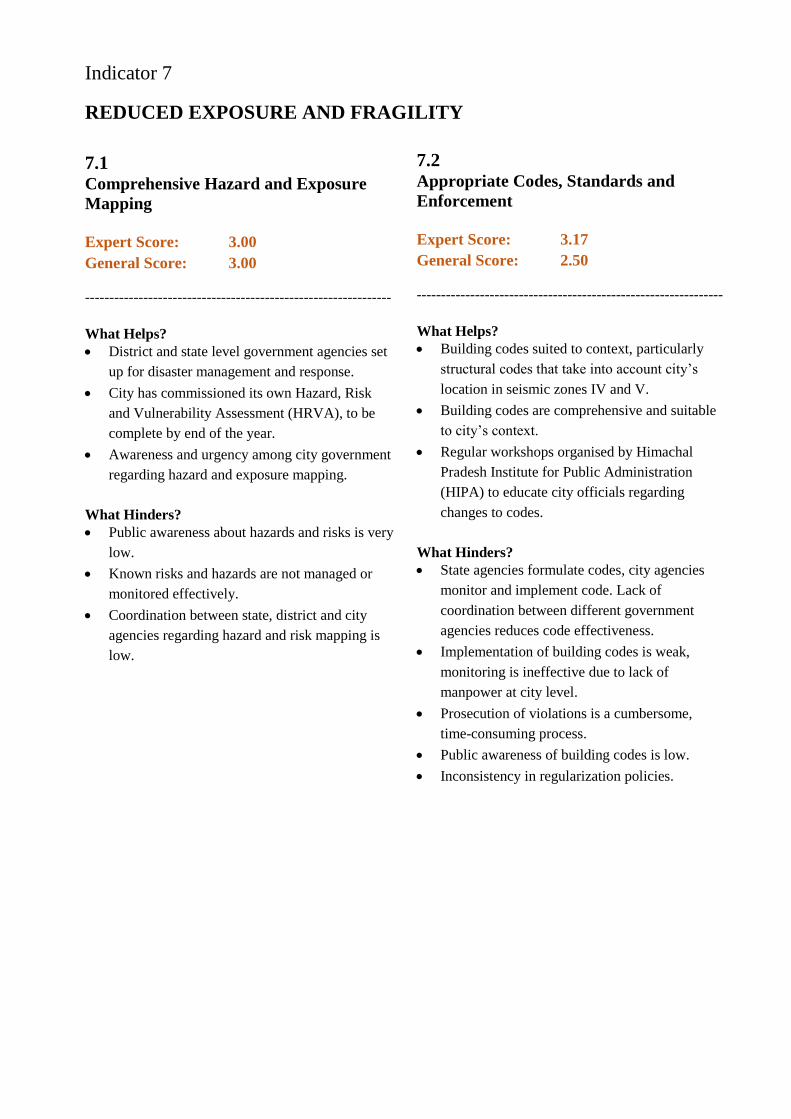
Indicator 7
REDUCED EXPOSURE AND FRAGILITY
7.1 Comprehensive Hazard and Exposure
Mapping
Expert Score: 3.00
General Score: 3.00
---------------------------------------------------------------
What Helps?
District and state level government agencies set
up for disaster management and response.
City has commissioned its own Hazard, Risk
and Vulnerability Assessment (HRVA), to be
complete by end of the year.
Awareness and urgency among city government
regarding hazard and exposure mapping.
What Hinders?
Public awareness about hazards and risks is very
low.
Known risks and hazards are not managed or
monitored effectively.
Coordination between state, district and city
agencies regarding hazard and risk mapping is
low.
7.2 Appropriate Codes, Standards and
Enforcement
Expert Score: 3.17
General Score: 2.50
---------------------------------------------------------------
What Helps?
Building codes suited to context, particularly
structural codes that take into account city’s
location in seismic zones IV and V.
Building codes are comprehensive and suitable
to city’s context.
Regular workshops organised by Himachal
Pradesh Institute for Public Administration
(HIPA) to educate city officials regarding
changes to codes.
What Hinders?
State agencies formulate codes, city agencies
monitor and implement code. Lack of
coordination between different government
agencies reduces code effectiveness.
Implementation of building codes is weak,
monitoring is ineffective due to lack of
manpower at city level.
Prosecution of violations is a cumbersome,
time-consuming process.
Public awareness of building codes is low.
Inconsistency in regularization policies.

Indicator 7
REDUCED EXPOSURE AND FRAGILITY
7.3 Effectively Managed Protective
Ecosystems
Expert Score: 2.67
General Score: 3.00
---------------------------------------------------------------
What Helps?
Forests within city limits are well protected,
both through laws and their enforcement.
Stringent rules and complex process deter
alterations in forest land.
Attaching reserved forests to key infrastructure
needs – for example, water catchment area
located within reserved forest.
What Hinders?
Afforestation in previously depleted areas not
pursued as urgently as it should be, no policies
in place to encourage afforestation.
Habitat protection measures not in place; effects
seen in influx of Russell’s Monkeys into city,
loss of unique animal and plant species,
proliferation of invasive plant species.
7.4 Robust Protective Infrastructure
Expert Score: 3.67
General Score: 3.00
---------------------------------------------------------------
What Helps?
Effective process of implementing civil works,
only executed after comprehensive
investigation, planning and design.
Operation and maintenance processes follow
established codes and practices, have skilled
labour involved.
What Hinders?
Hazard and risk assessments are not linked to
design of protective infrastructure.
Public awareness about critical infrastructure is
low.
Long term planning for protective infrastructure
is inadequate.

Indicator 8
EFFECTIVE PROVISION OF CRITICAL SERVICES
8.1 Effective Stewardship of Ecosystems
Expert Score: 3.33
General Score: 4.50
---------------------------------------------------------------
What Helps?
Clear recognition of link between forests and
quality of life and health among general public
as well as city officials.
Natural ecosystems form critical part of city’s
identity.
Good practices for protection and management
of ecosystem.
Small scale efforts at restoration of damaged
ecosystems.
What Hinders?
Urbanization encroaching into unreserved forest
areas, fragile ecosystems.
Illegally built settlements in unreserved forests
get regularized easily e.g. Sanjauli.
Afforestation is lacking, no political will or
policies to restore past damage to forests.
Floating population and tourists do not seem to
value natural ecosystems as much as residents
do.
8.2 Flexible Infrastructure
Expert Score: 3.64
General Score: 3.00
---------------------------------------------------------------
What Helps?
Long terms plans for upgrading sanitation,
water supply and electrical systems in place,
capital funding secured for water supply and
sanitation systems through World Bank loan.
‘Easy wins’ to increase electrical supply through
minor upgrades to existing supply and
distribution infrastructure – upgrading 120 kV
substations to 230 kV, revival of small
hydroelectricity units near city.
High diversity in sourcing and distribution
methods of electricity and water supply.
What Hinders?
Long term solid waste disposal plans in place
since 2012, but implementation has not started.
Door-to-door solid waste collection hampered
by strikes.
Burning down of treatment plant hampering
garbage disposal process.
Per capita water supply allocation lower than
national standards – 75 lpcpd versus 115 lpcpd.
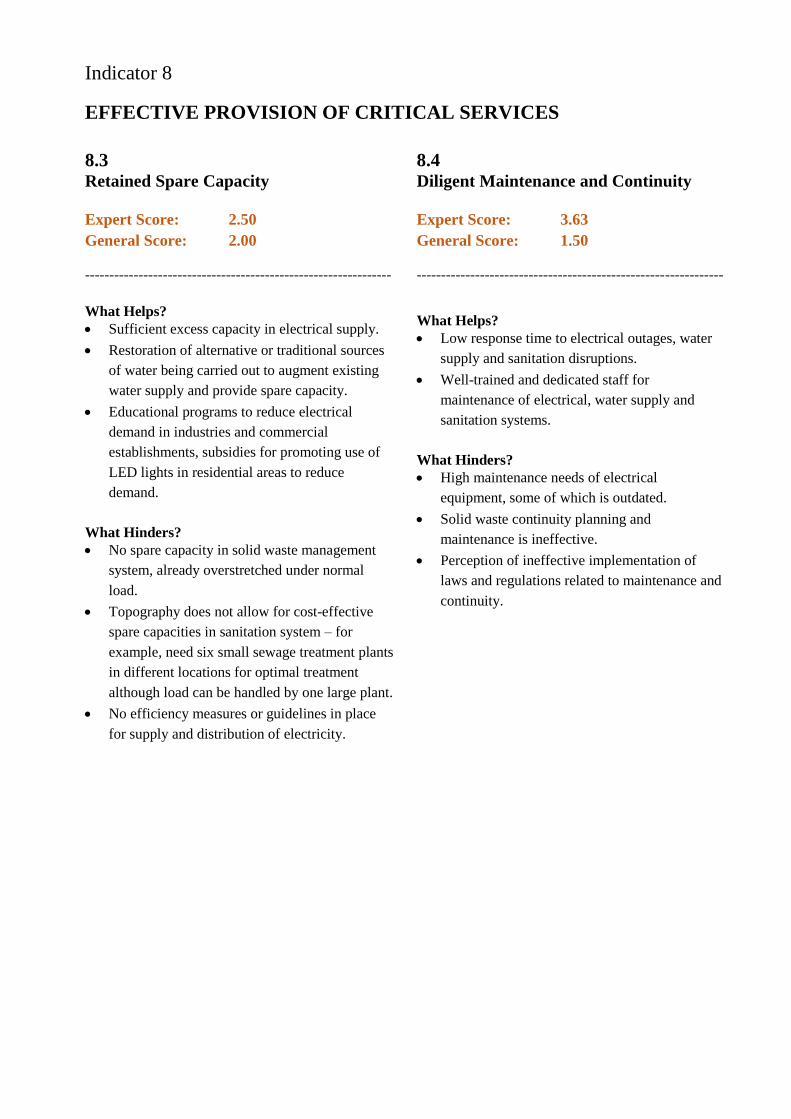
Indicator 8
EFFECTIVE PROVISION OF CRITICAL SERVICES
8.3 Retained Spare Capacity
Expert Score: 2.50
General Score: 2.00
---------------------------------------------------------------
What Helps?
Sufficient excess capacity in electrical supply.
Restoration of alternative or traditional sources
of water being carried out to augment existing
water supply and provide spare capacity.
Educational programs to reduce electrical
demand in industries and commercial
establishments, subsidies for promoting use of
LED lights in residential areas to reduce
demand.
What Hinders?
No spare capacity in solid waste management
system, already overstretched under normal
load.
Topography does not allow for cost-effective
spare capacities in sanitation system – for
example, need six small sewage treatment plants
in different locations for optimal treatment
although load can be handled by one large plant.
No efficiency measures or guidelines in place
for supply and distribution of electricity.
8.4 Diligent Maintenance and Continuity
Expert Score: 3.63
General Score: 1.50
---------------------------------------------------------------
What Helps?
Low response time to electrical outages, water
supply and sanitation disruptions.
Well-trained and dedicated staff for
maintenance of electrical, water supply and
sanitation systems.
What Hinders?
High maintenance needs of electrical
equipment, some of which is outdated.
Solid waste continuity planning and
maintenance is ineffective.
Perception of ineffective implementation of
laws and regulations related to maintenance and
continuity.

Indicator 8
EFFECTIVE PROVISION OF CRITICAL SERVICES
8.5 Adequate Continuity for Critical Assets
and Services
Expert Score: 2.17
General Score: 1.50
---------------------------------------------------------------
What Helps?
Back-up water supply in form of water tankers,
rejuvenation of traditional/alternate water
sources.
Critical assets that need water supply identified,
provided water supply 24 hours a day, as
opposed to 1.5 hours a day for other consumers.
What Hinders?
Lack of preparedness in service continuity
during disasters, city cannot even cope with
heavy snow or rainfall.
Emergency response lies with district agency,
while mapping of risks is managed by city –
lack of coordination between the two agencies.
District emergency response centre is woefully
inadequate.
For provision of electrical supply, no
identification of critical assets and no backup
systems in place.
Indicator 9
RELIABLE MOBILITY AND COMMUNICATIONS
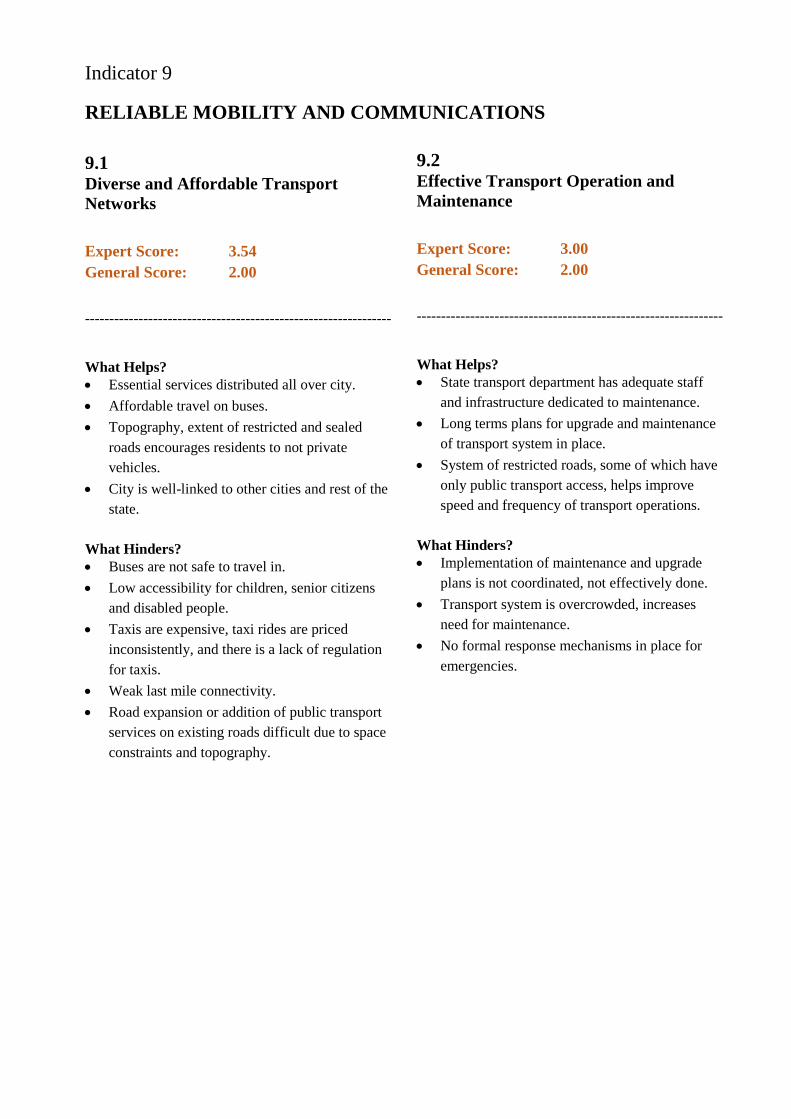
9.1 Diverse and Affordable Transport
Networks
Expert Score: 3.54
General Score: 2.00
---------------------------------------------------------------
What Helps?
Essential services distributed all over city.
Affordable travel on buses.
Topography, extent of restricted and sealed
roads encourages residents to not private
vehicles.
City is well-linked to other cities and rest of the
state.
What Hinders?
Buses are not safe to travel in.
Low accessibility for children, senior citizens
and disabled people.
Taxis are expensive, taxi rides are priced
inconsistently, and there is a lack of regulation
for taxis.
Weak last mile connectivity.
Road expansion or addition of public transport
services on existing roads difficult due to space
constraints and topography.
9.2 Effective Transport Operation and
Maintenance
Expert Score: 3.00
General Score: 2.00
---------------------------------------------------------------
What Helps?
State transport department has adequate staff
and infrastructure dedicated to maintenance.
Long terms plans for upgrade and maintenance
of transport system in place.
System of restricted roads, some of which have
only public transport access, helps improve
speed and frequency of transport operations.
What Hinders?
Implementation of maintenance and upgrade
plans is not coordinated, not effectively done.
Transport system is overcrowded, increases
need for maintenance.
No formal response mechanisms in place for
emergencies.
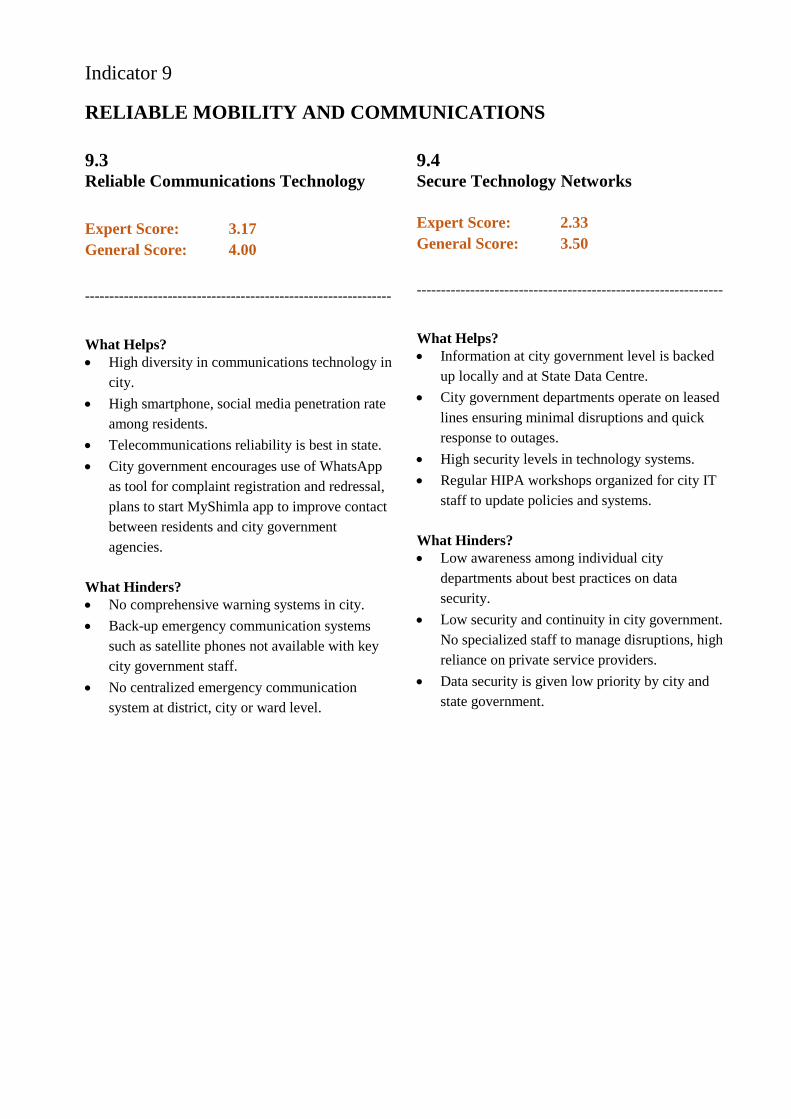
Indicator 9
RELIABLE MOBILITY AND COMMUNICATIONS
9.3 Reliable Communications Technology
Expert Score: 3.17
General Score: 4.00
---------------------------------------------------------------
What Helps?
High diversity in communications technology in
city.
High smartphone, social media penetration rate
among residents.
Telecommunications reliability is best in state.
City government encourages use of WhatsApp
as tool for complaint registration and redressal,
plans to start MyShimla app to improve contact
between residents and city government
agencies.
What Hinders?
No comprehensive warning systems in city.
Back-up emergency communication systems
such as satellite phones not available with key
city government staff.
No centralized emergency communication
system at district, city or ward level.
9.4 Secure Technology Networks
Expert Score: 2.33
General Score: 3.50
---------------------------------------------------------------
What Helps?
Information at city government level is backed
up locally and at State Data Centre.
City government departments operate on leased
lines ensuring minimal disruptions and quick
response to outages.
High security levels in technology systems.
Regular HIPA workshops organized for city IT
staff to update policies and systems.
What Hinders?
Low awareness among individual city
departments about best practices on data
security.
Low security and continuity in city government.
No specialized staff to manage disruptions, high
reliance on private service providers.
Data security is given low priority by city and
state government.

Indicator 10
EFFECTIVE LEADERSHIP AND MANAGEMENT
10.1 Appropriate Government Decision
Making
Expert Score: 4.00
General Score: 3.50
---------------------------------------------------------------
What Helps?
City government is seen as transparent, easily
reachable and responsible.
Decisions are made with extensive public
consultation.
What Hinders?
City governance is not entirely in city
government’s control, many state departments
responsible for local decision making as well.
Decentralization process under Municipal
Corporation Act of 1994 not followed up with in
its entirety.
10.2 Effective Coordination with Other
Government Bodies
Expert Score: 2.50
General Score: 2.00
---------------------------------------------------------------
What Helps?
Interdepartmental consultations and workshops
occur within city government when major
decisions have to be taken.
What Hinders?
City governance powers are not entirely
delegated to city government, low effectiveness
especially with issues handled directly by state
government agencies.
Coordination between departments occurs not as
matter of process but only if leadership demands
it.

Indicator 10
EFFECTIVE LEADERSHIP AND MANAGEMENT
10.3 Proactive Multi-stakeholder
Collaboration
Expert Score: 1.00
General Score: 4.00
---------------------------------------------------------------
What Helps?
Revamped complaint redress system in place,
use of new technologies to improve
communication between public and city
government.
What Hinders?
Business sector participation in government
decision making process is low.
Few civil society organizations involved in
consultation process with city government.
10.4 Comprehensive Hazard Monitoring and
Risk Assessment
Expert Score: 3.67
General Score: 1.00
---------------------------------------------------------------
What Helps?
First Hazard, Risk and Vulnerability
Assessment for the city planned for completion
in December 2015.
Effective coordination with external consultants
and experts to guide practices and systems for
assessment.
Risk awareness spread through radio and TV
ads by state government.
What Hinders?
No internal capacity in city or state government
to continually monitor hazards.
Lack of implementation of building codes is a
cause for concern.
Except for weather reports, no early forecast
systems in place.
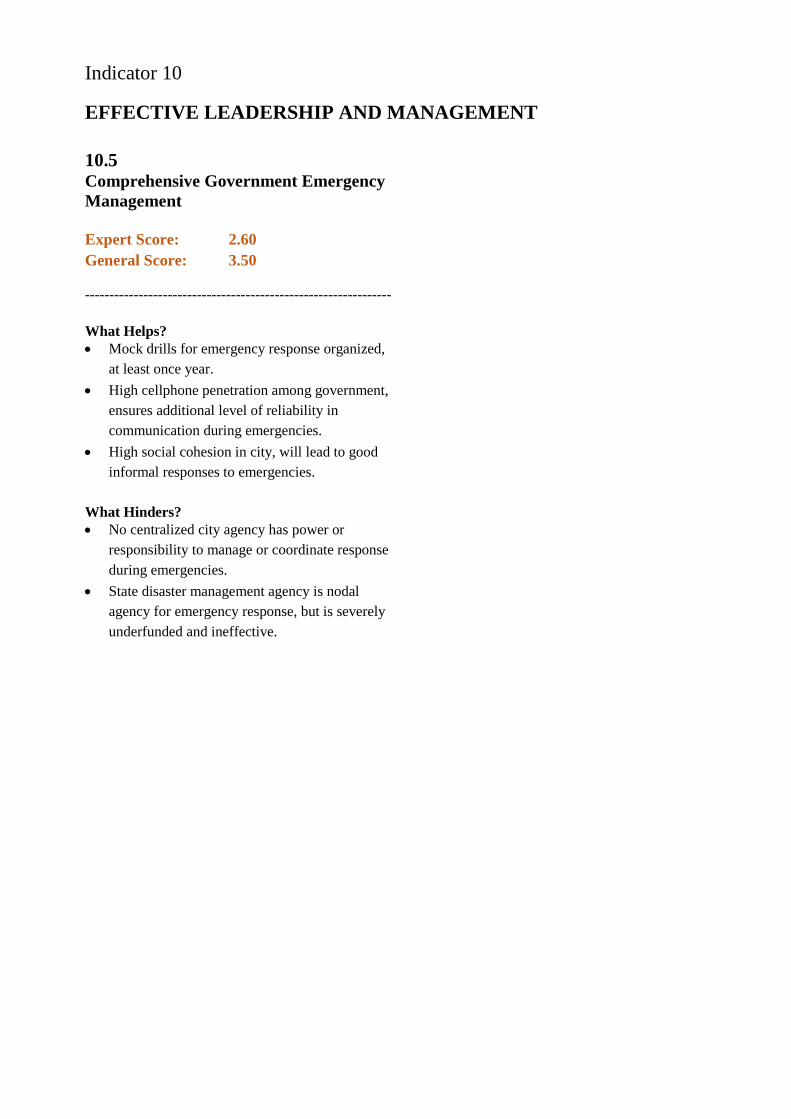
Indicator 10
EFFECTIVE LEADERSHIP AND MANAGEMENT
10.5 Comprehensive Government Emergency
Management
Expert Score: 2.60
General Score: 3.50
---------------------------------------------------------------
What Helps?
Mock drills for emergency response organized,
at least once year.
High cellphone penetration among government,
ensures additional level of reliability in
communication during emergencies.
High social cohesion in city, will lead to good
informal responses to emergencies.
What Hinders?
No centralized city agency has power or
responsibility to manage or coordinate response
during emergencies.
State disaster management agency is nodal
agency for emergency response, but is severely
underfunded and ineffective.
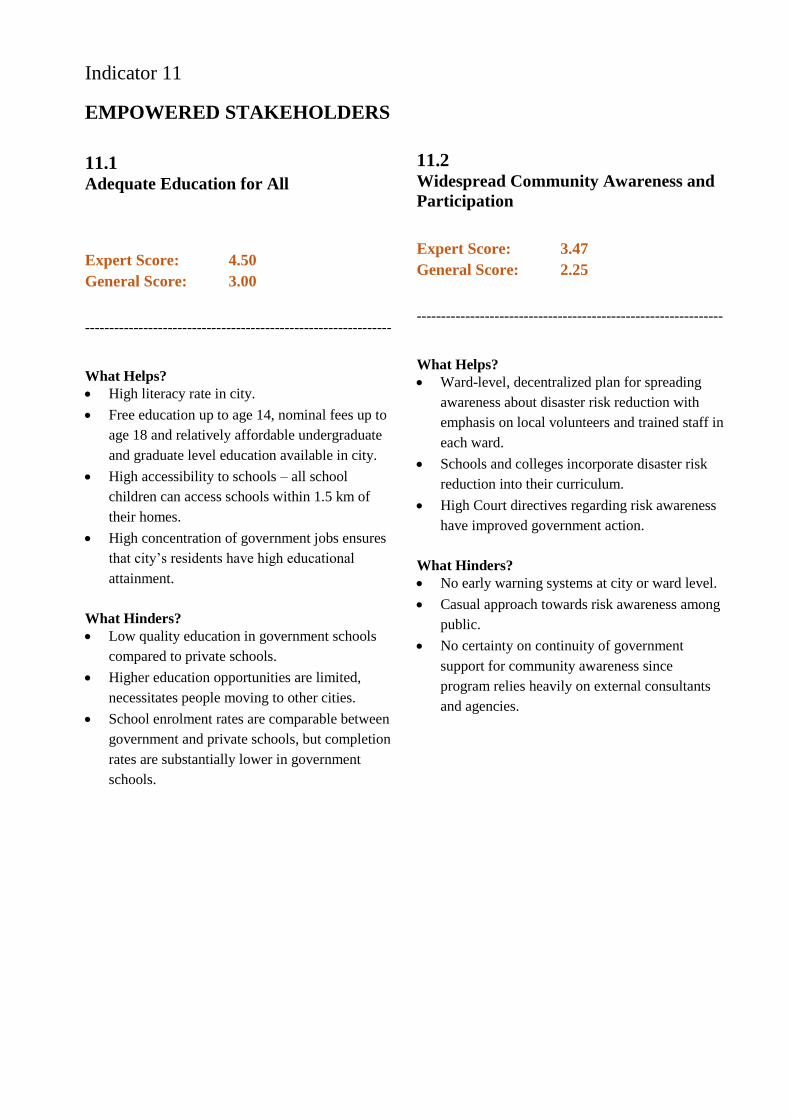
Indicator 11
EMPOWERED STAKEHOLDERS
11.1 Adequate Education for All
Expert Score: 4.50
General Score: 3.00
---------------------------------------------------------------
What Helps?
High literacy rate in city.
Free education up to age 14, nominal fees up to
age 18 and relatively affordable undergraduate
and graduate level education available in city.
High accessibility to schools – all school
children can access schools within 1.5 km of
their homes.
High concentration of government jobs ensures
that city’s residents have high educational
attainment.
What Hinders?
Low quality education in government schools
compared to private schools.
Higher education opportunities are limited,
necessitates people moving to other cities.
School enrolment rates are comparable between
government and private schools, but completion
rates are substantially lower in government
schools.
11.2 Widespread Community Awareness and
Participation
Expert Score: 3.47
General Score: 2.25
---------------------------------------------------------------
What Helps?
Ward-level, decentralized plan for spreading
awareness about disaster risk reduction with
emphasis on local volunteers and trained staff in
each ward.
Schools and colleges incorporate disaster risk
reduction into their curriculum.
High Court directives regarding risk awareness
have improved government action.
What Hinders?
No early warning systems at city or ward level.
Casual approach towards risk awareness among
public.
No certainty on continuity of government
support for community awareness since
program relies heavily on external consultants
and agencies.

Indicator 11
EMPOWERED STAKEHOLDERS
11.3 Effective Mechanisms for Community to
Engage with Government
Expert Score: 4.00
General Score: 4.00
---------------------------------------------------------------
What Helps?
Concerted effort from city government leaders
to improve access and communication between
government and public.
Availability of city government on a wide range
of media for communication.
Each ward is provided share of revenues by city
government, aids localized decision making and
direct citizen participation.
What Hinders?
Innovative methods for outreach and
communication do not get institutionalized
easily.

Indicator 12
INTEGRATED DEVELOPMENT PLANNING
12.1 Comprehensive City Monitoring and
Data Management
Expert Score: 2.33
General Score: 3.50
---------------------------------------------------------------
What Helps?
Raw data collected and available from different
sources and departments.
Capacity added by outsourcing some tasks and
processes, for example city development plan is
being developed by a consulting firm.
What Hinders?
No centralized agency to collect planning data.
Data reliability is low, frequently out of date.
Data from census is only form of projection or
trend analysis.
City and state do not have capacity to
continually collect data and conduct analyses.
High proportion of tourists and seasonal labour
in city hampers data collection accuracy.
12.2 Consultative Planning Process
Expert Score: 2.83
General Score: 2.50
---------------------------------------------------------------
What Helps?
Development plans and sector specific strategies
developed or in the process of development – for
example, city mobility plan to improve access
and city development plan.
What Hinders?
No transparency in development or planning
process.
Very little public participation in development
processes.
Lack of coordination between city and state
planning departments or agencies.
Very little coordination with utilities and service
providers during planning process.
Lack of communication with public on how to
engage with development process.
Lack of staff capacity to manage development
planning in government departments.
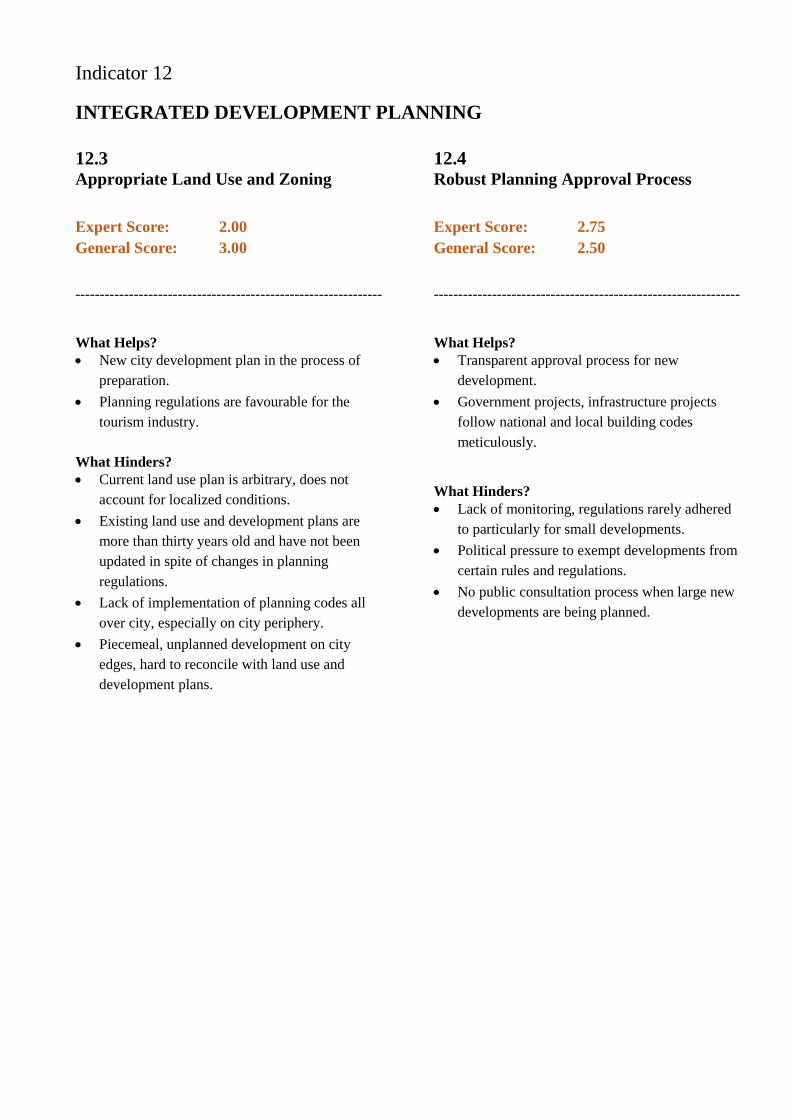
Indicator 12
INTEGRATED DEVELOPMENT PLANNING
12.3 Appropriate Land Use and Zoning
Expert Score: 2.00
General Score: 3.00
---------------------------------------------------------------
What Helps?
New city development plan in the process of
preparation.
Planning regulations are favourable for the
tourism industry.
What Hinders?
Current land use plan is arbitrary, does not
account for localized conditions.
Existing land use and development plans are
more than thirty years old and have not been
updated in spite of changes in planning
regulations.
Lack of implementation of planning codes all
over city, especially on city periphery.
Piecemeal, unplanned development on city
edges, hard to reconcile with land use and
development plans.
12.4 Robust Planning Approval Process
Expert Score: 2.75
General Score: 2.50
---------------------------------------------------------------
What Helps?
Transparent approval process for new
development.
Government projects, infrastructure projects
follow national and local building codes
meticulously.
What Hinders?
Lack of monitoring, regulations rarely adhered
to particularly for small developments.
Political pressure to exempt developments from
certain rules and regulations.
No public consultation process when large new
developments are being planned.