cityofcoachellageneralplanupdate.weebly.com · web viewis called the “greenhouse effect.” the...
TRANSCRIPT

5.7 Greenhouse Gases
Introduction This section presents an overview of the existing greenhouse gas (GHG) regulations and discusses the potential global climate change impacts as a result of construction and operation activities associated with the proposed general plan update.
Global climate change refers to any significant change in climate measurements, such as temperature, precipitation, or wind, lasting for an extended period (i.e., decades or longer).1 Climate change may result from:
Natural factors, such as changes in the sun’s intensity or slow changes in the Earth’s orbit around the sun;
Natural processes within the climate system (e.g., changes in ocean circulation, reduction in sunlight from the addition of GHG and other gases to the atmosphere from volcanic eruptions); and
Human activities that change the atmosphere’s composition (e.g., through burning fossil fuels) and the land surface (e.g., deforestation, reforestation, urbanization, desertification).
The third bullet is the focus of climate change legislation. The natural process through which heat is retained in the troposphere2 is called the “greenhouse effect.” The greenhouse effect traps heat in the troposphere through a threefold process as follows: (1) short-wave radiation in the form of visible light emitted by the Sun is absorbed by the Earth as heat; (2) long-wave radiation is re-emitted by the Earth; and (3) greenhouse gases (GHGs) in the atmosphere absorb or trap the long-wave radiation and re-emit it back towards the Earth and into space.
While water vapor and CO2 are the most abundant GHG, other trace GHGs have a greater ability to absorb and re-radiate long-wave radiation. To gauge the potency of GHGs, scientists have established a Global Warming Potential (GWP) for each GHG based on its ability to absorb and re-emit long-wave radiation over a specific period. The GWP of a gas is determined using CO2 as the reference gas with a GWP of 1 over 100 years. For example, a gas with a GWP of 10 is 10 times more potent than CO2 over 100 years. The use of GWP allows GHG emissions to be reported using CO2 as a baseline. The sum of each GHG multiplied by its associated GWP is referred to as carbon dioxide equivalents (CO2e). This essentially means that 1 metric ton of a GHG with a GWP of 10 has the same climate change impacts as 10 metric tons of CO2.
Greenhouse Gases1 US Environmental Protection Agency, “Glossary of Climate Change Terms,” http://www.epa.gov
/climatechange/glossary.html#Climate_change. 2009.
2 The troposphere is the bottom layer of the atmosphere, which varies in height from the Earth’s surface to 10 to 12 kilometers.
Coachella General Plan Admin Draft EIR 5.7-1 February 2012
Impact Sciences, Inc. (1098.001)

5.7 Greenhouse Gases
The compounds described below are GHGs subject to control under state law.3 As noted above, water vapor is a GHG; however, it’s concentration in the atmosphere is a function of temperature and vapor pressure and cannot be controlled by any known means; therefore, water vapor is not subject to control under state law.
Carbon Dioxide (CO2). Carbon dioxide primarily is generated by fossil fuel combustion from stationary and mobile sources. Due to the emergence of industrial facilities and mobile sources over the past 250 years, the concentration of carbon dioxide in the atmosphere has increased 35 percent.4 Carbon dioxide is the most widely emitted GHG and is the reference gas (GWP of 1) for determining the GWP of other GHGs. In 2004, 83.8 percent of California’s GHG emissions were carbon dioxide.5
Methane (CH4). Methane is emitted from biogenic sources, incomplete combustion in forest fires, landfills, manure management, and leaks in natural gas pipelines. In the United States, the top three sources of methane are landfills, natural gas systems, and enteric fermentation.6 Methane is the primary component of natural gas, which is used for space and water heating, steam production, and power generation. The GWP of methane is 21.
Nitrous Oxide (N2O). Nitrous oxide is produced by both natural and human-related sources. Primary human-related sources include: agricultural soil management, animal manure management, sewage treatment, mobile and stationary combustion of fossil fuel, adipic acid production, and nitric acid production. The GWP of nitrous oxide is 310.
Hydrofluorocarbons (HFCs). HFCs typically are used as refrigerants in both stationary refrigeration and mobile air conditioning. The use of HFCs for cooling and foam blowing is growing, particularly as the continued phase-out of chlorofluorocarbons (CFCs) and hydrochlorofluorocarbons (HCFCs) gains momentum. The GWP of HFCs range from 140 for HFC-152a to 6,300 for HFC-236fa.
Perfluorocarbons (PFCs). Perfluorocarbons are compounds consisting of carbon and fluorine. They primarily are created as a byproduct of aluminum production and semiconductor manufacturing. Perfluorocarbons are potent GHGs with a GWP several thousand times that of carbon dioxide, depending on the specific PFC. Another area of concern regarding PFCs is their long
3 All GWPs are given as 100-year GWP. Unless noted otherwise, all GWPs were obtained from the Intergovernmental Panel on Climate Change. Climate Change 1995: The Science of Climate Change – Contribution of Working Group I to the Second Assessment Report of the IPCC. Cambridge (UK): Cambridge University Press, 1996.
4 US Environmental Protection Agency, Inventory of US Greenhouse Gas Emissions and Sinks 1990-2006 (EPA 430- R-08-005), (2008) 1-3.
5 California Energy Commission, Inventory of California Greenhouse Gas Emissions and Sinks 1990 to 2004, (2006).
6 US Environmental Protection Agency, “Methane: Sources and Emissions,” http://www.epa.gov/methane /sources.html. n.d.
Coachella General Plan Admin Draft EIR 5.7-2 February 2012
Impact Sciences, Inc. (1098.001)

5.7 Greenhouse Gases
atmospheric lifetime (up to 50,000 years).7 The GWPs of PFCs range from 5,700 to 11,900.
Sulfur Hexafluoride (SF6). Sulfur hexafluoride is a colorless, odorless, nontoxic, nonflammable gas. It is most commonly used as an electrical insulator in high voltage equipment that transmits and distributes electricity. Sulfur hexafluoride is the most potent GHG that has been evaluated by the IPCC with a GWP of 23,900. However, its global warming contribution is not as high as the GWP would indicate due to its low mixing ratio, as compared to carbon dioxide (4 parts per trillion [ppt] in 1990 versus 365 parts per million [ppm]).8
Contributions to Greenhouse Gas EmissionsGlobalWorldwide anthropogenic (man-made) GHG emissions are tracked for industrialized nations (referred to as Annex I) and developing nations (referred to as Non-Annex I). Man-made GHG emissions for Annex I nations are available through 2007. Man-made GHG emissions for Non-Annex I nations are available through 2005. The sum of these emissions totaled approximately 42,133 MMTCO2e.9 It should be noted that global emissions inventory data are not all from the same year and may vary depending on the source of the emissions inventory data.10 Emissions from the top five countries and the European Union accounted for approximately 55 percent of the total global GHG emissions, according to the most recently available data (see Table 6.24-2, Top GHG Producer Countries and the European Union). The GHG emissions in more recent years may differ from the inventories presented in Table 6.24-2; however, the data is representative of currently available inventory data.
7 US Department of Energy, Energy Information Administration, “Other Gases: Hydrofluorocarbons, Perfluorocarbons, and Sulfur Hexafluoride,” http://www.eia.doe.gov/oiaf/1605/gg00rpt/other_gases.html. n.d.
8 US Environmental Protection Agency, “High GWP Gases and Climate Change,” http://www.epa.gov/ highgwp/scientific.html#sf6. n.d.
9 The CO2 equivalent emissions commonly are expressed as “million metric tons of carbon dioxide equivalent (MMTCO2e).” The carbon dioxide equivalent for a gas is derived by multiplying the tons of the gas by the associated GWP, such that MMTCO2e = (million metric tons of a GHG) x (GWP of the GHG). For example, the GWP for methane is 21. This means that the emission of one million metric tons of methane is equivalent to the emission of 21 million metric tons of CO2.
10 The global emissions are the sum of Annex I and non-Annex I countries, without counting Land-Use, Land-Use Change and Forestry (LULUCF). For countries without 2005 data, the UNFCCC data for the most recent year were used. United Nations Framework Convention on Climate Change, “Annex I Parties – GHG total without LULUCF,” http://unfccc.int/ghg_emissions_data/ghg_data_from_unfccc/time_series_annex_i/items/3841.php and “Flexible GHG Data Queries” with selections for total GHG emissions excluding LULUCF/LUCF, all years, and non-Annex I countries, http://unfccc.int/di/FlexibleQueries/Event.do?event= showProjection. n.d.
Coachella General Plan Admin Draft EIR 5.7-3 February 2012
Impact Sciences, Inc. (1098.001)
5.7 Greenhouse Gases
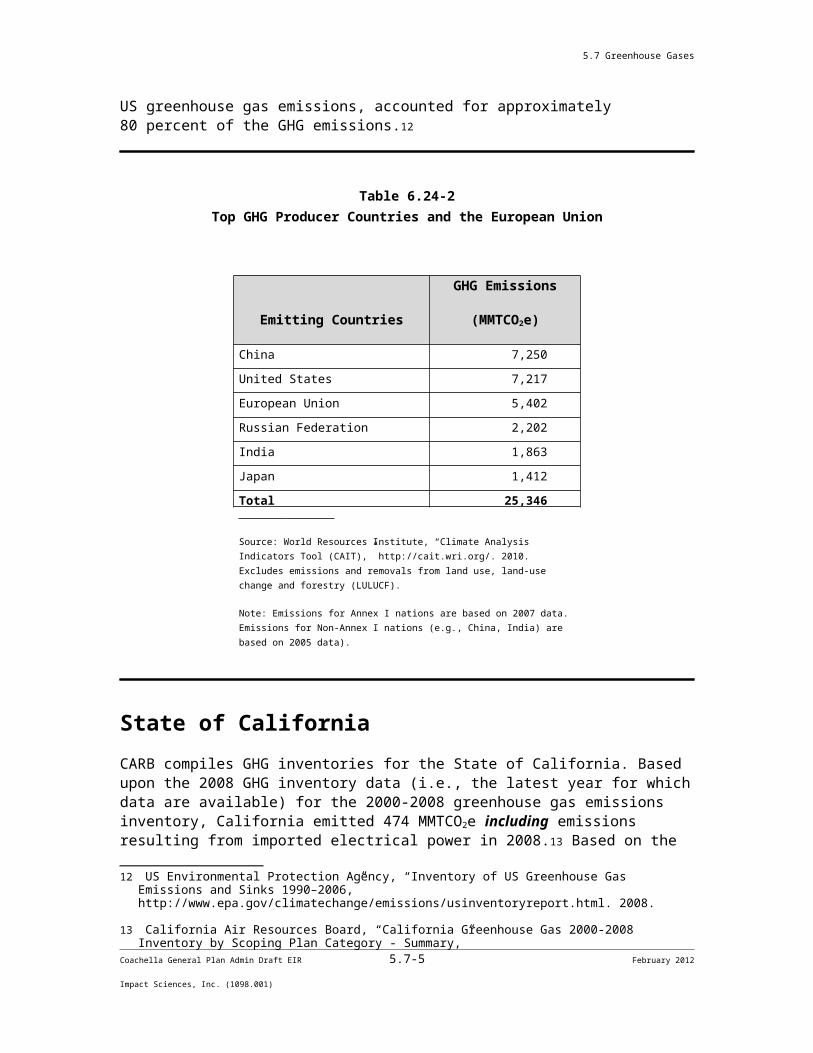
United StatesAs noted in Table 6.24-2, the United States was the number two producer of GHG emissions. The primary greenhouse gas emitted by human activities in the United States was CO2, representing approximately 84 percent of total greenhouse gas emissions.11 Carbon dioxide from fossil fuel combustion, the largest source of US greenhouse gas emissions, accounted for approximately 80 percent of the GHG emissions.12
Table 6.24-2Top GHG Producer Countries and the European Union
Emitting Countries
GHG Emissions
(MMTCO2e)
China 7,250
United States 7,217
European Union 5,402
Russian Federation 2,202
India 1,863
Japan 1,412
Total 25,346
Source: World Resources Institute, “Climate Analysis Indicators Tool (CAIT),” http://cait.wri.org/. 2010. Excludes emissions and removals from land use, land-use change and forestry (LULUCF).
Note: Emissions for Annex I nations are based on 2007 data. Emissions for Non-Annex I nations (e.g., China, India) are based on 2005 data).
State of CaliforniaCARB compiles GHG inventories for the State of California. Based upon the 2008 GHG inventory data (i.e., the latest year for which data are available) for the 2000-2008 greenhouse gas emissions inventory, California emitted 474 MMTCO2e including emissions resulting from imported electrical power in 2008.13 Based on the CARB inventory data and GHG inventories compiled by the World Resources Institute, California’s total statewide GHG emissions rank
11 US Environmental Protection Agency, “Inventory of US Greenhouse Gas Emissions and Sinks 1990–2006,” http://www.epa.gov/climatechange/emissions/usinventoryreport.html. 2008.
12 US Environmental Protection Agency, “Inventory of US Greenhouse Gas Emissions and Sinks 1990–2006,” http://www.epa.gov/climatechange/emissions/usinventoryreport.html. 2008.
Coachella General Plan Admin Draft EIR 5.7-4 February 2012
Impact Sciences, Inc. (1098.001)
5.7 Greenhouse Gases
second in the United States (Texas is number one) with emissions of 417 MMTCO2e excluding emissions related to imported power.14
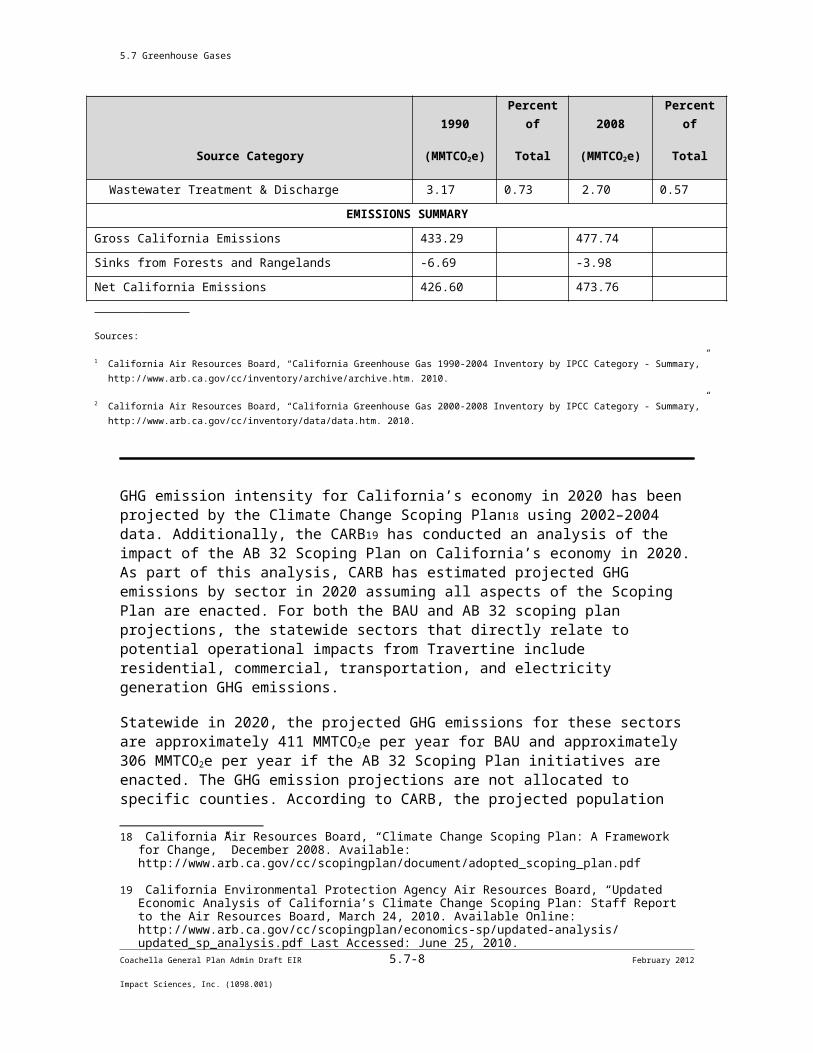
The primary contributors to GHG emissions in California are transportation, electric power production from both in-state and out-of-state sources, industry, agriculture and forestry, and other sources, which include commercial and residential activities. The bulk of the emissions from these sources are due to fossil fuel combustion. Table 6.24-3, GHG Emissions in California, provides a summary of GHG emissions reported in California in 1990 and 2008 separated by categories defined by the United Nations Intergovernmental Panel on Climate Change (IPCC).
Between 1990 and 2008, the population of California grew by approximately 7.3 million (from 29.8 to 37.9 million).15 This represents an increase of approximately 27.2 percent from 1990 population levels. In addition, the California economy, measured as gross state product, grew from $788 billon in 1990 to $1.8 trillion in 2008 representing an increase of approximately 128 percent (over twice the 1990 gross state product).16 Despite the population and economic growth, California’s net GHG emissions only grew by approximately 11 percent. The CEC attributes the slow rate of growth to the success of California’s renewable energy programs and its commitment to clean air and clean energy.17
Table 6.24-3GHG Emissions in California
Source Category
1990
(MMTCO2e)
Percent of
Total
2008
(MMTCO2e)
Percent of
Total
ENERGY 386.41 89.18 413.80 86.62Energy Industries 157.33 36.31 171.23 35.84
Manufacturing Industries & Construction 24.24 5.59 16.67 3.49
13 California Air Resources Board, “California Greenhouse Gas 2000-2008 Inventory by Scoping Plan Category - Summary,” http://www.arb.ca.gov/cc/inventory/data/data.htm. 2010.
14 Ibid.
15 US Census Bureau, “Data Finders,” http://www.census.gov/. 2009; California Department of Finance, “E-5 Population and Housing Estimates for Cities, Counties and the State, 2001-1008, with 2000 Benchmark,” http://www.dof.ca.gov/research/demographic/reports/estimates/e-5/2009/. 2010.
16 California Department of Finance, “Financial & Economic Data: Gross Domestic Product, California,” http://www.dof.ca.gov/HTML/FS_DATA/LatestEconData/FS_Misc.htm. 2010. Amounts are based on current dollars as of the data of the report (June 2, 2009).
17 California Energy Commission, Inventory of California Greenhouse Gas Emissions and Sinks 1990 to 2004, (2006).
Coachella General Plan Admin Draft EIR 5.7-5 February 2012
Impact Sciences, Inc. (1098.001)
5.7 Greenhouse Gases
Source Category
1990
(MMTCO2e)
Percent of
Total
2008
(MMTCO2e)
Percent of
Total
Transport 150.02 34.62 173.94 36.41
Other (Residential/Commercial/Institutional) 48.19 11.12 46.59 9.75
Non-Specified 1.38 0.32 0.00 0
Fugitive Emissions from Oil & Natural Gas 2.94 0.68 3.28 0.69
Fugitive Emissions from Other Energy Production 2.31 0.53 2.09 0.44
INDUSTRIAL PROCESSES & PRODUCT USE 18.34 4.23 30.11 6.3Mineral Industry 4.85 1.12 5.35 1.12
Chemical Industry 2.34 0.54 0.06 0.01
Non-Energy Products from Fuels & Solvent Use 2.29 0.53 1.97 0.41
Electronics Industry 0.59 0.14 0.80 0.17
Substitutes for Ozone Depleting Substances 0.04 0.01 13.89 2.91
Other Product Manufacture and Use 3.18 0.73 1.66 0.35
Other 5.05 1.17 6.39 1.34
AGRICULTURE, FORESTRY, & OTHER LAND USE 19.11 4.41 24.42 5.11
Livestock 11.67 2.69 16.28 3.41
Land 0.19 0.04 0.19 0.04
Aggregate Sources & Non-CO2 Sources on Land 7.26 1.68 7.95 1.66
WASTE 9.42 2.17 9.41 1.97Solid Waste Disposal 6.26 1.44 6.71 1.4
Wastewater Treatment & Discharge 3.17 0.73 2.70 0.57
EMISSIONS SUMMARYGross California Emissions 433.29 477.74
Sinks from Forests and Rangelands -6.69 -3.98
Net California Emissions 426.60 473.76
Sources:
1 California Air Resources Board, “California Greenhouse Gas 1990-2004 Inventory by IPCC Category - Summary,” http://www.arb.ca.gov/cc/inventory/archive/archive.htm. 2010.
2 California Air Resources Board, “California Greenhouse Gas 2000-2008 Inventory by IPCC Category - Summary,” http://www.arb.ca.gov/cc/inventory/data/data.htm. 2010.
Coachella General Plan Admin Draft EIR 5.7-6 February 2012
Impact Sciences, Inc. (1098.001)

5.7 Greenhouse Gases
GHG emission intensity for California’s economy in 2020 has been projected by the Climate Change Scoping Plan18 using 2002–2004 data. Additionally, the CARB19 has conducted an analysis of the impact of the AB 32 Scoping Plan on California’s economy in 2020. As part of this analysis, CARB has estimated projected GHG emissions by sector in 2020 assuming all aspects of the Scoping Plan are enacted. For both the BAU and AB 32 scoping plan projections, the statewide sectors that directly relate to potential operational impacts from Travertine include residential, commercial, transportation, and electricity generation GHG emissions.
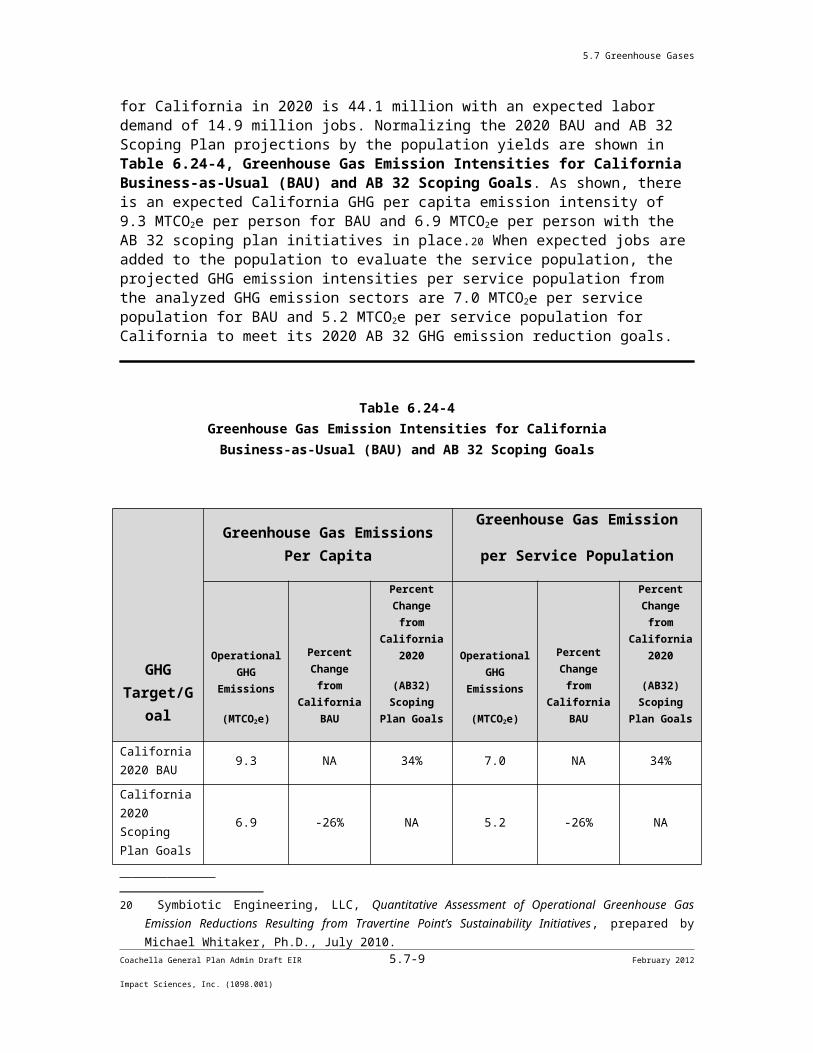
Statewide in 2020, the projected GHG emissions for these sectors are approximately 411 MMTCO2e per year for BAU and approximately 306 MMTCO2e per year if the AB 32 Scoping Plan initiatives are enacted. The GHG emission projections are not allocated to specific counties. According to CARB, the projected population for California in 2020 is 44.1 million with an expected labor demand of 14.9 million jobs. Normalizing the 2020 BAU and AB 32 Scoping Plan projections by the population yields are shown in Table 6.24-4, Greenhouse Gas Emission Intensities for California Business-as-Usual (BAU) and AB 32 Scoping Goals. As shown, there is an expected California GHG per capita emission intensity of 9.3 MTCO2e per person for BAU and 6.9 MTCO2e per person with the AB 32 scoping plan initiatives in place.20 When expected jobs are added to the population to evaluate the service population, the projected GHG emission intensities per service population from the analyzed GHG emission sectors are 7.0 MTCO2e per service population for BAU and 5.2 MTCO2e per service population for California to meet its 2020 AB 32 GHG emission reduction goals.
Table 6.24-4Greenhouse Gas Emission Intensities for CaliforniaBusiness-as-Usual (BAU) and AB 32 Scoping Goals
GHG Target/Goal Greenhouse Gas Emissions Per
Capita
Greenhouse Gas Emission
per Service Population
Operational GHG
Emissions
Percent Change
from California
Percent Change
from California
Operational GHG
Emissions
Percent Change
from California
BAU
Percent Change
from California
18 California Air Resources Board, “Climate Change Scoping Plan: A Framework for Change,” December 2008. Available: http://www.arb.ca.gov/cc/scopingplan/document/adopted_scoping_plan.pdf
19 California Environmental Protection Agency Air Resources Board, “Updated Economic Analysis of California’s Climate Change Scoping Plan: Staff Report to the Air Resources Board, March 24, 2010. Available Online: http://www.arb.ca.gov/cc/scopingplan/economics-sp/updated-analysis/updated_sp_analysis.pdf Last Accessed: June 25, 2010.
20 Symbiotic Engineering, LLC, Quantitative Assessment of Operational Greenhouse Gas Emission Reductions Resulting from Travertine Point’s Sustainability Initiatives, prepared by Michael Whitaker, Ph.D., July 2010.
Coachella General Plan Admin Draft EIR 5.7-7 February 2012
Impact Sciences, Inc. (1098.001)
5.7 Greenhouse Gases
(MTCO2e) BAU
2020
(AB32) Scoping
Plan Goals (MTCO2e)
2020
(AB32) Scoping
Plan Goals
California 2020 BAU 9.3 NA 34% 7.0 NA 34%
California 2020 Scoping Plan Goals
6.9 -26% NA 5.2 -26% NA
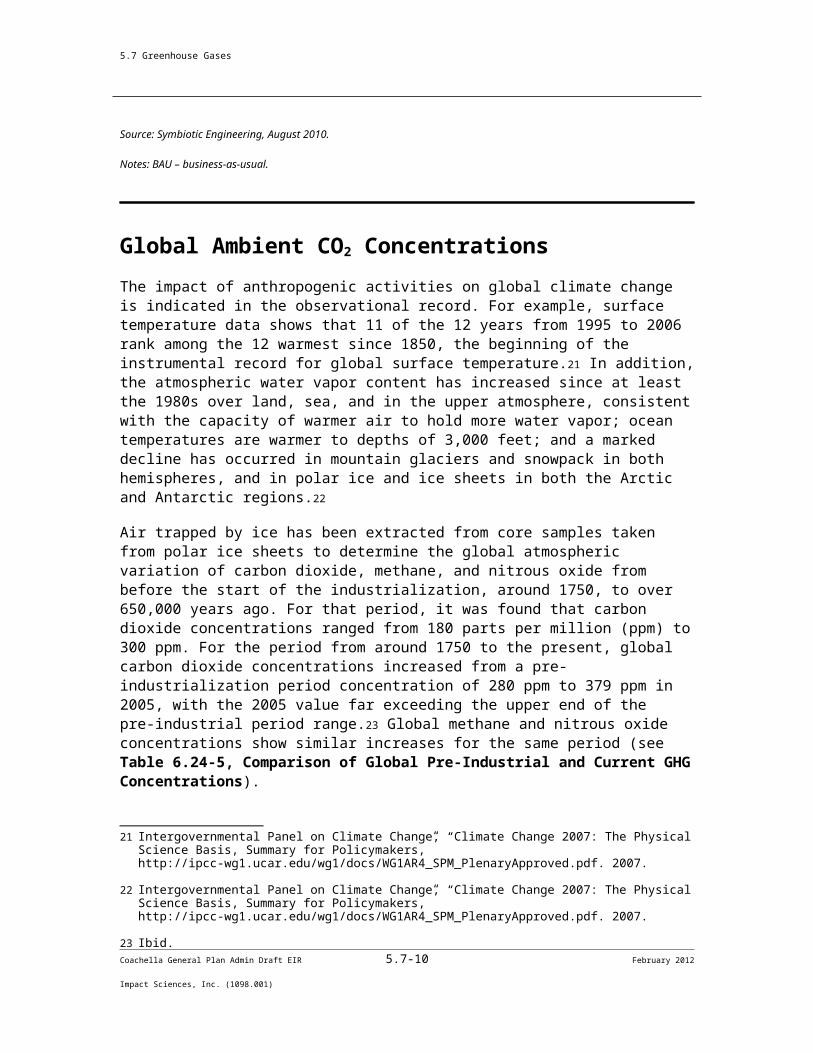
Source: Symbiotic Engineering, August 2010.
Notes: BAU – business-as-usual.
Global Ambient CO2 ConcentrationsThe impact of anthropogenic activities on global climate change is indicated in the observational record. For example, surface temperature data shows that 11 of the 12 years from 1995 to 2006 rank among the 12 warmest since 1850, the beginning of the instrumental record for global surface temperature.21 In addition, the atmospheric water vapor content has increased since at least the 1980s over land, sea, and in the upper atmosphere, consistent with the capacity of warmer air to hold more water vapor; ocean temperatures are warmer to depths of 3,000 feet; and a marked decline has occurred in mountain glaciers and snowpack in both hemispheres, and in polar ice and ice sheets in both the Arctic and Antarctic regions.22
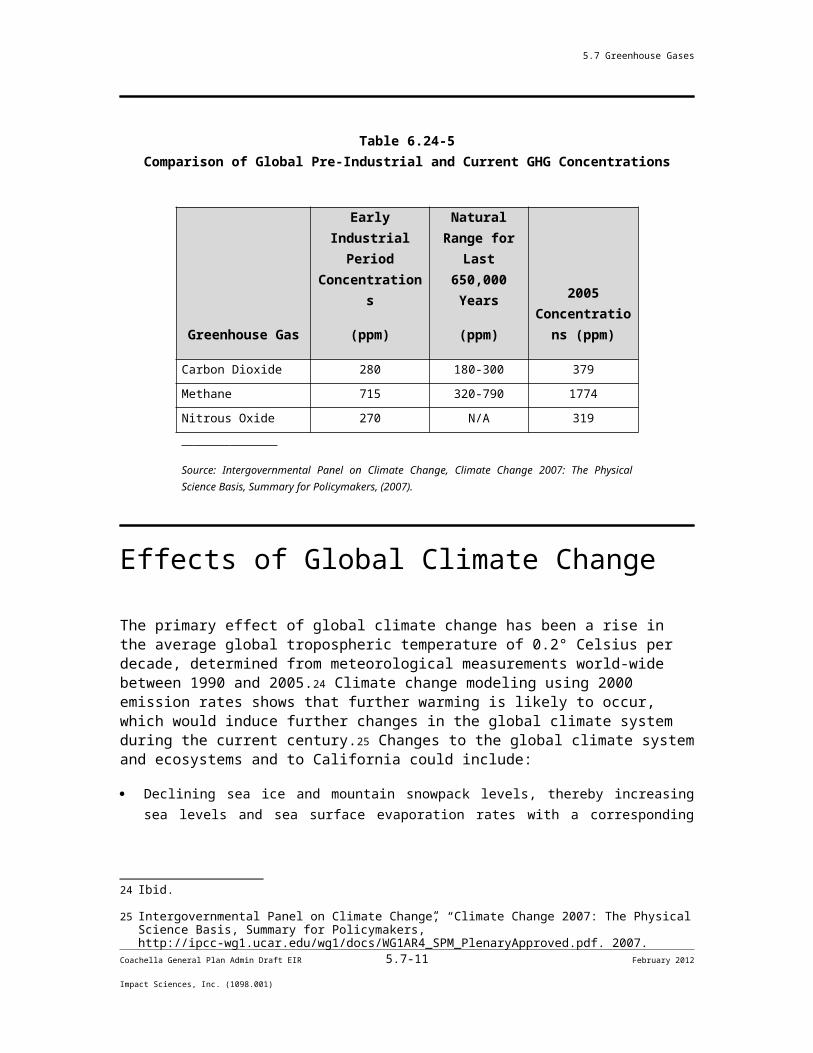
Air trapped by ice has been extracted from core samples taken from polar ice sheets to determine the global atmospheric variation of carbon dioxide, methane, and nitrous oxide from before the start of the industrialization, around 1750, to over 650,000 years ago. For that period, it was found that carbon dioxide concentrations ranged from 180 parts per million (ppm) to 300 ppm. For the period from around 1750 to the present, global carbon dioxide concentrations increased from a pre-industrialization period concentration of 280 ppm to 379 ppm in 2005, with the 2005 value far exceeding the upper end of the pre-industrial period range.23 Global methane and nitrous oxide concentrations show similar increases for the same period (see Table 6.24-5, Comparison of Global Pre-Industrial and Current GHG Concentrations).
21 Intergovernmental Panel on Climate Change, “Climate Change 2007: The Physical Science Basis, Summary for Policymakers,” http://ipcc-wg1.ucar.edu/wg1/docs/WG1AR4_SPM_PlenaryApproved.pdf. 2007.
22 Intergovernmental Panel on Climate Change, “Climate Change 2007: The Physical Science Basis, Summary for Policymakers,” http://ipcc-wg1.ucar.edu/wg1/docs/WG1AR4_SPM_PlenaryApproved.pdf. 2007.
23 Ibid.Coachella General Plan Admin Draft EIR 5.7-8 February 2012
Impact Sciences, Inc. (1098.001)
5.7 Greenhouse Gases
Table 6.24-5Comparison of Global Pre-Industrial and Current GHG Concentrations
Greenhouse Gas
Early Industrial
Period Concentration
s
(ppm)
Natural Range for
Last 650,000
Years
(ppm)
2005 Concentratio
ns (ppm)
Carbon Dioxide 280 180-300 379
Methane 715 320-790 1774
Nitrous Oxide 270 N/A 319
Source: Intergovernmental Panel on Climate Change, Climate Change 2007: The Physical Science Basis, Summary for Policymakers, (2007).
Effects of Global Climate Change
The primary effect of global climate change has been a rise in the average global tropospheric temperature of 0.2° Celsius per decade, determined from meteorological measurements world-wide between 1990 and 2005.24 Climate change modeling using 2000 emission rates shows that further warming is likely to occur, which would induce further changes in the global climate system during the current century.25 Changes to the global climate system and ecosystems and to California could include:
Declining sea ice and mountain snowpack levels, thereby increasing sea levels and sea surface evaporation rates with a corresponding increase in tropospheric water vapor due to the atmosphere’s ability to hold more water vapor at higher temperatures;26
Rising average global sea levels primarily due to thermal expansion and the melting of glaciers, ice caps, and the Greenland and Antarctic ice sheets;27
24 Ibid.
25 Intergovernmental Panel on Climate Change, “Climate Change 2007: The Physical Science Basis, Summary for Policymakers,” http://ipcc-wg1.ucar.edu/wg1/docs/WG1AR4_SPM_PlenaryApproved.pdf. 2007.
26 Ibid.
27 Ibid.Coachella General Plan Admin Draft EIR 5.7-9 February 2012
Impact Sciences, Inc. (1098.001)
5.7 Greenhouse Gases
Changing weather patterns, including changes to precipitation, ocean salinity, and wind patterns, and more energetic aspects of extreme weather including droughts, heavy precipitation, heat waves, extreme cold, and the intensity of tropical cyclones;28
Declining Sierra snowpack levels, which account for approximately half of the surface water storage in California, by 70 percent to as much as 90 percent over the next 100 years;29
Increasing the number of days conducive to ozone formation by 25 to 85 percent (depending on the future temperature scenario) in high ozone areas located in the Southern California area and the San Joaquin Valley by the end of the 21st
century;30
Increasing the potential for erosion of California’s coastlines and sea water intrusion into the Sacramento and San Joaquin Delta and associated levee systems due to the rise in sea level;31
Increasing pest infestation making California more susceptible to forest fires;32 and
Increasing the demand for electricity by 1 to 3 percent by 2020 due to rising temperatures resulting in hundreds of millions of dollars in extra expenditures.33
California Climate Adaptation Strategy
In 2009, the California Natural Resources Agency (CNRA) published the California Climate Adaptation Strategy34 as a response to the Governor’s Executive Order S-13-2008. The CNRA report lists specific recommendations for state and local agencies to best adapt to the anticipated risks posed by a changing climate. The Executive Summary contains a list of 12 key preliminary recommendations for adapting to a changing climate. The 12 recommendations are drawn from multiple strategies described within the sector specific and cross-sector adaptation strategy chapters of the CNRA report. Each Executive Summary recommendation lists the sector and recommendation number using the following acronyms to identify the sector: Public Health (PH),
28 Ibid.
29 California Environmental Protection Agency, Climate Action Team, Climate Action Team Report to Governor Schwarzenegger and the Legislature, (2006).
30 Ibid.
31 Ibid.
32 Ibid.
33 Ibid.
34 California Natural Resources Agency, Climate Action Team, 2009 California Climate Adaptation Strategy: A Report to the Governor of the State of California in Response to Executive Order S-13-2008, (2009).
Coachella General Plan Admin Draft EIR 5.7-10 February 2012
Impact Sciences, Inc. (1098.001)
5.7 Greenhouse Gases
Biodiversity and Habitat (BH), Ocean and Coastal Resources (OCR), Water Management (W), Agriculture (A), Forestry (F), Transportation and Energy Infrastructure (TEI), and Cross-Sector (CS). The key preliminary recommendations from the report are as follows:
1. A Climate Adaptation Advisory Panel (CAAP) will be appointed to assess the greatest risks to California from climate change and recommend strategies to reduce those risks building on California’s Climate Adaptation Strategy. This panel will be convened by the California Natural Resources Agency, in coordination with the Governor’s Climate Action Team, to complete a report by December 2010. The state will partner with the Pacific Council on International Policy to assemble this panel. A list of panel members can be found on the California adaptation Web site. (CS-1).
2. California must change its water management and uses because climate change will likely create greater competition for limited water supplies needed by the environment, agriculture, and cities. As directed by the recently signed water legislation (Senate Bill X71), state agencies must implement strategies to achieve a statewide 20 percent reduction in per capita water use by 2020, expand surface and groundwater storage, implement efforts to fix Delta water supply, quality, and ecosystem conditions, support agricultural water use efficiency, improve state-wide water quality, and improve Delta ecosystem conditions and stabilize water supplies as developed in the Bay Delta Conservation Plan. (BH-2, W-3, 6, and 7; A-1; TEI-3).
3. Consider project alternatives that avoid significant new development in areas that cannot be adequately protected (planning, permitting, development, and building) from flooding, wildfire and erosion due to climate change. The most risk-averse approach for minimizing the adverse effects of sea level rise and storm activities is to carefully consider new development within areas vulnerable to inundation and erosion. State agencies should generally not plan, develop, or build any new significant structure in a place where that structure will require significant protection from sea level rise, storm surges, or coastal erosion during the expected life of the structure. However, vulnerable shoreline areas containing existing development that have regionally significant economic, cultural, or social value may have to be protected, and in-fill development in these areas may be accommodated. State agencies should incorporate this policy into their decisions and other levels of government are also encouraged to do so. (CS-2; OCR-1 and 2; W-4 and 9; TEI -2 and 7).
4. All state agencies responsible for the management and regulation of public health, infrastructure or habitat subject to significant climate change should prepare as appropriate agency-specific adaptation plans, guidance, or criteria by September 2010. (PH-3 and 5; BH-1, 2, and 6; OCR-3; F-1 and 2; TEI-2 and 5).
5. To the extent required by CEQA Guidelines Section 15126.2, all significant state projects, including infrastructure projects, must consider the potential impacts of locating such projects in areas susceptible to hazards resulting from climate change. Section 15126.2 is currently being proposed for revision by CNRA to direct lead agencies to evaluate the
Coachella General Plan Admin Draft EIR 5.7-11 February 2012
Impact Sciences, Inc. (1098.001)

5.7 Greenhouse Gases
impacts of locating development in areas susceptible to hazardous conditions, including hazards potentially exacerbated by climate change. Locating state projects in such areas may require additional guidance that in part depends on planning tools that the CAS recommendations call for (see key recommendations 3, 6, 8, 9, and 10; BH-3; OCR-1; TEI-2).
6. The California Emergency Management Agency (Cal EMA) will collaborate with CNRA, the CAT, the Energy Commission, and the CAAP to assess California's vulnerability to climate change, identify impacts to state assets, and promote climate adaptation/mitigation awareness through the Hazard Mitigation Web Portal and My Hazards Website as well as other appropriate sites. The transportation sector CAWG, led by Caltrans, will specifically assess how transportation nodes are vulnerable and the type of information that will be necessary to assist response to district emergencies. Special attention will be paid to the most vulnerable communities impacted by climate change in all studies. (CS-3 and 4; PH-4 and 5; OCR-5; W-4; F-2 and 3; TEI-2, 5, 6 and 8).
7. Using existing research the state should identify key California land and aquatic habitats that could change significantly during this century due to climate change. Based on this identification, the state should develop a plan for expanding existing protected areas or altering land and water management practices to minimize adverse effects from climate change induced phenomena. (BH-1; W-5; F-5).
8. The best long-term strategy to avoid increased health impacts associated with climate change is to ensure communities are healthy to build resilience to increased spread of disease and temperature increases. The California Department of Public Health will develop guidance by September 2010 for use by local health departments and other agencies to assess mitigation and adaptation strategies, which include impacts on vulnerable populations and communities and assessment of cumulative health impacts. This includes assessments of land use, housing and transportation proposals that could impact health, GHG emissions, and community resilience for climate change, such as in the 2008 Senate Bill 375 regarding Sustainable Communities. (PH-3).
9. The most effective adaptation strategies relate to short and long-term decisions. Most of these decisions are the responsibility of local community planning entities. As a result, communities with General Plans and Local Coastal Plans should begin, when possible, to amend their plans to assess climate change impacts, identify areas most vulnerable to these impacts, and develop reasonable and rational risk reduction strategies using the CAS as guidance. Every effort will be made to provide tools, such as interactive climate impact maps, to assist in these efforts. (BH-1; OCR– 2 and 4; CS-2).
10. State fire fighting agencies should begin immediately to include climate change impact information into fire program planning to inform future planning efforts. Enhanced wildfire risk from climate change will likely increase public health and safety risks, property damage, fire suppression and emergency response costs to government, watershed and
Coachella General Plan Admin Draft EIR 5.7-12 February 2012
Impact Sciences, Inc. (1098.001)

5.7 Greenhouse Gases
water quality impacts, and vegetation conversions and habitat fragmentation. (PH-4 and 5; F-1; TEI-2).
11. State agencies should meet projected population growth and increased energy demand with greater energy conservation and an increased use of renewable energy. Renewable energy supplies should be enhanced through the Desert Renewable Energy Conservation Plan that will protect sensitive habitat that will while helping to reach the state goal of having 33 percent of California’s energy supply from renewable sources by 2020. (TEI-2).
12. Existing and planned climate change research can and should be used for state planning and public outreach purposes; new climate change impact research should be broadened and funded. By September 2010, the California Energy Commission will develop the CalAdapt Web site that will synthesize existing California climate change scenarios and climate impact research and to encourage its use in a way that is beneficial for local decision-makers. Every effort will be made to increase funding for climate change research, focusing on three areas: linkages with federal funding resources, developing Energy Commission -led vulnerability studies, and synthesizing the latest climate information into useable information for local needs through the CalAdapt tool. (CS-4; PH-7; BH-4; OCR-6; W-8, 9, and 10; A – 8; F-4 and 5; TEI-3 and 9).
The County of Riverside and the County of Imperial have not yet adopted specific policies based on the above recommendations as of the date of this writing.
APPLICABLE REGULATIONS
International Activities
Kyoto ProtocolThe original Kyoto Protocol was negotiated in December 1997 and came into force on February 16, 2005. For the Protocol to have entered into force, no less than 55 countries must have ratified the treaty and these minimum of 55 needed to together accounted for at least 55 percent of the total carbon dioxide emissions for 1990 of industrialized countries, referred to as Annex I countries. Participating nations are separated into Annex 1 (i.e., industrialized countries) and Non-Annex 1 (i.e., developing countries) countries, each with differing requirements for GHG reductions. The United States has not ratified the Protocol.
The goal of the protocol is to achieve overall emissions reduction targets for six primary GHGs by the period 2008 to 2012: carbon dioxide, methane, nitrous oxide, sulfur hexafluoride, HFCs, and PFCs. Each nation has an emissions reduction target under which they must reduce GHG
Coachella General Plan Admin Draft EIR 5.7-13 February 2012
Impact Sciences, Inc. (1098.001)

5.7 Greenhouse Gases
emissions by a certain percentage below levels that occurred in 1990 (e.g., 8 percent reduction for the European Union, 6 percent reduction for Japan). The average reduction target for nations participating in the Kyoto Protocol is approximately 5 percent below 1990 levels.35 Although the United States has not ratified the Protocol, it is aiming to reduce its GHG emissions intensity by 18 percent by 2012.36 Greenhouse gas intensity is the ratio of GHG emissions to economic output (i.e., gross domestic product). In addition, on July 8, 2008, President Bush, and other members of the Group of 8 (i.e., Japan; Germany; Britain; France; Italy; Canada; and Russia) pledged to cut current GHG emissions in half by 2050.
Intergovernmental Panel on Climate ChangeThe World Meteorological Organization (WMO) and United Nations Environmental Program (UNEP) established the Intergovernmental Panel on Climate Change (IPCC) in 1988. The goal of the IPCC is to evaluate the risk of climate change caused by human activities. Rather than performing research or monitoring climate, the IPCC relies on peer-reviewed and published scientific literature to make its assessment. The IPCC assesses information (i.e., scientific literature) regarding human-induced climate change, impacts of human-induced climate change, and options for adaptation and mitigation of climate change. The IPCC reports its evaluation through special reports called “assessment reports.” The latest assessment report (i.e., Fourth Assessment Report, consisting of three working group reports and a synthesis report based on the first three reports) was published in 2007.37 In its 2007 report, the IPCC stated that global temperature increases since the mid-20th century was “very likely” attributable to man-made activities (greater than 90 percent certainty).
Federal
There have been numerous federal actions over the past decade that have regulated greenhouse gases (GHG). The following is an overview of the most applicable regulations.
In Massachusetts v. EPA,38 the Supreme Court held that US EPA has the statutory authority the CAA39 to regulate GHGs from new motor vehicles. The Court did not hold that the US EPA was required to regulate GHG emissions; however, it indicated that the agency must decide whether GHGs from motor vehicles cause or contribute to air pollution that is reasonably anticipated to endanger public health or welfare. Upon the final decision, the President signed Executive Order
35 Pew Center on Global Climate Change. Bush Policy vs. Kyoto. http://www.pewclimate.org/what_s_being _done/in_the_world/bush_intensity_targe_2.cfm.
36 The White House. Addressing Global Climate Change. March 9, 2007. http://www.whitehouse.gov/ceq/global-change.html.
37 Intergovernmental Panel on Climate Change, Fourth Assessment Report, available online at http://www.ipcc.ch/.
38 Massachusetts v. EPA, 549 US at 526.
39 42 U.S.C. Section 7521(a)(1), Section 202(a)(1), Clean Air Act.Coachella General Plan Admin Draft EIR 5.7-14 February 2012
Impact Sciences, Inc. (1098.001)
5.7 Greenhouse Gases
13432 directing the US EPA, along with the Departments of Transportation, Energy, and Agriculture, to initiate a regulatory process that responds to the Supreme Court’s decision.40
In December 2007, the President signed the Energy Independence and Security Act of 2007,41 which sets a mandatory Renewable Fuel Standard requiring fuel producers to use at least 36 billion gallons of biofuel in 2022 and sets a national fuel economy standard of 35 miles per gallon by 2020. The Act also contains provisions for energy efficiency in lighting and appliances and for the implementation of green building technologies in Federal buildings.
On July 11, 2008, the US EPA issued an Advance Notice of Proposed Rulemaking on regulating GHGs under the CAA. The Advance Notice of Proposed Rulemaking reviews the various CAA provisions that may be applicable to the regulation of GHGs and presents potential regulatory approaches and technologies for reducing GHG emissions. In the Advance Notice of Proposed Rulemaking, the US EPA seeks further public comment on the regulation of GHG emissions under the CAA.42
The US EPA adopted a mandatory GHG reporting rule in September 2009. The rule requires suppliers of fossil fuels or industrial greenhouse gases, manufacturers of vehicles and engines, and facilities that emit 25,000 metric tons or more per year of GHG emissions to submit annual reports to the US EPA beginning in 2011 (covering the 2010 calendar year emission). Vehicle and engine manufacturers would begin reporting GHG emissions for model year 2011.
On September 15, 2009, the US EPA and the Department of Transportation’s (DOT) National Highway Traffic Safety Administration (NHTSA) issued a joint proposal to establish a national program consisting of new standards for model year 2012 through 2016 light-duty vehicles that will reduce GHG emissions and improve fuel economy. The proposed standards would be phased in and would require passenger cars and light-duty trucks to comply with a declining emission standard. In 2012, passenger cars and light-duty trucks would have to meet an average emission standard of 295 grams of CO2 per mile and 30.1 miles per gallon.43 By 2016, the vehicles would have to meet a standard of 250 grams of CO2 per mile and 35.5 miles per gallon.44
On December 7, 2009, the US EPA Administrator signed two distinct findings regarding GHGs under section 202(a) of the Clean Air Act:
40 Federal Register (72 FR 27717), May 16, 2007, Executive Order 13432, Cooperation Among Agencies in Protecting the Environment With Respect to Greenhouse Gas Emissions From Motor Vehicles, Nonroad Vehicles, and Nonroad Engines.
41 The Energy Independence and Security Act of 2007 (Pub.L. 110-140, originally named the Clean Energy Act of 2007).
42 US Environmental Protection Agency, “Advance Notice of Proposed Rulemaking: Regulating Greenhouse Gas Emissions under the Clean Air Act,” http://www.epa.gov/climatechange/anpr.html. 2008.
43 US Environmental Protection Agency, “EPA and NHTSA Propose Historic National Program to Reduce Greenhouse Gases and Improve Fuel Economy for Cars and Trucks,” http://epa.gov/otaq /climate/regulations/420f09047a.htm. 2009.
44 Ibid.Coachella General Plan Admin Draft EIR 5.7-15 February 2012
Impact Sciences, Inc. (1098.001)

5.7 Greenhouse Gases
Endangerment Finding: The Administrator finds that the current and projected concentrations of the six key well-mixed GHGs (carbon dioxide, methane, nitrous oxide, hydrofluorocarbons, perfluorocarbons, and sulfur hexafluoride) in the atmosphere threaten the public health and welfare of current and future generations.
Cause or Contribute Finding: The Administrator finds that the combined emissions of these well-mixed greenhouse gases from new motor vehicles and new motor vehicle engines contribute to the greenhouse gas pollution which threatens public health and welfare.
While these findings do not impose any requirements on industry or other entities, this action is a prerequisite to finalizing the US EPA’s proposed greenhouse gas emission standards for light-duty vehicles, which were jointly proposed by the US EPA and the NHSTA. On April 1, 2012, the US EPA and NHTSA issued final rules requiring that by the 2016 model-year, manufacturers must achieve a combined average vehicle emission level of 250 grams of CO2 per mile, which is equivalent to 35.5 miles per gallon as measured by US EPA standards.
California
Title 24 Building Standards CodeThe California Energy Commission (CEC) first adopted Energy Efficiency Standards for Residential and Nonresidential Buildings (California Code of Regulations, Title 24, Part 6) in 1978 in response to a legislative mandate to reduce energy consumption in the state. Although not originally intended to reduce GHG emissions, increased energy efficiency, and reduced consumption of electricity, natural gas, and other fuels would result in fewer GHG emissions from residential and nonresidential buildings subject to the standard. The standards are updated periodically to allow for the consideration and inclusion of new energy efficiency technologies and methods. The latest revisions were adopted in 2008 and became effective on January 1, 2010.
Part 11 of the Title 24 Building Standards Code is referred to as the California Green Building Standards Code (CALGreen Code). The purpose of the CALGreen Code is to “improve public health, safety and general welfare by enhancing the design and construction of buildings through the use of building concepts having a positive environmental impact and encouraging sustainable construction practices in the following categories: (1) Planning and design; (2) Energy efficiency; (3) Water efficiency and conservation; (4) Material conservation and resource efficiency; and (5) Environmental air quality.”45 The CALGreen Code is not intended to substitute or be identified as meeting the certification requirements of any green building program that is not established and adopted by the California Building Standards Commission (CBSC). The CBSC has released a 2010 Draft California Green Building Standards Code on its Web site.46 It is anticipated that this
45 California Building Standards Commission, 2008 California Green Building Standards Code, (2009) 3.
46 Ibid., “CALGreen,” http://www.bsc.ca.gov/CALGreen/default.htm. 2010.Coachella General Plan Admin Draft EIR 5.7-16 February 2012
Impact Sciences, Inc. (1098.001)
5.7 Greenhouse Gases
update to Part 11 of the Title 24 Building Standards Code will be effective on January 1, 2011. Unless otherwise noted in the regulation, all newly constructed buildings in California are subject of the requirements of the CALGreen Code.
Assembly Bill 1493In response to the transportation sector's contribution of more than half of California’s CO2 emissions, Assembly Bill 1493 (AB 1493, Pavley) was enacted on July 22, 2002. AB 1493 requires CARB to set GHG emission standards for passenger vehicles, light-duty trucks, and other vehicles whose primary use is noncommercial personal transportation. The bill requires CARB to set the GHG emission standards for motor vehicles manufactured in 2009 and all subsequent model years. In setting these standards, CARB is required to consider cost-effectiveness, technological feasibility, economic impacts, and provide maximum flexibility to manufacturers. CARB adopted the statutorily mandated standards in September 2004. If fully phased in, the near-term (2009–2012) standards would result in about a 22 percent reduction in greenhouse gas emissions compared to the emissions from the 2002 fleet, while the mid-term (2013–2016) standards would result in a reduction of about 30 percent.
In December 2004, these regulations were challenged in federal court by the Alliance of Automobile Manufacturers, who claimed that the law regulated vehicle fuel economy, a duty assigned to the federal government. In December 2007, after the US Supreme Court’s decision in Massachusetts v. EPA, the US District Court for the Eastern District dismissed the case against the AB 1493 regulations by the Alliance of Automobile Manufacturers.
However, before these regulations may go into effect, the US EPA must grant California a waiver under the federal CAA, which ordinarily preempts state regulation of motor vehicle emission standards. On June 30, 2009, the US EPA formally approved California’s waiver request. However, in light of the September 15, 2009, announcement by the US EPA and NHTSA regarding the national program to reduce vehicle GHG emissions, California—and states adopting California emissions standards—have agreed to defer to the proposed national standard through model year 2016 if granted a waiver by the US EPA. The 2016 endpoint of the two standards is similar, although the national standard ramps up slightly more slowly than required under the California standard. The Pavley standards require additional reductions in CO2 emissions beyond 2016 (referred to as Phase II standards). Nonetheless, California and other states adopting the California standards will not toughen standards beyond the proposed national standard until at least the 2017 model year.
Renewables Portfolio StandardIn 2002, Senate Bill 1078 (SB 1078, Sher) established California’s Renewable Portfolio Standard (RPS) which requires investor-owned utilities, such as Pacific Gas and Electric, Southern California Edison, and San Diego Gas and Electric, to increase energy production from renewable sources from 1 percent per year up to a minimum of 20 percent of total energy generation by 2017. SB 107 (Simitian), signed by the Governor on September 26, 2008, accelerated the
Coachella General Plan Admin Draft EIR 5.7-17 February 2012
Impact Sciences, Inc. (1098.001)

5.7 Greenhouse Gases
Renewable Portfolio Standard by requiring investor-owned utilities to meet the 20 percent target by 2010.
On September 15, 2009, the Governor issued Executive Order S-21-0911 requiring CARB, under its AB 32 authority, to adopt regulations to meet a 33 percent RPS target by 2020. The CARB regulations would use a phased-in or tiered requirement to increase the amount of electricity from eligible renewable sources over an eight year period beginning in 2012. CARB adopted the regulation in September 2010.
Executive Order S-3-05 and the Climate Action TeamIn June 2005, the Governor established California’s GHG emissions reduction targets in Executive Order S-3-05. The Executive Order established the following goals: GHG emissions should be reduced to 2000 levels by 2010, 1990 levels by 2020, and 80 percent below 1990 levels by 2050. The Secretary of California Environmental Protection Agency (CalEPA) is required to coordinate efforts of various agencies in order to collectively and efficiently reduce GHGs. Some of the agency representatives involved in the GHG reduction plan include the Secretary of the Business, Transportation and Housing Agency, the Secretary of the Department of Food and Agriculture, the Secretary of the Resources Agency, the Chairperson of CARB, the Chairperson of the CEC, and the President of the Public Utilities Commission. Representatives from these agencies comprise the Climate Action Team.
Climate Action TeamThe Climate Action Team is responsible for implementing global warming emissions reduction programs. The CalEPA secretary is required to submit a biannual progress report from the Climate Action Team to the governor and state legislature disclosing the progress made toward GHG emission reduction targets and the impacts of global warming on California’s water supply, public health, agriculture, the coastline, and forestry, and reporting possible mitigation and adaptation plans to combat these impacts.
Climate Action Team ReportThe first report was developed in 2006. The 2006 Climate Action Team Report (2006 CAT Report) identified key measures that will help ensure that California will meet the GHG reduction goals established under the Governor’s Executive Order S-3-05 (1990 levels by 2020 and 80 percent below 1990 levels by 2050). These key measures include establishing a market-based carbon trading system, mandatory GHG reporting for large emitters, production of alternative transportation fuels, energy efficiency and renewable portfolio standards for utilities, emission reporting protocols for local governments, establishing a public goods charge for transportation that funds key strategies to reduce climate change emissions, and leveraging California’s universities to train the next generation of workers needed to service new technologies. Minor changes to some of the recommendations in the 2006 CAT Report were issued by the Climate
Coachella General Plan Admin Draft EIR 5.7-18 February 2012
Impact Sciences, Inc. (1098.001)
5.7 Greenhouse Gases
Action Team in the Updated Macroeconomic Analysis of Climate Strategies Presented in the March 2006 Climate Action Team Report (2007 Update).47
The 2009 CAT Report provides more detailed information regarding sector-based impacts from climate change, such impacts to agriculture, forestry, water resources, coastal areas, energy, air quality, and public health. The 2009 CAT report also provides more information on economic impacts on these sectors from climate change. Lastly, the report discussed adaptation strategies for these sectors to avoid or mitigate the potential adverse impacts. The Climate Action Team reports are available for review on the California Climate Change Portal.48
The Climate Action Team recognizes some strategies that are currently being implemented by state agencies such as CARB introducing vehicle climate change standards and diesel anti-idling measures, the Energy Commission implementing building and appliance efficiency standards, and the CalEPA implementing its green building initiative. The Climate Action Team also recommends future emission reduction strategies, such as using only low-GWP refrigerants in new vehicles, developing ethanol as an alternative fuel, reforestation, solar power initiatives for homes and businesses, and investor-owned utility energy efficiency programs. According to the report, implementation of current and future emission reduction strategies have the potential to achieve the goals set forth in Executive Order S-3-05.
Assembly Bill 32In furtherance of the goals established in Executive Order S-3-05, the Legislature enacted Assembly Bill 32 (AB 32, Nuñez and Pavley), the California Global Warming Solutions Act of 2006, which Governor Schwarzenegger signed on September 27, 2006. AB 32 represents the first enforceable statewide program to limit GHG emissions from all major industries with penalties for noncompliance. AB 32 requires the State to undertake several actions – the major requirements are discussed below:
CARB Early Action MeasuresCARB is responsible for carrying out and developing the programs and requirements necessary to achieve the goals of AB 32—the reduction of California's GHG emissions to 1990 levels by 2020. The first action under AB 32 resulted in CARB's adoption of three (3) early action greenhouse gas emission reduction measures on June 21, 2007. On October 25, 2007, CARB approved an additional six early-action GHG reduction measures under AB 32. CARB has adopted regulations for all early action measures. The early action measures are divided into three categories:
47 California Climate Action Team, Updated Macroeconomic Analysis of Climate Strategies Presented in the March 2006 Climate Action Team Report, (2007).
48 The California Climate Change Portal website is available at the following Web site: http://www.climatechange .ca.gov/publications/cat/.
Coachella General Plan Admin Draft EIR 5.7-19 February 2012
Impact Sciences, Inc. (1098.001)
5.7 Greenhouse Gases
Group 1 - GHG rules for immediate adoption and implementation;
Group 2 - Several additional GHG measures under development; and
Group 3 - Air pollution controls with potential climate co-benefits.
The original three adopted early-action regulations meeting the narrow legal definition of “discrete early action GHG reduction measures” include:
a low-carbon fuel standard to reduce the “carbon intensity” of California fuels;
the reduction of refrigerant losses from motor vehicle air conditioning system maintenance to restrict the sale of ”do-it-yourself” automotive refrigerants; and
increased methane capture from landfills to require broader use of state-of-the-art methane capture technologies.
The additional six early-action regulations adopted on October 25, 2007, also meeting the narrow legal definition of “discrete early action GHG reduction measures,” include:
the reduction of aerodynamic drag, and thereby fuel consumption, from existing trucks and trailers through retrofit technology;
the reduction of auxiliary engine emissions of docked ships by requiring port electrification;
the reduction of perfluorocarbons from the semiconductor industry;
the reduction of propellants in consumer products (e.g., aerosols, tire inflators, and dust removal products);
the requirement that all tune-up, smog check and oil change mechanics ensure proper tire inflation as part of overall service in order to maintain fuel efficiency; and
the restriction on the use of sulfur hexafluoride from non-electricity sectors if viable alternatives are available.
State of California 1990 Greenhouse Gas Inventory and 2020 LimitAs required under AB 32, on December 6, 2007, CARB approved the 1990 greenhouse gas emissions inventory, thereby establishing the emissions limit for 2020. The 2020 emissions limit was set at 427 million metric tons of carbon dioxide equivalent (MMTCO2e). CARB also projected the state’s 2020 GHG emissions under “business as usual” (BAU) conditions—that is, emissions that would occur without any plans, policies, or regulations to reduce GHG emissions. CARB used an average of the state’s GHG emissions from 2002 through 2004 and projected the Coachella General Plan Admin Draft EIR 5.7-20 February 2012
Impact Sciences, Inc. (1098.001)

5.7 Greenhouse Gases
2020 levels based on population and economic forecasts. The projected net emissions totaled approximately 596 MMTCO2e. Therefore, the state must reduce its 2020 BAU emissions by approximately 29 percent in order to meet the 1990 target.
The inventory revealed that in 1990, transportation, with 35 percent of the state's total emissions, was the largest single sector, followed by industrial emissions, 24 percent; imported electricity, 14 percent; in-state electricity generation, 11 percent; residential use, 7 percent; agriculture, 5 percent; and commercial uses, 3 percent. AB 32 does not require individual sectors to meet their individual 1990 GHG emissions inventory; the total statewide emissions are required to meet the 1990 threshold by 2020.
CARB Mandatory Reporting RequirementsIn addition to the 1990 emissions inventory, CARB also adopted regulations requiring the mandatory reporting of GHG emissions for large facilities on December 6, 2007. The mandatory reporting regulations require annual reporting from the largest facilities in the state, which account for approximately 94 percent of GHG emissions from industrial and commercial stationary sources in California. About 800 separate sources fall under the new reporting rules and include electricity generating facilities, electricity retail providers and power marketers, oil refineries, hydrogen plants, cement plants, cogeneration facilities, and industrial sources that emit over 25,000 tons of carbon dioxide each year from on-site stationary combustion sources. Transportation sources, which account for 38 percent of California’s total greenhouse gas emissions, are not covered by these regulations but will continue to be tracked through existing means. Affected facilities will begin tracking their emissions in 2008, to be reported beginning in 2009 with a phase-in process to allow facilities to develop reporting systems and train personnel in data collection. Emissions for 2008 may be based on best available emission data. Beginning in 2010, however, emissions reporting requirements will be more rigorous and will be subject to third-party verification. Verification will take place annually or every three years, depending on the type of facility.
AB 32 Climate Change Scoping PlanAs indicated above, AB 32 requires CARB to adopt a scoping plan indicating how reductions in significant GHG sources will be achieved through regulations, market mechanisms, and other actions. After receiving public input on their discussion draft of the proposed Scoping Plan released in June 2008, CARB released the Climate Change Proposed Scoping Plan in October 2008 that contains an outline of the proposed state strategies to achieve the 2020 greenhouse gas emission limits. The CARB Governing Board approved the Scoping Plan on December 11, 2008. Key elements of the Scoping Plan include the following recommendations:
Expanding and strengthening existing energy efficiency programs as well as building and appliance standards.
Achieving a statewide renewable energy mix of 33 percent.
Coachella General Plan Admin Draft EIR 5.7-21 February 2012
Impact Sciences, Inc. (1098.001)
5.7 Greenhouse Gases
Developing a California cap-and-trade program that links with other Western Climate Initiative partner programs to create a regional market system.
Establishing targets for transportation-related greenhouse gas emissions for regions throughout California and pursuing policies and incentives to achieve those targets.
Adopting and implementing measures pursuant to existing state laws and policies, including California’s clean car standards, goods movement measures, and the Low Carbon Fuel Standard.
Creating targeted fees, including a public goods charge on water use, fees on high global warming potential gases, and a fee to fund the administrative costs of the state’s long-term commitment to AB 32 implementation.
Under the Scoping Plan, approximately 85 percent of the state’s emissions are subject to a cap-and-trade program where covered sectors are placed under a declining emissions cap. The emissions cap incorporates a margin of safety whereas the 2020 emissions limit will still be achieved even in the event that uncapped sectors do not fully meet their anticipated emission reductions. Emissions reductions will be achieved through regulatory requirements and the option to reduce emissions further or purchase allowances to cover compliance obligations. It is expected that emission reduction from this cap-and-trade program will account for a large portion of the reductions required by AB 32.
Table 6.24-1, AB 32 Scoping Plan Measures, lists CARB’s preliminary recommendations for achieving greenhouse gas reductions under AB 32 along with a brief description of the requirements and applicability.
Senate Bill 97In August 2007, the legislature enacted SB 97 (Dutton), which directed the Governor’s Office of Planning and Research (OPR) to develop guidelines under CEQA for the mitigation of greenhouse gas emissions. A number of actions have taken place under SB 97, which are discussed below.
OPR Climate Change Technical AdvisoryOn June 19, 2008, OPR issued a technical advisory as interim guidance regarding the analysis of GHG emissions in CEQA documents.49 The advisory indicated that a project’s GHG emissions, including those associated with vehicular traffic, and construction activities, should be identified and estimated. The advisory further recommended that the lead agency determine significance of the impacts and impose all mitigation measures that are necessary to reduce GHG emissions to a less than significant level. The advisory did not recommend a specific threshold of significance.
49 State of California, Governor’s Office of Planning and Research, CEQA and Climate Change: Addressing Climate Change Through California Environmental Quality Act (CEQA) Review, (2008).
Coachella General Plan Admin Draft EIR 5.7-22 February 2012
Impact Sciences, Inc. (1098.001)
5.7 Greenhouse Gases
CEQA Guideline AmendmentsIn its work to formulate CEQA Guideline Amendments for GHG emissions, OPR submitted the Proposed Draft CEQA Guideline Amendments for Greenhouse Gas Emissions to the Secretary for Natural Resources on April 13, 2009. The Natural Resources Agency conducted formal rulemaking procedures in 2009 and adopted the CEQA Guideline Amendments on December 30, 2009.
Table 6.24-1AB 32 Scoping Plan Measures
Scoping Plan Measure Description
SPM-1: California Cap-and-Trade Program linked to Western Climate Initiative
Implement a broad-based cap-and-trade program that links with other Western Climate Initiative Partner programs to create a regional market system. Ensure California’s program meets all applicable AB 32 requirements for market-based mechanisms. Capped sectors include transportation, electricity, natural gas, and industry. Projected 2020 business-as-usual emissions are estimated at 512 MTCO2e; preliminary 2020 emissions limit under cap-and-trade program are estimated at 365 MTCO2e (29 percent reduction).
SPM-2: California Light-Duty Vehicle GHG Standards
Implement adopted Pavley standards and planned second phase of the program. AB 32 states that if the Pavley standards (AB 1493) do not remain in effect, CARB shall implement equivalent or greater alternative regulations to control mobile sources.
SPM-3: Energy Efficiency
Maximize energy efficiency building and appliance standards, and pursue additional efficiency efforts. The proposed Scoping Plan considers green building standards as a framework to achieve reductions in other sectors, such as electricity.
SPM-4: Renewables Portfolio Standard
Achieve 33 percent Renewable Portfolio Standard by both investor-owned and publicly owned utilities.
SPM-5: Low Carbon Fuel Standard
CARB identified the Low Carbon Fuel Standard as a Discrete Early Action item and the final regulation was adopted on April 23, 2009. In January 2007, Governor Schwarzenegger issued Executive Order S-1-07, which called the reduction of the carbon intensity of California's transportation fuels by at least 10 percent by 2020.
SPM-6: Regional Transportation-Related Greenhouse Gas Targets
Develop regional greenhouse gas emissions reduction targets for passenger vehicles. SB 375 requires CARB to develop, in consultation with metropolitan planning organizations, passenger vehicle greenhouse gas emissions reduction targets for 2020 and 2035 by September 30, 2010. SB 375 requires metropolitan planning organizations to prepare a sustainable communities strategy to reach the regional target provided by CARB.
Coachella General Plan Admin Draft EIR 5.7-23 February 2012
Impact Sciences, Inc. (1098.001)

5.7 Greenhouse Gases
Scoping Plan Measure Description
SPM-7: Vehicle Efficiency Measures
Implement light-duty vehicle efficiency measures. CARB is pursuing fuel-efficient tire standards and measures to ensure properly inflated tires during vehicle servicing.
SPM-8: Goods Movement
Implement adopted regulations for port drayage trucks and the use of shore power for ships at berth. Improve efficiency in goods movement operations.
SPM-9: Million Solar Roofs Program
Install 3,000 megawatts of solar-electric capacity under California’s existing solar programs.
SPM-10: Heavy/Medium-Duty Vehicles
Adopt heavy- and medium-duty vehicle and engine measures. Measures targeting aerodynamic efficiency, vehicle hybridization, and engine efficiency are recommended.
SPM-11: Industrial Emissions
Require assessment of large industrial sources to determine whether individual sources within a facility can cost-effectively reduce greenhouse gas emissions and provide other pollution reduction co-benefits. Reduce greenhouse gas emissions from fugitive emissions from oil and gas extraction and gas transmission. Adopt and implement regulations to control fugitive methane emissions and reduce flaring at refineries.
SPM-12: High Speed Rail
Support implementation of a high-speed rail system. This measure supports implementation of plans to construct and operate a high-speed rail system between Northern and Southern California serving major metropolitan centers.
SPM-13: Green Building Strategy
Expand the use of green building practices to reduce the carbon footprint of California’s new and existing inventory of buildings.
SPM-14: High Global Warming Potential Gases
Adopt measures to reduce high global warming potential gases. The proposed Scoping Plan contains 6 measures to reduce high global warming potential gases from mobile sources, consumer products, stationary sources, and semiconductor manufacturing.
SPM-15: Recycling and Waste
Reduce methane emissions at landfills. Increase waste diversion, composting, and commercial recycling. Move toward zero-waste.
SPM-16: Sustainable Forests
Preserve forest sequestration and encourage the use of forest biomass for sustainable energy generation. The federal government and California’s Board of Forestry and Fire Protection has the regulatory authority to implement the Forest Practice Act to provide for sustainable management practices. This measure is expected to play a greater role in the 2050 goals.
SPM-17: Water Continue efficiency programs and use cleaner energy sources to move water. California will also establish a public goods charge for funding investments in water efficiency that will lead to as yet undetermined reductions in greenhouse gases.
SPM-18: Agriculture
In the near-term, encourage investment in manure digesters and at the five-year Scoping Plan update determine if the program should be made mandatory by 2020. Increase efficiency and encourage use of agricultural biomass for sustainable energy production. CARB has begun research on nitrogen fertilizers and will explore opportunities for emission reductions.
Coachella General Plan Admin Draft EIR 5.7-24 February 2012
Impact Sciences, Inc. (1098.001)
5.7 Greenhouse Gases
Scoping Plan Measure Description
Source: California Air Resources Board, Climate Change Scoping Plan, (2008).
Senate Bill 375The California Legislature passed Senate Bill 375 (SB 375) on September 1, 2008, and SB 375 was signed by Governor Schwarzenegger and chaptered into law on September 30, 2008. SB 375 requires CARB, working in consultation with the metropolitan planning organizations (MPOs), to set regional greenhouse gas reduction targets for the automobile and light truck sector for 2020 and 2035. CARB must provide each MPO with its reduction target by September 30, 2010. The target must then be incorporated within that region’s Regional Transportation Plan (RTP), which is used for long-term transportation planning, in a Sustainable Communities Strategy (SCS). Certain transportation planning and programming activities would then need to be consistent with the SCS; however, SB 375 expressly provides that the SCS does not regulate the use of land, and further provides that local land use plans and policies (e.g., general plan) are not required to be consistent with either the RTP or SCS.
SB 375 also includes CEQA streamlining provisions for “transit priority projects,” so long as the projects are consistent with the SCS. As defined in SB 375, a “transit priority project” shall (1) contain at least 50 percent residential use, based on total building square footage and, if the project contains between 26 and 50 percent nonresidential uses, a floor area ratio of not less than 0.75; (2) provide a maximum net density of at least 20 dwelling units per acre; and (3) be within 0.5 mile of a major transit stop or high quality transit corridor.
California Climate Action Registry, The Climate Action Reserve, and The Climate RegistryThe California Climate Action Registry (CCAR) is a private non-profit organization formed by the State of California that serves as a voluntary GHG registry to protect and promote early actions to reduce GHG emissions by organizations. Senate Bill 1771 (SB 1771, Sher) formally established the CCAR with technical changes made to the statute in SB 527, which finalized the structure of the CCAR. The CCAR began with 23 charter members and currently has over 300 corporations, universities, cities and counties, government agencies and environment organizations voluntarily measuring, monitoring, and publicly reporting their GHG emissions using the CCAR protocols. The CCAR has published a General Reporting Protocol, as well as project- and industry-specific protocols for landfill activities, livestock activities, the cement sector, the power/utility sector, and the forest sector. The protocols provide the principles, approach, methodology, and procedures required for participation in the CCAR.
Coachella General Plan Admin Draft EIR 5.7-25 February 2012
Impact Sciences, Inc. (1098.001)
5.7 Greenhouse Gases
Due to the growth of the CCAR, it now operates under the Climate Action Reserve,50 which is a national offsets program for the United States carbon market. As part of this transition, the California Climate Action Registry was instrumental in establishing The Climate Registry, with the mission of expanding the California Registry’s emissions reporting work to include all of North America. Emissions inventory reporting is being transitioned to The Climate Registry, and reports for the 2009 reporting year will be the last the California Registry will accept. However, even after that year, the California Registry will continue to represent its members’ emissions reports to the state of California.
CAPCOA CEQA and Climate Change White Paper The California Air Pollution Control Officers Association (CAPCOA) prepared a white paper on CEQA and Climate Change in January 2008. The white paper contains a disclaimer that states the paper is intended to be used as a resource by lead agencies when considering policy options and not as a guidance document. The disclaimer also states that it “is not intended, and should not be interpreted, to dictate the manner in which an air district or lead agency chooses to address GHG emissions in the context of its review of projects under CEQA.”51 Specifically, the white paper discusses three possible approaches to evaluating the significance of GHG emissions and possible mitigation measures; however, CAPCOA does not endorse any particular approach. The three alternative significance approaches are (1) not establishing a significance threshold for GHG emissions; (2) setting the GHG emission threshold at zero; and (3) setting the GHG emission threshold at some non-zero level. The white paper evaluates potential considerations and pitfalls associated with the three approaches. At the end of the white paper, CAPCOA provides a list of potential mitigation measures and discusses each in terms of emissions reduction effectiveness, cost effectiveness, and technical and logistical feasibility.
CARB Preliminary Draft Staff Proposal On October 24, 2008, CARB issued a Preliminary Draft Staff Proposal: Recommended Approaches for Setting Interim Significance Thresholds for Greenhouse Gases under the California Environmental Quality Act (Preliminary Draft Staff Proposal). In the Preliminary Draft Staff Proposal, CARB proposed a tiered approach to determine the significance of two types of projects: (1) industrial; and (2) commercial/residential. With respect to commercial/residential projects, CARB proposed a four-tiered threshold:
Tier 1: Is the project exempt from further analysis under existing statutory or categorical exemptions? If yes, there is a presumption of less than significant impacts with respect to climate change.
Tier 2: Does the project comply with a previously approved plan that addresses GHG emissions? (The plan must satisfy certain requirements (e.g., be consistent
50 Additional information about the Climate Action Reserve may be obtained at the following Web site: http://www.climateactionreserve.org/.
51 California Air Pollution Control Officers Association, CEQA & Climate Change: Evaluating and Addressing Greenhouse Gas Emissions from Projects Subject to the California Environmental Quality Act, (2008).
Coachella General Plan Admin Draft EIR 5.7-26 February 2012
Impact Sciences, Inc. (1098.001)

5.7 Greenhouse Gases
with AB 32 and/or SB 375).) If yes, there is a presumption of less than significant impacts with respect to climate change.
Tier 3: Does the project satisfy certain minimum performance standards relating to construction and operational activities, or include equivalent mitigation measures, and emit no more than a yet to be determined quantity of emissions? If yes, there is a presumption of less than significant impacts with respect to climate change.
Tier 4: The project will have significant climate change impacts.
CARB staff received public comments on the draft thresholds; however, as of this writing, the thresholds remain draft recommendations and CARB has ceased any further development of the threshold. CARB has not indicated when or if it will resume development of the threshold.
Regional
South Coast Air Quality Management DistrictIn April 2008, the South Coast Air Quality Management District (SCAQMD), in order to provide guidance to local lead agencies on determining the significance of GHG emissions identified in CEQA documents, convened a “GHG CEQA Significance Threshold Working Group.”52 The goal of the working group is to develop and reach consensus on an acceptable CEQA significance threshold for GHG emissions that would be utilized on an interim basis until CARB (or some other state agency) develops statewide guidance on assessing the significance of GHG emissions under CEQA.
Initially, SCAQMD staff presented the working group with a significance threshold that could be applied to various types of projects—residential; non-residential; industrial; etc. However, the threshold is still under development. In December 2008, staff presented the SCAQMD Governing Board with a significance threshold for stationary source projects where it is the lead agency. This threshold uses a tiered approach to determine a project’s significance, with 10,000 metric tons of carbon dioxide equivalent (MTCO2e) as a screening numerical threshold.
At present time, the SCAQMD has not adopted thresholds for projects such as the one analyzed in this technical report. The SCAQMD is considering a tiered approach to determine the significance of residential and commercial projects. The draft approach that was published in October 2008 is as follows:53
52 For more information see: http://www.aqmd.gov/ceqa/handbook/GHG/GHG.html.
53 South Coast Air Quality Management District, “Greenhouse Gases (GHG) CEQA Significance Thresholds Working Group Meeting #6,” http://www.aqmd.gov/ceqa/handbook/GHG/2008/oct22mtg/oct22.html. 2008.
Coachella General Plan Admin Draft EIR 5.7-27 February 2012
Impact Sciences, Inc. (1098.001)
5.7 Greenhouse Gases
Tier 1: Is the project exempt from further analysis under existing statutory or categorical exemptions? If yes, there is a presumption of less than significant impacts with respect to climate change.
Tier 2: Is the project’s GHG emissions within the GHG budgets in an approved regional plan? (The plan must be consistent with State CEQA Guidelines Sections 15064(h)(3), 15125(d), or 15152(s).) If yes, there is a presumption of less than significant impacts with respect to climate change.
Tier 3: Is the project’s incremental increase in GHG emissions below or mitigated to less than the significance screening level (10,000 MTCO2e per year for industrial projects and 3,000 MTCO2e for commercial/residential projects) and is the project X percent beyond the Title 24 standard and achieve Y percent reduction in water use (the X and Y values were not determined at the time the draft approach was published)? If yes, there is a presumption of less than significant impacts with respect to climate change.
Tier 4: Does the project meet one of the following performance standards (the performance standards were not well-defined at the time the draft approach was published)? If yes, there is a presumption of less than significant impacts with respect to climate change.
Option 1: Uniform Percent Emission Reduction Target Objective (e.g., 30 percent) from BAU by incorporating project design features and/or implementing emission reduction measures.
Option 2: Early Implementation of Applicable AB 32 Scoping Plan Measures.
Option 3: Achieve sector-based standard (e.g., pounds per person, pounds per square foot, etc.).
Tier 5: Does the project obtain offsets alone or in combination with the above to achieve the target significance screening level (offsets provided for 30-year project life, unless project life limited by permit, lease, or other legally binding conditions)? If yes, there is a presumption of less than significant impacts with respect to climate change. Otherwise, the project is significant.
In November 2009, the following revisions were proposed for Tiers 3 and 4:54
Tier 3: Is the project’s incremental increase in GHG emissions below or mitigated to less than the significance screening level (10,000 MTCO2e per year for industrial projects; 3,500 MTCO2e for residential projects; 1,400 MTCO2e for commercial projects; 3,000 MTCO2e for mixed-use or all land use projects)? If yes, there is a presumption of less than significant impacts with respect to climate change.
54 South Coast Air Quality Management District, “Greenhouse Gases (GHG) CEQA Significance Thresholds Working Group Meeting #14,” http://www.aqmd.gov/ceqa/handbook/GHG/2009/nov19mtg/nov19.html. 2009.
Coachella General Plan Admin Draft EIR 5.7-28 February 2012
Impact Sciences, Inc. (1098.001)
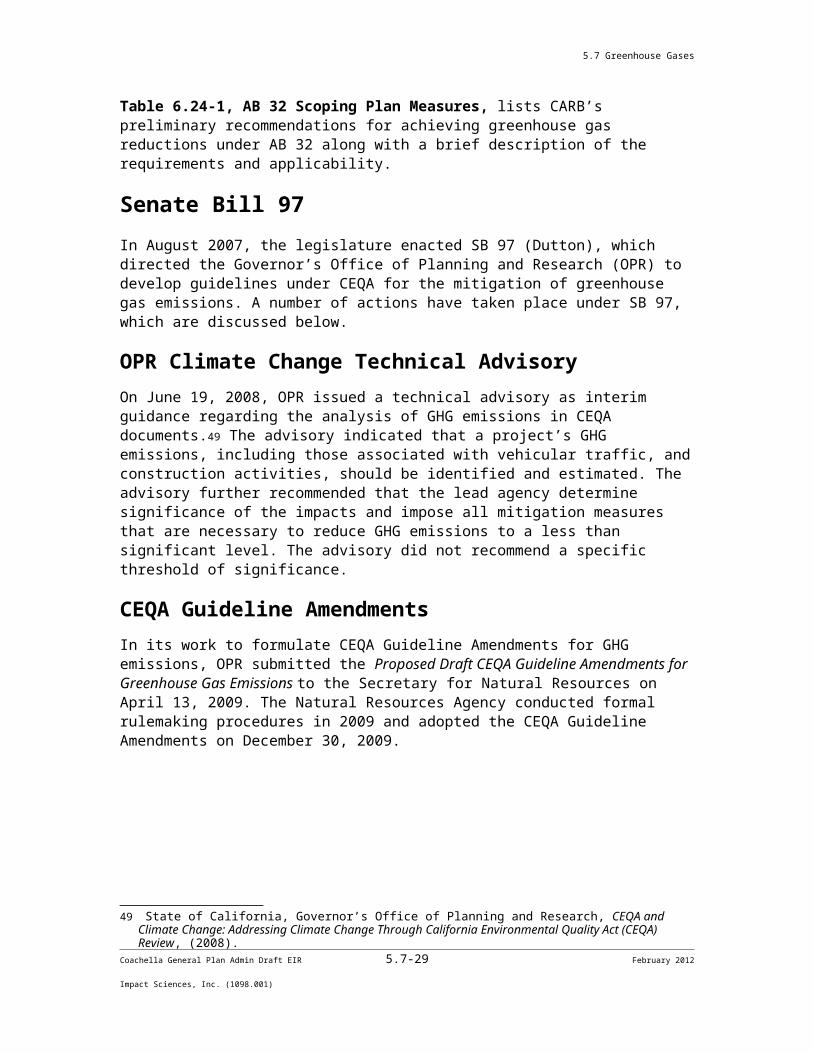
5.7 Greenhouse Gases
Tier 4: Does the project meet one of the following performance standards? If yes, there is a presumption of less than significant impacts with respect to climate change.
Option #1: Achieve a 28 percent reduction from a base case scenario, including land use sector reductions from AB 32 (total emissions not to exceed 25,000 MTCO2e).
Option #2: Achieve a project-level efficiency target of 4.6 MTCO2e per service population (total emissions not to exceed 25,000 MTCO2e) or plan-level efficiency target of 6.6 MTCO2e.
In September 2010, the Working Group released additional revisions which recommended a project-level efficiency target of 4.8 MTCO2e per service population as a 2020 target and 3.0 MTCO2e per service population as a 2035 target. The recommended plan-level target for 2020 was 6.6 MTCO2e and the plan-level target for 2035 was 4.1 MTCO2e. The SCAQMD has not announced when staff is expecting to present a finalized version of these thresholds to the Governing Board. The SCAQMD has also adopted Rules 2700, 2701, and 2702 that address GHG reductions; however, these rules are currently applicable to boilers and process heaters, forestry, and manure management projects.
Thresholds of Significance
State In accordance with Senate Bill (SB) 97, the Natural Resources Agency adopted amendments to the State CEQA Guidelines on December 30, 2009, which includes criteria for evaluating GHG emissions.55 Specifically, Appendix G of the State CEQA Guidelines (Environmental Checklist Form) lists the following thresholds, under which a project may be deemed to have a significant impact on air quality if it would:
Generate greenhouse gas emissions, either directly or indirectly, that may have a significant impact on the environment; or
Conflict with an applicable plan, policy, or regulation adopted for the purpose of reducing the emissions of greenhouse gases.
Under CEQA, “the determination of whether a project may have a significant effect on the environment calls for careful judgment on the part of the public agency involved, based to the extent possible on scientific and factual data.”56 CEQA grants agencies with the general authority to adopt criteria for determining whether a given impact is “significant.”57 When no guidance
55 The adopted amendments may be viewed at the following website: http://ceres.ca.gov/ceqa/guidelines/. 2010.
56 State CEQA Guidelines Section 15064(b).
57 See Cal. Pub. Resources Code Section 21082.Coachella General Plan Admin Draft EIR 5.7-29 February 2012
Impact Sciences, Inc. (1098.001)
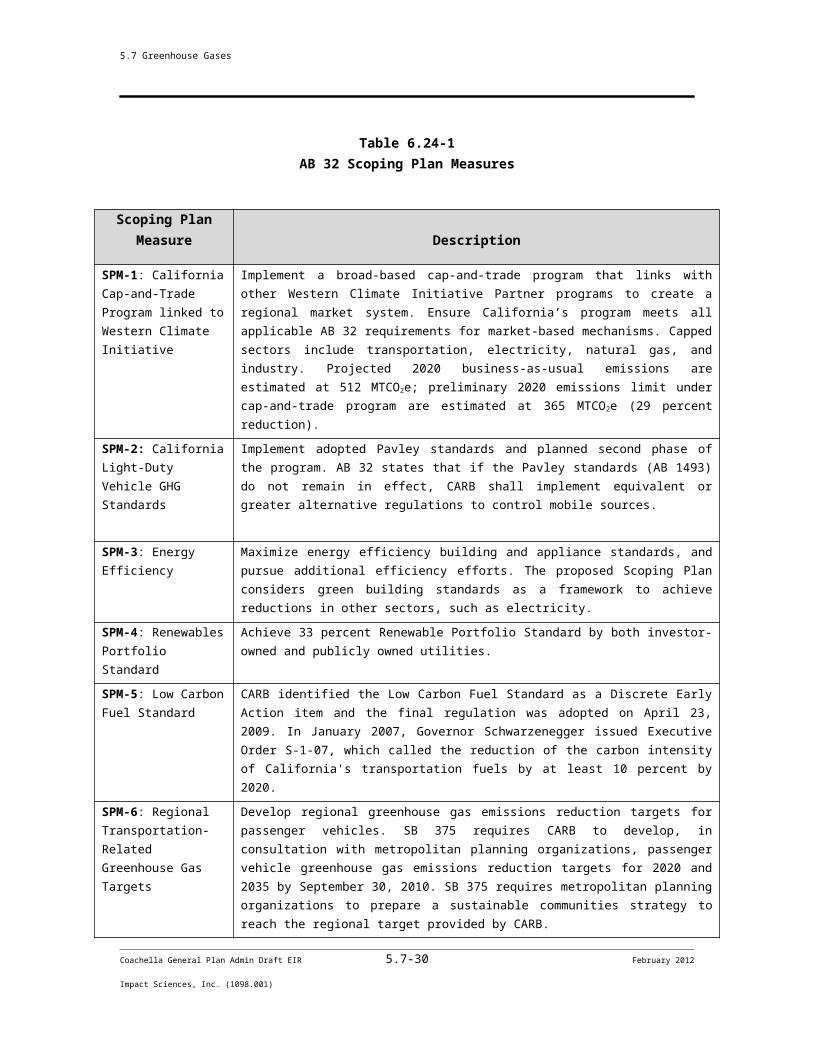
5.7 Greenhouse Gases
exists under CEQA, the agency may look to and assess general compliance with comparable regulatory schemes.58
Several air quality management and air pollution control districts have adopted guidance documents for evaluating the significance of GHG emissions. Other districts have published draft guidance documents that have not yet been formally adopted. A brief description of the available guidance documents from several air quality management and air pollution control districts is provided below. As listed below, the guidance documents do not provide a set of consistent thresholds for evaluating the significance of GHGs on the global climate.
As previously discussed, CARB published preliminary draft thresholds in 2008, but ceased further development of their threshold as of the date of this writing. The preliminary draft thresholds recommended that the significance of a project’s GHG emissions should be based on compliance with a previously approved plan that addresses GHG emissions or compliance with performance standards relating to construction and operational activities (or equivalent GHG-reduction measures) and emitting no more than a yet to be determined quantity of GHG emissions. Projects that do not meet these thresholds would be considered to have a significance impact.
The San Joaquin Valley Air Pollution Control District (SJVAPCD) adopted the Guidance for Valley Land-use Agencies in Addressing GHG Emission Impacts for New Projects under CEQA in late 2009. According to the guidance, the SJVAPCD guidance recommends the use of best performance standards to assess the significance of GHG emissions. The SJVAPCD expects that compliance with the recommended best performance standards would reduce a project’s GHG emissions by a target of 29 percent or more, compared to ‘business as usual’ (BAU) conditions. The 29 percent reduction target is based on the goal of AB 32, which is to reduce the state’s GHG emissions to 1990 levels by 2020.
The Sacramento Metropolitan Air Quality Management District (SMAQMD) has also adopted guidance recommending that projects achieve a 29 percent reduction from BAU conditions.
The Bay Area Air Quality Management District (BAAQMD) adopted revisions to its CEQA Guidelines in June 2010 that recommends a project-level significance threshold of 1,100 MTCO2e for residential and commercial projects or a project-level efficiency target of 4.6 MTCO2e per service population (residents plus employees) per year. The recommended plan-level significance thresholds are in compliance with a qualified greenhouse gas reduction strategy (or similar criteria included in a General Plan) or a plan-level efficiency target of 6.6 MTCO2e per service population (residents plus employees) per year.
58 See Protect Historic Amador Waterways v. Amador Water Agency (2004) 116 Cal. App. 4th 1099, 1107 [“‘[A] lead agency’s use of existing environmental standards in determining the significance of a project’s environmental impacts is an effective means of promoting consistency in significance determinations and integrating CEQA environmental review activities with other environmental program planning and resolution.’”]. Lead agencies can, and often do, use regulatory agencies’ performance standards. A project’s compliance with these standards usually is presumed to provide an adequate level of protection for environmental resources. See, e.g., Cadiz Land Co. v. Rail Cycle (2000) 83 Cal.App.4th 74, 106-09 (upholding use of regulatory agency performance standard).
Coachella General Plan Admin Draft EIR 5.7-30 February 2012
Impact Sciences, Inc. (1098.001)
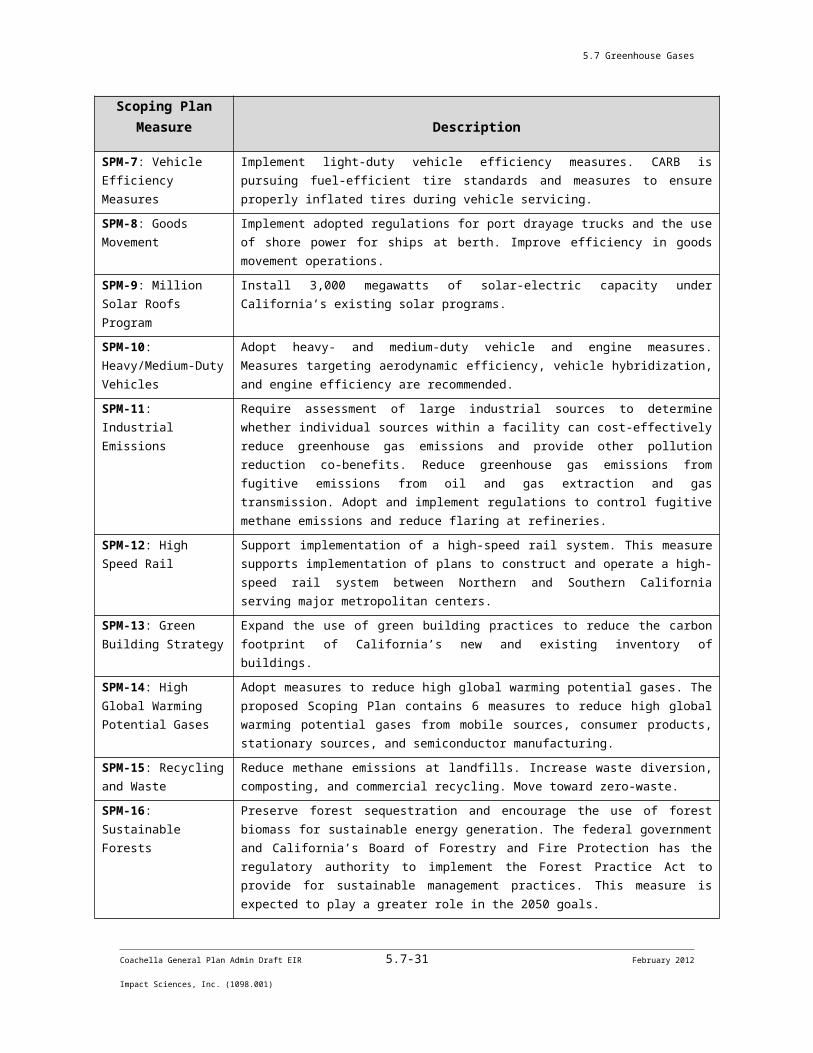
5.7 Greenhouse Gases
The SCAQMD is currently developing thresholds for GHG emissions. As noted previously, the SCAQMD recommends a tiered approach. The Tier 3 threshold requires that a project’s incremental increase in GHG emissions should be below or mitigated to less than the significance screening level (10,000 MTCO2e per year for industrial projects; 3,500 MTCO2e for residential projects; 1,400 MTCO2e for commercial projects; 3,000 MTCO2e for mixed-use or all land use projects). The Tier 4 threshold requires that projects achieve a 28 percent reduction from a base case scenario, including land use sector reductions from AB 32 (total emissions not to exceed 25,000 MTCO2e) or achieve a project-level efficiency target of 4.8 MTCO2e per service population per year by 2020 and 3.0 MTCO2e per year by 2035 (total emissions not to exceed 25,000 MTCO2e per year). The recommended plan-level significance thresholds is an efficiency target of 6.6 MTCO2e per service population per year by 2020 and 4.1 MTCO2e per year by 2035.
While a wide array of thresholds and standards have been presented, the amendments to the State CEQA Guidelines reaffirm that the lead agency has the discretion to determine how to evaluate a project’s significance under CEQA. The State CEQA Guidelines includes a new Section 15064.4, which states that, when making a determination of the significance of GHG emissions, a lead agency shall have discretion to determine whether to use a model or methodology to quantify GHG emissions and/or rely on a qualitative analysis or performance based standards.
Environmental Impacts The environmental impact analysis presented below is for issues identified by reviewing agencies, organizations, or individuals commenting on the NOP and the comments on the previously circulated Draft EIR that made a reasonable argument that the issue was potentially significant (see Comments on Draft EIR, Appendix 2.0).
Impact Generate greenhouse gas emissions, either directly or indirectly, that may have a significant impact on the environment.
Impacts
Mitigation Measures
Residual Impacts
Impact Conflict with an applicable plan, policy, or regulation adopted for the purpose of reducing the emissions of greenhouse gases.
Impacts
Mitigation Measures
Residual Impacts
Coachella General Plan Admin Draft EIR 5.7-31 February 2012
Impact Sciences, Inc. (1098.001)

5.7 Greenhouse Gases
Coachella General Plan Admin Draft EIR 5.7-32 February 2012
Impact Sciences, Inc. (1098.001)