cityscape july 2012: the long-term effects of...
TRANSCRIPT

137Cityscape: A Journal of Policy Development and Research • Volume 14, Number 2 • 2012U.S. Department of Housing and Urban Development • Office of Policy Development and Research
Cityscape
The Long-Term Effects of Moving to Opportunity on Youth OutcomesLisa A. Gennetian The Brookings Institution
Lisa SanbonmatsuNational Bureau of Economic Research
Lawrence F. KatzHarvard University National Bureau of Economic Research
Jeffrey R. KlingCongressional Budget Office National Bureau of Economic Research
The contents of this article are the views of the authors and do not necessarily reflect the views or policies of the U.S. Department of Housing and Urban Development, the Congressional Budget Office, the U.S. government, or any state or local agency that provided data.
Abstract
Evidence about the effects of neighborhood environments on children and youth is central to the design of a wide range of public policies. Armed with long-term survey data from the Moving to Opportunity (MTO) for Fair Housing demonstration final impacts eval - u ation (Sanbonmatsu et al., 2011), we have the opportunity to understand whether neighborhood poverty and related characteristics exert an independent causal effect on the life chances of young people. Findings from analyses of youth in the long-term survey for the final impacts evaluation show that MTO had few detectable effects on a range of schooling outcomes, even for those children who were of preschool age at study entry. MTO also had few detectable effects on physical health outcomes. In other youth outcome domains, patterns of effects on youth were similar to, but more muted than, those in the interim impacts evaluation (Orr et al., 2003), with favorable patterns among female youth—particularly on mental health outcomes—and less favorable patterns among male youth.
Matthew SciandraNational Bureau of Economic Research
Jens LudwigUniversity of Chicago National Bureau of Economic Research
Greg J. DuncanUniversity of California, Irvine
Ronald C. Kessler Harvard Medical School
138
Gennetian, Sciandra, Sanbonmatsu, Ludwig, Katz, Duncan, Kling, and Kessler
Moving to Opportunity
IntroductionThe life chances of children vary dramatically across neighborhoods. Youth who grow up in areas of concentrated poverty tend to have elevated rates of a wide range of adverse outcomes—such as school dropout, low test scores, and delinquency—even after statistically controlling for observable characteristics of the youth and their families (Chalk and Phillips, 1996; Duncan and Murnane, 2011; Ellen and Turner, 1997; Ginther, Haveman, and Wolfe, 2000; Leventhal and Brooks-Gunn, 2008, 2000; Shonkoff and Phillips, 2000). These patterns have led to a longstanding concern that neighborhood environments may exert an independent causal effect on the life chances of young people. Because low-income individuals comprise nearly one-half of the 8.7 million people living in census tracts with poverty levels of 40 percent or higher (Kneebone, Nadeau, and Berube, 2011), poor children growing up in neighborhoods of concentrated poverty may be “doubly disadvantaged”—they face potential risks from growing up in a low-income household and in an economically poor neighborhood.
Evidence about the effects of neighborhood environments on children and youth is central to the design of a wide range of public policies, from means-tested housing programs to place-based strategies such as those of the U.S. Department of Education’s (ED’s) Promise Neighborhoods and Harlem Children’s Zone, Inc. Empirically isolating the causal effects of neighborhood environ-ments on youth outcomes from the range of other youth and family characteristics with which they are correlated is complicated, however. Most families have at least some degree of choice about where they live. As a result, hard-to-measure individual- or family-level attributes associated with neighborhood selection and directly affecting youth outcomes can confound the estimated effects of neighborhood environment.
The U.S. Department of Housing and Urban Development (HUD) launched the Moving to Oppor-tunity (MTO) for Fair Housing demonstration randomized mobility experiment to try to overcome this empirical challenge of selection bias (that is, of nonrandom associations between neighbor-hood characteristics and the preexisting characteristics of residents that influenced their decisions to live in the neighborhood). Between 1994 and 1998, MTO recruited more than 4,600 families with children living in severely distressed public housing projects in five cities (Baltimore, Boston, Chicago, Los Angeles, and New York City). HUD offered some MTO families the opportunity to use a housing voucher to move into private-market housing in lower poverty neighborhoods and did not make the same offer to others. This random assignment to different groups—experimental, Section 8, and control—in the MTO study broke the link between family preferences and neigh-borhood environments, and it thus provides us with the opportunity to overcome the standard self- selection concern and identify the causal effects of neighborhoods on child and youth outcomes. This article summarizes key findings regarding the effects of neighborhood characteristics found in the long-term (10- to 15-year) survey of MTO youth, who were approximately ages 10 to 20 in December 2007 (age 11 or younger at baseline), conducted for the final impacts evaluation (Sanbonmatsu et al., 2011).1
1 For more detail about MTO’s long-term effects on youth outcomes, see Sanbonmatsu et al. (2011), chapters 2 through 7. A history of MTO research is available at http://mtoresearch.org.

The Long-Term Effects of Moving to Opportunity on Youth Outcomes
139Cityscape
Previous MTO research, based on data collected 4 to 7 years after random assignment, showed a more mixed and complicated pattern of findings than that predicted by the existing neighborhood effects literature. At the time of the followup survey for the interim impacts evaluation (Orr et al., 2003), MTO had produced few detectable effects on the achievement test scores or health of chil-dren, most of whom were already of school age when their families signed up for MTO (Fortson and Sanbonmatsu, 2010; Sanbonmatsu et al., 2006). Violent-crime arrests were fewer among male and female youth who moved via the experimental group vouchers compared with those assigned to the control group that received no vouchers. MTO effects on most other behavioral outcomes varied by gender, however, with beneficial effects on female youth and adverse effects for males (Kling, Liebman, and Katz, 2007; Kling, Ludwig, and Katz, 2005).
This article addresses three key questions for the final impacts evaluation. (1) Because disruptive effects from the act of moving are likely to fade and the beneficial influences of better neighbor-hoods likely to grow with time, do MTO’s effects on children become more beneficial over time? (2) Are MTO’s beneficial effects on children concentrated on the subset who had not entered school when their families enrolled in the program? Early childhood is a particularly malleable stage of early brain development and, therefore, a time when children are perhaps most susceptible to the benefits of social interventions (Becker and Murphy, 2000; Carneiro and Heckman, 2003; Knudsen et al., 2006; Shonkoff and Phillips, 2000). (3) Do the gender differences in MTO effects that the followup survey for the interim impacts evaluation found emerge in the final impacts eval-uation? We draw our outcome measures from survey self-reports2 of behavior, schooling, mental and physical health, and peer relationships; math and reading achievement assessments; physical measurements of height and weight; and administrative records on other outcomes such as quarterly earnings from state unemployment insurance (UI) data and arrest records.
The “Guest Editor’s Introduction” to this issue of Cityscape describes how MTO succeeded in gen-erating persistent differences in neighborhood environments across treatment and control groups (Ludwig, 2012). Youth in the experimental group, like adults in the experimental group, report feeling more safe in their neighborhoods, but the characteristics of the schools that children in the experimental group attended in their neighborhoods differed only modestly from the schools that children in the control group attended. For example, the schools that youth in the experimental and Section 8 groups attended had student bodies that were more mixed by income and by racial or ethnic groups than those of youth in the control group but that still included mostly poor and overwhelmingly minority students. Test scores in the schools that youth in the experimental and Section 8 groups attended were also slightly better than in the schools that the control group attended but were still usually in the bottom one-fourth of the statewide performance distribution. These mixed MTO effects on school environments do not preclude the possibility of MTO affecting schooling outcomes, because socioeconomic composition or social processes in neighborhoods might differ across schools and matter for achievement independent of school quality. Indeed, additional analyses of the followup (4- to 7-year) survey data for the interim impacts evaluation found signs of MTO effects on achievement test scores in only those demonstration sites with the highest levels of concentrated neighborhood disadvantage that also had few detectable effects on
2 The long-term youth survey is available at http://mtoresearch.org.

140
Gennetian, Sciandra, Sanbonmatsu, Ludwig, Katz, Duncan, Kling, and Kessler
Moving to Opportunity
schools (Burdick-Will et al., 2011). Analyses of the long-term (10- to 15-year) survey data for the final impacts evaluation, however, show that MTO had no detectable effect on math or reading achievement.
Overall, MTO had few detectable effects on a range of schooling outcomes, even among those children who were of preschool age at study entry, and few detectable effects on physical health outcomes. In other outcome domains, the long-term survey found that MTO had patterns of effects that were similar to, but more muted than, those the interim followup survey found, with favorable patterns among female youth—particularly on mental health outcomes—and less favorable pat-terns among male youth.
The next section of the article reviews the candidate mechanisms through which neighborhood environments might influence children’s outcomes. A section reviewing the data that we collected during the long-term survey for the final impacts evaluation and a section presenting the results follow. The final section discusses the implications of these findings for policy and future research on neighborhood effects.
Background and Conceptual FrameworkA large empirical literature, as discussed in the Introduction, generally points in the direction of neighborhood effects on children’s schooling outcomes, youth crime, parent joblessness and earn-ings, and even mortality. A framework Jencks and Mayer (1990) posited nicely describes the path-ways through which neighborhoods can affect youth achievement and behavior. Epidemic models emphasize the power of peers to spread behaviors. Such contagion effects can arise from learning from peers, pure preference externalities (individuals enjoy imitating their peers), stigma effects (negative signals from delinquent behaviors declines when more people do them), and physical externalities (for example, higher crime rates reduce the chances of getting arrested because of congestion effects in law enforcement; see Brock and Durlauf, 2001; Cook and Goss, 1996; Glaeser and Scheinkman, 1999; Manski, 2000; Moffitt, 2001). Collective socialization models concentrate on the way adults in a neighborhood influence young people who are not their children, through human capital externalities (Borjas, 1995) or by acting as role models or enforcers of public order (Sampson, Raudenbush, and Earls, 1997; Wilson, 1987). Institutional models focus on the influence of adults who mainly reside outside the community but who work in the schools, police force, and other neighborhood institutions. Competition models emphasize the competition between neighbors for scarce resources like grades or jobs. Relative deprivation models focus on the psychological effect on individuals or self-evaluation based on relative standing in the community (Luttmer, 2005). The failure to compete successfully for prosocial rewards, as competition models hypothesize, could in fact lead some people to reverse course and try competing for resources or social standing by engaging in antisocial behaviors. Furthermore, relative deprivation models might predict that com-parisons with the status and accomplishments of new neighbors in more affluent areas could have negative psychological effects.
The remaining subsections review the previous empirical research based around the key youth out-come domains of interest and the extent to which this literature sheds any light on the pathways by which neighborhoods have these effects.

The Long-Term Effects of Moving to Opportunity on Youth Outcomes
141Cityscape
Education and EmploymentPerhaps the most obvious way in which neighborhood context may affect educational outcomes is through the quality of local public schools. Moving to better neighborhoods for better schools arose as one key motivation for MTO study families to subsequently move, although realizing their aspirations for improved educational opportunities was difficult and often influenced by informal networks (Ferryman et al., 2008). Indeed, the composition of neighborhood residents might also matter, because adults convey shared prosocial (or antisocial) values or serve as positive or negative role models; that is, the Jencks-Mayer collective socialization model (Connell et al., 1995; Crane, 1991; Sampson, 1993; Sampson and Groves, 1989; Wilson, 1987). Such neighborhoods also may provide youth with a safe physical environment, which may be conducive to academic success (Connell et al., 1995). Epidemic models raise the possibility of a variety of spillover effects from exposure to higher achieving peers; for example, through opportunities to participate in more productive study groups, exposure to more rigorous instruction, and increased time on task from reductions in student disruptions (Lazear, 2001). On the other hand, the competition for grades may be more intense in more affluent areas. Increased competition could have a detrimental effect on some MTO children, although these effects might dissipate over time if their academic compe-tencies improve with exposure to new schools.
Previous nonexperimental research generally has found positive correlations between affluent neighbors and a variety of academic outcomes, such as IQ, reading and math achievement scores, school completion, and self-reported grades for children and adolescents (for example, Brooks-Gunn et al., 1993; Chase-Lansdale et al., 1997; Connell and Halpern-Felsher, 1997; Crane, 1991; Dornbusch, Ritter, and Steinberg, 1991; Duncan, Brooks-Gunn, and Klebanov, 1994; Entwistle, Alexander, and Olson, 1994). A study of the Gautreaux mobility program found that young adults in households that had moved from public housing in the city of Chicago to suburban locations were less than one-fourth as likely to drop out of school and more than twice as likely to attend college compared with the outcomes of young adults initially living in the same public housing units whose families moved to other parts of the city (Rubinowitz and Rosenbaum, 2000). Prelimi-nary analyses using longer run data on a larger group of Gautreaux children suggested smaller and more specialized effects (Keels et al., 2005).
Schools also can be gateways to other types of educational or work programs. School-to-work programs administered by local public schools may help youth secure internships while they are still enrolled in high school and help non-college-bound youth secure employment after high school. Factors such as the stigma surrounding entry-level jobs or local criminal activity, the level of violence associated with the local illegal economy and the quality of local policing, and the level of difficulty in competing for jobs and related positive rewards for behavior that supports schooling or employment can also influence youth decisions about whether to participate in the formal labor market or to pursue underground or informal work. Although having more affluent neighbors appears to correspond with having improved labor market outcomes (see, for example, Corcoran et al., 1992; Page and Solon, 2003; Sharkey, 2008), several more recent studies suggest a mixed pattern of neighborhood environment influence. Child neighborhood environments do not appear related to adult labor market outcomes among children assigned to public housing projects in sub - stantially different neighborhoods of Toronto (Oreopoulos, 2003). Further analyses of Gautreaux

142
Gennetian, Sciandra, Sanbonmatsu, Ludwig, Katz, Duncan, Kling, and Kessler
Moving to Opportunity
(Rosenbaum, 1995) found strong positive gains in educational and economic outcomes for the children of suburban movers relative to those of city movers, but longer term followups found less striking contrasts between suburban and city movers (DeLuca et al., 2009). On the other hand, Gould, Lavy, and Paserman (2009) found positive effects on long-term adult economic outcomes for Yemenite refugees to Israel who, as children, were placed initially in more prosperous neighbor - hoods with better infrastructure.
Delinquency and Risky or Problem BehaviorIn addition to potentially affecting educational and employment outcomes, MTO may have impor-tant effects on problem behaviors. Social stigma associated with criminal behavior may be lower in areas where such behavior is relatively more common. Similarly, if police resources assigned or available to a community are relatively fixed, an increase in criminal activity by one’s peers will reduce the probability that a given criminal offense results in arrest (Cook and Goss, 1996). The literature is more mixed regarding other risky behaviors, such as drug or substance abuse and sexual activity (Brooks-Gunn et al., 1993; Crane, 1991; Esbensen and Huizinga, 1990; Hogan, Astone, and Kitagawa, 1985; Hogan and Kitagawa, 1985).
HealthAlthough Jencks and Mayer (1990) did not consider neighborhood processes to be related to health, we have reason to believe that moves to lower poverty neighborhoods may improve both physical and mental health. Physical health may improve with safer and less stressful environments, greater community resources, or residents who practice healthy behaviors such as exercise. Low-income neighborhoods may also have compromised air quality, which has been linked to coronary heart disease (Kan et al., 2008) and poor health for infants (Currie and Walker, 2011). Poor children liv-ing in disadvantaged urban areas may be at higher risk of exposure to lead and secondhand smoke, both of which can impair brain development (Bombard et al., 2010; Filippelli and Laidlaw, 2010). The prevalence of accidents and injuries—the most common causes of death among children ages 1 to 14 in the United States—may be higher among children living in distressed urban communities, owing to unsafe playgrounds and other features of the environment (Quinlan, 1996; Scharfstein and Sandel, 1998).
Adults and children who live in high-poverty, high-crime urban settings are also at risk for poorer mental health outcomes (for example, Bagley, Jacobson, and Palmer, 1973; Rezaeian et al., 2005; Whitley et al., 1999). To the extent that MTO reduces exposure to crime and violence, we would expect it to improve overall well-being and reduce psychological distress, depression, and anxiety (Aneshensel and Sucoff, 1996; Ross and Mirowsky, 2001; Silver, Mulvey, and Swanson, 2002). Moving to lower poverty neighborhoods could influence a variety of externalizing behavior dis-orders (for example, oppositional defiant disorder), because these disorders are strongly related to contagion processes in peer environments and norms regarding the appropriateness of violence and antisocial behaviors (Deater-Deckard, 2001; Gifford-Smith et al., 2005). Male and female youth may also have different coping styles and capacities as they navigate different neighborhood environments. Adolescent males tend to be subject to less parental supervision than females, and they also tend to be greater risk takers (Block, 1983; Bottcher, 2001; LaGrange and Silverman, 1999).
The Long-Term Effects of Moving to Opportunity on Youth Outcomes
143Cityscape
Psychosocial stress sometimes can have more pronounced effects on males than females, in part, because males are more likely to use confrontational techniques (that is, the Jencks-Mayer collec-tive socialization model) to deal with stress, particularly stress involving interpersonal problems, whereas females are more likely to turn to supportive adults (Coleman and Hendry, 1999; Zaslow and Hayes, 1986).
The Jencks and Mayer (1990) typology and empirical literature, in turn, generally implies that the effect of MTO moves may become more beneficial (or less detrimental) as youth spend more time in lower poverty areas. For example, over time, we may expect MTO youth to become more socially integrated into their new communities and more attuned to local social norms, and thus more responsive to the peer and adult social influences that are central to the epidemic and col-lective socialization models. Parents may also learn over time how to better navigate the potential opportunities and pitfalls in low-poverty schools. More generally, the effects of exposure to new social environments and institutions may accumulate over time and lead to more pronounced positive effects on youth behavior. A different time path in MTO effects may arise from the effects of neighborhood safety and crime, which, as mentioned previously, may be relevant for outcomes in the schooling, employment, and delinquency domains. On the other hand, some of the theories described in the Jencks and Mayer typology—the competition and relative deprivation models in particular—predict potentially adverse effects as youth spend time in lower poverty neighbor-hoods. Ultimately, whether youth benefit based on these theories is an empirical question.
The MTO Study Design, Sample, and DataFrom 1994 to 1998, HUD launched MTO in five cities: Baltimore, Boston, Chicago, Los Angeles, and New York. HUD limited eligibility to families with children living in public or other govern-ment housing in designated high-poverty census tracts. The study then randomly assigned the 4,604 families who signed up to one of three groups. HUD offered families in the experimental group the opportunity to use a rent-subsidy voucher to move into private-market housing but, under the MTO design, families in this group could redeem their vouchers only in census tracts with a 1990 poverty rate of less than 10 percent. Families in the experimental group also received housing search assistance and relocation counseling from local nonprofit organizations. HUD offered the randomly assigned families in the Section 8 group a traditional housing voucher that had no location requirements and did not come with any search assistance beyond what Section 8 voucher recipients normally receive. Families in the control group did not receive a voucher through MTO, but they did not lose access to any housing or other social services to which they would otherwise have been entitled.
The final impacts evaluation youth survey sample frame included up to three youth per original MTO family who were between ages 10 and 20 as of December 2007. Older adolescents (ages 13 to 20 as of December 2007) answered the full-length survey that we developed, whereas younger children (ages 10 to 12 as of December 2007) answered a shorter subset of items. Although MTO participants who were younger than 18 at baseline and older than 20 by December 2007 were not in our survey sample frame, we did try to track their outcomes through proxy reports of parents on the adult MTO surveys and through administrative data on employment, postsecondary schooling, and arrests.

144
Gennetian, Sciandra, Sanbonmatsu, Ludwig, Katz, Duncan, Kling, and Kessler
Moving to Opportunity
Response rates for the youth survey were very high and were balanced across the control and treat-ment groups. The overall effective response rate was 89 percent, and the effective response rates by randomization group were as follows: experimental group, 90 percent; Section 8 group, 87 percent; control group, 89 percent. The analysis sample for the survey-based measures presented in this article includes a total of 5,101 youth ages 10 to 20, comprising 457 younger children and 4,644 older adolescents. All youth ages 10 to 20 (N = 6,645) in the 4,604 families in the program (as opposed to only those youth who were interviewed) were eligible for submission to administrative data agencies.3 Roughly 56 percent (2,969 of 5,345) of the youth who were interviewed as part of the followup survey for the interim impacts evaluation were interviewed again as part of the long-term survey for the final impacts evaluation.
The youth in the long-term survey sample, who on average were age 5 at baseline (ranging from newborn to age 11), were not particularly disadvantaged regarding learning and behavioral problems. They attended schools, however, characterized by high poverty, high minority composition, and low achievement; their parents had low educational achievement; and they were living in danger-ous neighborhoods. The baseline heads of household reported that 12 percent of youth ages 6 to 11 had a learning problem and 6 percent had behavioral or emotional problems. About 13 percent had been enrolled in a program for gifted and talented students or had done advanced coursework. These numbers are consistent with national averages; about 13 percent of the school-age popula-tion receives special education services (Kaufman, Alt, and Chapman, 2001) and 10 percent are enrolled in gifted classes (Fields et al., 2001). On the other hand, about 85 percent of students at the baseline schools of MTO youth were eligible for free or reduced-price lunches, more than 90 percent of students were minorities, and most of the schools were in the bottom 15 percent of the statewide performance distribution. Furthermore, parents had relatively low educational attainment: only 35 percent held a high school diploma, and another 18 percent had earned a certificate of General Educational Development (GED). Finally, as Ludwig (2012) described, when families listed their reasons for wanting to move, about three-fourths reported wanting to get away from gangs and drugs (that is, safety) as their first or second most important reason, about one-half listed better schools for the children, and about 45 percent listed a bigger or better apartment.
We estimate both the effects of being offered an MTO low-poverty voucher or a traditional Section 8 voucher, known as the intention-to-treat (ITT) effect in the program evaluation literature, and the effects of actually moving with a low-poverty or traditional voucher, known as the treatment-on-the-treated (TOT) effect. We calculate ITT using an ordinary least squares regression in which the outcome of interest is the dependent variable being predicted on group assignment and a series of baseline covariates. The basic equation is
Yi = α
0 + α
1Exp
i + α
2S8
i + α
3X
i + e
i, (1)
3 In practice, however, the outcomes in this article’s exhibits generally are limited to smaller samples, because they include age-based subsets of all youth (for example, we submitted only youth ages 15 to 20 for the postsecondary schooling data match). We also have proxy reports on 3,217 grown children (from 3,273 adult survey interviews), and we submitted all 4,643 grown children from the 4,604 families to administrative data agencies.
The Long-Term Effects of Moving to Opportunity on Youth Outcomes
145Cityscape
where Yi is some outcome for MTO program participant i; Exp
i and S8
i are binary indicator variables
equal to 1 if participant i was in the experimental or Section 8 group (and the control group is the omitted reference group); and X
i represents a series of individual- and family-level baseline covariates
that Sanbonmatsu et al. (2011) described and similar to the covariates Orr et al. (2003) described. The coefficients on Exp
i and S8
i capture the ITT estimates for the experimental and Section 8 groups,
respectively. The ITT effect represents the estimated effect of MTO on the assigned group as a whole, including both families who leased up and families who never used an MTO voucher. The ITT esti-mate eliminates the problem of self-selection bias, because it compares the average outcomes of the entire treatment group (regardless of whether the family moved through MTO) with the average outcomes of the control group. Because of random assignment, the treatment and control groups should, on average, be identical regarding their baseline characteristics, so we can confidently attribute any subsequent differences in outcomes to the fact that the treatment groups were offered the opportunity to relocate through the MTO demonstration.
The TOT estimate represents the effect of MTO on the program movers; that is, the experimental and Section 8 group members who actually moved with the program vouchers. Under certain assumptions (for example, that the program did not affect families who did not use their MTO voucher), we can estimate TOT by dividing the ITT effect by the share of the experimental or Section 8 group that relocated with an MTO voucher (Angrist, Imbens, and Rubin, 1996; Bloom, 1984). The TOT estimate does not remove the self-selection bias, because it compares the members of the treatment group who leased up, a self-selected group, with would-be movers in the control group.4 Because 47 percent of the experimental group and 62 percent of the Section 8 group relocated with an MTO voucher (Ludwig, 2012), TOT estimates are substantially larger than ITT estimates. For example, if the ITT for an outcome was 8 percentage points for the experimental group, the TOT estimate would be [.08/.47] = .17, or 17 percentage points.
MeasuresThe MTO long-term survey for the final impacts evaluation included an innovative combination of survey and administrative data collection. Within the survey interview setting, we administered math and reading achievement assessments; measured height and weight; constructed a full history of schools attended over the followup period; and used audio-enhanced, computer-assisted self-interviewing (audio-CASI) to ask about sensitive items related to mental health and risky behavior. We also collected a variety of administrative data, including postsecondary schooling data, criminal justice records, UI data, and government assistance data (food stamps and Temporary Assistance for Needy Families records).
4 The TOT approach assumes that those who did not use an MTO voucher experienced no average effect of being offered a voucher, which we believe is reasonable. Although the TOT estimates do not remove self-selection bias, the estimates are policy relevant because they focus on the effects that a new neighborhood environment would have on the individuals who would be most likely to participate in a housing voucher program.
146
Gennetian, Sciandra, Sanbonmatsu, Ludwig, Katz, Duncan, Kling, and Kessler
Moving to Opportunity
School CharacteristicsWe used two types of information to describe school characteristics: (1) a variety of socioeconomic and demographic characteristics available from three national databases, and (2) students’ self-reports of school climate. We constructed a full history of schools attended for each youth by combining parent reports on the youth’s schooling through the time of the followup survey for the interim im-pacts evaluation (or kindergarten for youth who were not of school age when the family volunteered for the MTO program) with youth self-reports through the time of the long-term survey for the final impacts evaluation (or the highest grade attended for youth who were no longer in a primary or secondary school). We then matched the school histories to school characteristics from two National Center for Education Statistics databases (the Common Core of Data for public schools and the Private School Universe Survey for private schools) and a school-level test score database.
We also constructed a school climate index based on whether youth strongly agreed, agreed, dis - agreed, or strongly disagreed with five statements about their most recent school’s climate. We asked youth if teachers were interested in students, if they felt “put down” by their teachers, if discipline was fair, if students who studied hard were teased, and if they felt safe in school. We constructed the index as the fraction of positive responses on the five items; that is, strongly agree or agree responses on teacher interest in students, fair discipline, and feeling safe, and disagree or strongly disagree responses on feeling put down by teachers and teasing of students who study hard.
Math and Reading AchievementAt the end of the survey interview, we administered a 45-minute achievement assessment, an adapted version of the assessment used for the ED’s Early Childhood Longitudinal Study-Kindergarten Cohort (ECLS-K). Youth ages 13 to 20 as of December 2007 took a slightly modified version of the eighth grade ECLS-K assessment, administered in two stages: a first-stage routing test that the survey interviewers scored in real time, the score of which then determined which form of the second-stage test to administer.5 We contracted with the Educational Testing Service (ETS) to score the assessments via estimates (known in the testing literature as theta scores) of each youth’s underlying academic ability from a statistical model based on item response theory (IRT). IRT scoring allows for the reliable prediction of a student’s ability on a full set of testing items based on only a subset of those items, which was important for the MTO study, given the limited time avail-able in the survey interview setting.6 We converted the ETS achievement theta scores into z-scores by subtracting the control group’s average test score from each youth’s individual test score, then dividing by the standard deviation of the control group’s test score distribution. By construction, the control group’s average test score in this z-score metric will equal 0.
We selected the ECLS-K assessments for several reasons. They are designed to measure what children learn in school (as opposed to measuring aptitude only) and are sensitive to capturing whether MTO moved children into improved schooling and learning environments. They also
5 Youth ages 10 to 12 also took an assessment, based on the ECLS-K fifth grade test, but the results for that age group do not qualitatively differ from those for youth ages 13 to 20, and we focus here on the eighth grade test. 6 Further details are available upon request. Also, see Reardon (2008).

The Long-Term Effects of Moving to Opportunity on Youth Outcomes
147Cityscape
include appropriate coverage of material that is relevant for the wide dispersion of ages of youth in the long-term survey for the final impacts evaluation, have good discriminating power across a wide range of ability levels, and have been extensively pretested and piloted (for example, to ensure that the test items work equally well for racial and ethnic subgroups).
The possibility that older youth in our survey sample would find the items on the tests too easy (known in the testing literature as a ceiling effect) was one concern about the ECLS-K assessments. To address this concern, we supplemented the ECLS-K eighth grade test with a small set of math and reading items from ED’s National Educational Longitudinal Survey-1988 (NELS) assessment for high school students. Only about 8 percent of MTO youth ages 13 to 20 performed well enough to take these additional NELS items in math or reading. The possibility of a floor effect, in which the assessment is too difficult for some children and so loses its ability to distinguish the achieve-ment of students at the bottom of the distribution, was another concern. About 14 percent of youth ages 13 to 20 performed at less than the level of chance on the reading test—that is, more poorly than we would have expected if they had simply guessed at every test question—and about 7 per-cent did so on the math test.
Educational Completion and IdlenessDuring the survey interview, we asked older MTO youth (ages 15 to 20 as of December 2007) about their schooling, completed education, and participation in employment or training. From these measures, we constructed a measure of youth or young adult idleness defined as “not currently employed” and “not currently in school” at the time of the survey interview. We also obtained UI records and postsecondary enrollment data from the National Student Clearinghouse (NSC).7
Physical HealthSelf-reported physical health measures included overall health, asthma, and accidents and injuries. To measure obesity, interviewers measured youth height and weight using the same protocols they used for adults then converted the results to the standard Body Mass Index (BMI) formula of weight in kilograms divided by height in meters squared. Because BMI tends to increase naturally through adolescence, instead of using the standard definition of obesity used for adults (BMI ≥ 30), we defined obesity using criteria developed by the International Obesity Task Force (Cole et al., 2000). Those criteria use growth curves based on age and gender that align with the standard adult BMI standards. The criteria further break down curves by gender because, whereas BMI tends to follow a linear trend for males, it tends to follow a more concave trend line for females, and because puberty generally affects female bodies at different ages than it does male bodies.
Mental HealthWe administered two short questionnaires to measure psychological distress and behavioral and emotional problems. The first was the Kessler 6 (K6), a six-item questionnaire used to determine
7 NSC data were available back through 2001, but it took until the end of 2006 for NSC to be near complete (96 percent of schools had joined NSC by then), so we have limited our analysis to the 3-year period from January 2007 to January 2010.

148
Gennetian, Sciandra, Sanbonmatsu, Ludwig, Katz, Duncan, Kling, and Kessler
Moving to Opportunity
general psychological distress. Youth reported how often in the past 30 days they felt so sad that nothing could cheer them up, nervous, restless or fidgety, hopeless, that everything is an effort, and worthless. The K6 raw score can range from 0 (no distress) to 24 (highest distress), and our K6 measure is a z-score based on the control group mean and standard deviation, with stan-dardization separated by gender and flipped such that a lower score indicates less psychological distress. The second questionnaire was a brief version of the Strengths and Difficulties Question-naire (SDQ), which is used to identify behavioral and emotional problems. Interviewers read five statements to youth, who reported how true (very, somewhat, or not) each statement was about their general behavior. The five statements concerned general obedience, worry and anxiety, feel-ing unhappy or depressed, getting along better with adults than with peers, and task completion and attention span. Raw SDQ scores can range from 0 (no behavioral or emotional problems) to 10 (severe behavioral or emotional problems). A score of 6 or higher is a commonly used indicator of serious behavioral or emotional problems.
Risky and Criminal BehaviorSimilar to the approach used in the followup survey for the interim impacts evaluation, our approach measured risky and criminal behavior through both youth reports and data matches with criminal justice records. To reduce the likelihood of youth underreporting sensitive or illegal behaviors, we administered many of the sensitive items in the survey about risky behaviors via audio-CASI. We constructed three indices: risky, problem, and delinquent behavior. The risky be-havior index is the fraction of 4 risky behaviors in which the youth reported ever having engaged: smoking, alcohol use, marijuana use, and sex. The delinquency index is, similarly, the fraction of 8 delinquent behaviors: drug selling, gang involvement, gun possession, attack on another person, property destruction, theft of an item worth less than $50, theft of an item worth more than $50, and other property crime. Finally, the behavior problems index is the fraction of 11 behaviors that the youth reported were true or sometimes true (as opposed to not true) of their behavior in the 6 months before the survey interview: trouble paying attention, lying or cheating, teasing others, disobeying parents, trouble sitting still, hot temper, would rather be alone, hanging out with kids who get in trouble, disobeying at school, not getting along with other kids, and trouble getting along with teachers.
ResultsMTO had few detectable long-term effects on achievement and educational outcomes, physical health, and several aspects of risky behavior. Children assigned to the experimental and Section 8 groups had similar scores on reading and math achievement tests compared with those in the control group. This finding held true for children who had not yet enrolled in school at baseline and who would have experienced particularly large MTO-induced changes in neighborhood en-vironments very early in their development of cognitive, social-emotional, and behavioral skills. A pattern of generally beneficial effects on female youth and some detrimental effects on male youth echoes, but is more muted than, the pattern the followup survey for the interim impacts evaluation found (Kling, Liebman, and Katz, 2007; Kling, Ludwig, and Katz, 2005). Male youth who moved through MTO engaged in relatively more of some risky behaviors (smoking) than male youth in

The Long-Term Effects of Moving to Opportunity on Youth Outcomes
149Cityscape
the control group, and female youth who moved through MTO experienced declines in some risky behaviors (drinking) and improvements in mental health outcomes compared with female youth in the control group.
Neighborhood and School EnvironmentsLudwig (2012) showed MTO effects on neighborhood poverty and a range of neighborhood characteristics with improved reports of safety, crime rates, and household victimization in the experimental group compared with effects on households in the control group. Whether youth from these households experience the same types of neighborhood differences depends on where they spend their time and, in some cases, whether they continue to live with their parents. Like the adults whose reports about neighborhood safety Ludwig (2012) described, MTO youth reported feeling safer and witnessing less drug use and selling in their neighborhoods, as exhibit 1 shows.
OutcomeControl Mean
Experimental vs. Control
Section 8 vs. Control Res pon dents
(N)ITT TOT ITT TOT
Exhibit 1
Youth Neighborhood Safety and Social Networks
ITT = intention to treat. SR = self-reported. TOT = treatment on the treated.
* = p < .05. ~ = p < .10.
Notes: Robust standard errors shown in parentheses. The control mean is unadjusted. Unless otherwise indicated, the control mean and effects are expressed as shares of the sample in the category (for example, a control mean of 0.250 for working would indicate that 25 percent of the control group was working). Experimental and Section 8 effects were estimated jointly using an ordinary least squares regression model controlling for baseline covariates, weighted, and clustering on family. Youth and grown children effects by gender were estimated as an interaction with treatment status. See the forthcoming technical appendixes to Sanbonmatsu et al. (2011) for details.
Source: MTO youth long-term survey
Neighborhood safety [SR]
Feels safe or very safe during the day
0.801 0.018 0.037 – 0.012 – 0.018 4,863(0.016) (0.033) (0.018) (0.026)
Feels safe or very safe at night
0.540 0.035~ 0.074~ 0.019 0.028 4,862(0.021) (0.043) (0.022) (0.033)
Saw drugs being sold or used in the neighborhood in the past 30 days
0.388 – 0.056* – 0.116* – 0.041* – 0.062* 4,879(0.020) (0.040) (0.021) (0.031)
Any household member was a crime victim in the past 6 months (ages 13 to 20)
0.246 – 0.027 – 0.056 – 0.020 – 0.030 4,618(0.018) (0.038) (0.020) (0.029)
Social networks [SR]
Visits with baseline friends at least a few times a week
0.280 – 0.035* – 0.073* – 0.038* – 0.057* 5,001(0.017) (0.036) (0.018) (0.027)

150
Gennetian, Sciandra, Sanbonmatsu, Ludwig, Katz, Duncan, Kling, and Kessler
Moving to Opportunity
One might expect such effects on neighborhood poverty and safety to translate to improvements in schools. Exhibit 2 shows, however, that MTO had relatively modest and somewhat mixed effects on school environments. We present youths’ average school by combining characteristics for all schools and weighting them by the number of grades attended at each school. Both the experimental and Section 8 treatments had statistically significant effects on the racial and socioeconomic com - position and schoolwide student academic performance of the new schools attended by youth in those groups. Youth in the control group, however, attended schools that, on average, had over-whelmingly (about 90 percent) minority enrollments, and most (70 percent) students eligible for
OutcomeControl Mean
Experimental vs. Control
Section 8 vs. Control Res pon dents
(N)ITT TOT ITT TOT
Exhibit 2
Characteristics of Schools Attended by Youth and Youth Perceptions of School Climate
CCD = common core of data. ITT = intention to treat. PSS = Private School Universe Survey. SLAD = school-level assessment data from the National Longitudinal School-Level State Assessment Score Database. SR = self-reported. TOT = treatment on the treated.
* = p < .05. ~ = p < .10.
Notes: Robust standard errors shown in parentheses. The control mean is unadjusted. Unless otherwise indicated, the control mean and effects are expressed as shares of the sample in the category (for example, a control mean of 0.250 for working would indicate that 25 percent of the control group was working). Experimental and Section 8 effects were estimated jointly using an ordinary least squares regression model controlling for baseline covariates, weighted, and clustering on family. Youth and grown children effects by gender were estimated as an interaction with treatment status. See the forthcoming technical appendixes to Sanbonmatsu et al. (2011) for details. The number of students is based on enrollment as of October of each year. The percentile ranking measure includes schools through eighth grade only for New York and Maryland. The school climate index is the fraction of positive responses on five items (students get teased if they study hard, discipline is fair, often feels put down by teachers, feels safe in school, and teachers interested in students). If the youth agreed or strongly agreed with a positive school climate item (for example, fair discipline), or if the youth disagreed or strongly disagreed with a negative school climate item (for example, students teased if they study hard), then the response was counted as positive. Average school characteristics are weighted by the amount of time youth spent at each school.
Source: MTO youth long-term survey
Characteristics of the average school attended by youth ages 10 to 20
Share minority [CCD, PSS]
0.904 – 0.037* – 0.077* – 0.016~ – 0.023~ 5,077(0.008) (0.016) (0.008) (0.012)
Share eligible for free lunch [CCD]
0.701 – 0.048* – 0.101* – 0.026* – 0.039* 5,043(0.007) (0.015) (0.008) (0.012)
Number of students [CCD, PSS]
927.1 25.6~ 53.4~ 41.8* 62.5* 5,077(14.9) (31.1) (17.5) (26.1)
Pupil-teacher ratio [CCD, PSS]
17.834 – 0.103 – 0.214 – 0.061 – 0.091 5,076(0.103) (0.215) (0.113) (0.170)
School-level percentile ranking on state exam [SLAD]
18.684 3.070* 6.430* 1.218~ 1.810~ 4,884(0.651) (1.364) (0.661) (0.983)
School climate index among youth ages 10 to 17 [SR]
All 0.797 0.020~ 0.043~ – 0.002 – 0.003 3,328(0.011) (0.023) (0.012) (0.017)
Female 0.786 0.025~ 0.052~ 0.006 0.010 1,694(0.015) (0.032) (0.016) (0.025)
Male 0.807 0.016 0.034 – 0.011 – 0.015 1,634(0.014) (0.031) (0.016) (0.022)
The Long-Term Effects of Moving to Opportunity on Youth Outcomes
151Cityscape
8 The analysis is limited to youth younger than age 18 as of December 2007, because older youth had to recall secondary school experiences from multiple years before the interview.
free or reduced-priced lunches, so despite these MTO effects, the new schools differed only very slightly on these characteristics. For example, with a TOT estimate of 7.7 percentage points on share minority and a TOT estimate of 10.1 percentage points on share eligible for free lunch, youth who moved with the low-poverty voucher were still in schools that had 82.3 percent minority enrollments and where more than one-half of the student population was eligible for free or reduced-price lunches. Youth in both treatment groups were also more likely to attend larger schools than were youth in the control group, but an increase in the pupil-to-teacher ratio did not accompany the increase in student body size. Although MTO effects on school characteristics are mixed, youth in the experimental group were more likely to report a favorable climate in their most recent school, and the effects appear to be driven by interactions with teachers; youth in the experimental group were more likely to report that teachers were interested in students and less likely to report that they felt put down by their teachers.8
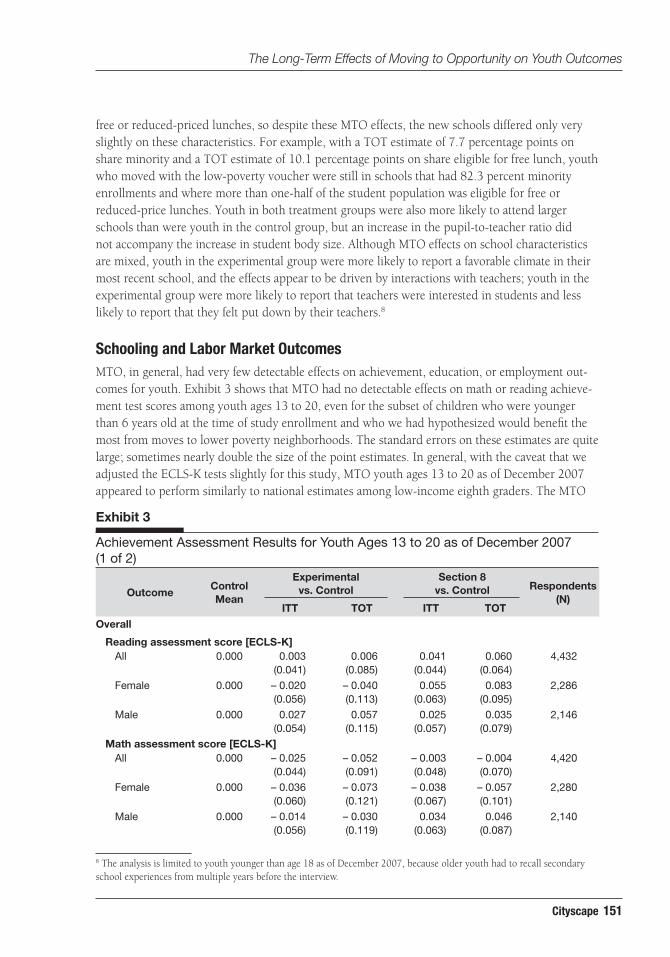
Schooling and Labor Market OutcomesMTO, in general, had very few detectable effects on achievement, education, or employment out-comes for youth. Exhibit 3 shows that MTO had no detectable effects on math or reading achieve-ment test scores among youth ages 13 to 20, even for the subset of children who were younger than 6 years old at the time of study enrollment and who we had hypothesized would benefit the most from moves to lower poverty neighborhoods. The standard errors on these estimates are quite large; sometimes nearly double the size of the point estimates. In general, with the caveat that we adjusted the ECLS-K tests slightly for this study, MTO youth ages 13 to 20 as of December 2007 appeared to perform similarly to national estimates among low-income eighth graders. The MTO
OutcomeControl Mean
Experimental vs. Control
Section 8 vs. Control Res pon dents
(N)ITT TOT ITT TOT
Exhibit 3
Achievement Assessment Results for Youth Ages 13 to 20 as of December 2007 (1 of 2)
Overall
Reading assessment score [ECLS-K]All 0.000 0.003 0.006 0.041 0.060 4,432
(0.041) (0.085) (0.044) (0.064)
Female 0.000 – 0.020 – 0.040 0.055 0.083 2,286(0.056) (0.113) (0.063) (0.095)
Male 0.000 0.027 0.057 0.025 0.035 2,146(0.054) (0.115) (0.057) (0.079)
Math assessment score [ECLS-K]All 0.000 – 0.025 – 0.052 – 0.003 – 0.004 4,420
(0.044) (0.091) (0.048) (0.070)
Female 0.000 – 0.036 – 0.073 – 0.038 – 0.057 2,280(0.060) (0.121) (0.067) (0.101)
Male 0.000 – 0.014 – 0.030 0.034 0.046 2,140(0.056) (0.119) (0.063) (0.087)

152
Gennetian, Sciandra, Sanbonmatsu, Ludwig, Katz, Duncan, Kling, and Kessler
Moving to Opportunity
OutcomeControl Mean
Experimental vs. Control
Section 8 vs. Control Res pon dents
(N)ITT TOT ITT TOT
Exhibit 3
Achievement Assessment Results for Youth Ages 13 to 20 as of December 2007 (2 of 2)
ECLS-K = achievement assessment from the Early Childhood Longitudinal Study-Kindergarten cohort study. ITT = intention to treat. TOT = treatment on the treated.
Notes: Robust standard errors shown in parentheses. The control mean is unadjusted. Unless otherwise indicated, the control mean and effects are expressed as shares of the sample in the category (for example, a control mean of 0.250 for working would indicate that 25 percent of the control group was working). Experimental and Section 8 effects were estimated jointly using an ordinary least squares regression model controlling for baseline covariates, weighted, and clustering on family. Youth and grown children effects by gender were estimated as an interaction with treatment status. See the forthcoming technical appendixes to Sanbonmatsu et al. (2011) for details. The reading and math achievement assessment scores are theta scores transformed into z-scores via standardization on the mean and standard deviation for control group youth ages 13 to 20. Results reported differ slightly from those in Sanbonmatsu et al. (2011) because here standardization was separate by gender in the overall results and by baseline age group and gender in the baseline age results, whereas Sanbonmatsu et al. standard-ized only on the overall control group mean and standard deviation. The overall (male and female combined) z-score values combine the z-scores by gender and thus are not themselves standardized (the control mean is 0 but the standard deviation is not exactly 1).
Source: MTO youth long-term survey
Baseline ages 0 to 5
Reading assessment score [ECLS-K]All 0.000 0.026 0.055 0.078 0.105 2,542
(0.052) (0.112) (0.055) (0.074)
Female 0.000 0.021 0.044 0.085 0.119 1,309(0.072) (0.152) (0.079) (0.110)
Male 0.000 0.030 0.067 0.069 0.090 1,233(0.069) (0.152) (0.070) (0.091)
Math assessment score [ECLS-K]All 0.000 – 0.057 – 0.123 – 0.060 – 0.081 2,535
(0.057) (0.121) (0.059) (0.079)
Female 0.000 – 0.072 – 0.150 – 0.072 – 0.100 1,306(0.080) (0.169) (0.083) (0.115)
Male 0.000 – 0.042 – 0.093 – 0.048 – 0.063 1,229(0.072) (0.157) (0.079) (0.103)
Baseline ages 6 to 11
Reading assessment score [ECLS-K]All 0.000 – 0.028 – 0.055 – 0.006 – 0.009 1,890
(0.061) (0.120) (0.070) (0.112)
Female 0.000 – 0.066 – 0.127 0.021 0.035 977(0.085) (0.163) (0.102) (0.173)
Male 0.000 0.013 0.027 – 0.035 – 0.053 913(0.084) (0.169) (0.092) (0.140)
Math assessment score [ECLS-K]All 0.000 0.020 0.039 0.080 0.129 1,885
(0.063) (0.124) (0.073) (0.118)
Female 0.000 0.020 0.039 0.028 0.047 974(0.083) (0.160) (0.103) (0.175)
Male 0.000 0.017 0.035 0.135 0.203 911(0.086) (0.174) (0.099) (0.149)

The Long-Term Effects of Moving to Opportunity on Youth Outcomes
153Cityscape
youth mean for the 10-point routing score for reading is about 0.6 points higher than the national mean for eighth graders in the lowest quintile of socioeconomic status; for math, the MTO youth mean is about 0.4 points lower than the comparable national average (Najarian et al., 2009).
Exhibit 4 shows that, in general, MTO also had few detectable effects on measures of educational completion and employment. As of the survey interview (late 2008 to early 2010), about one-fifth of the older youth (ages 15 to 20 as of December 2007) sample was currently idle; that is, neither working nor in school. Another way of characterizing this finding is that about 80 percent of the older youth sample was educationally on track; that is, was currently in school or had received a high school diploma or GED. About one-fourth had attended any college, most at 2-year and public colleges (control group means of 14 percent and 15 percent, respectively). About 40 percent reported being currently employed. Self-reported employment rates appear lower for experimental group members, a finding the UI data corroborated (although variation by site merits further investigation).9
MTO had few detectable effects on grown children’s schooling, completed education, and participation in employment or training, based on proxy reports from adults, UI records, and postsecondary enroll - ment data from NSC. Parents reported that nearly 40 percent of grown children were idle and that about 70 percent had a high school diploma or GED, and NSC data indicate that about 20 percent had attended college since 2007 (as with the younger youth sample, public and 2-year colleges com - prised most of the older youth sample’s enrollment). Both parent reports and UI records showed that about one-half of the grown children sampled were employed.10 On all of these measures, female grown children look better than their male counterparts, with mean differences of 10 to 15 percen tage points.
9 The UI data for this finding came from Maryland, Massachusetts, Illinois, and California; data from New York were not available.10 Again, the UI data for this finding came from Maryland, Massachusetts, Illinois, and California; data from New York were not available.
OutcomeControl Mean
Experimental vs. Control
Section 8 vs. Control Res pon dents
(N)ITT TOT ITT TOT
Exhibit 4
Education and Employment Outcomes for Youth Ages 15 to 20 as of December 2007 (1 of 2)
Currently idle (neither employed nor enrolled in school) [SR]
All 0.215 0.007 0.014 0.026 0.039 3,604(0.018) (0.038) (0.020) (0.031)
Female 0.194 0.024 0.049 0.031 0.048 1,838(0.024) (0.048) (0.027) (0.043)
Male 0.235 – 0.011 – 0.023 0.022 0.032 1,766(0.027) (0.058) (0.031) (0.045)
Educationally on track [SR]
All 0.814 – 0.014 – 0.028 – 0.029 – 0.044 3,614(0.018) (0.037) (0.021) (0.031)
Female 0.827 – 0.007 – 0.015 0.008 0.012 1,842(0.023) (0.046) (0.026) (0.040)
Male 0.801 – 0.019 – 0.041 – 0.066* – 0.096* 1,772(0.026) (0.055) (0.029) (0.042)

154
Gennetian, Sciandra, Sanbonmatsu, Ludwig, Katz, Duncan, Kling, and Kessler
Moving to Opportunity
OutcomeControl Mean
Experimental vs. Control
Section 8 vs. Control Res pon dents
(N)ITT TOT ITT TOT
Exhibit 4
Education and Employment Outcomes for Youth Ages 15 to 20 as of December 2007 (2 of 2)
ITT = intention to treat. NSC = National Student Clearinghouse. SR = self-reported. TOT = treatment on the treated. UI = unemployment insurance administrative records.
* = p < .05. ~ = p < .10.
Notes: Robust standard errors shown in parentheses. The control mean is unadjusted. Unless otherwise indicated, the control mean and effects are expressed as shares of the sample in the category (for example, a control mean of 0.250 for working would indicate that 25 percent of the control group was working). Experimental and Section 8 effects were estimated jointly using an ordinary least squares regression model controlling for baseline covariates, weighted, and clustering on family. Youth and grown chil dren effects by gender were estimated as an interaction with treatment status. See the forthcoming technical appendixes to Sanbonmatsu et al. (2011) for details. On-track youth are those who were currently in school or received a high school diploma or general equivalency diploma. Currently enrolled in school also includes youth who were on summer vaca-tion. UI data look only at the last four common calendar quarters (fourth quarter of 2007 through third quarter of 2008).
Source: MTO youth long-term survey
Currently enrolled in school [SR]
All 0.615 0.018 0.037 – 0.019 – 0.029 3,621(0.020) (0.041) (0.022) (0.034)
Female 0.637 0.001 0.002 0.001 0.001 1,845(0.027) (0.054) (0.030) (0.047)
Male 0.594 0.036 0.077 – 0.039 – 0.057 1,776(0.028) (0.061) (0.030) (0.044)
Currently employed [SR]
All 0.395 – 0.046* – 0.095* – 0.033 – 0.050 3,604(0.021) (0.043) (0.022) (0.034)
Female 0.410 – 0.051~ – 0.104~ – 0.042 – 0.066 1,838(0.029) (0.059) (0.031) (0.049)
Male 0.381 – 0.041 – 0.087 – 0.025 – 0.036 1,766(0.030) (0.064) (0.033) (0.049)
Employed [UI]
All 0.256 – 0.036* – 0.076* 0.004 0.006 3,490(0.015) (0.032) (0.018) (0.025)
Female 0.272 – 0.030 – 0.063 0.012 0.017 1,691(0.024) (0.051) (0.026) (0.037)
Male 0.241 – 0.045* – 0.093* – 0.002 – 0.003 1,799(0.021) (0.044) (0.023) (0.032)
Attended any college since 2007 [NSC]
All 0.262 – 0.014 – 0.029 – 0.021 – 0.033 4,717(0.016) (0.033) (0.017) (0.025)
Female 0.305 – 0.011 – 0.023 0.000 0.001 2,300(0.023) (0.048) (0.025) (0.039)
Male 0.222 – 0.016 – 0.033 – 0.042* – 0.064* 2,417(0.021) (0.044) (0.021) (0.032)
The Long-Term Effects of Moving to Opportunity on Youth Outcomes
155Cityscape
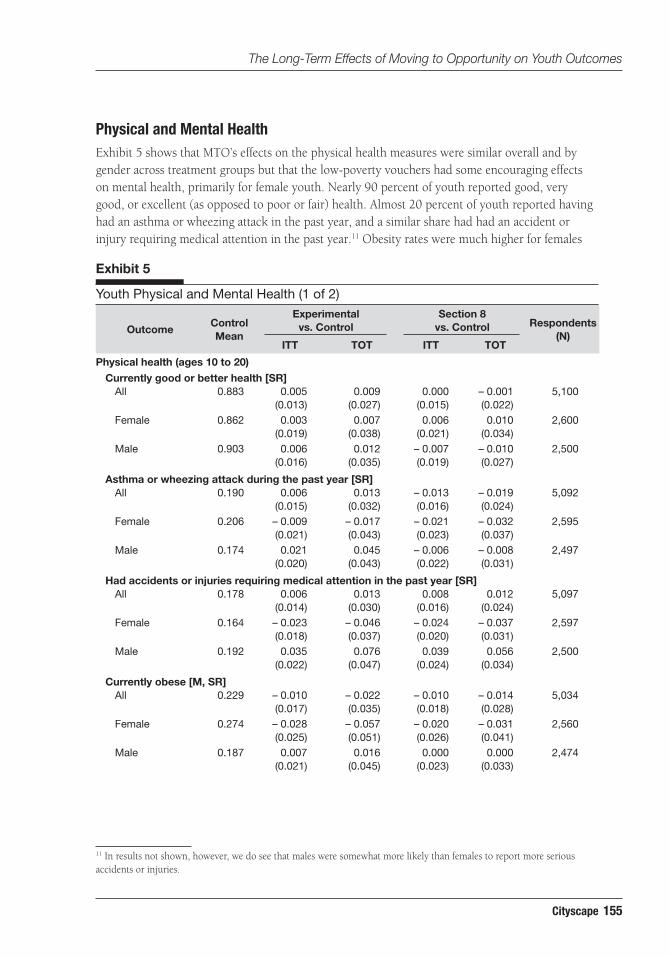
Physical and Mental HealthExhibit 5 shows that MTO’s effects on the physical health measures were similar overall and by gender across treatment groups but that the low-poverty vouchers had some encouraging effects on mental health, primarily for female youth. Nearly 90 percent of youth reported good, very good, or excellent (as opposed to poor or fair) health. Almost 20 percent of youth reported having had an asthma or wheezing attack in the past year, and a similar share had had an accident or injury requiring medical attention in the past year.11 Obesity rates were much higher for females
OutcomeControl Mean
Experimental vs. Control
Section 8 vs. Control Res pon dents
(N)ITT TOT ITT TOT
Exhibit 5
Youth Physical and Mental Health (1 of 2)
Physical health (ages 10 to 20)
Currently good or better health [SR]All 0.883 0.005 0.009 0.000 – 0.001 5,100
(0.013) (0.027) (0.015) (0.022)Female 0.862 0.003 0.007 0.006 0.010 2,600
(0.019) (0.038) (0.021) (0.034)Male 0.903 0.006 0.012 – 0.007 – 0.010 2,500
(0.016) (0.035) (0.019) (0.027)
Asthma or wheezing attack during the past year [SR]All 0.190 0.006 0.013 – 0.013 – 0.019 5,092
(0.015) (0.032) (0.016) (0.024)Female 0.206 – 0.009 – 0.017 – 0.021 – 0.032 2,595
(0.021) (0.043) (0.023) (0.037)Male 0.174 0.021 0.045 – 0.006 – 0.008 2,497
(0.020) (0.043) (0.022) (0.031)
Had accidents or injuries requiring medical attention in the past year [SR]All 0.178 0.006 0.013 0.008 0.012 5,097
(0.014) (0.030) (0.016) (0.024)Female 0.164 – 0.023 – 0.046 – 0.024 – 0.037 2,597
(0.018) (0.037) (0.020) (0.031)Male 0.192 0.035 0.076 0.039 0.056 2,500
(0.022) (0.047) (0.024) (0.034)
Currently obese [M, SR]All 0.229 – 0.010 – 0.022 – 0.010 – 0.014 5,034
(0.017) (0.035) (0.018) (0.028)Female 0.274 – 0.028 – 0.057 – 0.020 – 0.031 2,560
(0.025) (0.051) (0.026) (0.041)Male 0.187 0.007 0.016 0.000 0.000 2,474
(0.021) (0.045) (0.023) (0.033)
11 In results not shown, however, we do see that males were somewhat more likely than females to report more serious accidents or injuries.

156
Gennetian, Sciandra, Sanbonmatsu, Ludwig, Katz, Duncan, Kling, and Kessler
Moving to Opportunity
OutcomeControl Mean
Experimental vs. Control
Section 8 vs. Control Res pon dents
(N)ITT TOT ITT TOT
Exhibit 5
Youth Physical and Mental Health (2 of 2)
ITT = intention to treat. M = measured. SR = self-reported. TOT = treatment on the treated.
* = p < .05. ~ = p < .10.
Notes: Robust standard errors shown in parentheses. The control mean is unadjusted. Unless otherwise indicated, the control mean and effects are expressed as shares of the sample in the category (for example, a control mean of 0.250 for working would indicate that 25 percent of the control group was working). Experimental and Section 8 effects were estimated jointly using an ordinary least squares regression model controlling for baseline covariates, weighted, and clustering on family. Youth and grown chil dren effects by gender were estimated as an interaction with treatment status. See the forthcoming technical appendixes to Sanbonmatsu et al. (2011) for details. Obesity is defined according to the International Obesity Task Force. The psychological distress index consists of six items (sadness, nervousness, restlessness, hopelessness, feeling that everything is an effort, worthlessness) scaled on a score from 0 (no distress) to 24 (highest distress) and then converted to z-scores using the mean and standard deviation of control group youth. Results reported differ slightly from those in Sanbonmatsu et al. (2011) because here standardization was separate by gender, whereas Sanbonmatsu et al. standardized only on the overall control group mean and standard deviation. The overall (male and female combined) z-score values combine the z-scores by gender and thus are not themselves standardized (the control mean is 0 but the standard deviation is not exactly 1). The serious behavioral or emotional problems measure is based on the strengths and difficulties questionnaire, which consisted of five behavioral and emotional items (obedience, worry or anxiety, unhappiness, getting along better with adults than peers, at-tention span) scaled on score from 0 (no behavioral or emotional problems) to 12 (severe behavioral or emotional problems). A score of 6 or higher indicates serious behavioral or emotional problems.
Source: MTO youth long-term survey
Mental health (ages 13 to 20)
Psychological distress index (K6) z-score, past month (higher score indicates greater distress) [SR]All 0.000 – 0.038 – 0.079 0.038 0.056 4,644
(0.041) (0.086) (0.047) (0.070)
Female 0.000 – 0.116* – 0.234* – 0.013 – 0.020 2,371(0.056) (0.113) (0.065) (0.101)
Male 0.000 0.041 0.088 0.087 0.124 2,273(0.056) (0.120) (0.063) (0.089)
Serious behavioral or emotional problems [SR]All 0.103 – 0.022~ – 0.046~ 0.019 0.029 4,644
(0.011) (0.024) (0.014) (0.021)
Female 0.127 – 0.033* – 0.068* 0.030 0.047 2,371(0.017) (0.034) (0.021) (0.032)
Male 0.081 – 0.010 – 0.021 0.007 0.010 2,273(0.015) (0.032) (0.017) (0.024)
(27 percent) than for males (19 percent).12 Self-reports of overall health, obesity, asthma, and injury rates were similar among youth in the experimental, Section 8, and control groups. For mental health, however, females in the experimental group were 0.12 standard deviations lower than their counterparts in the control group on the K6. They also were 3.3 percentage points less likely to have serious behavioral or emotional problems compared with a mean of 12.7 percent for
12 These MTO obesity rates appear to be higher than even the low socioeconomic status (SES) group in one national study (Sherwood et al., 2008). That study showed that about 34 percent of females and 32 percent of males in the low SES group were overweight, a less stringent standard than obese. For comparison, MTO youth overweight rates were 48 and 42 percent for females and males, respectively.

The Long-Term Effects of Moving to Opportunity on Youth Outcomes
157Cityscape
the control group, a more than 25-percent reduction in prevalence. These results are consistent with results from the interim impacts evaluation (Kling, Liebman, and Katz, 2007; Orr et al., 2003) and with MTO qualitative investigations in suggesting that female youth responded more strongly to the new and safer social environments in the neighborhoods to which the families in the experimental group moved (Popkin, Leventhal, and Weismann, 2008).
Via proxy reports from the adults, MTO had few detectable effects on the physical and mental health of grown children. Parents reported less than 5 percent of grown children as having a physical health problem that kept them from normal activities and less than 10 percent as having had a chronic health issue, such as cancer or a heart problem. About 10 percent had depression or another serious mental health problem, and about 5 percent had an alcohol or drug problem. Physical health problems did not vary by gender, but parents were somewhat more likely to report males as having a mental health or substance abuse problem.
Risky and Delinquent BehaviorExhibit 6 shows few detectable effects on the three risky and problem behavior indices used in the long-term survey to measure a composite of behaviors related to drinking, drug abuse, sexual activity, and gun possession. Although MTO had no detectable effects on the overall risky behavior index, males in both treatment groups reported higher rates of smoking than males in the control
OutcomeControl Mean
Experimental vs. Control
Section 8 vs. Control Res pon dents
(N)ITT TOT ITT TOT
Exhibit 6
Risky and Criminal Behavior Outcomes for Older Youth (1 of 2)
Risky and delinquent behavior for youth ages 13 to 20
Risky behavior index [SR]All 0.467 – 0.001 – 0.002 0.007 0.010 4,623
(0.014) (0.029) (0.015) (0.022)
Female 0.442 – 0.027 – 0.054 – 0.017 – 0.026 2,358(0.019) (0.037) (0.020) (0.031)
Male 0.491 0.025 0.053 0.029 0.042 2,265(0.018) (0.039) (0.020) (0.028)
Behavior problems index [SR]All 0.379 0.004 0.008 0.009 0.013 4,629
(0.010) (0.022) (0.011) (0.017)
Female 0.371 – 0.007 – 0.014 – 0.010 – 0.015 2,361(0.014) (0.028) (0.015) (0.024)
Male 0.387 0.015 0.032 0.027~ 0.038~ 2,268(0.015) (0.032) (0.016) (0.023)
Delinquency index [SR]All 0.146 – 0.002 – 0.004 0.008 0.012 4,625
(0.008) (0.017) (0.009) (0.014)
Female 0.110 – 0.006 – 0.011 – 0.005 – 0.008 2,360(0.009) (0.019) (0.010) (0.016)
Male 0.181 0.002 0.004 0.021 0.030 2,265(0.013) (0.029) (0.016) (0.022)

158
Gennetian, Sciandra, Sanbonmatsu, Ludwig, Katz, Duncan, Kling, and Kessler
Moving to Opportunity
OutcomeControl Mean
Experimental vs. Control
Section 8 vs. Control Res pon dents
(N)ITT TOT ITT TOT
CJR = criminal justice records. ITT = intention to treat. SR = self-reported. TOT = treatment on the treated.
* = p < .05. ~ = p < .10.
Notes: Robust standard errors shown in parentheses. The control mean is unadjusted. Unless otherwise indicated, the control mean and effects are expressed as shares of the sample in the category (for example, a control mean of 0.250 for working would indicate that 25 percent of the control group was working). Experimental and Section 8 effects were estimated jointly using an ordinary least squares regression model controlling for baseline covariates, weighted, and clustering on family. Youth and grown chil dren effects by gender were estimated as an interaction with treatment status. See the forthcoming technical appendixes to Sanbonmatsu et al. (2011) for details. The risky behavior index is the fraction of four risky behaviors (smoking, alcohol use, marijuana use, and sex) that the youth reports ever having exhibited. The behavior problems index is the fraction of 11 problem behaviors (for example, difficulty concentrating and having a strong temper) that the youth reported as true or sometimes true at present or in the past 6 months. The delinquency index is the fraction of eight delinquent behaviors (for example, carrying a gun and destroying property) that the youth reported ever having exhibited. Violent crime arrests involve charges of force or threat of force including homicide, rape, robbery, assault, kidnapping, and weapons charges. Property crime arrests involve taking money or property and include burglary, motor vehicle theft, larceny, trespassing, and receiving stolen property.
Source: MTO youth long-term survey
Exhibit 6
Risky and Criminal Behavior Outcomes for Older Youth (2 of 2)
Ever smoked [SR]All 0.312 0.042* 0.088* 0.043* 0.064* 4,618
(0.019) (0.039) (0.020) (0.030)
Female 0.297 0.022 0.044 0.016 0.026 2,355(0.025) (0.051) (0.028) (0.043)
Male 0.327 0.062* 0.134* 0.069* 0.098* 2,263(0.025) (0.054) (0.028) (0.040)
Ever had alcoholic drink [SR]All 0.534 – 0.032 – 0.067 – 0.017 – 0.026 4,618
(0.020) (0.041) (0.021) (0.032)
Female 0.541 – 0.061* – 0.124* – 0.032 – 0.050 2,355(0.026) (0.053) (0.029) (0.045)
Male 0.528 – 0.003 – 0.006 – 0.004 – 0.005 2,263(0.027) (0.058) (0.029) (0.041)
Number of arrests by crime type for youth ages 15 to 20
Violent crime arrests [CJR]All 0.325 0.043 0.091 – 0.062 – 0.094 4,717
(0.037) (0.078) (0.039) (0.059)
Female 0.155 0.027 0.055 – 0.048 – 0.074 2,300(0.033) (0.069) (0.033) (0.050)
Male 0.481 0.060 0.128 – 0.076 – 0.115 2,417(0.064) (0.138) (0.068) (0.102)
Property crime arrests [CJR]All 0.239 0.065* 0.136* – 0.013 – 0.019 4,717
(0.031) (0.064) (0.034) (0.051)
Female 0.091 0.044~ 0.090~ – 0.010 – 0.015 2,300(0.026) (0.053) (0.023) (0.035)
Male 0.375 0.086 0.183 – 0.016 – 0.025 2,417(0.054) (0.117) (0.060) (0.090)

The Long-Term Effects of Moving to Opportunity on Youth Outcomes
159Cityscape
group, and females in the experimental group reported lower rates of drinking than females in the control group.13 In general, the number of violent and property crime arrests for male youth in the control group is about 0.86, more than 3.5 times the number for female youth. MTO increased property crime arrests among female and male youth in the experimental group relative to their peers in the control group, although the point estimates are imprecisely estimated and not quite statistically significant (p = .12). Unlike patterns observed with the followup survey data for the interim impacts evaluation, the number of violent crime arrests, at about 0.48 for males and 0.16 for females, is similar across groups. In results not shown, however, males in the experimental group appear to have a lower number of arrests for drug selling or distribution (roughly 11 percent were ever arrested for drug possession and 8.7 percent were ever arrested for drug distribution). We have a bit more confidence in this preliminary finding, which calls for further investigation, because the pattern is apparent among both older male youth and grown male children. MTO showed no detectable effects on the property or violent crime arrests of grown children.
Discussion and ConclusionsYouth in economically disadvantaged neighborhoods fare less well across a host of educational, health, and behavioral outcomes than do youth who grow up in more economically advantaged neighborhoods. Isolating the extent to which neighborhoods per se contribute to this variation is important for the design of means-tested housing programs and other place-based programs, but isolating neighborhood effects has been challenging in practice because of the difficulty in uncoupling neighborhood effects from so many other aspects of the youth and their families that are associated with moving to and staying in particular places. The MTO study helped overcome these issues of selection bias.
In conducting the long-term survey for the final impacts evaluation, we discovered that MTO had a number of unanticipated effects on youth health (as found with the adults), particularly benefiting female mental health outcomes, but few detectable effects on achievement, education, employment, and a range of health and risky behavior outcomes among either youth or grown children. These patterns of findings are quite similar to what the followup survey for the interim impacts evaluation found. In particular, gender differences in MTO’s effects appear for this cohort of youth in the long-term survey for the final impacts evaluation just as they did for a slightly older cohort of youth in the followup survey for the interim impacts evaluation.
MTO’s effects on achievement and related schooling outcomes were disappointing, particularly among the youngest cohort of children at MTO enrollment, whom we hypothesized would benefit the most from MTO moves into lower poverty neighborhoods. Although many MTO parents seem to believe that the quality of local public schools is an important mechanism through which neigh-borhood location may influence children’s academic achievement and attainment (Briggs, Popkin, and Goering, 2010), MTO had more modest effects on school quality than on other neighborhood
13 An alternative version of the risky behavior index, not presented here, includes a measure of ever having been pregnant (female) or having impregnated someone (male) instead of the current item on sexual activity. MTO’s effects on the index including the pregnancy item do not statistically differ across groups. Roughly 20 percent of male youth and 27 percent of female youth reported ever having impregnated someone or ever having been pregnant.
160
Gennetian, Sciandra, Sanbonmatsu, Ludwig, Katz, Duncan, Kling, and Kessler
Moving to Opportunity
social conditions. Children assigned to the two treatment groups attended schools that served stu - dents who were slightly less likely to have very low test scores, be poor, or be members of racial and ethnic minority groups compared with the student served in the schools that children in the control group attended, but they were still in generally low-performing schools that served over - whelmingly poor and majority-minority student populations. These findings raise questions about whether investing directly in schools might be more effective for improving schooling outcomes among economically disadvantaged youth (see a recent review of literature in Duncan and Murnane, 2011). For example, studies have found Success for All, a comprehensive reading intervention that involves extra time for reading, ability grouping, frequent assessment, and remediation (including tutoring), to improve reading scores for elementary and perhaps middle schoolchildren (Borman et al., 2007; Chamberlain et al., 2007). High schools organized as career academies that integrate academic and technical curricula and work-based learning opportunities with local employers pro-duced sizable long-term (11-year) earnings improvements for youth in low-income urban settings (Kemple, 2008).
The MTO design is not well suited to answer how or why MTO produced the effects it did, partic-ularly the differences between females and males. The survey data measured several of the proposed mechanisms, however, and future research will investigate them. Qualitative interviews can further deepen our understanding of how MTO altered the lives of families. Qualitative interviews with families after the interim followup survey suggest that the nature of how boys and girls interact socially with peers may mean that girls are more likely to successfully adapt to life in low-poverty areas. Parents reported that girls were more likely to visit with friends on their porches or inside their homes, in part because they placed their girls on a shorter leash than they did their boys. Boys, on the other hand, often hang out in public spaces, elevating the risk for conflict with neighbors and police and increasing their exposure to delinquent peer groups and opportunities to engage in delinquent activities themselves (Clampet-Lundquist et al., 2006; Popkin, Leventhal, and Weismann, 2008).
MTO generated large reductions in the neighborhood poverty and improvements in the neighbor-hood safety experienced by families in the two treatment groups relative to the families in the control group during the 10 to 15 years after random assignment. The low-poverty and traditional vouchers led to much smaller changes in MTO children’s school quality than in their residential neighborhood conditions, however. Because of its random-assignment design, MTO provides cru-cial data and compelling evidence on the likely effects on families of such moves from extremely poor to less poor neighborhoods. One difference between the MTO experiment results and those from the broader literature on neighborhood effects is that MTO did not result in many families moving to truly affluent neighborhoods. Another is, of course, that most of that broader literature is non experimental, which raises concerns about the nonrandom sorting of families into neighbor-hoods, even conditional on rich controls for the variables contained in standard data sets. Our overall conclusions about those effects on youth outcomes after 10 to 15 years are similar to those we reached after 4 to 7 years. For educational outcomes in particular, we conclude over both time horizons that if achievement effects exist, they are small and not detectable in our analysis. Most surprisingly, that result holds for children who were very young at the time of their initial moves out of poor neighborhoods.

The Long-Term Effects of Moving to Opportunity on Youth Outcomes
161Cityscape
Authors
Lisa A. Gennetian is a senior research director of economic studies at The Brookings Institution.
Matthew Sciandra is a research analyst at the National Bureau of Economic Research.
Lisa Sanbonmatsu is a senior researcher at the National Bureau of Economic Research.
Jens Ludwig is the McCormick Foundation Professor of Social Service Administration, Law, and Public Policy at the University of Chicago and a research associate at the National Bureau of Economic Research.
Lawrence F. Katz is the Elisabeth Allison Professor of Economics at Harvard University and a research associate at the National Bureau of Economic Research.
Greg J. Duncan is a distinguished professor in the School of Education at the University of Califor- is a distinguished professor in the School of Education at the University of Califor-nia, Irvine.
Jeffrey R. Kling is associate director for economic analysis at the Congressional Budget Office and a faculty research fellow at the National Bureau of Economic Research.
Ronald C. Kessler is the McNeil Family Professor of Health Care Policy at Harvard Medical School.
References
Aneshensel, Carol S., and Clea A. Sucoff. 1996. “The Neighborhood Context of Adolescent Mental Health,” Journal of Health and Social Behavior 37 (4): 293–310.
Angrist, Joshua D., Guido W. Imbens, and Donald B. Rubin. 1996. “Identification of Causal Effects Using Instrumental Variables,” Journal of the American Statistical Association 91 (434): 444–455.
Bagley, Christopher, Solomon Jacobson, and Clare Palmer. 1973. “Social Structure and the Ecolo gical Distribution of Mental Illness, Suicide, and Delinquency,” Psychological Medicine 3 (2): 177–187.
Becker, Gary Stanley, and Kevin M. Murphy. 2000. Social Economics: Market Behavior in a Social Environment, Vol. 2. Cambridge, MA: Belknap Press of Harvard University Press.
Block, Jeanne H. 1983. “Differential Premises Arising From Differential Socialization of the Sexes: Some Conjectures,” Child Development 54 (6): 1335–1354.
Bloom, Howard S. 1984. “Accounting for No-Shows in Experimental Evaluation Designs,” Evaluation Review 8 (2): 225–246.
Bombard, Yvonne, Fiona A. Miller, Robin Z. Hayeems, Denise Avard, and Bartha M. Knoppers. 2010. “Reconsidering Reproductive Benefit Through Newborn Screening: A Systematic Review of Guide-lines on Preconception, Prenatal and Newborn Screening,” European Journal of Human Genetics 18 (7): 751–760.
Borjas, George J. 1995. “Ethnicity, Neighborhoods and Human-Capital Externalities,” American Economic Review 85: 365–390.
162
Gennetian, Sciandra, Sanbonmatsu, Ludwig, Katz, Duncan, Kling, and Kessler
Moving to Opportunity
Borman, Geoffrey D., Robert E. Slavin, Alan C.K. Cheung, Anne M. Chamberlain, Nancy A. Madden, and Bette Chambers. 2007. “Final Reading Outcomes of the National Randomized Field Trial of Success for All,” American Educational Research Journal 44 (3): 701–731.
Bottcher, Jean. 2001. “Social Practices of Gender: How Gender Relates to Delinquency in the Everyday Lives of High-Risk Youths,” Criminology 39 (4): 893–931.
Briggs, Xavier de Souza, Susan J. Popkin, and John Goering. 2010. Moving to Opportunity: The Story of an American Experiment To Fight Ghetto Poverty. New York: Oxford University Press.
Brock, William A., and Steven N. Durlauf. 2001. “Interactions-Based Models.” In Handbook of Econometrics, Vol. 5, edited by James J. Heckman and Edward E. Leamer. Amsterdam, The Nether-lands: North-Holland: 3297–3380.
Brooks-Gunn, Jeanne, Greg J. Duncan, Pamela Kato Klebanov, and Naomi Sealand. 1993. “Do Neighborhoods Influence Child and Adolescent Development?” American Journal of Sociology 99 (2): 353–395.
Burdick-Will, Julia, Jens Ludwig, Stephen W. Raudenbush, Robert J. Sampson, Lisa Sanbonmatsu, and Patrick Sharkey. 2011. “Converging Evidence for Neighborhood Effects on Children’s Test Scores: An Experimental, Quasi-Experimental, and Observational Comparison.” In Whither Oppor-tunity? Rising Inequality, Schools, and Children’s Life Chances, edited by Greg J. Duncan and Richard J. Murnane. New York: Russell Sage Foundation: 255–276.
Carneiro, Pedro, and James J. Heckman. 2003. “Human Capital Policy.” In Inequality in America: What Role for Human Capital Policies? edited by James J. Heckman and Alan B. Krueger. Cambridge, MA: MIT Press: 77–239.
Chalk, Rosemary, and Deborah A. Phillips. 1996. Youth Development and Neighborhood Influences: Challenges and Opportunities. Washington, DC: National Research Council, Board on Children, Youth, and Families.
Chamberlain, Anne, Cecelia Daniels, Nancy A. Madden, and Robert E. Slavin. 2007. “A Random-ized Evaluation of the Success for All Middle School Reading Program,” Middle Grades Research Journal 2 (1): 1–21.
Chase-Lansdale, P. Lindsay, Rachel A. Gordon, Jeanne Brooks-Gunn, and Pamela K. Klebanov. 1997. “Neighborhood and Family Influences on the Intellectual and Behavioral Competence of Preschool and Early School-Age Children.” In Neighborhood Poverty: Context and Consequences for Children, edited by Jeanne Brooks-Gunn, Greg J. Duncan, and J. Lawrence Aber. New York: Russell Sage Foundation: 79–118.
Clampet-Lundquist, Susan, Kathryn Edin, Jeffrey R. Kling, and Greg J. Duncan. 2006. Moving At-Risk Teenagers Out of High-Risk Neighborhoods: Why Girls Fare Better Than Boys. Working paper 509. Princeton, NJ: Princeton University Industrial Relations Section.
Cole, Tim J., Mary C. Bellizzi, Katherine M. Flegal, and William H. Dietz. 2000. “Establishing a Standard Definition for Child Overweight and Obesity Worldwide: International Survey,” British Medical Journal Clinical Research Edition 320 (7244): 1240–1243.
The Long-Term Effects of Moving to Opportunity on Youth Outcomes
163Cityscape
Coleman, John C., and Leo B. Hendry. 1999. The Nature of Adolescence, 3rd ed. London, United Kingdom: Routledge.
Connell, James P., and Bonnie L. Halpern-Felsher. 1997. “How Neighborhoods Affect Educational Outcomes in Middle Childhood and Adolescence: Conceptual Issues and an Empirical Example.” In Neighborhood Poverty: Context and Consequences for Children, edited by Jeanne Brooks-Gunn, Greg J. Duncan, and J. Lawrence Aber. New York: Russell Sage Foundation: 174–199.
Connell, James P., Bonnie L. Halpern-Felsher, Elizabeth Clifford, Warren Crichlow, and Peter Usinger. 1995. “Hanging In There: Behavioral, Psychological, and Contextual Factors Affecting Whether African-American Adolescents Stay in High School,” Journal of Adolescent Research 10 (1): 41–63.
Cook, Philip J., and Kristen Goss. 1996. A Selective Review of the Social-Contagion Literature. Working paper. Durham, NC: Duke University, Sanford Institute of Public Policy.
Corcoran, Mary, Roger Gordon, Deborah Laren, and Gary Solon. 1992. “The Association Between Men’s Economic Status and Their Family and Community Origins,” Journal of Human Resources 27 (4): 575–601.
Crane, Jonathan. 1991. “The Epidemic Theory of Ghettos and Neighborhood Effects on Dropping Out and Teenage Childbearing,” American Journal of Sociology 96 (5): 1226–1259.
Currie, Janet, and Reed Walker. 2011. “Traffic Congestion and Infant Health: Evidence From E-ZPass,” American Economic Journal: Applied Economics 3 (1): 65–90.
Deater-Deckard, Kirby. 2001. “Annotation: Recent Research Examining the Role of Peer Relation-ships in the Development of Psychopathology,” Journal of Child Psychology and Psychiatry and Allied Disciplines 42 (5): 565–579.
DeLuca, Stefanie, Greg J. Duncan, Micere Keels, and Ruby M. Mendenhall. 2010. “Gautreaux Mothers and Their Children: An Update,” Housing Policy Debate 20 (1): 7–25.
Dornbusch, Sanford M., Philip L. Ritter, and Laurence Steinberg. 1991. “Community Influences on the Relations of Family Statuses to Adolescent School Performance: Differences Between African Americans and Non-Hispanic Whites,” American Journal of Education 99 (4): 543–567.
Duncan, Greg J., Jeanne Brooks-Gunn, and Pamela K. Klebanov. 1994. “Economic Deprivation and Early Childhood Development,” Child Development 65 (2): 296–318.
Duncan, Greg J., and Richard J. Murnane, eds. 2011. Whither Opportunity? Rising Inequality, Schools, and Children’s Life Chances. New York: Russell Sage Foundation.
Ellen, Ingrid Gould, and Margery Austin Turner. 1997. “Does Neighborhood Matter? Assessing Recent Evidence,” Housing Policy Debate 8 (4): 833–866.
Entwistle, Doris R., Karl L. Alexander, and Linda Steffel Olson. 1994. “The Gender Gap in Math: Its Possible Origins in Neighborhood Effects,” American Sociological Review 59 (6): 822–838.
Esbensen, Finn-Asge, and David Huizinga. 1990. “Community Structure and Drug Use: From a Social Disorganization Perspective,” Justice Quarterly 7 (4): 691–709.

164
Gennetian, Sciandra, Sanbonmatsu, Ludwig, Katz, Duncan, Kling, and Kessler
Moving to Opportunity
Ferryman, Kadija, Xavier de Souza Briggs, Susan J. Popkin, and María Rendón. 2008. Do Better Neighborhoods for MTO Families Mean Better Schools? Washington, DC: Urban Institute.
Fields, Jason, Kristin Smith, Loretta E. Bass, and Terry Lugaila. 2001. A Child’s Day: Home, School and Play (Selected Indicators of Child Well-Being), CENSUS-P70-68. Washington, DC: Bureau of the Census.
Filippelli, Gabriel M., and Mark A. Laidlaw. 2010. “The Elephant in the Playground: Confronting Lead-Contaminated Soils as an Important Source of Lead Burdens to Urban Populations,” Perspec-tives in Biology and Medicine 53 (1): 31–45.
Fortson, Jane G., and Lisa Sanbonmatsu. 2010. “Child Health and Neighborhood Conditions: Results From a Randomized Housing Voucher Experiment,” Journal of Human Resources 45 (4): 840–864.
Gifford-Smith, Mary, Kenneth A. Dodge, Thomas J. Dishion, and Joan McCord. 2005. “Peer Influence in Children and Adolescents: Crossing the Bridge From Developmental to Intervention Science,” Journal of Abnormal Child Psychology 33 (3): 255–265.
Ginther, Donna, Robert Haveman, and Barbara Wolfe. 2000. “Neighborhood Attributes as Deter-minants of Children’s Outcomes: How Robust Are the Relationships?” Journal of Human Resources 35 (4): 603–642.
Glaeser, Edward L., and José A. Scheinkman. 1999. Measuring Social Interactions. Unpublished paper. Harvard University.
Gould, Eric D., Victor Lavy, and M. Daniel Paserman. 2011. “Sixty Years After the Magic Carpet Ride: The Long-Run Effect of the Early Childhood Environment on Social and Economic Outcomes,” Review of Economic Studies 78 (3): 938–973.
Hogan, Dennis P., Nan Marie Astone, and Evelyn M. Kitagawa. 1985. “Social and Environmental Factors Influencing Contraceptive Use Among Black Adolescents,” Family Planning Perspectives 17 (4): 165–169.
Hogan, Dennis P., and Evelyn M. Kitagawa. 1985. “The Impact of Social Status, Family Structure, and Neighborhood on the Fertility of Black Adolescents,” American Journal of Sociology 90 (4): 825–855.
Jencks, Christopher, and Susan E. Mayer. 1990. “The Social Consequences of Growing Up in a Poor Neighborhood.” In Inner-City Poverty in the United States, edited by Laurence E. Lynn, Jr., and Michael G.H. McGeary. Washington, DC: National Academy Press: 111–186.
Kan, Haidong, Gerardo Heiss, Kathryn M. Rose, Eric A. Whitsel, Fred Lurmann, and Stephanie J. London. 2008. “Prospective Analysis of Traffic Exposure as a Risk Factor for Incident Coronary Heart Disease: The Atherosclerosis Risk in Communities (ARIC) Study,” Environmental Health Perspectives 116 (11): 1463–1468.
Kaufman, Phillip, Martha Naomi Alt, and Christopher D. Chapman. 2004. Dropout Rates in the United States: 2000. Washington, DC: U.S. Department of Education, Institute of Education Sciences, National Center for Education Statistics.

The Long-Term Effects of Moving to Opportunity on Youth Outcomes
165Cityscape
Keels, Micere, Greg J. Duncan, Stefanie DeLuca, Ruby Mendenhall, and James Rosenbaum. 2005. “Fifteen Years Later: Can Residential Mobility Programs Provide a Long-Term Escape From Neigh-borhood Segregation, Crime, and Poverty?” Demography 42 (1): 51–73.
Kemple, James J. 2008. Career Academies: Long-Term Impacts on Labor Market Outcomes, Educational Attainment, and Transitions to Adulthood. New York: MDRC.
Kling, Jeffrey R., Jeffrey B. Liebman, and Lawrence F. Katz. 2007. “Experimental Analysis of Neigh-borhood Effects,” Econometrica 75 (1): 83–119.
Kling, Jeffrey R., Jens Ludwig, and Lawrence F. Katz. 2005. “Neighborhood Effects on Crime for Female and Male Youth: Evidence From a Randomized Housing Voucher Experiment,” Quarterly Journal of Economics 120 (1): 87–130.
Kneebone, Elizabeth, Carey Nadeau, and Alan Berube. 2011. “The Re-Emergence of Concentrated Poverty: Metropolitan Trends in the 2000s,” Brookings Institution Metropolitan Policy Program. Metropolitan Opportunity Series. Washington, DC: The Brookings Institution. Also available at http://www.brookings.edu/~/media/Files/rc/papers/2011/1103_poverty_kneebone_nadeau_berube/1103_poverty_kneebone_nadeau_berube.pdf.
Knudsen, Eric I., James J. Heckman, Judy L. Cameron, and Jack P. Shonkoff. 2006. “Economic, Neurobiological, and Behavioral Perspectives on Building America’s Future Workforce.” In Proceed-ings of the National Academy of Sciences of the United States of America 103 (27): 10155–10162.
LaGrange, Teresa, and Robert Silverman. 1999. “Low Self-Control and Opportunity: Testing the General Theory of Crime as an Explanation for Gender Differences in Delinquency,” Criminology 37 (1): 41–72.
Lazear, Edward P. 2001. The Peter Principle: Promotions and Declining Productivity. Working paper 8094. Cambridge, MA: National Bureau of Economic Research.
Leventhal, Tama, and Jeanne Brooks-Gunn. 2008. “Neighborhood Residence and Youth Develop-ment: Empirical Findings and Theoretical Models,” The Prevention Researcher 15 (2): 3–6.
———. 2000. “The Neighborhoods They Live In: The Effects of Neighborhood Residence on Child and Adolescent Outcomes,” Psychological Bulletin 126 (2): 309–337.
Ludwig, Jens. 2012. “Guest Editor’s Introduction,” Cityscape 14 (2): 1–28.
Luttmer, Erzo F.P. 2005. “Neighbors as Negatives: Relative Earnings and Well-Being,” Quarterly Journal of Economics 120 (3): 963–1102.
Manski, Charles F. 2000. “Economic Analysis of Social Interactions,” Journal of Economic Perspectives 14 (3): 115–136.
Moffitt, Robert A. 2001. “Policy Interventions, Low-Level Equilibria, and Social Interactions.” In Social Dynamics, edited by Steven N. Durlauf and H. Peyton Young. Cambridge, MA: MIT Press: 45–82.
Najarian, Michelle, Judith M. Pollack, Alberto G. Sorongon, and Elvira Germino Hausken. 2009. Early Childhood Longitudinal Study, Kindergarten Class of 1998–99 (ECLS-K): Psychometric Report for the Eighth Grade. Washington, DC: U.S. Department of Education, Institute of Education Sciences, National Center for Education Statistics.

166
Gennetian, Sciandra, Sanbonmatsu, Ludwig, Katz, Duncan, Kling, and Kessler
Moving to Opportunity
Oreopoulos, Philip. 2003. “The Long-Run Consequences of Living in a Poor Neighborhood,” Quarterly Journal of Economics 118 (4): 1533–1575.
Orr, Larry, Judith D. Feins, Robin Jacob, Erik Beecroft, Lisa Sanbonmatsu, Lawrence F. Katz, Jeffrey B. Liebman, and Jeffrey R. Kling. 2003. Moving to Opportunity for Fair Housing Demonstration Program: Interim Impacts Evaluation. Report prepared by Abt Associates Inc. and the National Bureau of Eco -nomic Research for the U.S. Department of Housing and Urban Development, Office of Policy Development and Research. Washington, DC: U.S. Department of Housing and Urban Development.
Page, Marianne E., and Gary Solon. 2003. “Correlations Between Brothers and Neighboring Boys in Their Adult Earnings: The Importance of Being Urban,” Journal of Labor Economics 21 (4): 831–855.
Popkin, Susan J., Tama Leventhal, and Gretchen Weismann. 2008. Girls in the ’Hood: The Impor-tance of Feeling Safe. Washington, DC: Urban Institute.
Quinlan, Kyran P. 1996. “Injury Control in Practice: Home Radiator Burns in Inner-City Children,” Archives of Pediatrics & Adolescent Medicine 150 (9): 954–957.
Reardon, Sean F. 2008. Thirteen Ways of Looking at the Black-White Test Score Gap. Working paper 2008-08. Palo Alto, CA: Stanford University, Institute for Research on Education Policy & Practice.
Rezaeian, Mohsen, Graham Dunn, Selwyn St. Leger, and Louis Appleby. 2005. “The Ecological Association Between Suicide Rates and Indices of Deprivation in English Local Authorities,” Social Psychiatry and Psychiatric Epidemiology 40 (10): 785–791.
Rosenbaum, James E. 1995. “Changing the Geography of Opportunity by Expanding Residential Choice: Lessons From the Gautreaux Program,” Housing Policy Debate 6 (1): 231–269.
Ross, Catherine E., and John Mirowsky. 2001. “Neighborhood Disadvantage, Disorder, and Health,” Journal of Health and Social Behavior 42 (3): 258–276.
Rubinowitz, Leonard S., and James E. Rosenbaum. 2000. Crossing the Class and Color Lines: From Public Housing to White Suburbia. Chicago: University of Chicago Press.
Sampson, Robert J. 1993. “Community and Family-Level Influences on Delinquency: A Contextual Theory and Strategies for Research Testing.” In Integrating Individual and Ecological Aspects on Crime, edited by David Farrington, Robert J. Sampson, and Per-Olof Wikström. Stockholm, Sweden: National Council for Crime Prevention: 426–444.
Sampson, Robert J., and W. Byron Groves. 1989. “Community Structure and Crime: Testing Social-Disorganization Theory,” American Journal of Sociology 94 (4): 774–802.
Sampson, Robert J., Stephen W. Raudenbush, and Felton Earls. 1997. “Neighborhoods and Violent Crime: A Multilevel Study of Collective Efficacy,” Science 277 (5328): 918–924.
Sanbonmatsu, Lisa, Jeffrey R. Kling, Greg J. Duncan, and Jeanne Brooks-Gunn. 2006. “Neighbor-hoods and Academic Achievement: Results From the Moving to Opportunity Experiment,” Journal of Human Resources 41 (4): 649–691.

The Long-Term Effects of Moving to Opportunity on Youth Outcomes
167Cityscape
Sanbonmatsu, Lisa, Jens Ludwig, Larry F. Katz, Lisa A. Gennetian, Greg J. Duncan, Ronald C. Kessler, Emma Adam, Thomas W. McDade, and Stacy Tessler Lindau. 2011. Moving to Opportunity for Fair Housing Demonstration Program: Final Impacts Evaluation. Report prepared by the National Bureau of Economic Research for the U.S. Department of Housing and Urban Development, Office of Policy Development and Research. Washington, DC: U.S. Department of Housing and Urban Development, Office of Policy Development and Research.
Scharfstein, Joshua, and Megan Sandel. 1998. Not Safe at Home: How America’s Housing Crisis Threatens the Health of Its Children. The Doc4Kids Project. Boston: Boston Medical Center, Department of Pediatrics.
Sharkey, Patrick. 2008. “The Intergenerational Transmission of Context,” American Journal of Sociology 113 (4): 931–969.
Sherwood, Nancy E., Melanie Wall, Dianne Neumark-Sztainer, and Mary Story. 2008. “Effect of Socioeconomic Status on Weight Change Patterns in Adolescents,” Preventing Chronic Disease 6 (1): A19.
Shonkoff, Jack P., and Deborah Phillips. 2000. From Neurons to Neighborhoods: The Science of Early Childhood Development. Washington, DC: National Academy Press.
Silver, Eric, Edward P. Mulvey, and Jeffrey W. Swanson. 2002. “Neighborhood Structural Char-acteristics and Mental Disorder: Faris and Dunham Revisited,” Social Science & Medicine 55 (8): 1457–1470.
Whitley, Elise, David Gunnell, Daniel Dorling, and George Davey Smith. 1999. “Ecological Study of Social Fragmentation, Poverty, and Suicide,” British Medical Journal 319 (7216): 1034–1037.
Wilson, William Julius. 1987. The Truly Disadvantaged: The Inner City, the Underclass, and Public Policy. Chicago: University of Chicago Press.
Zaslow, Martha J., and Cheryl D. Hayes. 1986. “Sex Differences in Children’s Response to Psycho-social Stress: Toward a Cross-Context Analysis.” In Advances in Developmental Psychology, 4th ed., edited by Michael E. Lamb, Ann L. Brown, and Barbara Rogoff. Hillsdale, NJ: Lawrence Erlbaum: 285–337.

168 Moving to Opportunity