civil engineering studies uilu-eng-2009-2035 issn: 0197
TRANSCRIPT

MODIFICATION OF IDOT INTEGRAL ABUTMENT DESIGN LIMITATIONS
AND DETAILS
Prepared By
Scott M. Olson James H. Long
James R. Hansen Dzuigas Renekis James M. LaFave
University of Illinois at Urbana-Champaign
Research Report ICT-09-054
A report of the findings of
ICT-R27-25 Modification of IDOT Integral Abutment Design Limitations and Details
Illinois Center for Transportation
August 2009
CIVIL ENGINEERING STUDIES Illinois Center for Transportation Series No. 09-054
UILU-ENG-2009-2035 ISSN: 0197-9191

Technical Report Documentation Page
1. Report No.
FHWA-ICT-09-054
2. Government Accession No. 3. Recipient's Catalog No.
4. Title and Subtitle 5. Report Date
August 2009
Modification of IDOT Integral Abutment Design Limitations and Details
6. Performing Organization Code
8. Performing Organization Report N o. 7. Author(s)
S.M. Olson, J.H. Long, J.R. Hansen, D. Renekis, and J.M. LaFave
ICT-09-054 UILU-ENG-2009-2035
9. Performing Organization Name and Address
University of Illinois at Urbana-Champaign Department of Civil & Environmental Engineering 205 N. Mathews Ave. Urbana, IL 61801
10. Work Unit ( TRAIS)
11. Contract or Grant No.
ICT-R27-25 13. Type of Report and Period Covered
12. Sponsoring Agency Name and Address
Illinois Department of Transportation Bureau of Materials and Physical Research 126 East Ash Street Springfield, Illinois 62704
14. Sponsoring Agency Code
15. Supplementary Notes
16. Abstract
The use of integral abutment bridges (IABs) is growing rapidly in the U.S., primarily because of lower maintenance costs compared to conventional bridges. However, current length and skew limitations employed by IDOT are not based on rigorous engineering analysis. To potentially expand the use of IABs in Illinois, the project team performed extensive 2-D and 3-D analyses to examine a wide range of IAB parameters in addition to length and skew. The numerical analyses yielded the following findings when the bridge structures were subjected to extreme thermal loading: (1) The presence of the backfill and development of full passive pressures against the abutment backwall have a negligible effect on the pile foundation performance. (2) The use of wingwalls that are parallel to the bridge deck (rather than parallel to the abutment backwall) has little effect on the abutment or pile foundation performance, and does not significantly reduce backfill settlement when the backfill is uncompacted. In addition, use of uncompacted backfill reduces the vertical support of the approach slab and results in greater stresses and moments in the approach slab. (3) Soil type (when the soil is reasonably competent) has only a secondary effect on the abutment and pile foundation performance. (4) Use of steel vs. concrete girders (within the limited number of girder types and sizes considered) also has only a secondary effect on the abutment and pile foundation performance. (5) Acceptable IAB length and skew combinations that induce stresses in the foundation piles that do not exceed the pile yield stress are summarized in the report. Several moment-reducing options are available to increase these limitations, including: (a) predrilling pile locations to 8 feet, (b) reducing pile embedment into the pile cap to 6 inches (creating a hinge at the pile/pile cap interface), and (c) incorporating a mechanical hinge such as that used by the Virginia DOT at the cold joint between the pile cap and the abutment. (6) Instrumenting and monitorning one or more IABs in Illinois is essential to validate the numerical modeling described in this report, and to potentially investigate the effectiveness of one or more moment-reducing options.
17. Key Words
18. Distribution Statement
No restrictions. This document is available to the public through the National Technical Information Service, Springfield, Virginia 22161.
19. Security Classif. (of this report)
Unclassified
20. Security Classif. (of this page)
Unclassified
21. No. of Pages
22. Price
Form DOT F 1700.7 (8-72) Reproduction of completed page authorized

i
ACKNOWLEDGMENTS AND DISCLAIMER
This publication is based on the results of ICT-R27-25, Modification of IDOT Integral Abutment Design Limitations and Details. ICT-R27-25 was conducted in cooperation with the Illinois Center for Transportation; the Illinois Department of Transportation, Division of Highways; and the U.S. Department of Transportation, Federal Highway Administration.
The authors would like to thank the members of the Technical Review Panel (TRP), and in particular the TRP chairperson, Mr. William Kramer, for their guidance of the research and their insight into the issues related to designing, constructing, and numerically modeling integral abutment bridges. The members of the TRP included (listed alphabetically after the chair):
Mr. William Kramer (chairperson, IDOT) Mr. Dan Brydl (FHWA) Mr. Mark Gawedzinski (IDOT) Mr. David Greifzu (IDOT) Mr. Chris Hahin (IDOT) Mr. Terry McCleary (IDOT) Mr. Kevin Riechers (IDOT) Mr. Riyad Wahab (IDOT) The contents of this report reflect the view of the authors, who are responsible for the
facts and the accuracy of the data presented herein. The contents do not necessarily reflect the official views or policies of the Illinois Center for Transportation, the Illinois Department of Transportation, or the Federal Highway Administration. This report does not constitute a standard, specification, or regulation.

ii
EXECUTIVE SUMMARY
Integral abutment bridges (IABs) have many advantages, and therefore, their use is increasing rapidly in the United States. The primary advantages of IABs are the reduced maintenance costs associated with repairing and replacing expansion joints, damaged/ corroded girder ends, bearings, and concrete abutment and substructure elements. However, the current length and skew limitations that the Illinois Department of Transportation (IDOT) and many other Departments of Transportation (DOTs) place on IABs are based, to a large extent, more on judgment and experience than on any rigorous engineering analysis.
To address this situation and potentially expand the use of IABs in Illinois, the project team: (1) reviewed recent literature regarding IAB use and performance; (2) conducted a targeted survey of regional DOTs that employ IABs to understand their experience with the superstructure and substructure design and construction, as well as the maintenance and performance record of IABs; (3) performed two-dimensional (2-D) and three-dimensional (3-D) geotechnical and structural engineering modeling of IABs based on IDOT designs to understand the current design demands and explore methods to expand IAB use; and (4) developed preliminary instrumentation plans for measuring the performance of several IABs in the state of Illinois.
The literature review and targeted DOT survey suggested that IDOT has been relatively conservative in its design limitations compared to several states that have successfully used IABs for some time. Therefore, the numerical modeling performed in this study was important to understand the reasons for these differences and to develop a rational basis for expanding the use of IABs in Illinois.
The project team performed 2-D analyses using the software LPILE Plus 5.0 and FTOOL to examine a wide range of IAB parameters. Three-dimensional analyses were subsequently performed using SAP2000 to evaluate skew and other parameters in more detail. The numerical analyses yielded the following results and findings when the bridge structures were subjected to extreme thermal loading:
• The presence of the backfill and development of full passive pressures against the abutment backwall (which likely occurs over time) have a negligible effect on the performance of the foundation system.
• The use of wingwalls that are parallel to the longitudinal axis of the bridge (compared to the typical design where the wingwalls are parallel to the abutment backwall) has little effect on the performance of the abutment or the foundation piles and does not significantly reduce backfill settlement when the backfill is uncompacted. However, the use of uncompacted backfill does reduce the vertical support of the approach slab and results in greater stresses and moments in the approach slab. Therefore, the project team recommends that IDOT consider compacting the select granular backfill used directly behind the abutment backwall.
• The effect of soil type (when the soil is reasonably competent, i.e., medium dense to very dense sand or stiff to hard clay) has only a secondary effect on the performance of the abutment and foundation, and for practical purposes, the abutment and foundation performance in competent sand or clay can be considered to be the same.
• The use of steel vs. concrete girders (within the limited number of girder types and sizes considered) also has only a secondary effect on the performance of the abutment and foundation, and for practical purposes can be considered to be the same. This behavior occurs primarily because while concrete has a lower

iii
coefficient of thermal expansion (meaning less displacement for a given temperature change), the concrete girders generally have slightly higher flexural stiffness and therefore result in less abutment rotation (for a given displacement) which in turn causes greater moments and stresses in the piles.
• Acceptable bridge length and skew combinations (based on current IDOT design methods for IABs) that induce stresses in the foundation piles that do not exceed the pile yield stress are influenced by the grade of steel used for the piles and by the use of one or more moment-reducing elements. These moment-reducing elements include predrilling, a hinge between the pile cap and pile, and a hinge between the pile cap and abutment. The length and skew limitations computed during this study are summarized in Figure 31 through Figure 34 and conservatively simplified in Table 9 through Table 14.
• A relatively simple and conservative approach is proposed to examine specific IAB length and skew limitations, as described in Chapter 6.
• The following options are recommended to increase IAB length and skew limitations in Illinois: (1) predrill the pile locations to a depth of 8 feet; (2) reduce the depth of pile embedment in the pile cap from about 2 x pile width (i.e., 2 feet for a 12 inch diameter pile) to 6 inches, which would essentially introduce a hinge at the pile/pile cap interface; or (3) incorporate a mechanical hinge such as that used by the Virginia DOT at the cold joint between the pile cap and the abutment. Although this issue is beyond the scope of the present study, we note that these options may impact the seismic design of IABs, and IDOT should examine this for regions of Illinois where seismic loading may influence design.
• Although beyond the scope of this project, IDOT may consider designing IAB foundation piles to exceed the yield stresses as another alternative that would broaden the current limitations for IABs. Hassiotas et al. (2006) present a methodology for designing IAB foundation piles for exceeding the yield stress; their approach is excerpted in Appendix II.
• Based on the results of this study, it is critical that IDOT continue with its plans to instrument and monitor IABs in Illinois to validate the numerical modeling described in this report. It is further recommended that IDOT delay implementing the recommendations from this study until after initial results are available from an IAB field instrumentation program that can confirm the findings described in this report.
• The project team recommends that IDOT consider installing a moment relief mechanism in one of the IABs that will be targeted for instrumentation to investigate its potential effectiveness.
• Lastly, it is recommended that IDOT continue monitoring the instrumented bridges well beyond the limited scheduled lifetime of the instrumentation project, because based on past experience with short-term monitoring programs, it is highly unlikely that the instrumented bridge(s) will be subjected during that time period to the extreme temperature swings approaching those that were modeled in the numerical analyses.

iv
TABLE OF CONTENTS ACKNOWLEDGMENTS AND DISCLAIMER ................................................................ i
EXECUTIVE SUMMARY .............................................................................................. ii
TABLE OF CONTENTS .............................................................................................. iv
1 INTRODUCTION .......................................................................................................... 1
1.1 Overview and Problem Statement ................................................................................ 1
1.2 Research Objectives and Scope .................................................................................. 2
1.3 Report Organization ..................................................................................................... 3
2 LITERATURE SYNOPSIS ............................................................................................ 4
2.1 Minnesota (2000) Investigation .................................................................................... 4
2.2 Kentucky (2002) Report ............................................................................................... 4
2.3 Indiana (2004) Investigation ......................................................................................... 4
2.4 FHWA (2005) Survey ................................................................................................... 4
2.5 Massachusetts (2005) Studies ..................................................................................... 5
2.6 FHWA (2005) Recommendations ................................................................................ 6
2.7 West Virginia (2005) Study ........................................................................................... 6
2.8 Manhattan College (2005) Review ............................................................................... 6
2.9 Virginia (2005) Guidelines ............................................................................................ 7
2.10 Maine (2005) Report .................................................................................................... 7
2.11 Iowa (2005) Report ....................................................................................................... 7
2.12 Penn State (2005) Investigation ................................................................................... 8
2.13 New Jersey (2006) Report ........................................................................................... 8
2.14 Summary Comments .................................................................................................... 8
3 TARGETED TRANSPORTATION DEPARTMENT SURVEY ...................................... 9
3.1 Survey Questions ......................................................................................................... 9
3.2 Survey Response Summary ......................................................................................... 9
4 NUMERICAL MODELING OF INTEGRAL ABUTMENT BRIDGES ........................... 14
4.1 Two-dimensional Modeling ......................................................................................... 14
4.1.1 Fixed and Free Pile Head Conditions ................................................................. 14
4.1.1.1 Soil Types and Properties used for Modeling .................................................. 15
4.1.1.2 Results ............................................................................................................. 15
4.1.1.3 Summary ......................................................................................................... 18

v
4.1.2 Two-Dimensional Modeling with Soil Springs ..................................................... 18
4.1.2.1 Model Inputs .................................................................................................... 19
4.1.2.2 Model Limitations ............................................................................................. 20
4.1.2.3 Summary and Conclusions .............................................................................. 21
4.1.3 Parametric Study ................................................................................................. 21
4.1.3.1 Bridge Length .................................................................................................. 23
4.1.3.2 Number of Spans ............................................................................................. 23
4.1.3.3 Number of Piles ............................................................................................... 24
4.1.3.4 Presence of Backfill Soil Pressures behind the Abutment ............................... 24
4.1.3.5 Summary and Conclusions .............................................................................. 26
4.2 Three-dimensional Structural Modeling: General ....................................................... 26
4.2.1 FE Models of Integral Abutment Bridges ............................................................ 26
4.2.2 FE Analysis Setup, Loading, and Output ............................................................ 31
4.3 Three-Dimensional Structural Modeling: Model Construction .................................... 32
4.3.1 Application of Dead Loads .................................................................................. 32
4.3.2 Expansion along Bridge Width ............................................................................ 34
4.3.3 Comparison to 2-D FTOOL Modeling ................................................................. 34
4.4 Three-dimensional Structural Modeling: Results ........................................................ 35
4.4.1 Baseline Bridge Model ........................................................................................ 35
4.4.2 Presence of Passive Pressure in Backfill ............................................................ 37
4.4.3 Concrete versus Steel Girders ............................................................................ 37
4.4.4 Potential Moment Relief Mechanisms ................................................................. 38
4.4.5 Stresses in the Bridge Structure ......................................................................... 39
4.4.6 Stresses in Approach Slab .................................................................................. 41
4.4.7 Summary and Conclusions ................................................................................. 42
5 PRELIMINARY INSTRUMENTATION PLAN ............................................................. 47
5.1 Participants and their Roles ....................................................................................... 47
5.2 Geotechnical Instruments ........................................................................................... 47
5.3 Preliminary Scope of Work ......................................................................................... 50
6 CONCLUSIONS AND RECOMMENDATIONS .......................................................... 52
7 REFERENCES ........................................................................................................... 57
APPENDIX A TARGETED SURVEY QUESTIONNAIRES ................................................... 59

vi
APPENDIX B DESIGN PROCEDURE FOR INTEGRAL ABUTMENTS FROM HASSIOTIS ET AL. (2006) ........................................................................................................................ 60

1
CHAPTER 1 INTRODUCTION 1.1 OVERVIEW AND PROBLEM STATEMENT
Conventional bridges commonly require regular, expensive maintenance due to corrosion damage resulting from salt-laden roadway surface runoff through the expansion joints and seals. Runoff water attacks the girder ends, bearings, and concrete abutment and substructure elements. In most cases, leakage through the joints accounts for about 70% of the corrosion and deterioration that occurs at girders, seals, and bridge piers (Civjan et al. 2007). Furthermore, the accumulation of debris and/or ice in the expansion joints precludes their full movement during the bridge’s thermal expansion and can lead to joint damage. This damage is then exacerbated by impact from vehicles passing across the joints. Maintaining the damaged joints and structural elements is not only financially taxing on state Departments of Transportation (DOTs), but the repairs also require closing traffic lanes and putting workers at risk. Integral abutment bridges (IABs), or jointless bridges, eliminate nearly all of the joints from the bridge, greatly decreasing maintenance costs along with decreasing the corrosion of the substructure, thereby extending bridge lifespan (Dunker and Abu-Hawash 2005).
In an IAB, the bridge girders typically are embedded approximately 1 foot or more into the abutment, thereby creating a semi-rigid joint between these elements, essentially forcing them to move together. These joints are capable of transferring both moments and forces (in contrast to conventional bridge girder/abutment connections that primarily transfer vertical force only). In addition, the abutment piles (when used) are commonly embedded several feet into the pile cap/abutment element, creating another semi-rigid joint. Moments and forces transferred into the abutment are then transferred down into the piles, creating a complex soil-foundation-structure interaction problem.
Another advantage of integral abutment bridges is their simple design, with the bridge acting as a single unit. Traditional jointed bridges have several moving parts and connections to model in design analyses (as well as to then construct and maintain), while an IAB has a substructure and superstructure that essentially move as one continuous body. Therefore, a primary design and construction consideration for IABs is the piles and the abutment backwall. Thermal expansion and contraction of the bridge can impose significant cyclic movement of the bridge under no traffic load, and this continuous cycle (both daily and seasonally) could create fatigue issues over the bridge’s lifetime.
Integral abutment bridges are also more quickly erected than jointed bridges, thereby decreasing construction costs. The construction time for IABs is commonly shorter because connections are simple to form (Civjan et al. 2007) and expansion joints are not required. In addition, it is common for IABs to use only one row of vertical piles, meaning a smaller number of piles are typically used than for many jointed bridges, and cofferdams are not required for constructing the intermediate piers (Hassiotis et al. 2006). Installing fewer piles and not constructing cofferdams results in decreased construction time and lower bridge construction cost.
Because of these advantages, IABs are becoming more widely used in the United States and the state of Illinois. However, modeling IABs is a complex structure-foundation-soil interaction problem that is not well understood. As a result, each state DOT has typically adopted guidelines and limitations specifically for IAB use in their state. Guidelines and limitations currently used by the Illinois Department of Transportation (IDOT) generally are consistent with other states, but they were primarily developed using empirical procedures and certainly warrant further study.

2
Figure 1 presents the typical detail used for integral abutments in Illinois. As illustrated in Figure 1, IDOT uses a corbelled abutment with 10-foot long wingwalls that are oriented parallel to the backwall of the abutment. The corbel supports an approach pavement that spans uncompacted select granular backfill behind the abutment. Integral abutment bridges in Illinois can utilize steel or concrete girders, the size of which depends on the length and width of the bridge. The length limitation for Illinois IABs is 310-feet for steel superstructures and 410-feet for concrete superstructures, with a skew limitation of 30° for both steel and concrete girders. IDOT uses both H-piles (oriented for strong axis bending) and concrete-filled pipe piles for supporting the abutments, and no extended predrilling is performed for the piles.
Figure 1. Typical integral abutment detail used by IDOT.
1.2 RESEARCH OBJECTIVES AND SCOPE
The overall objective of this study is to develop and document rational guidelines and limitations for Illinois IABs. We also describe preliminary plans for instrumenting new IABs in order to verify the modeling performed during this study. (Procuring, installing, and monitoring the instrumentation will be conducted during an ongoing ICT/IDOT project.) The scope of work for this study is summarized in the three tasks below.
Task 1. Compare current IAB construction practice and design guidelines followed in Illinois with those employed by other states.
Task 2. Develop two-dimensional (2-D) and three-dimensional (3-D) analytical models to estimate relationships for displacement and rotational demands placed on IAB abutments and foundations based on structural and geometric characteristics of representative IABs, examining the following variables: bridge length; skew angle; pile type (H-pile and steel shell pile), size (section dimensions and wall thickness), and orientation of strong axis; ground modification (i.e., overdrilling); backfill characteristics; wingwall characteristics; and the abutment/approach slab joint.

3
Task 3. Develop instrumentation plans for monitoring IABs based on the results of Task 2 to verify the modeling results. 1.3 REPORT ORGANIZATION
Chapter 2 of this report summarizes key literature related to integral abutment bridge analysis, design, construction, and performance. Chapter 3 summarizes the results of a targeted survey of DOTs from surrounding states and other states that widely use IABs. Chapter 4 summarizes the results of 2-D modeling that the project team first performed to identify key IAB and foundation variables, and then summarizes more detailed 3-D modeling performed to evaluate IAB and foundation performance under varied thermal loading conditions. Chapter 5 presents the preliminary plans developed for instrumenting several IABs in Illinois in order to verify the numerical modeling performed for this study. And finally, Chapter 6 presents the conclusions and recommendations, primarily derived from the numerical modeling described in Chapter 4.

4
CHAPTER 2 LITERATURE SYNOPSIS
The project team conducted a literature survey to review studies of IAB design and performance that have been conducted in other states. The report prepared by Hassiotis et al. (2006) for the New Jersey DOT was found to be quite comprehensive. Therefore, the following focuses on only the synopses of key technical papers and reports from State DOTs and the Federal Highway Administration (FHWA) on research that has been performed in the past decade or so, rather than repeating all the details of the literature review provided by Hassiotis et al. 2.1 MINNESOTA (2000) INVESTIGATION
Lawver et al. (2000) investigated the field performance of an IAB located near Rochester, Minnesota from construction through several years of service. They measured abutment, pile, and deck behavior for seasonal, environmental, and live load scenarios. These researchers found that the abutments translated during seasonal expansion, rather than rotated, and that the measured translation was 96% of the translation computed from their numerical analysis. The piles were found to bend in double curvature, with peak strains just above the yield strain. Effects from live loads were much less significant than the environmental effects. The bridge performed well during monitoring, but seven months after the end of construction, a loss of backfill material was observed and an expansive void developed at the base of the abutment rip rap. Lawver et al. recommended the use of geotextiles and better drainage to improve the backfill performance. 2.2 KENTUCKY (2002) REPORT
Dupont and Allen (2002) performed a literature review and survey of transportation officials to examine issues related to approach slabs and backfill design for IABs. One unique design change that these investigators proposed was to use a lowered approach slab with an asphalt overlay. Dupont and Allen suggested that this design would reduce cracking and provide a smoother transition to the regular pavement. They noted that in several states where approach slab settlement is not a problem, concrete approach slabs are not the direct riding surface onto the bridge deck. They estimated that this design change would add less than $2000 to the cost of a typical bridge. 2.3 INDIANA (2004) INVESTIGATION
Frosch et al. (2004) investigated abutment-pile interaction of integral abutment and jointless bridges by instrumenting four bridges in Indiana, highlighted by SR249, a 990-ft long bridge with a 13-degree skew. Another bridge with lower skew was selected to exclusively study the effects on the abutments due to translation. By means of strain gauges, tiltmeters, and convergence meters, Frosch et al. (2004) concluded that the field translation is slightly smaller than theoretically computed, but the computed value can be used as a conservative estimate. They also concluded that piles integrally connected to the abutment bend in double curvature, but the design used by SR249 eliminated this double curvature by allowing it to behave as a pinned connection by covering the pile cap with polystyrene. As a result, the investigators recommended that the piles must be constructed and oriented as designed in order to most accurately predict abutment and pile performance.
2.4 FHWA (2005) SURVEY
Maruri and Petro (2005) conducted a survey of all 50 states (as a follow-up to a 1995 survey) to examine how IAB design and construction had evolved over the decade. Among

5
the 39 states that responded, approximately 9000 fully integral bridges and 4000 semi-integral bridges were in service, with over two-thirds of those bridges having been constructed since 1995. The investigators reported that:
• The majority of states that responded did not limit the maximum span within the
bridge, but they did limit the total bridge length and skew angle. • Many states recommended against using an IAB where a curved bridge was
required. • 59% of states accounted for passive earth pressures. • 33% of states accounted for creep effects. • The majority of states used steel piles for the foundations, but Hawaii and
Nevada also used drilled shafts. • 33% of states reported orienting steel piles for strong axis bending (with respect
to the longitudinal axis of the bridge) while 46% reported orienting piles for weak axis bending (with respect to the longitudinal axis of the bridge).
• The use of mechanically stabilized earth (MSE) walls had increased significantly since the 1995 survey, with the preferred detail being to offset the MSE wall from the abutment by 2 to 5 feet.
• 8% of states used active earth pressures behind the abutment, 33% used passive pressures, and the remainder of respondents used a combination of active and passive pressures or a different method.
• 41% of states did not account for bending moment and shear effects (imposed by bridge translation and rotation) when determining axial pile capacities.
• 69% of states specified that the abutment backfill should be compacted while only 8% specified uncompacted backfill. The remainder of the respondents did not specify compaction requirements.
• The primary problem reported was the settlement of approach slabs, followed by approach slab cracking and cracking of the deck at the abutment.
Interestingly, over 60% of the states reported that they have not changed their
design procedures in the past decade regarding loads, substructures, backfill/abutments, and approach slabs, despite the observed settlement and cracking damage. Overall, Maruri and Petro (2005) noted that IAB design approaches were very inconsistent, and they recommended that more uniform guidelines be developed based on the research performed by various states. 2.5 MASSACHUSETTS (2005) STUDIES
Primarily to investigate the effects of seasonal expansion and contraction, Bonczar et al. (2005a,b; 2007) instrumented the Orange-Wendell bridge, a three-span, 270-ft long integral abutment bridge, and compared the results to finite element modeling (FEM). The upper 10 feet of soil surrounding each abutment pile was prebored to allow additional pile movement and reduce moments in the piles. After driving, the prebored hole was filled in with pea gravel. The bridge was monitored with strain gauges, joint meters, tiltmeters, earth pressure cells, and temperature gauges. Measured translations along the centerline agreed with calculated translations, but unexpected abutment rotation also occurred. Their model predicted symmetric reactions at the two abutments, but the field data showed slightly uneven reactions. The modeling also showed that piles would yield at a temperature change in the range of 70 to 95 degrees Fahrenheit. While this particular bridge did not experience that extreme of a temperature change during the measurement period (to date), the unexpected abutment rotations caused some outer piles to experience greater displacement

6
that may have caused yielding. Field soil pressures agreed with FEM predicted pressures, with a few minor exceptions occurring at lower depths on the abutment, and the largest soil pressures were measured during the spring due to the most extreme daily temperature changes. Bonczar et al. concluded that the predrilling and pea gravel backfill had the most effect on pile behavior during construction, but that seasonal performance was primarily determined by the properties of the abutment backfill.
2.6 FHWA (2005) RECOMMENDATIONS
Mistry (2005) reviewed the state of practice for IABs and praised their advantages over jointed counterparts. He noted that 80 percent of bridges in the United States have a total length of less than 180 feet – well within the practical limits for integral abutment and jointless bridges. Mistry also presented a set of 25 recommendations based on numerous surveys and investigations. Some of the more notable recommendations include:
• Use a single row of piles oriented for weak axis bending. • Embed piles at least two pile widths (or diameters) into the pile cap to achieve
pile fixity in the pile cap or abutment. • Provide well-drained granular backfill to accommodate the imposed expansion
and contraction. • Tie approach slabs to abutments with hinge-type reinforcement. • Use excess shrinkage reinforcement in the deck slab above the abutment. • Provide prebored holes to a depth of 10 feet for piles in dense and/or cohesive
soils to allow for limited pile displacement as the superstructure translates. • Provide symmetry on IABs to minimize potential longitudinal forces on piers and
to equalize longitudinal pressures on abutments. 2.7 WEST VIRGINIA (2005) STUDY
Shekar et al. (2005) investigated the performance of IABs incorporating fiber reinforced polymer (FRP) composite decks. They evaluated two such bridges and then compared them to similar IABs with concrete decks. The study bridges were instrumented with strain gauges and piezoelectric accelerometers. Both bridges performed favorably when subjected to static and dynamic loading tests. The FRP deck behaved similarly to a concrete deck with the exception that it was not as stiff and therefore experienced larger vibrations when subjected to dynamic loading. Shekar et al. concluded that FRP decks are acceptable alternatives to concrete decks, providing the advantages of lighter weight and faster construction. Lastly, the investigators did not observe any abutment cracking, in contrast to common complaints that they reported for jointless all-concrete bridges. 2.8 MANHATTAN COLLEGE (2005) REVIEW
Horvath (2005) reviewed the evolution of IABs and problems with their performance, offering recommendations for how to improve existing designs. He noted that the two major problems with IABs, both stemming from seasonal translation, are subsidence beneath the approach slab and build up of soil pressures on the abutment backwalls. Horvath suggested that both problems can be addressed if the ground behind the abutments is stable and can provide a non-yielding, seasonally-constant support, similar to that of a conventional bridge design. He suggested that a geosynthetically reinforced soil mass or geofoam backfill could provide such stable support. Geofoam provides the additional benefits of rapid construction and reduced backfill settlements. Both designs incorporate a thin layer of compressible material between the embankment/backfill soils and the abutment to accommodate seasonal thermal expansion and to insulate the backfill against freezing. Despite the

7
additional cost of these designs, Horvath suggested that the long term benefits (e.g., increased bridge lifespan) and reliability would be worthwhile. 2.9 VIRGINIA (2005) GUIDELINES
Weakley (2005) presented Virginia DOT design guidelines for the use of IABs, semi-integral abutment bridges, and deck extensions. Their length limitations for zero-skew steel and concrete girder IABs are 300 and 500 feet, respectively. Length limits for bridges with 30° skews are half of the zero-skew limits. One interesting design that they employ is to build a hinge at the pile cap/abutment interface. This hinge is intended to relieve stresses in the piles, the abutment, and even the superstructure. The current (circa 2005) design “consists of strips of high durometer neoprene along either side of the dowels along the centerline of the integral abutment, through which vertical loads are transmitted to the footing.” Figure 2 presents this detail (Weakley 2005).
Figure 2. Virginia DOT hinge detail (Weakley 2005).
2.10 MAINE (2005) REPORT
DeLano et al. (2005) reviewed the performance of IABs that were supported by piles at sites with shallow bedrock. Using a FEM approach to examine pile stresses, pile kinematics, and pile/bedrock interaction, they proposed IAB design guidelines that incorporate various subsurface and loading conditions. However, the FE model idealized the pile tip as a pinned support rather than a fixed support, which would be more appropriate for longer piles, introducing some uncertainties into their analysis. They concluded that there are many instances where IABs can be used in areas with shallow bedrock, but that there are several issues, such as the depth to bedrock, that should be investigated before a decision is made. 2.11 IOWA (2005) REPORT
Dunker and Abu-Hawash (2005) provided an overview of Iowa’s various research projects and design revisions for IABs. Iowa researchers have used FEM and equivalent cantilever pile models to investigate stresses in both piles and abutments. In particular, they examined the structural performance of steel piles and concluded that that local flange buckling is not an issue as long as the piles are compact and that fatigue is not an issue for

8
typical IAB loading conditions. In addition, Iowa researchers have found that by increasing the depth to pile fixity, demand on the substructure and superstructure are reduced. These researchers recommended predrilling as an easy, cost-effective method to increase the depth to fixity. Dunker and Abu-Hawash also reported that the Iowa DOT recently increased the depth of predrilling to 10 feet to expand their IAB length and skew limitations. Lastly, Iowa researchers have noted that predrilling reduces any downdrag that may occur after construction, recommended using 50 ksi yield strength steel rather than 36 ksi because it gives the pile additional more capacity, and specifically recommended the use of HP10x57 piles because this section can handle fairly large rotations without buckling. 2.12 PENN STATE (2005) INVESTIGATION
Fennema et al. (2005) investigated the behavior of an IAB in Pennsylvania and compared the results with predictions from FEM. The bridge was 170 feet in length and used prestressed bulb-tee concrete girders. The abutments were supported by a single row of HP12x74 piles oriented for weak axis bending. The reported measurements were either typical of results reported by other states or were inconclusive due to a lack of measured data. One unique finding by Fennema et al. was that tiltmeter measurements indicated that the abutment and girder rotate in opposite directions during thermal contraction and expansion as a result of the connection stiffness between the girder and abutment. Strain gage data indicated that the joint exhibited rotational stiffness of only about 10% of the girder stiffness. Based on this behavior, their models were adjusted to allow full rotation at this connection, in contrast to the semi-rigid connections assumed in other models.
2.13 NEW JERSEY (2006) REPORT
As part of a comprehensive report, Hassiotis et al. (2006) performed an extensive literature review of the current state of practice for IABs, developed a detailed design procedure for IABs that incorporates the best practices from New Jersey and other state DOTs, instrumented and monitored an IAB in New Jersey, and compared the results with FEM analyses. The bridge was 298 feet long with a 15 degree skew, and the abutments were supported by a single row of 19 HP14x152 piles oriented for weak axis bending. Hassiotis et al. (2006) reported maximum longitudinal displacements of only about 0.5 inches after two years of monitoring. During the two year monitoring period, maximum rotations of about 0.1 degrees (corresponding to maximum longitudinal expansion in July), and maximum pile head stresses of about 10 ksi (corresponding to maximum longitudinal contraction in January and February) were recorded. Hassiotis et al. also observed that soil pressures on the back of the abutment increased significantly (ratcheted) during each spring as the bridge expanded back into the abutment backfill. 2.14 SUMMARY COMMENTS
Overall, recent literature indicates that IAB performance has been quite good when the bridge lengths and skews have been moderate. However, despite the increasing volume of literature devoted to IAB performance and modeling, some studies report conflicting results (e.g., with respect to girder/abutment stiffness) as a result of different design and construction details employed by various state DOTs. Therefore, this study of IDOT-specific IAB design details is certainly warranted.

9
CHAPTER 3 TARGETED TRANSPORTATION DEPARTMENT SURVEY
The project team developed a targeted questionnaire and distributed it to 23 states to
determine the state-of-practice for a number of issues regarding IABs. The targeted states were chosen by two criteria: (1) proximity or climate similar to Illinois; and/or (2) progressive use or research pertaining to IABs. Of the states contacted, more than two-thirds submitted responses, including: Florida, Indiana, Iowa, Kansas, Maine, Michigan, Minnesota, Missouri, New Jersey, Ohio, Oregon, South Dakota, Tennessee, Vermont, Washington, and Wisconsin. In particular, Iowa and Tennessee provided very detailed responses. Florida and Washington only use semi-integral bridge designs, and therefore their responses will not be included in this section. Additionally, bridge design manuals were obtained online for Massachusetts, Nebraska, New York, and West Virginia. 3.1 SURVEY QUESTIONS
The project team developed questions related to IABs that were specific to the state DOT personnel who responded to the request for information, depending on whether they had expertise in structural engineering, geotechnical engineering, or construction and maintenance. The specific questionnaires are provided in Appendix I. 3.2 SURVEY RESPONSE SUMMARY
The following paragraphs summarize the responses from the targeted surveys. Participants were asked to use best estimates for some questions, thus the results of many questions are qualitative. Also, some questions elicited long responses, while others were left blank. In certain cases where specific responses were not provided, we obtained answers from the state bridge manual. (The questions are numbered below as in Appendix I, with questions for structural engineers numbered S1, S2, S3, …; questions for geotechnical engineers numbered G1, G2, G3, …; and questions for construction and maintenance personnel numbered M1, M2, M3, …) Below, we omit questions that received no responses from any of the states. S1a. What are the limits for length and skew of integral abutment bridges?
Table 1 presents the responses to this question. We note that Iowa has performed considerable monitoring and analysis of IAB behavior and has some of the highest allowable limits for IAB length and skew. S1b. How were these limits determined?
Of the four states that responded to this question, all (excluding Iowa) stated that their limits were determined empirically from existing bridge performance or based on other states’ guidelines. On the other hand, the Iowa DOT has performed a series of studies with Iowa State University and is in the process of modifying their guidelines based on these studies’ results. Similarly, the University of Massachusetts has performed multiple studies to help determine acceptable design limits for their IABs. S2a. Do you use an approach slab?
All states use approach slabs. Michigan, Missouri, and New Jersey also specifically reported using sleeper slabs (i.e., footings for the approach slab). It appears likely that most states use sleeper slabs, but this question was not asked in the survey.

10
Table 1. Length and Skew Limits for IABs Reported by Various State DOTs
State Length limit for zero skew bridge (feet)
Skew limit (°) Comments Concrete SteelIA 575 45 Length limit is 400 feet for 45° skew IN 300 250 30 Skew limit is 45° for “short” bridges KS 500 300 No limit MA 600 350 30 ME 330 200 25 MI 400 300 30 MN 300 30 MO 600 425 45 NE NJ 450 30 NY 330 45 OH 250 30 OR NR NR NR SD 700 350 35 TN 800 400 No limit VT 590 330 20 WI 300 150 15 WV Based on 2 inches allowable movement 30
Note: NR = not reported S2b. What are the details of the slab and its connection to the abutment?
Slab details consisted of reinforced concrete ranging in length from 10 feet (New Jersey) to 25 feet (Missouri). The majority of the responses indicated that the slab was connected to the abutment with rebar, creating a hinge joint. Iowa reported using a sliding joint on the abutment corbel filled with crumb rubber. S3a. What typical pile do you use?
All states reported primarily using H-piles for their abutment supports, as illustrated in Figure 3. Iowa specifically stated that they primarily used HP10x42 sections. Tennessee also uses prestressed concrete piles, while Missouri, New York, and Ohio use concrete filled pipe piles. The use of prestressed concrete piles and concrete filled pipe piles is limited to shorter span bridges in all states that use them.
HP only69%
HP or metal shell25%
HP, metal shell, or prestressed
concrete6%
Figure 3. Pile types used for IABs (based on responses from 16 of 18 states).

11
S3b. What is the typical yield strength for your piles?
Of the eight states that replied to this question, Iowa, Michigan, Oregon, and Tennessee reported using 50 ksi sections; Maine and Missouri reported using 36 ksi sections, and Massachusetts and Ohio listed either 36 or 50 ksi. S4a. What typical wingwall geometry do you use?
Of the 15 responses received, 60% of the DOTs (Iowa, Massachusetts, Minnesota, Nebraska, Oregon, Tennessee, Vermont, West Virginia, and Wisconsin) use a U-back geometry. Kansas, Maine, Michigan, New Jersey, New York, and Ohio prefer a straight (or inline) wingwall orientation. S4b. What are the advantages of this?
Of the three responses received, Iowa and Tennessee claimed that the U-back geometry reduces resistance to thermal movement. On the other hand, Ohio justified the straight geometry by stating that it only uses one row of piles. S5. Does your state use a construction joint between the pile cap and the abutment?
Of the five responses that were received, Iowa, Ohio, Oregon, and Tennessee indicated that they use such a construction joint, while New Jersey said that they did not. S6/G5. Are there any bridges that have been instrumented and studied?
Of the eight responses that were received, four states either have not done any studies or have simply reviewed studies performed in other states. New Jersey reported that a brief study was performed, but it did not result in any changes to their design methodologies. The University of Tennessee has assisted the Tennessee DOT with their research, which has resulted in more liberal design limitations in Tennessee.
Iowa has (by far) performed the most research on IABs. In conjunction with Iowa State University, the Iowa DOT has progressively expanded their length and skew limits since the 1980s based on the findings from multiple studies. At the time the project team contacted them, Iowa DOT was in the process of reviewing and approving their latest research-based recommendations for IABs. G1b. What are the design criteria for orientation of piles?
Sixteen states (out of 18) responded to this question, and all 16 states responding use weak-axis orientation to reduce stresses in the pile cap and abutments. Only Vermont allows either strong- or weak-axis orientation, and New York recommends strong-axis orientation for long bridges where flange buckling in flexure is an issue.
G1c. Do you use predrilling, overdrilling, or backfill with weak materials for piles?
Fifteen states responded to this question, and 87% of these respondents indicated that they use predrilling under some conditions. Table 2 summarizes the responses. Of these, the West Virginia response was unique in that most other states will not build an integral abutment bridge on shallow bedrock.
G2. What are the design criteria for backfill gradation and compaction?
Of the seven states that responded to this question, six (Iowa, Michigan, Minnesota, Ohio, Oregon, and Wisconsin) reported using well compacted granular fill. Only West Virginia specifies loose select granular backfill behind the bridge abutment to prevent passive earth pressures from developing.

12
Table 2. DOT Specifications for Predrilling Pile Foundation Locations
State Comments
IA Predrill to 8 feet for bridges over 130 feet long, and fill the hole with bentonite IN Predrill to 8 feet if foundation soil is hard KS Not reported MA Predrill to 8 feet and fill with loose granular material ME Predrill to 10 feet MI Predrill to 10 feet MN Predrill only in very compact soil to facilitate pile driving rather than to influence IAB behavior MO Predrill only in new fill to prevent downdrag on the piles NE Predrill to the engineer’s recommendation NJ Predrill to 8 feet for bridges over 100 feet long NY Predrill to 8 feet and fill with loose granular material OH Not recommended OR Not recommended SD Predrill to 10 feet TN Not reported VT Predrill only in very compact soil WI Not reported WV Predrill to 15 feet, or predrill to bedrock if rock is between 10 and 15 feet below ground surface
G3. What specifications does your state use for the backfill against the abutment for countering displacements? Does your state use MSE walls or flowable fill behind the abutment?
Of the six states that responded to this question, none reported any specific measures in the abutment backfill for countering displacements. However, Ohio reported that they are just starting a pilot project to investigate the advantages of MSE walls behind the abutment. G4. Has your state seen any evidence of ratcheting or passive pressures behind the abutment backwall?
Michigan, Minnesota, New Jersey, and Oregon reported that they have not seen any evidence of ratcheting or passive pressures. The other states did not respond to this question. M1a. What are the primary problems that your state has experienced with IABs?
Most states reported settlement of the approach slab as the primary problem. Iowa additionally has had problems with shearing of the corbel supporting the approach slab, but they indicated that this is primarily the result of poor construction. No states reported abutment cracking or other soil pressure-related problems. We note that these responses contrast the complaints reported by Shekar et al. (2005). M1d. How do maintenance costs compare between IABs and conventional bridges?
Most states either did not respond to this question or could not because they did not have their records kept in such a fashion to compare the two. Michigan reported that the maintenance costs were approximately the same. M2. Has your state seen differences in approach slab performance between conventional and integral abutment bridges?
New Jersey reported that there was no difference in their approach slab performance. All other responding states reported approach slab settling with IABs. The states that use sleeper slabs also reported sleeper slab settling.

13
M4. Has your state observed deck cracking near the abutment?
Of the three states that responded to this question, Michigan and New Jersey reported no observations of cracking at this location. Oregon reported having observed some cracking, but indicated that it was consistent with cracking observed in conventional jointed bridges.

14
CHAPTER 4 NUMERICAL MODELING OF INTEGRAL ABUTMENT BRIDGES
The project team performed two-dimensional (2-D) modeling of integral abutment bridges using both structural and geotechnical engineering analysis software, as well as three-dimensional (3-D) modeling using more sophisticated structural analysis software. Specifically, 2-D structural frame modeling was performed using FTOOL, and 2-D geotechnical soil-pile interaction modeling was conducted using LPILE. The project team performed 3-D finite element modeling of non-skew and skewed integral abutment bridges using SAP2000. The following sections describe all of these analyses, including key aspects of model development as well as important results (model output). 4.1 TWO-DIMENSIONAL MODELING
The majority of displacement-related concerns regarding integral abutment bridges can be addressed fairly well with two-dimensional modeling. For example, soil backfill pressures, girder and pile stiffness, abutment dimensions, and bridge length can be accurately modeled using a plane-strain scenario. Therefore, our initial modeling efforts focused on performing 2-D analyses using FTOOL (2002) and LPILE Plus 5.0 (Ensoft 2005) to better understand the variables that were important to model accurately in subsequent 3-D analyses. Specifically, we examined the effects of fixed- and free-head pile conditions (to evaluate different pile embedment lengths into the abutment), embankment fill soil type (i.e., sand or clay), bridge length, number of bridge spans, number of abutment piles, and the development of passive pressures in the abutment backfill. 4.1.1 Fixed and Free Pile Head Conditions
The primary goal of the initial 2-D modeling was to investigate the shear forces and bending moments (and resulting stresses) in the piles supporting the abutment. These shears and moments are determined by soil properties, pile length, pile head rotation, pile head displacement, and any forces applied at the pile head. These issues can be addressed and modeled independently from any particular behavior of the abutment or superstructure.
The first step in this modeling was to develop limit cases for a variety of pile types, pile orientations, and soil types. By modeling a fixed head case with no rotation, the maximum (or limiting) pile head moment can be determined, and by modeling a free head case with no pile head moment, the maximum (or limiting) rotation can be determined. Using these maximum values, a moment versus rotation plot can be developed (as these two cases form the bounds of a linear relationship), and any other pile head fixity conditions would then plot within these limiting cases. The maximum moment for the free-head condition occurs below the pile head, but the magnitude of this moment is still directly related to the applied displacements (i.e., related to the temperature variation applied to the superstructure). Again, this modeling was performed using LPILE Plus 5.0.
A variety of pile types and sizes were considered in these analyses to reflect typical pile types and sizes employed by IDOT. H-pile sections included 12x53, 12x74, 12x84, 14x73, 14x102, and 14x117, and these piles were modeled for both weak-axis and strong-axis bending. We also modeled the response of 12-inch and 14-inch diameter concrete-filled steel shell piles (i.e., pipe piles) with multiple wall thicknesses. The 12-inch diameter piles had wall thicknesses of 0.179-inch, 0.25-inch, and 0.5-inch, while the 14-inch diameter piles had wall thicknesses of 0.312-inch and 0.5-inch. Using a wide variety of pile types and sections in the 2-D modeling allowed us to reduce the number of piles that we considered in the later 3-D modeling. In the later 3-D modeling, we limited the pile types to one H-pile

15
section (12x53) and two steel shell pile sections (12-inch diameter x 0.179-inch wall thickness and 14-inch diameter with 0.25-inch wall thickness). 4.1.1.1 Soil Types and Properties used for Modeling
Two general soil types (i.e., sand and clay) were considered in the 2-D modeling to reflect soils commonly used for embankment construction in Illinois. These two soil types were selected to represent coarse-grained (or cohesionless) and fine-grained (or cohesive) soil embankment materials. The lateral pressure-displacement response of these soils were modeled using the O’Neill/API sand and the Reese stiff clay without free water models, respectively. Both of these models are pre-programmed in LPILE Plus5.0. Unit weights for both models were selected as 120 pcf. For the sand response, we considered friction angles of 30, 35, and 40 degrees, although only 35 degrees was used in the later 3-D modeling. The stiff clay was modeled with an undrained cohesion (c) of 1000, 1500, and 2000 psf, although only 1500 psf was used in the later 3-D modeling. Strain factors (ε50) for the clay were selected as the LPILE default values. 4.1.1.2 Results
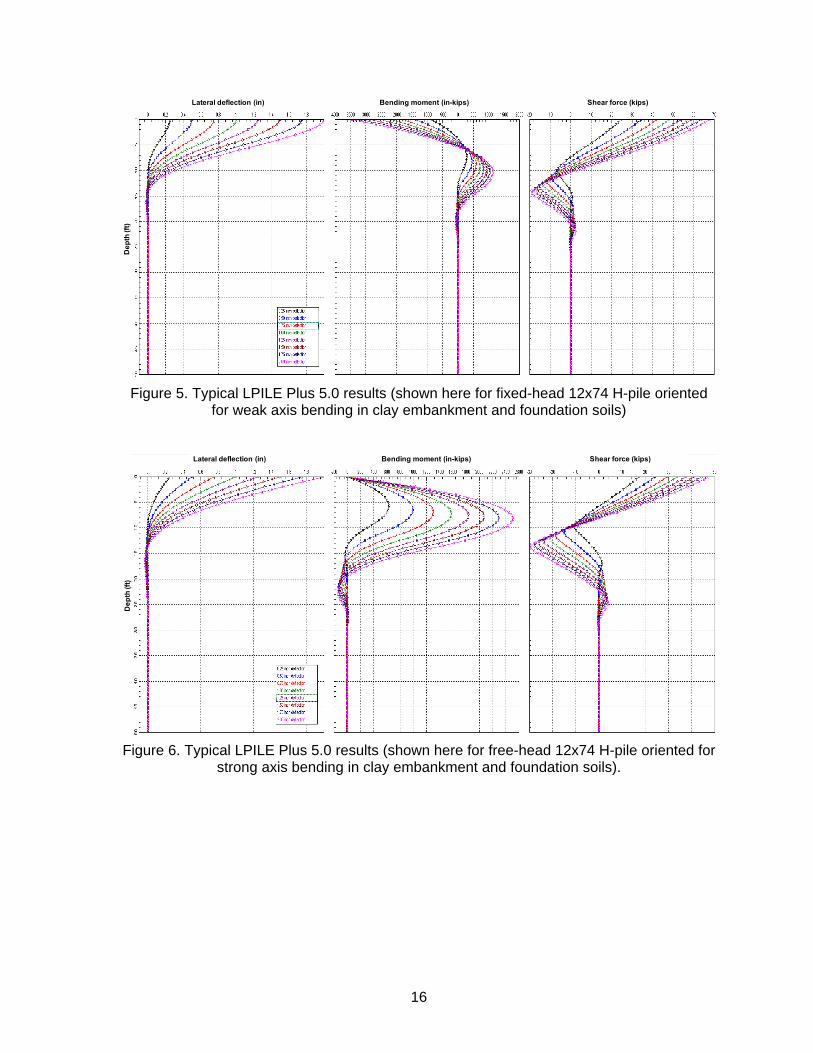
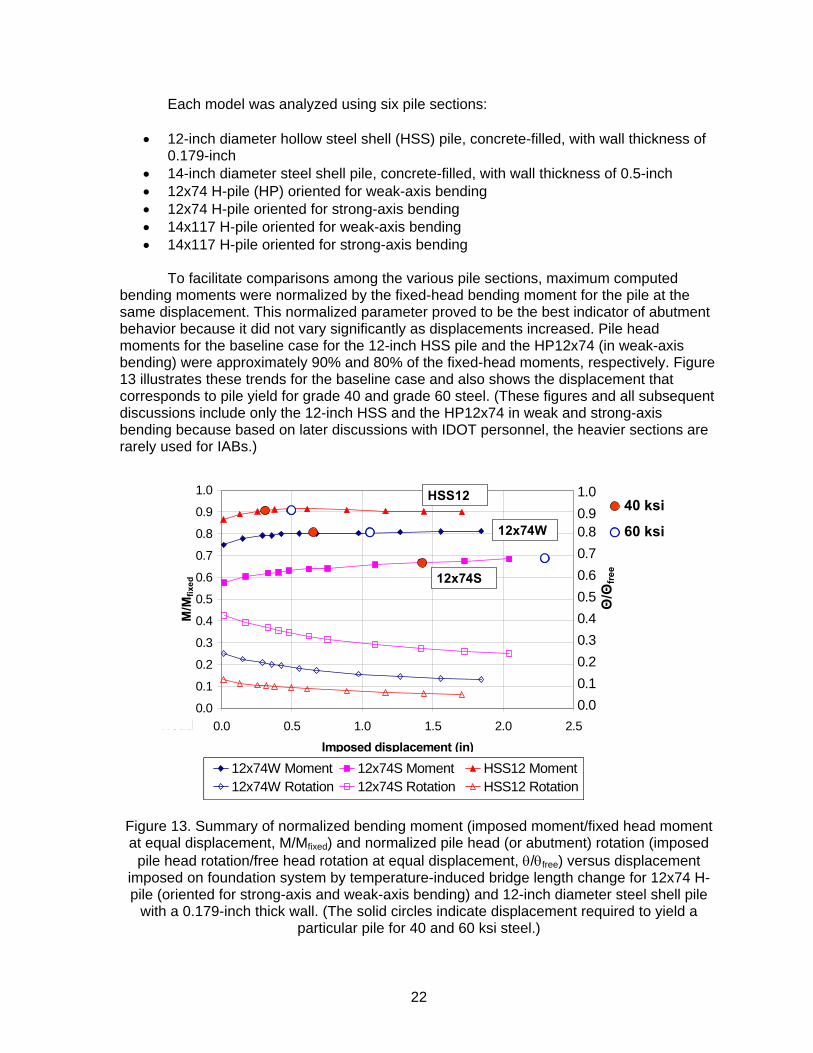
To evaluate limiting force and moment conditions, plots of maximum shear force and pile moment versus lateral head displacement were developed for each of the variable combinations outlined above. Figure 4 provides sample results for a fixed-head 12x74 H-pile oriented for strong axis bending through a clay soil embankment and foundation. Figure 5 through Figure 7 present similar results for fixed-head conditions with weak axis bending and for free-head conditions with both strong and weak axis bending, respectively. As anticipated, the maximum bending moment and maximum shear force occurs at the pile head under fixed-head conditions, while these values reach their maximum below the pile head for free-head conditions. Furthermore, both the maximum bending moment and maximum shear force increase nonlinearly with increasing imposed lateral displacement for both the fixed- and free-head conditions (see Figure 8 for strong axis bending and Figure 9 for weak axis bending of HP12x74 case).
Lateral deflection (in) Bending moment (in-kips) Shear force (kips)
Dep
th (f
t)
Figure 4. Typical LPILE Plus 5.0 results (shown here for fixed-head 12x74 H-pile oriented
for strong axis bending in clay embankment and foundation soils)
16
Lateral deflection (in) Bending moment (in-kips) Shear force (kips)
Dep
th (f
t)
Figure 5. Typical LPILE Plus 5.0 results (shown here for fixed-head 12x74 H-pile oriented
for weak axis bending in clay embankment and foundation soils)
Lateral deflection (in) Bending moment (in-kips) Shear force (kips)
Dep
th (f
t)
Figure 6. Typical LPILE Plus 5.0 results (shown here for free-head 12x74 H-pile oriented for
strong axis bending in clay embankment and foundation soils).

17
Lateral deflection (in) Bending moment (in-kips) Shear force (kips)
Dep
th (f
t)
Figure 7. Typical LPILE Plus 5.0 results (shown here for free-head 12x74 H-pile oriented for
weak axis bending in clay embankment and foundation soils).
0
1200
2400
3600
4800
6000
7200
0
20
40
60
80
100
120
0 0.25 0.5 0.75 1 1.25 1.5 1.75 2
Maxim
um ben
ding
mom
ent (kip‐inches)
Maxim
um sh
ear (kips)
Pile head displacement (inches)
Fixed head
Free head
solid symbols = shear forceopen symbols = bending moment
Figure 8. Summary of maximum shear and bending moment versus imposed pile head displacement for fixed- and free-head conditions (12x74 H-pile oriented for strong-axis
bending in clay soil).

18
0
1200
2400
3600
4800
6000
7200
0
20
40
60
80
100
120
0 0.25 0.5 0.75 1 1.25 1.5 1.75 2
Maxim
um ben
ding
mom
ent (kip‐inches)
Maxim
um sh
ear (kips)
Pile head displacement (inches)
Fixed head
Free head
solid symbols = shear forceopen symbols = bending moment
Figure 9. Summary of maximum shear and bending moment versus imposed pile head displacement for fixed- and free-head conditions (12x74 H-pile oriented for weak-axis
bending in clay soil).
4.1.1.3 Summary The LPILE Plus5.0 analyses indicate that when embedded in either sand or clay
embankment and foundation soils, many of the pile sections used by IDOT (when analyzed for fixed head conditions and strong axis bending) develop flexural stresses that may exceed the pile yield stress at imposed displacements significantly smaller than those calculated from the design temperature change. For this analysis, the design temperature change effect at one abutment has been simply estimated as:
2LTLylat Δ=Δ= α Eq. 1
where ylat = lateral pile head displacement, ΔL = change in bridge superstructure length, α = coefficient of thermal expansion, ΔT = temperature change (i.e., difference between the mean temperature at construction and the design high or low temperature), and L = bridge length.
Generally, heavier pile sections were able to withstand slightly more displacement before yielding than lighter pile sections, but it is unlikely that the abutment provides a truly fixed head case in the field. As such, we considered these results to mainly provide insight into general pile behavior that would subsequently be obtained from the more sophisticated 2-D and 3-D soil-foundation-structure interaction modeling. 4.1.2 Two-Dimensional Modeling with Soil Springs
To better understand the force and moment (and resulting stress) conditions that develop in integral abutment bridges, the project team developed a simplified 2-D model of the bridge abutment and pile foundation using the 2-D structural frame analysis program, FTOOL. Based on how much the abutment rotates and translates in response to

19
temperature changes, a better understanding of the forces and moments in the piles can be obtained. And from the pile reactions, the resulting stresses in the bridge superstructure can also be determined. 4.1.2.1 Model Inputs
For this model, only half of a typical two-span integral abutment bridge was actually modeled, with the central pier superstructure support location being a point of total fixity (due to symmetry), as shown in Figure 10. This simplification adequately represents a two-span bridge with a pier support in the middle. The bridge deck (superstructure) was modeled as an element with a moment of inertia and modulus of elasticity determined from a composite section evaluation of 8-inch thick concrete pavement overlying 36-inch deep steel girders, similar to those used by IDOT. (The geometry for the abutment area was derived as a composite of several IAB designs provided to the project team by IDOT.) The bridge beams and concrete deck were rigidly connected to the concrete abutment, which was 10 feet high and 24-inches wide. To perform 2-D modeling, representative sections were taken (using weighted averages of properties) in the transverse direction of the bridge (i.e., perpendicular to the centerline of the roadway), as well as for the number of piles and girders. Soil pressures on the abutment and the effects of the wingwalls were not included at this stage of modeling. Furthermore, bridge skew was not considered in the 2-D models. (Bridge skew will be considered subsequently in the 3-D models.)
Figure 10. Simple frame model developed for 2-D modeling using FTOOL.
To simulate temperature-induced expansion, a longitudinal displacement was
applied at the center of the bridge. Based on the literature review, other researchers reported that the actual displacement of an integral abutment is generally close to the calculated superstructure displacement computed simply from the measured temperature change and coefficient of thermal expansion (i.e., computed using using Eq. 1).
Limitations of the FTOOL (linear analysis) software precluded modeling the entire pile length with all of the necessary nonlinear springs to simulate the soil response along the entire pile. To circumvent this limitation, we modeled the soil response at the pile using a foundation stiffness matrix, requiring “cross-coupling” terms within the foundation stiffness matrix. The pile response to abutment translation and rotation is fairly complex. For example, the LPILE results illustrated that as abutment translation increases, the moments and shears at the pile head increase in a nonlinear fashion. Additionally, pile head moments could not simply be modeled using a rotational spring at the pile head because as the LPILE results illustrate increasing abutment rotation decreases the pile head moments. Therefore, we modeled this soil-pile-structure interaction by using rotational, lateral, and vertical springs at a computed distance below the pile head. This “lever arm” (see Figure 11) was modeled as a rigid link with a length that provided the best match with the moment behavior of the pile computed using LPILE. The combination of lateral and rotational springs combined with the lever arm adequately models the diagonal and cross-coupling stiffnesses for the pile head. By modeling the pile foundation in this manner, pure translation of the abutment would

20
cause both an increase in moment and shear while rotation of the abutment would relieve both moment and shear in the piles.
Pile head
Lever arm(rigid link)
Abutment
Figure 11. Schematic illustration that depicts the method of modeling foundation stiffness for
FTOOL 2-D frame analyses performed during this study.
4.1.2.2 Model Limitations
The 2-D modeling using FTOOL was able to accurately capture either the bending moment or shear forces developed in the pile in a given run because the pile head stiffness matrix is not symmetric. However, as most of the field behavior reported in the literature suggested that the abutment/foundation behavior closely approximated a fixed head scenario (i.e., abutment deformation was primarily in translation with very little rotation), it was possible to calibrate the pile head model for a fixed head condition (i.e., impose zero rotation of the abutment), which results in a symmetric stiffness matrix and a unique solution for the length of the lever arm. This approach produced shears that were accurate to within a 5% error for sand and 20% error for clay compared to those computed for a fixed-head condition using LPILE. This error was considered to be acceptable at this stage of the numerical modeling because the error was small, systematic, and represented the best solution available within the limitations of 2-D linear modeling. To check the accuracy of the springs (and the resulting shears and moments in the pile), the results from the FTOOL 2-D frame model were applied in LPILE (by inputting the rotation of the abutment for the pile head rotation). Figure 12 compares the results obtained using FTOOL and LPILE for a 12x74 H-pile oriented for both strong axis (S) and weak-axis (W) bending in a sand embankment and foundation.
While the pile response is nonlinear, FTOOL is only able to use linear springs. Therefore, the pile reaction was determined from LPILE for set pile head displacements of 0.01, 0.1, 0.2, 0.25, 0.3, 0.4, 0.5, 0.75, 1.0, 1.25, 1.5, 1.75, and 2.0 inches. The necessary pile springs and lever arm lengths were determined for each displacement, and then the 2-D structural modeling was performed iteratively until the pile head displacement agreed with the target value.

21
0.00.10.20.30.40.50.60.70.80.9
0.0 0.5 1.0 1.5 2.0 2.5
Displacement (in)
M/M
fixed
M /
Mfix
edhe
ad
Figure 12. Comparison of bending moments (normalized by maximum bending moments
computed for fixed-head conditions) computed using FTOOL and LPILE. 4.1.2.3 Summary and Conclusions
From this stage of the modeling, two primary conclusions were made. Firstly, the imposed displacement from a given temperature change almost exactly matches the displacement at the top of the abutment. In other words, the lateral resistance provided by the pile foundation is ineffective at preventing lengthening or shortening of the bridge as a result of temperature change. Secondly, the computed rotation of the abutment is small, but not negligible. As a result, the computed bending moments at the pile head commonly ranged from about 75% to 95% of the computed fixed-head moments. The only exceptions occurred with heavier pile sections, which are generally not used for integral abutment bridges. 4.1.3 Parametric Study
Following the 2-D modeling described above, the project team then performed a numerical parametric study using FTOOL to investigate the effects of a number of different variables, including: (1) bridge length; (2) number of bridge spans; (3) number of piles; and (4) development of passive soil pressures in the backfill. To facilitate later comparisons, we first established a “baseline case” from a number of integral abutment bridge plans that IDOT provided to the project team. The baseline case incorporated the following chief parameters:
• Two-span bridge (each span is 100-feet long) • Six girders (variable girder depth) • Six piles embedded into the pile cap/abutment with yield stress of either 40 or 60 ksi • Abutment dimensions of 10-feet high and 3-feet wide • Sand backfill (effective stress friction angle, φ' = 35°; effective cohesion intercept, c' =
0; total unit weight of embankment and foundation soils, γtotal = 120 pcf) • Fully-mobilized passive pressures estimated using log-spiral method (computed
using the guidelines in NAVFAC DM 7.1, 1982)
22
Each model was analyzed using six pile sections:
• 12-inch diameter hollow steel shell (HSS) pile, concrete-filled, with wall thickness of 0.179-inch
• 14-inch diameter steel shell pile, concrete-filled, with wall thickness of 0.5-inch • 12x74 H-pile (HP) oriented for weak-axis bending • 12x74 H-pile oriented for strong-axis bending • 14x117 H-pile oriented for weak-axis bending • 14x117 H-pile oriented for strong-axis bending
To facilitate comparisons among the various pile sections, maximum computed
bending moments were normalized by the fixed-head bending moment for the pile at the same displacement. This normalized parameter proved to be the best indicator of abutment behavior because it did not vary significantly as displacements increased. Pile head moments for the baseline case for the 12-inch HSS pile and the HP12x74 (in weak-axis bending) were approximately 90% and 80% of the fixed-head moments, respectively. Figure 13 illustrates these trends for the baseline case and also shows the displacement that corresponds to pile yield for grade 40 and grade 60 steel. (These figures and all subsequent discussions include only the 12-inch HSS and the HP12x74 in weak and strong-axis bending because based on later discussions with IDOT personnel, the heavier sections are rarely used for IABs.)
0.0
0.1
0.2
0.3
0.4
0.5
0.6
0.7
0.8
0.9
1.0
0.0 0.5 1.0 1.5 2.0 2.5
Imposed displacement (in)
M/M
fixed
Θ/Θ
free
1.00.90.80.70.60.50.40.30.20.10.0
40 ksi
60 ksi
FixedHead
FreeHead
HSS12
12x74W
12x74S
Free
Fixed
12x74W Moment 12x74S Moment HSS12 Moment12x74W Rotation 12x74S Rotation HSS12 Rotation
Figure 13. Summary of normalized bending moment (imposed moment/fixed head moment at equal displacement, M/Mfixed) and normalized pile head (or abutment) rotation (imposed
pile head rotation/free head rotation at equal displacement, θ/θfree) versus displacement imposed on foundation system by temperature-induced bridge length change for 12x74 H-pile (oriented for strong-axis and weak-axis bending) and 12-inch diameter steel shell pile
with a 0.179-inch thick wall. (The solid circles indicate displacement required to yield a particular pile for 40 and 60 ksi steel.)

23
4.1.3.1 Bridge Length To study effects of increasing span length, the bridge span was increased by a factor
of two and the bridge moment of inertia was increased by a factor of four to maintain similarity to IDOT bridge designs. This model resulted in pile head moments for the 12-inch HSS and HP12x74 sections of 95% and 88% of the fixed head moments, respectively, indicating that when the superstructure is more rigid (i.e., stiffer), the foundation behavior that is closer to a fixed head condition than the baseline case. The rotational stiffness provided by the beams at the abutment is a function of EI/L, thus quadrupling the moment of inertia and doubling the length of the beams results in doubling the rotational stiffness of the abutment, which agrees with the results. Figure 14 illustrates the pile behavior for the case of doubling the bridge length (i.e., 400 feet) compared to the baseline bridge length (i.e., 200 feet).
0.00.10.20.30.40.50.60.70.80.91.0
0.0 0.5 1.0 1.5 2.0 2.5
Displacement (in)
M/M
fixed
12x74W 12x74S HSS1212x74W-Base 12x74S-Base HSS12-Base
40 ksi
60 ksi
M /
Mfix
edhe
ad
Figure 14. Computed bending moments (normalized by fixed head moment at equal
displacement) in piles for case of doubling the bridge length (to 400 feet) compared to baseline case of 200-ft bridge with increasing temperature-change induced displacements. 12x74W and 12x74S are H-pile sections for weak- and strong-axis bending, respectively; HSS12 is 12-inch diameter, 0.179-inch thick wall steel shell pile. The solid circles indicate displacement required to yield a particular pile for 40 and 60 ksi steel. Grey lines represent
baseline cases. 4.1.3.2 Number of Spans
To study the effects of increasing bridge length while maintaining span length, the project team evaluated a case where the bridge length was increased by adding one (1) 100-foot span, for a total length of 300 feet over three spans. The moment of inertia was maintained constant with the baseline case. Structurally, maintaining a constant moment of inertia decreased the rotational stiffness of the bridge from 4EI/L to approximately 3.5EI/L. As modulus (E), moment of inertia (I), and length (L) are all the same, this produced slightly less rotational stiffness at the abutment, and therefore smaller pile head moments than the baseline case. As illustrated in Figure 15, computed moments for the 12-inch steel shell pile (with 0.179-inch wall thickness) and 12x74 H-pile sections (for both strong- and weak-axis bending) were 88% and 76%, respectively, of the computed fixed-head moment (Mfixed) at an equal displacement.

24
0.00.10.20.30.40.50.60.70.80.91.0
0.0 0.5 1.0 1.5 2.0 2.5
Displacement (in)
M/M
fixed
12x74W 12x74S HSS1212x74W-Base 12x74S-Base HSS12-Base
40 ksi
60 ksi
M /
Mfix
edhe
ad
Figure 15. Computed bending moments (normalized by fixed head moment at equal
displacement) in piles for case of adding a 100-ft long span length (300-ft total length, 3 span bridge) compared to baseline case (200-ft, 2-span bridge) with increasing temperature-
change induced displacements. 12x74W and 12x74S are H-pile sections for weak- and strong-axis bending, respectively; HSS12 is 12-inch diameter, 0.179-inch thick wall steel shell pile. (The solid circles indicate displacement required to yield a particular pile for 40
and 60 ksi steel. Grey lines represent baseline cases.) 4.1.3.3 Number of Piles
To study the influence of the number of piles supporting the abutment, the project team considered a case where the abutment was supported by 10 equally spaced piles (compared to the baseline case of 6 equally spaced piles). The results of the 2-D analysis indicated that increasing the number of abutment piles to 10 (not unexpectedly) increased the total resistance at the pile head by 67% over the baseline case, and the abutment rotated slightly more. This result is reasonable because increasing the total pile resistance creates a greater couple on the abutment, leading to greater rotation. Computed moments for the 12-inch steel shell pile and 12x74 H-pile sections (both strong- and weak-axis bending) were 85% and 72%, respectively, of the equivalent displacement fixed-head pile condition as illustrated in Figure 16. For this analysis, we ignored any potential pile interaction effects associated with close pile spacing. We consider this to be a reasonable assumption because the pile center-to-center spacing still exceeded three times the pile diameter, even with ten piles in the abutment. At this spacing, pile-soil-pile interaction effects are relatively small (Mokwa and Duncan 2001). 4.1.3.4 Presence of Backfill Soil Pressures behind the Abutment
To investigate the effect of backfill soil pressures acting on the abutment backwall, the 2-D analysis was performed again without applying the full passive soil pressure. Figure 17 illustrates that removing the passive soil pressure had minimal effect on the foundation/ pile response. This result can be justified by observing that the magnitude of forces resulting from full passive soil pressure against a 10-foot high, 60-foot wide abutment are still small compared to the lateral resistance provided by six foundation piles. The only instance where there was any visible difference in the results was at very small displacements (i.e., 0.01-inch), when the piles had not yet mobilized much lateral resistance.
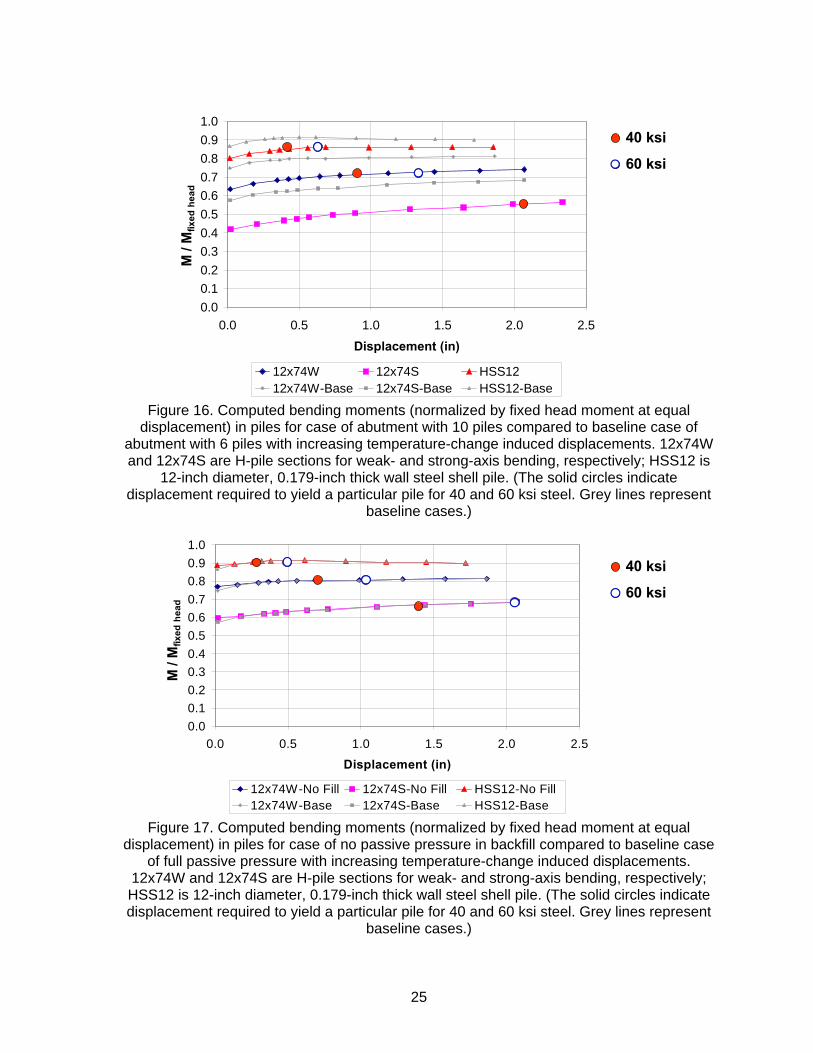
25
0.00.10.20.30.40.50.60.70.80.91.0
0.0 0.5 1.0 1.5 2.0 2.5
Displacement (in)
M/M
fixed
12x74W 12x74S HSS1212x74W-Base 12x74S-Base HSS12-Base
40 ksi
60 ksiM
/ M
fixed
head
Figure 16. Computed bending moments (normalized by fixed head moment at equal
displacement) in piles for case of abutment with 10 piles compared to baseline case of abutment with 6 piles with increasing temperature-change induced displacements. 12x74W and 12x74S are H-pile sections for weak- and strong-axis bending, respectively; HSS12 is
12-inch diameter, 0.179-inch thick wall steel shell pile. (The solid circles indicate displacement required to yield a particular pile for 40 and 60 ksi steel. Grey lines represent
baseline cases.)
0.00.10.20.30.40.50.60.70.80.91.0
0.0 0.5 1.0 1.5 2.0 2.5
Displacement (in)
M/M
fixed
12x74W-No Fill 12x74S-No Fill HSS12-No Fill12x74W-Base 12x74S-Base HSS12-Base
40 ksi
60 ksi
M /
Mfix
edhe
ad
Figure 17. Computed bending moments (normalized by fixed head moment at equal
displacement) in piles for case of no passive pressure in backfill compared to baseline case of full passive pressure with increasing temperature-change induced displacements.
12x74W and 12x74S are H-pile sections for weak- and strong-axis bending, respectively; HSS12 is 12-inch diameter, 0.179-inch thick wall steel shell pile. (The solid circles indicate displacement required to yield a particular pile for 40 and 60 ksi steel. Grey lines represent
baseline cases.)

26
4.1.3.5 Summary and Conclusions
While the FTOOL modeling involved numerous simplifications and assumptions, it allowed the project team to preliminarily evaluate the effect of several parameters on the abutment pile response efficiently. For the baseline cases described above, the less stiff piles considered here (12-inch diameter steel shell pile) reached yield at small lateral displacements (less than 1-inch) and resulted in less abutment rotation. Stiffer pile sections (12x74 H-pile with strong-axis bending) yielded at displacements of about 1.4 and 2.3 inches for yield strengths of 40 and 60 ksi, respectively. Doubling the bridge length decreased the displacements required to reach yield by 20 to 30%, while increasing the number of abutment piles to 10 increases the displacements required to reach yield by 20 to 40%. However, increasing the number of bridge spans only slightly increased the displacements required for yield, and the presence of passive backfill pressures had no significant effect on the yield behavior of the piles. 4.2 THREE-DIMENSIONAL STRUCTURAL MODELING: GENERAL
Three-dimensional (3-D) finite element (FE) models of integral abutment bridges were developed using the structural analysis software SAP2000 (CSI 2007). The bridge superstructure models consisted of steel or precast concrete beams, with a reinforced concrete deck and vertical supports at the pier locations. Detailed models of the abutment, pile cap, piles, and lateral restraint from different soil conditions (sand or clay) were developed for support of the bridge structure at its ends. Overall, the continuous bridge superstructure, abutment, pile cap, and pile materials were assumed to be linear elastic. Nonlinear properties were assigned to the soils that provide lateral restraint to the piles, pile cap, and abutment. Analyses were performed by first subjecting the bridge superstructure to dead load, and then applying positive and negative thermal loads. Parametric studies were conducted for approximately 70 bridge model scenarios to evaluate the performance of the bridge superstructure and substructure with various bridge properties (length, beam type, and skew angle of the supports), pile types, soil conditions, end-support connectivities (at the piles, pile cap, and abutment), as well as the addition of an approach slab. 4.2.1 FE Models of Integral Abutment Bridges
As shown in Figure 18(a), the baseline 3-D bridge superstructure was modeled as a linear elastic composite frame, comprised of six beams per span (at a spacing of 6 feet on-center), and an 8-inch reinforced concrete deck. Each beam was aligned with a pile at the abutment locations. The 3-D models were then adjusted to represent various bridge lengths, beam properties, and skew angles of its supports, as described in greater detail below. For specific analyses of bridges without skewed supports (where the overall bridge behavior was not affected by 3-D effects), simplified bridge “strip” models with a single pile and single beam were developed, as illustrated in Figure 18(b).
The composite bridge superstructure was represented by joined 3-D beam and shell elements, as shown in Figure 19(a). In general, the beams were implemented as “stiffeners” to the reinforced concrete deck (shell elements); the beam element node insertion points were offset to 4-inches above the top flange, and therefore both beam and shell elements shared the same nodes. As a result, the shell mid-surface axis was the reference plane of the assembled bridge superstructure model. The steel material properties in the FE models were assigned a modulus of elasticity (Es) of 29,000 ksi and a coefficient of thermal expansion (αs) of 6.5x10⁻⁶/°F; and the concrete materials were assigned a modulus of elasticity (Ec) of 3,605 ksi (corresponding to an unconfined compressive strength of 4 ksi) and a coefficient of thermal expansion (αc) of 5.5x10⁻⁶/°F, with the exception of the precast concrete beams, which were assigned an elastic modulus (Ec) of 4,770 ksi. The types of

27
beams employed in each of the different FE models of 200-foot, 400-foot, and 800-foot long bridges, as well as the corresponding beam section properties are summarized in Table 3.
x
z
y
(a) Complete 3D FE Model
Roller supports at center pier
x
z
y
(b) Simplified 3D FE Model
Figure 18. Baseline 3-D FE models of bridges and steel beam with reinforced concrete deck composite sections: (a) complete 200 ft bridge and (b) simplified strip representing one-half
of 200 ft bridge without skew. (Transverse cross-section is shown below isometric view.)

28
Beam Element
Shell ElementNode
d
v Neutral Axis Locationof Composite Section
Neutral Axis Locationof Beam Section
42 "
30 "
Beam
Pile
Pile-Cap
Abutment
Neutral Axis Locationof Composite Section
Lateral Soil
Rigid LinkConcrete Deck
Varies (d + 8")d
8 "
x
zy
Support Springs
A
B
C
360 "
Strong Axis Orientation Weak Axis Orientation
θ θ
x
y
(a)
(b)
(c)
Figure 19. FE model details of (a) composite beam section, (b) bridge beam-to-abutment
connection, and (c) plan view of H-pile and abutment orientation.
Table 3. Bridge Beam Section Properties
Bridge Length (ft)
Number of Spans and Span Length (ft)
Beam Section
Depth of Beam, d (in.)
Moment of Inertia, Ix (in.4)
Transformed Composite Section Moment of Inertia, Ix (in.4)a
Neutral Axis Offset, v (in.)
200 2 @ 100 W36x170 36.2 10,500 25,040 13.1 200 2 @ 100 54" PPCIB 54 213,715 491,340 13.9 400 4 @ 100 W36x194 36.5 12,100 27,990 12.4 400 4 @ 100 54" PPCIB 54 213,715 491,340 13.9 800 6 @ 133 40" PL Girderb 42.75 20,330 41,970 13.7 a Composite section properties include a 6-foot wide by 8-inch thick concrete deck, with its area transformed into steel or precast concrete beam elastic properties. b 40-inch x 0.5-inch web, with 1.375-inch x 15-inch flanges.
At the substructure level, the 2.5-foot thick abutment and pile cap model was represented by 3-D shell elements [Figure 18(a)]; in the simplified bridge strip models, beam
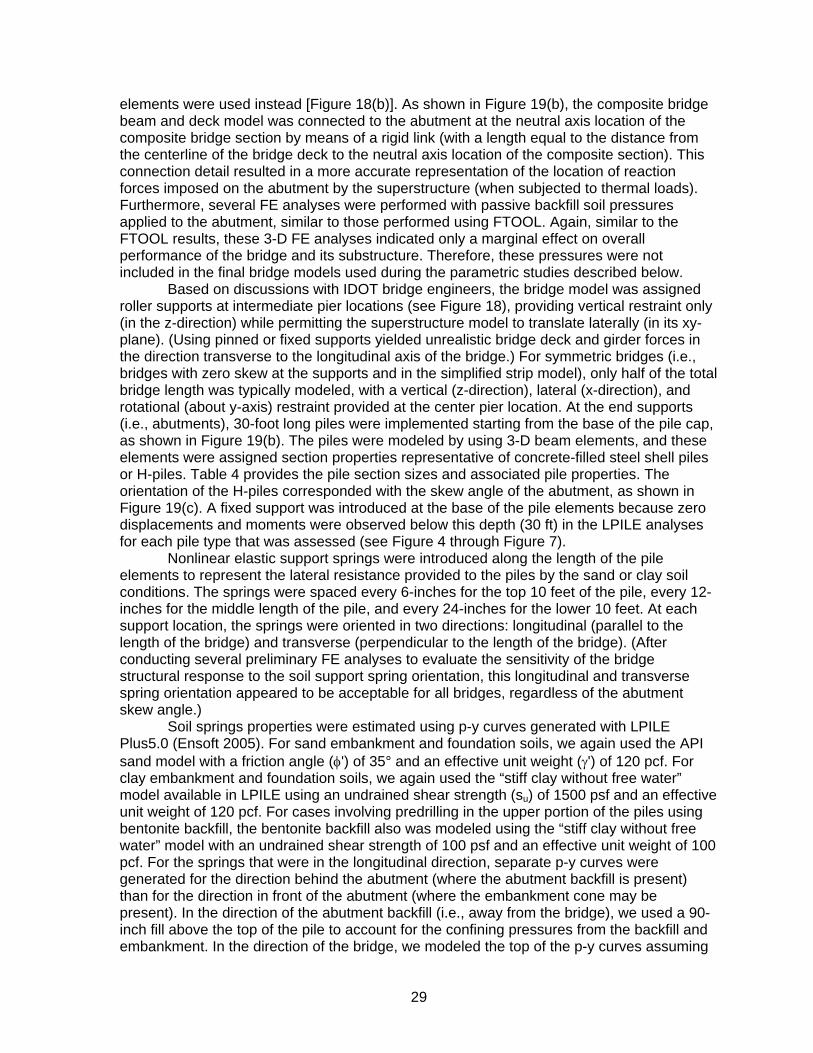
29
elements were used instead [Figure 18(b)]. As shown in Figure 19(b), the composite bridge beam and deck model was connected to the abutment at the neutral axis location of the composite bridge section by means of a rigid link (with a length equal to the distance from the centerline of the bridge deck to the neutral axis location of the composite section). This connection detail resulted in a more accurate representation of the location of reaction forces imposed on the abutment by the superstructure (when subjected to thermal loads). Furthermore, several FE analyses were performed with passive backfill soil pressures applied to the abutment, similar to those performed using FTOOL. Again, similar to the FTOOL results, these 3-D FE analyses indicated only a marginal effect on overall performance of the bridge and its substructure. Therefore, these pressures were not included in the final bridge models used during the parametric studies described below.
Based on discussions with IDOT bridge engineers, the bridge model was assigned roller supports at intermediate pier locations (see Figure 18), providing vertical restraint only (in the z-direction) while permitting the superstructure model to translate laterally (in its xy-plane). (Using pinned or fixed supports yielded unrealistic bridge deck and girder forces in the direction transverse to the longitudinal axis of the bridge.) For symmetric bridges (i.e., bridges with zero skew at the supports and in the simplified strip model), only half of the total bridge length was typically modeled, with a vertical (z-direction), lateral (x-direction), and rotational (about y-axis) restraint provided at the center pier location. At the end supports (i.e., abutments), 30-foot long piles were implemented starting from the base of the pile cap, as shown in Figure 19(b). The piles were modeled by using 3-D beam elements, and these elements were assigned section properties representative of concrete-filled steel shell piles or H-piles. Table 4 provides the pile section sizes and associated pile properties. The orientation of the H-piles corresponded with the skew angle of the abutment, as shown in Figure 19(c). A fixed support was introduced at the base of the pile elements because zero displacements and moments were observed below this depth (30 ft) in the LPILE analyses for each pile type that was assessed (see Figure 4 through Figure 7).
Nonlinear elastic support springs were introduced along the length of the pile elements to represent the lateral resistance provided to the piles by the sand or clay soil conditions. The springs were spaced every 6-inches for the top 10 feet of the pile, every 12-inches for the middle length of the pile, and every 24-inches for the lower 10 feet. At each support location, the springs were oriented in two directions: longitudinal (parallel to the length of the bridge) and transverse (perpendicular to the length of the bridge). (After conducting several preliminary FE analyses to evaluate the sensitivity of the bridge structural response to the soil support spring orientation, this longitudinal and transverse spring orientation appeared to be acceptable for all bridges, regardless of the abutment skew angle.)
Soil springs properties were estimated using p-y curves generated with LPILE Plus5.0 (Ensoft 2005). For sand embankment and foundation soils, we again used the API sand model with a friction angle (φ') of 35° and an effective unit weight (γ') of 120 pcf. For clay embankment and foundation soils, we again used the “stiff clay without free water” model available in LPILE using an undrained shear strength (su) of 1500 psf and an effective unit weight of 120 pcf. For cases involving predrilling in the upper portion of the piles using bentonite backfill, the bentonite backfill also was modeled using the “stiff clay without free water” model with an undrained shear strength of 100 psf and an effective unit weight of 100 pcf. For the springs that were in the longitudinal direction, separate p-y curves were generated for the direction behind the abutment (where the abutment backfill is present) than for the direction in front of the abutment (where the embankment cone may be present). In the direction of the abutment backfill (i.e., away from the bridge), we used a 90-inch fill above the top of the pile to account for the confining pressures from the backfill and embankment. In the direction of the bridge, we modeled the top of the p-y curves assuming

30
that the pile head was at the ground surface. For springs in the transverse direction, no overburden was included (to be conservative).
Table 4. Pile Section Properties Used in 3-D FE Analyses Pile Section
Area, A (in.2)
Moment of Inertia, Ix (in.4)
Moment of Inertia, Iy (in.4)
Section Modulus, Sx (in.3)
Section Modulus, Sy (in.3)
12" x 0.179" steel shell with concrete fill 19.9 228 - 38 - 14" x 0.25" steel shell with concrete fill 28.6 458 - 65.4 - HP12x53 15.5 393 127 66.7 21.1 NOTE: Composite pile section properties are for concrete areas transformed into steel pile
elastic properties. In addition, some of the pile sections differ from those used in the earlier 2-D modeling based on discussions with IDOT personnel throughout the course of the project.
The sand and clay soil support springs were assigned properties that represented
the resistance provided by the specific soil condition (and corresponding p-y models) that incorporated the specific width of the piles (i.e., 12- or 14-inch). For the H-pile sections, resistance in the upper 2 feet (below the pile cap) was computed based on a pile width of 24-inches to account for the 24-inch diameter reinforced concrete encasement installed at the top of these piles. (The reinforced concrete encasement was not modeled explicitly because its contribution to the top of pile stiffness and resistance appeared to be insignificant based on the lack of structural connection between the encasement and the pile cap.) Lastly, in cases where predrilling was considered, the effect of the backfill in the predrilled zone was captured using a separate set of springs.
In another series of analyses, the effects on the overall performance of bridges due to potential hinging at the cold joint between the pile cap and abutment [location B in Figure 19(b)], as well as at the pile to pile-cap connection [location C in Figure 19(b)], were evaluated by assigning moment releases at those key locations of the model. Lastly, an approach slab was modeled in a final series of FE analyses to investigate the effects of thermal response of the bridge superstructure on the slab itself, and vice versa. The approach slab was represented by beam elements, connected rigidly or hinged to the top of the abutment as shown in Figure 20 for the baseline zero skew strip models. The slab model was supported vertically by linear elastic springs assigned a resistance representing 500 psi/in.
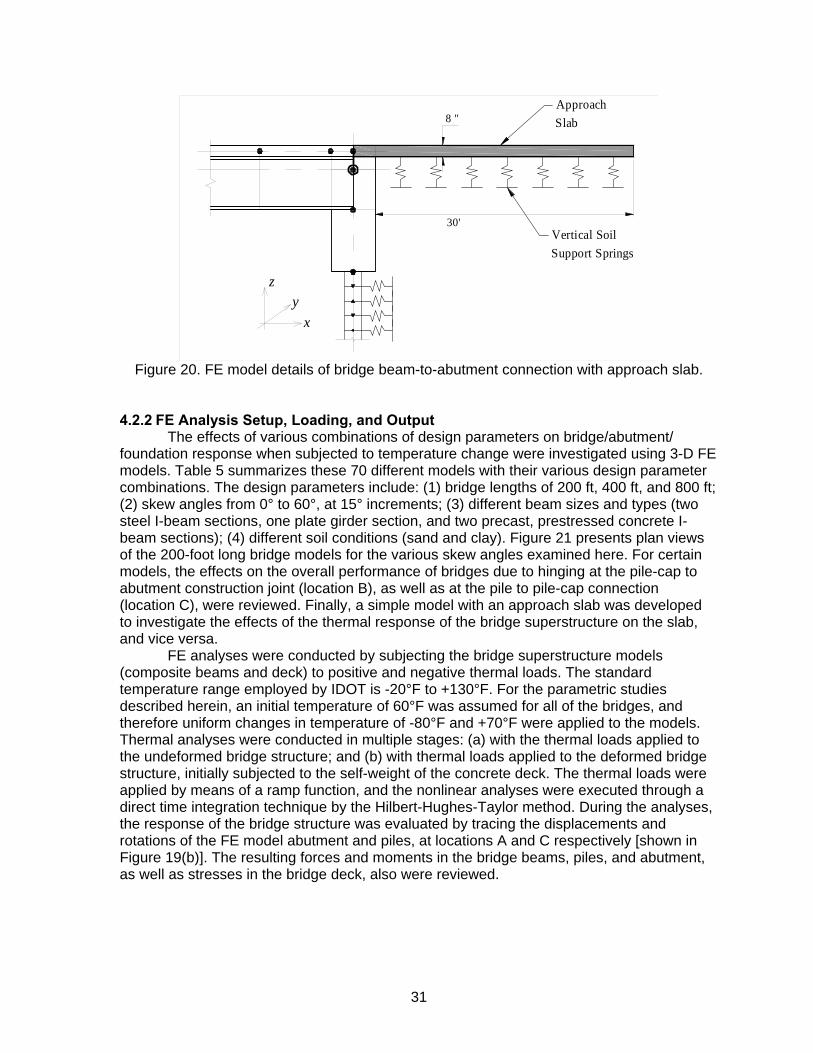
31
8 "ApproachSlab
30'Vertical SoilSupport Springs
x
zy
Figure 20. FE model details of bridge beam-to-abutment connection with approach slab.
4.2.2 FE Analysis Setup, Loading, and Output
The effects of various combinations of design parameters on bridge/abutment/ foundation response when subjected to temperature change were investigated using 3-D FE models. Table 5 summarizes these 70 different models with their various design parameter combinations. The design parameters include: (1) bridge lengths of 200 ft, 400 ft, and 800 ft; (2) skew angles from 0° to 60°, at 15° increments; (3) different beam sizes and types (two steel I-beam sections, one plate girder section, and two precast, prestressed concrete I-beam sections); (4) different soil conditions (sand and clay). Figure 21 presents plan views of the 200-foot long bridge models for the various skew angles examined here. For certain models, the effects on the overall performance of bridges due to hinging at the pile-cap to abutment construction joint (location B), as well as at the pile to pile-cap connection (location C), were reviewed. Finally, a simple model with an approach slab was developed to investigate the effects of the thermal response of the bridge superstructure on the slab, and vice versa.
FE analyses were conducted by subjecting the bridge superstructure models (composite beams and deck) to positive and negative thermal loads. The standard temperature range employed by IDOT is -20°F to +130°F. For the parametric studies described herein, an initial temperature of 60°F was assumed for all of the bridges, and therefore uniform changes in temperature of -80°F and +70°F were applied to the models. Thermal analyses were conducted in multiple stages: (a) with the thermal loads applied to the undeformed bridge structure; and (b) with thermal loads applied to the deformed bridge structure, initially subjected to the self-weight of the concrete deck. The thermal loads were applied by means of a ramp function, and the nonlinear analyses were executed through a direct time integration technique by the Hilbert-Hughes-Taylor method. During the analyses, the response of the bridge structure was evaluated by tracing the displacements and rotations of the FE model abutment and piles, at locations A and C respectively [shown in Figure 19(b)]. The resulting forces and moments in the bridge beams, piles, and abutment, as well as stresses in the bridge deck, also were reviewed.

32
Table 5. Summary of FE Models and Variables Examined in this Study
Beam Section
Bridge length
(ft)
Abutment skew angle
(deg.)
Embankment/foundation Soil
Pile Section
Other conditions
No. of models
W36x170
200 0/15/30/45/60 Sand & Clay 12" x 0.179"(a) 10 200 0/30 Sand 12" x 0.179"(a) Predrill top 8 ft 2 200 0 Sand & Clay 12" x 0.179"(a) Hinge at B 2 200 0/30 Sand & Clay 12" x 0.179"(a) Hinge at C 4 200 0 Sand 12" x 0.179"(a) Approach slab 2 200 0/30/60 Sand & Clay HP12x53 S&W(b) 12 200 0 Sand HP12x53 S&W(b) Predrill top 8 ft 2
W36x194
400 0/15/30/45/60 Sand & Clay 12" x 0.179"(a) 10 400 0/30 Sand 12" x 0.179"(a) Predrill top 8 ft 2 400 0 Sand & Clay 12" x 0.179"(a) Hinge at B 2 400 0/30 Sand & Clay 12" x 0.179"(a) Hinge at C 4
40" PL girder 800 0/15/30/45/60 Sand & Clay 14" x 0.25"(c) 10
54" PPCIB 200 0/30 Sand & Clay 12" x 0.179"(a) 4 54" PPCIB 400 0/30 Sand & Clay 12" x 0.179"(a) 4
Notes: (a)concrete-filled 12-inch diameter, 0.179-inch steel shell pile (HSS) (b)12x53 H-pile oriented for strong-axis and weak-axis bending (c)concrete-filled 14-inch diameter, 0.25-inch steel shell pile (HSS) 4.3 THREE-DIMENSIONAL STRUCTURAL MODELING: MODEL CONSTRUCTION
The primary goals of the 3-D modeling were to determine the effects of skew, soil type, pile type and orientation, girder type, and backfill pressure on the behavior of the bridge superstructure/abutment/foundation system, and to investigate possible design alterations like predrilling or built-in hinges on the system performance. However, before the results could be interpreted, additional investigation was required into the effects of several assumptions within the model – mainly in regards to the application of dead loads and with respect to expansion across the width of the bridge.
4.3.1 Application of Dead Loads
Prior to performing production runs of the 3-D models to consider a variety of different combinations of parameters, the project team considered how much dead load should be applied. We considered two construction conditions: (1) the pile cap is built, girders are placed, and then the deck and abutment are poured monolithically; and (2) the pile cap is built, girders are placed, the deck is poured, and then the abutment is poured. A conservative decision was initially made to include the dead load effects from only the deck, because the load of the girders would already be in place before the abutment was cast.
After analyzing the data from the production runs, computed moments in the piles were much larger than anticipated from the 2-D modeling, which did not assume any dead load. Including the dead load from the deck resulted in the piles exceeding their yield point for bridge lengths of only 200 feet when subjected to the design temperature changes. Even cases with moment relief mechanisms like predrilling or hinges resulted in yielding of the piles.

33
(a) Symmetric 0° skew
x
y
(b) 15° skew
(c) 30° skew
(d) 45° skew
(e) 60° skew
Figure 21. Plan view of 3-D FE models of 200-foot long bridges with different abutment and
intermediate pier skews.
These results forced us to reconsider the conservatism of our initial decision. After further discussion, we concluded that the second loading option above (the bridge deck is poured before pouring the abutment) was more consistent with actual construction procedures. Unfortunately, time constraints did not allow all of the FE models to be rerun without the dead load in place. Therefore, we developed an offset method to remove the effect of the dead load from the FE analyses that had already been completed. A subset of the models was rerun without dead load to evaluate the suitability of the offset method shown below.
( )DLTDLOFFSET MCMM ⋅−= + Eq. 2
where MOFFSET = moment back-calculated using the proposed offset; MDL+T = moment computed for combined dead load and temperature change; MDL = moment with only dead load; and C = offset constant determined by pile and soil conditions, as shown in Table 6.

34
While the simple offset constant was not entirely effective for computing displacements and rotations of the abutment, it was quite successful for computing the moments in the piles. Offset moments in the piles computed using Eq. 2 were within 5% of the moments computed with no dead load for all cases. Furthermore, we found that the offset method was not influenced by girder type, skew, hinges, or predrilling. Therefore, computed moments are reported below for each case evaluated, while the stresses, displacements, and rotations are reported only for the cases that were rerun without dead load.
Table 6. Values of Offset Factor C Used for Offset Method Soil Type Sand Clay Pile Type
H Piles in Strong Axis Bending 1.0 0.9
H Piles in Weak Axis Bending and Steel Shell Piles 0.9 0.8
4.3.2 Expansion along Bridge Width
While reviewing the FE results for the baseline model, it was at first unclear to the project team why the piles would be tilting slightly away from the centerline of the bridge (i.e., in the transverse direction) in a case with no skew. The project team deduced that this small transverse rotation was a result of the bridge deck expanding perpendicular to the centerline of the bridge. In the model, the temperature change was applied to the bridge deck, but not the abutment. As a result, the deck-abutment system bent like an arch to accommodate this difference in displacement, despite the strong resistance to bending provided by the abutment. In turn, the piles at the edges of the abutment always exhibited higher stresses because they rotated slightly more than the interior piles. Moments induced by this effect were generally one-tenth to one-fifth of the moments caused by longitudinal expansion. We anticipate that this effect reasonably represents true behavior. The bridge deck will feel the full temperature change, but the abutments are fairly insulated by the backfill and embankment fill soils. Therefore, the project team decided to leave the full deck expansion (as described above) in the subsequent models. 4.3.3 Comparison to 2-D FTOOL Modeling
After the project team addressed the issues observed during the initial modeling and agreed upon the assumptions feeding into the baseline model, the results from 3-D FE modeling were compared to those obtained from 2-D FTOOL models. For this comparison, the 3-D and 2-D baseline bridges (i.e., 200-foot, 2 span steel bridges with zero skew and sand backfill/embankment soil) were used. The average displacement at the top of the abutment for these 3-D models was 0.565-inches, which was the displacement that we used to extract results from the 2-D models. Figure 22 presents the maximum pile moments extracted from the 2-D and 3-D models in terms of the pile section modulus. The maximum pile moments computed for the interior piles in the 3-D baseline model agree well with maximum pile moments computed in the 2-D baseline model. The results do not agree exactly because the girder and abutment properties were slightly adjusted over the course of the project, and even the interior piles felt a slight increase in moment from the arching of the abutment, as discussed in Section 4.3.2.

35
0
10
20
30
40
50
60
0 20 40 60 80 100
Section Modulus, S (in3)
Max
Ben
ding
Str
ess
(ksi
)2D
3D - Exterior Pile
3D - Interior Pile
Pile Section Modulus, S (in3)
Figure 22. Comparison of maximum pile moments computed in 2-D and 3-D baseline bridge models
4.4 THREE-DIMENSIONAL STRUCTURAL MODELING: RESULTS
The project team investigated a number of parameters with the 3-D modeling, as summarized earlier in Table 5. The main parameters were total bridge length, pile type, skew angle, and soil type. The majority of the models addressed various combinations of these main parameters. In addition, a number of analyses were performed to investigate specific additional parameters, such as backfill pressures, girder type, pile orientation, predrilling, and built-in hinges. It was implicitly assumed that the effects of these specific parameters would have minimal interference with the effects of the main parameters, such that incorporating these specific parameters would not modify the conclusions from the primary analyses. 4.4.1 Baseline Bridge Model
The baseline bridge model was developed to set a benchmark for comparing the results of all subsequent models. As discussed previously, the parameters for the baseline model were selected to represent typical designs that IDOT uses for integral abutment bridges based on the plans that IDOT personnel provided to the project team. The baseline model bridge was a 200-foot long structure with two spans, steel girders, and 12-inch diameter concrete filled steel shell piles with 0.179-inch thick walls. The backfill and foundation soils were assumed to be sand for the baseline model. Figure 23 presents the maximum bending stresses computed in the steel shell piles for the baseline case, as well as a number of other cases including skew angles ranging from 0 to 60°, bridge lengths of 200 and 400 feet (with all cases being analyzed as a two-span structure), and both sand and clay backfill/embankment fill/foundation soils. Typically, the maximum bending stresses and moments occurred in the piles on the outsides of the group, particularly for bridges with skew. The data in Figure 23 show that with current IDOT specifications (i.e., temperature extremes of -20 to 130°F, or a maximum temperature change of -80°F to +70°F for a temperature of 60°F at construction), Grade 36 and Grade 40 concrete-filled steel shell piles would yield in a 200-foot long bridge (with either sand or clay soils) under the maximum design temperature change. In contrast, Grade 50 and Grade 60 steel would remain below its yield stress at the 200-foot length.
For the other cases (i.e., other than the baseline case) described in Figure 23, the following trends were observed: For a bridge length of 400 feet (i.e., 4 100-ft spans, see
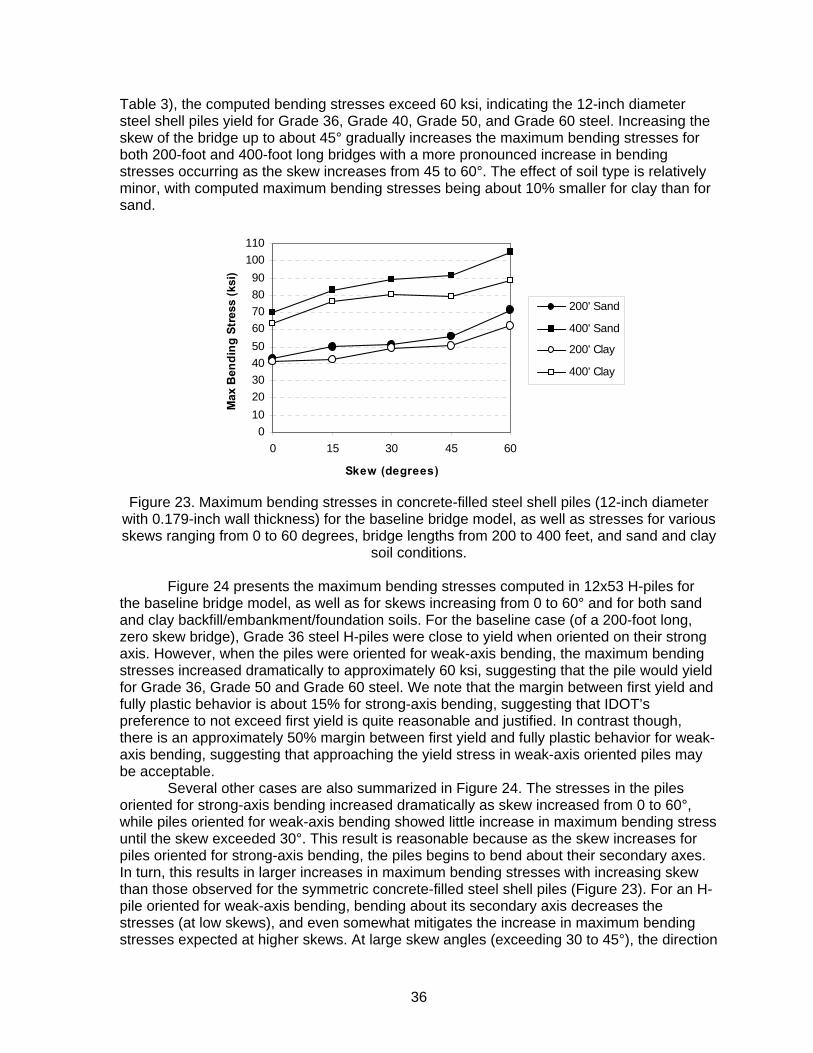
36
Table 3), the computed bending stresses exceed 60 ksi, indicating the 12-inch diameter steel shell piles yield for Grade 36, Grade 40, Grade 50, and Grade 60 steel. Increasing the skew of the bridge up to about 45° gradually increases the maximum bending stresses for both 200-foot and 400-foot long bridges with a more pronounced increase in bending stresses occurring as the skew increases from 45 to 60°. The effect of soil type is relatively minor, with computed maximum bending stresses being about 10% smaller for clay than for sand.
0102030405060708090
100110
0 15 30 45 60
Skew (degrees)
Max
Ben
ding
Str
ess
(ksi
)
200' Sand
400' Sand
200' Clay
400' Clay
Figure 23. Maximum bending stresses in concrete-filled steel shell piles (12-inch diameter
with 0.179-inch wall thickness) for the baseline bridge model, as well as stresses for various skews ranging from 0 to 60 degrees, bridge lengths from 200 to 400 feet, and sand and clay
soil conditions.
Figure 24 presents the maximum bending stresses computed in 12x53 H-piles for the baseline bridge model, as well as for skews increasing from 0 to 60° and for both sand and clay backfill/embankment/foundation soils. For the baseline case (of a 200-foot long, zero skew bridge), Grade 36 steel H-piles were close to yield when oriented on their strong axis. However, when the piles were oriented for weak-axis bending, the maximum bending stresses increased dramatically to approximately 60 ksi, suggesting that the pile would yield for Grade 36, Grade 50 and Grade 60 steel. We note that the margin between first yield and fully plastic behavior is about 15% for strong-axis bending, suggesting that IDOT’s preference to not exceed first yield is quite reasonable and justified. In contrast though, there is an approximately 50% margin between first yield and fully plastic behavior for weak-axis bending, suggesting that approaching the yield stress in weak-axis oriented piles may be acceptable.
Several other cases are also summarized in Figure 24. The stresses in the piles oriented for strong-axis bending increased dramatically as skew increased from 0 to 60°, while piles oriented for weak-axis bending showed little increase in maximum bending stress until the skew exceeded 30°. This result is reasonable because as the skew increases for piles oriented for strong-axis bending, the piles begins to bend about their secondary axes. In turn, this results in larger increases in maximum bending stresses with increasing skew than those observed for the symmetric concrete-filled steel shell piles (Figure 23). For an H-pile oriented for weak-axis bending, bending about its secondary axis decreases the stresses (at low skews), and even somewhat mitigates the increase in maximum bending stresses expected at higher skews. At large skew angles (exceeding 30 to 45°), the direction

37
of abutment and pile movement approaches 45° off either axis, so the orientation has little effect on the maximum bending stresses in the piles.
0102030405060708090
100110
0 30 60
Skew (degrees)
Max
Ben
ding
Str
ess
(ksi
)Sand -Strong AxisSand -Weak AxisClay -Strong AxisClay - WeakAxis
Figure 24. Maximum bending stresses in 12x53 H-piles oriented for strong-axis bending
(with flanges parallel to abutment backwall) and for weak-axis bending (with flanges perpendicular to the abutment backwall) for the baseline bridge model, as well as stresses
for various skews ranging from 0 to 60 degrees, and sand and clay soil conditions.
Similar to the results for the concrete-filled steel shell piles, the 12x53 H-piles oriented for weak-axis bending exhibited maximum bending stresses about 10% smaller when founded in clay soils rather than sandy soils. In contrast, the H-piles oriented for strong-axis bending exhibited nearly identical maximum bending stresses in sand and clay soils. 4.4.2 Presence of Passive Pressure in Backfill
A 3-D FE model was run with full passive soil pressures applied to the back of the abutment to investigate the effect of backfill on the piles. Similar to the results observed for the 2-D model, the abutment rotated and bent slightly more than the baseline case without soil pressures, but the effect on the abutment and foundation response was relatively insignificant. As such, this 3-D analysis confirmed the results of the 2-D modeling and illustrated that the backfill pressures have minimal impact on pile response. 4.4.3 Concrete versus Steel Girders
The project team analyzed several models that incorporated different-sized girders, as well as concrete girders rather than steel girders to investigate the influence of girder size and type on pile response (Table 5). Figure 25 illustrates that the maximum bending stresses in the piles are nearly identical for the steel and concrete girders. This result appears to be independent of bridge length, bridge skew, and backfill/soil type. While concrete has a lower coefficient of thermal expansion (which would lead to smaller bridge displacements), the concrete girders used by IDOT have a higher flexural stiffness than steel girders for a comparable span length (which would result in less rotation of the abutment and higher shear forces and moments in the piles).

38
0102030405060708090
100110
0 15 30
Skew (degrees)
Max
Ben
ding
Str
ess
(ksi
)
200' Steel
400' Steel
200' Concrete
400' Concrete
Figure 25. Effect of girder type on pile response. (W36x170 girders were used for 200-foot long steel models and W36x194 were used for the 400-ft long steel models. In contrast, 54-
inch deep PPCIP beams were used for both 200-foot and 400-foot long bridges.) 4.4.4 Potential Moment Relief Mechanisms
As these results presented above illustrate, the current IAB design guidelines employed by IDOT (concrete bridges up to 410 feet, steel bridges up to 310 feet, and maximum skew of 30°) are likely to cause the foundation piles to yield for nearly all pile types and sections commonly employed by IDOT, as well as for most backfill/embankment/ foundation soil types if the maximum temperature swings occurred during the structure’s lifetime. If longer IABs are to be used without causing the piles to yield (while maintaining the deterministic temperature range requirements of -20°F and 130°F), design changes that allow moments to be relieved must be incorporated. To investigate potential moment relief mechanisms, the project team developed and analyzed several models that incorporated various moment relief mechanism concepts. These concepts involved: (1) predrilling 8 feet before driving piles, then filling the annulus between the pile and soil with bentonite; (2) installing a “hinge” (such as that employed by the Virginia DOT and shown in Figure 2 at the cold joint between the pile cap and abutment); and (3) creating a hinge at the connection between the piles and the pile cap, perhaps by reducing pile embedment length from about two times the pile width (typically about 2 feet) to approximately 6 inches.
Figure 26 illustrates the potential reduction in maximum bending stresses in the concrete-filled steel shell piles for the baseline bridge model (200-foot long bridge, 2 spans, zero skew, steel girders, 6 piles at the abutment, and sand backfill, embankment, and foundation soils) as well as for a 400-foot long, 4-span bridge, where location B is the connection of pile cap and abutment and location C is the connection of piles and pile cap. These results show that all three of these moment relief alternatives could significantly reduce the maximum bending stresses in the abutment piles, with predrilling reducing pile stresses by 25 - 30%, a hinge at location C reducing pile stresses by approximately 55%, and a hinge at location B reducing pile stresses by approximately 65%.

39
0102030405060708090
100110
100 200 300 400 500
Bridge Length (ft)
Max
Ben
ding
Str
ess
(ksi
)
Base Case
Hinge at B
Hinge at C
Predrill
Figure 26. Effect of moment relief mechanism for baseline bridge case (200-foot long bridge, 2 spans, zero skew steel girders, 6 concrete-filled steel shell piles, sand soils), as well as for 400-foot long, 4-span bridges. (The hinge at B is located at the pile cap/abutment interface and the hinge at C is located at the pile/pile cap interface. Predrilling was assumed to be
performed to 8 feet below the base of the pile cap.)
Figure 27 presents the effects of moment relief mechanisms for the 200-foot long, 2-span bridge with 12x53 H-piles oriented for strong- and weak-axis bending in sands, considering variable skew. Predrilling had the largest effect on H-piles in weak axis bending, reducing the maximum bending moment by nearly 35% (similar to the reduction observed for concrete-filled steel shell piles), while the reduction for H-piles in strong-axis bending was only about 15%. This is reasonable because lighter sections are influenced more by the soil resistance than heavier sections, thus the H-piles in weak-axis bending experienced the largest moment relief, the steel shell piles experienced an intermediate amount of moment relief, and the H-piles in strong axis bending experienced the least moment relief. Introducing a hinge at location C caused a reduction in the maximum bending stress for the H-pile in strong-axis bending of 50 to 55%, identical to the reductions observed for the steel shell piles. Because the hinge applies to all horizontal directions, the piles move mostly parallel to the long-axis of the bridge. This allows the pile to bend primarily about the axis it is oriented for, reducing skew effects that had been observed previously.
4.4.5 Stresses in the Bridge Structure
During discussions with IDOT personnel, the cold joint between the pile cap and abutment (location B) was identified as an area of concern, with one potential issue being that the limited reinforcement crossing the joint may be yielding in some existing instrumented bridges. Figure 28 presents computed moments at the cold joint (location B) for a variety of pile types and both sand and clay soil conditions. These results illustrate that for current IDOT integral abutment bridge designs, the moments at that joint could exceed the ultimate bending capacity of the reinforced concrete abutment cross-section (even if the modest beneficial self-weight compression load were included). Lighter pile sections create smaller moments in the abutment, but all cases with no skew are well beyond yielding in these bars. One important implication that this analyses reveals is that current IABs and their foundation piles may be performing well, in part, because yielding at the cold joint (location B) is almost analogous to installing a plastic hinge at location B – one of the moment relieving methods described above – or because: (1) the IABs in Illinois have not been subjected to the extreme temperature swings that are specified in the design manual;

40
or (2) the joint fixity between the abutment and bridge beams is not 100% efficient. We anticipate that if this joint relieves the moments imposed by temperature-induced abutment translation and slight rotation (i.e., this joint is unintendedly “failing” first), then the maximum bending moments computed in our analyses are not able to fully develop.
0102030405060708090
100110
0 30 60
Skew (degrees)
Max
Ben
ding
Stre
ss (k
si)
Base -Strong AxisBase -Weak AxisPredrill -Strong AxisPredrill -Weak AxisHinge at C -Strong Axis
Figure 27. Effect of moment relief mechanisms for 200-foot long, 2-span bridge with 12x53 H-piles oriented for strong- and weak-axis bending in sands, and variable skew. (The hinge at C is located at the pile/pile cap interface. Predrilling was assumed to be performed to 8
feet below the base of the pile cap.)
0
10
20
30
40
50
60
70
80
0 45
Skew Angle (degrees)
Mom
ent (
K-in
/in)
Sand - Pipe
Sand - H Pile (Strong)
Sand - H Pile (Weak)
Clay - Pipe
Clay - H Pile (Strong)
Clay - H Pile (Weak)
Estimated UltimateCapacity
Figure 28. Moments computed at cold joint (location B) for baseline bridge model (200-foot
long, 2-span, zero skew, steel girders, 6 abutment piles) with both baseline model piles (concrete-filled steel shell piles) and 12x53 H-piles oriented for strong- and weak axis
bending, and both sand and clay soils.
When moment relief alternatives of predrilling and inserting a hinge at location C (at the pile cap/pile interface) are considered, moments and stresses at the cold joint (location B) drop significantly, as shown in Figure 29. A hinge at location C reduces moments by approximately 45% compared to the baseline case, slightly smaller than the percent reduction in stress observed in the piles when this moment relief mechanism is employed.

41
Compared to the baseline, predrilling reduces the moments by approximately 65% of the baseline case (i.e., equals about 35% of the baseline moment).
Figure 29. Moments at cold joint (location B) for baseline bridge model (200-foot long, 2
span, zero skew bridge, 6 concrete-filled steel shell piles) for steel and concrete girders and considering two moment relief options.
A second area of concern for these structures was the stresses developed in the
bridge deck near or at the abutment (location A in Figure 19). Unfortunately, the design of the elements used to develop the FE model precluded us from clearly computing good estimates of the average stresses in the deck. Specifically, because the deck is only connected to the abutment where a girder frames into the abutment, very high stress concentrations develop. This behavior is not expected to occur in real IABs. Therefore, the tensile stresses presented in Figure 30 should be considered to be qualitative. However, stresses in the deck at locations reasonably distant from location A were likely to exceed the tensile capacity of the deck concrete. The data in Figure 30 suggest that the deck stresses increase with increasing skew and that the only moment relieving mechanism that can appreciably reduce the deck stresses is to install a hinge at location B. 4.4.6 Stresses in Approach Slab
The project team also examined the stresses in an approach slab during thermal loading using the simplified 3-D bridge model including an approach slab. The approach slab was added to the 2000-ft baseline strip model of the bridge without skew [as described above and illustrated in Figure 18(b)]. Overall, the type of connection between the approach slab and the bridge superstructure played a key role on the performance of the slab, as summarized in Table 7. A continuous connection resulted in flexural stresses well above the tensile rupture strength of typical concrete materials, for both positive and negative thermal loading. In contrast, a hinged connection resulted in significantly lower flexural stresses, within typically acceptable strength limits (though axial restraint of the approach slab could still lead to significant normal stresses). Finally, the presence of the approach slab did not appear to significantly affect the resulting stresses in the bridge deck. A baseline bridge case without an approach slab resulted in bridge deck stresses of approximately 2.2 ksi for thermal loading in both directions, and these stresses remained unchanged after adding the approach slab.

42
0
0.5
1
1.5
2
2.5
3
3.5
0 45
Skew Angle (degrees)
Max
imum
Ten
sile
Str
ess
(ksi
)
Sand - Pipe
Sand - H Pile (Strong)
Sand - H Pile (Weak)
Clay - Pipe
Clay - H Pile (Strong)
Clay - H Pile (Weak)
Sand - Hinge at B
Sand - Hinge at C
Predrill
Figure 30. Tensile stresses computed in bridge deck for baseline bridge model (200-foot
long, 2 span, 6 abutment piles) modified with various piles (concrete-filled steel shell piles and H-piles oriented for strong- and weak-axis bending), sand and clay soils, and various
moment relieving mechanism.
Table 7. Summary of Maximum Flexural Stresses in Approach Slab and Bridge Deck for
Baseline Bridge Case Subjected to Maximum Temperature Increase and Decrease Approach Slab-to-Bridge Deck Connection Type and Thermal Load Condition
Resultant Flexural Stress in Approach Slab (ksi)
Resultant Stress in Bridge Deck (ksi)
Continuous ΔT = +70°F ΔT = -80°F
1.38 0.80
2.1 2.3
Hinged ΔT = +70°F ΔT = -80°F
0.029 0.016
2.1 2.3
4.4.7 Summary and Conclusions
Figure 31 through Figure 34 graphically summarize the allowable lengths and skews for the integral abutment bridge models and variables examined in this study. For practical purposes, we adopted a maximum skew for the plots of 60°. Somewhat surprising was the result that without a moment relieving mechanism, the current IDOT limitations for IABs are somewhat aggressive for the smaller piles considered here (i.e., 12-inch diameter HSS with 0.179-inch thick walls and HP12x53 with both strong and weak axis bending) and could likely result in pile yielding. The stouter piles considered here (i.e., 14-inch diameter HSS with 0.25-inch thick walls and HP12x74 for both strong and weak axis bending) did not appear to yield for the current IDOT length limitations and most values of skew.
As discussed previously, it appears likely that yielding occurs in the reinforcing steel at the cold joint between the pile cap and the abutment. As a result, this joint likely relieves considerable moment in the abutment/foundation system and prevents the piles from yielding. However, we also anticipate that even if the piles yielded, this should not necessarily lead to deficient behavior of the abutment/foundation system.

43
0
10
20
30
40
50
60
70
0 200 400 600 800 1000
Skew
(de
gree
s)
Integral Abutment Bridge Length, L (ft)
Six 12x74 H‐pile weak axis6 piles per abutment
Skews > 60o not considered
60 ksi steel
36 ksi steel
50 ksi steel
0
10
20
30
40
50
60
70
0 200 400 600 800 1000
Skew
(de
gree
s)
Integral Abutment Bridge Length, L (ft)
Six 12x74 H‐pile strong axis6 piles per abutment
Skews > 60o not considered
0
10
20
30
40
50
60
70
0 200 400 600 800 1000
Skew
(de
gree
s)
Integral Abutment Bridge Length, L (ft)
Six 14" dia. x 0.25" wall6 piles per abutment
Skews > 60o not considered
0
10
20
30
40
50
60
70
0 200 400 600 800 1000
Skew
(de
gree
s)
Integral Abutment Bridge Length, L (ft)
Six 12x53 H‐pile weak axis6 piles per abutment
Skews > 60o not considered
60 ksi steel
36 ksi steel
50 ksi steel
0
10
20
30
40
50
60
70
0 200 400 600 800 1000
Skew
(de
gree
s)
Integral Abutment Bridge Length, L (ft)
Six 12x53 H‐pile strong axis6 piles per abutment
Skews > 60o not considered
0
10
20
30
40
50
60
70
0 200 400 600 800 1000
Skew
(de
gree
s)
Integral Abutment Bridge Length, L (ft)
Six 12" dia. x 0.179" wall6 piles per abutment
Skews > 60o not considered
Figure 31. Allowable IAB lengths and skews for various pile types using grade 36, 50, and 60 steel with no moment reduction.

44
0
10
20
30
40
50
60
70
0 200 400 600 800 1000
Skew
(de
gree
s)
Integral Abutment Bridge Length, L (ft)
Six 12x74 H‐pileweak axis6 piles per abutment
Skews > 60o not considered
60 ksi steel
36 ksi steel
50 ksi steel
0
10
20
30
40
50
60
70
0 200 400 600 800 1000 1200
Skew
(de
gree
s)
Integral Abutment Bridge Length, L (ft)
Six 12x74 H‐pile strong axis6 piles per abutmentNote change in x‐axis scale
Skews > 60o not considered
0
10
20
30
40
50
60
70
0 200 400 600 800 1000 1200
Skew
(de
gree
s)
Integral Abutment Bridge Length, L (ft)
Six 14" dia. x 0.25" wall6 piles per abutmentNote x‐axis scale change
Skews > 60o not considered
60 ksi steel
50 ksi steel
0
10
20
30
40
50
60
70
0 200 400 600 800 1000
Skew
(de
gree
s)
Integral Abutment Bridge Length, L (ft)
Six 12x53 H‐pile weak axis6 piles per abutment
Skews > 60o not considered
60 ksi steel
36 ksi steel
50 ksi steel0
10
20
30
40
50
60
70
0 200 400 600 800 1000
Skew
(de
gree
s)
Integral Abutment Bridge Length, L (ft)
Six 12x53 H‐pile strong axis6 piles per abutment
Skews > 60o not considered
0
10
20
30
40
50
60
70
0 200 400 600 800 1000
Skew
(de
gree
s)
Integral Abutment Bridge Length, L (ft)
Six 12" dia. x 0.179" wall6 piles per abutment
Skews > 60o not considered
Figure 32. Allowable IAB lengths and skews for various pile types using grade 36, 50, and 60 steel with predrilling to a depth of 8
feet.
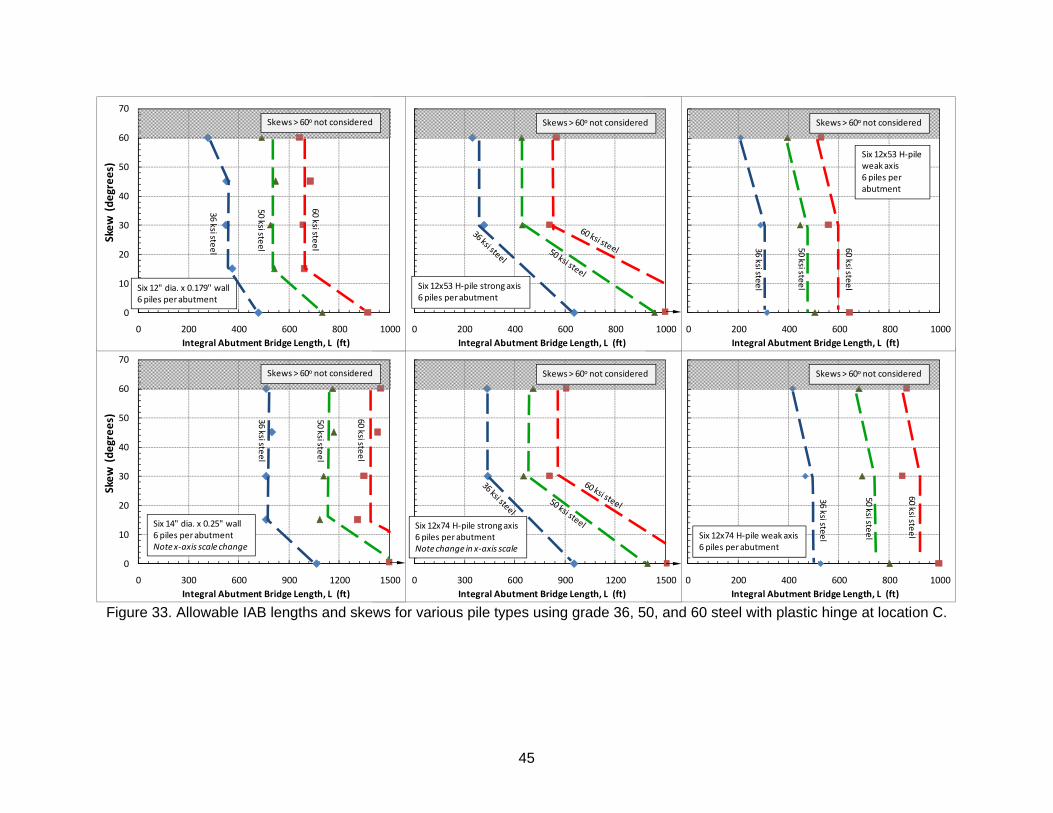
45
0
10
20
30
40
50
60
70
0 200 400 600 800 1000
Skew
(de
gree
s)
Integral Abutment Bridge Length, L (ft)
Six 12x74 H‐pile weak axis6 piles per abutment
Skews > 60o not considered
60 ksi steel
36 ksi steel
50 ksi steel
0
10
20
30
40
50
60
70
0 300 600 900 1200 1500
Skew
(de
gree
s)
Integral Abutment Bridge Length, L (ft)
Six 12x74 H‐pile strong axis6 piles per abutmentNote change in x‐axis scale
Skews > 60o not considered
0
10
20
30
40
50
60
70
0 300 600 900 1200 1500
Skew
(de
gree
s)
Integral Abutment Bridge Length, L (ft)
Six 14" dia. x 0.25" wall6 piles per abutmentNote x‐axis scale change
Skews > 60o not considered
60 ksi steel
36 ksi steel
50 ksi steel
0
10
20
30
40
50
60
70
0 200 400 600 800 1000
Skew
(de
gree
s)
Integral Abutment Bridge Length, L (ft)
Six 12x53 H‐pileweak axis6 piles per abutment
Skews > 60o not considered
60 ksi steel
36 ksi steel
50 ksi steel
0
10
20
30
40
50
60
70
0 200 400 600 800 1000
Skew
(de
gree
s)
Integral Abutment Bridge Length, L (ft)
Six 12x53 H‐pile strong axis6 piles per abutment
Skews > 60o not considered
0
10
20
30
40
50
60
70
0 200 400 600 800 1000
Skew
(de
gree
s)
Integral Abutment Bridge Length, L (ft)
Six 12" dia. x 0.179" wall6 piles per abutment
Skews > 60o not considered
60 ksi steel
36 ksi steel
50 ksi steel
Figure 33. Allowable IAB lengths and skews for various pile types using grade 36, 50, and 60 steel with plastic hinge at location C.

46
0
10
20
30
40
50
60
70
0 400 800 1200 1600 2000 2400
Skew
(de
gree
s)
Integral Abutment Bridge Length, L (ft)
Six 12x74 H‐pile weak axis6 piles per abutment Note x‐axis scale change
Skews > 60o not considered
60 ksi steel
36 ksi steel
50 ksi steel
0
10
20
30
40
50
60
70
0 400 800 1200 1600 2000 2400
Skew
(de
gree
s)
Integral Abutment Bridge Length, L (ft)
Six 12x74 H‐pile strong axis6 piles per abutmentNote change in x‐axis scale
Skews > 60o not considered
0
10
20
30
40
50
60
70
0 400 800 1200 1600 2000 2400
Skew
(de
gree
s)
Integral Abutment Bridge Length, L (ft)
Six 14" dia. x 0.25" wall6 piles per abutmentNote x‐axis scale change
Skews > 60o not considered
60 ksi steel
36 ksi steel
50 ksi steel
0
10
20
30
40
50
60
70
0 300 600 900 1200 1500
Skew
(de
gree
s)
Integral Abutment Bridge Length, L (ft)
Six 12x53 H‐pileweak axis6 piles per abutment Note x‐axis scale change
Skews > 60o not considered
60 ksi steel
36 ksi steel
50 ksi steel
0
10
20
30
40
50
60
70
0 300 600 900 1200 1500
Skew
(de
gree
s)
Integral Abutment Bridge Length, L (ft)
Six 12x53 H‐pile strong axis6 piles per abutment Note x‐axis scale change
Skews > 60o not considered
0
10
20
30
40
50
60
70
0 300 600 900 1200 1500
Skew
(de
gree
s)
Integral Abutment Bridge Length, L (ft)
Six 12" dia. x 0.179" wall6 piles per abutment Note x‐axis scale change
Skews > 60o not considered
60 ksi steel
36 ksi steel
50 ksi steel
Figure 34. Allowable IAB lengths and skews for various pile types using grade 36, 50, and 60 steel with plastic hinge at location B.

47
CHAPTER 5. PRELIMINARY INSTRUMENTATION PLAN
The purpose of the proposed instrumentation plan is to instrument and monitor one or more integral abutment bridges (IABs) to: (1) verify current design assumptions; (2) validate the numerical analyses performed in this study; (3) measure actual soil/foundation/ abutment performance; and (4) monitor the long-term behavior of these systems. As intended in the original planning for this project, and as unanimously agreed by the Technical Review Panel for this project, implementing the instrumentation plans proposed in this study and actually measuring the performance of IABs in Illinois is vital to expanding the use of IABs by IDOT designers. This section of the report describes a preliminary scope of work to instrument a new IAB (i.e., that is, the bridge would be in its early design stages). 5.1 PARTICIPANTS AND THEIR ROLES
The proposed instrumentation project will require a joint effort among the University of Illinois at Urbana-Champaign (UIUC), IDOT, a geotechnical consultant (Consultant), and a construction contractor (Contractor). The role for UIUC will be to: (1) design the instrumentation plan; (2) procure the instruments and appurtenant equipment for data acquisition; and (3) install the geotechnical instruments at the bridge site with the assistance of the Consultant and the Contractor. IDOT’s role will be to facilitate communication among the Contractor, the Consultant, and UIUC. The role for the Consultant will be to: (1) assist UIUC in installing the geotechnical instruments; (2) design and install the automated data acquisition system for the geotechnical instruments; and (3) maintain and monitor the instrumentation and data acquisition system. The Contractor’s role will be to: (1) provide materials (e.g., abutment piles) needed for installing geotechnical instruments; (2) provide timely access at the construction site to the project team members; (3) provide laborer and/or equipment operators for short periods of time to assist with installing the instruments; and (4) provide schedule allowances to install the instruments.
5.2 GEOTECHNICAL INSTRUMENTS
Table 8 below provides a list of the geotechnical instruments proposed for this project and a brief description of their primary function.
Table 8. List of Geotechnical Instruments Planned for Instrumenting each IAB Instrument Quantity Function Vibrating wire temperature sensors
3 Measure bridge deck, deck support girder, and ambient air temperature for correlating temperature to abutment movement
Vibrating wire position transducers
8 Measure x and y positions at ends of both abutments
Vibrating wire tilt meters 2 Measures rotation of the abutment for validating numerical models
Arc weldable strain gages 40 Attached to two abutment piles to measure strain profile along upper portion of pile during lateral loading. Each pile will have 4 strain gages installed at depths of 12” above base of pile cap, at base of pile cap, and 12”, 24”, and 48” below base of pile cap.
Vertical inclinometers and casing
2 Measure biaxial displacement and rotation of abutment at both sides of bridge
Monitoring points 6 Monitor settlement of backfill and embankment fill. Automated data logger 1 Collect and store data from instruments until
downloaded at specific time intervals.
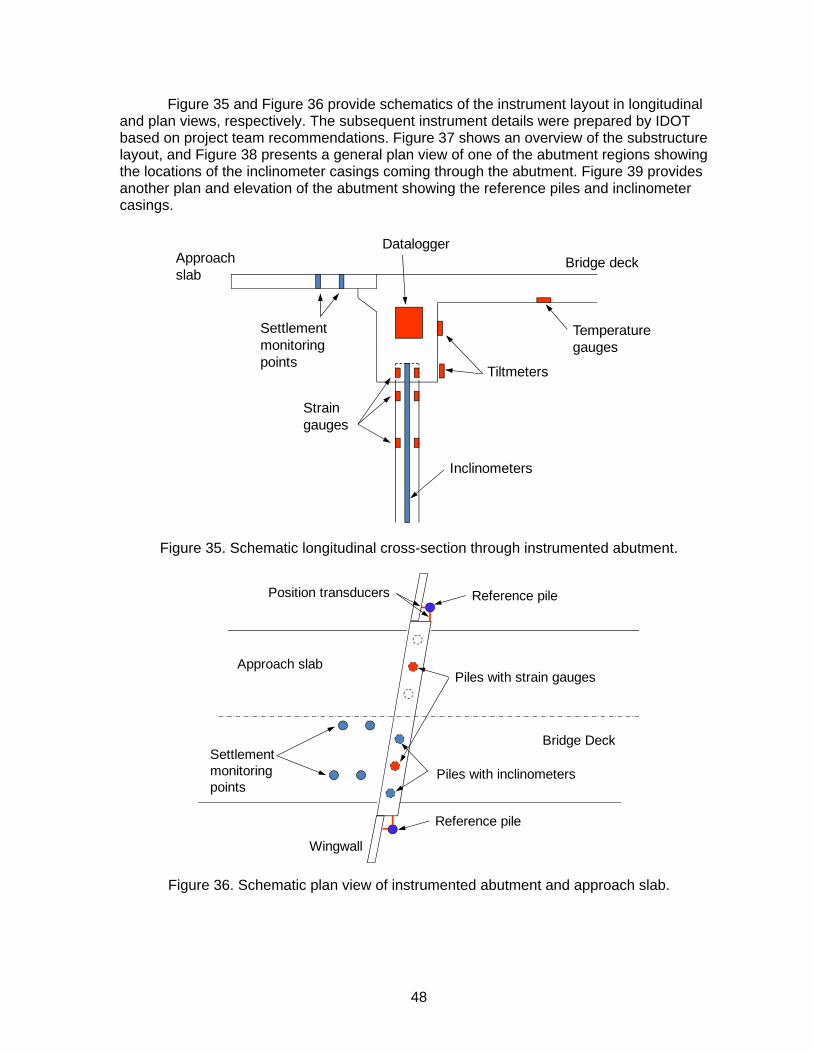
48
Figure 35 and Figure 36 provide schematics of the instrument layout in longitudinal and plan views, respectively. The subsequent instrument details were prepared by IDOT based on project team recommendations. Figure 37 shows an overview of the substructure layout, and Figure 38 presents a general plan view of one of the abutment regions showing the locations of the inclinometer casings coming through the abutment. Figure 39 provides another plan and elevation of the abutment showing the reference piles and inclinometer casings.
Strain gauges
Bridge deckApproach slab
Inclinometers
Settlement monitoring points
Tiltmeters
Temperature gauges
Datalogger
Figure 35. Schematic longitudinal cross-section through instrumented abutment.
Bridge Deck
Reference pile
Approach slab
Piles with inclinometers
Piles with strain gauges
Position transducers
Settlement monitoring points
Reference pile
Wingwall
Figure 36. Schematic plan view of instrumented abutment and approach slab.

49
Figure 37. Overview of substructure layout including instrumented pile locations and isolated
reference piles used to track abutment displacement.
Section A‐A
Figure 38. Plan and sectional views of abutment with locations of inclinometer casings.

50
Figure 39. Plan and elevation of abutment.
5.3 PRELIMINARY SCOPE OF WORK
The following sections provide a detailed preliminary scope of work that can be used to develop special provisions for inclusion in the contract.
1. UIUC will design the instrumentation plan, prepare preliminary drawings, final Scope of Work (SOW), preliminary Equipment List, and draft Instrument Measurement Protocol for use on the project. IDOT will review and approve all documents and preliminary drawings prior to proceeding.
2. Consultant will design automated data acquisition system (ADAS), prepare
design/ construction drawings and details for instrument and ADAS installation, and update Equipment List and Instrument Measurement Protocol document. The drawings and details will be included in Construction Plans for the selected integral abutment bridge. All drawings and documents will be reviewed and approved by IDOT prior to proceeding.
3. Contractor will review approved construction drawings and SOW for
instrumentation system and modify construction schedule as needed.
4. UIUC will procure all geotechnical instruments and appurtenant equipment on final Equipment List. UIUC will verify calibration for geotechnical instruments per manufacturer’s recommendations and standard industry practice.
5. UIUC will supply ADAS equipment to Consultant for pre-installation preparation.
6. Consultant will assemble and test ADAS system components prior to field
installation per manufacturer’s recommendations and standard industry practice.

51
7. Contractor will supply construction materials (e.g., abutment piles, protective
channels, etc.) to UIUC for pre-installation preparation.
8. UIUC will install arc-weldable strain gages on selected abutment piles and install protective channels over strain gages per manufacturers’ recommendations and standard industry practice.
9. Contractor will return instrumented materials to construction site following pre-
installation preparation by UIUC. Contractor will provide safe storage of instrumented materials at construction site prior to installation.
10. UIUC and Consultant will install, field calibrate, and verify the performance of the
following geotechnical instruments at bridge site: (a) vibrating wire temperature sensors on bridge deck, on bridge deck girder, and in free-field adjacent to bridge; (b) vibrating wire earth pressure cells in back face of abutment; (c) vertical in-place inclinometers through access hole provided in abutment; (d) horizontal inclinometer casing laid in abutment backfill. All instruments will be installed, field calibrated, and verified per manufacturer’s recommendations and standard industry practice
11. Contractor will provide laborers and/or equipment operators as needed, as well
as provide safe access to construction site for UIUC and Consultant to complete the work. As the various instruments will need to be installed at different times during abutment/fill construction, Contractor will coordinate with UIUC to allow for installation during bridge construction.
12. Consultant will install ADAS, connect all geotechnical instrumentation to ADAS,
and verify that the instruments and ADAS perform as intended per manufacturer’s recommendations and standard industry practice.
13. Contractor will provide laborers and/or equipment operators as needed, as well
as provide safe access to construction site for Consultant to install and troubleshoot ADAS.
14. Consultant will develop data management system to store and preliminarily
process raw instrument data per Instrument Measurement Protocol document.
15. UIUC will manually download data from ADAS and obtain horizontal inclinometer measurements according to schedule established in the Instrument Measurement Protocol document.
16. Consultant will provide raw and preliminary processed instrument data to UIUC
for verification and further processing according to the schedule established in the Instrument Measurement Protocol document.
52
CHAPTER 6 CONCLUSIONS AND RECOMMENDATIONS
The use of integral abutment bridges (IABs) is increasing rapidly in the United States because of their many advantages; their primary advantage being the reduction of maintenance costs associated with repairing and replacing expansion joints, damaged/corroded girder ends, bearings, and concrete abutment and substructure elements. However, the length and skew limitations that the Illinois Department of Transportation (IDOT) and many other DOTs place on IABs are based to a large extent on judgment and experience rather than on in-depth engineering analysis.
To address this situation and potentially expand the use of IABs in Illinois, the project team: (1) reviewed recent literature regarding IAB use and performance; (2) conducted a targeted survey of regional DOTs that employ IABs to understand their experience with the superstructure and substructure design and construction, as well as the maintenance and performance record of IABs; (3) performed 2-D and 3-D geotechnical and structural modeling of IABs based on IDOT designs to understand the current design demands and explore methods to expand IAB use; and (4) developed preliminary instrumentation plans to measure the performance of a number of IABs in the state of Illinois.
The literature review and targeted survey suggested that IDOT was relatively conservative in their design limitations compared to several states that have successfully used IABs for some time. Therefore, the numerical modeling was important to understand the reasons for these differences and to develop a rational basis for expanding the use of IABs in Illinois.
On the basis of the numerical analyses, the project team presents the following conclusions and recommendations:
1. The presence of the backfill and development of full passive pressures against the abutment backwall (which likely develops over time) have a negligible effect on the performance of the foundation system.
2. The use of wingwalls that are parallel to the longitudinal axis of the bridge (compared to the typical design where the wingwalls are parallel to the abutment backwall) has little effect on the performance of the abutment or the foundation piles, and does not significantly reduce the backfill settlement when the backfill is uncompacted. However, the use of uncompacted backfill reduces the support of the approach slab and results in greater stresses and moments in the approach slab. Therefore, we recommend that IDOT consider compacting the select granular backfill used directly behind the abutment backwall.
3. The soil type (when the soil is reasonably competent, i.e., medium dense or denser sand and stiff to hard clay) has a secondary effect on the performance of the abutment and foundation, and for practical purposes the abutment and foundation performance in sand or clay can be considered to be the same.
4. The use of steel and concrete girders (within the limited number of girder types and sizes considered) also has a secondary effect on the performance of the abutment and foundation, and for practical purposes can be considered to be the same. This behavior occurs primarily because while concrete has a lower coefficient of thermal expansion (meaning less displacement for a given temperature change), the concrete girders generally have slightly higher flexural stiffness and therefore result in less abutment rotation (for a given displacement) which in turn causes greater moments and stresses in the piles.
5. Figure 31 through Figure 34 can be used to evaluate acceptable bridge length and skew combinations (based on current IDOT design methods for IABs) that

53
induce stresses in the foundation piles that do not exceed the pile yield stress. Alternatively, the maximum length and skew combinations outlined in Table 9 through Table 14 could be adopted. (These values conservatively interpret the nonlinear trends presented in the figures. Furthermore we adopted a practical maximum skew value of 60° for the recommendations in the table.)
Table 9. Allowable Length and Skew Combinations for Integral Abutment Bridges using 12-
inch diameter, Concrete-filled HSS Piles with 0.179-inch Thick Walls Grade 36 steel Grade 50 steel Grade 60 steel
Maximum length (feet)
Skew
(degrees)
Maximum length (feet)
Skew
(degrees)
Maximum length (feet)
Skew
(degrees) No moment reduction (i.e., current IDOT design)
160 100
0 - 30 30 - 60
240 160
0 - 30 30 - 60
300 240
0 - 30 30 - 60
Predrill to 8 ft 240 160
0 - 30 30 - 60
390 280
0 - 30 30 - 60
480 400
0 - 30 30 - 60
Hinge at pile cap/pile interface
350 280
0 - 30 30 - 60
520 0 - 60 650 60
Hinge at pile cap/abutment interface
540 0 - 60 800 0 - 60 1020 0 - 60
Table 10. Allowable Length and Skew Combinations for Integral Abutment Bridges using HP12x53 Piles Oriented for Strong Axis Bending
Grade 36 steel Grade 50 steel Grade 60 steel Maximum
length (feet)
Skew
(degrees)
Maximum length (feet)
Skew
(degrees)
Maximum length (feet)
Skew
(degrees) No moment reduction (i.e., current IDOT design)
140
0 - 30
240 120
0 - 30 30 - 60
320 190
0 - 30 30 - 60
Predrill to 8 ft 160 0 - 30 300 160
0 - 30 30 - 60
360 240
0 - 30 30 - 60
Hinge at pile cap/pile interface
400 250
0 - 30 30 - 60
600 440
0 - 30 30 - 60
700 550
0 - 30 30 - 60
Hinge at pile cap/abutment interface
600 440
0 - 30 30 - 60
900 680
0 - 30 30 - 60
1000 850
0 - 30 30 - 60

54
Table 11. Allowable Length and Skew Combinations for Integral Abutment Bridges Using HP12x53 Piles Oriented for Weak Axis Bending
Grade 36 steel Grade 50 steel Grade 60 steel Maximum
length (feet)
Skew
(degrees)
Maximum length (feet)
Skew
(degrees)
Maximum length (feet)
Skew
(degrees) No moment reduction (i.e., current IDOT design)
Not recommended 160 120
0 - 30 30 - 60
240 180
0 - 30 30 - 60
Predrill to 8 ft 160 0 - 30 280 240
0 - 30 30 - 60
380 320
0 - 30 30 - 60
Hinge at pile cap/pile interface
300 240
0 - 30 30 - 60
440 400
0 - 30 30 - 60
600 540
0 - 30 30 - 60
Hinge at pile cap/abutment interface
450 0 - 60 700 0 - 60 900 0 - 60
Table 12. Allowable Length and Skew Combinations for Integral Abutment Bridges using 14-
inch diameter, Concrete-filled HSS Piles with 0.25-inch Thick Walls Grade 36 steel Grade 50 steel Grade 60 steel
Maximum length (feet)
Skew
(degrees)
Maximum length (feet)
Skew
(degrees)
Maximum length (feet)
Skew
(degrees) No moment reduction (i.e., current IDOT design)
360 280
0 - 30 30 - 60
500 0 - 60 620 0 - 60
Predrill to 8 ft 500 0 - 60 760 0 - 60 930 0 - 60 Hinge at pile cap/pile interface
750 0 - 60 1120 0 - 60 1380 0 - 60
Hinge at pile cap/abutment interface
1200 0 - 60 1660 0 - 60 2060 0 - 60
Table 13. Allowable Length and Skew Combinations for Integral Abutment Bridges Using
HP12x74 Piles Oriented for Strong Axis Bending Grade 36 steel Grade 50 steel Grade 60 steel
Maximum length (feet)
Skew
(degrees)
Maximum length (feet)
Skew
(degrees)
Maximum length (feet)
Skew
(degrees) No moment reduction (i.e., current IDOT design)
240 120
0 - 30 30 - 60
400 240
0 - 30 30 - 60
500 320
0 - 30 30 - 60
Predrill to 8 ft 300 160
0 - 30 30 - 60
500 320
0 - 30 30 - 60
600 400
0 - 30 30 - 60
Hinge at pile cap/pile interface
600 420
0 - 30 30 - 60
900 680
0 - 30 30 - 60
1050 840
0 - 30 30 - 60
Hinge at pile cap/abutment interface
1000 680
0 - 30 30 - 60
1300 1040
0 - 30 30 - 60
1600 1300
0 - 30 30 - 60

55
Table 14. Allowable Length and Skew Combinations for Integral Abutment Bridges using HP12x74 Piles Oriented for Weak Axis Bending
Grade 36 steel Grade 50 steel Grade 60 steel Maximum
length (feet)
Skew
(degrees)
Maximum length (feet)
Skew
(degrees)
Maximum length (feet)
Skew
(degrees) No moment reduction (i.e., current IDOT design)
160 110
0 - 30 30 - 60
300 240
0 - 30 30 - 60
380 320
0 - 30 30 - 60
Predrill to 8 ft 320 250
0 - 30 30 - 60
480 420
0 - 30 30 - 60
600 560
0 - 30 30 - 60
Hinge at pile cap/pile interface
440 0 - 60 700 0 - 60 860 0 - 60
Hinge at pile cap/abutment interface
760 0 - 60 1120 0 - 60 1360 0 - 60
6. On a case-by-case basis, a relatively simple and conservative approach can be adopted to examine specific IAB length and skew limitations, as follows: (1) compute the maximum bridge expansion and contraction using Eq. 1 (i.e., simple thermal expansion); (2) assume that the abutment accommodates this displacement through translation with no rotation; (3) perform LPILE (or equivalent) analyses to compute the moments and stresses induced in the piles as a result of the imposed lateral displacement (use the design axial load for the pile when computing the lateral response); (4) increase the stresses and moments in the pile by 20% to account for the higher stresses experienced by exterior piles; and (5) size the piles accordingly.
7. In order to increase IAB length and skew limitations in Illinois, we recommend the following options: (1) predrill the pile locations to a depth of 8 feet; (2) reduce the depth of pile embedment in the pile cap from about 2 x pile width (i.e., 2 feet) to 6 inches, which would essentially introduce a hinge at the pile/pile cap interface; or (3) incorporate a mechanical hinge such as that used by the Virginia DOT (Figure 2) at the cold joint between the pile cap and the abutment. If the latter option were employed, Figure 32 through Figure 34 illustrate the influence on the allowable length and skew.
8. Although beyond the scope of this project, we suggest that IDOT consider designing IAB foundation piles to exceed the yield stresses as another alternative that would broaden the current limitations for IABs. Hassiotas et al. (2006) present a methodology for designing IAB foundation piles for exceeding the yield stress; their approach is excerpted in Appendix II.
9. Based on the results of this study, it is critical that IDOT continue with its plans to instrument and monitor IABs in Illinois to validate the numerical modeling described in this report. It is further recommended that IDOT consider delaying the implementation of the recommendations of this study until the initial results from an instrumentation program are available.
10. The project team recommends that IDOT consider installing a moment relief mechanism in one of the IABs that will be targeted for instrumentation to investigate its potential effectiveness.
11. Lastly, the project team also recommends that IDOT continue monitoring the instrumented bridges well beyond the lifetime of the instrumentation project, because based on past experience with short-term monitoring programs, it is highly unlikely

56
that the instrumented bridge(s) will be subjected to the extreme temperature swings that were modeled in the numerical analyses.

57
CHAPTER 7 REFERENCES American Institute of Steel Construction, Inc. (AISC), Steel Construction Manual, Thirteenth Edition. Chicago: American Institute of Steel Construction, Inc., 2005. Bonczar, C., S. Breña, S. Civjan, J. DeJong, B. Crellin, and D. Crovo, “Field Data and FEM Modeling of the Orange-Wendell Bridge.” Proc., FHWA Conf. on Integral Abutments and Jointless Bridges, Baltimore, MD, March 16-18, 2005(a), pp. 163-173. Bonczar, C., S. Breña, S. Civjan, J. DeJong, and D. Crovo, “Integral Abutment Pile Behavior and Design – Field Data and FEM Studies.” Proc., FHWA Conf. on Integral Abutments and Jointless Bridges, Baltimore, MD, March 16-18, 2005(b), pp. 174-184. Civjan, S. A., C. Bonczar, S. F. Brena, J. DeJong, and D. Crovo, “Integral Abutment Bridge Behavior: Parametric Analysis of a Massachusetts Bridge, Journal of Bridge Engineering, ASCE, 12(1), 2007, pp. 64-71. Computers and Structures, Inc. (CSI) (2007). SAP2000 Advanced 11.0.0 Structural Analysis Program, Berkeley, CA, <http://www.csiberkeley.com/>. Delano, J.G. et al, “Behavior of Pile-Supported Integral Abutments at Bridge Sites with Shallow Bedrock – Phase I.” Maine DOT Report No. ME 01-07, June 2005. Dunker, K. F. and A. Abu-Hawash, “Expanding the Use of Integral Abutments in Iowa,” Proc., 2005 Mid-Continent Transportation Research Symposium, Ames, IA, August 2005. Dupont, B. and D. L. Allen, “Movements and Settlements of Highway Bridge Approaches,” Kentucky Transportation Center Report KTC-02-18/SPR-220-00-1F, University of Kentucky, Lexington, KY, June 2002. Ensoft , LPILE Plus 5.0 Geotechnical Analysis Program, <www.ensoftinc.com>, 2005. Fennema, J. L., J. A. Laman, and D. G. Linzell, D.G. “Predicted and Measured Response of an Integral Abutment Bridge.” Journal of Bridge Engineering, ASCE, 10(6), 2005, pp. 666-677. Frosch, R. J., M. Wenning, and V. Chovichien, “The In-service Behavior of Integral Abutment Bridges: Abutment-pile Response,” Proc., FHWA Conf. on Integral Abutments and Jointless Bridges, Baltimore, MD, March 16-18, 2005, pp. 30-40. FTOOL, http://www.tecgraf.puc.rio.br/ftool/ftooleng.html, 2002. Hassiotis, S., Y. Khodair, E. Roman, and Y. Dehne, “Evaluation of Integral Abutments,” Final Report, FHWA-NJ-2005-025, Federal Highway Administration, Washington, D.C., 2006. Horvath, J.S., “Integral-abutment Bridges: Geotechnical Problems and Solutions Using Geosynthetics and Ground Improvement,” Proc., FHWA Conf. on Integral Abutments and Jointless Bridges, Baltimore, MD, March 16-18, 2005, pp. 281-291.

58
Lawver, A., C. French, and C. K. Shield, “Field Performance of an Integral Abutment Bridge.” Transportation Research Record, No. 1740, Transportation Research Board, Washington, D.C., 2000, pp. 108-117. Maruri, R.F. and Petro, S.H. (2005). “Integral Abutments and Jointless Bridges (IAJB) 2004 Survey Summary.” Proc., FHWA Conf. on Integral Abutments and Jointless Bridges, Baltimore, MD, March 16-18, pp. 12-29. Mistry, V.C., “Integral Abutment and Jointless Bridges,” Proc., FHWA Conf. on Integral Abutments and Jointless Bridges, Baltimore, MD, March 16-18, 2005, pp. 3-11. Mokwa, R. L. and J. M. Duncan, “Laterally Loaded Pile Group Effects and P-Y Multipliers.” ASCE Geotechnical Special Publication (GSP No. 113), Foundations and Ground Improvement, ASCE, Reston, VA, 2001, pp. 728–742. Naval Facilities Design Manual (NAVFAC), Soil Mechanics. Design Manual DM7.1. Department of the Navy, Washington, D.C., 1982. Shekar, V. and S. Aluri, “Integral Abutment Bridges with FRP Decks – Case Studies,” Proc., FHWA Conf. on Integral Abutments and Jointless Bridges, Baltimore, MD, March 16-18, 2005, pp. 113-124. Weakley, K., “VDOT integral bridge design guidelines.” Proc., FHWA Conf. on Integral Abutments and Jointless Bridges, Baltimore, MD, March 16-18, 2005, pp. 61-72.

59
APPENDIX A TARGETED SURVEY QUESTIONNAIRES Questions asked of DOT structural engineers
1. What are the limits for length and skew of IABs? How were these limits determined? And have these limits been met or exceeded?
2. Do you use approach slabs? If so, what is the detail of the slab and the connection to the abutment?
3. What typical pile type does your state use? And what is its yield strength? 4. What typical wingwall geometry does your state use? What are the advantages
of this? 5. Does your state use a construction joint between the pile cap and the abutment? 6. Are there any bridges that have been instrumented and studied in your state? Is
data still being collected and is it available? What conclusions were reached? Has your state made any modifications to IAB design details and usage limits based on this work?
7. Can we have a copy of a typical IAB design? Questions asked of DOT geotechnical engineers
1. What are the design criteria for pile type? What criteria does your state use for orienting the piles? Does your state use predrilling, overdrilling, or backfill with weak materials for piles? How were these criteria determined?
2. What are the design criteria for backfill gradation and compaction? How were these determined?
3. What specifications does your state use for the backfill against the abutment for countering displacements? Does your state use MSE walls or flowable fill behind the abutment?
4. Has your state seen any evidence of ratcheting or passive pressures behind the abutment backwall?
5. Are there any bridges that have been instrumented and studied in your state? Is data still being collected and is it available? What conclusions were reached? Has your state made any modifications to IAB design details and usage limits based on this work?
Questions asked of DOT construction and maintenance personnel
1. What are the primary problems that your state has experienced with IABs? How expensive is it (unit cost) to replace/fix that/those particular problem(s)? How often does that/those particular problem(s) occur? How do these problems and expenses compare to those of conventional bridges?
2. Has your state seen differences in approach slab performance between conventional and integral abutment bridges?
3. Has your state seen any evidence of excessive pressures or cracking on the back wall of the abutments?
4. Has your state observed deck cracking near the abutment?

60
APPENDIX B DESIGN PROCEDURE FOR INTEGRAL ABUTMENTS FROM HASSIOTIS ET AL. (2006) Step 1. Superstructure design 1.1. The superstructure design is based on LRFD Step 2. Design the abutment piles for vertical load 2.1. Choose the pile that can carry the applied vertical loads (dead load + live load + impact)
• Choose pile cross section. • Allow 1/16” corrosion around the pile perimeter. • Calculate the allowable pile stress for the corroded section. • Check the axial load capacity. If the total pile design load is more than the allowable
force on the pile corroded section, redesign. Step 3. Design the piles for horizontal loading 3.1. Calculate the total thermal movement demand at the abutment. 3.2. Calculate the plastic moment capacity of the section of the pile, MP. 3.3. Check the ability of the surrounding concrete to develop the plastic moment capacity
within the embedded length of pile penetrating the abutment. 3.4. Calculate the displaced shape and the bending moment diagram of a horizontally
loaded pile embedded in soil (using a program such as LPILE). • The boundary condition needed to model the pile-abutment system is fixed head +
displacement. Using LPILE one can start modeling using fixed head condition (slope at the pile head = 0) and then apply the lateral load that is needed to achieve the horizontal displacement.
• If MTOP (moment at the top of the pile) is less than the plastic moment MP then reduce the pile section or the steel grade. Redesign.
• If MTOP is approximately equal to the plastic moment then we remodel the system as a free head with an applied MP at the top.
3.5. Check the unbraced length section of the pile as a beam column. • Determine the applicable group load cases on the unbraced length (Lc) of the pile
(unbraced = length of pile between zero moments) • Calculate the pile capacities using the AASHTO LRFD and develop interaction
diagram. • Superimpose the group loading on the interaction diagram.
o If the group loading is under the interaction diagram then OK. o If not, then Redesign (increase pile cross section or the steel grade).
