civil grand jury | 2016-2017
TRANSCRIPT

ACCELERATING SF GOVERNMENT PERFORMANCE TAKING ACCOUNTABILITY AND TRANSPARENCY TO THE NEXT LEVEL
MAY 2017
CIVIL GRAND JURY | 2016-2017
CITY AND COUNTY OF SAN FRANCISCO

2
ACCELERATING SF GOVERNMENT PERFORMANCE
THE CIVIL GRAND JURY
The Civil Grand Jury is a government oversight panel of volunteers who serve for one year. It makes findings and recommendations resulting from its investigations.
Reports of the Civil Grand Jury do not identify individuals by name. Disclosure of information about individuals interviewed by the jury is prohibited.
California Penal Code, section 929.
STATE LAW REQUIREMENT Each published report includes a list of those public entities that are required to respond to the Presiding Judge of the Superior Court within 60 to 90 days as specified. A copy must be sent to the Board of Supervisors. All responses are made available to the public. For each finding, the response must:
1) agree with the finding, or 2) disagree with it, wholly or partially,
and explain why. As to each recommendation the responding party must report that:
1) the recommendation has been implemented, with a summary explanation; or
2) the recommendation has not been implemented but will be within a set timeframe as provided; or
3) the recommendation requires further analysis. The officer or agency head must define what additional study is needed. The Grand Jury expects a progress report within six months; or
4) the recommendation will not be implemented because it is not warranted or reasonable, with an explanation.
California Penal Code, Section 933.05
JURORS | 2016 – 2017
KATHIE LOWRY, FOREPERSON
KITSAUN KING, FOREPERSON PRO TEM
CHARLES HEAD, SECRETARY
CHRIS BACON
RICHARD BAKER-LEHNE
CONSTANCE BERNSTEIN
DONNA CASEY
PHYLLIS DEETS
JOHN ERICKSON
SANFORD GALLANTER
LAWRENCE GROO
YANE NORDHAV
ADAM RASKIN
RAE RAUCCI
DANIEL ROSENTHAL
MARVIN STENDER
DAVID TEJEDA
CHARLES THOMPSON
ELLEN LEE ZHOU

3
ACCELERATING SF GOVERNMENT PERFORMANCE
EXECUTIVE SUMMARY
San Franciscans are frustrated. According to credible polls, in recent years a near majority of residents believe the City is headed in the wrong direction. While many areas in the United States (US) feature a large proportion of dissatisfied voters, that San Francisco suffers from such widespread public dismay is remarkable considering that it lies at the heart of the most dynamic regional economy in the nation.
Explaining this public frustration, a reasonable San Franciscan would likely point to a housing affordability crisis that has resulted in the highest rents of any major US city, a property crime rate that is the highest of the 50 largest US cities, a homelessness situation that has, by the City’s own metrics, worsened even while the San Francisco Government (SFG) spends approximately $250 million a year on related services.
The underlying paradox: while the people of San Francisco have grown more frustrated, the SFG budget has increased by roughly 100% over the last ten years -- and the City now appears to spend more on public services per capita than any other major city in the country.
The Civil Grand Jury (CGJ) addressed these questions with the overall objective of improving the focus, accountability and transparency of the SFG’s performance in the areas of greatest concern to the people of San Francisco. In particular, we:
1) Assessed the SFG’s Performance Scorecard (PS) framework, the primary Citywide platform for tracking and reporting performance to the public; and
2) Examined how the SFG measures and tracks progress in the top areas of public concern (homelessness, affordability and housing, and crime and street safety).
Through an extensive investigation drawing on dozens of interviews with SFG representatives from both the executive and legislative branches, as well as reference to the experience and practice of other leading US cities, our analysis leads to two overarching findings: (1) the SFG’s operational focus, in terms of tracking and measuring progress on the public’s gravest concerns, can be improved; and (2) the SFG can substantially improve communicating what and how it is doing to the public.
A related finding is that even some senior SFG officials are unaware of how the SFG tracks and reports on performance to the public. If even senior City Hall officials do not know how the SFG tracks progress, how can the government be held accountable by the people?
The 14 recommendations that follow from these findings are grouped in two categories:
▪ Recommendations ensuring the SFG achieves parity in accountability and transparency with other leading US cities; and
▪ Recommendations enabling the SFG to set a new national standard for responsive, accountable and transparent government.
The CGJ’s recommendations collectively represent a non-partisan blueprint for the Mayor and Board of Supervisors to measurably enhance and accelerate the SFG’s response to the public’s gravest concerns and well documented frustration.
Our objective: to improve the focus, accountability and transparency of the SFG’s performance in the areas of greatest concern to the people of San Francisco

4
ACCELERATING SF GOVERNMENT PERFORMANCE
CONTENTS
EXECUTIVE SUMMARY 3
BACKGROUND & METHODOLOGY 5
DISCUSSION & ANALYSIS 8
I. REPORTING FRAMEWORK 8
Baseline Assessment 9 Analysis 10
II. THE PUBLIC’S PRIORITIES 13 Housing Affordability 13 Homelessness 15
Crime & Street Safety 18
FINDINGS & RECOMMENDATIONS 20
REQUEST FOR RESPONSES 23
ENDNOTES 26
APPENDICES 30 Appendix A: SFG & External Sources 31 Appendix B: SF in National / Global Rankings 33 Appendix C: SFG Performance Scorecard 34 Appendix D: Austin’s Citywide Dashboard 36

5
ACCELERATING SF GOVERNMENT PERFORMANCE
BACKGROUND & METHODOLOGY
BACKGROUND San Franciscans are frustrated. Over the last several years an average of 40% of citizens indicated they believe the City is headed in the wrong direction (see Figure 1 below).1 While many areas in the US feature a large proportion of dissatisfied voters, that San Francisco suffers from such widespread public dismay is remarkable considering it lies at the heart of the most dynamic regional economy in the nation, boasting growth well above the national average and an unemployment rate hovering near 3%.2
FIGURE 1: TOP PUBLIC ISSUES: 2014-2017*
ISSUE 2014 2015 2016 2017 ‘14-’17 Average
Homelessness/street behavior 29% 35% 51% 60% 43%
Affordability/cost of rents 21% 43% 44% 51% 40%
Housing/cost of owning a home 44% 35% 27% 23% 32%
Crime, drugs & gangs 10% 14% 12% 8% 11%
“SF is going in the wrong direction” 37% 34% 51% 36% 40%
(*)Source: DignityHealth CityBeat Poll 2014-2017
The strength of the local economy has even led some to trumpet San Francisco as “the new Florence of the Renaissance”.3 Yet even a cursory review of headlines lends credence to the frustration of San Franciscans, while raising fundamental questions about how the San Francisco Government (SFG) is responding to public needs. In particular, a concerned reasonable citizen (hereinafter “Citizen R”), would likely note:
▪ An affordability crisis which has resulted in the highest average rental prices in the country, leading to an exodus of young families, with the City now home to the lowest percentage of children of any of the 100 largest cities in the country.4
▪ High rates of petty crime, with the FBI reporting that San Francisco has the highest per capita property crime rate of the top 50 cities in the country.5
▪ Outdated infrastructure, with 71% of major roads classed as in poor condition, the worst rating of any major city in the country (for the second consecutive year), and the third worst traffic congestion of any US city.6
▪ An under-performing public transportation system, with the slowest average bus transit times among peer cities, a MUNI system that consistently misses voter-mandated on-time performance levels, and a BART system which recently received the lowest customer satisfaction rating in 20 years.7
▪ Dramatic increases in citizen complaints about street cleanliness, with a 41% increase in complaints about syringes and a 39% increase in complaints about feces during the 2015-2016 period, suggesting a “citywide crisis”.8
▪ A hollowed out public school system with only 53,000 students, down from 90,000 in 1970; today the City has the lowest public school enrollment (70% of children) of any large US city.9
Digesting these facts, Citizen R might be surprised, if not astonished, to learn that the citizens of San Francisco appear to pay more per capita for their public services than any other

6
ACCELERATING SF GOVERNMENT PERFORMANCE
large US city (see Figure 2 below).10 Moreover, the SFG’s budget has increased by nearly 100% over the last ten years, from $5.3 billion to $9.6 billion for the 2016-2017 Fiscal Year (FY). During this period inflation has been negligible while the population grew by approximately 10% (from 777,660 to 864,186).
FIGURE 2: COMPARING SF TO OTHER CITIES*
City 2005 Pop. 2016 Pop. Pop.
Increase 2005
Budget 2016
Budget
Budget
Increase (’05-’16)
Per Capita
Budget (‘16)
San Francisco 777,660 864,186 11% $5.3B $9.6B 81% $11,108
Austin 708,293 931,830 32% $2.5B $3.7B 48% $3,971
New York 8,143,197 8,491,079 4% $47B $78B 67% $9,245
Philadelphia 1,463,281 1,562,000 7% $5.9B $8.1B 37% $5,185
Portland 555,650 619,445 12% $2.1B $4.3B 105% $6,942
Seattle 575,036 684,451 19% $2.9B $5.3B 83% $7,743
Washington, DC 567l136 672,228 18% $4.5B $7.2B 60% $10,710
(*)Sources: Official websites and budget data from the cities of San Francisco, Austin, New York, Philadelphia, Portland, Seattle, and Washington DC.
The picture before Citizen R would be incomplete without recognizing recent progress the SFG has achieved in several areas, including launching ambitious reforms of the SF Police Department, rejuvenating mid-Market Street, improving responsiveness to community and neighborhood needs through the Mayor’s Office of Neighborhood Services, boosting SFG capabilities through innovative projects like Civic Bridge, and the Fix-It program.11
Even with these important examples in mind, or perhaps precisely because of them, Citizen R could rightly ask why key indicators of life in San Francisco – especially in the areas of greatest public concern – are not improving despite considerable increases in public expenditures. This question looms all the more important with a new administration in Washington DC sitting on the purse strings to over $1 billion in SFG programs.12
This leads to several inter-related questions: how does the SFG define its priorities and measure progress? And how is this communicated to the citizens to enable accountability while helping the public understand the value they get from their government?
The CGJ addressed these questions with the overall objective of improving the focus, accountability and transparency of the SFG’s performance in the areas of greatest concern to the broader public.
METHODOLOGY This investigation examined how the SFG defines its priorities, measures progress, and communicates this to citizens.
In particular, the CGJ assessed (a) the Performance Scorecard (PS) framework, the primary SFG-wide platform for tracking and reporting performance to the public; (b) how the SFG measures and tracks progress in the top three areas of public concern -- homelessness, housing affordability, and crime and street safety.
$11,108 Estimated budget per capita in San Francisco (2016). Both New York City and Washington DC have lower per capita budgets.
7
ACCELERATING SF GOVERNMENT PERFORMANCE
In each section a baseline assessment defines the current situation and the SFG’s approach. This is followed by our analysis, utilizing SFG data, public opinion surveys, external reports, and the examples of other US city governments, including Austin (Texas), Portland (Oregon), Denver (Colorado), and New York City.
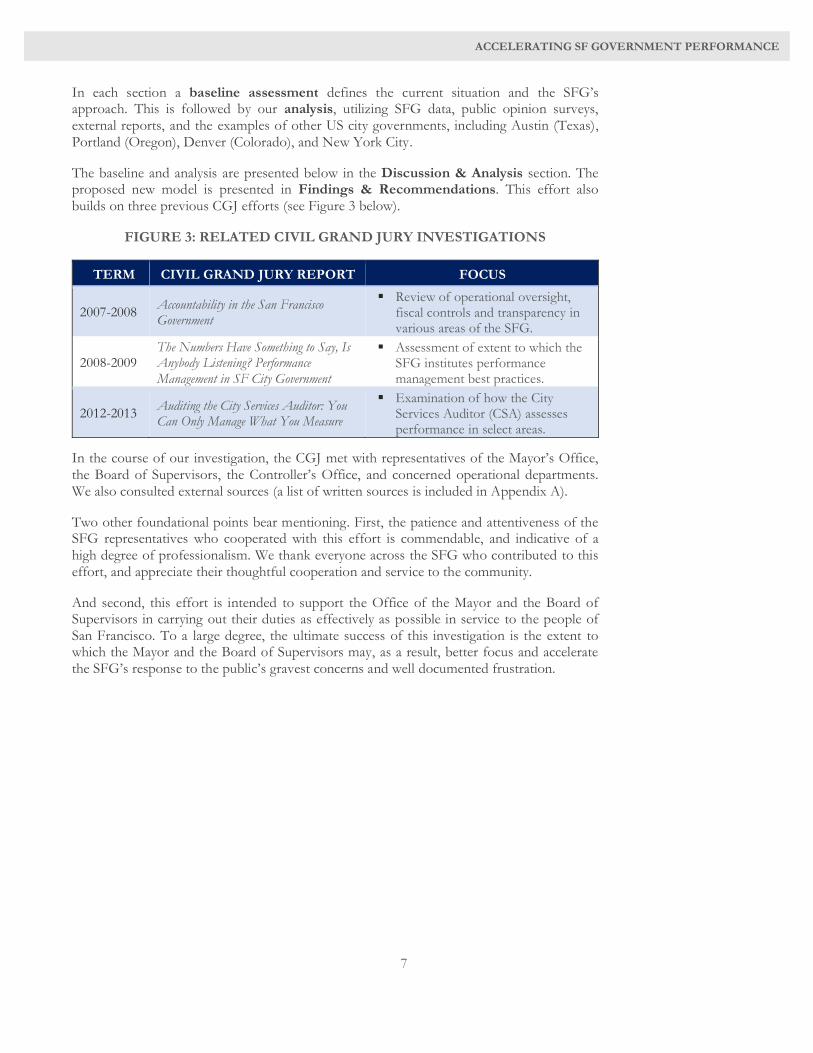
The baseline and analysis are presented below in the Discussion & Analysis section. The proposed new model is presented in Findings & Recommendations. This effort also builds on three previous CGJ efforts (see Figure 3 below).
FIGURE 3: RELATED CIVIL GRAND JURY INVESTIGATIONS
TERM CIVIL GRAND JURY REPORT FOCUS
2007-2008 Accountability in the San Francisco Government
▪ Review of operational oversight, fiscal controls and transparency in various areas of the SFG.
2008-2009 The Numbers Have Something to Say, Is Anybody Listening? Performance Management in SF City Government
▪ Assessment of extent to which the SFG institutes performance management best practices.
2012-2013 Auditing the City Services Auditor: You Can Only Manage What You Measure
▪ Examination of how the City Services Auditor (CSA) assesses performance in select areas.
In the course of our investigation, the CGJ met with representatives of the Mayor’s Office, the Board of Supervisors, the Controller’s Office, and concerned operational departments. We also consulted external sources (a list of written sources is included in Appendix A).
Two other foundational points bear mentioning. First, the patience and attentiveness of the SFG representatives who cooperated with this effort is commendable, and indicative of a high degree of professionalism. We thank everyone across the SFG who contributed to this effort, and appreciate their thoughtful cooperation and service to the community.
And second, this effort is intended to support the Office of the Mayor and the Board of Supervisors in carrying out their duties as effectively as possible in service to the people of San Francisco. To a large degree, the ultimate success of this investigation is the extent to which the Mayor and the Board of Supervisors may, as a result, better focus and accelerate the SFG’s response to the public’s gravest concerns and well documented frustration.
8
ACCELERATING SF GOVERNMENT PERFORMANCE
DISCUSSION & ANALYSIS
Contrary to the well flogged notions of some consultants and academics, focusing on systematic improvements to government performance, transparency and accountability is not especially new. To cite one example among many, the invention of double entry bookkeeping in Italy during the 15th century, as codified by Luca Pacioli in 1494 in Venice, was likely significantly more effective in advancing public accountability and stemming corruption than any “reinventing government” idea adopted over the last 30 years.13 And it was President Abraham Lincoln who summarized, in a sentence, what thousands of journal articles, hundreds of books, and dozens of TED talks would later seek to expound:
If we could first know where we are, and whither we are tending, we could then better judge what to do, and how to do it.14
Lincoln’s logic should be the basis for the Mayor and the Board of Supervisors, as the accountable representatives of the SFG, to effectively respond to the public’s needs. There is nothing overly sophisticated or conceptually obtuse about documenting the extent of a problem and which way it’s trending, what the goal should be in responding to it, and defining how to achieve that goal. And then effectively communicating this to the public. Given the SFG’s immense budgetary resources, and the imperative of responding to the public’s frustration, Citizen R would likely assume that the SFG has a well-defined framework for tracking progress on key issues that is integrated with the SFG’s planning and budgetary process and effectively communicated to the public to ensure accountability and transparency. Citizen R would be wrong.
I. REPORTING FRAMEWORK
To understand how the SFG is doing in the areas of gravest public concern, Citizen R starts with the Office of the Mayor. Citizen R suspects what the City Charter denotes, which is that the Mayor is the accountable public representative with oversight of all operational departments responsible for delivering public services.15 Within a few seconds of searching online, Citizen R locates the Mayor’s website. There Citizen R finds a section entitled “Mayor’s Priorities”, which details the Mayor’s plans in five areas (Affordable Care Act Day of Action, housing, minimum wage, police reforms, and state & federal priorities). These areas partially overlap with the public’s primary concerns, however there is no systematic reporting or tracking of progress.16 Citizen R is persistent, and proceeds to search the Mayor’s speeches, including the last three State of the City speeches, each of which require herculean focus in the midst of Facebook, Snapchat, Slack and Whatsapp interruptions. A conclusion emerges: there are many positive statements and important figures included in the Mayor’s speeches, but each speech is, understandably, distinct, with varying degrees of specificity and details on each topic. By now somewhat vexed, Citizen R continues the search. After several more online searches two immense treasure-troves of data are unearthed: DataSF and SFOpendata. The 431 data sets available on DataSF, encompassing 52 departments, make a big impression; however, pressed for time, Citizen R reluctantly concludes she’s unable to review any of them, and

9
ACCELERATING SF GOVERNMENT PERFORMANCE
turns to SFOpendata. Her brief review of the encyclopedic amount of public data conveyed through SFOpendata is as inspiring as it is daunting. By now desperate for an accessible summary of SFG performance, Citizen R does one more search on SFGov, and after a series of clicks stumbles across SF Openbook. Setting aside her rising confusion caused by the similar sounding DataSF, SFOpendata and SF Openbook, she glides by the topics of vendor payments and employee compensation, and finds the City Performance Scorecards (PS). She clicks. And at long last finds the place where the SFG reports to the public on progress – she has found where accountability begins. There is no need, however, to rely on Citizen R’s experience to understand how the PS framework – the only place where SFG progress is systematically tracked and communicated – is underappreciated. One need only roam the corridors of City Hall. During the course of this investigation the CGJ interviewed dozens of senior SFG officials, a surprising number of whom (including several with strategically situated City Hall offices) were unaware of the existence of the PS framework and associated website -- let alone the content indicating how the SFG was doing in addressing the public’s concerns.17 Other SFG officials, including several with direct operational responsibility and accountability for important public services, knew of the PS framework but noted that the PS metrics and/or goals associated with their responsibilities were not appropriate or relevant. In the words of one senior SFG representative heading a critical department: “What the scorecard is tracking doesn’t make sense…if citizens want to find out what’s going on, they need to come to our website”. Another senior official said “the indicators for my area are not helpful to the public…they should be changed.”
FIGURE 4: PERFORMANCE SCORECARD FRAMEWORK
BASELINE ASSESSMENT If the PS framework is not well known within the SFG itself, let alone among the general public, what does it consist of? And how is it managed? Per Figure 4 above, the PS framework consists of eight categories: livability, safety net, public health, public safety, environment, finance, economy and transportation. Each category features a number of
A number of senior SFG officials, including several with strategically situated City Hall offices, were unaware of the existence of the PS framework and website.

10
ACCELERATING SF GOVERNMENT PERFORMANCE
specific indicators, also known as Key Performance Indicators (KPIs), which track the status or progress of performance of a particular public service or issue. There are a total of 76 indicators across all categories, most of which also have associated goals, or targets. The safety net category has the most indicators (13), while finance has the fewest (6). Operationally, the custodian of the PS framework is the Controller’s Office, where a small team performs the admirable service of collecting and vetting data from across the SFG, and ensuring it is posted online. The data is gathered through various means, and at varying intervals depending on the source, and the Controller’s Office is responsible for reviewing and, if necessary, verifying the reported data. The PS platform represents a small slice of a much larger data gathering and performance monitoring enterprise. Over 1,000 indicators are tracked by the Controller’s Office, with current reporting including some 8,500 different KPIs for departments.18 Making sense of all of this data is a challenge even for SFG officials, let alone citizens; as the Controller said recently in the SF Chronicle, “It’s almost incomprehensible for members of the public…there’s way too much detail.”19 Based on CGJ interviews, the primary utility of the PS data today appears to be in providing a general reference for select SFG officials when preparing and shaping SFG department budget requests. However, it’s unclear how formative a role the PS framework plays in budget development, partly because each department reports on a larger number of indicators which are assessed and referenced by the Mayor’s Budget Office and the Board of Supervisors, and partly because the PS framework appears to be unknown or little appreciated in many SFG departments. It should also be noted that in 2009 the previous Mayor, in response to a related CGJ investigation, committed to quarterly performance reporting and strengthening reporting to the public. The creation of the PS framework and website, approximately two years ago, is consistent with that earlier commitment.20 ANALYSIS This investigation analyzed the PS framework across three primary dimensions, each of which is briefly summarized below:
1. The number and focus of performance indicators and goals: To begin with, 76 indicators is a large spread and arguably too ambitious – some indicators are of great importance (the property crime rate, homeless population, etc.), while others are comparatively less weighty (sales tax collections, average daily hotel rate, etc.). By way of comparison, the City of Austin’s Performance Dashboard has 21 indicators. While there is no magic number of indicators perfectly representing the most critical areas of government performance, Austin’s model is more focused and likely more accessible to Citizen R. Additionally, recent research on key performance indicators (KPIs) suggests that there should be a relatively smaller number of priority indicators, likely fewer than 30 across the entire government.21 Along with the total number of indicators, there is the range and distribution of indicators across the eight scorecards. The transportation scorecard, for example, has 11 indicators, while livability only has eight. The safety net scorecard has 14, while the economy scorecard has 11. We make no judgment about whether livability
76
Total number of performance indicators included in the Citywide Performance Scorecards.
11
ACCELERATING SF GOVERNMENT PERFORMANCE
or the economy is more important than transportation or the safety net, but having nearly twice as many indicators in one scorecard raises a question of balance and, to the extent that tracking something confers an emphasis, could send a message to Citizen R that the City has prioritized progress in one scorecard area over another. Another issue is that not all indicators have goals. Without a specific goal, it is hard for Citizen R to evaluate the SFG’s progress. The standard in other leading cities is annual goals for all key indicators. In Austin, every indicator has an annual goal, plus trend or regular reporting against the goal, with several years of past performance against prior goals included for reference. Portland also uses this logic and framework in its performance reporting. The approach of Austin and Portland allows the public to understand the trend across recent years, which is more indicative of overall progress than reporting solely against the current annual goal (i.e., what the SFG’s PS framework does today). Further, the goals which do exist today appear, in some cases, to be set by the SFG entities with operational responsibility, while other goals are set in a collaborative effort between the Controller’s Office and SFG entities, while others are the result of direct input from the Mayor’s Office. The goals of the key operational functions in the SFG are central to the Mayor’s role as the accountable executive representing the people; and the Mayor’s Office has a natural interest in ensuring all PS goals are a direct reflection of the Mayor’s public commitments and electoral mandate.
In addition, while the PS framework conveys a broad sense of how the SFG is doing, both SFG representatives and the public are likely to find comparative figures or rankings featuring other cities useful in evaluating SFG performance and service quality. To take one example, the City’s Pavement Condition Index documents the state of SF’s roads. According to this indicator, as of 2016 the SFG is already very close to hitting its target index score of 70. Yet San Franciscans know the state of many roads in the City to be well short of satisfactory, and one widely known (if methodologically imperfect) national index ranking the quality of major roads has found that San Francisco, along with Oakland, has the worst roads of any major city in the country – for the second consecutive year.22 This example suggests that more systematic use of comparative benchmarks may be helpful to better focus and balance reporting; its notable that Austin, in the city’s annual report, includes a listing of where Austin places in a range of national rankings. We also note that the biannual City Survey, which is an underappreciated source of information coordinated by the Controller’s Office to track citizen views of City services, utilized comparative city ratings in the 2011 edition (but not in 2013 or 2015), and the City Services Auditor (also in the Controller’s Office) provides ongoing benchmarking studies that are of general interest – including a recently published Citywide Benchmarking Report that is commendably comprehensive. An illustrative group of comparative rankings is presented in Appendix B for reference. One final point on the focus of PS indicators. While the existing PS framework does include several indicators tracking public services for disadvantaged groups, other cities like Portland have taken a more assertive approach towards tracking progress on social equity.23 Oakland has also established a dedicated Department of Race and Equity. Given the extreme divergence of inequality and economic opportunities within the City, there is a need for better tracking of social and gender equity issues.
12
ACCELERATING SF GOVERNMENT PERFORMANCE
To cite one example, the PS framework includes the unemployment rate indicator within the Economy scorecard. The overall unemployment rate is 2.95%; however, recent data indicates that San Francisco has the highest employment disparity between the white and the African American populations of any major US city; moreover, government budgets can be implicitly gender biased.24 Examples like this suggest that the PS framework’s focus on social equity issues can be improved.
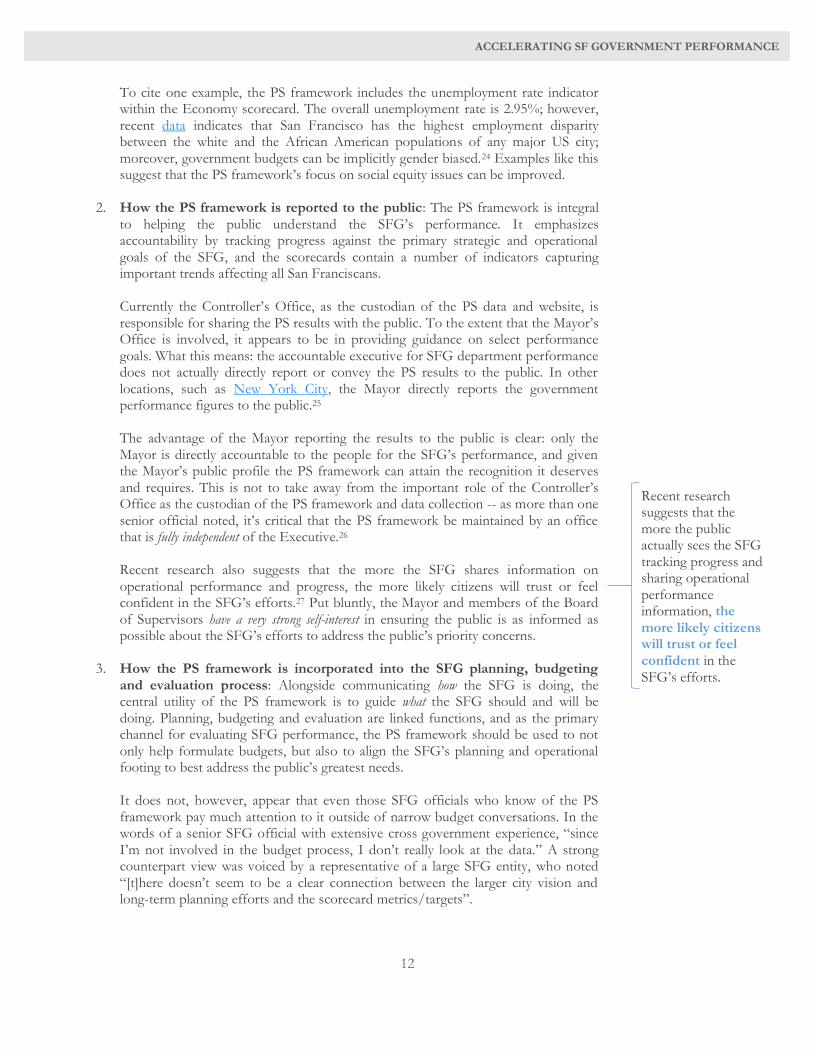
2. How the PS framework is reported to the public: The PS framework is integral to helping the public understand the SFG’s performance. It emphasizes accountability by tracking progress against the primary strategic and operational goals of the SFG, and the scorecards contain a number of indicators capturing important trends affecting all San Franciscans. Currently the Controller’s Office, as the custodian of the PS data and website, is responsible for sharing the PS results with the public. To the extent that the Mayor’s Office is involved, it appears to be in providing guidance on select performance goals. What this means: the accountable executive for SFG department performance does not actually directly report or convey the PS results to the public. In other locations, such as New York City, the Mayor directly reports the government performance figures to the public.25 The advantage of the Mayor reporting the results to the public is clear: only the Mayor is directly accountable to the people for the SFG’s performance, and given the Mayor’s public profile the PS framework can attain the recognition it deserves and requires. This is not to take away from the important role of the Controller’s Office as the custodian of the PS framework and data collection -- as more than one senior official noted, it’s critical that the PS framework be maintained by an office that is fully independent of the Executive.26 Recent research also suggests that the more the SFG shares information on operational performance and progress, the more likely citizens will trust or feel confident in the SFG’s efforts.27 Put bluntly, the Mayor and members of the Board of Supervisors have a very strong self-interest in ensuring the public is as informed as possible about the SFG’s efforts to address the public’s priority concerns.
3. How the PS framework is incorporated into the SFG planning, budgeting and evaluation process: Alongside communicating how the SFG is doing, the central utility of the PS framework is to guide what the SFG should and will be doing. Planning, budgeting and evaluation are linked functions, and as the primary channel for evaluating SFG performance, the PS framework should be used to not only help formulate budgets, but also to align the SFG’s planning and operational footing to best address the public’s greatest needs. It does not, however, appear that even those SFG officials who know of the PS framework pay much attention to it outside of narrow budget conversations. In the words of a senior SFG official with extensive cross government experience, “since I’m not involved in the budget process, I don’t really look at the data.” A strong counterpart view was voiced by a representative of a large SFG entity, who noted “[t]here doesn’t seem to be a clear connection between the larger city vision and long-term planning efforts and the scorecard metrics/targets”.
Recent research suggests that the more the public actually sees the SFG tracking progress and sharing operational performance information, the more likely citizens will trust or feel confident in the SFG’s efforts.

13
ACCELERATING SF GOVERNMENT PERFORMANCE
The suggestion is clear enough: there is a real opportunity, if not urgency, to better integrate the PS framework with SFG department strategic plans and budgets.
In concluding this brief analysis, we note that the Mayor’s Office is working on defining a set of goals, indicative of a plan or set of Mayoral priorities, for the remaining years of the current Mayoral term. Further, we understand the Office of the Controller is continuing efforts to further improve the PS framework and reporting process, and we note with appreciation plans to include reference to Performance Scorecard results in the pending Citywide budget discussions. To the extent that these efforts by the Mayor’s Office and the Controller’s Office are consistent with the analysis set forth above, there is a clear near-term opportunity to better align and structure the PS framework in a manner that more closely integrates the PS framework with the SFG’s central planning and budgeting process.
II. THE PUBLIC’S PRIORITIES
HOUSING AFFORDABILITY No issue touches so many San Franciscans with such broad equivalence as the high cost of living and, in particular, the high cost of buying or renting a home in the City. At a time when, per Figure 5 below, rents in the City are the highest in the country, when the average cost of a one-bedroom apartment is over $1 million, and when less than 1% of available homes are affordable to public school teachers, it’s understandable that citizens ranked affordability of housing (whether rental costs or home costs) the second and third highest public concerns over the last several years.28
Source: Apartment List National Rent Report
BASELINE ASSESSMENT The current PS framework, which according to the PS website is “intended to provide timely information on the efficiency and effectiveness of the SFG” to San Franciscans and policy
$0
$500
$1,000
$1,500
$2,000
$2,500
$3,000
$3,500
$4,000
$4,500
$5,000
San Francisco New York Boston Wash. DC Los Angeles Seattle
FIGURE 5: MEDIAN PRICES OF 1 & 2 BEDROOM APARTMENTS (MARCH 2017)
Median 1BR Price Median 2BR Price

14
ACCELERATING SF GOVERNMENT PERFORMANCE
makers, provides interesting factoids about home values and rents, but has no indicators gauging the direct progress of the SFG in this critical area of public concern. Specifically, the PS framework currently tracks the SFG’s progress in the affordability and housing area through two indicators included in the Economy scorecard: (1) the Zillow Home Price Index; and (2) the Zillow Rental Price Index. Both indicators are collected through publicly available information on the local housing market. Irrespective of their relevance, there are no goals for either indicator.
These indicators, while providing the public with a picture of the local housing market, do not indicate or provide insight into any SFG programs or initiatives supporting the construction of new homes/apartments. Nor do they capture the ratio of new lower or middle income housing units relative to the broader market. In short, despite housing being one of the Mayor’s declared priorities for the City, San Franciscans have no ability in the PS framework to track what or how the SFG is actually performing in this critical area. ANALYSIS It requires no great analytical leap to sense that the public’s concern for the inadequate supply of affordable housing is likely exacerbated by the feeling that the SFG is not doing enough to address the problem. Our review demonstrates that there is a fundamental disconnect between the information available and what is communicated to the public on a systematic basis. And the PS framework, which is explicitly intended to address that disconnect, provides none of the metrics required to bridge the divide. The absence of useful PS indicators tracking the SFG’s operational response to the affordability crisis is not a function of lack of SFG activity. For example, the Mayor’s Affordability Agenda includes constructing and rehabilitating 30,000 homes by 2020 and using the recent $310 million housing bond issue and the Housing Trust Fund to fund new and rehabilitate existing housing; curbing real estate speculation; and increasing housing for the middle class through use of public land and down payment assistance. As the Mayor noted in his 2017 State of the City address:
In 2012 we secured the $1.3 billion Housing Trust Fund and in 2015, a $310 million affordable housing bond to build the housing our residents need. We pledged to create 30,000 new and rehabilitated housing units, half of which would be affordable to low-income and middle-class families. And we announced an unprecedented new program to completely rehabilitate our public housing stock. Today I’m proud to say, we are on track, and 13,813 units closer to meeting our goal of 30,000,…[o]f this new housing, 42 percent is affordable to low-income and middle-class San Franciscans…11,000 low-income people will now live in new and refurbished homes…[w]e are building another 20,000 units along the Southern Bayfront, a third of which will be affordable...
The immediate question that follows: knowing that housing affordability is one of the top issues frustrating the public, why wouldn’t the SFG track and report on these impressive commitments via the PS framework? Furthermore, the Mayor’s Office of Housing and Community Services (MOHCD) Annual Progress Report provides a comprehensive summary of performance for the Mayor’s affordability agenda. In the absence of relevant PS indicators, this report is an important

15
ACCELERATING SF GOVERNMENT PERFORMANCE
resource for Citizen R; if she is resolute enough to find it online, and patient enough to sift through 68 pages, she will learn the remarkable fact that some 6,000 affordable housing units have been revitalized – as well as the overall plans, progress and goals of the Mayor’s housing programs, past accomplishments and future expectations. In short, this report and associated data are the basis for what the PS framework should be reporting. The example of other cities is instructive. Austin tracks four operational housing indicators, including the number of affordable rental units that are constructed or preserved through capital investment. Portland, through its attractively presented Dashboard, tracks the number of affordable housing units made available every year, inclusive of current and prior year annual targets. And New York City reports total housing starts and total completed. Senior SFG officials already know what needs to be done. The Office of the Mayor is reportedly studying a possible update to the housing indicators. The logic for doing so is overwhelming. As an SFG official noted: the current PS measures [for housing] “are not useful”. The same official went on to suggest three possible priority indicators:
1) Number of new housing units produced by the SFG per year; 2) Number of new lower or middle income units produced by neighborhood and
priority development area; and 3) Overall body/stock of affordable units being produced by the SFG per year relative
to overall new housing units coming online per year.
Any of these indicators are much more informative to Citizen R than the existing PS indicators. And it’s vital that the City communicate more effectively – in the words of Supervisor Jane Kim commenting on the challenge of affordability: “the crisis is now.”29 In short, there is both emerging consensus within City Hall and strong rationale for the need to improve how the SFG measures and communicates progress on housing issues to the public.
HOMELESSNESS
Across the last four years, citizens rated homelessness as the single most pressing issue facing the City. In fact, homelessness has been a public concern for at least 35 years, spanning five mayors, from then Mayor Dianne Feinstein in the 1980s up through today. Each Mayor pledged to tackle the problem. Billions of tax payer dollars have been spent. Dozens of new programs have been tried. Yet by the SFG’s own metrics, the problem, far from improving, has continued and, in certain respects, worsened. Per Figure 6 below, on a per capita basis the City has the 5th highest homeless population in the country. BASELINE ASSESSMENT Today the Government tracks and reports on progress on homelessness issues through three main indicators included in the SFG’s City Performance Scorecard. The indicators, a brief description and associated targets are included in Figure 7 below. For these three indicators, two targets, or goals, have been established: 1,540 direct homeless exits per year (this target was reportedly set ten years ago); and 200/month for the family shelter waiting list (this target was reportedly set seven years ago). There are no targets for the total homelessness count.
6,686 Total number of homeless individuals in the most recent annual survey (2016).

16
ACCELERATING SF GOVERNMENT PERFORMANCE
Source: US Conference of Mayors
ANALYSIS Any assessment of the SFG’s approach to measuring progress on homelessness begins with two important qualifications:
1. Measuring or tracking homelessness is not a straightforward exercise; no single indicator encapsulates the issue, and because of the SFG’s fragmented data systems, tracking even the topline number of homelessness in San Francisco is difficult.
2. Homelessness in San Francisco, as in any other city or county in California, is partly a function of regional dynamics -- including economic, social, demographic and even climatological trends – that are beyond the policy and institutional purview of the Mayor, the Board of Supervisors, and SFG departments.
Acknowledging the complexity of measuring homelessness and the broader factors at play in no way diminishes the responsibility of the SFG to effectively track and report on progress to the public. This is especially true given that the SFG is spending close to $250M a year on homelessness issues, involving no less than eight departments.30 Precisely because of this complexity and commitment the SFG, and the Mayor in particular, must make every effort to communicate progress to the public in a transparent and trust-building manner.
FIGURE 7: HOMELESSNESS INDICATORS
INDICATORS DESCRIPTION TARGETS
Homelessness population ▪ number of homeless people, as determined
by an annual survey None
Direct homeless exits ▪ number of people who are no longer
homeless as a result of city programs 1,540
Family shelter waiting list ▪ number of homeless families waiting to be
admitted to the family shelter 200/month
Our analysis focuses on two dimensions: (1) do the existing indicators and goals likely satisfy the standard of Citizen R in wanting to know how the SFG is performing? And (2) can San
0 20 40 60 80 100 120 140
National Ave.
Honolulu, HI
Gresham, OR
Portland, OR
Los Angeles
San Francisco
New York, NY
Atlanta, GA
Portland, ME
Wash. DC
FIGURE 6: PER CAPITA HOMELESSNESSIN US CITIES (2016)
Rate of Homelessless per 10,000 People

17
ACCELERATING SF GOVERNMENT PERFORMANCE
Francisco learn from the approach or indicators used by other leading cities in the US?
Of the three existing indicators, Citizen R is likely to be most interested in the overall homelessness count. This is an important, if imperfect, indicator. And the fact that the SFG does not have a specific associated goal may be surprising – how, she might wonder, can the SFG be held to account on homelessness if there is no goal for the primary indicator? The indicator of direct homeless exits is a clear gauge of how effective the SFG’s related support services are. This is an important indicator, and having an associated goal encourages accountability. However, why the SFG’s associated goal has been fixed for a decade, despite a much larger SFG budget, is unclear – and likely curious to Citizen R. The other indicator – family shelter waiting – is important, but does not necessarily seem more significant than other possible indicators; including, for example, the average length of time of homelessness by individual. A comparison with the city of Portland (Oregon) reinforces the opportunity for SFG to improve reporting and accountability on this key topic. Portland, which also features a year-round livable climate and similar demographics, has three primary homelessness indicators, with annual targets for each (see chart below).
FIGURE 8: PORTLAND HOMELESSNESS INDICATORS
INDICATORS 2016 ’17 TARGET
Number of homeless individuals placed in permanent housing 4,049 4,324
Retention rate of households placed in housing at 12 months 74% 85%
Number of individuals prevented from becoming homeless 3,922 4,900
Source: City of Portland website.
Compared with San Francisco, Portland’s indicators are of more general interest and relevance. And having annual targets for each indicator promotes accountability while communicating a vision to the public of what should happen in the next 12 months. The recently established Department of Homelessness and Supportive Housing (DHSH) is leading the effort to improve data collection and tracking of associated issues. Once DHSH’s information and case management system comes online in the next 12-18 months, and consistent with the strategic plan and related metrics that DHSH will also share with the public, the ability to track and report on progress should be substantially improved.
CRIME & STREET SAFETY Alongside homelessness and affordability, San Franciscans rank crime and street safety among the top three issues. As with homelessness, regional/national trends impact the local environment. However, as the Civil Grand Jury has previously examined, the rise of non-violent criminality is at least partly a result of SFG’s policies and programming.31 BASELINE ASSESSMENT At the Citywide level, as reflected in the PS framework, the SFG currently tracks and reports on three dimensions of crime and public safety: (1) violent crime rate; (2) property crime
The fact that the SFG does not have a specific goal for the topline homelessness number is surprising – how can the SFG be held to account for spending $250M per year if there is no goal?

18
ACCELERATING SF GOVERNMENT PERFORMANCE
rate; and (3) 911 call volume. The indicators are listed below in Figure 9.
FIGURE 9: CRIME & SAFETY INDICATORS
CRIME & PUBLIC SAFETY INDICATORS
DESCRIPTION TARGETS
Property crime ▪ Number of burglaries, larceny, motor
vehicle thefts and arson, per 100,000 residents
None
Violent crime ▪ Number of homicides, rape, robbery
and aggravated assault, per 100,000 residents
None
911 call volume ▪ Average number of calls receive daily None
Neither the property crime nor violent crime indicators have specific targets, though there are associated projections. Notably, both crime rates have been increasing – with property crimes especially elevated (see Figure 10 below). In many neighborhoods there is a chronically high rate of car theft, with a reported 153% increase in car theft crimes between 2010 and 2016. While some reports suggest property crime in certain districts is leveling off, the issue remains acute and visible throughout the City.
The 911 call volume indicator, which also lacks a clear target, reveals that, corresponding with the rise in property crime, call levels have been increasing in recent years. The SFG, assisted by private sector expertise, has recently studied the reasons for this rise.32 ANALYSIS Ensuring public safety is fundamental to the SFG’s mission. And in the last several years the Police Department has experienced significant scrutiny, particularly on use of force issues. A new police chief, William Scott, was selected by Mayor Ed Lee and appointed on January 23, 2017, with a mandate to further improve public confidence in the City’s police force. The two broad indicators of property crime and violent crime capture general trends, and are used in other cities such as Austin. However, no targets are currently set – unlike in Austin, which features annual targets and regular reporting on progress against those targets. Moreover, it’s likely curious to Citizen R that the property crime rate, which according to FBI data is among the worst in the country among large cities, is currently classed as yellow, or cautionary. At what point, Citizen R might ask, does the problem merit a red rating? As for the other indicator, 911 call volume, this is an indicator of general interest to the public; however, this tells comparatively little about the SFG’s focus or responsiveness – the actual average response time is a more meaningful measure. And as Supervisor Aaron Peskin has noted, the SFG’s performance in this area has been “unacceptable”.33
Other cities have adopted indicators and associated goals that incorporate a broader spectrum of public safety priorities. These include:
▪ Measuring specific crimes: adopting indicators for residential burglary and motor vehicle thefts, as well as associated annual targets (Seattle).
▪ Measuring police recruiting diversity: adopting indicators documenting the percentage of new sworn police hires that are female or minorities (Portland).
153%
Increase of theft from vehicles in San Francisco between 2010 and 2016.

19
ACCELERATING SF GOVERNMENT PERFORMANCE
Source: FBI crime data (2015).
In view of the number of neighborhoods that have been plagued by property crimes, adopting a specific property crime indicator, like Seattle has done, is a reasonable consideration. With respect to police recruitment, even senior Police representatives indicated there should be greater emphasis on diversity in recruiting and hiring – though whether or not to include this in the PS framework is an open question. One final point -- cities such as Portland have also adopted a citywide dashboard indicator that tracks whether citizens feel secure in their neighborhoods. Specifically, Portland tracks the percentage of residents who feel safe walking alone in their neighborhoods at night (2017 target: 60%). Austin also uses this indicator. The City Survey poll coordinated by the Controller’s Office includes a similar measure, but the PS framework does not.
0
0.01
0.02
0.03
0.04
0.05
0.06
0.07
FIGURE 10: HIGHEST PROPERTY CRIME RATEPER CAPITA IN MAJOR US CITIES (2015)

20
ACCELERATING SF GOVERNMENT PERFORMANCE
FINDINGS & RECOMMENDATIONS San Francisco has set a national standard for recognizing the fundamental rights of all citizens. There is an equally historic opportunity to define a new standard for the transparency and accountability of government. This opportunity has real urgency: many San Franciscans are deeply frustrated, and the wider national mood is unsettled – with the public less trusting of government than at any time in recent history.34 Responding to this context, and noting Mayor Lee’s35 and Board of Supervisors President London Breed’s36 personal commitment to government accountability, as well as the City Charter’s emphasis on ensuring a responsive and accountable government,37 this section details the Civil Grand Jury’s findings and associated recommendations.
The recommendations are intended to support both the Mayor and Board of Supervisors in further improving (1) San Francisco’s Government (SFG) focus on the issues most important to the public; and (2) communicating to the public how the SFG is doing. Collectively the recommendations represent a non-partisan blueprint to systematically enhance the SFG’s accountability, transparency and responsiveness to a level commensurate with the public’s expectation and the example of other leading cities.
Recommendations are grouped in two categories:
▪ Recommendations ensuring the SFG achieves parity in accountability and transparency with other leading US cities (P); and
▪ Recommendations enabling the SFG to set a new national standard for responsive, accountable and transparent government (N).
A breakdown of findings and recommendations aligned with specific SFG authorities is presented in the Request for Responses section below.
At a general level, because the performance scorecard (PS) framework is the only cross SFG mechanism for reporting to the public, our analysis leads to the overarching conclusion that the SFG’s operational focus, in terms of tracking and measuring progress on the public’s gravest concerns, can be improved. It is similarly clear that the SFG can substantially improve communicating what and how it is doing. All specific findings follow from these general points.
FINDING 1: The broader public is barely aware of the PS framework, diminishing its utility and hampering the SFG’s ability to communicate progress to San Franciscans.
❖ RECOMMENDATION 1: In order to ensure broader public access to the PS platform, and consistent with the practice of other leading cities, a clear link to the PS website should be placed on the SFG website homepage, the Office of the Mayor’s homepage and the Board of Supervisor’s homepage by January 1, 2018 (P).
FINDING 2: Despite the Mayor’s role as the accountable executive of the SFG, the Mayor does not directly report performance results to the public, as is done in other leading cities.
❖ RECOMMENDATION 2.1: Consistent with other leading cities such as New York, beginning in 2018 the Mayor should present an annual SFG Performance report that
21
ACCELERATING SF GOVERNMENT PERFORMANCE
concisely communicates SFG performance and progress to the public; the public transmission of which should consist of:
i. Hosting a public press conference, the first of which would occur not later than January 31, 2019, announcing the SFG’s annual performance (P).
ii. Posting the SFG Performance report on the Office of the Mayor’s website homepage (P).
iii. Submitting the SFG Performance report to the Board of Supervisors for comment (P).
iv. Within 30 days of the Board of Supervisors response, the Controller’s Office should update the PS website to reflect annual SFG performance, with comments from the Board of Supervisors and responses from the Office of the Mayor included online for the public’s reference (P).
❖ RECOMMENDATION 2.2: Commencing in 2018, the Controller’s Office should prepare quarterly updates of the PS framework, inclusive of:
i. Submission of the quarterly update to the Board of Supervisor’s Government Audit and Oversight Committee (GAO) and the Office of the Mayor, inviting comment (N).
ii. Posting a quarterly update on the PS website homepage, with comments from the Board of Supervisors and Mayor’s Office included for public reference (N).
FINDING 3: The PS framework encompasses too many indicators – some of the indicators are of great importance, whereas others are much less significant.
❖ RECOMMENDATION 3.1: In consultation with other SFG entities and community groups, the Controller’s Office should propose a narrowed set of PS indicators, likely not exceeding 30 total, by October 1, 2017; the Board of Supervisor’s GAO Committee should be invited to comment on the revised indicators prior to submission to the Office of the Mayor for review and approval (P).
❖ RECOMMENDATION 3.2: In consultation with other SFG entities and community groups, the Controller’s Office should evaluate, no later than July 1, 2018, the feasibility of including district level reporting for some or all indicators and posting this information within the online PS platform, enabling citizens to understand progress in their own neighborhoods (N).
FINDING 4: Having performance indicators without associated goals goes against practice in other leading cities, and limits the public’s ability to understand the SFG’s progress.
❖ RECOMMENDATION 4.1: The Mayor’s Office should ensure that by January 1, 2018 every PS indicator has a linked goal, with all goals approved by the Mayor – these goals comprise the SFG’s overarching annual operational plan (P).
❖ RECOMMENDATION 4.2: The Controller’s Office should ensure that by January 1, 2018 the PS framework includes comparative performance figures against prior year goals alongside current year goals, so citizens can see the trend of progress (P).
FINDING 5: Citizens have almost no means by which to regularly and systematically assess the SFG’s performance relative to other leading cities; in contrast, other leading cities provide this information to their citizens.
22
ACCELERATING SF GOVERNMENT PERFORMANCE
❖ RECOMMENDATION 5: The Controller’s Office should identify the top 3-5 rankings/indices relevant to each scorecard, and add these to the PS framework by January 1, 2018 (N).
FINDING 6: The PS framework is not formally integrated into the SFG’s planning process other than occasional budget discussions, whereas its true value is the extent to which SFG planning and budgeting is directly linked to achieving the goals within the PS framework.
❖ RECOMMENDATION 6: Beginning in fiscal year 2018 the revised PS framework should be formally incorporated into the SFG department strategic planning and budgeting process – in particular, the Office of the Mayor should require each department to:
i. Specify within their departmental strategic plans which initiatives directly support the SFG’s PS goals most relevant to their operational mandate, and what improvement they project in achieving that goal (N).
ii. Specify within their departmental budget submission how their budget request is directly supportive of improved SFG performance against the PS goals most relevant to their operational mandate (N).
FINDING 7: The specific indicators used within the SFG’s PS framework to track performance in the areas of the gravest public concern should be updated to better reflect what the SFG is doing to address the public’s gravest concerns.
❖ RECOMMENDATION 7.1: The Controller’s Office should update, by January 1, 2018, the current housing affordability indicators based on recommendations from the Director of the Mayor’s Office of Housing and Community Development, and submit the revisions to the Mayor’s Office for review and approval (P).
❖ RECOMMENDATION 7.2: The Controller’s Office should update, by January 1, 2018, the current homelessness indicators based on recommendations from the DHSH Director and the examples of other leading cities, and submit the revised indicators to the Office of the Mayor for review and approval (P).
❖ RECOMMENDATION 7.3: The Controller’s Office should update, by January 1, 2018, the current crime and street safety indicators based on recommendations from the Chief of Police and the examples of other leading cities, and submit the revised indicators to the Office of the Mayor for review and approval (P).
❖ RECOMMENDATION 7.4: Consistent with Recommendation P4 above, the Office of the Mayor should ensure that, by January 1, 2018, each of the primary housing, homelessness and crime indicators have associated goals (P).
FINDING 8: Noting the severe economic inequality within and between various neighborhoods and communities in the City, and consistent with the City’s long-standing reputation for socially inclusive policies, the PS framework should more directly gauge SFG progress in addressing social, gender and racial equity.
❖ RECOMMENDATION 8: In consultation with other SFG entities and community organizations, the Controller’s Office should ensure that, by January 1, 2018, one or more PS indicators are amended or added to ensure the SFG is tracking and reporting on the equitable distribution of government spending and services (N).

23
ACCELERATING SF GOVERNMENT PERFORMANCE
REQUEST FOR RESPONSES
FINDING 1 The broader public is barely aware of the performance scorecard (PS) framework, diminishing its utility and hampering the ability of San Francisco’s Government (SFG) to communicate progress to San Franciscans.
RESPONDER
RECOMMENDATION 1 In order to ensure broader public access to the PS platform, and consistent with the practice of other leading cities, a clear link to the PS website should be placed on the SFG website homepage, the Office of the Mayor’s homepage and the Board of Supervisor’s homepage by January 1, 2018.
Office of the Mayor Board of Supervisors
FINDING 2 Despite the Mayor’s role as the accountable executive of the SFG, the Mayor does not directly report performance results to the public, as is done in other leading cities.
RESPONDER
RECOMMENDATION 2.1 Consistent with other leading cities, beginning in 2018 the Mayor should present an annual SFG Performance report that concisely communicates SFG performance and progress to the public; the public transmission of which should consist of:
i. Hosting a public press conference, the first of which would occur not later than January 31, 2019, announcing the SFG’s annual performance.
ii. Posting the SFG Performance report, not later than January 31, 2019, on the Office of the Mayor’s website homepage.
iii. Submitting the SFG Performance report to the Board of Supervisors for comment.
iv. Within 30 days of the Board of Supervisors response, the Controller’s Office should update the PS website to reflect annual SFG performance, with comments from the Board of Supervisors and responses from the Office of the Mayor included online for the public’s reference.
Office of the Mayor Board of Supervisors
Office of the Controller
RECOMMENDATION 2.2 Commencing in 2018, the Controller’s Office should prepare quarterly updates of the PS framework, inclusive of:
i. Submission of the quarterly update to the Board of Supervisor’s GAO Committee and the Office of the Mayor, inviting comment.
ii. Posting the quarterly update on the PS website homepage, with comments from the Board of Supervisors and Office of the Mayor included for public reference.
Office of the Controller
Board of Supervisors Office of the Mayor
FINDING 3 The PS framework encompasses too many indicators – some of the indicators are of great importance, whereas others are much less significant.
RESPONDER
RECOMMENDATION 3.1 In consultation with other SFG entities and community groups, the Office of the Controller should propose a narrowed set of PS indicators, likely not exceeding 30 total, by October 1, 2017; the Board of Supervisor’s GAO Committee should be invited to comment on the revised indicators prior to submission to the Office of the Mayor for review and approval.
Office of the Controller
Office of the Mayor Board of Supervisors

24
ACCELERATING SF GOVERNMENT PERFORMANCE
RECOMMENDATION 3.2 In consultation with other SFG entities and community groups, the Controller’s Office should evaluate, no later than July 1, 2018, the feasibility of including district level reporting on some or all indicators and posting this information within the online PS platform, enabling citizens to understand progress in their neighborhoods.
Office of the Controller
FINDING 4 Having performance indicators without associated goals goes against practice in other leading cities, and limits the public’s ability to understand how the SFG is progressing.
RESPONDER
RECOMMENDATION 4.1 The Mayor’s Office should ensure that by January 1, 2018 every PS indicator has a linked goal, with all goals approved by the Mayor – these goals comprise the SFG’s overarching annual operational plan.
Office of the Mayor Board of Supervisors
RECOMMENDATION 4.2 The Controller’s Office should ensure that by January 1, 2018 the PS framework includes comparative performance figures against prior year goals alongside the current year goal and progress, so citizens can understand the trend of SFG progress.
Office of the Controller
FINDING 5 Citizens have almost no means by which to regularly and systematically assess the SFG’s performance relative to other leading cities; in contrast, other leading cities provide this information to their citizens.
RESPONDER
RECOMMENDATION 5 The Controller’s Office should identify the top 3-5 rankings/indices relevant to each scorecard, and add these to the PS framework by January 1, 2018.
Office of the Controller
FINDING 6 The PS framework is not formally integrated into the SFG’s planning process other than occasional budget discussions, whereas its true value is the extent to which SFG planning and budgeting is directly linked to the PS framework.
RESPONDER
RECOMMENDATION 6 Beginning in fiscal year 2018, the revised PS framework should be formally incorporated into the SFG department strategic planning and budgeting process – in particular, the Office of the Mayor should require each department to:
i. Specify within their departmental strategic plans which initiatives directly support the SFG’s PS goals most relevant to their operational mandate, and what improvement they project in achieving that goal.
ii. Specify within their departmental budget submission how their budget request is directly supportive of improved SFG performance against the PS goals most relevant to their operational mandate.
Office of the Mayor Board of Supervisors

25
ACCELERATING SF GOVERNMENT PERFORMANCE
FINDING 7 The specific indicators used within the SFG’s PS framework to track performance in the areas of the gravest public concern should be updated to better reflect what the SFG is doing to address the public’s gravest concerns.
RESPONDER
RECOMMENDATION 7.1 The Controller’s Office should update, by January 1, 2018, the current housing affordability indicators based on recommendations from the Director of the Mayor’s Office of Housing and Community Development, and submit the revisions to the Office of the Mayor for review and approval.
Office of the
Controller Office of the Mayor
RECOMMENDATION 7.2 The Controller’s Office should update, by January 1, 2018, the current homelessness indicators based on recommendations from the DHSH Director and the examples of other leading cities, and submit the revised indicators to the Office of the Mayor for review and approval.
Office of the Controller
Office of the Mayor
RECOMMENDATION 7.3 The Controller’s Office should update, by January 1, 2018, the current crime/street safety indicators based on recommendations from the Chief of Police and the examples of other leading cities, and submit the revised indicators to the Office of the Mayor for review and approval.
Office of the Controller
Office of the Mayor
RECOMMENDATION 7.4 Consistent with Recommendation P4, the Office of the Mayor should ensure that, by January 1, 2018, each of the primary housing affordability, homelessness and crime indicators have associated goals.
Office of the Mayor
FINDING 8 Noting the severe economic inequality within and between various neighborhoods and communities in the City, and consistent with the City’s long-standing reputation for socially inclusive policies, the PS framework should more directly gauge SFG progress in addressing social, gender and racial equity.
RESPONDER
RECOMMENDATION 8 In consultation with other SFG entities and community organizations, the Controller’s Office should ensure that, by January 1, 2018, one or more PS indicators are amended or added to ensure the SFG is tracking and reporting on the equitable distribution of government spending and services.
Office of the Controller Board of Supervisors

26
ACCELERATING SF GOVERNMENT PERFORMANCE
ENDNOTES
1. Dignity Health Citybeat 2017 poll. The 2016 poll reported that over 50% of San Franciscans believed the City was headed in the wrong direction; interestingly, the SFG’s most recent City Survey (2015), which attempts to measure public satisfaction with SFG services, recorded the highest favorability ratings in recent history. The divergent findings could either suggest that the public’s general frustration is not a reflection of how the public perceives SFG services – or that the methodology used in one (or both) polls are fundamentally different.
2. State of California Employment Development Department data.
3. Among other examples, this article notes that “if you live in the San Francisco Bay Area in the early 21st century, it’s hard not to feel a special connection to Renaissance Florence.”
4. The percentage of children in San Francisco is 13%; New York City, which is the second most expensive city in the US, has a 21% rate. See Housing for Families with Children, San Francisco Planning Department (1/17/2017). As Board of Supervisors member Norman Yee has said: “Everybody talks about children as our future…[but]if you have no children around, what’s our future?” As reported in The New York Times, (1/21/2017).
5. FBI data referenced in “San Francisco Torn as Some See ‘Street Behavior’ Worsen”, The New York Times (4/24/2016). See also “Blame game: SF officials continue to point fingers over rise in property crimes” SF Examiner (5/27/2016).
6. Bumpy Roads Ahead: America’s Roughest Rides and Strategies to Make our Roads Smoother (TRIP; November 2016). San Francisco, which was grouped with Oakland, received a rating of 71% of major roads being classed as poor condition, which is 11% higher than the 2nd worst city (Los Angeles). While the methodology of the TRIP study is fundamentally different from the way the SFG measures pavement quality, and grouping San Francisco with Oakland is not necessarily fair, the study is still suggestive of the work the SFG needs to do to improve the City’s roads.
7. See, for example, the Controller’s Office recent benchmarking documenting that the City’s bus service average speed of 8.1 MPH is the slowest among peer cities; regarding BART, see “BART hits record low in survey of its riders”, SF Chronicle (1/26/2017); MUNI has yet to hit the mandated goal of 85% on time or early arrivals.
8. See, for example, “Complaints of syringes and feces rise dramatically in SF”, SF Chronicle (11/2/2016). The Public Works Department, as reported by the SF Chronicle (4/21/2017), has corroborated the dramatic increase of syringes on the City’s streets, with a reported 16,318 syringes collected in January 2017, up from 2,118 collected in January 2016 – a 670% increase in 12 months.
9. To put the hollowing out of the City’s Public School system in perspective, there are around 37,000 fewer public school students today than in 1970. In other words, during a period in which the City’s overall population increased by approximately 21%, the total number of children attending SF public schools decreased by over 41%. As reported in “San Francisco Asks: Where Have All the Children Gone?”, The New York Times, (1/21/2017).
10. That San Francisco appears to have the highest per capita government expenditures of any major US city raises
fundamental questions about the efficiency and cost-effectiveness of the County and City’s Government. While this topic is outside the purview of this investigation, the Board of Supervisors, the Mayor’s Office, the Controller’s Office, and/or the Civil Grand Jury should strongly consider further analysis on this topic.
11. Civic Bridge, an initiative organized by the Mayor’s Office of Civic Innovation, places private sector experts who volunteer 16 weeks of their time to help government entities on specific challenges. The Fit-It program was

27
ACCELERATING SF GOVERNMENT PERFORMANCE
established by Mayor Lee in 2016, for the purpose of improving SFG responsiveness to community needs; as reported in the SF Chronicle (3/22/2017), the program is slated to expand in 2017 with the addition of three full-time employees alongside the 40 staff seconded from other SFG departments – while Fix-It is laudable in concept, per Note 10 above, Citizen R would likely ask why the SFG, which appears to receive the highest per capita budget of any major US city, needs a coordinating body to ensure that public services address neighborhood needs in a timely manner.
12. The recent lawsuit initiated by the San Francisco City Attorney Dennis Herrera in Federal Court to halt enforcement of President Trump’s executive order denying federal funding to “sanctuary jurisdictions” notes that of “the $1.2 billion in federal funds that San Francisco receives for its annual operating budget, 92 percent goes to entitlement programs like Medicare, Medicaid, Temporary Assistance to Needy Families, and Supplemental Nutrition Assistance Programs.” In other words, approximately 10% of the County and City’s budget is from the federal government.
13. Luca de Pacioli is known as the “Father of accounting and bookkeeping.” His treatise Summa de Arithmetica, geometria. Proportioni et proportionalita, released in 1494, contains the first published description of the double-entry accounting system. The “reinventing government” movement started in the US in the 1990s, and was championed by then Vice President Al Gore. Despite efforts in Washington and various states to implement “reinventing” concepts like performance-based budgeting, public trust in government is now at historic lows, and progress on a range of important public issues has stalled. According to one view, reflected in “25 Years Later, What Happened to Reinventing Government”, Governing magazine (9/2016), the reason for the lack of greater success is a combination of over-emphasis on budgeting or technical issues and poor political leadership. Equally plausible, however, is that the “reinventing” movement fizzled because even the most celebrated initiatives were largely superficial – as the management expert Peter Drucker pointed out in The Atlantic, Vice President Gore’s promise to reinvent the US Government represented budget savings and efficiencies equivalent to two tenths of one percent of the federal budget, leading to “trivial” results.
14. Speech in Springfield, Illinois, June 16, 1858. This is the so-called “House Divided Speech”, which Lincoln gave
before 1,000 delegates at the Illinois Republican Convention, shortly after he was nominated as the Republican candidate for US Senator.
15. San Francisco City Charter, Article III, Section 3.100 states: “The Mayor shall be the chief executive officer and
the official representative of the City and County.” The same section later notes the Mayor has responsibility for “[g]eneral administration and oversight of all departments and governmental units in the executive branch of the City and County.”
16. During the course of this investigation, the Civil Grand Jury was informed that the Office of the Mayor’s website
was likely going to be upgraded to improve its accessibility and organization. At the time of publishing this report, the exact scope and timing of this upgrade were unclear.
17. Another way to measure the extent of public awareness of SFG performance lies within the PS website itself;
specifically, every scorecard indicator website has a visitor tracking ticker. For example, as of March 1, 2016, the property crime indicator recorded 1,020 page views. Generously assuming that all 1,020 views were discrete visitors, and all were San Franciscans, this means that 0.12% of the City’s population is aware of this indicator. Other indicators have even lower page views.
18. Likely as a result of the ambitious level of data collection and processing the Controller’s Office handles, San
Francisco has been recognized by the International City/Country Management Association’s Center for
Performance Analytics, earning a Certificate of Excellence in 2011, 2013, 2015 and 2016. To earn this certificate municipalities apply and pay a notional fee. In 2016 a total of 33 other cities earned the same certificate, including Kansas City, New Orleans, San Antonio and San Jose.

28
ACCELERATING SF GOVERNMENT PERFORMANCE
19. As quoted in “SF falling short on many goals, controller finds”, SF Chronicle (9/3/2016). 20. 2008-2009 Status of Civil Grand Jury Recommendations, Office of the Controller (2014 update). 21. See, for example, How to Create Government KPIs, Freebalance (2/18/2017). A more scholarly reference is Michael
Barber’s How to Run a Government (Penguin Random House, 2015); see, for example, pages 10-13, in which he advocates keeping the number of priority targets to a “small number”.
22. Bumpy Roads Ahead: America’s Roughest Rides and Strategies to Make our Roads Smoother (TRIP; November 2016).
Whereas the current pavement indicator and associated goal are, based on comparative national indices, potentially inconclusive or insufficient, the performance of the SFG in the area of sustainability is arguably under reported by the current PS Environment indicators; as the comparative benchmarks in the appendix suggest, the City is a strong performer in related areas. While the topic of improved sustainability reporting is outside the scope of this analysis, Austin’s sustainability dashboard is a useful reference point -- and the SFG should consider adopting a similar approach to further improve how the City tracks and reports progress on this critical topic. For additional references on the City’s green credentials and performance see the Green City Index (which rates SF as the top North American city) and the 2016 United Nations World Cities Report.
23. See, for example, “In Portland, One Plan Tackles Climate Change and Racial Discrimination”, Governing Magazine
(March 2017). 24. On the disparity of unemployment between the City’s white and African-American populations, see Employment by
race and place: snapshots of America, Brookings Institution (2/27/2017). On implicit gender bias in government budgets, see for example, Gender Budgeting: Fiscal Context and Current Outcomes (IMF Working Paper, 2016) and The Impact of Women on the 2016 Budget (House of Commons Library, 2016). Both sources are referenced in “The Fiscal Mystique,” The Economist (2/25/2017).
25. The City Charter of New York was amended in 1977 to require, per Section 12, the Mayor to submit two mayoral
management reports (MMR) a year to the public and the City Council. While each Mayor has chosen somewhat different approaches to the MMR, in general New York’s example compares favorably with other US cities given its scope and level of detail. The most recent MMR, filed by Mayor De Blasio, covers all city departments and is 349 pages.
26. Per Section 3.105 of the City Charter, the Mayor appoints the Controller to a 10-year term and may only be
removed for cause with the concurrence of the Board of Supervisors by a two-thirds vote. This arrangement provides, in theory, for the Controller’s full organizational independence. However two senior SFG representatives interviewed for this analysis indicated that historically there have been times when the Controller’s Office has been perceived as being overly close to the Office of the Mayor. This topic, while important, lies outside the scope of this investigation.
27. See, for example, Surfacing the Submerged State: Operational Transparency Increases Trust in and Engagement with
Government, Harvard Business School Working Paper 14-034 (2013). 28. According to a recent analysis conducted by Mother Jones magazine, in 2016 a total of 14 of the 2,244 houses for
sale – or 0.62% -- in San Francisco were affordable to a public school teacher earning a salary of $71,000. Trulia has also recently documented that only 0.4% of homes on the market in San Francisco are affordable to a typical teacher. The SFG’s performance in addressing housing needs for public school teachers has been remarkably poor: as reported in the SF Chronicle (3/24/2017), the SFG pledged to build teacher-specific housing in the late 1990s, but the plan was later derailed by the Board of Supervisors. More recently, in 2015 Mayor Lee and SF United School District Superintendent Richard Carranza committed to helping 500 teachers (equivalent to 15% of

29
ACCELERATING SF GOVERNMENT PERFORMANCE
the total number of teachers) find housing within five years. Some two years after this public commitment, a total of 16 teachers have been placed in affordable housing. As Board of Supervisor member Hillary Ronen noted “[i]t’s mind boggling…we have lost our way as a city.” The SFG’s lack of progress is all the more troubling given that the affordability crisis has become even more acute in recent years: as noted in The Economist (2/25/2017), over the last five years house prices in San Francisco have risen 66% more than in New York City.
29. Supervisor Kim’s remarks were quoted in the SF Chronicle (3/21/2017). She also noted “[w]hen are we going to
start implementing some of the concepts?” It’s a great question, and the people of San Francisco are still waiting for an answer.
30. See, for example, “SF spends a record $241 million on homeless, can’t track results”, SF Chronicle (2/5/2016).
When overall social spending and indirect benefits/costing are factored in, it’s likely that the SFG is spending over $300M a year on homeless issues.
31. Auto Burglary in San Francisco, 2015-2016 Civil Grand Jury (June 2016). 32. San Francisco’s 9-1-1 Call Volume Increase, Findings Paper by the Google 9-1-1 Team (10/2015). This analysis was
undertaken in cooperation with the Department of Emergency Management and the Mayor’s Office of Civic Innovation. The findings of this analysis include the suggestion that increases in 9-1-1 calls are due, in part, to a rise in accidental dialing combined with a modest rise in calls associated with homeless persons, auto break-ins and suspicious persons.
33. Supervisor Peskin noted in reference to the SFG’s poor 911 response times: “I don’t know what is worse, the
unacceptable time it takes 911 to respond to emergency calls or the unacceptable amount of time it has taken the city to address this serious safety problem” -- as quoted in the SF Chronicle (1/8/2017). The SF Chronicle (4/28/2017) has also documented that the SFG currently has only 105 911 dispatchers instead of 180, despite the City increasing budgetary support from $43M to $83M across the last six years.
34. See, for example, “Americans are losing faith in democracy – and in each other,” The Washington Post
(10/14/2016), which highlights polls documenting, inter alia, that 40% of the citizenry have lost faith in American democracy, and that confidence in various public institutions has dropped to record lows. A more academic and exhaustive treatment of public dissatisfaction is “The Signs of Deconsolidation”, published in the Journal of Democracy in January 2017. In this article Roberto Foa and Yascha Mounk demonstrate that increasing numbers of young Americans believe that democracy is a bad or very bad way of running the country, while the number of Americans supporting the idea of army rule or a strong populist leader has notably increased in the last 20 years.
35. See, for example, Mayor Lee’s 2015 State of the City address, in which he noted “I expect to be held accountable”
in regard to his newly announced Affordability Directives. Consistent with his extensive and distinguished career with the City’s Government, Mayor Lee is uniquely placed to encourage and strengthen accountability and transparency in the SFG over the long-term.
36. Supervisor London Breed ran for re-election on a number of issues, including her record on helping the homeless
into supportive housing. As her campaign website notes, she “learned many ways to improve how to provide services…allocating our resources efficiently, and holding everyone involved accountable.”
37. The Preamble of the San Francisco City Charter includes specific language emphasizing the importance of
responsive and accountable government, noting that the “the people of the City and County” have established the Charter as “the fundamental law”, in order to, inter alia, “enable municipal government to meet the needs of the people effectively and efficiently”, and “to provide for accountability and ethics in public service.”

30
ACCELERATING SF GOVERNMENT PERFORMANCE
APPENDICES
APPENDIX A: SFG & EXTERNAL SOURCES 31 APPENDIX B: SF IN NATIONAL / GLOBAL RANKINGS 33 APPENDIX C: SFG PERFORMANCE SCORECARD 34 APPENDIX D: AUSTIN’S CITYWIDE DASHBOARD 36

31
ACCELERATING SF GOVERNMENT PERFORMANCE
APPENDIX A: SFG & EXTERNAL SOURCES
CITY AND COUNTY OF SAN FRANCISCO
Charter of San Francisco (1996)
Office of the Mayor:
Mayor’s 2017 State of the City Address Mayor’s 2015 State of the City Address Mayor’s 2014 State of the City Address Mayor’s Proposed Budget, 2015-2016 & 2016-2017 Resilient San Francisco (2016) San Francisco’s 9-1-1 Call Volume Increase (Office of Civic Innovation in cooperation w/Google; October 2015)
Board of Supervisors:
Performance Audit of Homeless Services in San Francisco (June, 2016)
Civil Grand Jury:
Accountability in the San Francisco Government (2008) The Numbers have Something to Say, Is Anybody Listening? Performance Management in SF City Government (2009) Auditing the City Services Auditor: You Can Only Manage What You Measure (2013)
Office of the Controller:
2015 City Survey 2013 City Survey 2011 City Survey 2008-2009 Status of Civil Grand Jury Recommendations (2014 Update) Citywide Benchmarking Report, Part I: Demographics, Livability, Public Safety (2017) Citywide Benchmarking Report, Part II: Transportation, Finance (2017) Citywide Benchmarking Report, Part III: Safety Net, Population Health (2017) City Services Auditor Fiscal Year 2016-2017 Annual Workplan Inclusionary Housing Working Group: Final Report (2016) Performance Scorecards website Performance Scorecards Update & Fiscal Year 2015-2016 Performance Measures Strategic Plan: FY 2016-2017 & 2020-2021
Budget & Finance:
Draft Capital Plan: Fiscal Years 2018-2027 Proposed Five Year Financial Plan: Fiscal Years 2017-2018 through 2021-22

32
ACCELERATING SF GOVERNMENT PERFORMANCE
Other:
2016 Customer Satisfaction Survey (BART) Data in San Francisco: Fueling Good Decisions, dataSF (2016) Housing for Families with Children (Planning Department; 2017) Reaching 80-50: Technology Pathways to a Sustainable Future (Department of the Environment, 2016) San Francisco General Plan (Public Works) San Francisco’s Ten Year Plan to End Chronic Homelessness: Anniversary Report Covering 2004-2014 (San Francisco Human Services Agency)
OTHER RESOURCES
2015 Year in Review, City of Austin A Performance Management Framework for State and Local Government: From Measurement and Reporting to Management and Improving, National Performance Management Advisory Commission (2010) An Evaluation of the Performance Measurement Process of the City of Austin, City of Austin (2016) Beyond the Scorecard: Understanding Global City Rankings, The Chicago Council on Global Affairs (2015) The Dark Side of Transparency, McKinsey & Co (February 2017) Employment by race and place: snapshots of America, Brookings Institute (February 2017) The Future is Now: Transparency in Government Performance, Chartered Global Management Accountants (August 2016) Government Productivity: Unlocking the $3.5 Trillion Opportunity, McKinsey & Co (April 2017) How to Create Government KPIs, Freebalance (2017) How to Run a Government, Michael Barber (Penguin Random House, 2015) How US State Governments Can Improve Customer Service, McKinsey & Company (December 2014) Hunger and Homelessness Survey, United States Conference of Mayors (December 2016) Implementing a citizen-centric approach to delivering government services, McKinsey & Company (July 2015) Lessons from Performance Measurement Leaders: A Sample of Larger Local Governments in North America, Government Finance Officers Association (June 2013) Outcome and Process Metrics Recommendations Developed for Seattle’s Homeless Services Contracts, Government Performance Lab, Harvard Kennedy School (2016) Performance Accountability, Evidence, and Improvement: Reflections and Recommendations to the Next Administration, National Academy of Public Administration & The Volcker Alliance (October 2016) The PerformanceStat Potential, Robert D. Behn, (Ash Center for Democratic Governance and Innovation, Harvard University, 2014) Performance Tracker: A data-driven analysis of the performance of government, Institute of Government (Spring 2017) Retooling Metropolis: How Social Media, Markets, and Regulatory Innovation can Make America’s Cities More Livable, Manhattan Institute (2016) Solving the Housing Affordability Crisis: How Policies Change the Number of San Francisco Households Burdened by Housing Costs, Bay Area Council Economic Institute (2016) Surfacing the Submerged State: Operational Transparency Increases Trust in and Engagement with Government, Harvard Business School Working Paper 14-034 (2013) Transforming Performance Measurement for the 21st Century, The Urban Institute (July 2014) Why Government Fails so Often, Peter H. Schuck (Princeton University Press, 2014)
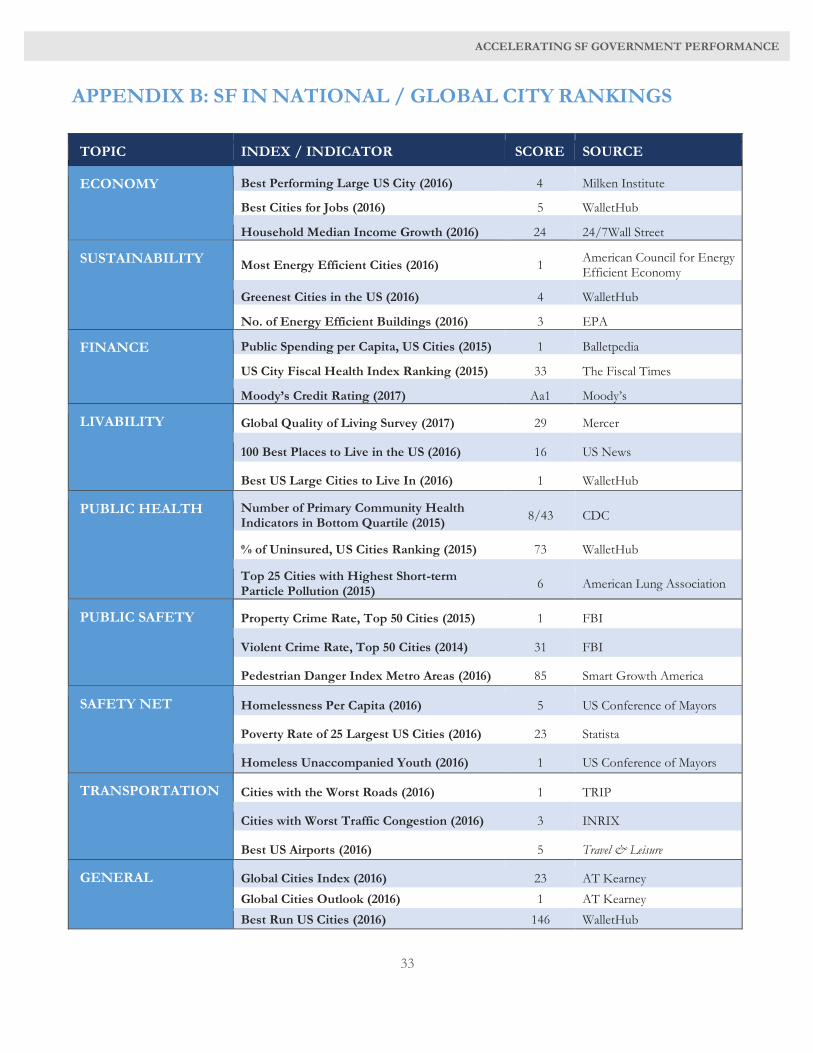
33
ACCELERATING SF GOVERNMENT PERFORMANCE
APPENDIX B: SF IN NATIONAL / GLOBAL CITY RANKINGS
TOPIC INDEX / INDICATOR SCORE SOURCE
ECONOMY Best Performing Large US City (2016) 4 Milken Institute
Best Cities for Jobs (2016) 5 WalletHub
Household Median Income Growth (2016) 24 24/7Wall Street
SUSTAINABILITY Most Energy Efficient Cities (2016) 1
American Council for Energy Efficient Economy
Greenest Cities in the US (2016) 4 WalletHub
No. of Energy Efficient Buildings (2016) 3 EPA
FINANCE Public Spending per Capita, US Cities (2015) 1 Balletpedia
US City Fiscal Health Index Ranking (2015) 33 The Fiscal Times
Moody’s Credit Rating (2017) Aa1 Moody’s
LIVABILITY Global Quality of Living Survey (2017) 29 Mercer
100 Best Places to Live in the US (2016) 16 US News
Best US Large Cities to Live In (2016) 1 WalletHub
PUBLIC HEALTH Number of Primary Community Health Indicators in Bottom Quartile (2015)
8/43 CDC
% of Uninsured, US Cities Ranking (2015) 73 WalletHub
Top 25 Cities with Highest Short-term Particle Pollution (2015)
6 American Lung Association
PUBLIC SAFETY Property Crime Rate, Top 50 Cities (2015) 1 FBI
Violent Crime Rate, Top 50 Cities (2014) 31 FBI
Pedestrian Danger Index Metro Areas (2016) 85 Smart Growth America
SAFETY NET Homelessness Per Capita (2016) 5 US Conference of Mayors
Poverty Rate of 25 Largest US Cities (2016) 23 Statista
Homeless Unaccompanied Youth (2016) 1 US Conference of Mayors
TRANSPORTATION Cities with the Worst Roads (2016) 1 TRIP
Cities with Worst Traffic Congestion (2016) 3 INRIX
Best US Airports (2016) 5 Travel & Leisure
GENERAL Global Cities Index (2016) 23 AT Kearney
Global Cities Outlook (2016) 1 AT Kearney
Best Run US Cities (2016) 146 WalletHub

34
ACCELERATING SF GOVERNMENT PERFORMANCE
APPENDIX C: SFG PERFORMANCE SCORECARD
THEMES INDICATORS GOALS STATUS
Livability
(8)
Street & Sidewalk Cleaning Response Graffiti Service Request Pothole Response Pavement Condition Index Park Maintenance Scores Recreation Courses Enrollment Total Monthly Visitors (Libraries) Total Monthly Circulation (Libraries)
95% within 48 hours No target 90% within 72 hours 70% by 2025 90% of park maintenance standards met 70% of courses with enrollment at or above 70% 558,333 visitors per month (main & branch libraries) 850,00 physical and electronic materials
94% 3,469/month
97% 68%
86.3% 72%
504,326 893,985
Public Health
(10)
Health Network Enrollment Urgent Care Access Primary Care Patient Satisfaction ZSFG Occupancy Rate Ave. Daily Population, Laguna Honda Hospital Ave. Length of Stay, Laguna Honda Hospital Unique Substance Abuse Clients in Treatment Unique Metal Health Clients in Treatment HIV+ Clients Linked to Medical Care Health Insurance Coverage
98,000 enrollees by fiscal year 2020-21 95% of patients in Urgent Care same/next day 70% of providers receive a rating of 9 or 10 (of 10) 85% occupancy No target Less than 60 days No target No target 75% of new cases connected to care within 3 months 100% of healthy people by 2020
94,062 84% 74% 100% 760 70
3,809 11,362 90%
95.4%
Safety Net (13)
County Adult Assistance Active Caseload Calworks Active Caseload Calfresh Active Caseload Medi-Cal Enrollment Homeless Population Direct Homeless Exits through City Programs Family Shelter Waiting List In Home Supportive Services Active Caseload Meals Delivered to Seniors Children in Foster Care Children Receiving a Subsidy Enrolled in Licensed Care Licensed Childcare Centers with Quality Scores Poverty in San Francisco
5,364 active cases projected (no target) 3,976 active cases projected (no target) 33,339 active cases projected (no target) 132,216 active cases projected (no target) No target 1,570 for Fiscal Year 2016-17 200 per month 22.500 for Fiscal Year 2016-17 1,501,224 for Fiscal Year 2016-17 943 children 85% 99% with 4.5 out of 7 No target
4,913 3,634 29,745 122,512 6,686 804 223
22,377 1,620,337
899 87% 99% 13%
Public Safety (9)
Property Crime Violent Crime 911 Call Volume 911 Call Response Ambulance Response to Life Threatening Emergencies Police Response to High Priority Call County Jail Population Active Probationers Juvenile Jail Population
6,126 per 100,000 residents projected (no target) 883 per 100,000 residents projected (no target) No target 90% within 10 seconds 90% within 10 minutes Within 4 minutes Fiscal year projection: 1,280 inmates No target No target
3,311 430
1,733 75% 90%
5.2 minutes 1,340 3,154
43
Transportation (11)
Transit Trips with Bunching or Gaps Between Vehicles Percentage of Scheduled Service Hours Delivered Transit On-Time Performance Customer Rating of Overall Satisfaction w/Transit Services Customer Rating of Cleanliness of Muni Vehicles Traffic Fatalities Percentage of Citations for Top Five Causes of Collisions Crimes on Muni Muni Collisions Non Private Auto Mode Share Congestion
10.6% combined for bunching and gaps 98.5% delivered 85% on-time 3.3 out of 5 3.0 out of 5 Zero traffic fatalities by 2024 50% of traffic citations 5.70 per 100,000 miles 3.67 per 100,000 miles 50% non-private auto mode share by FY 2018 No target
24.1% 98.3% 57% 3.2 3.0 2
54% 4.6 6.6
53% 12.7 mph
Environment (8)
Water Sold to San Francisco Residential Customers Average SFPUC Water and Sewer Bill Water System Preventative Maintenance SFPUC Customer Service Rating Days with EPA Air Quality Index Rating of “Good” Greenhouse Gas Emissions Residential and Small Business Landfill Diversion Refuse to Primary Landfill
Less than 50 gallons per capita per day Less than 2.5% of median income 95% of total waster system maintenance time 90% “Good” or “Excellent” by surveyed customers No target 25% below 1990 levels by 2017 60% refuse diverted from landfill Zero waste by 2020
40.9 gallons 1.29% 90% 85% 301 23% 58% 1,571
Economy
(11)
Total Employment, Metropolitan Division Temporary Employment, Metropolitan Division Unemployment Rate Zillow Home Price Index
2.5% increase from prior year (no target) 5.3% increase from prior year (no target) 0.3 % point decrease from prior year (no target) 0.0% increase from prior year (no target)
1,103,700 19,800 3.1%
$1.15M

35
ACCELERATING SF GOVERNMENT PERFORMANCE
Zillow Rental Price Index Office Vacancy Rate Direct Average Asking Rent Hotel Occupancy Rate Average Daily Hotel Rate Revenue Per Available Hotel Room Sales Tax Collections
4.9% increase from prior year (no target) 0.0% point increase from prior year (no target) 7.1% increase from prior year (no target) 0.7 % point increase from prior year (no target) 6.1 decrease from prior year (no target) 5.2% decrease from prior year (no target) 5.5% increase from prior year/2015 (no target)
$3,007 8.2%
$73.65 81.5%
$238.77 $194.60 $94.6M
Finance
(6)
General Obligation Bond Rating Unrestricted Fund Balance Stabilization Reserves Actual Expenditures vs Budgeted Expenditures Pension Plan Funding Level Other Post-Employment Benefits Funding Level
Aa1 (Moody’s) 16.7% of revenue 10% of revenue ($436M in FY 2015-16) 0% variance 0% variance 100% funded 100% funded by 2043
Aa1 30.1% 6.9% -2.1% 1.5% 82.6% 0.4%

36
ACCELERATING SF GOVERNMENT PERFORMANCE
APPENDIX D: AUSTIN’S CITYWIDE DASHBOARD