civil rights data collection (crdc) webinar · agenda i. introduction - liz • why crdc and how to...
TRANSCRIPT

Civil Rights Data Collection (CRDC) Civil Rights Data Collection (CRDC) Webinar:Webinar:
Using the Data in Local WorkUsing the Data in Local WorkJune 28, 2018June 28, 2018
Liz Olsson ♦ NAACP Legal Defense Fund
Harold Jordan ♦ ACLU Pennsylvania
Amir Whitaker ♦ ACLU SoCal Attorney &
UCLA Researcher

Agenda
I. Introduction - Liz• Why CRDC and how to use as an advocacy tool?
II. Overview of CRDC website and accessing local info - Harold Accessing Local Information• Accessing Local Information
• Charts/diagrams that can be generated
III. Analyzing and Understanding the Data – Amir • Data flaws and issues
• Data analysis tips
• Publication preview
• National and state analysis
IV. Closing and Next Steps – Liz• Collection of issues (e-mail to Liz at [email protected])
• ESSA data requirements and timeline2

Intro to CRDC and Local Work
Liz Olsson
NAACP Legal Defense Fund
3

What is the CRDC?
The U.S. Department of Education (ED) conducts the Civil Rights Data Collection (CRDC) to collect data on key education characteristics of school districts.
Office of Civil Rights (OCR) collects the data to ensure that districts are meeting their civil rights obligations.
Conducted usually every two years.
– Current data is for 2015-2016
– The next data collection will be for 2017-2018.
Data on individual schools and districts.
4

What is the CRDC?
Covers a number of school characteristics, like:
– Access to Advanced Placement courses, Math and Science courses,
SAT/ACT tests,– SAT/ACT tests,
– Preschool programs,
– Percentage of first-year teachers,
– Enrollment demographics, and
– Discipline.
Data is disaggregated by race/ethnicity, sex, limited English proficiency, and for students with disabilities and students without disabilities.
5

Why CRDC Matters?
It matters more than ever – it is connected to ESSA
CRDC is a tool for members to use in their local work CRDC is a tool for members to use in their local work
Reveals school climate disparities related to discipline, restraint and seclusion, retention, and bullying
Tracks personnel and non-personnel expenditures
Can be used to check that data is being reported accurately
Gives State/National estimations
6

What new info is in the 2015-2016 CRDC?
Several elements were optional for 2013-2014 but required for 2015-2016, including: Number of incidents of violent and serious crimes
Number of school days missed by students who received out-of-school suspensions
Number of students transferred to alternative schools
Number of instances of corporal punishment PreK-12
Number of allegations of harassment or bullying on basis of sexual orientation or religion
Number of FTEs for psychologists, social workers, nurses, security guards, and SROs
Additional elements included data on school characteristics, early childhood education, college and career readiness, & school staffing/resources. 7

Local Issues with Reporting + Definitions
Local districts do not always report data accurately to OCR
If a district fails to report certain data, a zero will appear
There may also be cases where the data on the OCR website does not match the data you can access locally. One reason may be different rounding of numbers attempting to maintain privacy
Some districts may not accurately report particular disciplinary categories because the way OCR defines a category does not match the district’s definition
8

Holding Districts Accountable
Schools and districts can be held accountable if you know that the data reported is incorrect, and you have documentation to prove otherwise.
For example, in Holmes County Mississippi: For example, in Holmes County Mississippi:
-During the previous data collection, it was reported that no students were referred to Law Enforcement; but through Nollie Jenkins Family Center’s organizing we had evidence that at least four students had been referred.
– With regards to school-related arrest, data from the previous collection reported a lower number than actual in elementary, middle and high schools.
9

Questions
Any questions so far?Any questions so far?
10

HOW TO: Explore the OCRWebsiteWebsite
Harold Jordan
ACLU Pennsylvania
11

OCR website has evolved over time
Features added in 2016:
• Data Analysis Tools - 3 tools that automate the process of making
calculations and comparisons calculations and comparisons
http://ocrdata.ed.gov/DataAnalysisTools
• Discipline Report – but does not include arrests & assignment to
alternative schools
• But some tools do not yet use the 2015-16 data
• And some tools use data only for school-administered discipline
(suspensions, etc.), not police-administered discipline (arrests)
“School and District Search” and “Detailed Data Tables” display the
most complete discipline data
12

HOW TO: Explore the District Data Summaries from
Office for Civil Rights
Go to ocrdata.ed.gov
Four Approaches to Accessing Data
13

Approaches to Pulling/Displaying Data
1. Use School and District Search
Access to complete data w/visuals
2. Use Detailed Data Tables
Displays all categories of discipline data in tables
Lesson1
14
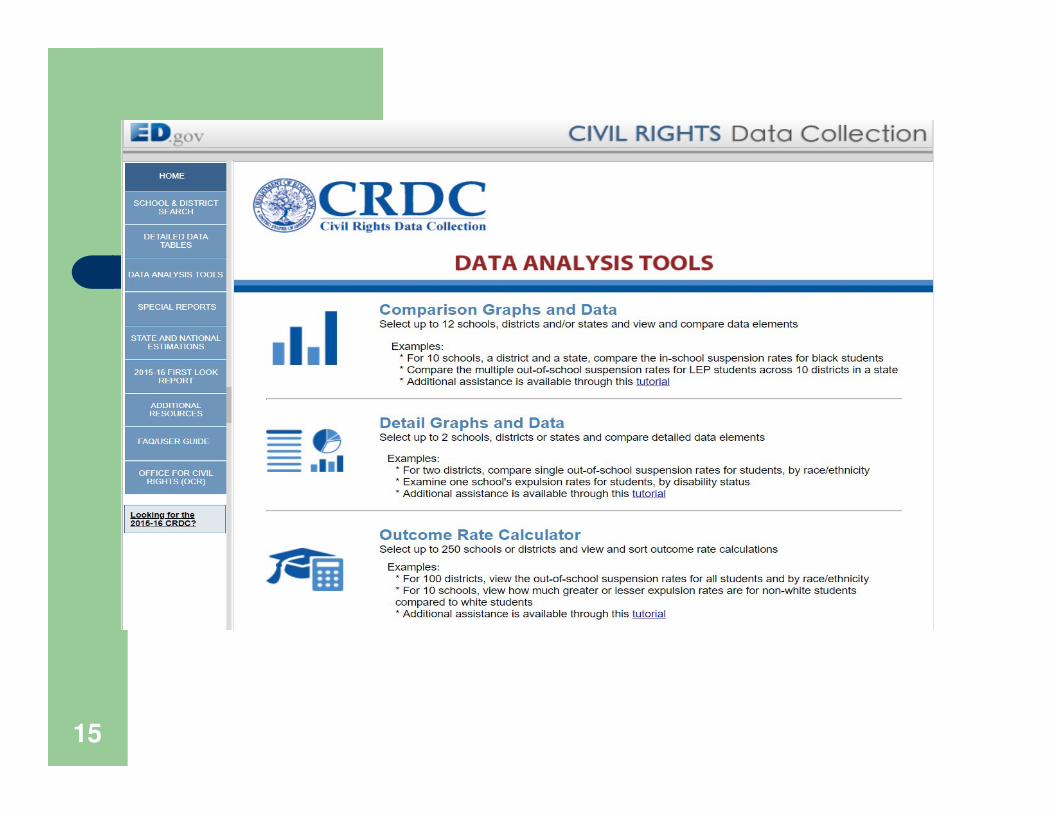
3. Use OCR’s Data Analysis Tools
But only the Outcome Calculator uses 2015 data (so far)
Not all tools report arrest trends
4. Use Discipline Report
Easy and quick snapshot with helpful line graphs
Does not report arrest and alternative schools data
Displays suspensions by race and gender in a unique way
Displays all categories of discipline data in tables
#s and %s can be downloaded in Excel, CSV, or
Best choice for the data hound, but you must do
the math
Lesson 2
15

Data Analysis Tools in a Nutshell
Comparison Graphs and Data
• Compare up to 12 individual schools, districts (or
16
• Compare up to 12 individual schools, districts (or
LEAs), or states
• For each one, rates are also compared to national
rates for that category of discipline
• You have the option of generating a bar graph
(default) or a table
• You can export data in Excel (from table option)
• BUT No 2015-16 data yet

Data Analysis Tools in a Nutshell
Detail Graphs and Data
• Similar to comparison graphs and data
• Limited to comparing two schools, districts
17
• Limited to comparing two schools, districts
(or LEAs), or states
• A much more detailed comparison (includes
subcategories and interactive options)
• But does not allow you to compare to
national rates
• You have the option of generating a bar
graph (default) or a table
• You can export data in Excel (from table
option)
• BUT No 2015-16 data just yet

Data Analysis Tools in a Nutshell
Outcome Calculator
• Includes 2015-16 data
18
• Includes 2015-16 data• Allows you to compare rates of
ethnic/racial groups vs. whites
• Can select up to 250 schools or districts
(LEAs)
• Reports OSSs and expulsions, not law enforcement data
• Generates tables only (no graphs)
• Can export table into Excel

Lesson 1 – School/District Search
Click to find your district
District
19
District name

Lesson 1 – School/District Search
20
Click here to get arrest data

Lesson 1 – School/District Search
Click for table
21

Lesson 1 – School/District SearchVoila! Arrest table for students w/ disabilities
22

Lost Class Days Due to Suspension (new)
23
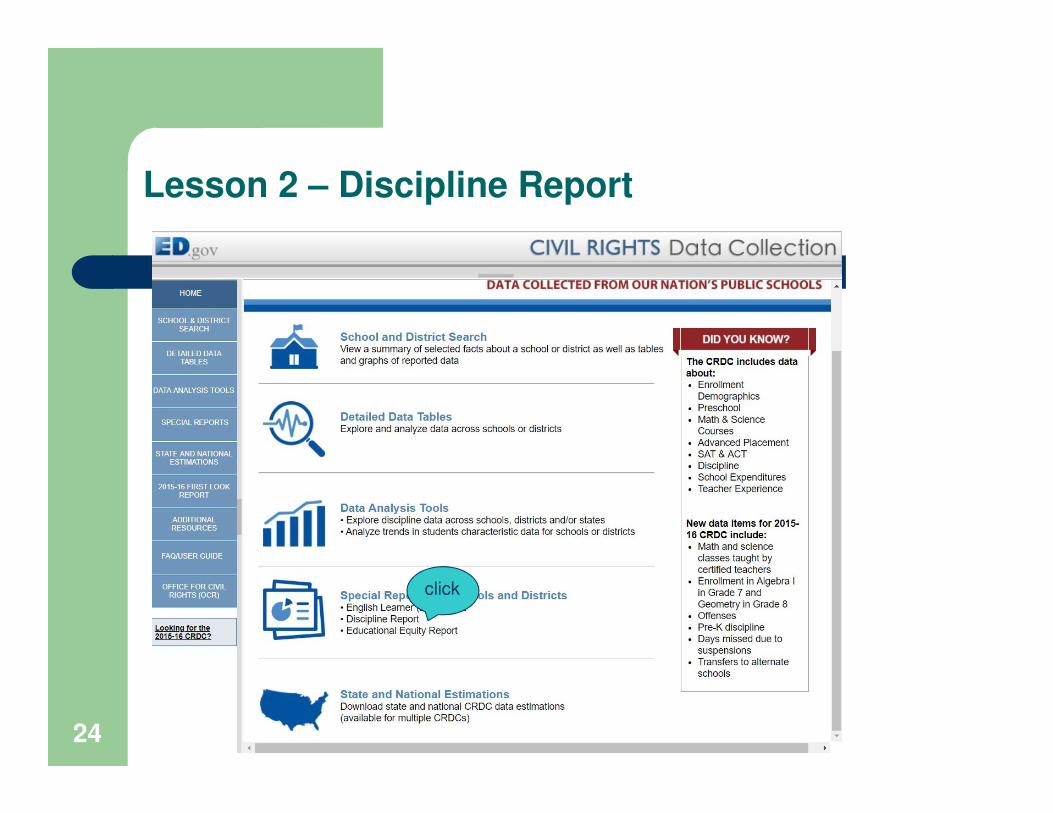
Lesson 2 – Discipline Report
24
click

Lesson 2 – Discipline Report
25
select by district or school name

Lesson 2 – Discipline Report
26
or search by
criteria, such as
black females
suspended >20%

Lesson 2 – Discipline Reportviewing suspensions by race & gender
27

Using Data
28
www.endzerotolerance.org

HOW TO: Analyzing and Understanding the Data Understanding the Data
Amir Whitaker
ACLU SoCal
UCLA Researcher
29

DATA FLAWS AND ISSUES IN 15-16
• Hawaii and Florida...again
• Problematic federal interpretations

ANALYZING AND UNDERSTANDING DATA
Risk = absolute values (the percentage of students suspended at
least once).
Risk difference = absolute differences. Subtract the highest group from the lowest.from the lowest.
Risk Ratio and Composition Index- useful for conveying the injustices. They are purely relative measures, they are not recommended for comparing schools or measuring progress. They DO NOT not reveal whether the underlying risk for suspension is high or low
Composition index- compares the composition of the enrollment to the composition of a comparison group (students suspended). MAY NOT work for schools/districts primarily serving students of color.
31

Which District was Highest Suspending For Blacks?Which had the largest Racial Gap?
County Black Risk %
White Risk %
Racial Gap
CompositionVariance For Highest Group
Black to WhiteRisk RatioGroup Ratio
Baltimore City
8 2 6 11% 4.0
Dorchester 17 6 11 68% 2.4Montgomery 5 1 4 132% 5.0
32

Analysis Tip: Translate to Class Time

Analysis Tips: Report Cards
VIDEO LINK:https://www.youtube.com
/watch?v=KAxREnlONZk
34

Analysis Tips: Report Cards
35

Analysis Tips: Include Solutions and Citations
36

DASHBOARD AND PUBLICATION PREVIEW
37

ESSA data requirements and timeline
ESSA requires states and districts to publish
discipline data reported under the CRDC on annual
report cardsreport cards
Report cards for 2017-2018 must be published by
Dec 31, 2018
These report cards must be posted on state and
district websites
Make sure this data is on report cards!
38

Possible Next Steps and Closing
Compile and report issues about accuracy of local
data
– Can send issues to Liz at [email protected]– Can send issues to Liz at [email protected]
Advocacy and Public Education
– Use CRDC data to educate officials and the public about discipline disparities, resource inequity, etc. and to push for change!
– The Engage for Education Equity Toolkit can help you develop a strategy: http://partnersforeachandeverychild.org/project/engageforedequity/39

Resources
Dignity in Schools Campaign – “Take Action” page
http://dignityinschools.org/
ACLU-PA STPP Site (see: “Using Data” page) ACLU-PA STPP Site (see: “Using Data” page)
www.endzerotolerance.org
ACLU-PA – Open Records Request Templates
https://www.endzerotolerance.org/data
ProPublica Tool – Check the Status of Complaints
https://projects.propublica.org/graphics/civil-rights-violations
Government Accountability Office Report:
https://www.gao.gov/products/GAO-18-25840

Resources
The Civil Rights Project Resources
https://www.civilrightsproject.ucla.edu/resources/projects/ce
nter-for-civil-rights-remedies/school-to-prison-foldernter-for-civil-rights-remedies/school-to-prison-folder
State-level data on discipline in SPED
https://www2.ed.gov/programs/osepidea/618-data/static-
tables/index.html#partb-dis
Primer on how to measure discipline disparities
https://supportiveschooldiscipline.org/learn/reference-
guides/measuring-discipline-disparities
U.S. Department of Education CRDC webpage
https://www2.ed.gov/about/offices/list/ocr/data.html41

Q & A
Any remaining questions for our
panelists?panelists?
42

Presenter Contact Information
Harold Jordan - [email protected]
Amir Whitaker – [email protected] Whitaker – [email protected]
To report issues with the data, please contact Liz at
NAACP LDF at [email protected].
43