class 3 - university of maryland, baltimore countymartins/phys650/class3_project... · class 3 –...
TRANSCRIPT

Class 3
University of Maryland Baltimore County - UMBCPhys650 - Special Topics in Experimental Atmospheric Physics (Spring 2009)
J. Vanderlei Martins and Manfredo H. Tabacniks
http://userpages.umbc.edu/~martins/PHYS650/
• Aerosol Sampling Station: Discussion• Introduction to Course Project Part I – Sunphotometers and Sunphotometry

Class 3 – Always Check the Course’s Web Page• Station Discussion (9:00AM – 45min)
– Short Report• HW question• Calibration Report (plots, error bars, etc.)• Filter Weighting Report (procedures???)
– Station Management:• Schedule and procedures• Manager should report activities every Wednesday (5 min)• Manager should rotate every Wednesday
– Documentation: update on station manual– Initial results from station
• Project Discussion (9:45AM – 1:45min)– Introduction to Sunphotometers and Sunphotometry (9:45 - 30 min)
• Atmospheric Window• Solar Constant• Project (part 1): Solar sunphotometer• Calibration procedures
– Operational Amplifiers (10:15 - 10 min)– Hands on Project (10:25 - 1:05 min)
• Measure LED detection curve• Measure LED emission curve
• Open Lab (11:30-15:00)– Group 1: Calibration– Group 2: Weighing
• HW: Weekly Short Report; Design the printed circuit Board for next class; Reading Assignments.


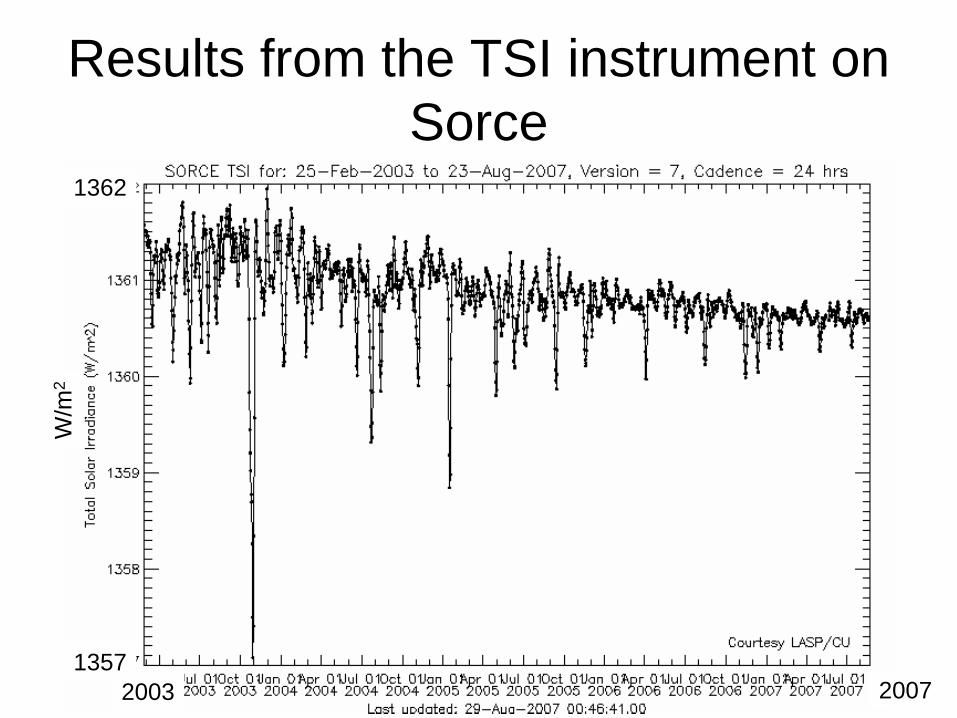
Results from the TSI instrument on Sorce
1357
W/m
2
1362
2003 2007

2007
TSISORCE

Solar Spectrum at different levels:
http://lasp.colorado.edu/sorce/instruments/sim/sim_science.htm
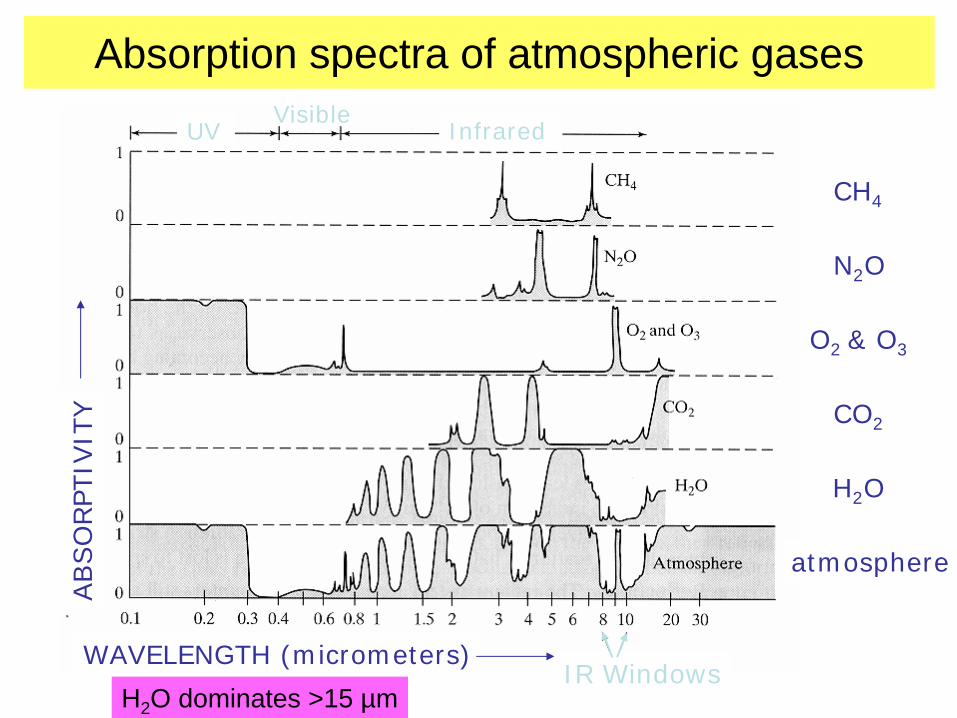
Absorption spectra of atmospheric gases
CH4
CO2
N2 O
H2 O
O2 & O3
atmosphere
ABSO
RPT
IVIT
Y
WAVELENGTH (micrometers)IR Windows
InfraredVisible
UV
H2 O dominates >15 µm
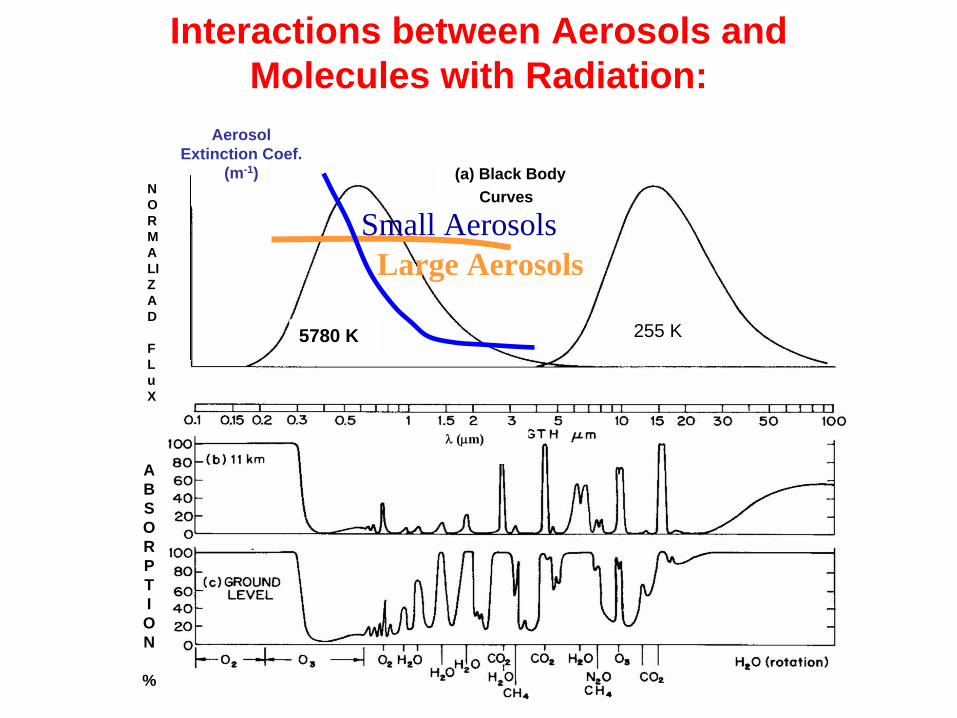
Interactions between Aerosols and Molecules with Radiation:
(a) Black Body Curves
λ
(μm)
Aerosol Extinction Coef.
(m-1)
5780 K 255 K
NORMALIZAD
FLuX
ABSORP T I ON
%
Large AerosolsSmall Aerosols

Lambert-Beer’s Law (discussion on the board)

Experiment 2:1. Project: Construction of atmospheric radiometers-I: 1.1 Objectives
• Construction of an optical instrument for the measurement of solar radiances using photodiodes and portable spectrometers;
• Measurement of atmospheric properties using sun photometry.
1.2 Activities • Conceptual Design and utilization of a sunphotometer • Simulation of the solar signal arriving at the surface • Sensitivity issues, Signal to noise limitations and possible solutions; • Characterization of the instrument components, sensors, and electronics
1.3 Sources and complimentary information
• Basic Principles on Instrument Design • Optics (FOV, lenses, etc.) • Optoelectronic components • Radiometric analysis and signal to noise ratio (SNR) simulations

This week’s report:There are many items that can be included:• Homework assignment (next few slides) in preparation for the
project
• Calibration of the spectrometer and the results of your measured LED emission spectrum compared with the atmospheric transmittance spectrum
• Update from the Sampling station:– Calibration of the Mass flow meter (if you did it this week)– Discussion of filter weighing procedure (if you did it this week)– Discussion on any activities you did related to the station (this is
required for this week’s manager but it is optional for the others)
• Any other activity or discussion you find relevant to include
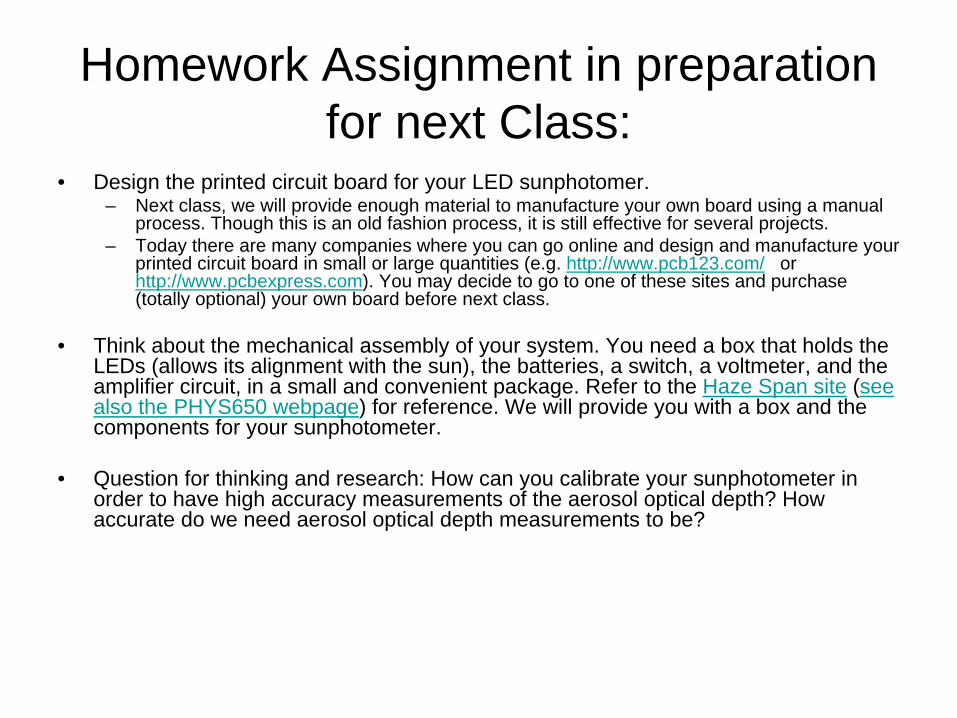
Homework Assignment in preparation for next Class:
• Design the printed circuit board for your LED sunphotomer.– Next class, we will provide enough material to manufacture your own board using a manual
process. Though this is an old fashion process, it is still effective for several projects. – Today there are many companies where you can go online and design and manufacture your
printed circuit board in small or large quantities (e.g. http://www.pcb123.com/ or http://www.pcbexpress.com). You may decide to go to one of these sites and purchase (totally optional) your own board before next class.
• Think about the mechanical assembly of your system. You need a box that holds the LEDs (allows its alignment with the sun), the batteries, a switch, a voltmeter, and the amplifier circuit, in a small and convenient package. Refer to the Haze Span site (see also the PHYS650 webpage) for reference. We will provide you with a box and the components for your sunphotometer.
• Question for thinking and research: How can you calibrate your sunphotometer in order to have high accuracy measurements of the aerosol optical depth? How accurate do we need aerosol optical depth measurements to be?

Electronic Circuit Diagram for The LED Sunphotometer
(extracted from F. Mims III, Scientific American)

Example of printed circuit board routing design (from PCB design tutorial, by David L. Jones at www.alternatezone.com):

Homework Problem: Draw your PCBThe PCB is an insulated board covered with a thin copper layer. The top side is the component side. The copper film is on the other side. On the copper side you draw the circuit connecting the holes following the diagram in the previous page. The circuit is drawn using a pen with a special ink that resists the corrosion bath in which the PCB is put to remove the unwanted copper. After removing the ink with a solvent, the copper connections between and around the holes are exposed. The components are inserted from the top side and the leads soldered on the copper connections.
MountingScrew
switch
LED
-9V
GND
Rf
+9V
top V
copper side
For the next class, draw your own PCB circuit, using a pencil and a printout of this slide. Draw the circuit on the copper side of the PCB. During next class you will transfer the drawing to your PCB using a corrosion resistant ink. After removing the unwanted copper, solder your components and wires on the PCB.

Example of Mechanical Assembly: (extracted from F. Mims III, Scientific American)
Switch
Terminal for Voltimeter
LED
Resistor
Screen for sun projection
Collimators

Class 3 – experiment: Sun photometer
• Determine the spectral properties of your sunphotometer’s detector (Emission x detection)
– Using Na and Hg spectral lamps, verify the wavelength calibration of the Ocean-Optics spectrometer
– Calibrate ( obtain the experimental λ(θ), eventually linearized) for the prism monochromator: (TBD in class 4)
– Determine experimentally the detection spectrum of your LED normalized to 1 at the maximum intensity.
• Based on your data, what color is your LED?– Using a prism (or diffraction grating) monocromator determine
experimentally the emission spectrum of your LED (TBD in class 4)• Is the detection color of the LED the same as the emission color?