class inequality among college graduates - … class inequality among college graduates paul...
TRANSCRIPT

1
Class Inequality among College Graduates
Paul Attewell & Dirk Witteveen
Graduate Center of the City University of New York
3/22/2015
Abstract Stratification researchers have reported that the relationship between parental class origins and
socio-economic outcomes drops to near zero for individuals who have a baccalaureate degree,
leading one scholar to conclude: “This … provides a new answer to the old question about
overcoming disadvantaged origins. A college degree can do it.” We present contrary evidence
from a nationally-representative sample of baccalaureate graduates. Ten years after graduation
there are substantial income differences between graduates from different class origins. These
class-related gaps persist after controlling for college selectivity, major, and academic
performance. We develop the implications of this for theories of educational stratification.
Introduction
A large body of research shows that academic success is strongly associated with family
background. In the US, kindergarteners begin their schooling with substantial SES-related
differences in vocabulary, numeracy, reading readiness, and general knowledge (Duncan and
Magnuson 2011; Risley and Hart 1995). Class and race differences in residential patterns result
in young children attending schools with divergent student demographics and different resources
(Altonji and Mansfield 2011; Lee and Burkam 2002). Initial skill disparities tend to widen as
children progress from K through 12 grade, in part due to SES-related fallbacks in skills during
summer breaks (Cunha and Heckman 2007; DiPrete and Eirich 2006; Downey et al. 2004; Heyns
1978). During middle and high school, lower-income students are disproportionately tracked into
less-advanced courses, and more of them drop out of school, further intensifying academic
inequalities (Kaushal et al. 2011; Lucas 1999; Rumberger 2004).
This pattern of cumulative disadvantage extends into higher education: family SES is
associated with whether a student continues into college, the kind of institution attended
(community college versus four-year, selective versus unselective college) and the likelihood of
graduation with a baccalaureate degree (Bailey and Dynarski 2011).

2
Notwithstanding these well-documented aspects of class inequality in schooling,
American popular culture celebrates the ideal of upward mobility through educational attainment
(Hochschild 1995; Duncan and Murnane 2011). Politicians exhort young people to stay in school
and study hard, believing that individuals from lower-income families who beat the odds and
complete a degree, thereby gain entry into the middle class (Lewin 2012, White House 2014).
This conviction about the power of educational credentials to erase disadvantages in family
background is also supported by research. In several studies, Hout (1984, 1988) documented that
family SES is no longer associated with occupational attainment if one limits one’s focus to
individuals with a bachelor’s degree. More recently, that observation has been replicated by
Torché (2011, 2014).
This paper reconsiders the finding that undergraduates who complete the baccalaureate
thereby erase the disadvantage of a low-SES family origin. Analyzing longitudinal survey data
for a large nationally-representative sample of baccalaureate holders, we observe something
quite different: substantial earnings gaps a decade after graduation among individuals with
different class origins. We examine several possible mechanisms leading to these SES-related
earnings differences: disparities in academic skills at college entry and in academic performance
during college; differences in the selectivity of college attended; in choice of college major; and
in the attainment of degrees beyond the BA. In contrast to the earlier studies, our analyses
indicate that social class reproduction remains a substantial force among bachelor’s graduates
and that the influence of class origin on income is far from accounted for by factors such as
college selectivity and choice of major.
Previous Research
Scholars have long theorized about the role that educational credentials play in social
stratification (Collins 1979; Shavit et al. 2007). They note that for over a century economically-
developed nations have undergone a steady expansion in the proportion of the population
obtaining schooling and that the length of formal education has steadily increased. Among earlier
generations of Americans, a high school graduate was considered a highly educated person but
nowadays a baccalaureate has replaced that credential as a status marker, and ambitious people
increasingly seek masters and higher degrees to distinguish themselves. These two trends –
expansion and elongation – are read as evidence of competition between social classes for

3
economic advantage through educational credentials. As completing one level of education
becomes commonplace, advantaged classes have typically extended the length of their own
children’s education, earning a higher credential to distinguish themselves and maintain
privileged access to preferred occupations. Undergraduate institutions have also become
segmented along lines of income and class, as community colleges enroll a socially distinct
student body compared to four-year colleges, academically selective colleges have very different
undergraduate demographics than less selective colleges, and public institutions diverge from
private non-profit ones. These various processes of educational stratification have been theorized
in terms of Credential Inflation (Collins 1979), Maximally Maintained Inequality (Raftery and
Hout 1993; Shavit et al. 2007), Effectively Maintained Inequality (Lucas 2001) and more broadly
as Opportunity Hoarding (Tilly 1998) and Social Closure (Weeden 2002).
While these theories account for enduring gaps in educational attainment among social
classes, and for the ongoing expansion of educational institutions, they emphasize differential
access to a given level of education and its consequences, and are relatively silent on the
question of what happens when some members of the lower classes do manage to obtain
credentials usually associated with more privileged social groups. Here one has to turn to a
different body of research on social mobility.
Using mobility table data from the Occupational Change in a Generation studies, and log-
linear methods, Hout (1984) found a marked weakening between 1962 and 1973 of the effect of
father’s occupational status on son’s occupational status and attributed this to the “leveling effect
of education.” Thus by 1973, “origin status does not affect destination status among college
graduates” (Hout 1984, p.1404).
Hout (1988) re-examined the association between socioeconomic origins and destinations
for a later time period –1972 to 1985 – analyzing data from the General Social Survey. This era
was marked by increases in college-going which Hout (1988, p. 1358 & 1391) linked to the
weakening of inter-generational transmission: “Origin affects destination status among workers
who do not have bachelor’s degrees, but college graduation cancels the effect of background
status.” His striking conclusion was that: “This finding provides a new answer to the old question
about overcoming disadvantaged origins: A college degree can do it.”
Torché (2011 & 2014) revisited this issue in a paper titled “Is a College Degree Still the
Great Equalizer?” Her analyses improved upon earlier studies in several respects. Where prior
research focused on mobility tables that cross-tabulated father’s occupation with son’s occupation,

4
Torché included four different measures of occupational destination: social class, occupational
status, individual earnings, and total family income. She also drew upon multiple datasets, most
centrally the General Social Survey, the National Longitudinal Survey of Youth (NLSY), and the
Panel Study of Income Dynamics (PSID).
Torché’s findings varied somewhat across measures and datasets. For social class, she
noted a U-shaped relation between origins and outcomes: … “ the association is substantial
among those without a high school diploma; it weakens as education increases to become not
significantly different from zero among college graduates and then regains strength among
advanced-degree holders” (Torché 2011, p.784.) Torché (2011, p.798) concluded: “… the
chances of achieving economic success are independent of social background among those who
attain a BA. The finding is largely consistent across all indicators of socioeconomic standing…”
In sum, prior research has consistently reported that parental background is not associated
with socio-economic destinations among BA recipients. By implication this should also hold for
individuals from low-income families who, against the odds, do complete a bachelor’s degree.
We nevertheless view this question as unresolved because of data limitations of prior studies,
and because those studies did not examine outcomes specifically for college graduates from
lower SES families. Instead they focused on average effects of family SES on outcomes, using a
statistic such as an elasticity. When that average effect of SES proved statistically non-
significant, they concluded that completing a BA could overcome a disadvantaged family origin.
“In other words, a college degree fulfills the promise of meritocracy – it offers equal opportunity
for economic success regardless of the advantages of origins” (Torché 2011, p. 764) Beyond that
issue, one notes that mobility tables based on 17 broad occupational categories may overlook
finer-grained structural processes, and that in prior studies using regression methods, several
samples contained quite small numbers of parent-offspring pairs at each educational
level. Some analyses of the PSID earnings data by Torché (2011, Table 4), for example, were
based on 177 male BAs.
Given these concerns, to better understand intergenerational effects among college
graduates disaggregated by SES origins, we sought data with a larger sample of degree
recipients, and richer detail about the type of institution each attended, their college major,
performance in college, occupational destinations, and earnings. We also modeled the effect of
family origins on outcomes, specifically among baccalaureate graduates from low SES families.

5
Data and Methods
The data used in this paper are from the 1993/2003 Baccalaureate & Beyond Longitudinal Study
(B&B), conducted by the National Center for Education Statistics (NCES)1. The initial cohort
consists of a nationally representative sample of about 11,000 4-year college seniors who
obtained their bachelor’s degree in the academic year of 1992/1993 (Wine et al. 2005). The data
includes relevant demographic background information and college transcripts (added in 1994).
Two additional follow-ups were carried out in 1997 and 2003 about post-college education,
employment, career development, family formation, and finances. The data used in this paper
come from the restricted-access version of the B&B, which includes specific information on the
institutions that conferred the bachelor’s in 1993. Regulations for the restricted data require us to
round certain descriptive statistics to the nearest ten. We concentrate on the 2003 interviewees
and examine their labor market outcomes ten years after graduation.
Among the sampled 11,190 (a rounded figure) graduates of 1993, 7,790 were employed in
2003. These labor market active respondents form the basis of our study sample. Another 150
respondents had to be eliminated from the sample due to missing data on our main independent
variable (parental income in 1992/1993), which leads to a final sample of 7,740 college
graduates.
Missing data were imputed for two independent variables – age (545 cases) and parental
education (399) – using a prediction based on the co-variance matrix with REML (restricted
maximum likelihood) using JMP software. In all analyses, replicate weights were applied, based
on the final 2003 sample (using the SVY commands in Stata). Table 1 provides descriptive
statistics for the variables used in our analyses.
[Table One About here]
Parental social class was represented by quintiles of family income measured in 1993,
prior to graduation. (The special case of financially-independent students is discussed below.)
The college selectivity measure used in this study is from Barron’s Profile of American
Colleges of 1992 – the academic year in which the sampled baccalaureate students graduated.
This is a ranking determined by a college’s student body average on high school class rank, high
1 More information about the 1993/2003 B&B can be found here: http://nces.ed.gov/surveys/b&b/about.asp

6
school GPA, standardized test score, and selectivity rate (% of applicants admitted). Barron’s
ranking consists of seven different categories: most competitive, highly competitive, very
competitive, competitive, less competitive, noncompetitive, and ‘special.’ The special group
includes music and arts conservatories. The distribution of our analytical sample is presented in
Table 2 below (rounded to the nearest ten).
[Table Two About here]
The dependent variable for the analyses is the baccalaureate graduate’s income in 2003,
approximately 10 years after college graduation. Those among the 1993 BA graduates who were
unemployed, not in the labor force, or who were still in higher education in 2003, are omitted.
After estimating class-origin effects on income ten years after graduation, we first
determine whether class-related earnings gaps are attributable to factors such as selectivity of
college attended, test score at entry to college, GPA at the end of college, college major, and so
on. These are aspects of college performance and behavior that might mediate the effects of
social class background on later earnings.
Finally, we examine as possible proximal causes of class inequality in earnings, the
characteristics of the jobs that graduates from various class backgrounds attain. We determine
whether graduates from different class backgrounds are disproportionately represented in lower-
paid ‘economic niches’, and the extent to which this class-related distribution of employment
across niches accounts for observed class-origin differences in earnings. In this context, we
conceptualize an economic niche as the unique combination of occupation and industry that a
graduate works in (400 niches in total). We calculated median incomes among BA holders for
each unique combination of occupation and industry, using US Census micro-data for the year
2000. We used that information on the niche characteristics of bachelor’s graduates to determine
the extent to which the lower observed incomes for graduates from poorer family backgrounds is
due to those graduates working disproportionately in less remunerative niches, and
(alternatively) the extent to which graduates from poorer family backgrounds earn less than the
median income of graduates within their niche.

7
Findings
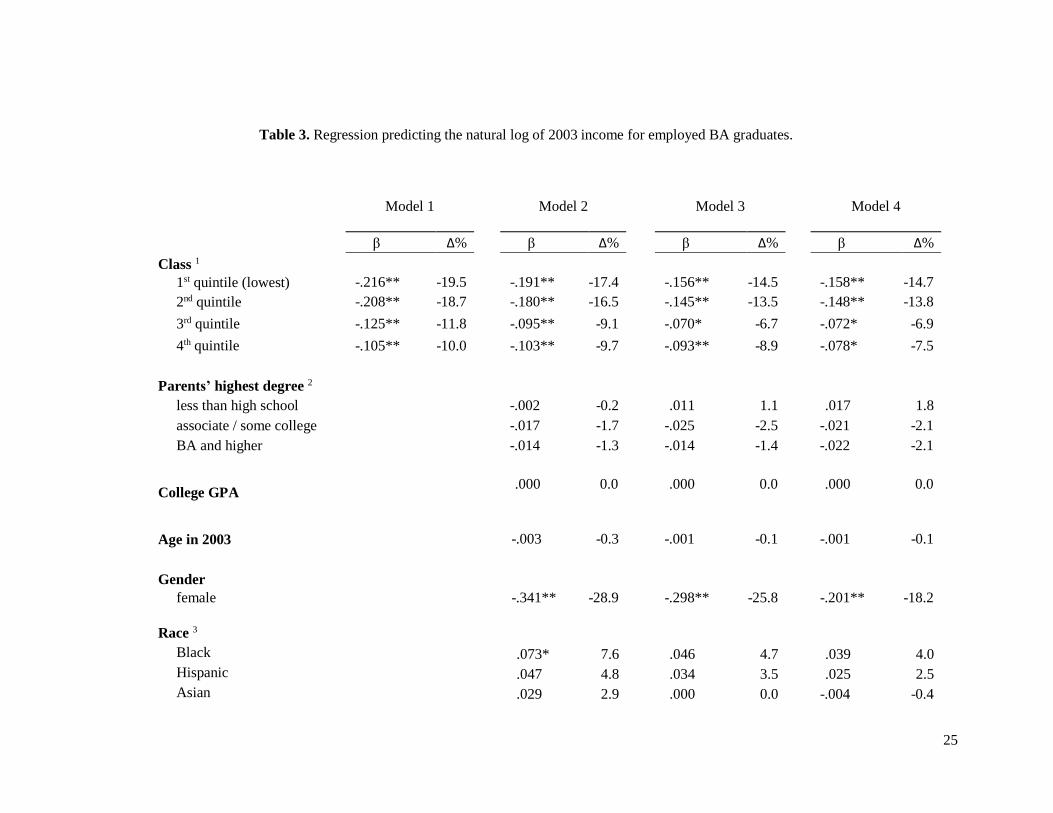
Table 3 presents a set of nested regressions examining the relationship between family
background and an individual’s personal income (logged) about ten years after receiving the
baccalaureate. When a dependent variable has been log-transformed, the coefficient for a
predictor is often interpreted as the percentage change in the dependent variable associated with
a unit increase in that predictor. However, as Tufte (1974, p.125) has noted, this approximation
becomes inaccurate at larger values. We therefore calculated the exact percentage change in
outcome associated with a one-unit increase for a particular predictor and reported this in the
column (indicated by Δ%) next to the regression coefficient.
[Table Three about here]
Model 1 of Table 3 represents family class background as a set of dummy variables
indicating the income quintile of the student’s family at graduation. (We will discuss
independent students separately below.) The reference category is the highest income quintile.
With no covariates or controls, the raw difference in personal income ten years after
baccalaureate graduation between those from top income quintile and bottom income quintile
families (or ‘classes’ )is 19.5 percent, a substantial and statistically-significant gap.
Model 2 adds several controls: parental education, gender, race, age, student’s SAT/ACT
score at entry to college, college GPA at graduation, and whether or not a student was financially
independent of parents at graduation. Neither age at graduation nor the parental education dummies
nor GPA nor the financial independence variable were statistically significant predictors. However,
ceteris paribus, women graduates earned on average 28.9 percent less than their male counterparts
and black graduates earned 7.6 percent more than otherwise similar whites with a similar class
background. In addition, a student’s test score at college entry was positively related to income ten
years after graduation.
Although these covariates are of interest in their own right, one should note that the
coefficient for low social class origins remains substantial even after controlling for all these
factors: a 17.5 percent lower income.
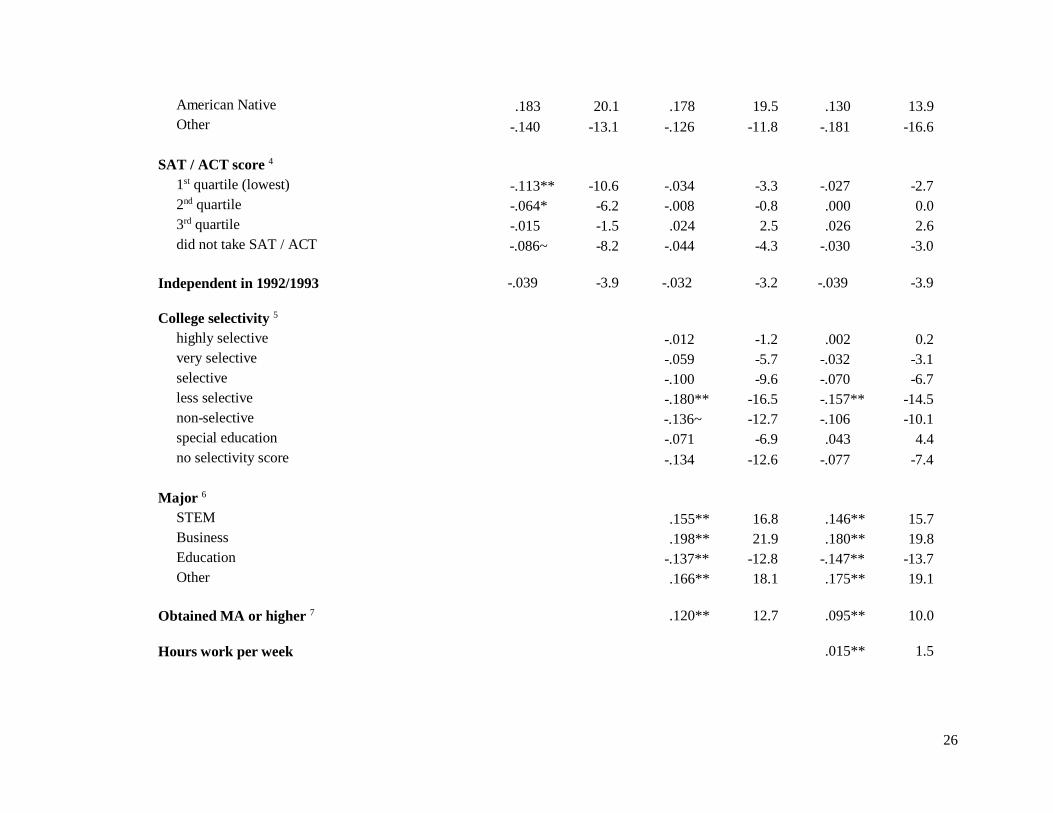
Model 3 adds controls for the selectivity of the college from which the baccalaureate was
granted, plus a measure of student’s major, and a dummy variable for students who received an

8
MA or higher degree during the subsequent decade. Those who graduated from less selective
colleges had on average lower incomes a decade later, and there were large income advantages to
business and science, technology, engineering and math majors (STEM). Nevertheless, these
controls did not cause the coefficient predicting income from family background to disappear:
there were statistically-significant coefficients for every quintile below the top reference group,
growing in magnitude to 13.5 and 14.5 percent for the lowest two family background quintiles.
In the final Model 4, we added part-time work status: this caused the income gap for
women graduates to shrink to 18.2 percent, but had no effect upon the coefficients for class
origins.
Prior researchers have emphasized the importance of college selectivity in predicting
earnings (Dale and Krueger 2011; Loury and Garman 1995). The findings in Table 3 indicated
that controlling for college selectivity did not erase the significant coefficients for family class
background when predicting income. Nevertheless, to explicitly model interactions between
these two dimensions, we constructed a composite variable combining class origins and
college selectivity, and examined its relationship to graduates’ incomes after ten years. This
variable classified both class origin and college selectivity into terciles, resulting in a 9-level
combination predictor. The omitted reference category represents students from the top social
class who graduated from colleges in the top selectivity group.
[Table four about here]
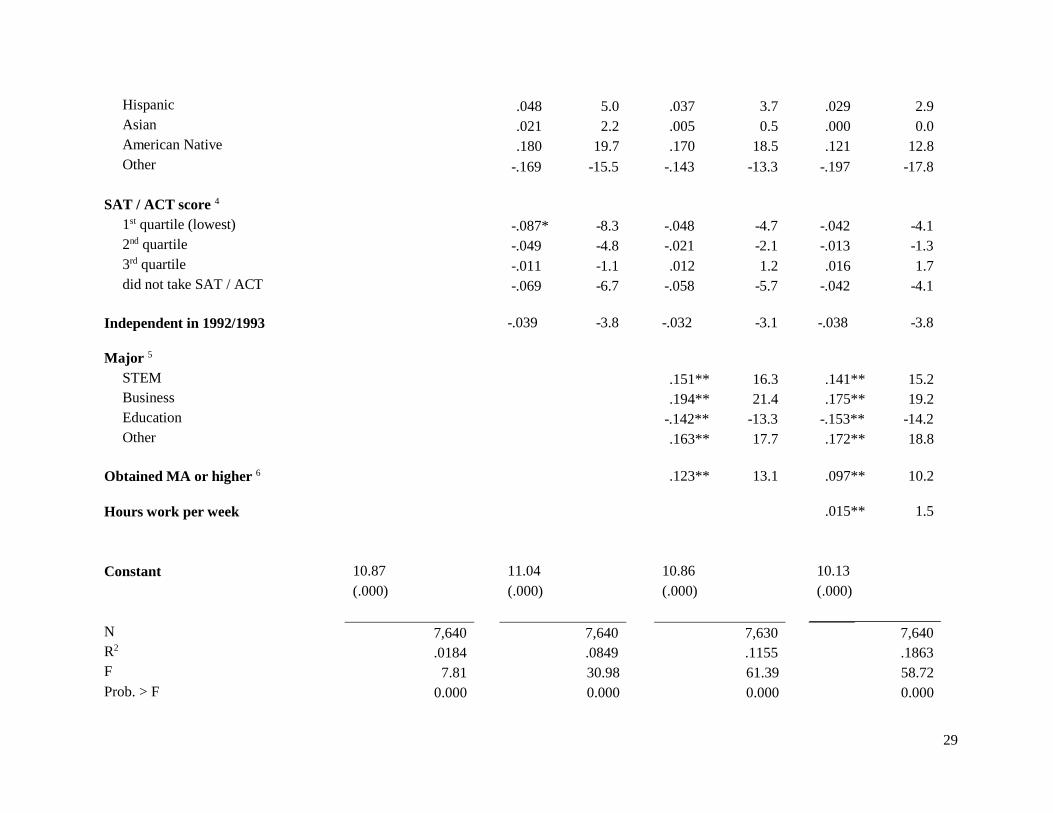
Table 4 reports these findings, again predicting log income for working graduates ten
years on. Model 1 indicates that students from lower-class families who graduated from bottom
tercile colleges earned on average 28.2 percent less than the top group ten years after graduation.
This demonstrates the combined disadvantage of family background and low college selectivity,
as was expected. More striking, in our view, is the coefficient for the row labeled “low high.”
These are graduates from lower-income families who attended highly-selective colleges. The
coefficient indicates that on average their incomes ten years after graduation were about 12
percent lower than their classmates from high income families. Evidently undergraduates from
low income families earn significantly less, even if they overcome the odds and graduate from
highly selective colleges. In addition, those graduates from low-income origins who received
their baccalaureates from middle-selectivity institutions earned about 18 percent less than the

9
reference category.
Model 2 of Table 4 controls for college GPA, parental education, gender, race, age and
SAT scores. These controls slightly reduced the coefficients for the class/selectivity dummies for
graduates for lower-class families, which nevertheless remained statistically significant. In Model
3, controls for major and higher degrees are added. These only marginally changed the
coefficients for lower-class origin graduates who attended low and medium selective colleges;
however, the income disadvantage associated with low-class graduates at the most selective
colleges was reduced to 7.7 percent, at a p value of 0.067. To some extent then, the class income
gap for graduates from the most selective colleges reflects both their college major and whether
the graduate continued and received a higher degree; these are mediating factors for this top
selectivity group.
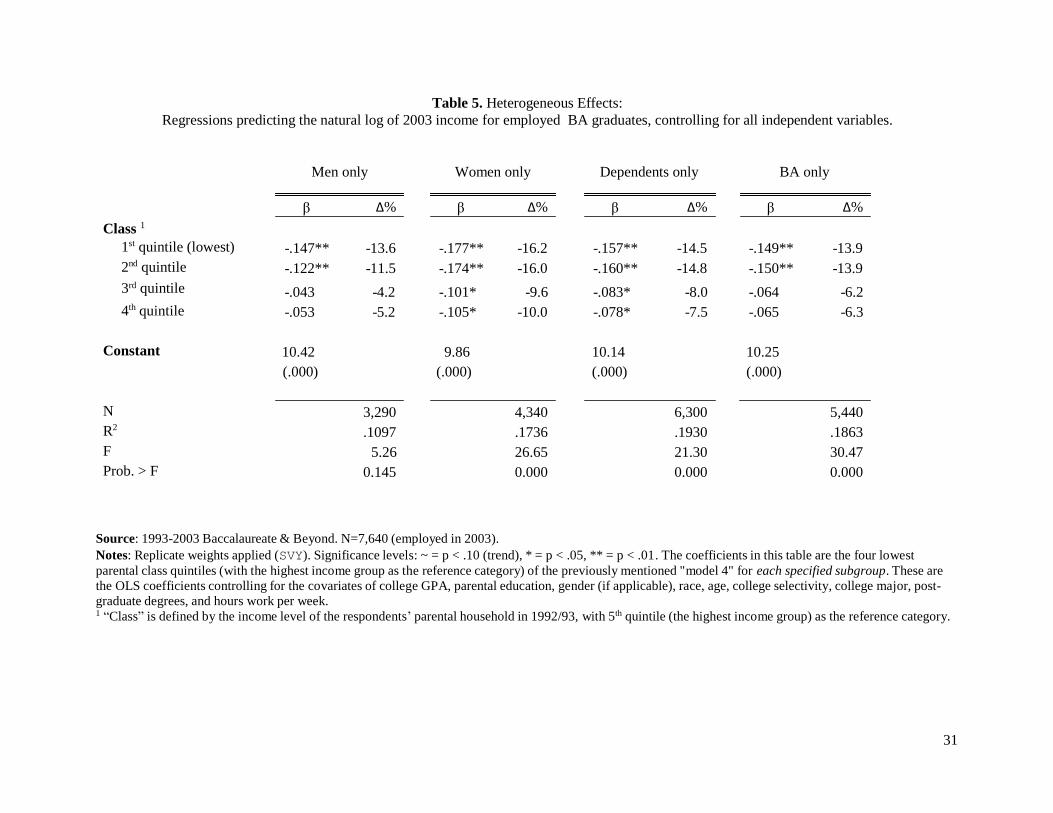
Heterogeneous effects
Sample sizes allowed us to estimate separate models for certain subgroups. As Table 5 shows,
disaggregating by gender indicated that a lower class family background remained a significant
predictor of lower income ten years after graduation both for men (a 13.6 percent pay gap for the
lowest family quintile after all controls) and for women (a 16.2 percent gap).
[Table Five about here]
Undertaking a separate analysis for those students who were financially dependent upon
their parents shortly before graduation revealed that the lowest two class quintiles have
statistically significant income gaps of 14.5 percent and 14.8 percent compared to the highest
class quintile. However, our model for predicting income for the subset of students who were
financially independent prior to graduation showed no significant parental background effects.
In those less typical cases, the “income” variable did not refer to parental income but to the
student’s personal household income.
Finally, analyzing a restricted sample containing only students who went no further than a
bachelor’s degree (i.e., omitting higher degrees) showed significant class-related income gaps
(13.9 percent for the two lowest class quintiles) after other factors were controlled for. Although
prior research makes it clear that a high family SES is associated with higher education beyond
the BA, this particular analysis shows that class-related income gaps are not simply reflections of
duration of higher education: the gaps exist even among those who go no farther than the

10
baccalaureate.
Proximal Effects
The class-related pay gaps discussed so far were only modestly reduced after adding controls for
demographics, high school and college performance, major, college selectivity, and higher
degrees. We thought these would prove to be important mediating factors, but the findings
suggest otherwise. They are associated with earnings but do not account for the family
background gap in graduates’ earnings. What then explains the substantial pay penalties
experienced by baccalaureates from lower class families?
According to a succession of theorists including Collins(1979), Tilly(1999) and Weeden
(2002), privileged status groups monopolize jobs in the most lucrative occupations and industrial
locations (‘economic niches’), though processes that are partly based on their greater opportunity
to obtain sought-after educational credentials, and partly through the ability of those from their
status group already in those niches to effect social closure through hiring processes. For
example, Kanter (1977) described how those who hire in corporations undertake what she calls
“homosocial reproduction” -- choosing to hire persons with similar social backgrounds as
themselves. Fiske (1998) showed that this social bias can occur through non-conscious processes
by which we overrate the competence and efficacy of persons from our in-group while
underestimating the competence of persons outside of our group. In addition, researchers who
have studied job search and hiring processes have documented the importance of social networks
for finding a job, and have shown how higher status groups have better access to those kinds of
networks (Granovetter, 1995; Royster, 2003; Smith, 2007). Taken together, this body of research
implies that social class origins will influence the occupation, sector, and industry in which
graduates find employment, with those from economically privileged backgrounds
disproportionately obtaining jobs in the better paying niches.
Using 2000 Census data we calculated the median income for 400 economic niches in
which the B&B graduates were employed. We then added that income measure for one’s niche
to the earlier income attainment model. To the extent that social background affects the
distribution of graduates across niches, this niche measure should mediate the effects of
background on 2003 earnings. If that were true, then adding that niche measure should greatly
reduce the magnitude of the previous coefficient for family background.
[Table 6 about here]

11
Table 6 (second column) displays the class origin coefficients after adding the niche
measure and controlling for all other predictors. Both the covariates and the p-values indicate
that niche did not account for the family background effect: the family origin coefficient was not
much reduced, compared to column 1.
As an alternative hypothesis about the proximal mediating factor behind lower earnings,
we calculated the ratio of a graduate’s income to the median income for BAs in the niche in
which that graduate works. This represents the graduate’s income relative to others in that niche.
We found that this niche measure was associated with family background: the less advantaged
one’s family, the lower one’s income relative to the norm for employees in one’s niche. Adding
this measure to the earlier income attainment model, did reduce the coefficient for family
background considerably, from 14.7% to 9.5%. (See third column in Table 6.) In column four of
Table 6, both aspects of niches are included together in the model. The disadvantage of a low
class family background drops from 14.7% to 6.4%. We conclude that the disadvantage of low
social class background is mainly associated with having a lower income relative income to
others within one’s occupational/industry niche rather than to the distribution of graduates from
different class origins across niches.
Conclusion
Prior research reported that family background did not affect earnings and other outcomes
among BA holders, and this finding led researchers to argue that “a college degree fulfills the
promise of meritocracy.” The analyses presented in this paper challenge that upbeat conclusion.
Family background casts a long shadow over income attainment in a dataset that followed a
representative sample of baccalaureate graduates for ten years after graduation. Even when
individuals from lower-income families do manage to complete a baccalaureate degree, against
the odds, they earn substantially lower salaries than graduates from more affluent families, ten
years after graduation. Graduates’ pay is related to the selectivity of the college they attended,
and to their major, and to their academic performance on tests and college GPA. However, those
factors do not erase the pay gap associated with disadvantaged family background, which
persists over and above those factors. Even those students from disadvantaged backgrounds who
graduate from the most selective colleges, earn less than their classmates.

12
The earnings gap is not explained by the economic niche where a graduate works, after
controlling for issues such as college major and college selectivity. Instead it seems to be the
case than graduates from lower class families, ten years after graduation, are earning less than
others with similar educational attainment who work in the same occupation-industry niche.
Our analyses cannot reveal why our findings diverge from earlier studies. Data sources,
sample size, and analytical methods differ. It is possible that with the expansion of college-
going, new stratification processes have emerged that were not apparent when college-going
was more closely associated with affluent families. However, our findings strongly suggest that
stratification scholars should reconsider their understanding of class-based inequalities among
the college-educated. Prior conclusions that a college degree could overcome disadvantaged
origins may remain true for exceptional individuals, but appear no longer accurate in general
for baccalaureate graduates from disadvantaged family backgrounds.

13
References Bailey, Martha J. and Susan M. Dynarski. 2011. “Inequality in Postsecondary Education”
Chapter Six in Greg J. Duncan and Richard J. Murnane (eds) Whither Opportunity: Rising
Inequality, Schools, and Children’s Life Chances. New York: Russell Sage Foundation.
Collins, Randall. 1979. The Credential Society: An historical sociology of education and
Stratification. New York: Academic.
Cunha, Flavio and James J. Heckman. 2007. “The Technology of Skill Formation>” American
Economic Review 97(1):31-47.
Dale, Stacey and Alan Krueger. 2011. “Estimating the Returns to College Selectivity over the
Career, Using Administrative Earnings Data.” NBER Working Paper #17159. June 2011.
Cambridge MA: National Bureau of Economic Research.
DiPrete, Thomas A, and Gregory Eirich. 2011. Cumulative Advantage as a mechanism for
Inequality: A Review of Theoretical and Empirical Developments.” Annual Review of Sociology
32:271-97.
Downey, Douglas B.; von Hippel, Paul T.; Broh, Beckett A. 2004. Are Schools the Great
Equalizer? Cognitive Inequality during the Summer Months and the School Year. American
Sociological Review, 69(5), 613-635.
Duncan, Greg J. and Katherine Magnuson. 2011. “The Nature of Early Achievement Skills,
Attention Skills, and Behavior Problems.” Chapter 3 in Greg J. Duncan and Richard J. Murnane
(eds) Whither Opportunity: Rising Inequality, Schools, and Children’s Life Chances. New York:
Russell Sage Foundation.

14
Duncan, Greg J. and Richard J. Murnane. 2011. “Introduction: The American Dream, Then and
Now.” Chapter 1 in Greg J. Duncan and Richard J. Murnane (eds) Whither Opportunity: Rising
Inequality, Schools, and Children’s Life Chances. New York: Russell Sage Foundation.
Fiske, Susan. (1998). “Stereotyping, prejudice, and discrimination”. In D. T. Gilbert, S. T. Fiske,
& G. Lindzey (Eds.), Handbook of social psychology (4th ed., Vol. 2, pp. 357-411). New York:
McGraw-Hill.
Granovetter, Mark. 1995. Getting a Job. (Second edition). Chicago: Universityof Chicago Press. Hart, Betty and Todd R. Risley. 1995. Meaningful Differences in the Everyday Experience of
Young American Children: The Everyday Experience of One and Two Year Old American
Children. Baltimore MD: Paul H. Brookes Pub Co.
Heyns, Barbara. 1978. Summer Learning and the Effects of Schooling. New York: Academic
Press.
Hochschild, Jennifer. 1995. Facing Up to the American Dream: Race, Class, and the Soul of the
Nation. Princeton NJ: Princeton University Press.
Kanter, Rosabeth. 1977. Men and Women of the Corporation. New York: basic Books.
Kaushal, Neeraj, Katherine Magnuson and Jane Waldfogel. 2011. “How Is Family Income
Related to Investments in Children’s Learning?” Chapter 9 in Greg J. Duncan and Richard J.
Murnane (eds) Whither Opportunity: Rising Inequality, Schools, and Children’s Life Chances.
New York: Russell Sage Foundation.
Lee, Valerie E. and David T. Burkam. 2002. Inequality at the Starting Gate: Social Background
Differences in Achievement as Children Begin School. Washington DC: Economic Policy

15
Institute.
Lewin, Tamar. 2012. “Obama Wades Into Issue of Raising Dropout Age” New York Times January 25th 2012. Downloaded from: http://www.nytimes.com/2012/01/26/education/obama-
wades-into-issue-of-raising-dropout-age.html?_r=0
Loury, Linda Datcher and David Garman. 1995. “College Selectivity and Earnings.” Journal of
Labor Economics 13(2) April:298-308.
Lucas, Samuel Roundfield. 1999. Tracking Inequality: Stratification and Mobility in American
High Schools. New York: Teachers College Press.
Lucas, Samuel Roundfield. 2001. “Effectively Maintained Inequality: Educational Transitions,
Track Mobility, and Social Background Effects” American Journal of Sociology 106(6):1642-90.
Raftery, Adrian and Michael Hout. 1999. “Maximally Maintained Inequality: Expansion,
Reform, and Opportunity in Irish Education, 1921-75.” Sociology of Education. 66(1):41-62.
Royster, Deidre. 2003. Race and the Hidden Hand. Berkeley: University of California Press.
Rumberger, Russell. 2004. “Why Students Drop Out of School.” Pp. 131–55 in Dropouts in
America: Confronting the Graduation Rate Crisis, edited by Gary Orfield. Cambridge, MA:
Harvard Education Publishing Group.
Shavit, Yossie, Richard Arum and Adam Gamoran. 2007. Stratification in Higher Education: A
Comparative Study. Stanford CA: Stanford University Press.
Tilly, Charles. 1998. Durable Inequality. Berkeley: University of California Press. Smith, Sandra. 2007. Lone Pursuit: Distrust and Defensive Individualism among the Black Poor.
New York: Russell Sage Press.

16
Tilly, Charles. 1999. Durable Inequality. Berkeley: University of California Press.
Torché, Florencia. 2011. “Is a College Degree Still the Great Equalizer? Intergenerational
Mobility across Levels of Schooling in the United States” American Journal of Sociology
117(3):763-807.
Torché, Florencia. 2014. “Does College Still Have Equalizing Effects?” Pp.578-586 in David
Grusky (ed.) Social Stratification. 4th Edition. Westview Press.
Tufte, Edward. 1974. Data Analysis for Politics and Policy. NY: Prentice Hall.
White House. 2014. “White House Agenda on Higher Education.” Downloaded from
http://www.whitehouse.gov/issues/education/higher-education
Weeden, Kim. 2002. “Why Do Some Occupations Pay More Than Others? Social Closure and
Earnings Inequality in the United States” The American Journal of Sociology, Vol. 108, No. 1
(Jul., 2002), pp. 55-101
Wine, J.S., Cominole, M.B., Wheeless, S., Dudley, K., and Franklin, J. (2005). 1993/03
Baccalaureate and Beyond Longitudinal Study (B&B:93/03) Methodology Report (NCES 2006–
166). U.S. Department of Education. Washington, DC: National Center for Education Statistics.

17
Table 1. Distribution of College Selectivity: 1993 4-year BA graduates, employed in 2003.
College selectivity
count %
most competitive 230 3.1
highly competitive 490 6.3
very competitive 1,880 24.5
competitive 3,170 41.5
less competitive 1,120 14.7
noncompetitive 400 5.3
special 20 0.3
no selectivity measure 330 4.4
7,740 100.0
Source: 1993-2003 Baccalaureate & Beyond. Unweighted N=7,640 (employed in 2003).
Notes: Institution’s selectivity is based on Barron’s Profile of American College 1992. The frequencies are rounded
to the nearest ten.

18
Table 2. Descriptive Statistics: 4-year BA graduates of 1993, employed in 2003.
mean st. error
Class (1992/1993 household income)
$46,030
$590
College GPA
3.07
.006
Age (2003)
35.7
.069
Hours work per week (2003)
42.9
.147
College selectivity 1
proportion st. error
most selective .0305 .0020
highly selective .0634 .0029
very selective .2453 .0049
selective .4147 .0056
less selective .1465 .0040
non-selective .0526 .0026
special education .0031 .0006
no selectivity score .0439 .0023
Class * College selectivity (interactions) 2
low class * low selectivity .0980 .0034
low class * medium selectivity .1453 .0040
low class * high selectivity .0900 .0033
middle class * low selectivity .0933 .0033
middle class * medium selectivity .1433 .0040
middle class * high selectivity .0968 .0034
high class * low selectivity .0548 .0026
high class * medium selectivity .1261 .0038
high class * high selectivity .1524 .0041
Parents’ highest degree
less than high school .0383 .0022
high school .3137 .0053
associate / some college .1791 .0044
BA and higher .4689 .0057
Gender
male .4312 .0057
female .5688 .0057

19
Race
White .8516 .0041
Black .0542 .0026
Hispanic .0445 .0024
Asian .0385 .0022
American Native .0059 .0009
Other .0054 .0008
Independent student (1992/1993)
.1744
.0043
College major
Social Sciences .2828 .0052
STEM .2106 .0047
Business .1428 .0040
Education .1594 .0042
Other .2044 .0046
Obtained MA or higher 3
.2862
.0052
SAT / ACT score 4
1st quartile (lowest) .1991 .0046
2nd quartile .2166 .0047
3rd quartile .2155 .0047
4th quartile .1949 .0045
did not take SAT / ACT .1739 .0043
Source: 1993-2003 Baccalaureate & Beyond. Unweighted N=7,640 (employed in 2003).
Notes: 1 Barron’s Profile of American Colleges selectivity measure (1992). 2 Each category refers to a combination of the two three-way split variables, whereby ‘class’ is defined by the
household income level of 1992/93 and the categories of ‘college selectivity’ were created with Barron’s 1991
selectivity measure: a low category (less competitive, noncompetitive, and special education), a medium category
(competitive), and a high category (very competitive, highly competitive, and most competitive). 3 These degrees include MA’s, LLM’s, JD’s, MBA’s, PhD’s, and other post-graduate credentials. 4 The quartile score on either the SAT or the ACT is the most detailed comprehensive measure provided by NCES in
the 1993-2003 Baccalaureate & Beyond.
25
Model 1 Model 2 Model 3 Model 4
β Δ% β Δ% β Δ% β Δ%
ass 1
1st quintile (lowest)
-.216**
-19.5
-.191**
-17.4
-.156**
-14.5
-.158**
-14.7
2nd quintile -.208** -18.7 -.180** -16.5 -.145** -13.5 -.148** -13.8
3rd quintile -.125** -11.8 -.095** -9.1 -.070* -6.7 -.072* -6.9
4th quintile -.105** -10.0 -.103** -9.7 -.093** -8.9 -.078* -7.5
Table 3. Regression predicting the natural log of 2003 income for employed BA graduates.
Cl
Parents’ highest degree 2
less than high school -.002 -0.2 .011 1.1 .017 1.8
associate / some college -.017 -1.7 -.025 -2.5 -.021 -2.1
BA and higher -.014 -1.3 -.014 -1.4 -.022 -2.1
College GPA .000 0.0 .000 0.0 .000 0.0
Age in 2003
Gender
-.003 -0.3 -.001 -0.1 -.001 -0.1
female -.341** -28.9 -.298** -25.8 -.201** -18.2
Race 3
Black
.073*
7.6
.046
4.7
.039
4.0
Hispanic .047 4.8 .034 3.5 .025 2.5
Asian .029 2.9 .000 0.0 -.004 -0.4
26
American Native
Other
.183
-.140
20.1
-13.1
.178
-.126
19.5
-11.8
.130
-.181
13.9
-16.6
SAT / ACT score 4
1st quartile (lowest) -.113** -10.6 -.034 -3.3 -.027 -2.7
2nd quartile -.064* -6.2 -.008 -0.8 .000 0.0
3rd quartile -.015 -1.5 .024 2.5 .026 2.6
did not take SAT / ACT -.086~ -8.2 -.044 -4.3 -.030 -3.0
Independent in 1992/1993
-.039
-3.9
-.032
-3.2
-.039
-3.9
College selectivity 5
highly selective -.012 -1.2 .002 0.2
very selective -.059 -5.7 -.032 -3.1
selective -.100 -9.6 -.070 -6.7
less selective -.180** -16.5 -.157** -14.5
non-selective -.136~ -12.7 -.106 -10.1
special education -.071 -6.9 .043 4.4
no selectivity score -.134 -12.6 -.077 -7.4
Major 6
STEM .155** 16.8 .146** 15.7
Business .198** 21.9 .180** 19.8
Education -.137** -12.8 -.147** -13.7
Other .166** 18.1 .175** 19.1
Obtained MA or higher 7
.120**
12.7
.095**
10.0
Hours work per week
.015**
1.5

27
Constant 10.87 11.10 10.94 10.19
(.000) (.000) (.000) (.000)
N 7,640 7,640 7,630 7,640
R2 .0132 .0837 .1180 .1882
F 69.12 24.07 35.78 69.12
Prob. > F 0.000 0.000 0.000 0.000
Source: 1993-2003 Baccalaureate & Beyond. N=7,640 (employed in 2003).
Notes: Replicate weights applied (SVY). Significance levels: ~ = p < .10 (trend), * = p < .05, ** = p < .01. 1 “Class” is defined by the income level of the respondents’ parental household in 1992/93, with 5th quintile (the highest income group) as the reference category. 2 The reference category is “high school”. 3 The reference category is “white”. 4 The reference category is “4th quartile” (the highest scores on the SAT or ACT). 5 Barron’s selectivity was used (see Data & Methods section), with “most competitive” as the reference category. 6 The reference category is “social sciences”. 7 These degrees include MA’s, LLM’s, JD’s, MBA’s, PhD’s, and other post-graduate credentials.

28
Model 1 Model 2 Model 3 Model 4
β Δ% β Δ% β Δ% β Δ%
ass * College selectivity 1
low class * low selectivity
-.331**
-28.2
-.259**
-22.8
-.233**
-20.8
-.235**
-21.0
low class * medium selectivity -.199** -18.1 -.164** -15.1 -.157** -14.5 -.150** -13.9
low class * high selectivity -.126** -11.9 -.096* -9.2 -.080~ -7.7 -.059 -5.7
middle class * low selectivity -.212** -19.1 -.136** -12.8 -.128** -12.0 -.104** -9.8
middle class * medium selectivity -.153** -14.1 -.094* -8.9 -.088* -8.4 -.076~ -7.3
middle class * high selectivity -.050 -4.9 -.028 -2.7 -.024 -2.4 -.023 -2.2
high class * low selectivity -.144** -13.4 -.074 -7.2 -.098~ -9.4 -.075 -7.2
high class * medium selectivity -.075* -7.3 -.033 -3.3 -.035 -3.5 -.014 -1.4
Table 4. Regression predicting the natural log of 2003 income for employed BA graduates.
Class origins by college selectivity
Cl
Parents’ highest degree 2
less than high school .004 0.4 .009 0.9 .017 1.7
associate / some college -.022 -2.2 -.026 -2.6 -.022 -2.2
BA and higher -.010 -1.0 -.005 -0.5 .012 -1.2
College GPA .000 0.0 .000 0.0 .000 0.0
Age in 2003
-.002
0.2
-.001
-0.1
-.001
-0.1
Gender
female
-.340**
-28.8
-.298**
-25.7
-.200**
-18.1
Race 3
Black
.071*
7.3
.040
4.1
.031
3.1
29
Hispanic .048 5.0 .037 3.7 .029 2.9
Asian .021 2.2 .005 0.5 .000 0.0
American Native .180 19.7 .170 18.5 .121 12.8
Other -.169 -15.5 -.143 -13.3 -.197 -17.8
SAT / ACT score 4
1st quartile (lowest) -.087* -8.3 -.048 -4.7 -.042 -4.1
2nd quartile -.049 -4.8 -.021 -2.1 -.013 -1.3
3rd quartile -.011 -1.1 .012 1.2 .016 1.7
did not take SAT / ACT -.069 -6.7 -.058 -5.7 -.042 -4.1
Independent in 1992/1993
-.039
-3.8
-.032
-3.1
-.038
-3.8
Major 5
STEM .151** 16.3 .141** 15.2
Business .194** 21.4 .175** 19.2
Education -.142** -13.3 -.153** -14.2
Other .163** 17.7 .172** 18.8
Obtained MA or higher 6
.123**
13.1
.097**
10.2
Hours work per week
.015**
1.5
Constant 10.87 11.04 10.86 10.13
(.000) (.000) (.000) (.000)
N 7,640 7,640 7,630 7,640
R2 .0184 .0849 .1155 .1863
F 7.81 30.98 61.39 58.72
Prob. > F 0.000 0.000 0.000 0.000

30
Source: 1993-2003 Baccalaureate & Beyond. N=7,640 (employed in 2003).
Notes: Replicate weights applied (SVY). Significance levels: ~ = p < .10 (trend), * = p < .05, ** = p < .01. 1 Here, “class” is defined by the income level of the respondents’ respondents’ parental household in 1992/93. Barron’s selectivity was used to create a low category (less competitive, noncompetitive, and special education), a medium category (competitive), and a high category (very competitive, highly competitive,
and most competitive). Each category refers to a combination of the two three-way split variables, with the “high class * high selectivity” as the reference
category. 2 The reference category is “high school”. 3 The reference category is “white”. 4 The reference category is “4th quartile” (the highest scores on the SAT or ACT). 5 The reference category is “social sciences”. 6 These degrees include MA’s, LLM’s, JD’s, MBA’s, PhD’s, and other post-graduate credentials.
31
Table 5. Heterogeneous Effects:
Regressions predicting the natural log of 2003 income for employed BA graduates, controlling for all independent variables.
Men only Women only Dependents only BA only
Class 1
β Δ% β Δ% β Δ% β Δ%
1st quintile (lowest) -.147** -13.6 -.177** -16.2 -.157** -14.5 -.149** -13.9
2nd quintile -.122** -11.5 -.174** -16.0 -.160** -14.8 -.150** -13.9
3rd quintile -.043 -4.2 -.101* -9.6 -.083* -8.0 -.064 -6.2
4th quintile -.053 -5.2 -.105* -10.0 -.078* -7.5 -.065 -6.3
Constant 10.42 9.86 10.14 10.25
(.000) (.000) (.000) (.000)
N 3,290 4,340 6,300 5,440
R2 .1097 .1736 .1930 .1863
F 5.26 26.65 21.30 30.47
Prob. > F 0.145 0.000 0.000 0.000
Source: 1993-2003 Baccalaureate & Beyond. N=7,640 (employed in 2003).
Notes: Replicate weights applied (SVY). Significance levels: ~ = p < .10 (trend), * = p < .05, ** = p < .01. The coefficients in this table are the four lowest
parental class quintiles (with the highest income group as the reference category) of the previously mentioned "model 4" for each specified subgroup. These are
the OLS coefficients controlling for the covariates of college GPA, parental education, gender (if applicable), race, age, college selectivity, college major, post-
graduate degrees, and hours work per week. 1 “Class” is defined by the income level of the respondents’ parental household in 1992/93, with 5th quintile (the highest income group) as the reference category.

32
Table 6.
Regression on the natural log of 2003 income of 1993 4-year BA graduates, among employed – controlling for all independent variables and salary
in combined occupation / industry niche (median).
Column 1
controls (except
niches)
Column 2 controls
+ between niches
Column 3
controls + within
niches
Column 4 controls
+ between and
within niches
β Δ% β Δ% β Δ% β Δ%
Class 1
1st quintile (lowest)
-.158**
-14.7
-.147**
-13.7
-.100**
-9.5
-.066*
-6.4
2nd quintile -.148** -13.8 -.156** -14.5 -.114** -10.8 -.091** -8.7
3rd quintile -.072* -6.9 -.082* -7.9 -.055* -5.3 -.059* -5.8
4th quintile -.078* -7.5 -.086* -8.2 -.067* -6.5 -.053* -5.2
Constant 10.87 9.80 9.64 9.06
(.000) (.000) (.000) (.000)
N 7,640 6,240 6,240 6,240
R2 .1882 .2142 .4286 .5370
F 69.12 47.37 40.90 82.28
Prob. > F 0.000 0.001 0.001 0.002
Sources: 1993-2003 Baccalaureate & Beyond, N=7,640 (employed in 2003). For industry/occupation mean: 5% sample of the 2000 Census, N=1,574,410
(employed BA graduates).
Notes: Replicate weights applied (SVY). Significance levels: ~ = p < .10 (trend), * = p < .05, ** = p < .01. These are the OLS coefficients controlling for the
covariates of college GPA, parental education, gender (if applicable), race, age, college selectivity, college major, post-graduate degrees, hours work per week, and industry/occupation niche (median for each of the 400 categories) 1 “Class” is defined by the income level of the respondents’ parental household in 1992/93, with 5th quintile (the highest income group) as the reference category.