class of 2017 annual report - ed.stanford.edu · and analyzing data, conducting interviews and...
TRANSCRIPT

CLASS OF 2017 ANNUAL REPORT
KnowThyself
Connect with
the Players
Game Plan
Execute Your
Expl
ore th
e
Lan
dsca
pe

Table of Contents
Introductory Letter .................................................................................................................................... 1
Class of 2017 Profile ................................................................................................................................... 2
Beyond Numbers ....................................................................................................................................... 4
STEP Graduates .......................................................................................................................................... 6
STEP Hiring Organizations .......................................................................................................................... 7
MA Graduates (Non-STEP) ......................................................................................................................... 8
MA Hiring Organizations & Titles ............................................................................................................. 10
MA Internship Organizations ................................................................................................................... 11
PhD Graduates ......................................................................................................................................... 12
PhD Hiring Organizations & Titles ............................................................................................................ 13
Employment Locations ............................................................................................................................ 14
Methodology ............................................................................................................................................ 16

1
Introductory Letter
Dear Education Community,
Introductory Letter
We are pleased to share our Class of 2017 Annual Report with you. We first released this report with the Class of 2011, and the invaluable information we have since gathered has served many purposes and populations. With several years of data captured, current students use this information to find organizations that offer internships, and to broaden their thinking about different education industries and specific roles. This allows them to explore the landscape of education and make more informed choices regarding organizations and positions they hope to pursue upon graduation. Alumni and employers have shared that they enjoy reading this report because it helps them understand how the field and its industries are changing, through the different organizations and roles listed as well as the choices our graduates are making in pursuing certain industries. More recently, the data we collect in this report have been used in the recruitment of and outreach to prospective GSE students. By referencing employment industries and placement percentages from this report, prospective students benefit from a clear picture of the diverse career trajectories and possibilities available to them as graduates of Stanford GSE. This report would not be possible without our critical EdCareers partners. Our research assistants, Nadine Skinner and Gabriela Gavrila, contributed countless hours to designing the survey, collecting and analyzing data, conducting interviews and drafting the report itself. The alumni featured in this report provided additional insights into their own career paths beyond the data. We would also like to thank our partners: Krysten Crawford for editing this report, and our collaborations with GSE IT and the communication office, which resulted in the powerful infographics and press release that complement this report. We are very impressed with the breadth of career paths our 2017 graduates pursued, both in industries and geographic areas. We invite you to read the entire report, and if you ever find yourself looking for talent in the education space for early career and/or more experienced positions, you may always share your opportunities with our students and alumni at edcareers.stanford.edu. Sincerely, Nereyda Salinas, Executive Director Jennifer Mason, Associate Director

2
Class of 2017 Profile
Class of 2017 Profile
The Class of 2017 included 202 Master's and PhD graduates. We know the employment status of 97 percent of them. They pursued a variety of degrees, which led to new career opportunities at 136 organizations around the world, representing over 10 sub-sectors within education (see breakdown below):
Education, Public (Non-Charter) PreK-1254%
Education, Public (Charter) PreK-12
8%
Education, Private PreK-12
1%
Faculty & Postdoc
13%
Education Technology5%
Management Consulting
3%Higher Education Administration
2%
International Development
2%Philanthropy1%
Supplementary Education Services
1%Education Research (think tanks or other
research organizations)9%
Education Policy1%
CLASS OF 2017INDUSTRY BREAKDOWN
3
Class of 2017 Profile
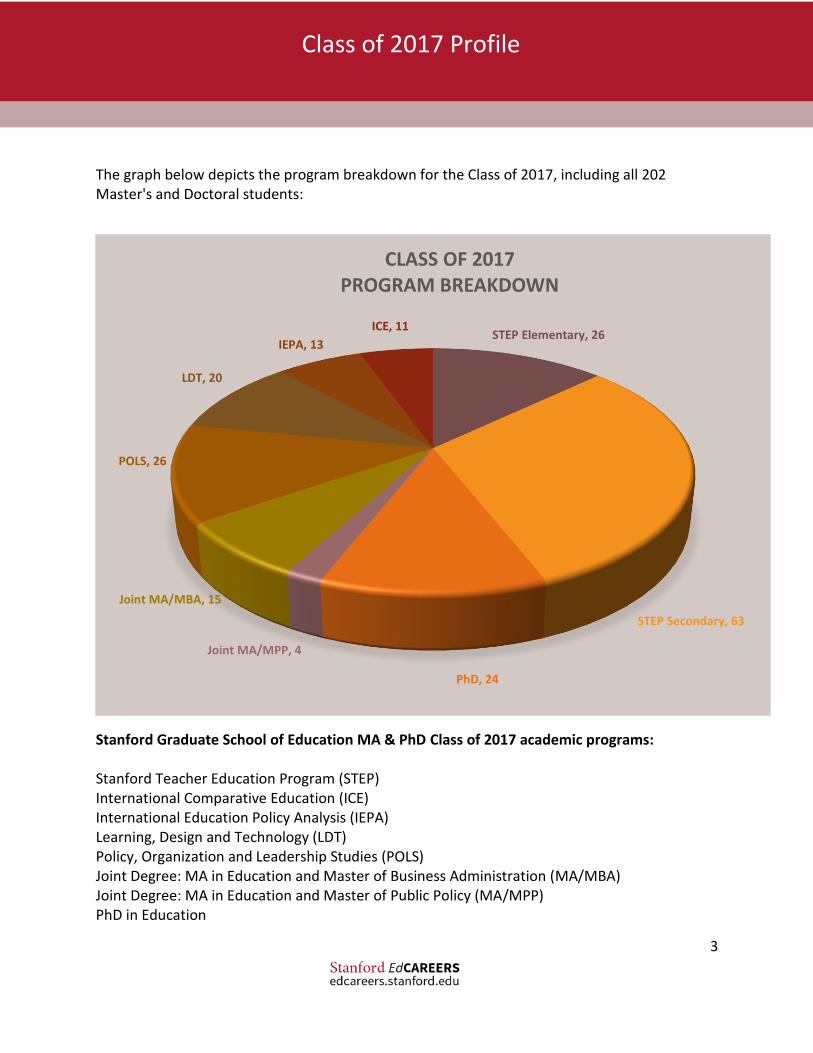
The graph below depicts the program breakdown for the Class of 2017, including all 202 Master's and Doctoral students:
Stanford Graduate School of Education MA & PhD Class of 2017 academic programs: Stanford Teacher Education Program (STEP) International Comparative Education (ICE) International Education Policy Analysis (IEPA) Learning, Design and Technology (LDT) Policy, Organization and Leadership Studies (POLS) Joint Degree: MA in Education and Master of Business Administration (MA/MBA) Joint Degree: MA in Education and Master of Public Policy (MA/MPP) PhD in Education
STEP Elementary, 26
STEP Secondary, 63
PhD, 24
Joint MA/MPP, 4
Joint MA/MBA, 15
POLS, 26
LDT, 20
IEPA, 13
ICE, 11
CLASS OF 2017 PROGRAM BREAKDOWN

4
Beyond Numbers
Beyond Numbers
The Class of 2017 report shows that the majority of GSE graduates accepted offers within four months of graduation (see next sections for placement rates by program) from institutions throughout the country and around the world. The following testimonials provide additional insights into successful career planning strategies and possible trajectories after GSE.
Valuing the Academic and the Practical Some graduates knew clearly what job they were looking for, while others had a general idea and were able to narrow their search based on desired location and other personal preferences. Rafael Pérez-Segura, a STEP Elementary graduate who works as a teacher (kindergarten, Spanish dual language) at the Heketi Community Charter School in New York City, N.Y., shared his approach. He searched for “a progressive school that also had a critical pedagogy component to its curriculum" and a place where "it was clear that teachers and administration valued both the intellectual and practical aspects of teaching.”
Thinking Broadly About Impact While 77 percent of the Class of 2017 respondents were working in the field of education post-graduation, others were able to leverage their skills and knowledge elsewhere. Even those who ended up working in other fields often reported maintaining an education focus. For example, Sonia Doshi is an LDT MA graduate who works as a learning science and design analyst for Los Angeles-based startup Imbellus. While keeping in mind her “background and interest in creating user-centered experiences," she conducted a broad job search. “I didn’t limit myself to education-based companies, given the industries prevalent in my desired location," she said. "Instead, I focused on mission-based companies.” During the recruiting process, Imbellus created a role for Sonia that allowed her to work in both learning science and design, which was a perfect blend given her prior work experience.
Crafting Relationships and Ideas Many 2017 graduates engaged in internships, practicums or other professional experiences while earning their academic degree (see MA section for sample internships and organizations). Informational interviews were also invaluable for connecting to the industry and for gaining a better understanding of job opportunities. Nicole Hensel, a joint MA/MPP graduate who works as a senior program manager of strategic literacy initiatives for Denver Public Schools, credits informational interviews with helping her craft a career plan that led to a summer fellowship and eventual job offer. When reflecting on pivotal moments during her education, Nicole spoke of the importance of building relationships within and outside the GSE community.
“I didn’t limit myself to education-based companies…Instead, I focused on mission-based companies, more broadly.”

5
Beyond Numbers
Strategic Career Moves Many Class of 2017 graduates received multiple job offers, which presented them with opportunities to make strategic career decisions. Christopher Doss, a PhD graduate who works as Associate Policy Researcher for RAND Corporation in Washington D.C., also recognized the importance of maintaining a varied network including faculty, peers and alumni. He, too, relied heavily on informational interviews: “I was constantly thinking of questions that could only be answered by people who have been through the process, and each person I talked to was more than generous with their time.” When deciding between competing job offers, Chris focused on advancement prospects (medium and long-term), and Sonia Doshi of Imbellus considered “the type of work, culture fit, location, potential for growth, salary and benefits, in that order.”
As evidenced through these and other testimonials, the impact of GSE graduates is far-reaching. For personal or strategic reasons (or a combination of the two), they chose to work in a variety of places and settings, and often ventured far from where they had lived or studied previously — from Sonia in Los Angeles and Nicole in Denver to Rafael in New York and Chris in Washington D.C.
Bridging Academic Knowledge to Practice Our graduates also spoke of the importance of connecting their academic knowledge to the professional world. When asked about practical skills, ideas or knowledge learned at Stanford, Sonia highlighted the interdisciplinary framework she developed while taking “project-based and design-focused classes through Stanford GSE and the d.school." Said Rafael: “Most of all, I have taken with me the idea that as long as there is thought put into my practice, I’m doing right by my kids.” For his part, Chris discovered the value of lifelong learning: “I use the skills I learned in my classes and in my research every day. The ability to work with academic institutions and practitioner-based partners was something that I cultivated during my time at Stanford and something that I use every day. Perhaps most importantly, I learned how to keep learning…and that is probably the most valuable skill I use daily.”
“I was constantly thinking of questions that could only be answered by people who have been through the process, and each person I talked to was more than generous with their time.”
“I learned how to keep learning…and that is probably the most valuable skill I use daily.”

6
STEP Graduates
STEP Graduates
The Stanford Teacher Education Program (STEP) is a nationally renowned, full-time, 12-month program that prepares future teachers at the elementary and secondary levels. STEP leads to a Master of Arts in Education and a California teaching credential. The program also requires a 12-month teaching practicum. Graduates of STEP Elementary earn a California preliminary multiple-subject teaching credential, and those of STEP Secondary receive a California preliminary single-subject teaching credential in English, Mathematics, History/Social Sciences, Science or World Languages. In 2017, the STEP program graduated 89 students (26 Elementary/63 Secondary). We know the employment placement of 100 percent of them:
99 percent were employed and 1 percent were pursuing further studies.
100 percent of those employed received an offer within four months of graduating.
64 percent of those employed had received two or more job offers.
99 percent were employed in the field of education.
96 percent worked primarily as classroom teachers.
95 percent indicated they were employed in their desired geographic location.
76 percent were working in California. The median yearly full-time salary of STEP graduates was $57,000, with a range of $38,700-$79,162.1
1 Most teacher salaries are set by districts and not negotiated on an individual basis.
Education, Public (Non-
Charter) PreK-1285%
Education, Public (Charter) PreK-1212%
Faculty Position (untenured)
1%
Other2%
STEP EMPLOYMENT BREAKDOWN

7
STEP Hiring Organizations
STEP Hiring Organizations
A.E. Kent Middle School, Kentfield SD2 Addison Elementary, Palo Alto USD3 Albany High School, Albany USD Alliance Academy Middle School, Oakland USD
Ánimo Venice Charter High School, Green Dot PS4 Balboa High School, San Francisco USD Brooklyn Prospect Charter School, New York, NY Benjamin Bubb Elementary School, Mountain View
Whisman SD City Arts & Tech High School, San Francisco USD Columbia Middle School, Sunnyvale Elementary SD Covington Elementary School, Los Altos SD Del Mar High School, Campbell Union HSD5 East Palo Alto Charter School, Aspire Public Schools El Dorado Elementary School, San Francisco USD Elk Grove High School, Elk Grove USD Ellis Elementary School, Sunnyvale Elementary SD (The) Academy – San Francisco @ McAteer, San Francisco
USD (The) English High School, Boston PS Envision Academy of Arts & Technology, Oakland, Calif. Everett Middle School, San Francisco USD Fiesta Gardens International School, San Mateo-Foster
City SD Fremont High School, Fremont Union HSD Gabriela Mistral Elementary, Mountain View Whisman
SD Gateway Middle School, Gateway PS Gililland Middle School, Tempe Elementary SD No3 Gunn High School, Palo Alto USD Heketi Community Charter School, New York, N.Y. Hillsdale High School, San Mateo Union HSD Irvine High School, Irvine USD Isaac Newton Graham Middle School, Mountain View
Whisman SD John Amesse Elementary School, Denver PS June Jordan School for Equity, San Francisco USD Lakeshore Alternative Elementary School, San Francisco
USD Lakewood Elementary, Sunnyvale Elementary SD
Los Altos High School, Mountain View Los Altos HSD Los Robles Dual Immersion Magnet Academy,
Ravenswood City SD Luis Valdez Leadership Academy, San Jose, CA Magnolia High School, Magnolia Independent SD,
Magnolia, TX McKinley School, Pasadena USD McLoughlin Middle School, Vancouver PS Menlo-Atherton High School, Sequoia Union HSD Mission High School, San Francisco USD Monta Loma Elementary, Mountain View Whisman SD Mount Pleasant Elementary STEAM Academy, Mount
Pleasant Elementary SD Mountain View High School, Mountain View Los Altos
HSD Nicholas Senn High School, Chicago PS Northwest High School, Montgomery County PS Oakland International High School, Oakland USD Parkside Elementary School, Pittsburg USD Paul Revere College Preparatory School, San Francisco
USD Philip and Sala Burton Academic High School, San
Francisco USD Pioneer Middle School, Walla Walla PS Raoul Wallenberg High School, San Francisco USD Roses in Concrete Community School, Oakland, CA San Lorenzo High School, San Lorenzo USD San Miguel Elementary School, Sunnyvale Elementary SD San Pedro Elementary School, San Rafael City Elementary
SD Scott Lane Elementary School, Santa Clara USD Skyline High School, Oakland USD Somersworth High School, Somersworth SD Starr King Elementary School, San Francisco USD Sutter Elementary School, Santa Clara USD Thurgood Marshall Academic High School, San Francisco
USD Wilcox High School, Santa Clara USD Winding Springs Elementary, Charlotte-Mecklenberg
Schools Woodside High School, Sequoia Union HSD
2 SD is an abbreviation for School District 3 USD is an abbreviation for Unified School District
4 PS is an abbreviation for Public Schools 5 HSD is an abbreviation for High School District

8
MA Graduates (Non-STEP)
MA Graduates (Non-STEP)
Of 2017's 89 MA students (non-STEP), we know the employment placement rate of 94 percent of them. Graduates earned degrees from the six programs listed below, with topic areas including policy, education management, comparative research and design.
Joint Degree: MA in Education and Master of Public Policy (MA/MPP)
Joint Degree: MA in Education and Master of Business Administration (MA/MBA)
Policy, Organization and Leadership Studies (POLS)
Learning, Design and Technology (LDT)
International Education Policy Analysis (IEPA)
International Comparative Education (ICE)
Joint MA/MPP, 4
Joint MA/MBA, 15
POLS, 26LDT, 20
IEPA, 13
ICE, 11
MA PROGRAM BREAKDOWN

9
MA Graduates (Non-STEP)
We know the employment status of 94 percent of MA graduates (non-STEP). Of those, 82 percent were employed, continuing their education, had started new organizations or were not seeking employment. Below is the employment breakdown of the 56 MA graduates who were hired within four months of graduating (including non-education jobs):
*Organizations categorized as “Other” include Adobe Systems Incorporated, FFL Partners LLC, New Harbor Capital LLC, Creative Leadership Trust, San Francisco Symphony, etc.
85 percent indicated they had accepted a position in their desired geographic location.
58 percent had at least two job offers. MA Salaries**
**Salaries reported in other currencies were converted to US$.
Education, Research18%
Education, Policy
2%
Education, Technology14%
Education, Private PreK-12
2%
Education, Public (Non-
Charter) PreK-12
11%
Education, Public
(Charter) PreK-12
3%
Faculty Positions3%Government
2%
Higher Education Administration
5%
International Development
3%
Management Consulting
9%
Other*23%
Supplementary Education Services
2%
Philanthropy3%
MA EMPLOYMENT BREAKDOWN
MA graduates
(excluding Joint Degrees) Joint Degrees
Median Yearly Full-time Salary $70,000 $107,577
Full-time Salary Range $15,000- $180,000 $30,000- $154,000
10
MA Hiring Organizations & Titles
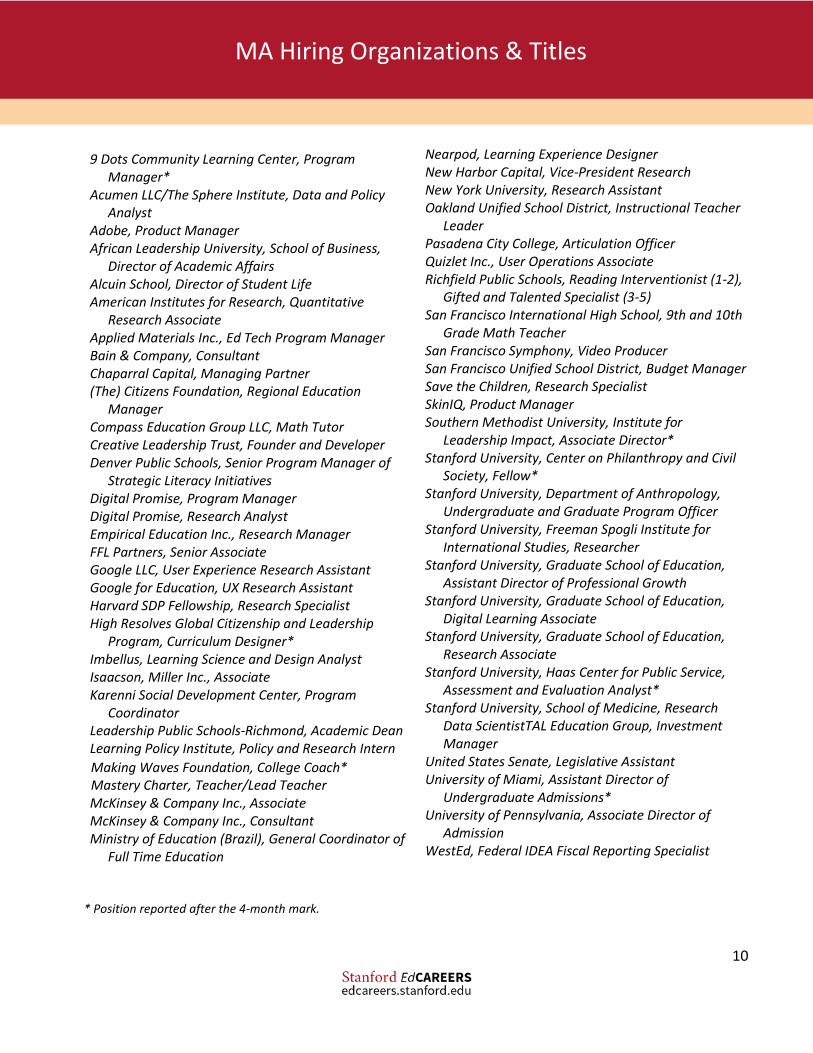
MA Hiring Organizations & Titles
9 Dots Community Learning Center, Program Manager*
Acumen LLC/The Sphere Institute, Data and Policy Analyst
Adobe, Product Manager African Leadership University, School of Business,
Director of Academic Affairs Alcuin School, Director of Student Life American Institutes for Research, Quantitative
Research Associate Applied Materials Inc., Ed Tech Program Manager Bain & Company, Consultant Chaparral Capital, Managing Partner (The) Citizens Foundation, Regional Education
Manager Compass Education Group LLC, Math Tutor Creative Leadership Trust, Founder and Developer Denver Public Schools, Senior Program Manager of
Strategic Literacy Initiatives Digital Promise, Program Manager Digital Promise, Research Analyst Empirical Education Inc., Research Manager FFL Partners, Senior Associate Google LLC, User Experience Research Assistant Google for Education, UX Research Assistant Harvard SDP Fellowship, Research Specialist High Resolves Global Citizenship and Leadership
Program, Curriculum Designer* Imbellus, Learning Science and Design Analyst Isaacson, Miller Inc., Associate Karenni Social Development Center, Program
Coordinator Leadership Public Schools-Richmond, Academic Dean Learning Policy Institute, Policy and Research Intern
Making Waves Foundation, College Coach* Mastery Charter, Teacher/Lead Teacher McKinsey & Company Inc., Associate McKinsey & Company Inc., Consultant Ministry of Education (Brazil), General Coordinator of
Full Time Education
Nearpod, Learning Experience Designer New Harbor Capital, Vice-President Research New York University, Research Assistant Oakland Unified School District, Instructional Teacher
Leader Pasadena City College, Articulation Officer Quizlet Inc., User Operations Associate Richfield Public Schools, Reading Interventionist (1-2),
Gifted and Talented Specialist (3-5) San Francisco International High School, 9th and 10th
Grade Math Teacher San Francisco Symphony, Video Producer San Francisco Unified School District, Budget Manager Save the Children, Research Specialist SkinIQ, Product Manager Southern Methodist University, Institute for
Leadership Impact, Associate Director* Stanford University, Center on Philanthropy and Civil
Society, Fellow* Stanford University, Department of Anthropology,
Undergraduate and Graduate Program Officer Stanford University, Freeman Spogli Institute for
International Studies, Researcher Stanford University, Graduate School of Education,
Assistant Director of Professional Growth Stanford University, Graduate School of Education,
Digital Learning Associate Stanford University, Graduate School of Education,
Research Associate Stanford University, Haas Center for Public Service,
Assessment and Evaluation Analyst* Stanford University, School of Medicine, Research
Data ScientistTAL Education Group, Investment Manager
United States Senate, Legislative Assistant University of Miami, Assistant Director of
Undergraduate Admissions* University of Pennsylvania, Associate Director of
Admission WestEd, Federal IDEA Fiscal Reporting Specialist
* Position reported after the 4-month mark.

11
MA Internship Organizations
MA Internship Organizations
Since 2013, Stanford EdCareers has managed a centralized internship program for GSE students. Internships provide an opportunity for our students to learn about organizations in their areas of interest. During the 2016-17 academic year, 64 percent of MA graduates (non-STEP) indicated that they completed at least one internship. Below is a sample list of hosting organizations:
521 Dimensions LLC African Leadership Academy Better Chinese LLC College Transition Collaborative Education.com Inc. Epic! Forshay Inc FOSS (Full Option Science System) Gakko Inc. Khan Lab School Kidaptive Inc. KIPP Bay Area Schools Leadership Public Schools - Oakland R&D Nearpod Oakland Unified School District Owl Ventures LP Palo Alto Unified School District Policy Analysis for California Education Project Wayfinder Quizlet Inc. Reach Capital RE-ENVISIONED San Francisco Unified School District San Francisco Unified School District - iLab School Services of California Inc. Schoolzilla PBC Square Panda Inc. Stanford: John W. Gardner Center for Youth and
Their Communities Stanford: Lemann Center for Entrepreneurship
and Educational Innovation in Brazil
Stanford: Meta-Research Innovation Center at Stanford
Stanford: Open Learning Initiative at Stanford Stanford Center for Professional Development Stanford Early Life Stress & Pediatric Anxiety
Program Stanford History Education Group Stanford University, Diversity and First-Gen Office Stanford University, Faculty Development and
Diversity Office Stanford University, Graduate School of Business,
MBA Admissions Office Stanford University, Haas Center for Public Service Stanford University, Native American Cultural
Center Stanford University, School of Engineering Stanford University, School of Engineering, Global
Engineering Programs Stanford University, School of Medicine,
Department of Pediatrics Stanford University, Student Activities and
Leadership Stanford University, Transformative Learning
Technologies Lab Tangible Play Inc. TeachAids Ubongo Kids U.S. Department of Veteran Affairs, Palo Alto
Health Care System Virta Health Corp

12
PhD Graduates
PhD Graduates
We know the employment status of 96 percent of 2017's 24 PhD graduates.
91 percent of respondents were employed within four months of graduating.
90 percent of those employed had accepted a position in the field of education.
95 percent indicated they accepted a position in their desired geographic location.
86 percent accepted faculty, postdoctoral or research positions. The median yearly full-time salary of PhD graduates was $74,500, with a range of $55,000-$200,000.
_________________________________________________________________________________
* Organizations categorized as “Other” include Genentech Inc. and Facebook Inc.
Faculty Position (tenure-track)
38%
Faculty Position (untenured)
9%
Education Research
14%
International Development
5%
Other*10%
Postdoctoral scholar or fellow
24%
PHD EMPLOYMENT BREAKDOWN

13
PhD Hiring Organizations & Titles
PhD Hiring Organizations & Titles
Facebook, User Experience Researcher
Genentech, Data Scientist
Inter-American Development Bank, Consultant
New York University Global TIES for Children, Research Scientist
Pontificia Universidad Católica de Chile, Associate Professor
RAND Corporation, Associate Policy Researcher
SRI International, Early childhood researcher
Stanford University, Center for Education Policy Analysis, Postdoctoral Fellow
Stanford University, Department of Psychology, Postdoctoral Scholar
Stanford University, School of Engineering, Postdoctoral Scholar
Stanford University School of Medicine, Postdoctoral Fellow
Stanford University, Stanford Teacher Education Program, Postdoctoral Scholar
State University of New York - Cortland, Assistant Professor
University of California - Irvine, Assistant Professor
University of Colorado Boulder, Assistant Professor
University of Hawai'i at Manoa, Assistant Professor
University of Nebraska Omaha, Assistant Professor
University of Nevada - Reno, Assistant Professor
University of San Diego, Diversity Postdoctoral Fellow
University of Texas at Austin, Assistant Professor
Woodrow Wilson Academy of Teaching and Learning, Faculty Mentor

14
Employment Locations
Employment Locations
94 percent of employed respondents accepted a position in their desired geographic location. This year, our graduates secured positions in nine countries and 17 U.S. states (highlighted below).

15
Employment Locations
The Class of 2017 graduates accepted offers with organizations based in the following locations:
International Australia Brazil Chile China Japan New Zealand Pakistan Rwanda Thailand U.S. Northeast Washington, DC Boston, MA Germantown, MD Somersworth, NH Cortland, NY New York, NY Philadelphia, PA U.S. Midwest Chicago, IL Richfield, MN Omaha, NE U.S. South Miami, FL Charlotte, NC Austin, TX Dallas, TX Magnolia, TX
U.S. West Phoenix, AZ Albany, CA Atherton, CA East Palo Alto, CA Elk Grove, CA Kentfield, CA Irvine, CA Larkspur, CA Los Altos, CA Los Angeles, CA Menlo Park, CA Mountain View, CA Oakland, CA Palo Alto, CA Pasadena, CA Pittsburg, CA Redwood City, CA Richmond, CA San Diego, CA San Francisco, CA San Jose, CA San Lorenzo, CA San Mateo, CA San Rafael, CA Santa Clara, CA South San Francisco, CA Stanford, CA Sunnyvale, CA Woodside, CA Honolulu, HI Reno, NV Vancouver, WA Walla Walla, WA

16
Methodology
Methodol ogy
This report is based on data collected internally. Stanford EdCareers designed and tested a job placement survey consisting of items addressing program affiliation, internship participation, employment status and employment characteristics. The survey was administered to the Class of 2017 graduates electronically, via an outside platform (Qualtrics). Graduates first received the survey upon graduation. Those who indicated that they were “still seeking” a position received a follow-up survey four months later. All survey instruments were closed December 2017, at which point the combined overall response rate for the three programs (STEP, non-STEP MA and PhD) was 94 percent. In addition to the survey responses, a knowledge rate was calculated for an additional 3 percent of graduates who did not respond to the initial or follow-up surveys. The knowledge rate is based on information sent via email, faculty contacts, graduate student liaisons or LinkedIn profiles. The combined knowledge and response rate is 97 percent. The knowledge rate was computed separately within each program and the total rate was averaged across all programs. In all calculations related to total knowledge rate, the rate exceeds 90 percent indicating sufficient knowledge to provide comprehensive data. Employment statistics were calculated based on all valid responses that indicated either having accepted a position or still seeking a position. The report also presents information from the subset of respondents – 6 percent – who indicated that they were not seeking employment; these respondents continued their education, started a business or chose alternative paths for personal reasons. PhD graduates can receive their degree during any of the four quarters; PhD graduates included in this report earned degrees between September 2016 and August 2017. STEP graduates received their degrees in June, and MA graduates (non-STEP) received their degrees in June or August, depending on the program. Students in each program received the survey (and any follow-up reminders) at different points in the year, depending on the graduation month. The statistics in this report reflect employment status within four months of graduating, unless indicated otherwise. MA and PhD graduates received highly similar surveys. Because of the unique nature of the STEP program, STEP graduates were asked to complete a modified yet comparable version of the survey.