class size, capacity and planning factors: additional information joint fac & bac meeting...
TRANSCRIPT

Class Size, Capacity and Class Size, Capacity and Planning Factors:Planning Factors:
Additional InformationAdditional Information
Joint FAC & BAC MeetingJoint FAC & BAC Meeting
Arlington Public SchoolsJanuary 7, 2010
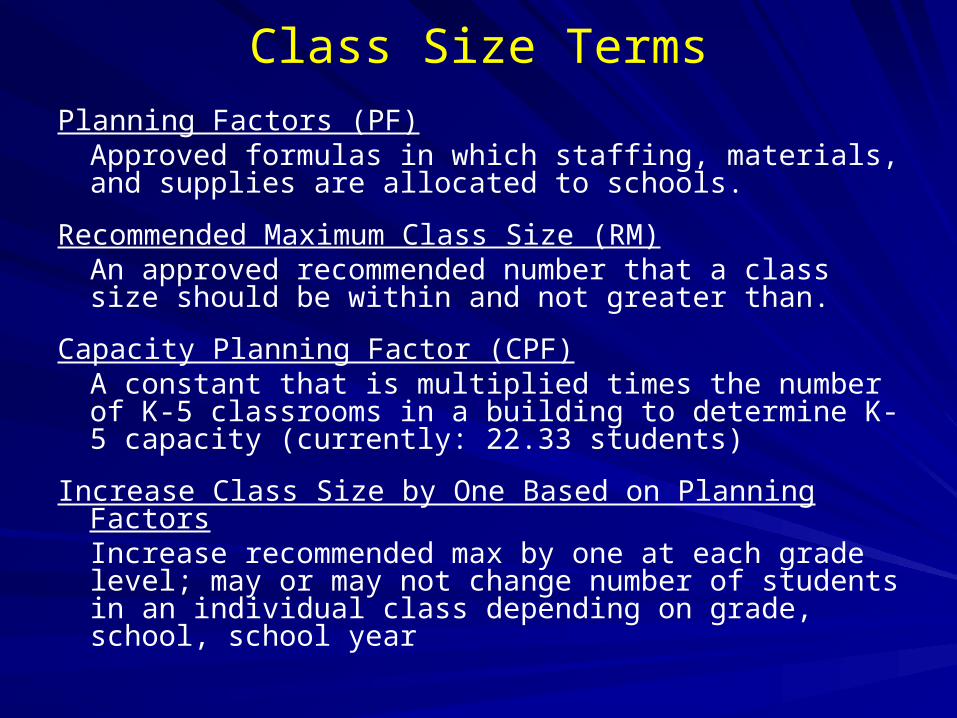
Class Size Terms
Planning Factors (PF) Approved formulas in which staffing, materials, and supplies are allocated to schools.
Recommended Maximum Class Size (RM)An approved recommended number that a class size should be within and not greater than.
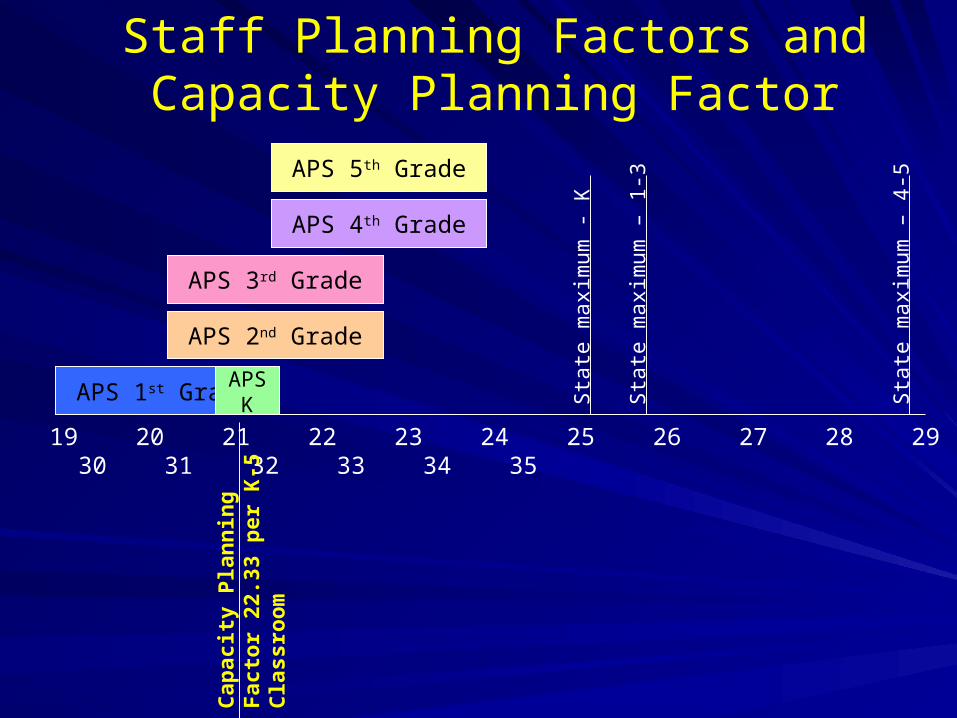
Capacity Planning Factor (CPF)A constant that is multiplied times the number of K-5 classrooms in a building to determine K-5 capacity (currently: 22.33 students)
Increase Class Size by One Based on Planning FactorsIncrease recommended max by one at each grade level; may or may not change number of students in an individual class depending on grade, school, school year
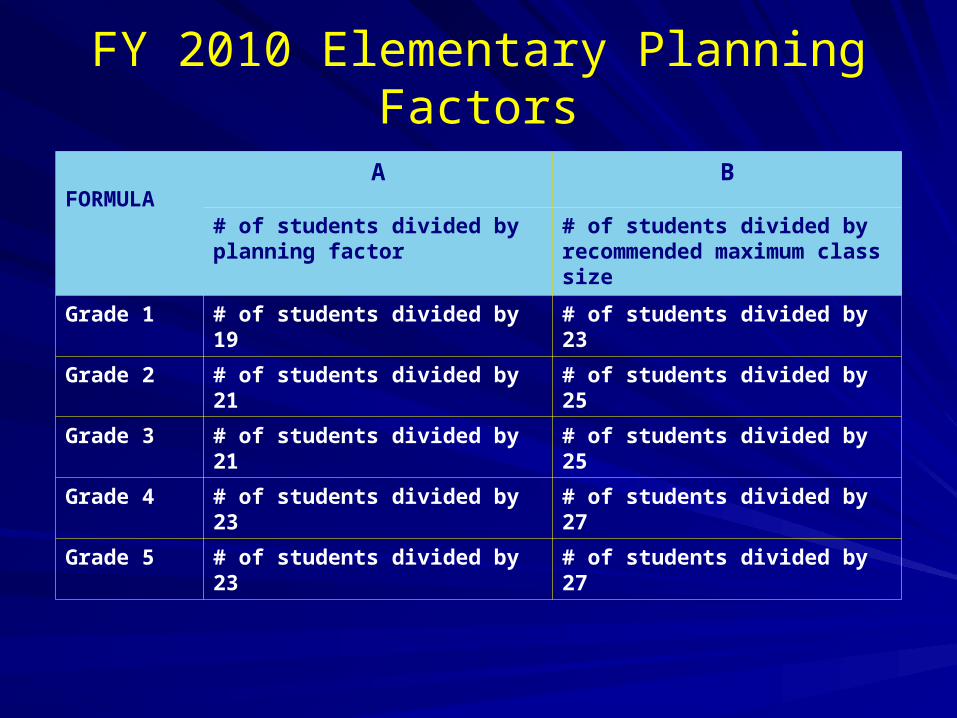
FY 2010 Elementary Planning Factors
FORMULAA B
# of students divided by planning factor
# of students divided by recommended maximum class size
Grade 1 # of students divided by 19 # of students divided by 23
Grade 2 # of students divided by 21 # of students divided by 25
Grade 3 # of students divided by 21 # of students divided by 25
Grade 4 # of students divided by 23 # of students divided by 27
Grade 5 # of students divided by 23 # of students divided by 27
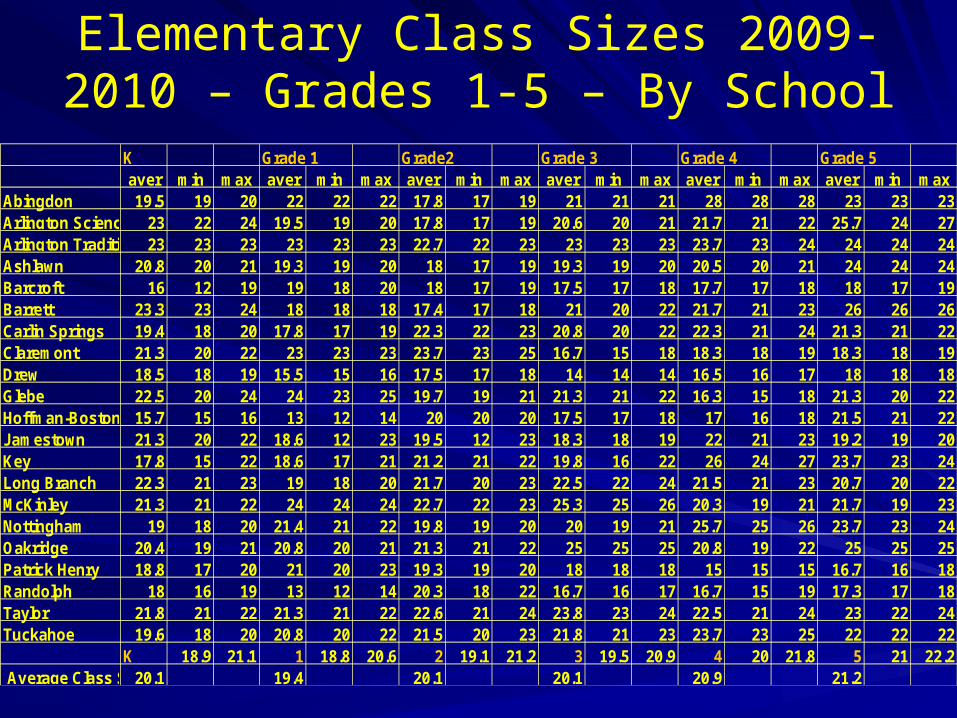
K Grade 1 Grade2 Grade 3 Grade 4 Grade 5aver min max aver min max aver min max aver min max aver min max aver min max
Abingdon 19.5 19 20 22 22 22 17.8 17 19 21 21 21 28 28 28 23 23 23Arlington Science Focus 23 22 24 19.5 19 20 17.8 17 19 20.6 20 21 21.7 21 22 25.7 24 27Arlington Traditional School23 23 23 23 23 23 22.7 22 23 23 23 23 23.7 23 24 24 24 24Ashlawn 20.8 20 21 19.3 19 20 18 17 19 19.3 19 20 20.5 20 21 24 24 24Barcroft 16 12 19 19 18 20 18 17 19 17.5 17 18 17.7 17 18 18 17 19Barrett 23.3 23 24 18 18 18 17.4 17 18 21 20 22 21.7 21 23 26 26 26Carlin Springs 19.4 18 20 17.8 17 19 22.3 22 23 20.8 20 22 22.3 21 24 21.3 21 22Claremont 21.3 20 22 23 23 23 23.7 23 25 16.7 15 18 18.3 18 19 18.3 18 19Drew 18.5 18 19 15.5 15 16 17.5 17 18 14 14 14 16.5 16 17 18 18 18Glebe 22.5 20 24 24 23 25 19.7 19 21 21.3 21 22 16.3 15 18 21.3 20 22Hoffman-Boston 15.7 15 16 13 12 14 20 20 20 17.5 17 18 17 16 18 21.5 21 22Jamestown 21.3 20 22 18.6 12 23 19.5 12 23 18.3 18 19 22 21 23 19.2 19 20Key 17.8 15 22 18.6 17 21 21.2 21 22 19.8 16 22 26 24 27 23.7 23 24Long Branch 22.3 21 23 19 18 20 21.7 20 23 22.5 22 24 21.5 21 23 20.7 20 22McKinley 21.3 21 22 24 24 24 22.7 22 23 25.3 25 26 20.3 19 21 21.7 19 23Nottingham 19 18 20 21.4 21 22 19.8 19 20 20 19 21 25.7 25 26 23.7 23 24Oakridge 20.4 19 21 20.8 20 21 21.3 21 22 25 25 25 20.8 19 22 25 25 25Patrick Henry 18.8 17 20 21 20 23 19.3 19 20 18 18 18 15 15 15 16.7 16 18Randolph 18 16 19 13 12 14 20.3 18 22 16.7 16 17 16.7 15 19 17.3 17 18Taylor 21.8 21 22 21.3 21 22 22.6 21 24 23.8 23 24 22.5 21 24 23 22 24Tuckahoe 19.6 18 20 20.8 20 22 21.5 20 23 21.8 21 23 23.7 23 25 22 22 22
K 18.9 21.1 1 18.8 20.6 2 19.1 21.2 3 19.5 20.9 4 20 21.8 5 21 22.2 Average Class Size per Grade20.1 19.4 20.1 20.1 20.9 21.2
Elementary Class Sizes 2009-2010 – Grades 1-5 – By School
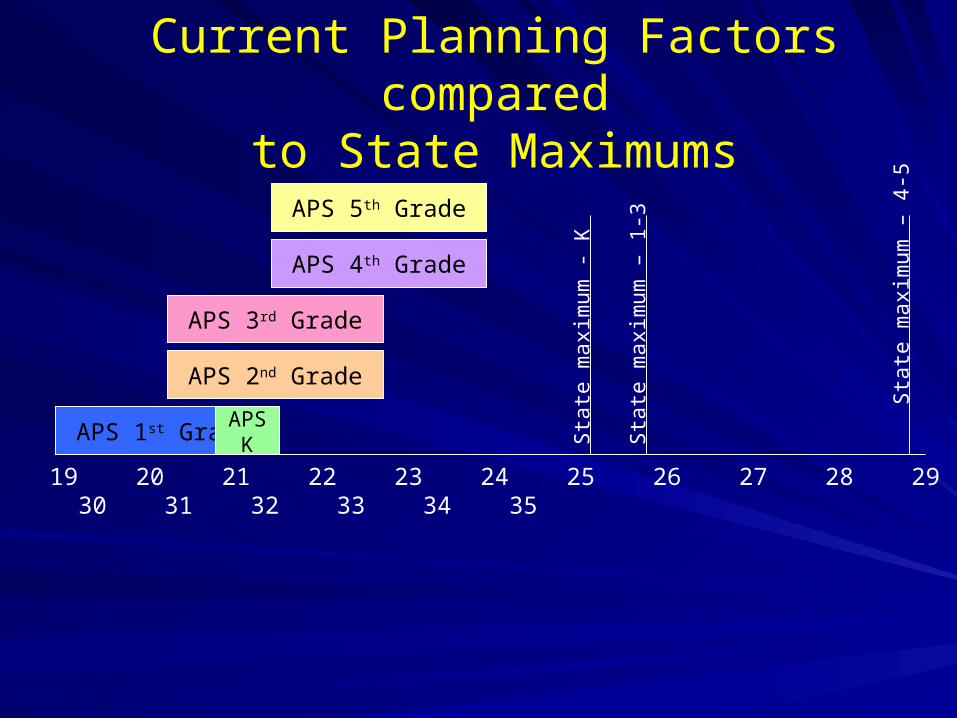
19 20 21 22 23 24 25 26 27 28 29 30 31 32 33 34 35
APS 1st Grade
APS 3rd Grade
APS 2nd Grade
APS 4th Grade
APS 5th Grade
APSK S
tate
max
imum
- K
Sta
te m
axim
um –
1-3
Sta
te m
axim
um –
4-5
Current Planning Factors comparedto State Maximums

Illustrative Example:Impact of Increasing Class Size by One (Planning
Factor & Recommended Maximum)
CURRENT INCREASE BY ONE DIFFERENCE
Kindergarten Teacher
Teachers 1-5
Kindergarten Teacher
Teachers 1-5
KindergartenTeacher
Teachers 1-5
CASE 1
3.00 12.00 3.00 11.00 -
(1.00)
CASE 2
5.00 20.00 4.00 18.00
(1.00)
(2.00)
CASE 3
3.00 12.00 3.00 12.00 - -

Illustrative Example: Impact of Class Size Increase by One on 2009-2010 Staffing
Reduction of20 elem classes

Impact of Class Size +1 on Current Year Classrooms

Impact of Class Size +1 on Current Year Classrooms
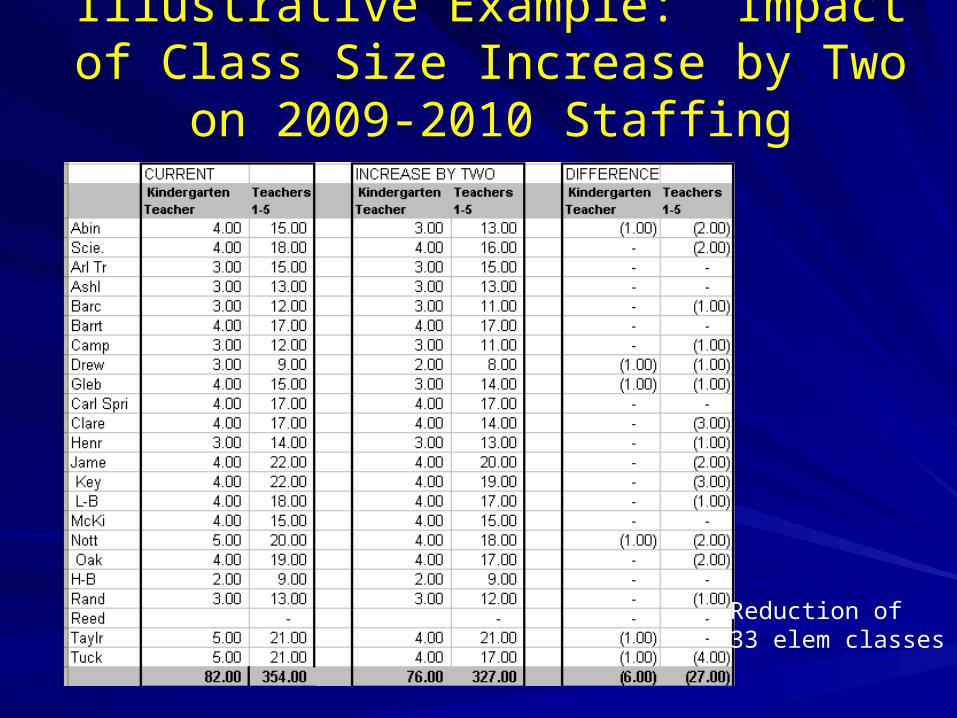
Illustrative Example: Impact of Class Size Increase by Two on 2009-2010 Staffing
Reduction of33 elem classes
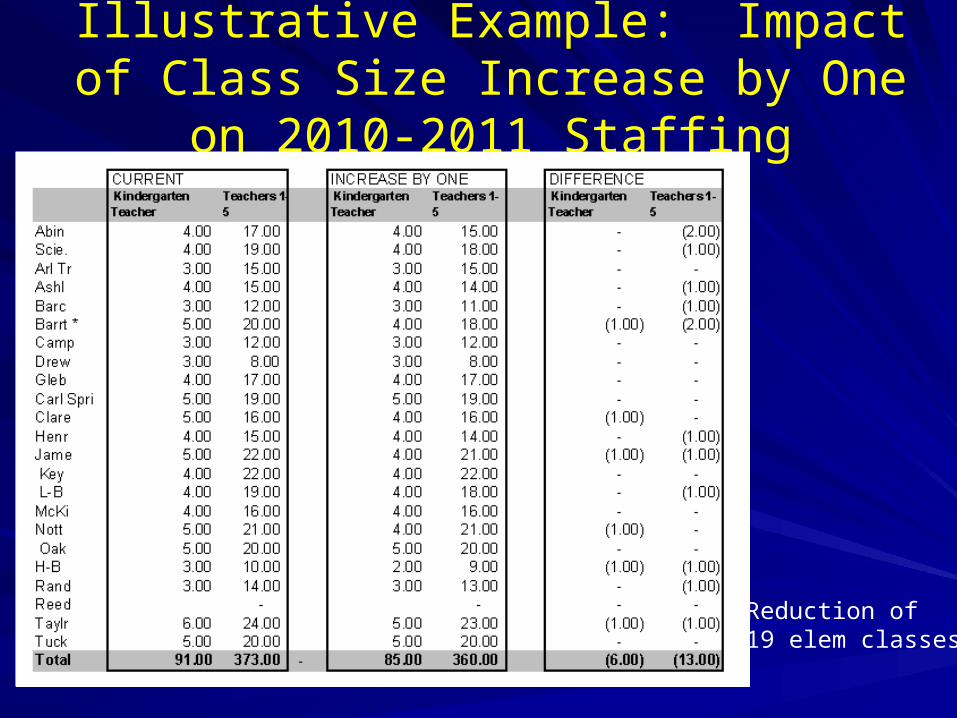
Illustrative Example: Impact of Class Size Increase by One on 2010-2011 Staffing
Reduction of19 elem classes

Capacity Numbers: MGT & APS
Differences in capacity numbers due to four reasons:
1. Variation in formula (same number of rooms)
2. Current use vs. potential use
3. Clarity of detail due to 30,000 foot view from MGT
4. Adjustments to room uses not yet captured by APS (last capacity update Aug 09)
19 20 21 22 23 24 25 26 27 28 29 30 31 32 33 34 35
APS 1st Grade
APS 3rd Grade
APS 2nd Grade
APS 4th Grade
APS 5th Grade
APSK
Cap
acit
y P
lan
nin
g F
acto
r 22
.33
per
K-5
Cla
ssro
om
Sta
te m
axim
um -
K
Sta
te m
axim
um –
1-3
Sta
te m
axim
um –
4-5
Staff Planning Factors andCapacity Planning Factor
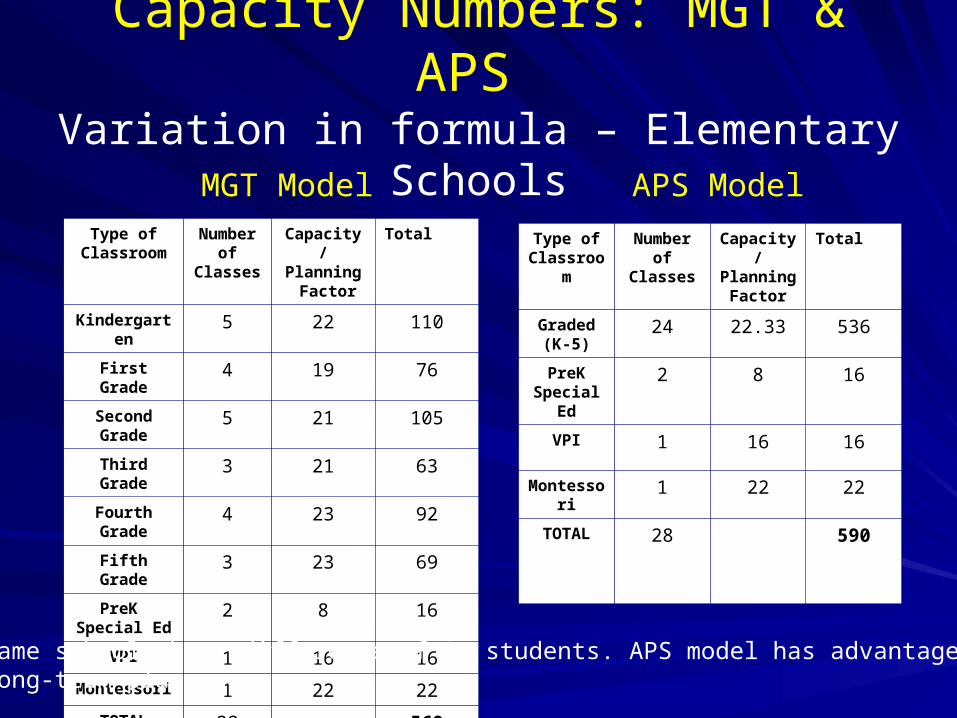
Capacity Numbers: MGT & APS Variation in formula – Elementary Schools
Type of Classroom
Number of Classes
Capacity/Planning
Factor
Total
Kindergarten 5 22 110
First Grade 4 19 76
Second Grade 5 21 105
Third Grade 3 21 63
Fourth Grade 4 23 92
Fifth Grade 3 23 69
PreK Special Ed
2 8 16
VPI 1 16 16
Montessori 1 22 22
TOTAL 28 569
Type of Classroom
Number of Classes
Capacity/Planning
Factor
Total
Graded (K-5)
24 22.33 536
PreK Special Ed
2 8 16
VPI 1 16 16
Montessori 1 22 22
TOTAL 28 590
MGT Model APS Model
Same school shows difference of 21 students. APS model has advantage for long-term planning.

Enrollment Projections: MGT & APS
Projection
Year APS MGT difference
2010 20933 21751 -818
2011 21657 22285 -628
2012 22358 22740 -382
2013 23074 22973 101
2014 22838 23321 -483
2015 24615 23434 1181
Enrollment Projections: MGT & APS
• Differences in projection numbers due to variation in methodologies
• APS selects a single methodology• MGT uses a combination methodology
• APS staff and MGT are confident in APS’ methodology
• Historically accurate within 2% systemwide• Updated twice yearly

Information and materials related to Information and materials related to process:process:
http://www.apsva.us/elemcapacity
In addition, the web page has an e-mail option for comments and suggestions.
Web PageWeb Page