classifi cation of carbonate gas condensate reservoirs ... research institute of petroleum...
TRANSCRIPT
7070DOI 10.1007/s12182-011-0117-1
Li Yong1 , Li Baozhu1, Hu Yongle1, Xia Jing1, Liu Zhaowei2, Deng Xingliang3, She Zhicheng3 and Fan Kun3 1 Research Institute of Petroleum Exploration and Development, PetroChina, Beijing 100083, China2 China National Oil & Gas Exploration and Development Corporation, PetroChina, Beijing 100034, China3 Tarim Oilfi eld Company, PetroChina, Korla, Xingjiang 841000, China
© China University of Petroleum (Beijing) and Springer-Verlag Berlin Heidelberg 2011
Abstract: Carbonate reservoir patterns play an important role in the production performance of oil and gas wells, and it is usually classified through static data analysis which cannot reflect the actual well performance. This paper takes the Tazhong No. 1 gas field in the Tarim Basin, China as an example to investigate the classification of carbonate reservoirs. The classification method mainly combines well test analysis with production analysis ― especially the Blasingame type curve method. Based on the characteristics of type curves for well test analysis and the Blasingame method, the relationship between the type curves and reservoir pattern was established. More than 20 wells were analyzed and the reservoirs were classifi ed into 3 major patterns with 7 sub-classes. Furthermore, the classifi cation results were validated by dynamic performance analysis of wells in the Tazhong No.1 gas fi eld. On the basis of the classifi cation results, well stimulation (i.e. water fl ooding in a single well) was carried out in three volatile-oil wells, and the oil recovery increased by up to 20%.
Key words: Carbonate, reservoir pattern, well test analysis, production analysis, type curve
Classifi cation of carbonate gas condensate reservoirs using well test and production data analyses
*Corresponding author. email: [email protected] May 23, 2010
Pet.Sci.(2011)8:70-78
1 IntroductionCompared with carbonate gas reservoirs in other
countries, the deeply buried carbonate reservoirs in China are characterized by extreme heterogeneity of permeability and porosity and complicated fl uid properties. It is more diffi cult to develop this type of carbonate gas reservoirs because the reservoir rocks are mainly composed of matrix, high-permeability fractures and vugs. Therefore, predicting the reservoir development performance is more difficult. Based on the analyses of the well test and production data, this paper discussed the pattern classifi cation of carbonate gas reservoirs in the Tarim Basin, China. Well test methods and production data analysis are usually used for the evaluation of reservoir parameters and original-gas-in-place (OGIP) (Wehner et al, 2000; Borch, 2001; Mattar and Anderson, 2003; Anderson and Matter, 2004; Anderson et al, 2006; Han et al, 2006), and they also have useful diagnostic functions on reservoir pattern and well performance. In the 1970’s, well test analysis began to develop, and a series of well test models have been proposed for homogeneous reservoirs, composite reservoirs, dual-porosity reservoirs (Gringarten et al, 2006; Escobar
et al, 2007). Whereas production data analysis was mainly improved by Blasingame in the late 1980’s. It includes not only the traditional Arps and Fetkovich decline analyses (Fetkovich, 1980), but also the modern Blasingame method (Blasingame et al, 1989; 1991), Agarwal-Gardner method (AG) (Agarwal et al, 1998), normalized pressure integral (NPI) method, transient type curve analysis method, and the fl owing-material-balance method (Mattar and McNeil, 1998). Because both well test analysis and production analysis are processes of inverse problem solution, the interpretation results obtained from one of these methods are not unique. So the interpretation of reservoir patterns needs to combine these two methods and be further verifi ed through well production performance (Doublet et al, 1995; Rushing and Blasingame, 2003; Bello and Wattenbarger, 2008; Li et al, 2009b)
Taking the Tazhong No.1 gas field in the Tarim Basin, China as an example, the authors studied the classification of gas carbonate reservoirs. Through in-depth analysis of type curves for well test interpretation and production data analysis for 22 wells in the Tazhong No.1 gas field, the relationship between the type curves and reservoir patterns was established. The reservoirs are classified into 3 major patterns and 7 sub-classes, which are verified by well performance dynamic analysis.
7171
Pet.Sci.(2011)8:70-78
72
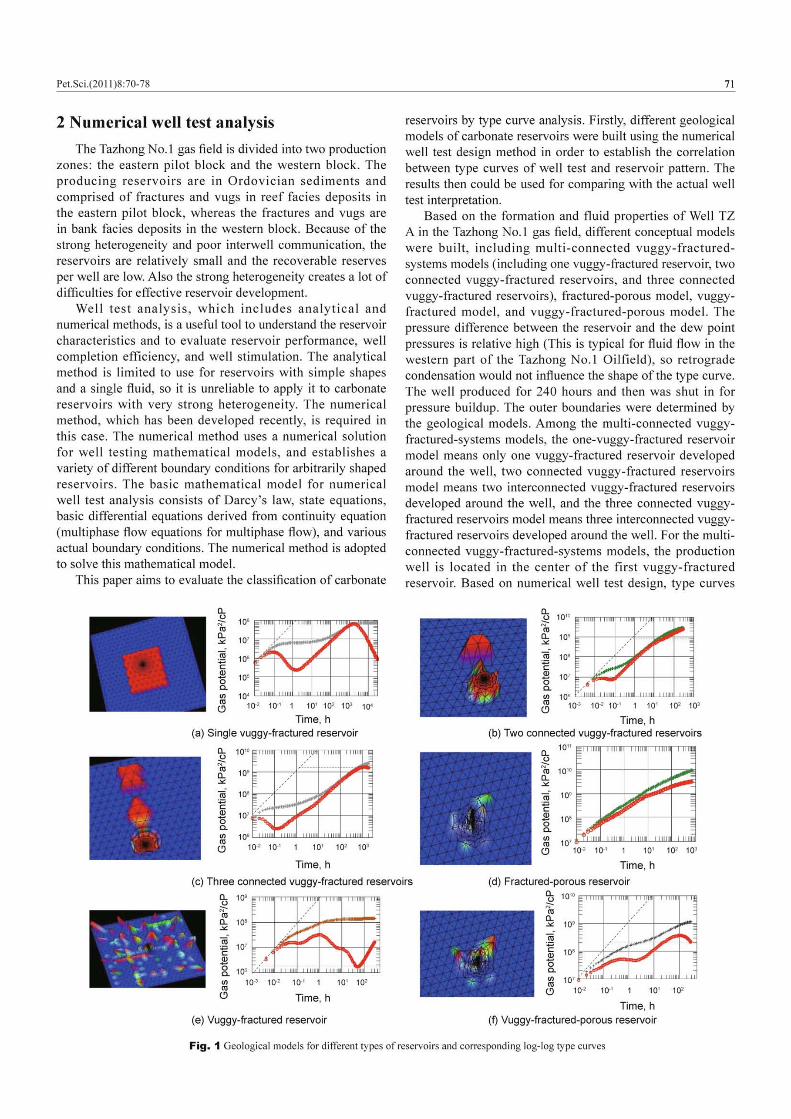
of these models were obtained. Fig. 1 shows the conceptual models of different reservoir patterns and the relevant log-log type curves.
(1) For a single vuggy-fractured reservoir, the type curves show that boundary dominated fl ow occurs immediately after the transient fl ow period (if the reservoir is big enough, radial fl ow can occur). During the boundary-dominated period, the slope of the derivative curve gradually becomes closer to unity. After the boundary-dominated period, the well presents the characteristics of a constant-volume gas reservoir and the slope of the derivative curve drops to zero. The reason for the rapid drop is that once the well was shut in, the pressure in the closed gas reservoir quickly tends to balance and then the pressure drop funnel gradually disappears, which means that the reservoir pressure tends to be constant. It is known that the derivative value of a constant pressure with respect to time is zero, so the slope of the well test derivative curve drops to zero after the boundary-dominated period.
(2) For two connected vuggy-fractured reservoirs, the type curves show an initial pressure buildup in the fi rst reservoir around the well. If the reservoir is big enough, radial flow occurs after the transient fl ow, and is followed by boundary-dominated flow. The pressure change and the derivative coincide with a unit-slope trend during the boundary-dominated flow period. As soon as the pressure sweeps the second vuggy-fractured reservoir, the pressure change and the derivative curves separate, and the degree of separation is affected by the size of the second reservoir.
(3) For three connected vuggy-fractured reservoirs, the type curves are affected by the elapsed time required when the pressure sweeps the three reservoirs respectively and the reservoir properties. There are three fl uctuations on the curves which refl ect the sweep of three reservoirs respectively.
(4) Example (d) shows the behavior of fl ow in fractured-porous reservoirs. Initially, fracture linear fl ow period occurs as the fl uid within the fracture expands towards the wellbore. Radial fl ow dominates in the undamaged formation after the fracture linear flow. This usually happens when the well is fractured or connected with macro fractures.
(5) Example (e) illustrates a vuggy-fractured reservoir. The fracture linear flow period occurs initially, and then a transient concave section is caused by cross flow between fractures and vugs. After that, a fracture-vug intersection radial flow period shows sometimes and finally a boundary dominated fl ow period occurs.
(6) Example (f) illustrates a vuggy, fractured, porous reservoir. Its well test type curves are similar to that of the triple porosity formations. Two valleys in the pressure derivative are an indication of reservoir heterogeneity.
Type curves for different types of reservoirs were obtained through numerical test design, which can be used for the comparative analysis of actual well test data in order to classify the reservoir pattern.
3 Production analysisProduction analysis is also called transient production
analysis, decline curve analysis, and modern production decline analysis, which is a new method for analyzing the
well dynamic performance. Adopting the theory similar to transient well testing and introducing some new concepts (dimensionless production rate, dimensionless pressure, and pseudo-time), new type curves were derived. The type curve was used to match production data, and the formation permeability, well skin factor, and well-recoverable reserves could be calculated from data matching. So this method had the dual function of numerical reservoir simulation and well test analysis, which could yield similar results to these two methods. The data used in production analysis were production rate and well bottom-hole pressure. In the process of production analysis, the Fetkovich, Blasingame, Agarwal-Gardner type curves and the flowing material balance method were used for the preliminary evaluation, and then the analytical (or numerical) radial model for a single well was used for well production history matching, so the final evaluation results were generated. The following section describes one representative method of type curve analysis — the Blasingame method.
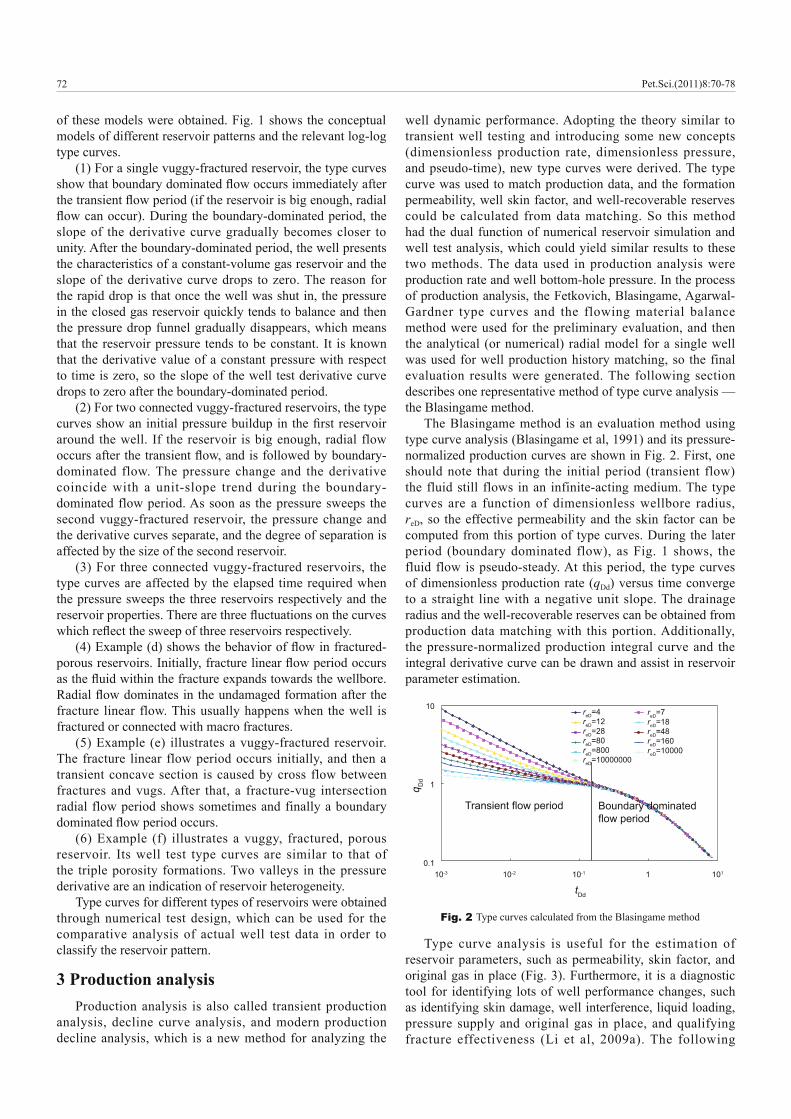
The Blasingame method is an evaluation method using type curve analysis (Blasingame et al, 1991) and its pressure-normalized production curves are shown in Fig. 2. First, one should note that during the initial period (transient flow) the fluid still flows in an infinite-acting medium. The type curves are a function of dimensionless wellbore radius, reD, so the effective permeability and the skin factor can be computed from this portion of type curves. During the later period (boundary dominated flow), as Fig. 1 shows, the fluid flow is pseudo-steady. At this period, the type curves of dimensionless production rate (qDd) versus time converge to a straight line with a negative unit slope. The drainage radius and the well-recoverable reserves can be obtained from production data matching with this portion. Additionally, the pressure-normalized production integral curve and the integral derivative curve can be drawn and assist in reservoir parameter estimation.
Transient flow period Boundary dominatedflow period
tDd
10-3 10-2 10-1
reD=4reD=12reD=28reD=80reD=800reD=10000000
reD=7reD=18reD=48reD=160reD=10000
1 101
10
1
0.1
q Dd
Fig. 2 Type curves calculated from the Blasingame method
Type curve analysis is useful for the estimation of reservoir parameters, such as permeability, skin factor, and original gas in place (Fig. 3). Furthermore, it is a diagnostic tool for identifying lots of well performance changes, such as identifying skin damage, well interference, liquid loading, pressure supply and original gas in place, and qualifying fracture effectiveness (Li et al, 2009a). The following
Pet.Sci.(2011)8:70-78
73
illustrates how the original gas in place can be diagnosed from the type curve analysis. The original gas in place can be calculated by the following formula (Blasingame, 1991).
Oil reservoir:
(1) dd
c
t
/1q
pqtt
cN
Gas reservoir:
(2)pcai
t Dd Ddi
/2 q ptpGZ c t q
where N is the original oil in place, t; G is the original gas in place, m3; ct is the total compressibility, MPa–1; tc and tca are the material balance time for oil reservoirs and gas reservoirs, respectively, d; q is the daily production, t/d (oil wells) or m3/d (gas wells); ∆p and ∆pp are the pseudo-pressure difference of oil reservoirs and gas reservoirs, respectively, MPa; tDd is the dimensionless time; qDd is the dimensionless production rate.
During the boundary-dominated flow period, the actual production data points converge to a negative unit line, which
means that c
Dd Dd
/t q pt q or
pca
Dd Dd
/q ptt q is constant.
Eqs. (1) and (2) indicate that the original oil or gas in place is constant. If the production data deviates from a straight line with a slope of negative unity and falls on the right side of the line, for the same q/∆pp it means tca increases compared to the tca on the line with a negative unit slope, which illustrates that the original gas in place increases.
Other diagnostic functions can be derived similarly.
4 Application in reservoir pattern classifi cation
As well tests were implemented before pilot production, the retrograde condensation did not occur around the well bottom-hole and had no effect on the shape of type curves for analyzing well test data. Based on the reservoir classifi cation results from seismic attributes, and combined with the results
q Dd
tDd
Productivityshifts
Well cleaning up
Liquid loading
No reserves change
OGIPincrease
Increasing damage (difficult to identify)
10-4 10-3 10-2 10-1 1 101 102 103 104
101
1
10-1
10-2
10-3
Fig. 3 Diagnostic functions of production analysis
0
20
40
Tubi
ngpr
essu
re
5
6
7
8
Cho
ke s
izeTubing pressure (MPa)
Choke size (mm)
0
50
100
150
200
2004-12-7 2005-12-7 2006-12-7 2007-12-7 2008-12-7 2009-12-7
DO
PR
DW
PR
0
5
10
15
DG
PR
Daily oil production rate (t)Daily water production rate (t)Daily gas production rate (104m3)
0
1000
2000
3000
GO
R
0
20
40
60
Wat
er c
utGas oil ratio (m3/m3)Water cut (%)
Fig. 4 Production performance of well TZ A
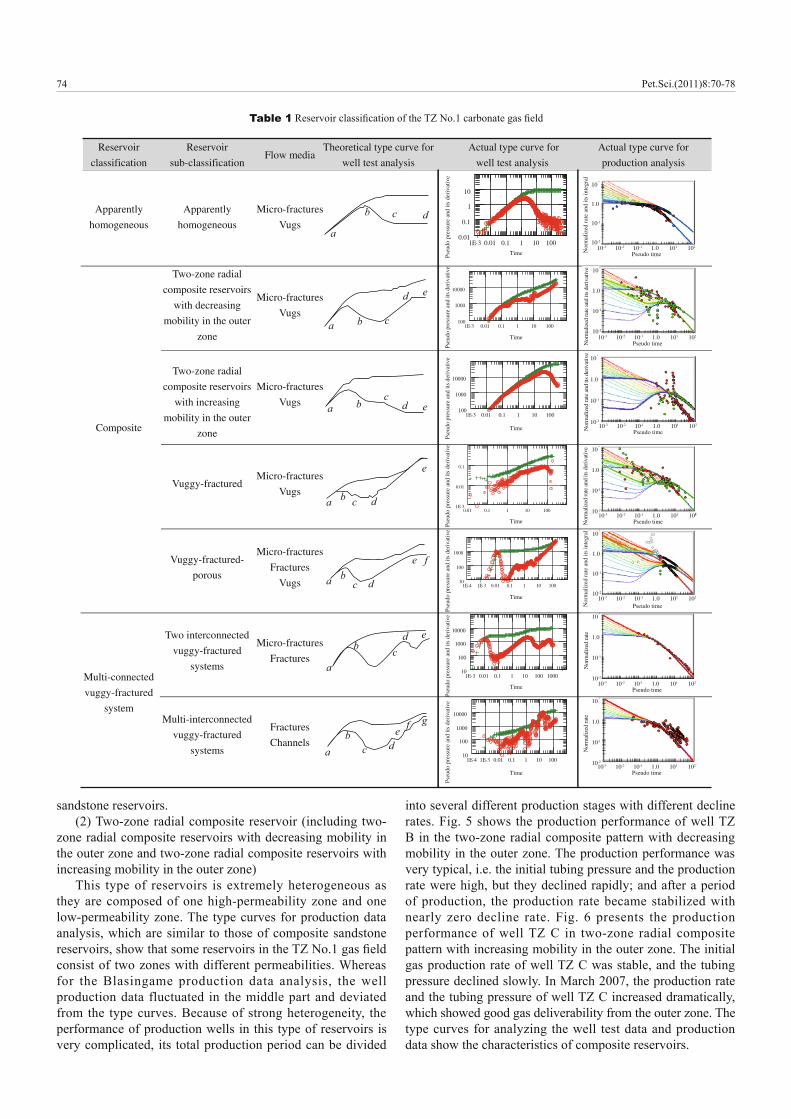
from numerical well test models designed for different carbonate reservoirs and the type curve analysis of 22 wells, the relationship between the type curves and reservoir pattern was established. The reservoirs were classifi ed into 3 major patterns with 7 sub-classes, which were validated through dynamic well performance analysis. The reservoir patterns included apparently-homogeneous reservoirs, two-zone radial composite reservoirs (including two-zone radial composite reservoirs with decreasing mobility in the outer zone and two-zone radial composite reservoirs with increasing mobility in the outer zone, vuggy-fractured reservoirs and vuggy-fractured-porous reservoirs), and multi-connected-vuggy-fractured systems (including two connected vuggy-fractured reservoirs and multi-connected-vuggy-fractured reservoirs). The detailed results are shown in Table 1.
(1) Apparently homogeneous reservoirThe media, through which the fluid flows, consist
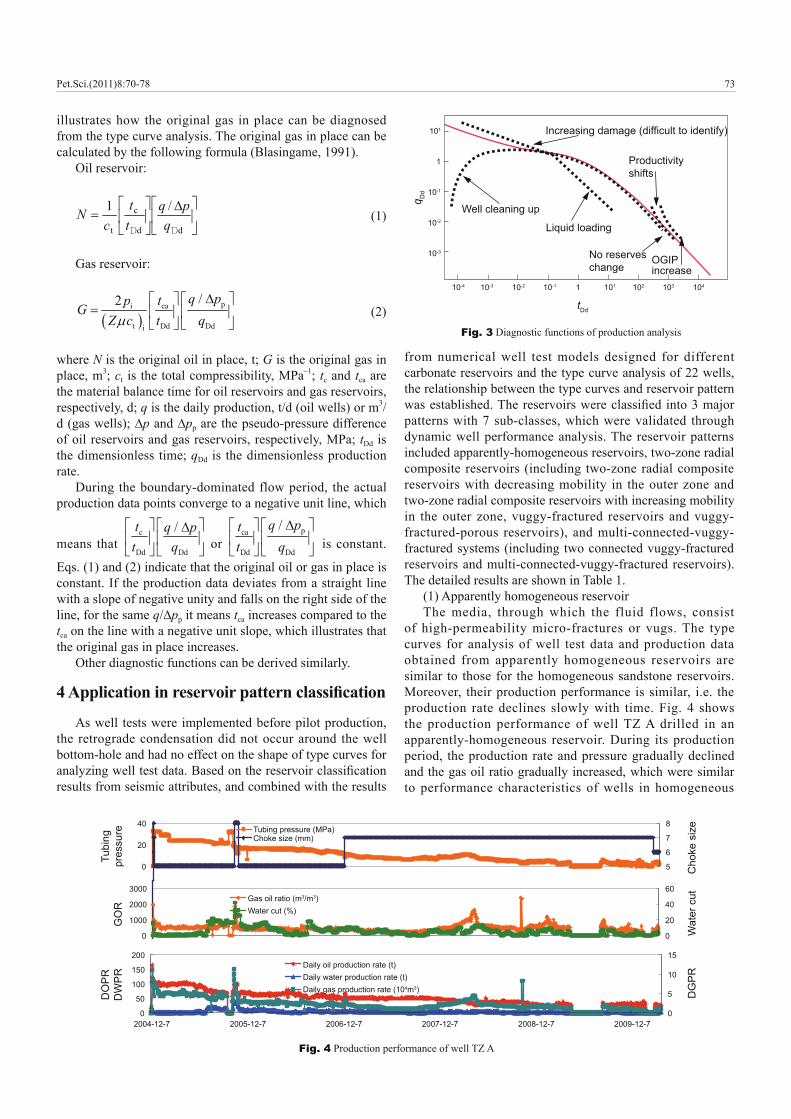
of high-permeability micro-fractures or vugs. The type curves for analysis of well test data and production data obtained from apparently homogeneous reservoirs are similar to those for the homogeneous sandstone reservoirs. Moreover, their production performance is similar, i.e. the production rate declines slowly with time. Fig. 4 shows the production performance of well TZ A drilled in an apparently-homogeneous reservoir. During its production period, the production rate and pressure gradually declined and the gas oil ratio gradually increased, which were similar to performance characteristics of wells in homogeneous
Pet.Sci.(2011)8:70-78
74
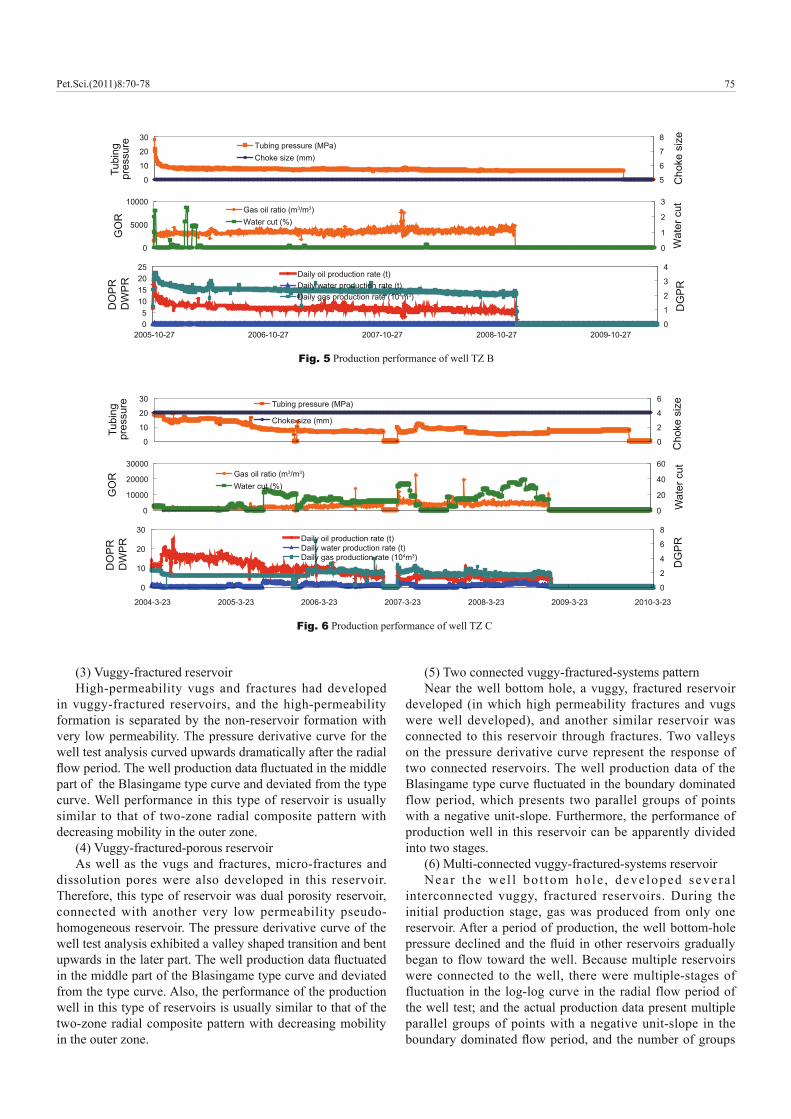
sandstone reservoirs. (2) Two-zone radial composite reservoir (including two-
zone radial composite reservoirs with decreasing mobility in the outer zone and two-zone radial composite reservoirs with increasing mobility in the outer zone)
This type of reservoirs is extremely heterogeneous as they are composed of one high-permeability zone and one low-permeability zone. The type curves for production data analysis, which are similar to those of composite sandstone reservoirs, show that some reservoirs in the TZ No.1 gas fi eld consist of two zones with different permeabilities. Whereas for the Blasingame production data analysis, the well production data fluctuated in the middle part and deviated from the type curves. Because of strong heterogeneity, the performance of production wells in this type of reservoirs is very complicated, its total production period can be divided
into several different production stages with different decline rates. Fig. 5 shows the production performance of well TZ B in the two-zone radial composite pattern with decreasing mobility in the outer zone. The production performance was very typical, i.e. the initial tubing pressure and the production rate were high, but they declined rapidly; and after a period of production, the production rate became stabilized with nearly zero decline rate. Fig. 6 presents the production performance of well TZ C in two-zone radial composite pattern with increasing mobility in the outer zone. The initial gas production rate of well TZ C was stable, and the tubing pressure declined slowly. In March 2007, the production rate and the tubing pressure of well TZ C increased dramatically, which showed good gas deliverability from the outer zone. The type curves for analyzing the well test data and production data show the characteristics of composite reservoirs.
Reservoir
classification
Reservoir
sub-classification Flow media
Theoretical type curve for
well test analysis
Actual type curve for
well test analysis
Actual type curve for
production analysis
Apparently
homogeneous
Apparently
homogeneous
Micro-fractures
Vugs
1E-3 0.01 0.1 1 10 1000.01
0.1
1
10
Two-zone radial
composite reservoirs
with decreasing
mobility in the outer
zone
Micro-fractures
Vugs 1E-3 0.01 0.1 1 10 100
100
1000
10000
Two-zone radial
composite reservoirs
with increasing
mobility in the outer
zone
Micro-fractures
Vugs 1E-3 0.01 0.1 1 10 100
100
1000
10000
Vuggy-fractured Micro-fractures
Vugs
0.01 0.1 1 10 1001E-3
0.01
0.1
Composite
Vuggy-fractured-
porous
Micro-fractures
Fractures
Vugs 1E-4 1E-3 0.01 0.1 1 10 10010
100
1000
Two interconnected
vuggy-fractured
systems
Micro-fractures
Fractures
1E-3 0.01 0.1 1 10 100 100010
100
1000
10000
Multi-connected
vuggy-fractured
system Multi-interconnected
vuggy-fractured
systems
Fractures
Channels
1E-4 1E-3 0.01 0.1 1 10 10010
100
1000
10000
Pseudo time
Pseudo timeNor
mal
ized
rat
e an
d its
inte
gral
N
orm
aliz
ed ra
te
TimePseu
do p
ress
ure
and
its d
eriv
ativ
e
Time
Pseu
do p
ress
ure
and
its d
eriv
ativ
e
Time
Pseu
do p
ress
ure
and
its d
eriv
ativ
e
Time
Pseu
do p
ress
ure
and
its d
eriv
ativ
e
Time
Pseu
do p
ress
ure
and
its d
eriv
ativ
e
Time
Pseu
do p
ress
ure
and
its d
eriv
ativ
e
Time
Pseu
do p
ress
ure
and
its d
eriv
ativ
e
a
b c d
a b c
d e
a bc
d e
a b c d
e
a bc d
e f
a
b cd e
ab
c de f g
10
1.0
10-1
10-2
10-3 10-2 10-1 1.0 101 102
Pseudo timeNor
mal
ized
rate
and
its
deri
vativ
e 10
1.0
10-1
10-2
10-3 10-2 10-1 1.0 101 102
Pseudo timeNor
mal
ized
rate
and
its
deri
vativ
e
10-3 10-2 10-1 1.0 101 102
10
1.0
10-1
10-2
Pseudo timeNor
mal
ized
rate
and
its
deri
vativ
e 10
1.0
10-1
10-2
10-3 10-2 10-1 1.0 101 102
Pseudo timeNor
mal
ized
rat
e an
d its
inte
gral
10
1.0
10-1
10-2
10-3 10-2 10-1 1.0 101 102
Pseudo time
Nor
mal
ized
rate
10
1.0
10-1
10-2
10-3 10-2 10-1 1.0 101 102
Pseudo time
Nor
mal
ized
rate
10
1.0
10-1
10-2
10-3 10-2 10-1 1.0 101 102
Table 1 Reservoir classifi cation of the TZ No.1 carbonate gas fi eld
Pet.Sci.(2011)8:70-78
75
(3) Vuggy-fractured reservoirHigh-permeability vugs and fractures had developed
in vuggy-fractured reservoirs, and the high-permeability formation is separated by the non-reservoir formation with very low permeability. The pressure derivative curve for the well test analysis curved upwards dramatically after the radial fl ow period. The well production data fl uctuated in the middle part of the Blasingame type curve and deviated from the type curve. Well performance in this type of reservoir is usually similar to that of two-zone radial composite pattern with decreasing mobility in the outer zone.
(4) Vuggy-fractured-porous reservoirAs well as the vugs and fractures, micro-fractures and
dissolution pores were also developed in this reservoir. Therefore, this type of reservoir was dual porosity reservoir, connected with another very low permeability pseudo-homogeneous reservoir. The pressure derivative curve of the well test analysis exhibited a valley shaped transition and bent upwards in the later part. The well production data fl uctuated in the middle part of the Blasingame type curve and deviated from the type curve. Also, the performance of the production well in this type of reservoirs is usually similar to that of the two-zone radial composite pattern with decreasing mobility in the outer zone.
(5) Two connected vuggy-fractured-systems patternNear the well bottom hole, a vuggy, fractured reservoir
developed (in which high permeability fractures and vugs were well developed), and another similar reservoir was connected to this reservoir through fractures. Two valleys on the pressure derivative curve represent the response of two connected reservoirs. The well production data of the Blasingame type curve fl uctuated in the boundary dominated flow period, which presents two parallel groups of points with a negative unit-slope. Furthermore, the performance of production well in this reservoir can be apparently divided into two stages.
(6) Multi-connected vuggy-fractured-systems reservoirNear the wel l bo t tom hole , deve loped severa l
interconnected vuggy, fractured reservoirs. During the initial production stage, gas was produced from only one reservoir. After a period of production, the well bottom-hole pressure declined and the fl uid in other reservoirs gradually began to flow toward the well. Because multiple reservoirs were connected to the well, there were multiple-stages of fluctuation in the log-log curve in the radial flow period of the well test; and the actual production data present multiple parallel groups of points with a negative unit-slope in the boundary dominated fl ow period, and the number of groups
0
10
20
30
5
6
7
8
Cho
ke s
ize
Tubing pressure (MPa)Choke size (mm)
05
10152025
2005-10-27 2006-10-27 2007-10-27 2008-10-27 2009-10-270
1
2
3
4
DG
PR
Daily oil production rate (t)Daily water production rate (t)Daily gas production rate (104m3)
0
5000
10000
0
1
2
3
Wat
er c
utGas oil ratio (m3/m3)Water cut (%)
Tubi
ngpr
essu
reD
OP
RD
WP
RG
OR
Fig. 5 Production performance of well TZ B
Fig. 6 Production performance of well TZ C
0
10
20
30
0
2
4
6
Cho
ke s
izeTubing pressure (MPa)
Choke size (mm)
0
10
20
30
2004-3-23 2005-3-23 2006-3-23 2007-3-23 2008-3-23 2009-3-23 2010-3-23
0
2
4
6
8
DG
PRDaily oil production rate (t)
Daily water production rate (t)Daily gas production rate (104m3)
0
10000
20000
30000
0
20
40
60
Wat
er c
utGas oil ratio (m3/m3)Water cut (%)
Tubi
ngpr
essu
reD
OP
RD
WP
RG
OR
Pet.Sci.(2011)8:70-78
76
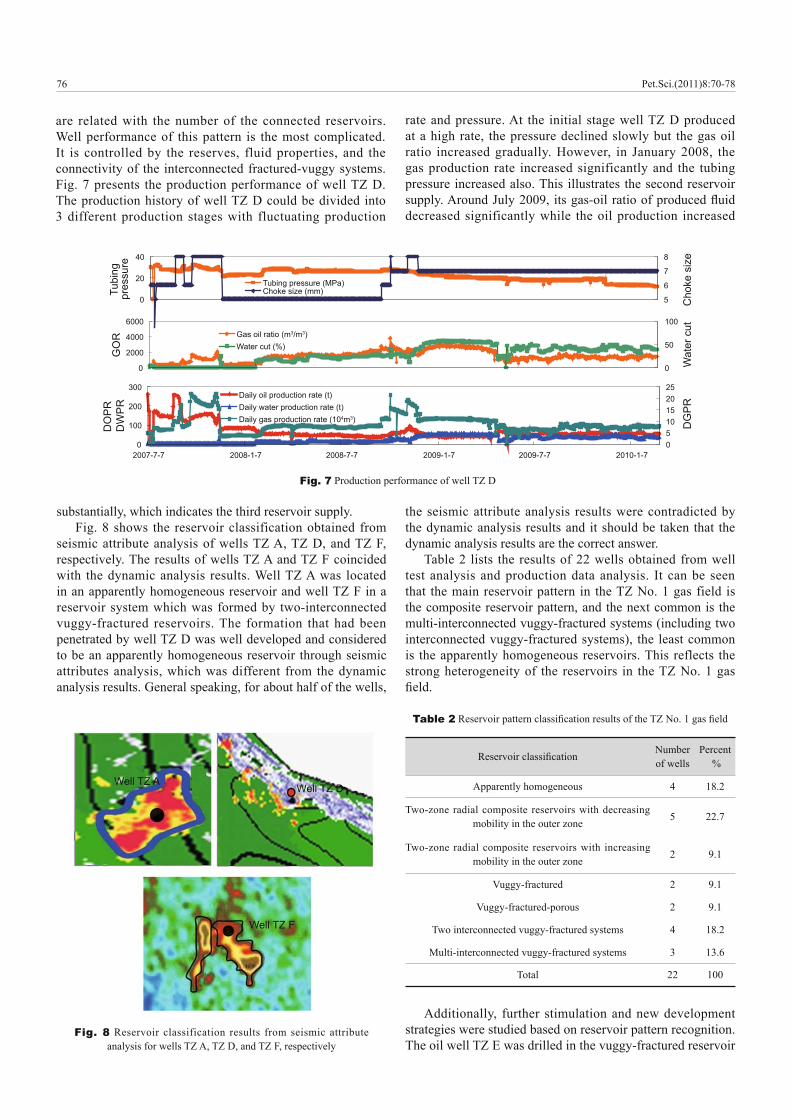
are related with the number of the connected reservoirs. Well performance of this pattern is the most complicated. It is controlled by the reserves, fluid properties, and the connectivity of the interconnected fractured-vuggy systems. Fig. 7 presents the production performance of well TZ D. The production history of well TZ D could be divided into 3 different production stages with fluctuating production
rate and pressure. At the initial stage well TZ D produced at a high rate, the pressure declined slowly but the gas oil ratio increased gradually. However, in January 2008, the gas production rate increased significantly and the tubing pressure increased also. This illustrates the second reservoir supply. Around July 2009, its gas-oil ratio of produced fl uid decreased significantly while the oil production increased
0
20
40
5
6
7
8
Cho
ke s
ize
Tubing pressure (MPa)Choke size (mm)
0
100
200
300
2007-7-7 2008-1-7 2008-7-7 2009-1-7 2009-7-7 2010-1-70510152025
DG
PR
Daily oil production rate (t)Daily water production rate (t)Daily gas production rate (104m3)
0
2000
4000
6000
0
50
100
Wat
er c
ut
Gas oil ratio (m3/m3)Water cut (%)
Tubi
ngpr
essu
reD
OP
RD
WP
RG
OR
Fig. 7 Production performance of well TZ D
substantially, which indicates the third reservoir supply.Fig. 8 shows the reservoir classification obtained from
seismic attribute analysis of wells TZ A, TZ D, and TZ F, respectively. The results of wells TZ A and TZ F coincided with the dynamic analysis results. Well TZ A was located in an apparently homogeneous reservoir and well TZ F in a reservoir system which was formed by two-interconnected vuggy-fractured reservoirs. The formation that had been penetrated by well TZ D was well developed and considered to be an apparently homogeneous reservoir through seismic attributes analysis, which was different from the dynamic analysis results. General speaking, for about half of the wells,
the seismic attribute analysis results were contradicted by the dynamic analysis results and it should be taken that the dynamic analysis results are the correct answer.
Table 2 lists the results of 22 wells obtained from well test analysis and production data analysis. It can be seen that the main reservoir pattern in the TZ No. 1 gas field is the composite reservoir pattern, and the next common is the multi-interconnected vuggy-fractured systems (including two interconnected vuggy-fractured systems), the least common is the apparently homogeneous reservoirs. This reflects the strong heterogeneity of the reservoirs in the TZ No. 1 gas fi eld.
Table 2 Reservoir pattern classifi cation results of the TZ No. 1 gas fi eld
Reservoir classifi cation Number of wells
Percent %
Apparently homogeneous 4 18.2
Two-zone radial composite reservoirs with decreasing mobility in the outer zone 5 22.7
Two-zone radial composite reservoirs with increasing mobility in the outer zone 2 9.1
Vuggy-fractured 2 9.1
Vuggy-fractured-porous 2 9.1
Two interconnected vuggy-fractured systems 4 18.2
Multi-interconnected vuggy-fractured systems 3 13.6
Total 22 100
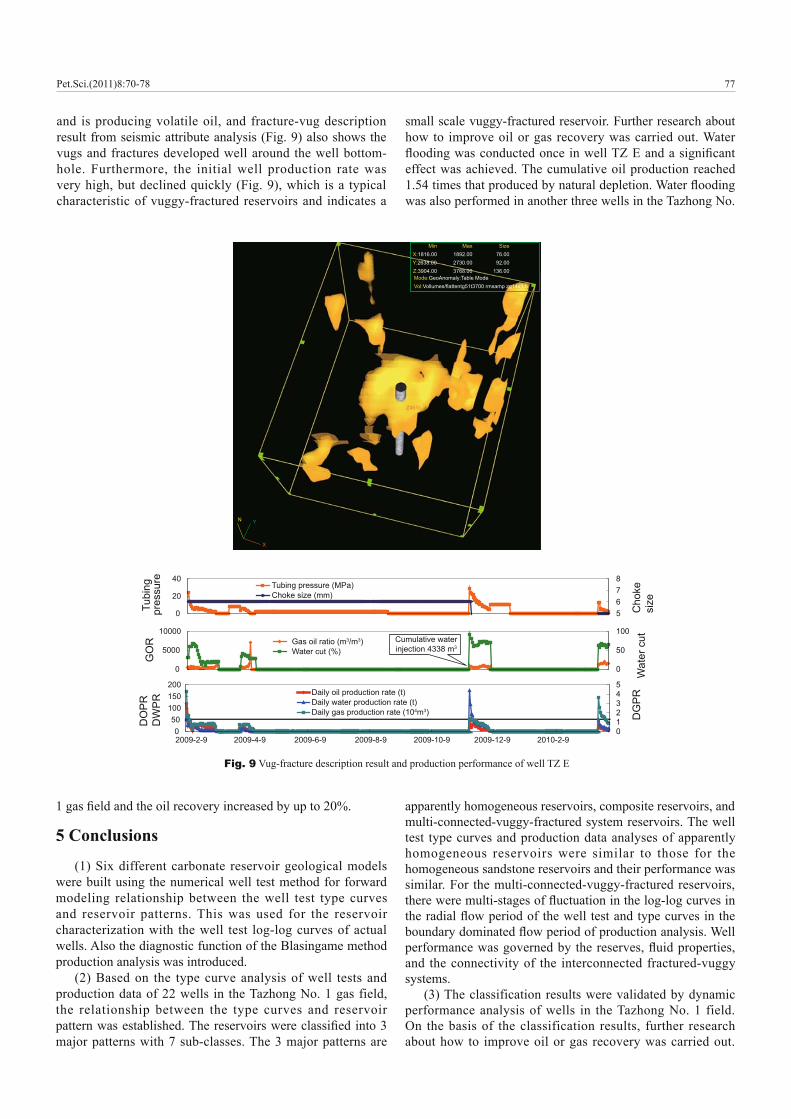
Additionally, further stimulation and new development strategies were studied based on reservoir pattern recognition. The oil well TZ E was drilled in the vuggy-fractured reservoir
Fig. 8 Reservoir classification results from seismic attribute analysis for wells TZ A, TZ D, and TZ F, respectively
Well TZ AWell TZ D
Well TZ F
Pet.Sci.(2011)8:70-78
77
and is producing volatile oil, and fracture-vug description result from seismic attribute analysis (Fig. 9) also shows the vugs and fractures developed well around the well bottom-hole. Furthermore, the initial well production rate was very high, but declined quickly (Fig. 9), which is a typical characteristic of vuggy-fractured reservoirs and indicates a
small scale vuggy-fractured reservoir. Further research about how to improve oil or gas recovery was carried out. Water fl ooding was conducted once in well TZ E and a signifi cant effect was achieved. The cumulative oil production reached 1.54 times that produced by natural depletion. Water fl ooding was also performed in another three wells in the Tazhong No.
Fig. 9 Vug-fracture description result and production performance of well TZ E
Min X:1816.00 Y:2638.00 Z:3904.00 Mode:GeoAnomaly:Table Mode Vol:Vollumes/flattentg51t3700 rmsamp zg14x1.b
Max 1892.00 2730.00 3768.00
Size 76.00 92.00
136.00
Z451c
X
Y N
0
20
40
5678
Tubing pressure (MPa)Choke size (mm)
050
100150200
2009-2-9 2009-4-9 2009-6-9 2009-8-9 2009-10-9 2009-12-9 2010-2-9012345
Daily oil production rate (t)Daily water production rate (t)Daily gas production rate (104m3)
0
5000
10000
0
50
100Gas oil ratio (m3/m3)Water cut (%)
Cumulative waterinjection 4338 m3
Tubi
ngpr
essu
reD
OP
RD
WP
RG
OR
Cho
kesi
zeD
GP
RW
ater
cut
1 gas fi eld and the oil recovery increased by up to 20%.
5 Conclusions
(1) Six different carbonate reservoir geological models were built using the numerical well test method for forward modeling relationship between the well test type curves and reservoir patterns. This was used for the reservoir characterization with the well test log-log curves of actual wells. Also the diagnostic function of the Blasingame method production analysis was introduced.
(2) Based on the type curve analysis of well tests and production data of 22 wells in the Tazhong No. 1 gas field, the relationship between the type curves and reservoir pattern was established. The reservoirs were classifi ed into 3 major patterns with 7 sub-classes. The 3 major patterns are
apparently homogeneous reservoirs, composite reservoirs, and multi-connected-vuggy-fractured system reservoirs. The well test type curves and production data analyses of apparently homogeneous reservoirs were similar to those for the homogeneous sandstone reservoirs and their performance was similar. For the multi-connected-vuggy-fractured reservoirs, there were multi-stages of fl uctuation in the log-log curves in the radial fl ow period of the well test and type curves in the boundary dominated fl ow period of production analysis. Well performance was governed by the reserves, fl uid properties, and the connectivity of the interconnected fractured-vuggy systems.
(3) The classification results were validated by dynamic performance analysis of wells in the Tazhong No. 1 field. On the basis of the classification results, further research about how to improve oil or gas recovery was carried out.
Pet.Sci.(2011)8:70-78
7878
Three single-well water injection tests was performed in the Tazhong No. 1 gas field, and the oil recovery increased by 20%.
AcknowledgmentsThe authors are grateful for the financial support from
“Major Projects about Carbonate Reservoirs of Petrochina (2008E-0610-08)” and “Young Innovation Fund Project of Research Institute of Petroleum Exploration and Development (2009-A-17-13)”.
ReferencesAga rwal R G, Gardner D C, Kleinsteiber S W, et al. Analyzing well
production data using combined type curve and decline curve concepts. Paper SPE 57916 presented at SPE Annual Technical Conference and Exhibition, 27-30 September 1998, New Orleans, Louisiana
And erson D M and Mattar L. Practical diagnostics using production data and fl owing pressures. Paper SPE 89939 presented at SPE Annual Technical Conference and Exhibition, 26-29 September 2004, Houston, Texas
And erson D M, Stotts G W J, Mattar L, et al. Production data analysis — Challenges, pitfalls, diagnostics. Paper SPE 102048 presented at SPE Annual Technical Conference and Exhibition, 24-27 September 2006, San Antonio, Texas, USA
Bel lo R O and Wattenbarger R A. Rate transient analysis in naturally fractured shale gas reservoirs. Paper SPE 114591 presented at CIPC/SPE Gas Technology Symposium 2008 Joint Conference, 16-19 June 2008, Calgary, Alberta, Canada
Bla singame T A, Johnston J L and Lee W J. Type-curve analysis using the pressure integral method. Paper SPE 18799 SPE presented at California Regional Meeting, 5-7 April 1989, Bakersfi eld, California
Bla singame T A, McCray T L and Lee W J. Decline curve analysis for variable pressure drop/variable fl owrate systems. Paper SPE 21513 presented at SPE Gas Technology Symposium, 22-24 January 1991, Houston, Texas
Bor ch C. Applied multisource pressure data integration for dynamic reservoir characterization, reservoir, and production management: A case history from the Siri fi eld, offshore Denmark. Paper SPE 71629 presented at SPE Annual Technical Conference and Exhibition, 30
September-3 October 2001, New Orleans, LouisianaDou blet L E, Pande P K, Clark M B, Nevans J W, et al. An integrated
geologic and engineering reservoir characterization of the North Robertson (Clearfork) Unit: A case study. Part 1. Paper SPE 29594 presented at Low Permeability Reservoirs Symposium, 19-22 March 1995, Denver, Colorado
Esc obar F H, Garcia-Rocha H, Suaza I M, et al. Well pressure behavior for a vertical well in a gas condensate naturally-fractured reservoir. Paper SPE 107721 presented at Latin American & Caribbean Petroleum Engineering Conference, 15-18 April 2007, Buenos Aires, Argentina
Fet kovich M J. Decline curve analysis using type curves. Journal of Petroleum Technology. 1980. 32(6): 1065-1077
Gri ngarten A C, Bozorgzadeh M, Daungkaew S, et al. Well test analysis in lean gas condensate reservoirs: Theory and practice. Paper SPE 100993 presented at SPE Russian Oil and Gas Technical Conference and Exhibition, 3-6 October 2006, Moscow, Russia
Han Y X, Zhuang H N and Sun H D. Application of a numerical well test analysis technique in gas reservoir characterization. Well Test. 2006. 15(2): 9-11 (in Chinese)
Li Y, Li B Z, Hu Y L, et al. The application of modern production decline analysis in the dynamic analysis of gas condensate reservoirs. Natural Gas Geoscience. 2009a. 20(2): 304-308 (in Chinese)
Li Y, Li B Z, Hu Y L, et al. The application of single-well production analysis for carbonate gas condensate reservoirs. Petroleum Geology and Recovery Effi ciency. 2009b. 16(5): 79-81 (in Chinese)
Mat tar L and Anderson D M. A systematic and comprehensive methodology for advanced analysis of production data. Paper SPE 84472 presented at SPE Annual Technical Conference and Exhibition, 5-8 October 2003, Denver, Colorado
Mat tar L and McNeil R. The flowing gas material balance. Journal of Canadian Petroleum Technology. 1998. 37(2): 37-42
Rus hing J A and Blasingame T A. Integrating short-term pressure buildup testing and long-term production data analysis to evaluate hydraulically-fractured gas well performance. Paper SPE 84475 presented at SPE Annual Technical Conference and Exhibition, 5-8 October 2003, Denver, Colorado
Weh ner S C, Raines M A, Davis T L, et al. Dynamic reservoir characterization at Central Vacuum Unit. Paper SPE 63134 presented at SPE Annual Technical Conference and Exhibition, 1-4 October 2000, Dallas, Texas
(Edited by Sun Yanhua)
Pet.Sci.(2011)8:70-78