classification of roof materials for … · classification of roof materials for rainwater...
TRANSCRIPT

CLASSIFICATION OF ROOF MATERIALS FOR RAINWATER POLLUTIONMODELIZATION
Arnaud Le Bris a and Pauline Robert-Sainte b
a Institut Geographique National (IGN) - MATIS Laboratory2-4 Avenue Pasteur - 94165 SAINT-MANDE Cedex - FRANCE
[email protected] Universite Paris-Est, LEESU, UMR-MA102 - AgroParisTech
6-8 Avenue Blaise Pascal - Cite Descartes - Champs sur Marne - 77455 MARNE-LA-VALLEE Cedex 2 - [email protected]
KEY WORDS: Supervised classification, Image segmentation, Roofing materials, Roofs, Rainwater pollution
ABSTRACT:
It has been proven that roof runoff water plays an important role in the high metallic concentration levels in urban rainwater sincemetallic elements are generated by corrosion of roof materials before being swept away by rainwater. The aim of TOITEAU project istherefore to model this phenomenon, evaluating the metallic flows from roofs in rainwater. To achieve this goal, an important work hasalready been done to model those flows at roof scale. But, it has now to be extrapolated to a whole drainage area, requiring knowledgeabout the areas concerned by the different kinds of roof coverage, that is to say that a map of roof materials is needed. Such informationcan be extracted from aerial (ortho-)images owing to (supervised) classification techniques. In the present situation, only six classescorresponding to the following kinds of roofs were defined : zinc plates, slates, red tiles, brown tiles and flat roofs.Nevertheless, classification results are limited because of several factors that have therefore to be dealt with.First of all, some distinct classes have very similar radiometric distribution (such as for instance zinc and at light slates), making ithard to distinguish between them. That’s why derived channels computed from initial red-green-blue channels of the ortho-image havebeen used to improve the classification results. Texture channels have also been tested especially to discriminate zinc from other lightcoloured roof materials. For the same reason and in order not to obtain a too ”noisy” result, per region classification algorithms havebeen used : homogeneous regions will be classified instead of pixels. Secondly, roofs are the only interesting parts of the ortho-imagein this study. As a consequence, a building mask is first computed from digital topographic database BDTopo in order to classify onlyroofs. However, several elements concerning data precision have to be taken into account at this step. For instance, the ortho-imageand the topographic database can obviously not have been captured at the same date and, as a consequence, buildings can have beendestroyed, modified or built between these two distinct capture times. In addition, as the used ortho-image is not a ”true ortho-image”,building objects from digital topographic database and ortho-image roofs are not perfectly superposed. However, these topographicdatabase building objects can be registered to the ortho-image. Nevertheless, it must be said that these database objects often remaincaricatures of true buildings. Besides, most of the time, homogeneous regions to be classified do not directly correspond to databasebuildings since those database objects can be groups of buildings or buildings of which the roof is composed of different materials.Therefore, it is necessary to segment building areas (according to the topographic database) of the ortho-image into homogeneousregions that are then classified.Lastly, shadows can be quite important in roof areas because of the presence of roof superstructures or higher buildings in the neigh-bourhood. That’s why an additional class ”shadow” is also defined in order to take into account shadow areas where radiometricinformation is not sufficient to discriminate between the different kinds of materials.Tests have been carried out on two distinct study areas with 50cm resolution orthophotos for the first one and 12cm resolution orthoim-ages for the second one. The first study area was a dense urban centre, whereas the second could be divided into several parts : aresidential suburb consisting of houses, a dense urban centre with buildings having up to 4-5 levels and a mixed residential / servicearea consisting of higher buildings.
1 INTRODUCTION
1.1 TOITEAU project
Zinc-based materials are largely used in urban areas, especiallyfor infrastructure, such as furniture or siding and roofing for build-ings. Exposed to atmospheric conditions (environmental pollu-tants, relative humidity, rain events...), these materials are pro-gressively corroded. During a rain event, a part of the corrosionproducts formed at their surface will be retained, and the otherpart will be released and washed off.Several research programs lead since the 1990’s have shown thevery high trace metal contamination of runoff from metallic orpartly metallic roofs (Forster, 1996), (Gromaire-Mertz et al.,1999). In Paris, experiments conducted on a 42 ha urban catch-ment have established that atmospheric corrosion of roofing ma-terials could be a major source of zinc, cadmium, lead and copper
during wet weather (Chebbo et al., 2001). Several researches onspeciation of metals from roofing materials have been carried out,showing that zinc emissions are mainly in the labile form (Heijer-ick et al., 2002), which is very bioavailable and therefore harmfulto aquatic organisms (both animals and plants).Thus, in the actual context of the European Water Framework Di-rective (2000/60 CE), whose aim is to obtain a good ecologicalstate of aquatic environments, it seems necessary to reduce theproduction of pollutants at their sources. This implies to identifysources and to quantify emissions.TOITEAU project has begun in 2005, with the aim of developinga methodology for the estimation of annual metallic flows fromroofs at the catchment area scale. This work implies on one handthe estimation of metallic runoff rates from different roofing ma-terials, and on the other hand the identification and the quantifica-tion of the different roof surface areas, using aerial photographs

and image classification tools.The first part leads to a large database of runoff rates, concern-ing 12 materials and 13 metallic species. Complementary exper-iments - focused on the effect of inclination and length of flow- and carried out both at the test bed scale (see figure 1) and atthe roof scale in order to verify the transposition of runoff ratesat larger spatial scales, lead to the conclusion that projected areasare sufficient to predict and model metal runoff from materials(Robert-Sainte, 2009).
Figure 1: Experimental evaluation of the effect of inclination onrunoff rates
1.2 Measure roof material areas
As previously said in 1.1, work has been done to model metallicrunoff rates for roofing materials. To extrapolate these results towhole drainage areas, knowledge about the areas concerned bythe different kinds of roof coverage is required : a map of roof-ing materials is needed. Such information can be extracted fromaerial (ortho-)images through classification.Roofing materials classification from aerial images has alreadybeen studied. For instance, an approach using hyperspectral andlaser scanning data is presented in (Lemp and Weidner, 2004).The method described in (Martinoty, 2005) uses BidirectionalReflectance Distribution Function (BRDF) of materials computedfrom red-green-blue-near infrared aerial images and 3D data.In the present case, only red-green-blue ortho-images (and a 2Dtopographic database to focuse on buildings) are available. Fur-thermore, as experiments have shown that projected areas are suf-ficient to predict and model metal runoff from materials, ortho-images can be used directly, without 3D information. Therefore,the chosen method simply consists in classifying them (through asupervised classification method) into the following classes zincplates, slates, red tiles, brown tiles and flat roofs. This approach isvery simple but it will have to face several limits and difficulties.
2 DIFFICULTIES AND LIMITS
2.1 Similar classes and radiometric variations inside classes
Some distinct roofing materials classes have very similar radio-metric distributions (as it can be seen on image histogram repre-sented on figure 2), making it often hard to distinguish betweenthem, even for a human operator. For instance, brown tiles andslates often look like each other on the image.Using associations of derived channels calculated from originalred-green-blue spectral bands of the ortho-image is a way to im-prove classification results. The use of per region classificationalgorithms can also improve results since it enables to take intoaccount the radiometric distribution of whole regions instead of
Figure 2: Image histogram for channel “red” for the differentclasses
isolated pixels.However, this problem is increased by the fact that the radiom-
etry can greatly vary inside a same class. These variations arecaused by several factors and can lead to misclassifications :
• Roof orientation linked to Sun illumination angle is the mainreason. Therefore, a same roofing material can appear verydifferent from one side of a roof to an other. This phe-nomenon is particularly important for slates and zinc platesas shown by figure 3: slates at light can appear as light aszinc plates whereas zinc plates at shadow are sometimes asdark as some slates... Misclassifications occurs also betweenred and brown tiles because of differences of Sun illumina-tion.
Figure 3: Example of important radiometric variations caused byroof orientation linked to Sun illumination and making it verydifficult to distinguish between slates and zinc plates
• The colour of roofing materials obviously depends on theirage, because of corrosion.
• Objects of a same class can have different colours for differ-ent reasons (painted zinc plates, tiles more red than others...)
2.2 Shadows
Shadow areas can obviously be important in urban aeras. Theymostly concern streets but roofs can also be partly masked byshadows caused by higher buildings or roof superstructures. Ifnothing is done to deal with this phenomenon, shadow regionsare classified into the two “darkest classes” slates and brown tiles,leading to an over estimation of the areas covered by these mate-rials.As a consequence, an additional class “shadow” is also definedin order to take into account shadow areas where radiometric in-formation is not sufficient to discriminate between the differentkinds of materials.
2.3 Building database
Roofs are the only interesting parts of the image for the classi-fication. As a consequence, a mask is computed from buildingobjects of a topographic database to focuse on them. Neverthe-less, several elements concerning data precision have to be takeninto account at this step.
• First of all, the ortho-image and the topographic databasecan obviously not have been captured at the same date and,as a consequence, buildings can have been destroyed, mod-ified or built between these two distinct capture times.
• The used ortho-image is not a “true ortho-image”. As a con-sequence, building objects from the topographic databaseand roofs on the ortho-image are not perfectly superposed(as it can be seen on figure 4). However, these buildings canbe registered to the ortho-image.
Figure 4: Building objects of the topographic database and roofson the ortho-image are not perfectly superposed
• Nevertheless, it must be said that building objects from thedatabase often remain caricatures of true buildings. There-fore, they can sometimes be wider (containing other partsof the image such as balconies, courtyards or even part ofstreets) or on the contrary not contain the full roof.
• Besides, most of the time, homogeneous roof coverage re-gions to be classified do not directly correspond to buildingobjects of the database since those objects can be groupsof buildings or even buildings of which the roof is coveredby several materials. Therefore, it is necessary to segmentbuilding areas (according to the topographic database) of theortho-image into homogeneous roofing material regions thatwill then be classified.
2.4 Non roof coverage elements
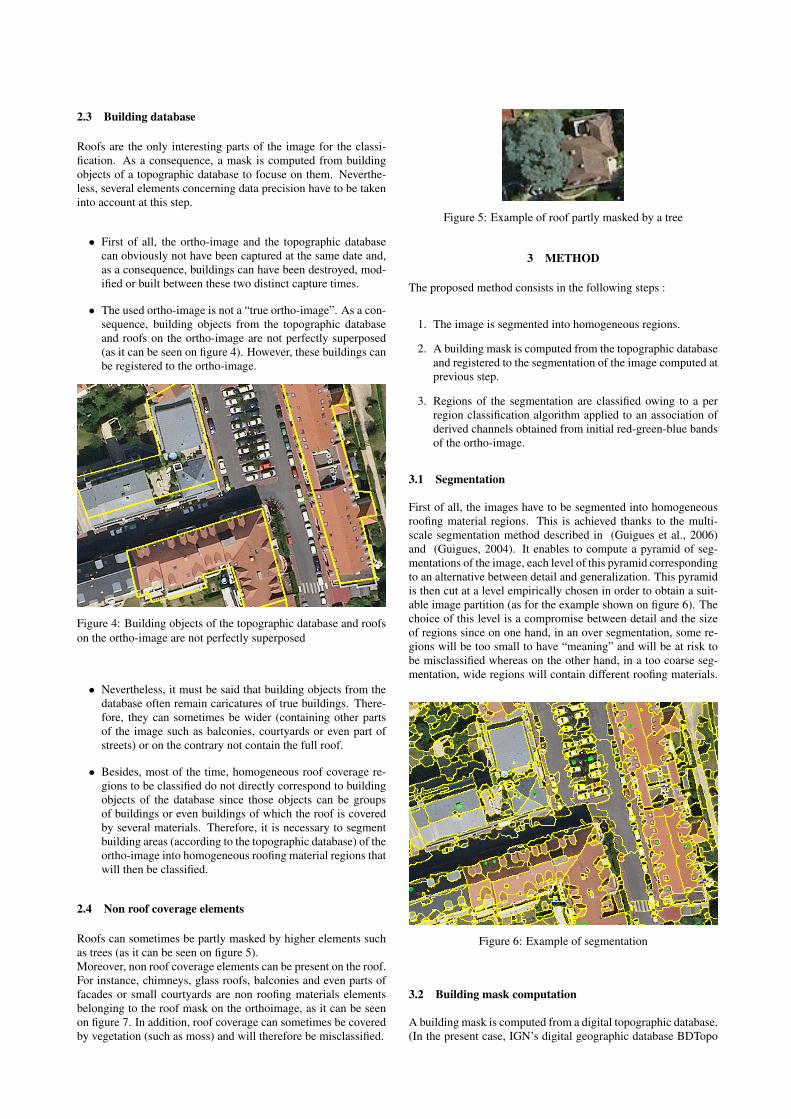
Roofs can sometimes be partly masked by higher elements suchas trees (as it can be seen on figure 5).Moreover, non roof coverage elements can be present on the roof.For instance, chimneys, glass roofs, balconies and even parts offacades or small courtyards are non roofing materials elementsbelonging to the roof mask on the orthoimage, as it can be seenon figure 7. In addition, roof coverage can sometimes be coveredby vegetation (such as moss) and will therefore be misclassified.
Figure 5: Example of roof partly masked by a tree
3 METHOD
The proposed method consists in the following steps :
1. The image is segmented into homogeneous regions.
2. A building mask is computed from the topographic databaseand registered to the segmentation of the image computed atprevious step.
3. Regions of the segmentation are classified owing to a perregion classification algorithm applied to an association ofderived channels obtained from initial red-green-blue bandsof the ortho-image.
3.1 Segmentation
First of all, the images have to be segmented into homogeneousroofing material regions. This is achieved thanks to the multi-scale segmentation method described in (Guigues et al., 2006)and (Guigues, 2004). It enables to compute a pyramid of seg-mentations of the image, each level of this pyramid correspondingto an alternative between detail and generalization. This pyramidis then cut at a level empirically chosen in order to obtain a suit-able image partition (as for the example shown on figure 6). Thechoice of this level is a compromise between detail and the sizeof regions since on one hand, in an over segmentation, some re-gions will be too small to have “meaning” and will be at risk tobe misclassified whereas on the other hand, in a too coarse seg-mentation, wide regions will contain different roofing materials.
Figure 6: Example of segmentation
3.2 Building mask computation
A building mask is computed from a digital topographic database.(In the present case, IGN’s digital geographic database BDTopo

is used.) Roofs and therefore buildings are indeed the only inter-esting parts of the image. However, as previously explained in2.3, database building objects and ortho-image roofs are not per-fectly superposed.Nevertheless, building objects from the topographic database canbe registered to the ortho-image. In the present case, building ob-jects are in fact rasterized and then registered to the segmentation(obtained at previous step) : a 2D rigid raster-raster registrationof rasterized buildings to the segmentation is processed for eachbuilding object of the database using Insight ToolKit Registrationtools (Ibanez et al., 2005). It consists in computing the best pa-rameters of a 2D rigid transform (a 2D similitude in this case)minimizing a metric (based on mutual information here) betweenthe two images.Obtained results are quite good (as it can be seen on figure 7),except for the highest buildings for which the shift between theroof on the orthoimage and the corresponding database buildingobject is sometimes too important.It must also be said that methods to obtain a finer registrationexist (see for example (Trias-Sanz, 2006)), but don’t solve theproblems described in 2.4.
Figure 7: Example of building mask registration for 3 buildingobjects. (The situation before registration is shown by figure 4.)
3.3 Derived channels
The use of derived channels calculated from original bands ofthe orthoimage can improve classification results. These chan-nels can be radiometric channels computed as combinations ofthe original bands (such as channels of an other colour space orindices as the well known ndvi computed from red and near in-frared bands to discriminate vegetation) or texture channels.For instance, in the present tests, the following derived channelshave been used :logrg = log(red) − log(green) (a log-opponent chromaticitychannel)logrs = log(red)− log(red+ green+ blue)Furthermore, these channels are used in association in the clas-sification process. Therefore, the choice of good associations ofchannels is important to obtain good classification results.
3.4 Classification
The regions of the segmentation are classified by the classifica-tion tool described in (Trias-Sanz, 2006) and (Trias-Sanz andBoldo, 2005). It works in two steps :
1. Model estimation from training data captured by an oper-ator : First, for each class, the best parameters of several
statistical distributions (such as gaussian, laplacian laws butalso histograms (raw or obtained by kernel density estima-tion)...) are computed to fit to the radiometric n-dimensionalhistogram of the class (with n number of channels used forthe classification). Then the best model is selected thanks toa Bayes Information Criterion enabling to choose an alter-native between fit to data and model complexity.
2. Classification : The image can then be classified know-ing the statistical model of the radiometry of the differentclasses. Several per pixel and per region classification algo-rithms are proposed in (Trias-Sanz, 2006) :
• Maximum A Posteriori (MAP) and Maximum Likelihood (ML)per region classification algorithms : The label co(R) givento a region R is its most probable class according to themodel previously estimated (and to prior probabilities). Hence,with the MAP algorithm, co(R) is the class c that maximizesthe following function : Pprior knowledge(c(R) = c)·(∏
pixel s∈RPmodel(I(s)|c(s) = c)
) 1Card R
with I(s) standing for the radiometry vector of pixel s, c(z)meaning region or pixel “z’s class” and P (c(z) = c) stand-ing for the probability for pixel or region z to belong to classc. Such a method enables to take easily into account externalinformation as prior probability.
• per region classification algorithms based on the compari-son of distributions : The label given to a region is the classwith the most similar model to the distribution of pixel val-ues in the region to be classified. (Instead of calculatingthe probability that the pixels in a region come from a cer-tain random variable, distributions of pixels values in theregion to be classified are compared to the probability func-tion of the models previously estimated in order to find theclass with most similar distribution.) The χ2 statistic and theKullback-Leibler divergence (also called relative entropy)are two possible dissymilarity coefficients to use to comparethese distributions.
4 TESTS AND RESULTS
The method has been tested on two distinct study areas (Le Maraisdistrict in Paris and Noisy-le-Grand) with different urban infras-tructures. Image resolution was different for the two study areas.Several classification methods and associations of derived chan-nels from original red-green-blue bands of the ortho-images havebeen tested.Results have been evaluated both visually on the whole imageand numerically, calculating confusion matrices on smaller partsof the study area. Confusion matrices are computed from test datacaptured by an operator and enable to calculate user and produceraccuracies. Nevertheless it must be said that it was sometimesdifficult even for a human operator to identify roofing materialson the image.
4.1 Le Marais - Paris
The first test area is a dense urban centre located in Le Maraisdistrict in Paris. 50cm resolution orthophotos (with red-green-blue bands) from the IGN’s national orthoimages database wereavailable there (see figure 8).Results obtained with the different per region classification meth-ods are quite similar. The best results (see figure 9 and table 1)have been obtained for several associations of derived channels.For instance, the associations of channels red/logrs, red/logrg and

Figure 8: 50cm resolution ortho-image on Paris - Le Marais
even red/blue give almost 77 % pixels well classified, which canbe considered as a good result taking into account the quality ofthe processed data. Most misclassifications occur between slatesand zinc at shadow and between slates and brown tiles. Misclas-sifications between red tiles and flat roofs sometimes happen too.
Figure 9: Example of results obtained in Le Marais for MAP perregion classification algorithm applied to red/logrg channels as-sociation. (red tiles in light red, brown tiles in dark red, slates inblue, zinc plates in light grey, flat roofs in green, shadows in darkgrey)
4.2 Noisy-le-Grand
The second test area is the town of Noisy-le-Grand. It can bedivided into several parts :
• a residential suburb consisting of houses,
• a dense urban centre with buildings having up to 4-5 levels
• a mixed residential / service area consisting of higher build-ings.
12cm resolution red-green-blue orthoimages have been used (seefor example figures 3, 4 or 5). Such resolution could enable theuse of texture information especially to distinguish zinc platesfrom other materials. (Zinc roofing coverage has indeed a partic-ular and regular texture, whereas other materials present a homo-geneous texture.) Nevertheless, there has been no real improve-ments since this texture is often not really visible on the used im-ages because of roof orientation linked to Sun illumination angle.Furthermore, there is no real texture for some small zinc areas onthe top of roofs or of roof windows.As for the first test area, results obtained by the different per re-gion classification algorithms are quite similar. The best resultswith almost 82% well classified pixels have been obtained forseveral channels associations as for example red/logrs or red/blue/logrs(see table 1 and figures 10 and 11).Misclassifications mostly concern slates and zinc plates, whichare sometimes difficult to distinguish from each other even for anoperator. Other misclassifications often occur between flat roofsand other themes, but it must be said that those errors could beavoided by the use of information from a 3D city model. Fur-thermore, some buildings present important roof balconies withplants, leading to misclassification.
Table 1: User (us acc) and producer (pr acc) accuracies (in %)obtained in Le Marais for MAP per region classification algo-rithm applied to red/logrs channels association and in Noisy-le-Grand for chi2 per region classification algorithm applied tored/blue/logrs channels association
Paris - Le Marais Noisy-le-GrandClass us acc pr acc us acc pr accRed tiles 99.3 30.0 95.9 89.4Brown tiles 62.8 63.7 65.3 77.9Slates 63.0 63.1 76.3 80.6Zinc plates 89.8 89.2 64.3 77.3Flat Roofs 15.8 64.3 90.6 80.4Well classified pixels 76.7 82.3
5 CONCLUSION
The method proves to be quite powerful and relatively easy to usefor areas where orthophotos are available. The results obtainedare promising, with about 75 to 80% of surface areas well classi-fied. The image quality contributes to determine the performanceof the classification - shooting limits (shadows, correct contrast,resolution enabling the use of texture channels).The main source of error is confusion between similar radiome-try. Nevertheless, if some (red tiles / brown tiles, brown tiles /slates) remain insignificant in the context of the use made for theevaluation of metal flows from roofs, others are more problematic(slates/zinc).Such a tool is essential for the evaluation of metal roof surfacesthroughout a watershed. Anyway, the use of the described clas-sification method alone does not give a sufficiently detailed esti-mate of all the metal surfaces implemented: if the performance isgood to evaluate the ramp surfaces, the individual little elementscan not be taken into account in this review, these elements aregenerally not visible on the aerial photograph. These metallicelements can be numerous and cumulatively represent importantareas, efforts should be made to estimate them too.

Figure 10: Example of result obtained in Noisy-le-Grand forMAP per region classification algorithm applied to red/blue/logrschannels association. (with the same legend as for figure 9)
REFERENCES
Chebbo, G., Gromaire, M., Ahyerre, M. and Garnaud, S., 2001.Production and transport of urban wet weather pollution in com-bined sewer systems: the marais experimental catchment in paris.Urban Water 3(1-2), pp. 3–15.
Forster, J., 1996. Heavy metal and ion pollution patterns inroof runoff. In: 7th International Conference on Urban StormDrainage, Hannover, Germany.
Gromaire-Mertz, M., Garnaud, S., Gonzalez, A. and Chebbo, G.,1999. Characterisation of urban runoff pollution in paris. Water,Science and Technology 39(2), pp. 1–8.
Guigues, L., 2004. Modeles Multi-Echelles pour la Segmentationd’Images. PhD thesis, Ecole Doctorale Sciences et Ingenierie del’Universite de Cergy-Pontoise.
Guigues, L., Cocquerez, J.-P. and Le Men, H., 2006. Scale setsimage analysis. International Journal of Computer Vision 68(3),pp. 289–317.
Heijerick, D., Janssen, J., Karlen, C., Odnevall Wallinder, I. andLeygraf, C., 2002. Bioavailability of zinc in runoff water fromroofing materials. Chemosphere 47, pp. 1073–1080.
Figure 11: Example of result obtained in Noisy-le-Grand forMAP per region classification algorithm applied to red/blue/logrschannels association. (with the same legend as for figure 9)
Ibanez, L., Schroeder, W., Ng, L. and Cates, J., 2005. The ITKSoftware Guide. Second edn, Kitware, Inc. ISBN 1-930934-15-7,http://www.itk.org/ItkSoftwareGuide.pdf.
Lemp, D. and Weidner, U., 2004. Use of hyperspectral and laserscanning data for the characterization of surfaces in urban areas.In: XXth ISPRS Congress 2004, Istanbul, Turkey.
Martinoty, G., 2005. Reconnaissance de materiaux sur des im-ages aeriennes en multirecouvrement, par identification de fonc-tions de reflectance bidirectionnelles. PhD thesis, UniversiteParis 7 - Denis Diderot.
Robert-Sainte, P., 2009. Contribution des materiaux de couver-ture a la contamination metallique des eaux de ruissellement.PhD thesis, Universite Paris-Est.
Trias-Sanz, R., 2006. Semi-automatic high-resolution rural landcover classification. PhD thesis, Universite Paris 5, Paris, France.
Trias-Sanz, R. and Boldo, D., 2005. A high-reliability, high-resolution method for land cover classification into forest andnon-forest. In: H. Kalviainen, J. Parkkinen and A. Kaarna (eds),Proc. of the Scandinavian Conference on Image Analysis (SCIA),Lecture Notes in Computer Science, Vol. 3540, Springer, Joen-suu, Finland, pp. 831–840.