clean development mechanism project design document … pdd beatrix... · project design document...
TRANSCRIPT

PROJECT DESIGN DOCUMENT FORM (CDM PDD) - Version 03 CDM – Executive Board page 1
CLEAN DEVELOPMENT MECHANISM PROJECT DESIGN DOCUMENT FORM (CDM-PDD)
Version 03 - in effect as of: 28 July 2006
CONTENTS A. General description of project activity B. Application of a baseline and monitoring methodology C. Duration of the project activity / crediting period D. Environmental impacts E. Stakeholders’ comments
Annexes Annex 1: Contact information on participants in the project activity Annex 2: Information regarding public funding Annex 3: Baseline information
Annex 4: Monitoring plan

PROJECT DESIGN DOCUMENT FORM (CDM PDD) - Version 03 CDM – Executive Board page 2 SECTION A. General description of project activity A.1. Title of the project activity: >> The Capture, Destruction and Utilisation of Mine Methane at the Beatrix West Shaft in South Africa Version 1.0 Date: 04 April 2012 A.2. Description of the project activity: >> Purpose: The proposed project activity is to reduce greenhouse gas emissions through the capture, destruction and utilisation of mine methane from the West shaft of the Beatrix Gold Mine. The Beatrix Gold Mine (hereafter referred to as “Beatrix”) is owned and operated by GFI Mining South Africa, a wholly owned subsidiary of Gold Fields Ltd. The Beatrix West shaft is located 10.2 km North-West of the Beatrix One Shaft where CDM project 4728 was registered on 10 June 2011.
Figure 1: Project location relative to Project 4728

PROJECT DESIGN DOCUMENT FORM (CDM PDD) - Version 03 CDM – Executive Board page 3 Methane is released by mining activities in the Beatrix West shaft. The gas is released when mining activity intersects methane carrying geological faults. Currently, the methane is diluted with ventilation air to below its explosion limits and released into the atmosphere through ventilation shafts. The proposed project will install structures underground to capture the methane and pipe it to the Beatrix West ventilation shaft where it will be piped to surface. Once at surface, the methane will be flared and used to generate electricity. Electricity will be generated in internal combustion engines. Waste heat from the internal combustion engines will be used in absorption chillers. The excess methane that cannot be handled by the engines will be flared in an enclosed flare. The electricity generated in the project activity will be used as captive capacity to displace grid electricity at the Beatrix West shaft. The refrigeration produced by the absorption chillers will replace refrigeration from compressor chillers using grid electricity. The baseline scenario for this project activity is the continuation of the current practice, which is to dilute and vent the mine methane and import electricity from the grid. GHG Reduction: The project will reduce greenhouse gasses in three ways:
• The flaring of methane will reduce the amount of methane released into the atmosphere to below that of the baseline.
• The use of methane to generate electricity will reduce the amount of electricity Beatrix needs to import from the South African grid. South African grid electricity is generated predominantly from low grade coal.
• The use of waste heat in absorption chillers will further reduce the amount of electricity imported from the grid by displacing chilling capacity from electrically driven compressor chillers.
Contribution to Sustainable Development: The project makes positive contributions to sustainable development. The South African Designated National Authority (DNA) evaluates sustainability in three categories: Economic, environmental and social. The contribution of the project towards sustainable development is discussed in terms of these three categories:
• Economic: The project will contribute to foreign reserve earnings for South Africa via the carbon credit sales revenue.
• Environmental: At a regional level, the project will have a positive impact on the environment. This positive impact relates to a reduction in the generation of coal-based electricity and its associated environmental consequences. These consequences include: the impact of coal mining, the utilisation of scarce water resources, SO2 emissions and the impacts associated with the disposal of coal ash.

PROJECT DESIGN DOCUMENT FORM (CDM PDD) - Version 03 CDM – Executive Board page 4
The project will result in a reduction of greenhouse gas emissions by eliminating the release of methane; which has a global warming potential of 21 times that of carbon dioxide.
• Social: The project will create jobs in both the construction and operations phase.
GFI Mining South Africa have committed to contributing a percentage (R0.20 per ton of CO2e and 0.5% of pre-tax profit) of their carbon credit revenue to The Gold Fields Foundation. This is similar to the contribution GFI Mining South Africa makes out of gold mining revenue in terms of its social sustainable development obligations as dictated by the South African mining legislative framework relating to sustainable development. The Gold Fields Foundation is involved in a number of projects aimed at the social wellbeing of the local communities. These projects target local economic development with a positive environmental impact. Examples of these projects include:
– Golden Oils – a community based, indigenous plant essential oil project – Bulk water supply to the Lejweleputswa District – Land and housing project in Masilonyana – Beatrix day-care facilities
A.3. Project participants: >> Name of Party involved (*) ((host) indicates a host Party)
Private and/or public entity(ies) project participants (*) (as applicable)
Kindly indicate if the Party involved wishes to be considered as project participant (Yes/No)
Republic of South Africa (host) GFI Mining South Africa (Pty) Ltd
No
A.4. Technical description of the project activity: A.4.1. Location of the project activity: >> A.4.1.1. Host Party(ies): >> The host party is the Republic of South Africa. A.4.1.2. Region/State/Province etc.: >> The project is located in the Free State Province. A.4.1.3. City/Town/Community etc.: >> Beatrix mine is situated south of Virginia in an area known as the “Welkom Gold Fields.” Beatrix mine is in the Theunissen district of the Free State. Beatrix falls under Masilonyana Local Municipality and Lejweleputswa District Municipality.

PROJECT DESIGN DOCUMENT FORM (CDM PDD) - Version 03 CDM – Executive Board page 5 A.4.1.4. Details of physical location, including information allowing the unique identification of this project activity (maximum one page): >> The project activity will be implemented at the Beatrix West shaft. The GPS coordinates of the shaft are: 28° 11.172'S 26° 43.309'E
Figure 1: Map of Southern Africa
Figure 4: Beatrix West site layout
Project Location

PROJECT DESIGN DOCUMENT FORM (CDM PDD) - Version 03 CDM – Executive Board page 6 A.4.2. Category(ies) of project activity: >> The project category is: Sectoral Scope 10: Fugitive emissions from fuels (solid, oil and gas) A.4.3. Technology to be employed by the project activity: >> The methane is found in geological faults in the Freestate goldfields where the Beatrix Gold Mine is situated (Hugo, 1963). This methane is liberated when a methane carrying fault is intersected during the mining operations. The methane will be captured by sealing off areas into which the methane is released by geological faults. Pipes will be installed to transport the methane from these areas to the vent shaft and up the vent shaft to surface. The implementation of this project results in a transfer of environmentally safe and sound technology, and know-how to be used, to the Host Party. The technology implemented is proven technology (a similar project has been implemented at another shaft on the Beatrix mins) adhering to international standards. The Gold Fields employees will be trained to have the required know-how of the technology and the functioning of the project activity. Methane is released by mining activities in the Beatrix West shaft. The gas is released when mining activity intersects methane carrying geological faults. Currently, the methane is diluted with ventilation air to below its explosion limits and released into the atmosphere through ventilation shafts. The proposed project will install structures underground to capture the methane and pipe it to the Beatrix West ventilation shaft where it will be piped to surface. Once at surface, the methane will be flared and used to generate electricity. Electricity will be generated in internal combustion engines. Waste heat from the internal combustion engines will be used in absorption chillers. The excess methane that cannot be handled by the engines will be flared in an enclosed flare. The electricity generated in the project activity will be used as captive capacity to displace grid electricity at the Beatrix West shaft. The refrigeration produced by the absorption chillers will replace refrigeration from compressor chillers using grid electricity. The baseline scenario for this project activity is the continuation of the current practice, which is to dilute and vent the mine methane and import electricity from the grid.
PROJECT DESIGN DOCUMENT FORM (CDM PDD) - Version 03 CDM – Executive Board page 7
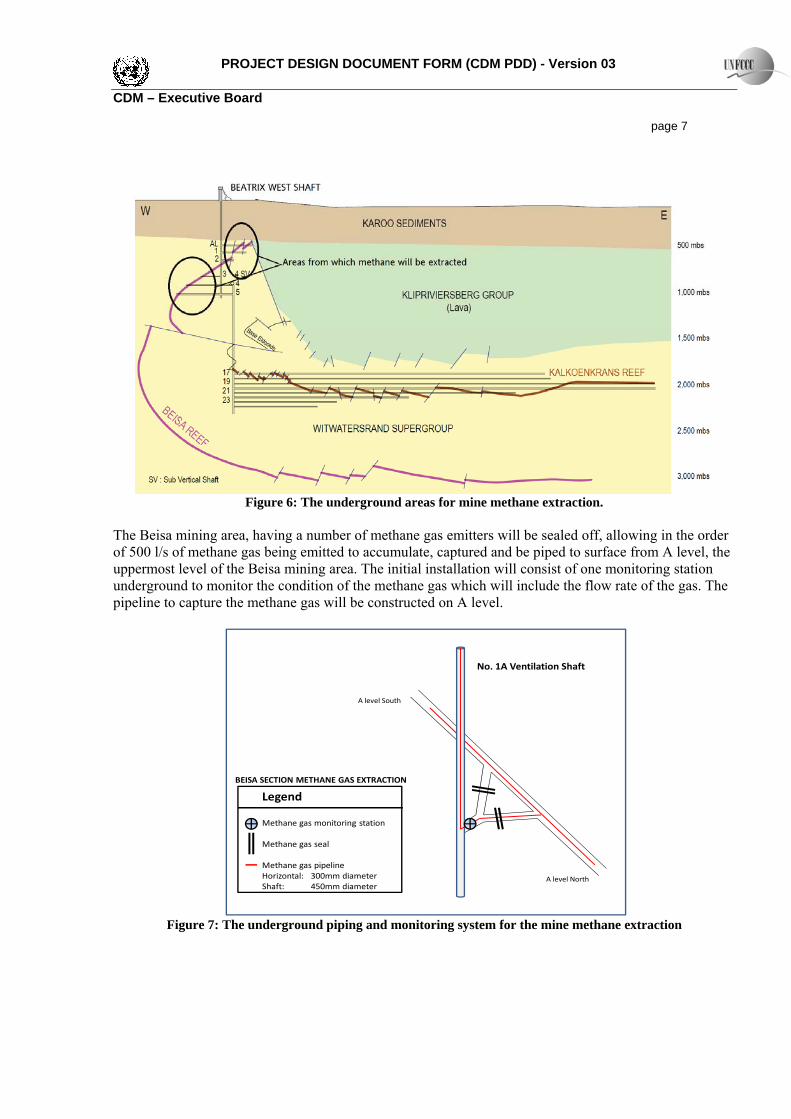
Figure 6: The underground areas for mine methane extraction.
The Beisa mining area, having a number of methane gas emitters will be sealed off, allowing in the order of 500 l/s of methane gas being emitted to accumulate, captured and be piped to surface from A level, the uppermost level of the Beisa mining area. The initial installation will consist of one monitoring station underground to monitor the condition of the methane gas which will include the flow rate of the gas. The pipeline to capture the methane gas will be constructed on A level.
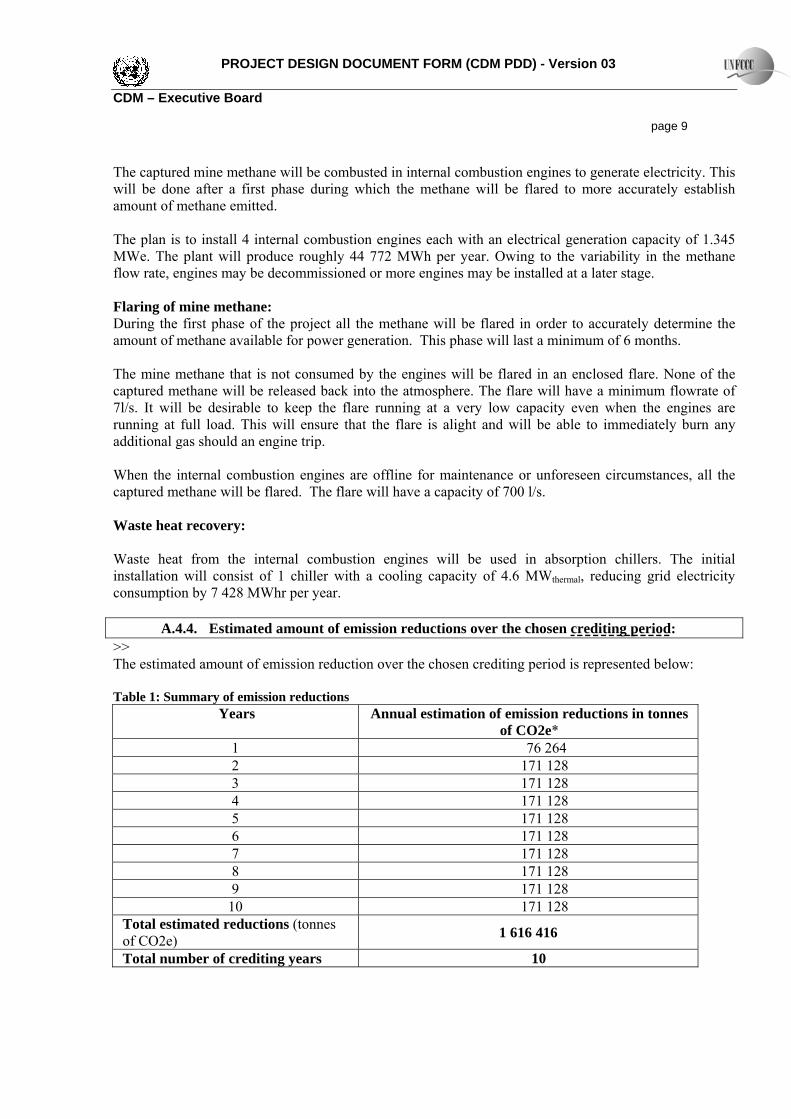
Figure 7: The underground piping and monitoring system for the mine methane extraction
Legend
Methane gas monitoring station
Methane gas seal
Methane gas pipelineHorizontal: 300mm diameterShaft: 450mm diameter
No. 1A Ventilation Shaft
A level North
A level South
BEISA SECTION METHANE GAS EXTRACTION

PROJECT DESIGN DOCUMENT FORM (CDM PDD) - Version 03 CDM – Executive Board page 8
Figure 2: Sealing plan for Beisa section
Due to the nature of the methane source, it is not possible to accurately predict the volume of methane that will be released in the mine. However, based on experience, GFI Mining South Africa is comfortable that they will be able to deliver a maximum of 500 l/s (100% methane at atmospheric conditions) of pure methane from the mine. Once the extraction piping and flaring facility are complete, accurate measurements can be taken and there will be more certainty of the amount of gas available. For the purposes of the ex-ante calculation of the emission reductions, a total methane flow rate of 400 l/s (100% methane at atmospheric conditions) was used to be conservative. Initial gas analysis of the methane containing gas had the following composition:
Propane Carbon Dioxide
Ethane Oxygen Nitrogen Methane
<50ppm_vol 2764ppm_vol 240ppm_vol 4.72% 24.18% 70.8% The gas composition is however subject to change. A gas composition of 70.8 volume % methane was assumed for the ex-ante calculation of the emission reductions. Electricity generation from mine methane:
No 1 MainShaft
No 1 B VentShaft
No 1A VentShaft
M S/V
25 LEVEL
1 LEVEL
3 LEVEL
5 LEVEL
T.P.S.
17 LEVEL
19 LEVEL
21 LEVEL
23 LEVEL
B.T.M.
V S/V
Surface BAC
Surface BAC
Downcast300 kg/s
Upcast500 kg/s
Beatrix 4 Shaft
Downcast300 kg/s
Beisa
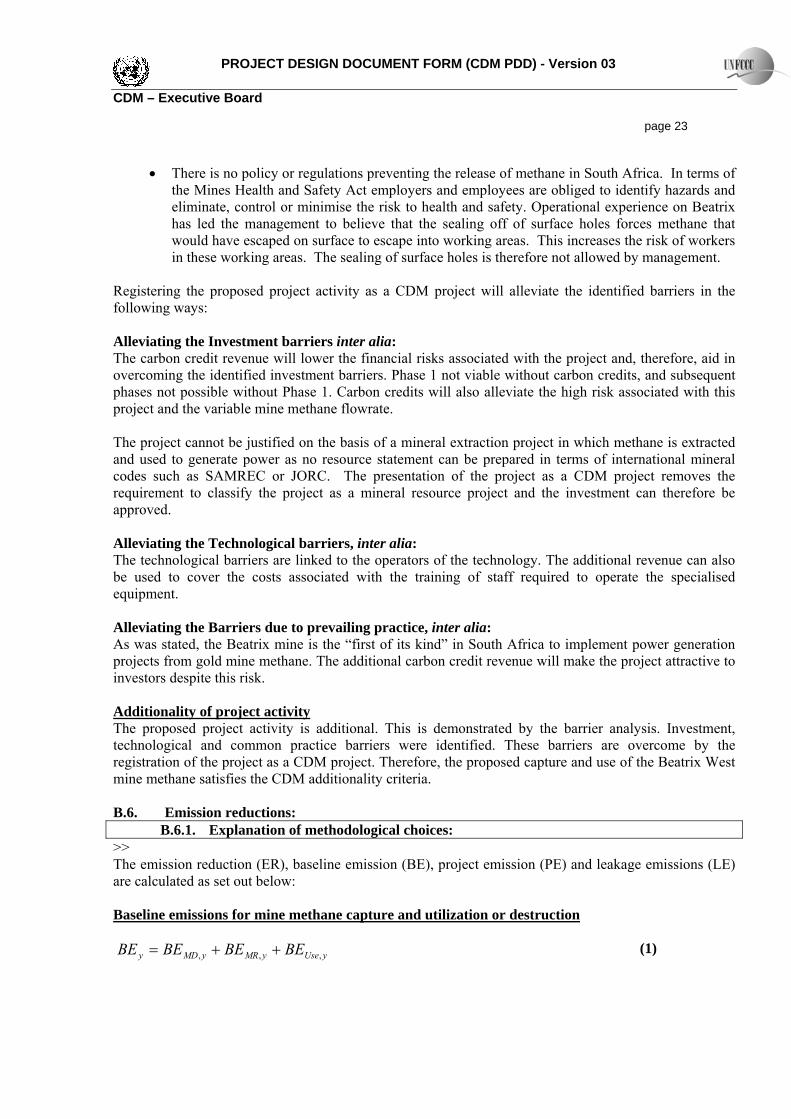
PROJECT DESIGN DOCUMENT FORM (CDM PDD) - Version 03 CDM – Executive Board page 9 The captured mine methane will be combusted in internal combustion engines to generate electricity. This will be done after a first phase during which the methane will be flared to more accurately establish amount of methane emitted. The plan is to install 4 internal combustion engines each with an electrical generation capacity of 1.345 MWe. The plant will produce roughly 44 772 MWh per year. Owing to the variability in the methane flow rate, engines may be decommissioned or more engines may be installed at a later stage. Flaring of mine methane: During the first phase of the project all the methane will be flared in order to accurately determine the amount of methane available for power generation. This phase will last a minimum of 6 months. The mine methane that is not consumed by the engines will be flared in an enclosed flare. None of the captured methane will be released back into the atmosphere. The flare will have a minimum flowrate of 7l/s. It will be desirable to keep the flare running at a very low capacity even when the engines are running at full load. This will ensure that the flare is alight and will be able to immediately burn any additional gas should an engine trip. When the internal combustion engines are offline for maintenance or unforeseen circumstances, all the captured methane will be flared. The flare will have a capacity of 700 l/s. Waste heat recovery: Waste heat from the internal combustion engines will be used in absorption chillers. The initial installation will consist of 1 chiller with a cooling capacity of 4.6 MWthermal, reducing grid electricity consumption by 7 428 MWhr per year.
A.4.4. Estimated amount of emission reductions over the chosen crediting period: >> The estimated amount of emission reduction over the chosen crediting period is represented below: Table 1: Summary of emission reductions
Years Annual estimation of emission reductions in tonnes of CO2e*
1 76 264 2 171 128 3 171 128 4 171 128 5 171 128 6 171 128 7 171 128 8 171 128 9 171 128
10 171 128 Total estimated reductions (tonnes of CO2e) 1 616 416
Total number of crediting years 10

PROJECT DESIGN DOCUMENT FORM (CDM PDD) - Version 03 CDM – Executive Board page 10
Annual average over the crediting period of estimated reductions (tonnes of CO2e)
161 642
Due to the variation of mine methane, the emission reduction figures in the table above were calculated based on measurements and estimates taken during the development of the project. There is no guarantee that the underground methane emission rate will stay constant. The methane emission rate may increase or decrease, depending on changing geological conditions. Should this happen, the emission reduction by the project will vary accordingly. A.4.5. Public funding of the project activity: >> No public funding has been used or will be used in the development and implementation of this project.

PROJECT DESIGN DOCUMENT FORM (CDM PDD) - Version 03 CDM – Executive Board page 11 SECTION B. Application of a baseline and monitoring methodology B.1. Title and reference of the approved baseline and monitoring methodology applied to the project activity: >> This PDD is compiled using the approved baseline and monitoring methodology AM0064: “Methodology for methane capture and utilization or destruction in underground, hard rock, precious and base metal mines” Version 02, EB 42 This PDD refers to the following tools:
• “Tool to calculate baseline, project and/or leakage emissions from electricity consumption” Version 01;
• “Combined tool to identify the baseline scenario and demonstrate additionality” Version 4.0.0; • “Tool to determine project emissions from flaring gases containing methane” Annex 13, EB28; • “Tool to calculate the emission factor for an electricity system” Version 02.2.1.
No fossil fuel is used to capture, transport or use the mine methane. Hence, the “Tool to calculate project or leakage CO2 emissions from fossil fuel combustion” Version 02 is not used in the PDD. B.2. Justification of the choice of the methodology and why it is applicable to the project activity: >> AM0064 was developed by Promethium Carbon (Pty) Ltd specifically for the registered project “The Capture and Utilisation of Methane at the GFI Mining South Africa owned Beatrix Mine in South Africa”. The latter registered project is very similar to this project activity. A discussion of the applicability of AM0064 as applied to this project follows: Table 2: Discussion of the applicability of AM0064 for mine methane Discussion of the Applicability conditions of AM0064 for mine methane capture and utilization or destruction as applied to the Beatrix Underground Methane Capture Project Applicability criteria as in AM0064 Project activity at
Beatrix mine Was the Applicability condition of AM0064 met?
The applicability conditions apply to project activities that involve capture, utilisation or destruction of methane from any operating mine, excluding mines where coal is extracted.
The Beatrix West shaft is an operating mine. Methane will be captured, utilized and destroyed. Beatrix West is not a coal mine.
Yes
Mine methane can be captured from the following: • Underground boreholes in the mine, where mine methane can be captured from: - Development ends including shafts, access drives,
Methane will be captured from underground boreholes, gas drainage galleries and sealed areas
Yes

PROJECT DESIGN DOCUMENT FORM (CDM PDD) - Version 03 CDM – Executive Board page 12 ore passes or other developments; - Existing infrastructure such as shafts, access drives, raises and winzes; - Working areas including working stopes and worked out stopes; or - Any other area opened up for the development of the mine or the extraction of ore; • Surface wells drilled into sealed off areas where the mine methane is accumulated; • Gas drainage galleries or other infrastructure using mine methane capture techniques, including capture of gas from sealed areas; • Ventilation air.
as described. Surface well drainage from sealed off areas where mine methane is accumulated could be considered if future methane sources are identified due to continued mining. Ventilation air methane will not be used.
The mine methane can be removed from the mine, in which the project activity is implemented, in two ways: 1. By sealing off an area into which the methane is released and piping it from that area, and/or 2. By piping the methane from underground boreholes.
Both these removal methods will be used in this project.
Yes
For the purposes of this component, drainage to surface boreholes is only allowed in the following cases: • Where a hole is drilled from the surface to an underground mining area where mine methane is allowed to accumulate. For safety reasons, such an area will be isolated (sealed off) from the rest of the workings by walls. Methane will be drained into these areas with the purpose of taking it to the surface via the borehole. • Where a hole is drilled from the surface to an underground mining area and a pipe into which mine methane has been collected is connected to the opening of the borehole where it intersects the mining area. In this case the borehole is used to convey mine methane to surface rather than to install a pipe column in the shaft.
Depending on future mine development, methane may be drained to surface through boreholes drilled into underground mining areas where methane is allowed to accumulate. Methane extraction, from surface boreholes, that does not comply with the requirements of AM0064 will not be done.
Yes
The methodology is applicable under the following conditions: • The captured mine methane is utilised to produce electricity, motive power and/or thermal energy and/or destroyed through flaring; •Prior to the start of the project activity all mine methane was released into the atmosphere or partially used for heat generation; • The methodology applies to both new and existing mining activities; • Project participants must be able to supply the
Captured methane will be flared, used for electricity generation and the generation of thermal energy. No prior use of the methane exists and all methane is diluted in the ventilation air.
Yes

PROJECT DESIGN DOCUMENT FORM (CDM PDD) - Version 03 CDM – Executive Board page 13 necessary data for ex-ante projections of methane demand in the case where part of mine methane was used for the heat generation prior to the start of the project activity.
Beatrix West is an existing mining operation.
This component of the methodology does not apply to project activities that: • Operate in coal mines; • Operate in open cast mines; • Capture methane from abandoned or decommissioned mines; • Capture/use methane from surface boreholes that do not intersect mining areas/developments underground; • Use CO2 or any other fluid/gas to enhance methane drainage.
Beatrix mine is not a coal mine and is not an open cast mine. Beatrix West is, furthermore, an operating mine and not an abandoned or decommissioned mine. Future surface borehole methane extraction will only be done for mining areas/developments underground. No CO2 will be used for enhanced methane drainage.
Yes
In addition, the applicability conditions included in the tools referred to above apply.
All tools that AM0064 refers to were adhered to.
Yes
Finally, for mine methane capture and utilization or destruction, this methodology is only applicable to project activities where the identified baseline scenario is a partial or total atmospheric release of mine methane. In case of a partial atmospheric release, some mine methane is flared and/or used for the heat generation only.
The baseline selection section will illustrate that atmospheric methane release is the baseline scenario.
Yes
B.3. Description of the sources and gases included in the project boundary: >> The spatial extent of the project boundary comprises: • All equipment installed and used as part of the project activity for the extraction of the methane at
the project site. • Flaring and captive power facilities installed and used as part of the project activity. • Power plants connected to the electricity grid, where the project activity exports or imports power
from the grid, as per the definition of an electricity system in the latest approved version of the “Tool to calculate the emissions factor for an electricity system.”
The boundary for the capture of mine methane includes:
• Piping of the methane to the surface

PROJECT DESIGN DOCUMENT FORM (CDM PDD) - Version 03 CDM – Executive Board page 14
• Underground monitoring stations for the methane
A diagram of the boundary for the capture of mine methane can be seen below:
Figure 3: Beisa section
No 1 MainShaft
No 1 B VentShaft
No 1A VentShaft
M S/V
25 LEVEL
1 LEVEL
3 LEVEL
5 LEVEL
T.P.S.
17 LEVEL
19 LEVEL
21 LEVEL
23 LEVEL
B.T.M.
V S/V
Surface BAC
Surface BAC
Downcast300 kg/s
Upcast500 kg/s
Beatrix 4 Shaft
Downcast300 kg/s
Beisa

PROJECT DESIGN DOCUMENT FORM (CDM PDD) - Version 03 CDM – Executive Board page 15
Figure 7: The underground piping and monitoring system for the mine methane extraction
The boundary for the destruction and utilisation of mine methane includes:
• The piping of methane on the surface to the flare (Phase 1) and internal combustion engines (Phase 2)
• The fan on the surface used to increase the pressure of the methane (Phase 1) • The flare (Phase 1) • The internal combustion engines (Phase 2) • Absorption chillers (Phase 3) • The instrumentation on the surface, which is in place for monitoring (Phase 1)
A diagram of the boundary for the destruction and utilisation of mine methane can be seen below:
Legend
Methane gas monitoring station
Methane gas seal
Methane gas pipelineHorizontal: 300mm diameterShaft: 450mm diameter
No. 1A Ventilation Shaft
A level North
A level South
BEISA SECTION METHANE GAS EXTRACTION

PROJECT DESIGN DOCUMENT FORM (CDM PDD) - Version 03 CDM – Executive Board page 16 Figure 4: Destruction and utilisation of mine methane (3 phases indicated in one diagram) Table 4 illustrates which emissions sources are included and which are excluded from the project boundary for determination of both baseline and project emissions. Table 4: Overview on emissions sources included in or excluded from the project boundary
Source Gas Included? Justification / Explanation
Bas
elin
e
Venting of methane
CO2 No Excluded.
CH4 Yes Emissions from the venting of mine methane are included in the project boundary.
N2O No Excluded. There is no N2O in the gas.
Bas
elin
e
Emissions from use or destruction of methane in the baseline CO2 Yes
Emissions from any flaring or use for heat generation in the baseline scenario are included in the project boundary. However, no methane was flared or used in the baseline.
CH4 No Excluded for simplification. This is conservative.
N2O No Excluded for simplification. There is no N2O in the gas.
Emissions from electricity generation in the grid CO2 Yes
Included in the project boundary as the project will generate electricity from the mine methane through engines.
CH4 No Excluded for simplification. This is conservative.
N2O No Excluded for simplification. This is conservative.
Mine methane from underground
Excess
Flare
Internal combustion
engines Electricity
Absorption
chillers Chilled water
Phase 1
Phase 2
Phase 3

PROJECT DESIGN DOCUMENT FORM (CDM PDD) - Version 03 CDM – Executive Board page 17
Source Gas Included? Justification / Explanation
Emissions from captive power and/or heat generation, and vehicle fuel use
CO2 Yes Included in the project boundary as the project activity includes power generation from the mine methane.
CH4 No Excluded for simplification. This is conservative.
N2O No Excluded for simplification. This is conservative.
Proj
ect a
ctiv
ity
On-site fuel consumption due to the project activity, including transport of the gas
CO2 Yes
The electricity used by the equipment in the project activity will be included in the project boundary. Apart from electricity, no other fossil fuels are used in the project activity.
CH4 No Excluded for simplification. This emission source is assumed to be negligible.
N2O No Excluded for simplification. This emission source is assumed to be negligible.
Emissions from methane combustion
CO2 Yes Emissions from the combustion of mine methane in flares and engines will be included in the project boundary.
CH4 No Excluded for simplification. N2O No Excluded for simplification.
Emissions from NMHC destruction
CO2 Yes
If NMHC accounts for more than 1% by volume of extracted mine methane then the emissions from the combustion of NMHC in flares and engines must be included in the project boundary. The NMHC content of the gas will be monitored in the project activity.
CH4 No Excluded for simplification. N2O No Excluded for simplification.
Proj
ect a
ctiv
ity
Fugitive emissions of unburned methane
CO2 No Excluded.
CH4 Yes
Small amounts of methane will remain unburned in flares and power generation. This methane will be accounted for and included in the project boundary.
N2O No Excluded. Fugitive methane emissions from on-site equipment
CO2 No Excluded for simplification. This emission source is assumed to be very small. CH4 No
N2O No Fugitive methane emissions from gas supply pipeline or in relation to use in vehicles
CO2 No Excluded for simplification. However other leakage effects are taken into account in the project.
CH4 No
N2O No
Accidental methane release
CO2 No Excluded for simplification. This emission source is assumed to be very small. CH4 No

PROJECT DESIGN DOCUMENT FORM (CDM PDD) - Version 03 CDM – Executive Board page 18
Source Gas Included? Justification / Explanation
N2O No B.4. Description of how the baseline scenario is identified and description of the identified baseline scenario: >> The “Combined tool to identify the baseline scenario and demonstrate additionality” Version 4.0.0 was used to identify the baseline scenario in the following manner: STEP 1: Identification of alternative scenarios Sub-Step 1a: Define alternative scenarios to the proposed CDM project activity The identified alternative baseline scenarios are:
A. Diluting the methane to safe and acceptable levels with ventilation air is technically feasible. The ventilation air methane (VAM) can then be:
i. Vented to the atmosphere as VAM.
B. Capturing of methane and extraction from underground boreholes or sealed off areas. The captured methane can then be:
i. Captured and vented above ground in a safe location; ii. Flared above ground;
iii. Used for electricity and thermal energy generation with the excess flared; or iv. Used for electricity and thermal energy generation with the excess flared without being
registered as a CDM project activity. This is the proposed project activity for the destruction and utilisation of mine methane without CDM.
The baseline scenario alternatives include all possible options to generate electricity and/or heat:
C. For the generation of electricity and/or heat: i. Electricity can be imported from the national grid;
Sub-Step 1b: Consistency with mandatory applicable laws and regulations: All options comply with the mandatory applicable laws and regulations. STEP 2: Barrier analysis Sub-step 2a: Identify barriers that would prevent the implementation of alternative scenarios: A list of the alternative scenarios and the investment, technological barriers and barriers due to prevailing practice that they face is presented below: Scenario Ai: The VAM can be vented to the atmosphere

PROJECT DESIGN DOCUMENT FORM (CDM PDD) - Version 03 CDM – Executive Board page 19 The mine currently dilutes the methane with ventilation air and releases it into the atmosphere. This is common practice for mine methane from gold mines. According to Hugo (1963) when referring to methane in the Orange Free State Gold-Field, “...as much gas as possible is allowed to escape through surface bore-holes or via the exhaust ventilation systems in order to reduce the methane hazard in the mines” This is illustrated in more detail in a report by Cook (1998), “The normal means of dealing with accumulations and emissions are well documented (various including Greig, 1989; Eschenburg, 1980), although a part of this is based on the assumptions that gases separate depending on relative densities. The methods include ventilation, cementing or plastering fissures, water infusion of fissures, drainage and compressed air.” And, “It is generally considered that the relatively small methane volumes can be controlled by good ventilation practice and proper detection procedures (Jackson, 1957; Kidd ,1997), and that other procedures are additional for particular circumstances.” (Cook, 1998) Hence, there are no barriers to this scenario and it can be considered a possible baseline scenario for the mine methane. Scenario Bi: The mine methane can be captured and vented above ground in a safe location The mine methane is vented as VAM. Venting the mine methane not as VAM would require capturing the mine methane in its concentrated form then piping it up the shaft and finding a safe location in which to vent it. Firstly, the capturing and piping of concentrated methane would pose a safety risk to the mine. In addition, it is very difficult to find a safe location away from the mine and farms in the area, where this gas with a methane concentration above 85 volume % can be vented. The dangers of methane are elaborated: “Methane can be dangerous because the mixture of methane and air in a confined area can create explosive conditions! If the amount of methane in the air reaches 5 to 15 percent, an explosion can occur. If the amount of methane in the air increases even more, it can be flammable...Higher concentrations of methane in the air can also be dangerous because there is not enough oxygen for people to breathe.” (Study Hall Webmaster, 2004) Methane poses a huge safety risk to the mine and this option would increase the risk to safety at the mine. Finding a location to vent the methane is not an option as there is still a safety risk associated with the methane unless it is diluted below its explosion limits in air. This scenario is not an alternative baseline scenario. Scenario Bii: The captured mine methane can be flared above ground The captured mine methane can be flared above ground. This would require capturing the concentrated methane before it is diluted with ventilation air. This is not current practice in the mine. The capturing of the mine methane and piping it to surface increases the safety risk associated with the methane. It is much safer to dilute the methane at source to below its explosion limits in air and transport the VAM; which is current practice. The methane is diluted with ventilation air in the baseline. The methane is not captured and flared above ground. As there is no safety and no financial incentive to install a methane capturing and flaring system, this is not an alternative baseline scenario.

PROJECT DESIGN DOCUMENT FORM (CDM PDD) - Version 03 CDM – Executive Board page 20 Scenario Biii: The mine methane can be used for electricity and thermal energy generation with the excess flared The variability and unpredictability of the mine methane make it difficult to be used for additional reliable power generation. The mine needs a reliable power source in order to keep the miners safe underground. The variability and unpredictability of the methane is cited by Cook (1998), “Uncertainty as to the origins and transport mechanisms of gas within the strata make emissions difficult to predict, so although the ventilation is adequate to control the normal situation, sudden emissions do create problems” and “The distribution of gas is across almost all mines, but to variable degrees. There is no distinct correlation between reefs, mines, depths or regions, making prediction difficult to generalise. Many individual mines and people have their own opinions where the chances of gas emissions are greater.” The use of methane poses a safety risk to personnel and will require adequate training on the risks associated with methane gas. According to Cook (1998), “There is a general lack of awareness of the hazards of methane on mines, with only four mines considering combustible gases to be a problem” and “Methane ignitions have long been acknowledged as a hazard in South African gold and platinum mines, but the origins and transport mechanisms of the gas have not been well understood. This lack of understanding has contributed to the hazard, making gas emissions difficult to predict and prepare for.” Owing to the unpredictability of the mine methane flow and the hazardous nature of mine methane, this can be eliminated as a potential baseline scenario. The generation of electricity in equipment such as an internal combustion engine would require training of personnel to operate and maintain the equipment. A service level agreement would need to be signed with the manufacturer of the engine to ensure that the engines were properly serviced. Scenario Biv: The mine methane can be used for electricity and thermal energy generation with the excess flared without being registered as a CDM project activity. This is the proposed project activity for the destruction and utilisation of mine methane without CDM. Owing to the unpredictability and uncertainty of the methane resource, this can be eliminated as a plausible baseline scenario. Please see Scenario Biii; which discusses the uncertainty of the methane resource and safety issues related to the use of mine methane. The variability of the methane makes it impossible to justify the installation of the methane extraction system and a power plant. This scenario is therefore not an alternative baseline scenario. Scenario Ci: The electricity can be imported from the national grid The mine already receives all of its electricity from the national grid and only has emergency generators on site. Sourcing all the electricity from the national grid is common practice and, hence, this option is a plausible baseline scenario. The mine already has all equipment in place to receive electricity from the grid. In addition, historically, grid electricity has always been cheap. Sub-step 2b: Eliminate alternative scenarios which are prevented by the identified barriers: This has been done in the analysis of the scenarios above. The only scenarios that are not eliminated as a result of the barriers are: A i. The mine methane is vented to the atmosphere as VAM C i. Electricity can be imported from the national grid

PROJECT DESIGN DOCUMENT FORM (CDM PDD) - Version 03 CDM – Executive Board page 21 The alternative scenario that does not face any barriers is the baseline scenario. Hence, the baseline scenario for Beatrix is the continuation of the current practice, which is to dilute and vent the mine methane and import electricity from the grid. Simply continuing with this practice has the following advantages:
• It conforms to all legal requirements provided that the mine methane is diluted sufficiently; • No technological barriers exists as this is the accepted industry practice; • No capital expenditure is required since the ventilation system currently in use at the Beatrix mine
adequately dilutes the methane to an acceptable level; and, • It is common practice to source electricity from the national grid.
Step 4: Common practice analysis Globally, various projects are at different stages of development to utilize coal mine methane (CMM) for power generation. These projects are being developed as CDM projects. At least six of these projects are being executed in China. The proposed Beatrix West project is a deviation from these projects since Beatrix is a gold mine and the methane released is not related to the amount of gold mined. The only similar project is the CDM registered project “The Capture and Utilisation of Methane at the GFI Mining South Africa owned Beatrix Mine in South Africa”. However, according to the “Combined tool to identify the baseline scenario and demonstrate additionality” (Version 4.0.0) it does not need to be included in this analysis seeing as the latter project is a CDM project activity. The Beatrix mine is still the only gold mine planning to use the methane for electricity generation in South Africa. All methane from South African gold mines is simply diluted and vented. This is referenced in a letter from the Chamber of Mines of South Africa. This letter can be seen in Annex 5. B.5. Description of how the anthropogenic emissions of GHG by sources are reduced below those that would have occurred in the absence of the registered CDM project activity (assessment and demonstration of additionality): >> Date Milestone 26 Jan 2011 Proposal to develop CDM project submitted to Gold Fields by Promethium
Carbon. 30 Aug 2011 CDM “Notice of Prior Intent” form submitted to CDM executive board and
South African DNA. 21 Dec 2011 Letter of no objection received from DNA The “Combined tool to identify the baseline scenario and demonstrate additionality” (Version 4.0.0) was used to demonstrate that the proposed project activity is additional. Section B.4. lists the alternatives scenarios and the barriers that these scenarios face. Apart from the identified baseline, the alternatives scenarios, including the proposed project activity, face barriers. Therefore, all the other alternative scenarios, including the proposed project activity, are additional.

PROJECT DESIGN DOCUMENT FORM (CDM PDD) - Version 03 CDM – Executive Board page 22 The additionality of the proposed project activity is further illustrated by the complete list of barriers listed below:
Investment barriers inter alia:
• Codes such as the SAMREC code (THE SOUTH AFRICAN MINERALRESOURCE COMMITTEE (SAMREC), 2011), the mineral resource quantification code of the JSE Securities Exchange (where Gold Fields is listed) or other international codes such as JORC are required by the investment community. When considering these codes, it is clear that the investment of capital in the available methane resources is not justifiable. This is because of the unpredictable nature of the methane occurrence. The proposed project, which involves the use of methane, therefore, is impossible to fund in terms of conventional mining finance.
• The unquantifiable and unpredictable nature of the mine methane makes debt funding of the proposed project impossible.
• The proposed project will require capital expenditure that would not be required in the continuation of the baseline.
• The importance of resource estimation in investment decisions can be seen from “The mining industry depends on financial investments that, in turn, depend on how well investors understand the risks involved in estimating mineral resources or ore reserves. Professional organizations in several different countries have published codes that set minimum standards for public reporting of mineral resources and ore reserves.” (Ramcharan & Moser, 2010)
Technological barriers, inter alia: • The unpredictability of methane supply is a barrier to the project activity. The flowrate of the
methane is expected to vary and the continuation of the release of methane is not a certainty. This poses risks in terms of plant capacity and investment. According to Head and Kissell (2006), “Unlike coal mines, methane emission rates in metal/non-metal mines are not consistent. This irregularity often makes an accumulation of methane an unexpected event, and an unexpected event by definition is difficult to anticipate.” This unpredictability of methane flowrate has also been experienced in the Beatrix Methane registered CDM project.
• The internal combustion engines require specialist labour and infrastructure. Barriers due to prevailing practice, inter alia: • Although a similar project has been implemented by Gold Fields under the CDM at the Beatrix
mine, this is still the first and only mine in South Africa to implement a project like this, and is not common practice in the industry. This is demonstrated by the letter from the Chamber of Mines that is in Section B.4.
• Generating electricity is not part of the normal skill set of a mining activity. • Largely because of the low cost of electricity and technological barriers, most mine operators in
South Africa have not really considered the possibility of generating electricity from mine methane. Due to the delocalization of the methane sources and the unpredictability of the methane supply, it is not ideal for use as a fuel source.
• There is no legislative pressure to use the energy content from the methane. South African laws only make provision for safety issues regarding methane venting. Even where utilization has been identified as a priority, current legal policies offer little or no incentive for using mine methane to generate electricity.
PROJECT DESIGN DOCUMENT FORM (CDM PDD) - Version 03 CDM – Executive Board page 23
• There is no policy or regulations preventing the release of methane in South Africa. In terms of the Mines Health and Safety Act employers and employees are obliged to identify hazards and eliminate, control or minimise the risk to health and safety. Operational experience on Beatrix has led the management to believe that the sealing off of surface holes forces methane that would have escaped on surface to escape into working areas. This increases the risk of workers in these working areas. The sealing of surface holes is therefore not allowed by management.
Registering the proposed project activity as a CDM project will alleviate the identified barriers in the following ways: Alleviating the Investment barriers inter alia: The carbon credit revenue will lower the financial risks associated with the project and, therefore, aid in overcoming the identified investment barriers. Phase 1 not viable without carbon credits, and subsequent phases not possible without Phase 1. Carbon credits will also alleviate the high risk associated with this project and the variable mine methane flowrate. The project cannot be justified on the basis of a mineral extraction project in which methane is extracted and used to generate power as no resource statement can be prepared in terms of international mineral codes such as SAMREC or JORC. The presentation of the project as a CDM project removes the requirement to classify the project as a mineral resource project and the investment can therefore be approved. Alleviating the Technological barriers, inter alia: The technological barriers are linked to the operators of the technology. The additional revenue can also be used to cover the costs associated with the training of staff required to operate the specialised equipment. Alleviating the Barriers due to prevailing practice, inter alia: As was stated, the Beatrix mine is the “first of its kind” in South Africa to implement power generation projects from gold mine methane. The additional carbon credit revenue will make the project attractive to investors despite this risk. Additionality of project activity The proposed project activity is additional. This is demonstrated by the barrier analysis. Investment, technological and common practice barriers were identified. These barriers are overcome by the registration of the project as a CDM project. Therefore, the proposed capture and use of the Beatrix West mine methane satisfies the CDM additionality criteria. B.6. Emission reductions:
B.6.1. Explanation of methodological choices: >> The emission reduction (ER), baseline emission (BE), project emission (PE) and leakage emissions (LE) are calculated as set out below: Baseline emissions for mine methane capture and utilization or destruction (1)
yUseyMRyMDy BEBEBEBE ,,, ++=
PROJECT DESIGN DOCUMENT FORM (CDM PDD) - Version 03 CDM – Executive Board page 24 Where: BEy Baseline emissions in year y (tCO2e/yr) BEMD,y Baseline emissions from the destruction of methane in the baseline scenario in year y
(tCO2e/yr) BEMR,y Baseline emissions from the release of methane into the atmosphere in year y that is
avoided by the project activity (tCO2e/yr) BEUse,y Baseline emissions from the production of power and/or heat displaced by the project
activity in year y (tCO2e/yr) In the baseline, no methane is used for any heat or electricity generation. Methane destruction in the baseline only occurs if the gas is ignited by accident. This accidental methane destruction is not desirable and is stopped as soon as possible for safety reasons. (This leads to BEMD,y = 0.) In the baseline, all methane was simply vented to atmosphere as ventilation air methane. The baseline emissions due to the ventilation of the methane will be captured in the BEMR,y. In the proposed project activity, the methane will be used to generate electricity. Excess methane will be flared. The generation of electricity will displace grid electricity used in the baseline. This will be captured in the BEUse,y term. Equation 1 becomes: (1.1) Baseline emissions from the release of methane into the atmosphere: Baseline emissions from the venting of methane were calculated as follows:
( ) ( )[ ]∑ −+−×=i
yiBLyiPRyiBLyiPRCHyMR VAMVAMMMMMGWPBE ,,,,,,,,4, (6)
Where: BEMR,y Baseline emissions from the release of methane into the atmosphere in year y that is
avoided by the project activity (tCO2e/yr) GWPCH4 Global Warming Potential of methane MMPR,i,y Mine methane captured, sent to and destroyed by use i in the project activity in year y
(tCH4/yr) MMBL,i,y Mine methane that would have been captured, sent to and destroyed by use i in the
baseline scenario in year y (tCH4/yr) VAMPR,i,y VAM captured, sent to and destroyed by use i in the project activity in year y (tCH4) VAMBL,i,y VAM that would have been captured, sent to and destroyed by use i in the baseline
scenario in year y (tCH4) No ventilation air methane (VAM) is used in the baseline (BL) or in the project case (PR). The result is that: VAMPR,i,y = 0 VAMBL,i,y = 0
yUseyMRy BEBEBE ,, +=

PROJECT DESIGN DOCUMENT FORM (CDM PDD) - Version 03 CDM – Executive Board page 25 No mine methane (MM) is captured and used in the baseline (BL). The result is: MMBL,i,y = 0 Combustion engines, absorption chillers, and flaring of excess methane will take place in the project case (PR). Therefore, including the uses of methane, Equation 6 simplifies to equation 6.1:
( )yflarePRyenginePRCHyMR MMMMGWPBE ,,,,4, +×= (6.1) Where: MMPR,engine,y Mine methane captured, sent to and destroyed by internal combustion engines in the
project activity in year y (tCH4/yr) MMPR,flare,y Mine methane captured, sent to and destroyed by flare in the project activity in year y
(tCO2e/yr) Baseline emissions from power generation by project activity: The proposed project activity will generate electricity and chilled water. The electricity generated will displace electricity that was sourced from the national grid in the baseline. The chilled water will be generated in absorption chillers and will displace chilled water generated in electric chillers. Hence, the chilled water generated in absorption chillers will displace electricity from the national grid. No captive power generation occurred in the baseline. Equation 7 originally stated:
yELECELEC
ABSyyVyyHEATyyELECyyUse EF
COPCOP
ABSEFVFUELEFHEATEFGENBE ,,,,, ××+×+×+×=
(7) Where: BEUse,y Baseline emissions from the production of power or heat replaced by the project activity
in year y (tCO2e/yr) GENy Electricity generated by the project activity in year y (MWh) EFELEC,y Emission factor for electricity generation (grid, captive or a combination) replaced by the
project activity (tCO2/MWh) HEATy Heat generation by project activity in year y (GJ) EFHEAT,y Emission factor for heat generation replaced by the project activity (tCO2/GJ) VFUELy Vehicle fuel provided by the project activity in year y (GJ) EFV,y Emission factor for vehicle operation replaced by the project activity (tCO2/GJ) ABSy Chilling produced in project activity by absorption chillers in year y (MWh) COPABS Coefficient of performance of the absorption chiller (MW thermal input / MW thermal
output) COPELEC Coefficient of performance of the electrical chillers used in the baseline Chillers (MW
electrical input / MW thermal output) No heat will be generated during the project activity. The thermal energy generated will be chilling in the form of chilled water. This chilling is captured in the ABSy term. This implies that:
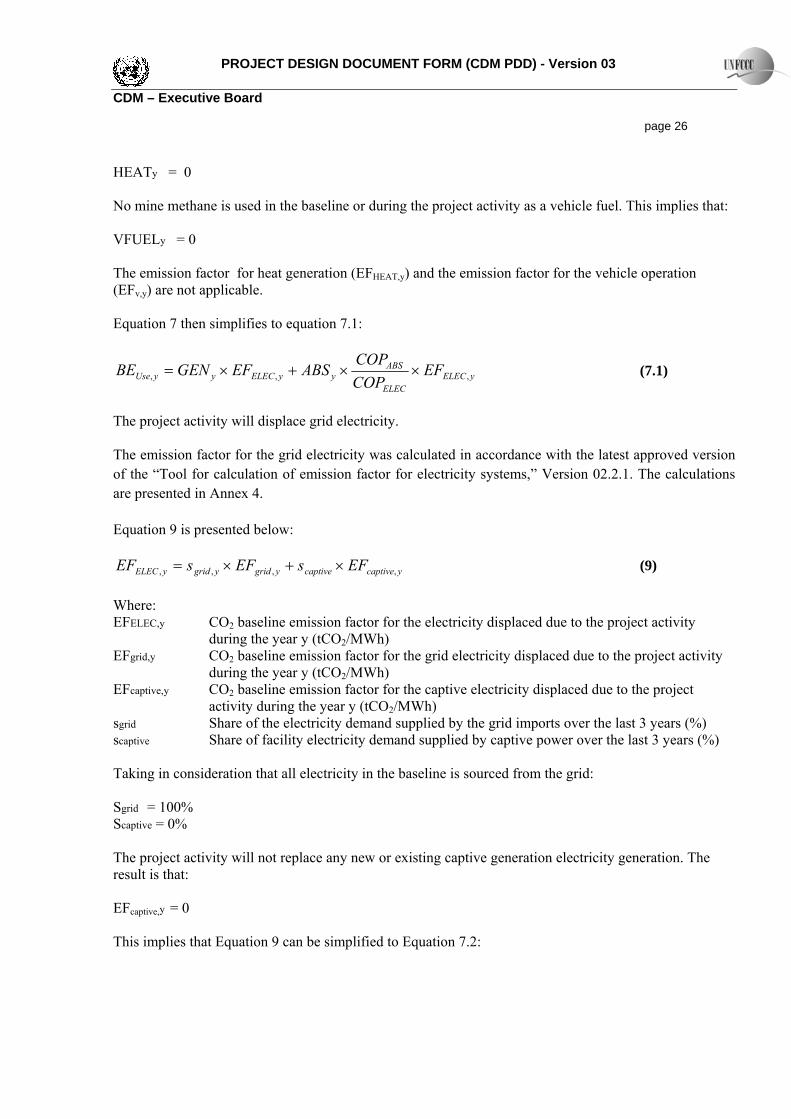
PROJECT DESIGN DOCUMENT FORM (CDM PDD) - Version 03 CDM – Executive Board page 26 HEATy = 0 No mine methane is used in the baseline or during the project activity as a vehicle fuel. This implies that: VFUELy = 0 The emission factor for heat generation (EFHEAT,y) and the emission factor for the vehicle operation (EFv,y) are not applicable. Equation 7 then simplifies to equation 7.1:
yELECELEC
ABSyyELECyyUse EF
COPCOP
ABSEFGENBE ,,, ××+×= (7.1)
The project activity will displace grid electricity. The emission factor for the grid electricity was calculated in accordance with the latest approved version of the “Tool for calculation of emission factor for electricity systems,” Version 02.2.1. The calculations are presented in Annex 4. Equation 9 is presented below:
ycaptivecaptiveygridygridyELEC EFsEFsEF ,,,, ×+×= (9) Where: EFELEC,y CO2 baseline emission factor for the electricity displaced due to the project activity
during the year y (tCO2/MWh) EFgrid,y CO2 baseline emission factor for the grid electricity displaced due to the project activity
during the year y (tCO2/MWh) EFcaptive,y CO2 baseline emission factor for the captive electricity displaced due to the project
activity during the year y (tCO2/MWh) sgrid Share of the electricity demand supplied by the grid imports over the last 3 years (%) scaptive Share of facility electricity demand supplied by captive power over the last 3 years (%) Taking in consideration that all electricity in the baseline is sourced from the grid: Sgrid = 100% Scaptive = 0% The project activity will not replace any new or existing captive generation electricity generation. The result is that: EFcaptive,y = 0 This implies that Equation 9 can be simplified to Equation 7.2:

PROJECT DESIGN DOCUMENT FORM (CDM PDD) - Version 03 CDM – Executive Board page 27
ygridyELEC EFEF ,, = (7.2) Where: EFELEC,y Emission factor for electricity generation (grid, captive or a combination) replaced by the
project activity (tCO2/MWh) EFgrid,y CO2 baseline emission factor for the grid electricity displaced due to the project activity
during the year y (tCO2/MWh) Project emissions due to project activities recovering mine methane Project emissions are defined by the following equation:
yUMyMDyMEy PEPEPEPE ,,, ++= (13) Where: PEy Project emissions in year y (tCO2e/yr) PEME,y Project emissions from energy use to capture and use methane in year y(tCO2e/yr) PEMD,y Project emissions from methane destroyed in year y (tCO2e/yr) PEUM,y Project emissions from un-combusted methane in year y (tCO2e/yr) Project emissions from the use of additional energy required for MM/VAM capture and utilisation Additional energy was required to capture, transport and compress, use or destruct the mine methane. Project emissions from the use of this energy were calculated as follows:
yFFyELECyME PEPEPE ,,, += (14) Where: PEELEC,y Project emissions from the use of electricity for capture, transportation, compression and
utilisation or destruction of MM/VAM in year y (tCO2e/yr). Calculated in accordance with the latest approved version of the "Tool to calculate baseline, project and/or leakage emissions from electricity consumption"
PEFF,y Project emissions from the combustion of fossil fuels for capture, transportation, compression and utilisation or destruction of MM/VAM in year y (tCO2e/yr). Calculated in accordance with the latest approved version of the "Tool to calculate project or leakage CO2 emissions from fossil fuel combustion"
No fossil fuel will be used for the capture, transportation, compression, utilisation or destruction of MM/VAM in the project activity. Hence, PEFF,y = 0. The mine methane captured will be pumped to surface. The pumping will be done by using an electrical blower. To calculate PEELEC,y, AM0064 states that the “Tool to calculate baseline, project and/or leakage emissions from electricity consumption” (Version 01) must be used. The application of this tool can be seen in Annex 4. Project emissions from the combustion of MM/VAM

PROJECT DESIGN DOCUMENT FORM (CDM PDD) - Version 03 CDM – Executive Board page 28 AM0064 states that when the captured mine methane is burned in a flare, heat or power plant, or oxidized in a catalytic oxidation unit, emissions from combustion are released. (In addition, if non methane hydro carbons (NMHC) account for more than 1% by volume of the extracted MM or more than 0.1% by volume of the extracted VAM, combustion emissions from these gases should also be included.) The project emissions (PE) from mine methane destruction (MD) are then accounted for as follows:
( ) ( )NMHCCHyGASyHEATyELECyOXyFLyMD CEFrCEFMDMDMDMDMDPE ×+×++++= 4,,,,,, (15) Where: PEMD,y Project emissions from MM/VAM destroyed in year y (tCO2e/yr) MDFL,y Amount of methane destroyed through flaring in year y (tCH4/yr) MDOX,y Amount of methane destroyed through catalytic oxidation in year y (tCH4/yr) MDELEC,y Amount of methane destroyed through power generation in year y (tCO2e/yr) MDHEAT,y Amount of methane destroyed through heat generation in year y (tCO2e/yr) MDGAS,y Amount of methane destroyed after being supplied to gas grid or for vehicle use in year y
(tCH4) CEFCH4 Carbon emission factor for combusted methane (2.75 tCO2/tCH4) CEFNMHC Carbon emission factor for combusted non methane hydrocarbons (the concentration
varies and, therefore, to be obtained through periodical analysis of captured methane) (tCO2/tNMHC)
r Relative proportion of NMHC compared to methane r=PCNMHC/PCCH4 PCCH4 Concentration (in mass) of methane in extracted gas (%), measured on wet basis PCNMHC NMHC concentration (in mass) in extracted gas (%) No mine methane will be:
• Destroyed through catalytic oxidation (MDOX,y = 0) • Supplied to a gas grid or used as vehicle fuel (MDGAS,y = 0) • Destroyed through heat generation (MDHEAT,y = 0)
Equation 15 then simplifies to Equation 15.1:
( ) ( )NMHCCHyELECyFLyMD CEFrCEFMDMDPE ×+×+= 4,,, (15.1) Furthermore, gas analysis indicated that non-methane hydrocarbons (NMHCs) accounts for 0.00% of the composition. Therefore, the NMHCs are below the 1% threshold for the ex-ante calculation of the emission reductions and are assumed negligible. Therefore, they are excluded. However, they will be monitored in the project activity. Equation 14.1 is simplified further to Equation 14.2:
( ) ( )4,,, CHyELECyFLyMD CEFMDMDPE ×+= (15.2) AM0064 states that the amount of methane destroyed by each application depends on the efficiency of combustion in that application. Firstly, the mine methane destroyed by the flare is determined:

PROJECT DESIGN DOCUMENT FORM (CDM PDD) - Version 03 CDM – Executive Board page 29
4
,,,
CH
yflareyFLyFL GWP
PEMMESMD −= (16)
Where: MDFL,y Amount of methane destroyed through flaring in year y (tCH4) MMESFL,y Amount of methane measured sent to flare in year y (tCH4) PEflare,y Project emissions of non-combusted CH4, expressed in terms of tCO2e, from flaring of
the residual gas stream in year y (tCO2e) GWPCH4 Global warming potential of methane (21 tCO2/tCH4)
The project emissions of non-combusted CH4 expressed in terms of CO2e from flaring of the residual gas stream (PEflare,y) was calculated following the procedures described in the “Tool to determine project emissions from flaring gases containing methane” (Version: not stated. Origin: EB 28, Annex 13). The calculations of the project emissions of non-combusted CH4 can be found in Annex 4. Secondly, the mine methane destroyed through electricity generation is determined:
ELECyELECyELEC EffMMESMD ×= ,, (20) Where: MMESELEC,y Amount of methane measured sent to power plant in year y (tCH4) EffELEC Efficiency of methane destruction/oxidation in power plant Project emissions from un-combusted methane
( ) 4,,,4, 1 CHyOXyflarei
iyiCHyUM GWPPEPEEffMMESGWPPE ×++⎥⎦
⎤⎢⎣
⎡−××= ∑ (23)
Where: PEUM,y Project emissions from un-combusted methane in year y (tCO2e) GWPCH4 Global warming potential of methane (21 tCO2e/tCH4) MMESi,y Methane measured sent to use i in year y (tCH4) Effi Efficiency of methane destruction in use i (%) PEflare,y Project emissions of non-combusted CH4, expressed in terms of tCO2e, from the residual
gas stream (tCO2e) PEOX,y Project emissions of non oxidized CH4 from catalytic oxidation of the VAM stream in
year y (tCH4) As applied to this project, Equation 23 becomes:
( )[ ] yflareELECELECCHyUM PEEffMMESGWPPE ,4, 1 +−××= (23.1) Where:

PROJECT DESIGN DOCUMENT FORM (CDM PDD) - Version 03 CDM – Executive Board page 30 MMESELEC,y Amount of methane measured sent to power plant in year y (tCH4) EffELEC Efficiency of methane destruction/oxidation in power plant Leakage due to project activities recovering mine methane AM0064 states that “Leakage may occur if the project activity prevents MM/VAM from being used to meet the baseline thermal energy demand, whether as a result of physical constraints on delivery, or price changes.” No mine methane (MM) was used in the baseline. Such displacement resulting in leakage does not occur and the project activity does not “cause increased emissions outside the project boundary associated with meeting thermal energy demand with other fuels.” AM0064 states that “because of likely day-to-day fluctuations in MM/VAM extraction rates, to ensure a conservative result, CERs should not be calculated solely from annual data. Any CERs generated from methane destruction should be calculated using daily logs, or monthly logs if daily data are not available, of project-case demand for MM/VAM for non-thermal uses compared against estimates of the baseline MM/VAM demand for thermal uses. For each day (or month) of the crediting period, this form of leakage must be calculated if:”
( ) kkHEATkELECk THMMESMMESME <+− ,, (28) Where: MEk Methane extracted on day k (tCH4) MMESHEAT,k Methane measured sent to new heat generation uses on day k in the project
scenario that would not have been sent in the baseline scenario on day k (tCH4) MMESELEC,k Methane measured sent to power plant on day k (tCH4) THk Methane used to serve thermal energy demand in the baseline for day k (tCH4) No mine methane is used in the baseline (THk = 0) and It is furthermore not possible for the sum of methane sent to heat generation equipment (MMESHEAT,k) and the methane sent to electricity generation equipment (MMESELEC,k) to be more than the methane extracted (MEk). The result is that:
( ) 0,, ≥+− kHEATkELECk MMESMMESME (28.1) Taking into consideration that THk = 0, the implication is that no leakage occurs in this project activity.
OXIDEFNCVQLE AFAFAFy ×××= (32) Where: LEy Leakage emissions in year y (tCO2e/yr) QAF,y Quantity of alternative fuels displaced by the project activity in year y (tonnes or m3) NCVAF Net calorific value for alternative fuels (GJ/tonne or m3)

PROJECT DESIGN DOCUMENT FORM (CDM PDD) - Version 03 CDM – Executive Board page 31 EFAF Emissions factor for alternative fuel (tCO2/GJ) sourced from IPCC OXID Oxidation efficiency of combustion (%), sourced from IPCC Since QAF,y is zero. The result is that: LEy = 0 (32.1) Emission reductions The emission reduction ERy by the project activity during a given year y is the difference between the baseline emissions (BEy) and project emissions (PEy). The leakage emissions (LEy) in this project activity are zero as no activity which uses methane occurred in the baseline. No baseline methane application was thus displaced. The emission reduction is calculated as below:
yyyy LEPEBEER −−= (33) Where: ERy Emission reductions in year y (tCO2e/yr) BEy Baseline emissions in year y (tCO2e/yr) PEy Project emissions in year y (tCO2e/yr) LEy Leakage emissions in year y (tCO2e/yr)
B.6.2. Data and parameters that are available at validation: The following table with values is reproduced from the flaring tool: Parameter SI Unit Description Value MMCH4 kg/kmol Molecular mass of methane 16.04MMCO kg/kmol Molecular mass of carbon monoxide 28.01MMCO2 kg/kmol Molecular mass of carbon dioxide 44.01MMO2 kg/kmol Molecular mass of oxygen 32MMH2 kg/kmol Molecular mass of hydrogen 2.02MMN2 kg/kmol Molecular mass of nitrogen 28.02AMc kg/kmol (g/mol) Atomic mass of carbon 12AMh kg/kmol (g/mol) Atomic mass of hydrogen 1.01AMo kg/kmol (g/mol) Atomic mass of oxygen 16AMn kg/kmol (g/mol) Atomic mass of nitrogen 14.01Pn Pa Atmospheric pressure at normal conditions 101 325 Ru Pa.m3/kmol.K Universal ideal gas constant 8 314.472 Tn K Temperature at normal conditions 273.15MFO2 Dimensionless O2 volumetric fraction of air 0.21GWPCH4 tCO2/tCH4 Global warming potential of methane 21

PROJECT DESIGN DOCUMENT FORM (CDM PDD) - Version 03 CDM – Executive Board page 32 MVn m3/Kmol Volume of one mole of any ideal gas at normal 22.414
Data / Parameter: COPABS Data unit: Dimensionless Description: Coefficient of performance of the absorption chillers (MW thermal input / MW
thermal output) used in the project activity Source of data used: Manufacturer Value applied: 1 Justification of the choice of data or description of measurement methods and procedures actually applied :
The manufacturer’s data for the performance of the absorption chillers was used.
Any comment: Data / Parameter: COPELEC
Data unit: Dimensionless Description: Coefficient of performance of the Electric Chillers (MW thermal input / MW
thermal output) Source of data used: Manufacturer Value applied: 3.5 Justification of the choice of data or description of measurement methods and procedures actually applied :
Manufacturer’s data was used.
Any comment: Data / Parameter: sgrid
Data unit: percentage Description: Percentage of the electricity demand supplied by the grid imports for the 3 years
preceding the implementation of the project. Source of data used: Current and historical mining operations at Beatrix mine. Value applied: 100% Justification of the choice of data or description of measurement methods and procedures actually applied :
No captive electricity generation occurs in the baseline. Historically, all electricity is sourced from the national grid.
Any comment:
Data / Parameter: scaptive
Data unit: percentage Description: Percentage of the electricity demand supplied by captive electricity generation

PROJECT DESIGN DOCUMENT FORM (CDM PDD) - Version 03 CDM – Executive Board page 33
for the 3 years preceding the implementation of the project. Source of data used: Current and historical mining operations at Beatrix mine. Value applied: 0% Justification of the choice of data or description of measurement methods and procedures actually applied :
No captive electricity generation occurs in the baseline. Historically, all electricity is sourced from the national grid.
Any comment: Data / Parameter: CEFCH4
Data unit: tCO2/tCH4 Description: Carbon emission factor for combusted methane Source of data used: As stated in AM0064 Value applied: 2.75 Justification of the choice of data or description of measurement methods and procedures actually applied :
Ex ante value stated in AM0064
Any comment: 44/16 = 2.75 tCO2e/tCH4 Data / Parameter: EffELEC
Data unit: Percentage Description: Efficiency of methane destruction/oxidation in power plant Source of data used: IPCC default value as stated in AM0064 Value applied: 99.5% Justification of the choice of data or description of measurement methods and procedures actually applied :
IPCC default value as stated in AM0064
Any comment: Data / Parameter: THBL Data unit: tCH4 Description: Average annual thermal demand over the past 5 years (tCH4) Source of data used: Current and historical mining operations at Beatrix mine Value applied: 0 Justification of the choice of data or description of measurement methods and procedures actually
Historically the baseline scenario had no thermal demand.

PROJECT DESIGN DOCUMENT FORM (CDM PDD) - Version 03 CDM – Executive Board page 34 applied : Any comment: Data / Parameter: EFgrid Data unit: tCO2/MWh Description: Grid emission factor Source of data used: Eskom data Value applied: 1.021 Justification of the choice of data or description of measurement methods and procedures actually applied :
“Tool to calculate the emission factor for an electricity system”
Any comment:
B.6.3. Ex-ante calculation of emission reductions: >>
The calculations presented in this section were based on: • A starting date of the project is 23 December 2011 (See “AFE” (authorisation for expenditure)
supporting documentation). This is the date that the first approval towards a significant expenditure for this project was made;
• Crediting period starting 01 Jan 2013 • Flaring occurs in the first phase of the project, which runs from 01 Jan to 31 Dec 2013; • Electricity generation, chilling with absorption chillers, and flaring occur in the second phase of
the project, which runs from 01 Jan 2014 to the end of the crediting period. • The main flare will have all the monitoring equipment necessary to calculate the actual
combustion efficiency as per the “Tool to determine project emissions from flaring gases containing methane.” This per the quote obtained for the flare.
Baseline emissions for mine methane capture and utilization or destruction Equation 1:
Year BEy BEMD,y BEMR,y BEUse,y
1 141 628.52 0 141 628.52 - 2 194 925.07 0 141 628.52 53 296.55 3 194 925.07 0 141 628.52 53 296.55 4 194 925.07 0 141 628.52 53 296.55 5 194 925.07 0 141 628.52 53 296.55 6 194 925.07 0 141 628.52 53 296.55 7 194 925.07 0 141 628.52 53 296.55 8 194 925.07 0 141 628.52 53 296.55
yUseyMRyMDy BEBEBEBE ,,, ++=
PROJECT DESIGN DOCUMENT FORM (CDM PDD) - Version 03 CDM – Executive Board page 35
9 194 925.07 0 141 628.52 53 296.55 10 194 925.07 0 141 628.52 53 296.55
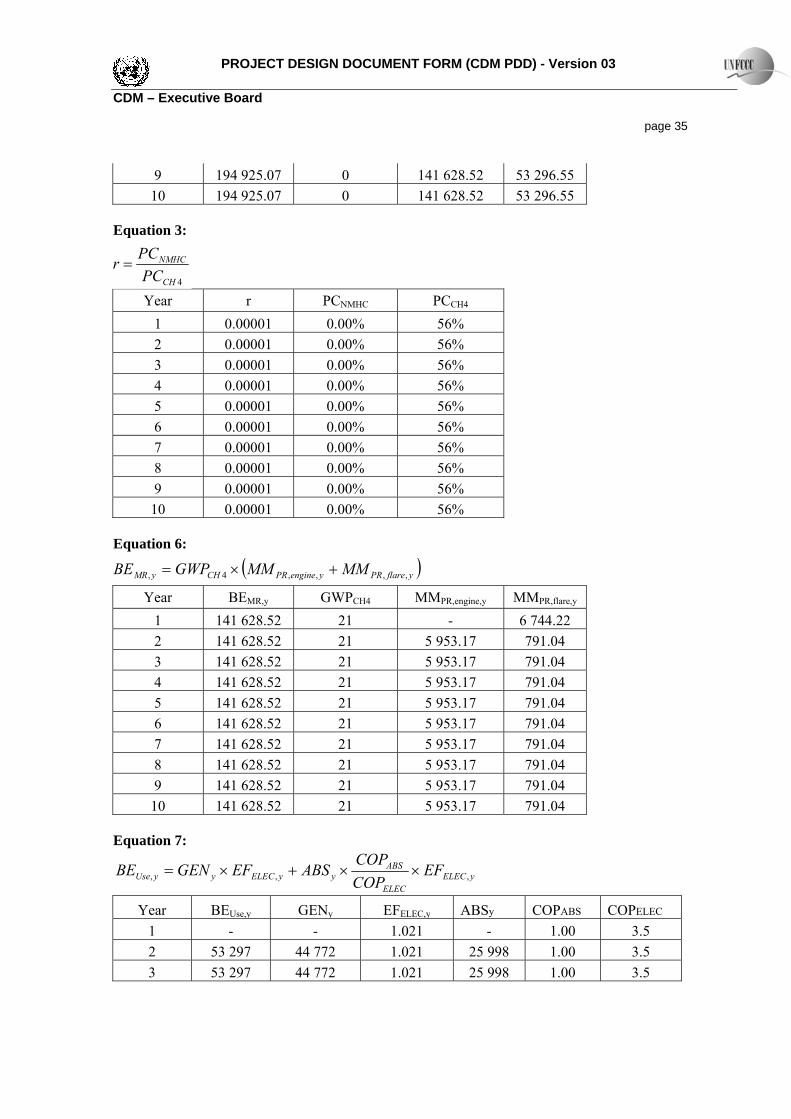
Equation 3:
Year r PCNMHC PCCH4 1 0.00001 0.00% 56% 2 0.00001 0.00% 56% 3 0.00001 0.00% 56% 4 0.00001 0.00% 56% 5 0.00001 0.00% 56% 6 0.00001 0.00% 56% 7 0.00001 0.00% 56% 8 0.00001 0.00% 56% 9 0.00001 0.00% 56% 10 0.00001 0.00% 56%
Equation 6:
Year BEMR,y GWPCH4 MMPR,engine,y MMPR,flare,y 1 141 628.52 21 - 6 744.22 2 141 628.52 21 5 953.17 791.04 3 141 628.52 21 5 953.17 791.04 4 141 628.52 21 5 953.17 791.04 5 141 628.52 21 5 953.17 791.04 6 141 628.52 21 5 953.17 791.04 7 141 628.52 21 5 953.17 791.04 8 141 628.52 21 5 953.17 791.04 9 141 628.52 21 5 953.17 791.04 10 141 628.52 21 5 953.17 791.04
Equation 7:
yELECELEC
ABSyyELECyyUse EF
COPCOP
ABSEFGENBE ,,, ××+×=
Year BEUse,y GENy EFELEC,y ABSy COPABS COPELEC 1 - - 1.021 - 1.00 3.5 2 53 297 44 772 1.021 25 998 1.00 3.5 3 53 297 44 772 1.021 25 998 1.00 3.5
4CH
NMHC
PCPCr =
( )yflarePRyenginePRCHyMR MMMMGWPBE ,,,,4, +×=

PROJECT DESIGN DOCUMENT FORM (CDM PDD) - Version 03 CDM – Executive Board page 36
4 53 297 44 772 1.021 25 998 1.00 3.5 5 53 297 44 772 1.021 25 998 1.00 3.5 6 53 297 44 772 1.021 25 998 1.00 3.5 7 53 297 44 772 1.021 25 998 1.00 3.5 8 53 297 44 772 1.021 25 998 1.00 3.5 9 53 297 44 772 1.021 25 998 1.00 3.5 10 53 297 44 772 1.021 25 998 1.00 3.5
Equation 9:
Year EFELEC,y sgrid EFgrid,y scaptive EFcaptive,y 1 1.021 1 1.021 0 0 2 1.021 1 1.021 0 0 3 1.021 1 1.021 0 0 4 1.021 1 1.021 0 0 5 1.021 1 1.021 0 0 6 1.021 1 1.021 0 0 7 1.021 1 1.021 0 0 8 1.021 1 1.021 0 0 9 1.021 1 1.021 0 0 10 1.021 1 1.021 0 0
Project emissions due to project activities recovering mine methane
Equation 13:
Year PEy PEME,y PEMD,y PEUM,y 1 65 364.28 1 792.25 11 761.94 51 810.10 2 23 797.49 1 792.25 18 025.43 3 979.81 3 23 797.49 1 792.25 18 025.43 3 979.81 4 23 797.49 1 792.25 18 025.43 3 979.81 5 23 797.49 1 792.25 18 025.43 3 979.81 6 23 797.49 1 792.25 18 025.43 3 979.81 7 23 797.49 1 792.25 18 025.43 3 979.81 8 23 797.49 1 792.25 18 025.43 3 979.81 9 23 797.49 1 792.25 18 025.43 3 979.81 10 23 797.49 1 792.25 18 025.43 3 979.81
Equation 14:
ycaptivecaptiveygridgridyELEC EFsEFsEF ,,, ×+×=
yUMyMDyMEy PEPEPEPE ,,, ++=
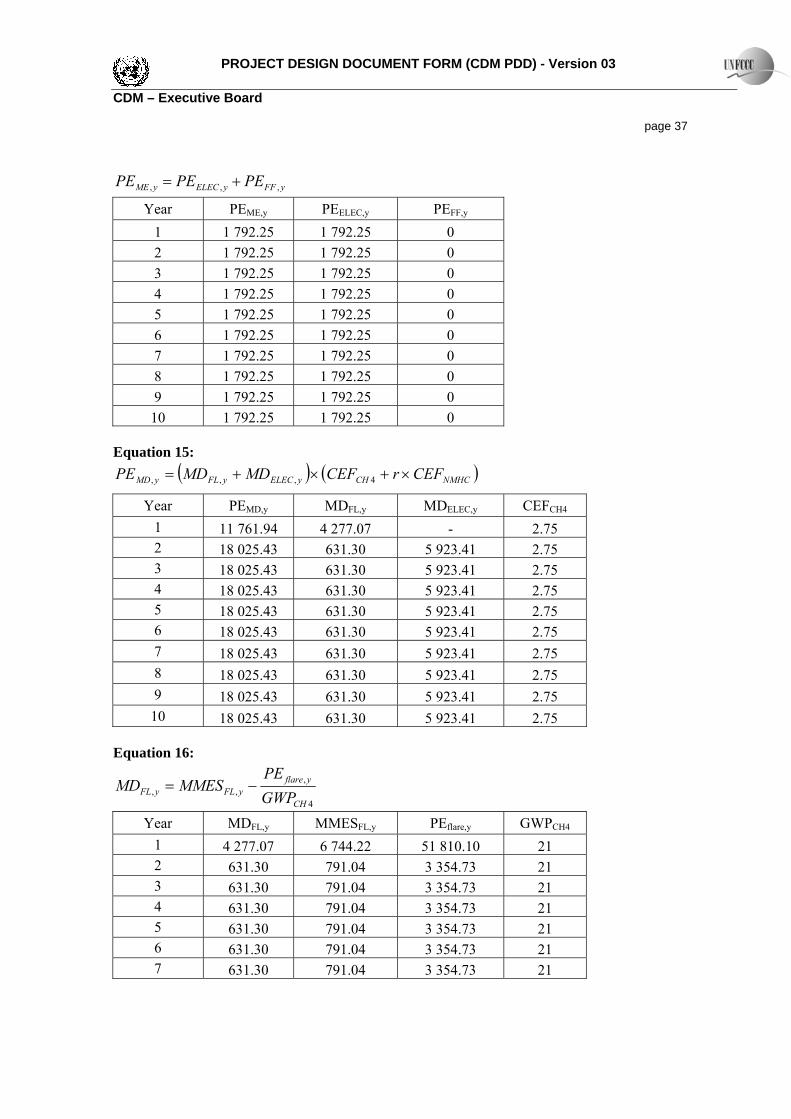
PROJECT DESIGN DOCUMENT FORM (CDM PDD) - Version 03 CDM – Executive Board page 37
Year PEME,y PEELEC,y PEFF,y 1 1 792.25 1 792.25 0 2 1 792.25 1 792.25 0 3 1 792.25 1 792.25 0 4 1 792.25 1 792.25 0 5 1 792.25 1 792.25 0 6 1 792.25 1 792.25 0 7 1 792.25 1 792.25 0 8 1 792.25 1 792.25 0 9 1 792.25 1 792.25 0 10 1 792.25 1 792.25 0
Equation 15:
Year PEMD,y MDFL,y MDELEC,y CEFCH4 1 11 761.94 4 277.07 - 2.75 2 18 025.43 631.30 5 923.41 2.75 3 18 025.43 631.30 5 923.41 2.75 4 18 025.43 631.30 5 923.41 2.75 5 18 025.43 631.30 5 923.41 2.75 6 18 025.43 631.30 5 923.41 2.75 7 18 025.43 631.30 5 923.41 2.75 8 18 025.43 631.30 5 923.41 2.75 9 18 025.43 631.30 5 923.41 2.75 10 18 025.43 631.30 5 923.41 2.75
Equation 16:
Year MDFL,y MMESFL,y PEflare,y GWPCH4
1 4 277.07 6 744.22 51 810.10 21 2 631.30 791.04 3 354.73 21 3 631.30 791.04 3 354.73 21 4 631.30 791.04 3 354.73 21 5 631.30 791.04 3 354.73 21 6 631.30 791.04 3 354.73 21 7 631.30 791.04 3 354.73 21
yFFyELECyME PEPEPE ,,, +=
( ) ( )NMHCCHyELECyFLyMD CEFrCEFMDMDPE ×+×+= 4,,,
4
,,,
CH
yflareyFLyFL GWP
PEMMESMD −=

PROJECT DESIGN DOCUMENT FORM (CDM PDD) - Version 03 CDM – Executive Board page 38
8 631.30 791.04 3 354.73 21 9 631.30 791.04 3 354.73 21 10 631.30 791.04 3 354.73 21
Equation 20:
Year MDELEC,y MMESELEC,y EffELEC 1 - - 99.5% 2 5 923.41 5 953.17 99.5% 3 5 923.41 5 953.17 99.5% 4 5 923.41 5 953.17 99.5% 5 5 923.41 5 953.17 99.5% 6 5 923.41 5 953.17 99.5% 7 5 923.41 5 953.17 99.5% 8 5 923.41 5 953.17 99.5% 9 5 923.41 5 953.17 99.5% 10 5 923.41 5 953.17 99.5%
Equation 23:
Year PEUM,y MMESELEC,y EffELEC PEflare,y PEOX,y GWPCH4
1 51 810.10 - 99.5% 51 810.10 0 21 2 3 979.81 5 953.17 99.5% 3 354.73 0 21 3 3 979.81 5 953.17 99.5% 3 354.73 0 21 4 3 979.81 5 953.17 99.5% 3 354.73 0 21 5 3 979.81 5 953.17 99.5% 3 354.73 0 21 6 3 979.81 5 953.17 99.5% 3 354.73 0 21 7 3 979.81 5 953.17 99.5% 3 354.73 0 21 8 3 979.81 5 953.17 99.5% 3 354.73 0 21 9 3 979.81 5 953.17 99.5% 3 354.73 0 21
10 3 979.81 5 953.17 99.5% 3 354.73 0 21 Leakage due to project activities recovering mine methane Equation 28:
Year MEk MMESELEC,k MMESHEAT,k LHS THk 1 18.48 - 0 18.48 0
ELECyELECyELEC EffMMESMD ×= ,,
( )[ ] yflareELECELECCHyUM PEEffMMESGWPPE ,4, 1 +−××=
( ) kkHEATkELECk THMMESMMESME <+− ,,
PROJECT DESIGN DOCUMENT FORM (CDM PDD) - Version 03 CDM – Executive Board page 39
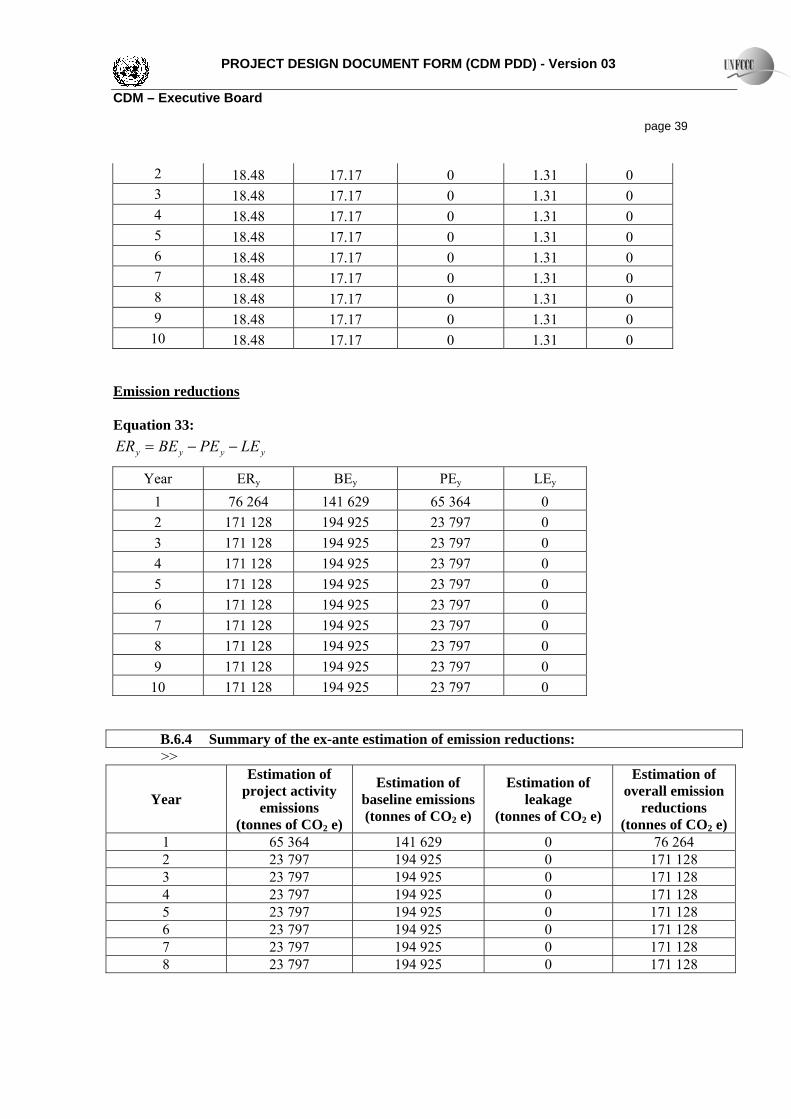
2 18.48 17.17 0 1.31 0 3 18.48 17.17 0 1.31 0 4 18.48 17.17 0 1.31 0 5 18.48 17.17 0 1.31 0 6 18.48 17.17 0 1.31 0 7 18.48 17.17 0 1.31 0 8 18.48 17.17 0 1.31 0 9 18.48 17.17 0 1.31 0 10 18.48 17.17 0 1.31 0
Emission reductions
Equation 33:
Year ERy BEy PEy LEy 1 76 264 141 629 65 364 0 2 171 128 194 925 23 797 0 3 171 128 194 925 23 797 0 4 171 128 194 925 23 797 0 5 171 128 194 925 23 797 0 6 171 128 194 925 23 797 0 7 171 128 194 925 23 797 0 8 171 128 194 925 23 797 0 9 171 128 194 925 23 797 0 10 171 128 194 925 23 797 0
B.6.4 Summary of the ex-ante estimation of emission reductions: >>
Year
Estimation of project activity
emissions (tonnes of CO2 e)
Estimation of baseline emissions (tonnes of CO2 e)
Estimation of leakage
(tonnes of CO2 e)
Estimation of overall emission
reductions (tonnes of CO2 e)
1 65 364 141 629 0 76 264 2 23 797 194 925 0 171 128 3 23 797 194 925 0 171 128 4 23 797 194 925 0 171 128 5 23 797 194 925 0 171 128 6 23 797 194 925 0 171 128 7 23 797 194 925 0 171 128 8 23 797 194 925 0 171 128
yyyy LEPEBEER −−=

PROJECT DESIGN DOCUMENT FORM (CDM PDD) - Version 03 CDM – Executive Board page 40
9 23 797 194 925 0 171 128 10 23 797 194 925 0 171 128
Total (tonnes of CO2 e) 279 542 1 895 954 0 1 616 416
B.7. Application of the monitoring methodology and description of the monitoring plan:
B.7.1 Data and parameters monitored:
Data / Parameter: MMPR,engine,y or MMESELEC,y Data unit: tCH4/yr Description: Mine methane captured, sent to and destroyed by internal combustion engines in
the project activity in year y. Source of data to be used:
Engine specifications were used for the purpose of the ex-ante calculations. The flowrate will be measured in the project activity. The methane concentration of the gas will be metered at the flare. Since the methane concentration of the gas sent to the flare and the gas sent to the engines does not differ, the concentration of the gas at the flare can be used to give the concentration of the gas sent to the engines.
Value of data applied for the purpose of calculating expected emission reductions in section B.5
6 266.50 tCH4/year
Description of measurement methods and procedures to be applied:
The flowrate of the gas will be monitored continuously, integrated hourly and logged electronically. The monitoring report will consolidate these values monthly for the purpose of the verification. The methane concentration will be measured continuously at the flare and consolidated to a monthly figure for the monitoring report.
QA/QC procedures to be applied:
The flowmeter and concentration meter will be calibrated according to manufacturer’s specifications.
Any comment: Data / Parameter: MMPR,flare,y or MMESFL,y Data unit: tCH4/yr Description: Mine methane captured, sent to and destroyed by flare in the project activity in
year y Source of data to be used:
A flow meter and concentration meter will be installed to measure the flowrate of methane sent to the flare.
Value of data applied for the purpose of calculating expected emission reductions in section B.5
477.72 tCH4/year
Description of measurement methods
The flow meter will measure the flowrate of gas. The flow meter has temperature and pressure compensation. The methane value of that gas will be monitored and
PROJECT DESIGN DOCUMENT FORM (CDM PDD) - Version 03 CDM – Executive Board page 41 and procedures to be applied:
used to calculate the flowrate of methane. These values will be consolidated to a monthly value for the purpose of the report.
QA/QC procedures to be applied:
The flowmeter and methane concentration meter will be calibrated in accordance with manufacturer’s specifications.
Any comment: Data / Parameter: GENy Data unit: MWh Description: Electricity generated by the project activity in year y Source of data to be used:
The electrical output will be measured by an electricity meter installed at the engines.
Value of data applied for the purpose of calculating expected emission reductions in section B.5
44 772 MWh
Description of measurement methods and procedures to be applied:
The electricity output will be measured at the engines. This meter will be installed in phase 2. The electricity generated will be monitored continuously, integrated hourly and logged electronically. For the monitoring report the values will be consolidated on a monthly basis for verification.
QA/QC procedures to be applied:
The meter will be calibrated according to manufacturer’s specifications.
Any comment: Data / Parameter: PCCH4 Data unit: % Description: Concentration (in mass) of methane in extracted gas (%), measured on wet basis Source of data to be used:
The concentration of methane will be monitored continuously at the underground monitoring stations. The methane concentration of the gas is then monitored again at the flare.
Value of data applied for the purpose of calculating expected emission reductions in section B.5
56.18 %
Description of measurement methods and procedures to be applied:
The concentration will be monitored continuously, integrated hourly and logged electronically. The methane concentration will be measured in volume percent. Using the flowrate of the gas, the volumetric concentrations of the components in the gas and molar masses; the volume percent will be converted into a mass percent. The concentration will be monitored on a wet basis and this value will be reported on a wet basis. The concentration is metered by a gas analysis device. This device will first, cool the gas to a temperature of roughly 5 degrees Celsius

PROJECT DESIGN DOCUMENT FORM (CDM PDD) - Version 03 CDM – Executive Board page 42
(condensate will be evacuated), logically the gas is now 100% wet since it is very close to the dew point. Afterwards, the gas will move to the measuring cells in this status. So the gas is wet. For the monitoring report these values will be consolidated and reported on as monthly values for the verification
QA/QC procedures to be applied:
Maintenance of concentration meters will be done according to manufacturer’s specification; which comply with manufacturer’s specifications.
Any comment: Data / Parameter: PCNMHC Data unit: % Description: NMHC concentration (in mass) in extracted gas Source of data to be used:
The gas will be sampled every 3 months initially and tested for the NMHC concentration. The frequency of this will be reduced to twice a year after the first year of operation of the plant. The methane concentration will be monitored continuously. If the methane concentration falls below the 75% indicated by the analysis taken prior to the project activity or the average concentration in that year then the gas will be sampled again and the new NMHC concentration will be used.
Value of data applied for the purpose of calculating expected emission reductions in section B.5
0.00 %
Description of measurement methods and procedures to be applied:
The gas is sampled and the samples are sent to a laboratory for testing.
QA/QC procedures to be applied:
Any comment: Data / Parameter: ECPJ,,y
Data unit: MWh/y Description: Quantity of electricity consumed by the project electricity consumption
source in year y Source of data to be used:
The electricity consumed by the plant will be measured.
Value of data applied for the purpose of calculating expected emission reductions in section B.5
1 704 MWh/year
Description of measurement methods and procedures to be
The electricity consumption of the electricity generating equipment and auxiliaries will be measured. The continuous monitored data will be logged electronically. These values will be consolidated and reported on a monthly basis

PROJECT DESIGN DOCUMENT FORM (CDM PDD) - Version 03 CDM – Executive Board page 43 applied: for the verification. QA/QC procedures to be applied:
The measuring equipment will be calibrated according to manufacturer’s specifications.
Any comment: Data / Parameter: TDLy Data unit: - Description: Average technical transmission and distribution losses for providing electricity to
source in year y Source of data to be used:
A default value of 3% was used because the scenario presented below was found to be applicable to the project (verbatim text in italics): (b) project and leakage electricity consumption sources if the electricity consumption by all project and leakage electricity consumption sources to which scenario A or scenario C (cases C.I or C.III) applies is smaller than the electricity consumption of all baseline electricity consumption sources to which scenario A or scenario C (cases C.I or C.III) applies.
Value of data applied for the purpose of calculating expected emission reductions in section B.5
Default 3% as stated in “Tool to calculate baseline, project and/or leakage emissions from electricity consumption”
Description of measurement methods and procedures to be applied:
The tool will be checked annually for updates and new default values.
QA/QC procedures to be applied:
Default values, as stated in the tool, will be used.
Any comment: Data / Parameter: FVRG,h
Data unit: m3/h Description: Volumetric flow rate of the residual gas in dry basis at normal conditions in the
hour h Source of data to be used:
Measurements will be taken using a flow meter
Value of data applied for the purpose of calculating expected emission reductions in section B.5
105.09 m3/h
Description of measurement methods and procedures to be applied:
A flowmeter will be installed to measure the flowrate of gas sent to the flare. The volumetric flowrate will be measured on a dry basis; ensuring that all the moisture is removed prior to the analysis. This will be the same for the density of methane and the fraction of methane in the residual gas. The flowrate will be measured after the dewatering unit and after the pressure

PROJECT DESIGN DOCUMENT FORM (CDM PDD) - Version 03 CDM – Executive Board page 44
increase of the blowers (here, there is also a significant gas temperature increase). At this time, there is no condensate and the relative humidity is not zero but approximately 20-30%. So, the gas is dry. These flowrates will be consolidated into monthly values in the monitoring report for verification.
QA/QC procedures to be applied:
Flow meters are to be calibrated annually according to the manufacturer’s specification.
Any comment: Data / Parameter: fvi,h Data unit: - Description: Volumetric fraction of component i in the residual gas in the hour h
Where i is CH4, N2 Source of data to be used:
Initial gas analyses before project start was used for the ex-ante calculations. Thereafter, the volumetric fraction of CH4 will be measured and remainder will be considered to be N2.
Value of data applied for the purpose of calculating expected emission reductions in section B.5
fvCH4,h = 0.708 (value from initial measurement) fvN2,h = 0.292 (value from initial measurement)
Description of measurement methods and procedures to be applied:
The volumetric fraction of CH4 will be measured continuously. The remainder will be considered as N2. The volumetric fraction of methane will be measured on a dry basis; ensuring that all the moisture is removed prior to the analysis. This will be in line with the measurement of the gas flowrate and the density of methane. These fractions will be consolidated into a monthly value for the purpose of the monitoring report and verification.
QA/QC procedures to be applied:
The instrument measuring the volumetric fraction of CH4 will be calibrated according to the manufacturer’s specifications; which correspond with international standards. Only the CH4 measurement will be used in the calculations as the remainder will be assumed to be N2.
Any comment: Data / Parameter: fvCH4,FG,h Data unit: mg/m3
Description: Concentration of methane in the exhaust gas of the flare in dry basis at normal conditions in the hour h
Source of data to be used:
Measurements at the flare as part of the flare package
Value of data applied for the purpose of calculating expected emission reductions in section B.5
10 721.15 mg/m3
Description of The volumetric fraction of the methane in the exhaust gas will be measured. This

PROJECT DESIGN DOCUMENT FORM (CDM PDD) - Version 03 CDM – Executive Board page 45 measurement methods and procedures to be applied:
measurement will be converted to mg/m3. These values will be consolidated into monthly values in the monitoring report for verification. The concentration of methane will be measured on a dry basis; ensuring that all the moisture is removed prior to the analysis. This will be in line with the measurement of the gas flowrate and the density of methane.
QA/QC procedures to be applied:
The instrument will be calibrated in accordance with manufacturer’s specifications.
Any comment: Data / Parameter: tO2,h
Data unit: - Description: Volumetric fraction of O2 in the exhaust gas of the flare in the hour h Source of data to be used:
Measured using a continuous gas analyser (electrochemical)
Value of data applied for the purpose of calculating expected emission reductions in section B.5
0.04
Description of measurement methods and procedures to be applied:
The concentration of oxygen will be monitored using a flue gas analyser. The concentration of oxygen will be measured on a dry basis; ensuring that all the moisture is removed prior to the analysis. These values will be consolidated into monthly values in the monitoring report for verification.
QA/QC procedures to be applied:
The analyser will be periodically calibrated according to the manufacturer’s recommendation. The accuracy of the instrument is +/- 1%.
Any comment: Data / Parameter: Tflare
Data unit: °C Description: Temperature in the exhaust gas of the flare Source of data to be used:
Measurement
Value of data applied for the purpose of calculating expected emission reductions in section B.5
600 °C
Description of measurement methods and procedures to be applied:
Measure the temperature of the exhaust gas stream in the flare by a Type N thermocouple. A temperature above 500 ºC indicates that a significant amount of gases are still being burnt and that the flare is operating. The temperature should be measured continuously. These values will be consolidated into monthly values in the monitoring report for verification.
QA/QC procedures to be applied:
Thermocouples should be replaced or calibrated every year.
Any comment: An excessively high temperature at the sampling point (above 700 ºC) may be an

PROJECT DESIGN DOCUMENT FORM (CDM PDD) - Version 03 CDM – Executive Board page 46
indication that the flare is not being adequately operated or that its capacity is not adequate to the actual flow.
Data / Parameter: ABSy
Data unit: MWhth Description: Chilling produced in project case by absorption chillers in year y (MWhth).Source of data to be used:
Measurements
Value of data applied for the purpose of calculating expected emission reductions in section B.5
25 998
Description of measurement methods and procedures to be applied:
This variable is reported continuously with an online meter as part of the chiller equipment, which measures the flow and temperature.
QA/QC procedures to be applied:
Calibrated to manufacturers specification
Any comment:
B.7.2. Description of the monitoring plan: >> The monitoring plan will ensure that project emission reductions are accurately monitored, recorded and reported. The onsite monitoring as well as calibration/verification of measurement equipment will be the responsibility of the operations manager. The data will be collected on site and archived both on site and off site. Promethium Carbon, the CDM project developer, will be responsible for calculating the emission reductions and drafting of the monitoring report. Mine Methane Monitoring Plan
1. Data to be monitored.
The monitoring equipment and the placing of the equipment in the project are shown in the diagram below. The following parameters will be monitored as per the applied monitoring methodology:
• The flowrate of the gas sent to the engines and the flare • The methane concentration in the extracted gas • The NMHC concentration in the extracted gas • The composition of the gas going to the flare • The oxygen and methane concentration of the exhaust gas from the flare • The temperature of the flare • The electricity produced by the engines • Cooling provided by the absorption chiller • The electricity consumption of the plant
The monitoring equipment is depicted in the diagram below:
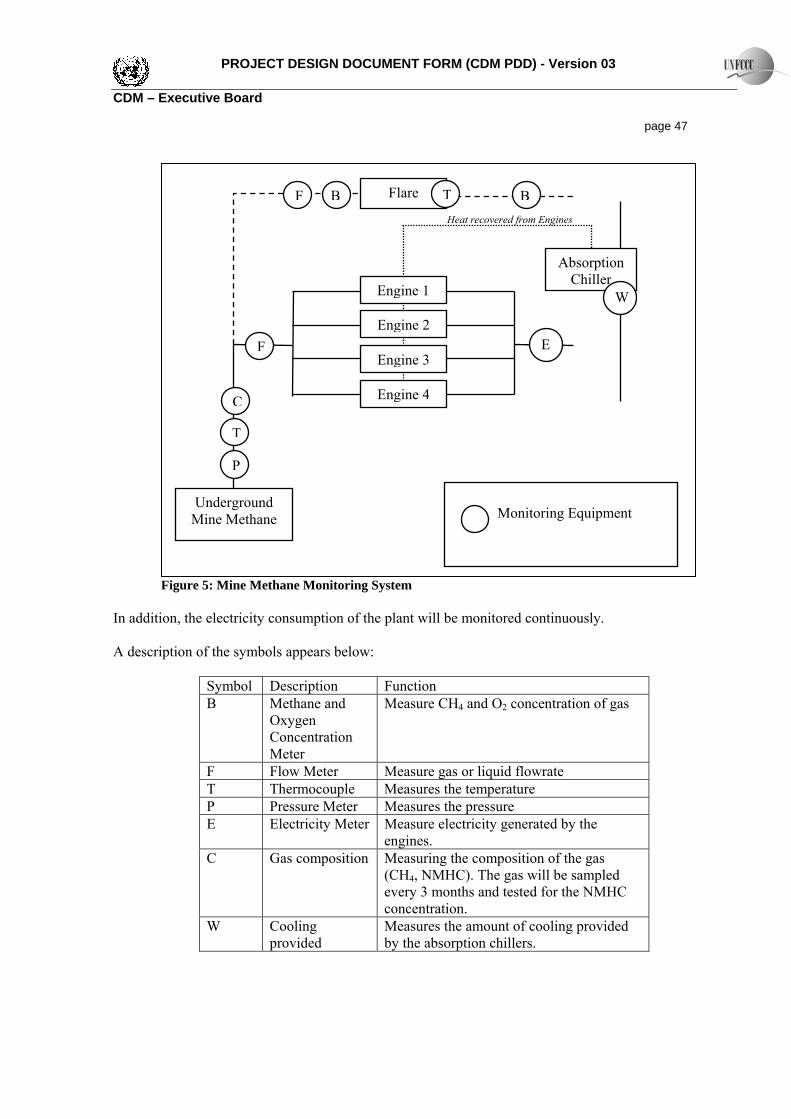
PROJECT DESIGN DOCUMENT FORM (CDM PDD) - Version 03 CDM – Executive Board page 47
Figure 5: Mine Methane Monitoring System
In addition, the electricity consumption of the plant will be monitored continuously. A description of the symbols appears below:
Symbol Description Function B Methane and
Oxygen Concentration Meter
Measure CH4 and O2 concentration of gas
F Flow Meter Measure gas or liquid flowrate T Thermocouple Measures the temperature P Pressure Meter Measures the pressure E Electricity Meter Measure electricity generated by the
engines. C Gas composition Measuring the composition of the gas
(CH4, NMHC). The gas will be sampled every 3 months and tested for the NMHC concentration.
W Cooling provided
Measures the amount of cooling provided by the absorption chillers.
Underground Mine Methane
Flare
Engine 4
Engine 3
Engine 2
F
E
T BB
Monitoring Equipment
C
Engine 1
F
T
P
Absorption Chiller
Heat recovered from Engines
W

PROJECT DESIGN DOCUMENT FORM (CDM PDD) - Version 03 CDM – Executive Board page 48 The below ground monitoring stations for the collection of the underground mine methane are shown in figure 19 below. These stations are to ensure the safety of the underground workers.
Figure 6: The underground piping and monitoring system for methane extraction.
The monitoring stations underground measure both gas flowrate and methane concentration.
2. Responsibility for data monitoring, recording and management.
The operations manager will be responsible for ensuring that the data is monitored and recorded and that the instruments are all in working order.
3. Calibration of meters and metering
The following procedures will be implemented by the project to ensure accurate measurement and therefore accurate knowledge of GHG emission reductions.
• The metering equipment will be calibrated in accordance with manufacturer’s specifications.
• The metering equipment will be calibrated and checked for accuracy in accordance with manufacturer’s specifications.
• The instrumentation has not been finally selected yet. However, the instrumentation must have an accuracy of at least 95%. This can be checked at the first verification.
4. Verification Procedure
Verification will be done annually.
• The project participants will provide the data and calculated emission reductions to the DOE during verification.
Legend
Methane gas monitoring station
Methane gas seal
Methane gas pipelineHorizontal: 300mm diameterShaft: 450mm diameter
No. 1A Ventilation Shaft
A level North
A level South
BEISA SECTION METHANE GAS EXTRACTION

PROJECT DESIGN DOCUMENT FORM (CDM PDD) - Version 03 CDM – Executive Board page 49 The operations personnel and the project participants will cooperate with the DOE during the verification process. The personnel working on this project will be available for consultation during the entire verification and will provide correct data to substantiate all queries. B.8. Date of completion of the application of the baseline study and monitoring methodology and the name of the responsible person(s)/entity(ies): >> Both the baseline study and the monitoring methodology were developed by Promethium Carbon (Pty) Ltd and completed in September 2011. SECTION C. Duration of the project activity / crediting period C.1. Duration of the project activity: C.1.1. Starting date of the project activity: >> The starting date of the project activity is 23 December 2011. This is the date that the flares are ordered in accordance with the project plan. This is in accordance with EB 41 where the starting date can be the date on which contracts have been signed for equipment or construction/operation services required for the project activity. C.1.2. Expected operational lifetime of the project activity: >> The life time of the mine exceeds the 10 year period of this project activity (see “Beatrix LOM” supporting documentation for the life of mine). C.2. Choice of the crediting period and related information: C.2.1. Renewable crediting period: C.2.1.1. Starting date of the first crediting period: >> Not applicable C.2.1.2. Length of the first crediting period: >> Not applicable C.2.2. Fixed crediting period: C.2.2.1. Starting date: >> 01/01/2013 or the date of registration, whatever occurs later.

PROJECT DESIGN DOCUMENT FORM (CDM PDD) - Version 03 CDM – Executive Board page 50 C.2.2.2. Length: >> 10 years SECTION D. Environmental impacts >> D.1. Documentation on the analysis of the environmental impacts, including transboundary impacts: >> The project does not involve any activity that is listed in terms of the National Environmental Management Act and, as such, does not require an environmental impact assessment or a basic assessment. D.2. If environmental impacts are considered significant by the project participants or the host Party, please provide conclusions and all references to support documentation of an environmental impact assessment undertaken in accordance with the procedures as required by the host Party: >> The impacts of the project is summarised below:
• An environmental analysis concluded that there do not appear to be any environmental fatal-flaws associated with the establishment of the proposed cogeneration plant on the existing ‘brown-fields” site;
• The proposed cogeneration plant will be installed at an existing “brown-fields” site. It will not be necessary to apply for a Water Use License in terms of Section 21, 37(1) or 38(1) of the National Water Act, 1998, as no listed water uses are contemplated for the proposed project. This is given that municipal water (Sedibeng) will be used as top-up water for the cogeneration plant; and
SECTION E. Stakeholders’ comments >> E.1. Brief description how comments by local stakeholders have been invited and compiled: >> An advertisement was placed in a local newspaper to inform all the local stakeholders of the CDM project. The advertisement was placed in the Vista newspaper on 29 September 2011. Comments were invited on the project and the closing date for comments was the 17th of October 2011. E.2. Summary of the comments received: >>

PROJECT DESIGN DOCUMENT FORM (CDM PDD) - Version 03 CDM – Executive Board page 51 There was one response to the advertisement, but this was only from a person looking to apply for a job on the project. E.3. Report on how due account was taken of any comments received: >> The person was answered stating that unfortunately there are no job vacancies.

PROJECT DESIGN DOCUMENT FORM (CDM PDD) - Version 03 CDM – Executive Board page 52
Annex 1
CONTACT INFORMATION ON PARTICIPANTS IN THE PROJECT ACTIVITY Organization: GFI Mining South Africa (Pty) Ltd Street/P.O.Box: Farm Leeuwbult No 52 Building: City: Welkom State/Region: District Theunissen Postcode/ZIP: Country: South Africa Telephone: 057 733 8526 FAX: 057 733 8545 E-Mail: [email protected] URL: www.goldfields.co.za Represented by: Title: Mr. Salutation: Last name: Van Greuning Middle name: First name: Dirk Department: Mobile: Direct FAX: Direct tel: Personal e-mail:

PROJECT DESIGN DOCUMENT FORM (CDM PDD) - Version 03 CDM – Executive Board page 53
Annex 2
INFORMATION REGARDING PUBLIC FUNDING

PROJECT DESIGN DOCUMENT FORM (CDM PDD) - Version 03 CDM – Executive Board page 54
Annex 3
BASELINE INFORMATION
Information about the Occurrence of Methane at a Gold Mine 1. Methane Capturing: 1.1 Methane Occurrence: The methane in the Beatrix mining area is not liberated homogeneously as is the case in coal beds. Methane is carried in geological faults from unknown reservoir(s) or source(s). Scientific research into the occurrence of the methane indicates that the methane: (a) seems to come from a deep-seated source, and (b) may be of biological origin. Some of the literature sources are listed below:
• Hugo P. J., Helium in the Orange Free State Gold Field, Geological Survey, Republic of South Africa, 1963.
• Takai et al., Archaeal Diversity in Waters from Deep South African Gold Mines, Applied and Environmental Microbiology, December 2001, Vol 67, No 12, pp 5750 – 5760
• England, G L, Rasmussen, B, Krapez, B, Groves, D I, Archaean oil migration in the Witwatersrand Basin of South Africa, Journal of the Geological Society, Mar 2002
• Spangenberg J., Frimmel H. E., Basin-internal derivation of hydrocarbons in the Witwatersrand Basin, South Africa: evidence from bulk and molecular 13C data, Chemical Geology, 2001, 173, 339-355.
• Ward J.A. et al, Microbial hydrocarbon gases in the Witwatersrand Basin, South Africa: Implications for the deep biosphere, Geochimica et Cosmochimica Acta, Vol. 68, No. 15, pp. 3239–3250, 2004.
The conclusion reached by Ward states that: “… these microbial hydrocarbon gases are the product of in situ methanogenic communities in the deep subsurface of the Witswaterand basin.” Attempts to reduce the methane hazard in the underground mines, by borehole drainage, were made in the 1960s. These attempts were unsuccessful due to the failure to predict the location of the methane gas in the underground mines. This was documented and made public by the Department of Mines in a geological survey on Helium in the Orange Free State Gold-Field. The South African Government Printer, Bulletin 39, G.P.-s 3479551-1962-63-1200

PROJECT DESIGN DOCUMENT FORM (CDM PDD) - Version 03 CDM – Executive Board page 55 The difficulties in predicting the location of the methane in the Beatrix mine are exacerbated by the lack of detailed major and minor geological fault charts. The major geological fault zones, running through the Beatrix mining area, are depicted in Figure 3. The minor faults are largely uncharted. As the country rock in the area is impermeable, methane is carried exclusively in these discrete faults. The exact location of the methane in these discrete faults is difficult to determine. Hence, the management of methane in the mine can only be done on an ex post basis; when the area is mined and the methane is released.
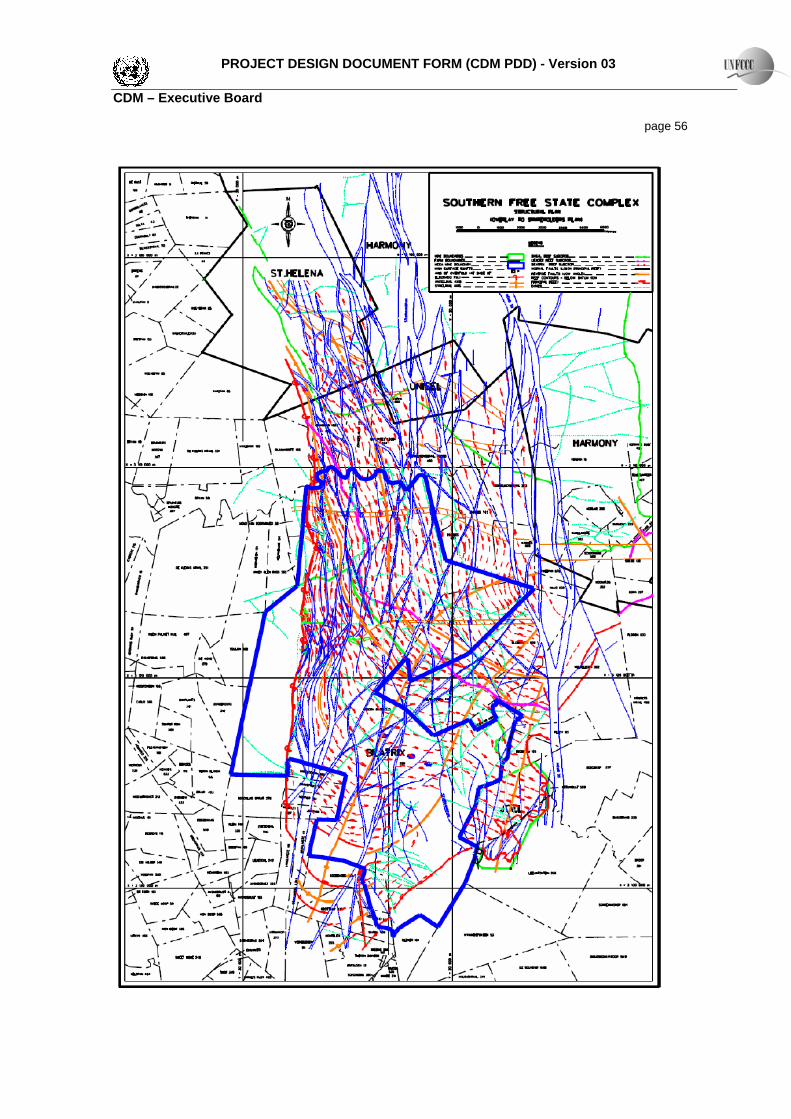
PROJECT DESIGN DOCUMENT FORM (CDM PDD) - Version 03 CDM – Executive Board page 56

PROJECT DESIGN DOCUMENT FORM (CDM PDD) - Version 03 CDM – Executive Board page 57
Figure 7: Geological faults in the Beatrix mining area Historically, methane emissions from mining operations has occurred from the Karoo Supergroup through to the Virginia Formation (refer Figure 8 below) at depths ranging from 300 meters to 3 kilometres.
Figure 8: Free State goldfields stratigraphic column Methane from these geological structures is vented from two main sources: surface boreholes and underground mining areas. Currently, all of the methane from the underground workings is diluted into the ventilation air and vented to surface through the vent shafts. Examples of these vent shafts can be seen in Figure 9.

PROJECT DESIGN DOCUMENT FORM (CDM PDD) - Version 03 CDM – Executive Board page 58
Annex 4
MONITORING INFORMATION
From the “Tool to determine project emissions from flaring gases containing methane” (EB 28, Annex 13): The steps in this tool were carried out to determine the project emissions from flaring the mine methane. A single flare will be installed at the Beisa Shaft to combust the mine methane. The steps in the tool are as follows: STEP 1: Determination of the mass flow rate of the residual gas that is flared This step calculates the residual gas mass flow rate in each hour h, based on the volumetric flow rate and the density of the residual gas. The density of the residual gas is determined based on the volumetric fraction of all components in the gas.
hRGhnRGhRG FVFM ,,,, ×= ρ (Flaring Tool1 1) Where: FMRG,h Mass flow rate of residual gas in hour h (kg/h) ρRG,n,h Density of residual gas at normal conditions in hour h FVRG,h Volumetric flow rate of the residual gas in dry basis at normal conditions in hour h
(m3/h) And:
nhRG
u
nhnRG
TMM
RP
×=
,
,,ρ (Flaring Tool 2)
Where: ρRG,n,h Density of residual gas at normal conditions in hour h Pn Atmospheric pressure at normal conditions (101,325 Pa) Ru Universal ideal gas constant (8,314 Pa.m3/kmol.K)’ MMRG,h Molecular mass of the residual gas in hour h (kg/kmol) Tn Temperature at normal conditions (273.15K) And:
( )∑ ×=i
ihihRG MMfvMM ,, (Flaring Tool 3)
1 UNFCCC methodological tool, “Tool to determine project emissions from flaring gases containing methane”.
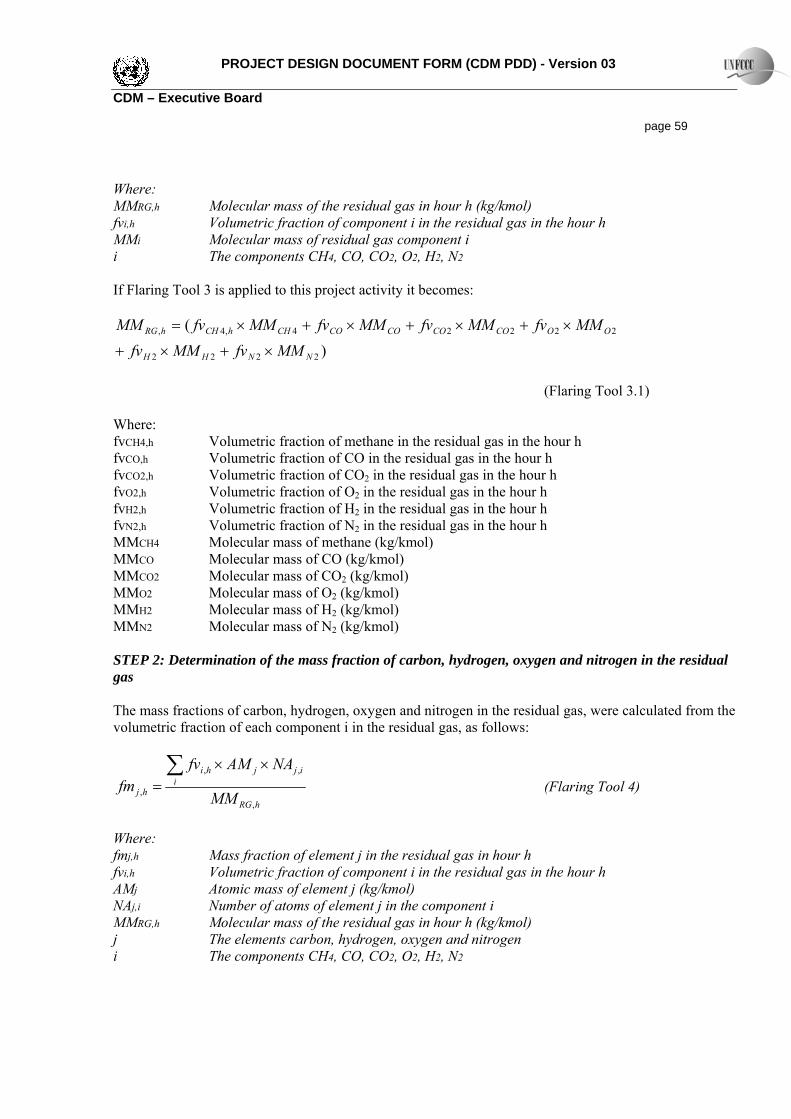
PROJECT DESIGN DOCUMENT FORM (CDM PDD) - Version 03 CDM – Executive Board page 59 Where: MMRG,h Molecular mass of the residual gas in hour h (kg/kmol) fvi,h Volumetric fraction of component i in the residual gas in the hour h MMi Molecular mass of residual gas component i i The components CH4, CO, CO2, O2, H2, N2 If Flaring Tool 3 is applied to this project activity it becomes:
(Flaring Tool 3.1) Where: fvCH4,h Volumetric fraction of methane in the residual gas in the hour h fvCO,h Volumetric fraction of CO in the residual gas in the hour h fvCO2,h Volumetric fraction of CO2 in the residual gas in the hour h fvO2,h Volumetric fraction of O2 in the residual gas in the hour h fvH2,h Volumetric fraction of H2 in the residual gas in the hour h fvN2,h Volumetric fraction of N2 in the residual gas in the hour h MMCH4 Molecular mass of methane (kg/kmol) MMCO Molecular mass of CO (kg/kmol) MMCO2 Molecular mass of CO2 (kg/kmol) MMO2 Molecular mass of O2 (kg/kmol) MMH2 Molecular mass of H2 (kg/kmol) MMN2 Molecular mass of N2 (kg/kmol) STEP 2: Determination of the mass fraction of carbon, hydrogen, oxygen and nitrogen in the residual gas The mass fractions of carbon, hydrogen, oxygen and nitrogen in the residual gas, were calculated from the volumetric fraction of each component i in the residual gas, as follows:
hRG
iijjhi
hj MM
NAAMfvfm
,
,,
,
∑ ××= (Flaring Tool 4)
Where: fmj,h Mass fraction of element j in the residual gas in hour h fvi,h Volumetric fraction of component i in the residual gas in the hour h AMj Atomic mass of element j (kg/kmol) NAj,i Number of atoms of element j in the component i MMRG,h Molecular mass of the residual gas in hour h (kg/kmol) j The elements carbon, hydrogen, oxygen and nitrogen i The components CH4, CO, CO2, O2, H2, N2
)(
2222
22224,4,
NNHH
OOCOCOCOCOCHhCHhRG
MMfvMMfvMMfvMMfvMMfvMMfvMM
×+×+
×+×+×+×=

PROJECT DESIGN DOCUMENT FORM (CDM PDD) - Version 03 CDM – Executive Board page 60 When applied in this project Flaring Tool equation 4 became:
(Flaring Tool 4.1) Where: fmC,h Mass fraction of carbon in the residual gas in hour h fvCH4,h Volumetric fraction of methane in the residual gas in the hour h fvCO,h Volumetric fraction of CO in the residual gas in the hour h fvCO2,h Volumetric fraction of CO2 in the residual gas in the hour h AMC Atomic mass of carbon (kg/kmol) NAC,CH4 Number of atoms of carbon in methane NAC,CO Number of atoms of carbon in CO NAC,CO2 Number of atoms of carbon in CO2
hRG
HHHhHCHHHhCHhH MM
NAAMfvNAAMfvfm
,
2,,24,,4,
××+××= (Flaring Tool 4.2)
Where: fmH,h Mass fraction of hydrogen in the residual gas in hour h fvCH4,h Volumetric fraction of methane in the residual gas in the hour h fvH2,h Volumetric fraction of H2 in the residual gas in the hour h AMH Atomic mass of hydrogen (kg/kmol) NAH,CH4 Number of atoms of hydrogen in methane NAH,H2 Number of atoms of hydrogen in H2 MMRG,h Molecular mass of the residual gas in hour h (kg/kmol)
(Flaring Tool 4.3) Where: fmO,h Mass fraction of oxygen in the residual gas in hour h fvCO,h Volumetric fraction of CO in the residual gas in the hour h fvCO2,h Volumetric fraction of CO2 in the residual gas in the hour h fvO2,h Volumetric fraction of O2 in the residual gas in the hour h AMO Atomic mass of oxygen (kg/kmol) NAO,CO Number of atoms of oxygen in CO NAO,CO2 Number of atoms of oxygen in CO2 NAO,O2 Number of atoms of oxygen inO2 MMRG,h Molecular mass of the residual gas in hour h (kg/kmol)
hRG
COCChCOCOCChCOCHCChCHhC MM
NAAMfvNAAMfvNAAMfvfm
,
2,,2,,4,,4,
××+××+××=
hRG
OOOhOCOOOhCOCOOOhCOhO MM
NAAMfvNAAMfvNAAMfvfm
,
2,,22,2,,,
××+××+××=

PROJECT DESIGN DOCUMENT FORM (CDM PDD) - Version 03 CDM – Executive Board page 61
hRG
NNNhNhN MM
NAAMfvfm
,
2,,2,
××= (Flaring Tool 4.4)
Where: fmN,h Mass fraction of nitrogen in the residual gas in hour h fvN2,h Volumetric fraction of nitrogen in the residual gas in the hour h AMN Atomic mass of hydrogen (kg/kmol) NAN,N2 Number of atoms of hydrogen in nitrogen MMRG,h Molecular mass of the residual gas in hour h (kg/kmol) STEP 3: Determination of the volumetric flow rate of the exhaust gas on a dry basis This step is only applicable if the methane combustion efficiency of the flare is continuously monitored. Determine the average volumetric flow rate of the exhaust gas in each hour h based on a stoichiometric calculation of the combustion process, which depends on the chemical composition of the residual gas, the amount of air supplied to combust it and the composition of the exhaust gas, as follows:
hRGhFGnhFGn FMVTV ,,,,, ×= (Flaring Tool 5) Where: TVn,FG,h Volumetric flow rate of the exhaust gas in basis at normal conditions in hour h (m3/h) Vn,FG,h Volume of the exhaust gas of the flare in dry basis at normal conditions per kg of residual
gas in hour h (m3/h residual gas) FMRG,h Mass flow rate of the residual gas in hour h (kg residual gas/h)
hNnhOnhCOnhFGn VVVV ,2,,2,,2,,, ++= (Flaring Tool 6) Where: Vn,FG,h Volume of the exhaust gas of the flare in dry basis at normal conditions per kg of residual
gas in the hour h (m3/kg residual gas) Vn,CO2,h Quantity of CO2 volume free in the exhaust gas of the flare at normal conditions per kg of
residual gas in the hour h (m3/kg residual gas) Vn,O2,h Quantity of O2 volume free in the exhaust gas of the flare at normal conditions per kg of
residual gas in the hour h (m3/kg residual gas) Vn,N2,h Quantity of N2 volume free in the exhaust gas of the flare at normal conditions per kg of
residual gas in the hour h (m3/kg residual gas)
nhOhOn MVnV ×= ,2,2, (Flaring Tool 7) Where: Vn,O2,h Quantity of O2 volume free in the exhaust gas of the flare at normal conditions per kg of
residual gas in the hour h (m3/kg residual gas) nO2,h Quantity of moles O2 in the exhaust gas of the flare per kg residual gas flared in hour h
(kmol/kg residual gas)

PROJECT DESIGN DOCUMENT FORM (CDM PDD) - Version 03 CDM – Executive Board page 62 MVn Volume of one mole of any ideal gas at normal temperature and pressure (22.4 L/mol)
[ ]⎭⎬⎫
⎩⎨⎧
+×⎟⎟⎠
⎞⎜⎜⎝
⎛ −+×= hOh
O
O
n
hNnhNn nF
MFMF
AMfm
MVV ,22
2,,2,
1200
(Flaring Tool 8)
Where: Vn,N2,h Quantity of N2 volume free in the exhaust gas of the flare at normal conditions per kg of
residual gas in the hour h (m3/kg residual gas) MVn Volume of one mole of any ideal gas at normal temperature and pressure (22.4 L/mol) fmN,h Mass fraction of nitrogen in the residual gas in hour h AMn Atomic mass of nitrogen (kg/kmol) MFO2 O2 volumetric fraction of air Fh Stoichoimetric quantity of moles O2 required for complete oxidation of one kg residual
gas in hour h nO2,h Quantity of moles of O2 in the exhaust gas of the flare per kg residual gas flared in hour
h
vc
hChCOn MV
AMfm
V ×= ,,2, (Flaring Tool 9)
Where: Vn,CO2,h Quantity of CO2 volume free in the exhaust gas of the flare at normal conditions per kg of
residual gas in the hour h (m3/kg residual gas) fmC,h Mass fraction of carbon in the residual gas in the hour h AMC Atomic mass of carbon (kg/kmol) MVn Volume of one mole of any ideal gas at normal temperature and pressure (22.4 L/mol)
⎥⎦
⎤⎢⎣
⎡×
−++×
⎟⎟⎠
⎞⎜⎜⎝
⎛−
= hO
O
N
hN
c
hC
O
hO
hOhO F
MFMF
AMfm
AMfm
MFt
tn
2
2,,
2
,2
,2,2
12
1 (Flaring Tool 10)
Where: nO2,h Quantity of moles O2 in the exhaust gas of the flare per kg residual flared in hour h
(kmol/kg residual gas) tO2,h Volumetric fraction of O2 in the exhaust gas in the hour h MFO2 Volumetric fraction of O2 in the air (0.21) fmC,h Mass fraction of C in the residual gas in hour h fmN,h Mass fraction of N in the residual gas in hour h Fh Stociometric quantity of moles of O2 required for a complete oxidation of one kg residual
gas in hour h (kmol/kg residual gas) AMC Atomic mass of C (kg/kmol) AMN Atomic mass of N (kg/kmol)
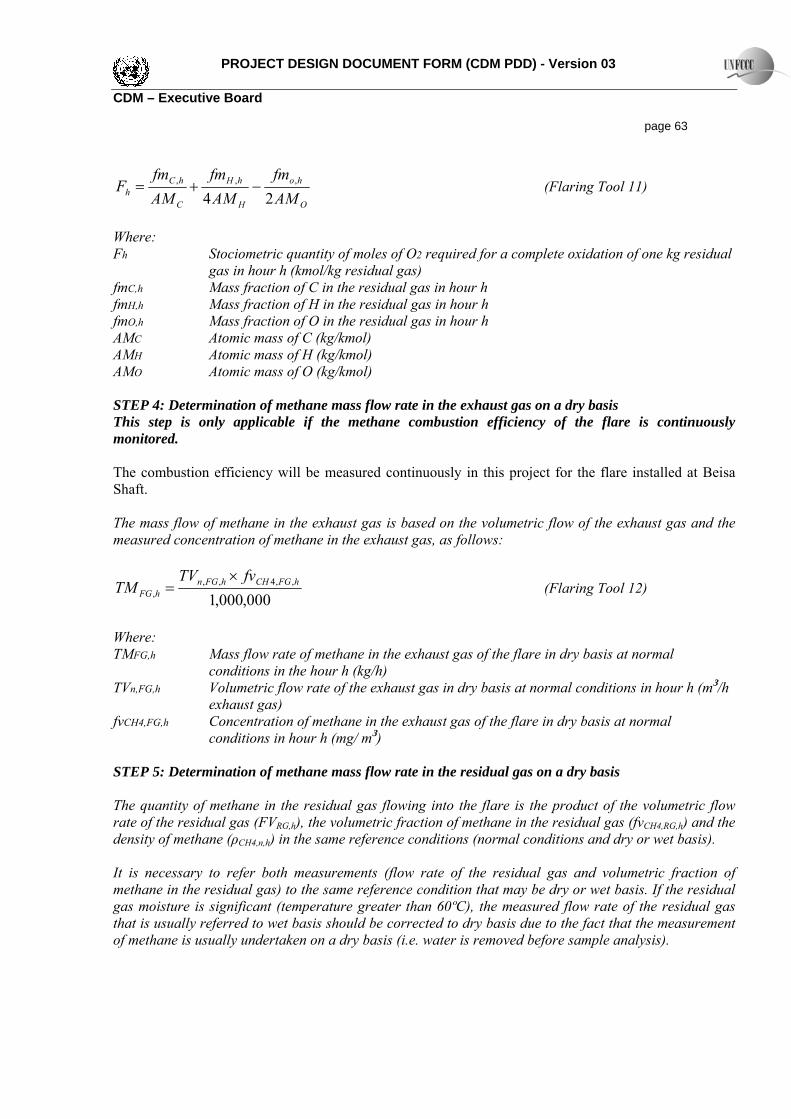
PROJECT DESIGN DOCUMENT FORM (CDM PDD) - Version 03 CDM – Executive Board page 63
O
ho
H
hH
C
hCh AM
fmAMfm
AMfm
F24
,,, −+= (Flaring Tool 11)
Where: Fh Stociometric quantity of moles of O2 required for a complete oxidation of one kg residual
gas in hour h (kmol/kg residual gas) fmC,h Mass fraction of C in the residual gas in hour h fmH,h Mass fraction of H in the residual gas in hour h fmO,h Mass fraction of O in the residual gas in hour h AMC Atomic mass of C (kg/kmol) AMH Atomic mass of H (kg/kmol) AMO Atomic mass of O (kg/kmol) STEP 4: Determination of methane mass flow rate in the exhaust gas on a dry basis This step is only applicable if the methane combustion efficiency of the flare is continuously monitored. The combustion efficiency will be measured continuously in this project for the flare installed at Beisa Shaft. The mass flow of methane in the exhaust gas is based on the volumetric flow of the exhaust gas and the measured concentration of methane in the exhaust gas, as follows:
000,000,1,,4,,
,hFGCHhFGn
hFG
fvTVTM
×= (Flaring Tool 12)
Where: TMFG,h Mass flow rate of methane in the exhaust gas of the flare in dry basis at normal
conditions in the hour h (kg/h) TVn,FG,h Volumetric flow rate of the exhaust gas in dry basis at normal conditions in hour h (m3/h
exhaust gas) fvCH4,FG,h Concentration of methane in the exhaust gas of the flare in dry basis at normal
conditions in hour h (mg/ m3) STEP 5: Determination of methane mass flow rate in the residual gas on a dry basis The quantity of methane in the residual gas flowing into the flare is the product of the volumetric flow rate of the residual gas (FVRG,h), the volumetric fraction of methane in the residual gas (fvCH4,RG,h) and the density of methane (ρCH4,n,h) in the same reference conditions (normal conditions and dry or wet basis). It is necessary to refer both measurements (flow rate of the residual gas and volumetric fraction of methane in the residual gas) to the same reference condition that may be dry or wet basis. If the residual gas moisture is significant (temperature greater than 60ºC), the measured flow rate of the residual gas that is usually referred to wet basis should be corrected to dry basis due to the fact that the measurement of methane is usually undertaken on a dry basis (i.e. water is removed before sample analysis).

PROJECT DESIGN DOCUMENT FORM (CDM PDD) - Version 03 CDM – Executive Board page 64
nCHhRGCHhRGhRG fvFVTM ,4,,4,, ρ××= (Flaring Tool 13) Where: TMRG,h Mass flow rate of methane in the residual gas in the hour h (kg/h) FVRG,h Volumetric flow rate of the residual gas in dry basis at normal conditions in hour h
(m3/h) fvCH4,RG,h Volumetric fraction of methane in the residual gas on dry basis in hour h ρCH4,n Density of methane at normal conditions (0.716 kg/ m3) STEP 6: Determination of the hourly flare efficiency The determination of the hourly flare efficiency depends on the operation of flare (e.g. temperature), the type of flare used (open or enclosed) and, in case of enclosed flares, the approach selected by project participants to determine the flare efficiency (default value or continuous monitoring) This project will use an enclosed, continuously monitored flare for the mine methane. The tool states that in the case of enclosed flares and continuous monitoring of the flare efficiency, the flare efficiency in the hour h (ηflare,h) is:
• 0% if the temperature of the exhaust gas of the flare (Tflare) is below 500 °C during more than 20 minutes during the hour h.
• determined as follows in cases where the temperature of the exhaust gas of the flare (Tflare) is above 500 °C for more than 40 minutes during the hour h :
hRG
hFGhflare TM
TM
,
,, 1−=η (Flaring Tool 14)
Where: ηflare,h Flare efficiency in the hour h TMFG,h Methane mass flow rate in the exhaust gas averaged in a period of time t (kg/h) TMRG,h Mass flow rate of methane in the residual gas in the hour h (kg/h) STEP 7: Calculation of annual project emissions from flaring Project emissions from flaring are calculated as the sum of emissions from each hour h, based on the methane flow rate in the residual gas (TMRG,h) and the flare efficiency during each hour h (η flare,h), as follows:
( )000,1
1 48760
1,,,
CH
hhflarehRGyflare
GWPTMPE ×−×= ∑=
η (Flaring Tool 15)
Where: PEflare,y Project emissions from flaring the residual gas stream in year y (tCO2e) TMRG,h Mass flow rate of methane in the residual gas in the hour h (kg/h)
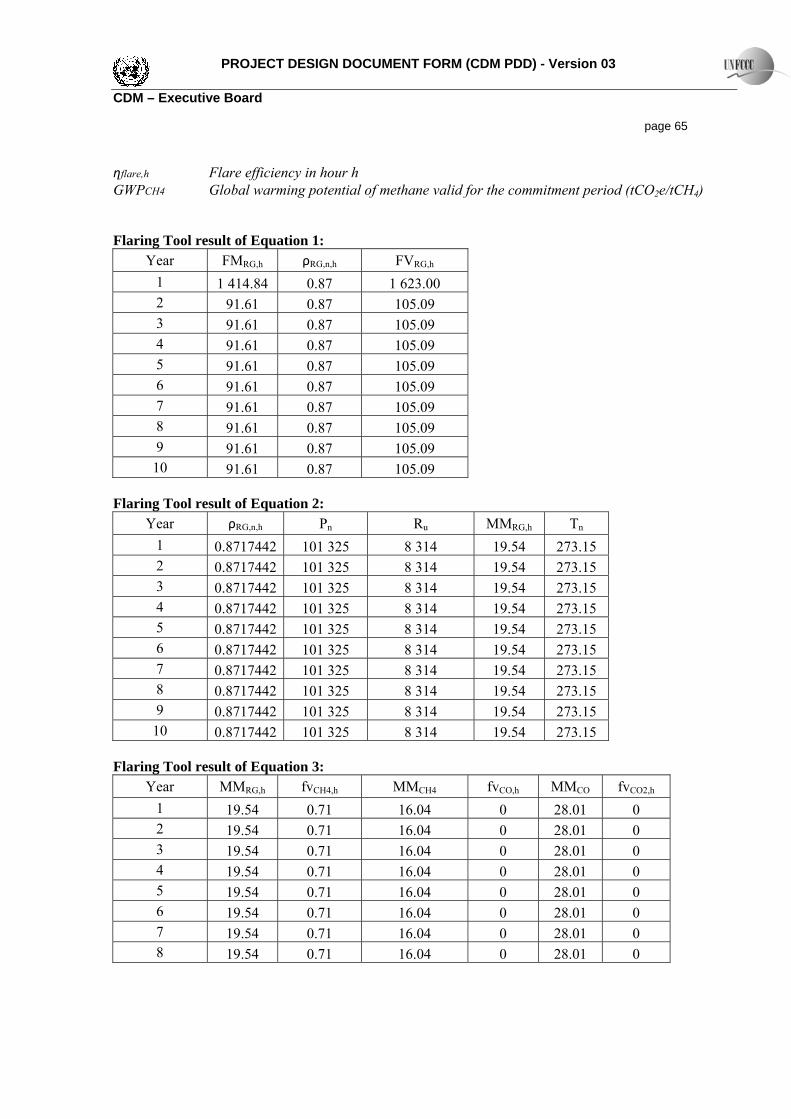
PROJECT DESIGN DOCUMENT FORM (CDM PDD) - Version 03 CDM – Executive Board page 65 ηflare,h Flare efficiency in hour h GWPCH4 Global warming potential of methane valid for the commitment period (tCO2e/tCH4) Flaring Tool result of Equation 1:
Year FMRG,h ρRG,n,h FVRG,h 1 1 414.84 0.87 1 623.00 2 91.61 0.87 105.09 3 91.61 0.87 105.09 4 91.61 0.87 105.09 5 91.61 0.87 105.09 6 91.61 0.87 105.09 7 91.61 0.87 105.09 8 91.61 0.87 105.09 9 91.61 0.87 105.09 10 91.61 0.87 105.09
Flaring Tool result of Equation 2:
Year ρRG,n,h Pn Ru MMRG,h Tn 1 0.8717442 101 325 8 314 19.54 273.15 2 0.8717442 101 325 8 314 19.54 273.15 3 0.8717442 101 325 8 314 19.54 273.15 4 0.8717442 101 325 8 314 19.54 273.15 5 0.8717442 101 325 8 314 19.54 273.15 6 0.8717442 101 325 8 314 19.54 273.15 7 0.8717442 101 325 8 314 19.54 273.15 8 0.8717442 101 325 8 314 19.54 273.15 9 0.8717442 101 325 8 314 19.54 273.15 10 0.8717442 101 325 8 314 19.54 273.15
Flaring Tool result of Equation 3:
Year MMRG,h fvCH4,h MMCH4 fvCO,h MMCO fvCO2,h 1 19.54 0.71 16.04 0 28.01 0 2 19.54 0.71 16.04 0 28.01 0 3 19.54 0.71 16.04 0 28.01 0 4 19.54 0.71 16.04 0 28.01 0 5 19.54 0.71 16.04 0 28.01 0 6 19.54 0.71 16.04 0 28.01 0 7 19.54 0.71 16.04 0 28.01 0 8 19.54 0.71 16.04 0 28.01 0

PROJECT DESIGN DOCUMENT FORM (CDM PDD) - Version 03 CDM – Executive Board page 66
9 19.54 0.71 16.04 0 28.01 0 10 19.54 0.71 16.04 0 28.01 0
Year MMCO2 fvO2,h MMO2 fvH2,h MMH2 fvN2,h MMN2
1 44.01 0 32 0 2.02 0.29 28.02 2 44.01 0 32 0 2.02 0.29 28.02 3 44.01 0 32 0 2.02 0.29 28.02 4 44.01 0 32 0 2.02 0.29 28.02 5 44.01 0 32 0 2.02 0.29 28.02 6 44.01 0 32 0 2.02 0.29 28.02 7 44.01 0 32 0 2.02 0.29 28.02 8 44.01 0 32 0 2.02 0.29 28.02 9 44.01 0 32 0 2.02 0.29 28.02
10 44.01 0 32 0 2.02 0.29 28.02 Flaring Tool result of Equation 4:
Year fmC,h fvCH4,h AMC NAC,CH4 1 0.43 0.71 12 1 2 0.43 0.71 12 1 3 0.43 0.71 12 1 4 0.43 0.71 12 1 5 0.43 0.71 12 1 6 0.43 0.71 12 1 7 0.43 0.71 12 1 8 0.43 0.71 12 1 9 0.43 0.71 12 1 10 0.43 0.71 12 1
Year fvCO,h NAC,CO fvCO2,h NAC,CO2 MMRG,h
1 0 1 0 1 19.54 2 0 1 0 1 19.54 3 0 1 0 1 19.54 4 0 1 0 1 19.54 5 0 1 0 1 19.54 6 0 1 0 1 19.54 7 0 1 0 1 19.54 8 0 1 0 1 19.54 9 0 1 0 1 19.54
10 0 1 0 1 19.54

PROJECT DESIGN DOCUMENT FORM (CDM PDD) - Version 03 CDM – Executive Board page 67
Year fmH,h fvCH4,h AMH NAH,CH4 fvH2,h NAH,H2 MMRG,h 1 0.15 0.71 1.01 4 0 2 19.54 2 0.15 0.71 1.01 4 0 2 19.54 3 0.15 0.71 1.01 4 0 2 19.54 4 0.15 0.71 1.01 4 0 2 19.54 5 0.15 0.71 1.01 4 0 2 19.54 6 0.15 0.71 1.01 4 0 2 19.54 7 0.15 0.71 1.01 4 0 2 19.54 8 0.15 0.71 1.01 4 0 2 19.54 9 0.15 0.71 1.01 4 0 2 19.54 10 0.15 0.71 1.01 4 0 2 19.54
Year fmN,h fvN2,h AMN NAN,N2 MMRG,h
1 0.42 0.29 14.01 2 19.54 2 0.42 0.29 14.01 2 19.54 3 0.42 0.29 14.01 2 19.54 4 0.42 0.29 14.01 2 19.54 5 0.42 0.29 14.01 2 19.54 6 0.42 0.29 14.01 2 19.54 7 0.42 0.29 14.01 2 19.54 8 0.42 0.29 14.01 2 19.54 9 0.42 0.29 14.01 2 19.54 10 0.42 0.29 14.01 2 19.54
Year fmO,h fvO2,h AMO NAO,O2 fvCO,h
1 0 0 16 2 0 2 0 0 16 2 0 3 0 0 16 2 0 4 0 0 16 2 0 5 0 0 16 2 0 6 0 0 16 2 0 7 0 0 16 2 0 8 0 0 16 2 0 9 0 0 16 2 0 10 0 0 16 2 0
Year NAO,CO fvCO2,h NAO,CO2 MMRG,h
1 1 0 2 19.54 2 1 0 2 19.54

PROJECT DESIGN DOCUMENT FORM (CDM PDD) - Version 03 CDM – Executive Board page 68
3 1 0 2 19.54 4 1 0 2 19.54 5 1 0 2 19.54 6 1 0 2 19.54 7 1 0 2 19.54 8 1 0 2 19.54 9 1 0 2 19.54
10 1 0 2 19.54 Flaring Tool result of Equation 5:
Year TVn,FG,h Vn,FG,h FMRG,h 1 26 280.16 19.18 1 370.32 2 1 701.65 19.18 88.73 3 1 701.65 19.18 88.73 4 1 701.65 19.18 88.73 5 1 701.65 19.18 88.73 6 1 701.65 19.18 88.73 7 1 701.65 19.18 88.73 8 1 701.65 19.18 88.73 9 1 701.65 19.18 88.73 10 1 701.65 19.18 88.73
Flaring Tool result of Equation 6:
Year Vn,FG,h Vn,CO2,h Vn,O2,h Vn,N2,h 1 19.18 0.78 0.67 17.72 2 19.18 0.78 0.67 17.72 3 19.18 0.78 0.67 17.72 4 19.18 0.78 0.67 17.72 5 19.18 0.78 0.67 17.72 6 19.18 0.78 0.67 17.72 7 19.18 0.78 0.67 17.72 8 19.18 0.78 0.67 17.72 9 19.18 0.78 0.67 17.72 10 19.18 0.78 0.67 17.72
Flaring Tool result of Equation 7:
Year Vn,O2,h nO2,h MVn 1 0.67 0.03 22.4 2 0.67 0.03 22.4 3 0.67 0.03 22.4

PROJECT DESIGN DOCUMENT FORM (CDM PDD) - Version 03 CDM – Executive Board page 69
4 0.67 0.03 22.4 5 0.67 0.03 22.4 6 0.67 0.03 22.4 7 0.67 0.03 22.4 8 0.67 0.03 22.4 9 0.67 0.03 22.4 10 0.67 0.03 22.4
Flaring Tool result of Equation 8:
Year Vn,N2,h MVn fmN,h AMn MFO2 Fh nO2,h 1 17.72 22.4 36% 14.01 0.21 0.18 0.03 2 17.72 22.4 36% 14.01 0.21 0.18 0.03 3 17.72 22.4 36% 14.01 0.21 0.18 0.03 4 17.72 22.4 36% 14.01 0.21 0.18 0.03 5 17.72 22.4 36% 14.01 0.21 0.18 0.03 6 17.72 22.4 36% 14.01 0.21 0.18 0.03 7 17.72 22.4 36% 14.01 0.21 0.18 0.03 8 17.72 22.4 36% 14.01 0.21 0.18 0.03 9 17.72 22.4 36% 14.01 0.21 0.18 0.03 10 17.72 22.4 36% 14.01 0.21 0.18 0.03
Flaring Tool result of Equation 9:
Year Vn,CO2,h fmC,h AMC MVn 1 0.78 42% 12 22.4 2 0.78 42% 12 22.4 3 0.78 42% 12 22.4 4 0.78 42% 12 22.4 5 0.78 42% 12 22.4 6 0.78 42% 12 22.4 7 0.78 42% 12 22.4 8 0.78 42% 12 22.4 9 0.78 42% 12 22.4 10 0.78 42% 12 22.4
Flaring Tool result of Equation 10:
Year nO2,h tO2,h fmC,h AMC fmN,h 1 0.03 4% 42% 12 35.82% 2 0.03 4% 42% 12 35.82% 3 0.03 4% 42% 12 35.82% 4 0.03 4% 42% 12 35.82%

PROJECT DESIGN DOCUMENT FORM (CDM PDD) - Version 03 CDM – Executive Board page 70
5 0.03 4% 42% 12 35.82% 6 0.03 4% 42% 12 35.82% 7 0.03 4% 42% 12 35.82% 8 0.03 4% 42% 12 35.82% 9 0.03 4% 42% 12 35.82% 10 0.03 4% 42% 12 35.82%
Year AMN MFO2 Fh
1 14.01 0.21 0.18 2 14.01 0.21 0.18 3 14.01 0.21 0.18 4 14.01 0.21 0.18 5 14.01 0.21 0.18 6 14.01 0.21 0.18 7 14.01 0.21 0.18 8 14.01 0.21 0.18 9 14.01 0.21 0.18
10 14.01 0.21 0.18 Flaring Tool result of Equation 11:
Year Fh fmC,h AMC fmH,h AMH fmO,h AMO 1 0.18 42% 12 14.15% 1.01 8% 16 2 0.18 42% 12 14.15% 1.01 8% 16 3 0.18 42% 12 14.15% 1.01 8% 16 4 0.18 42% 12 14.15% 1.01 8% 16 5 0.18 42% 12 14.15% 1.01 8% 16 6 0.18 42% 12 14.15% 1.01 8% 16 7 0.18 42% 12 14.15% 1.01 8% 16 8 0.18 42% 12 14.15% 1.01 8% 16 9 0.18 42% 12 14.15% 1.01 8% 16 10 0.18 42% 12 14.15% 1.01 8% 16
Flaring Tool result of Equation 12:
Year TMFG,h TVn,FG,h fvCH4,FG,h 1 281.64 26 280.16 10 716.75 2 18.24 1 701.65 10 716.75 3 18.24 1 701.65 10 716.75 4 18.24 1 701.65 10 716.75 5 18.24 1 701.65 10 716.75 6 18.24 1 701.65 10 716.75
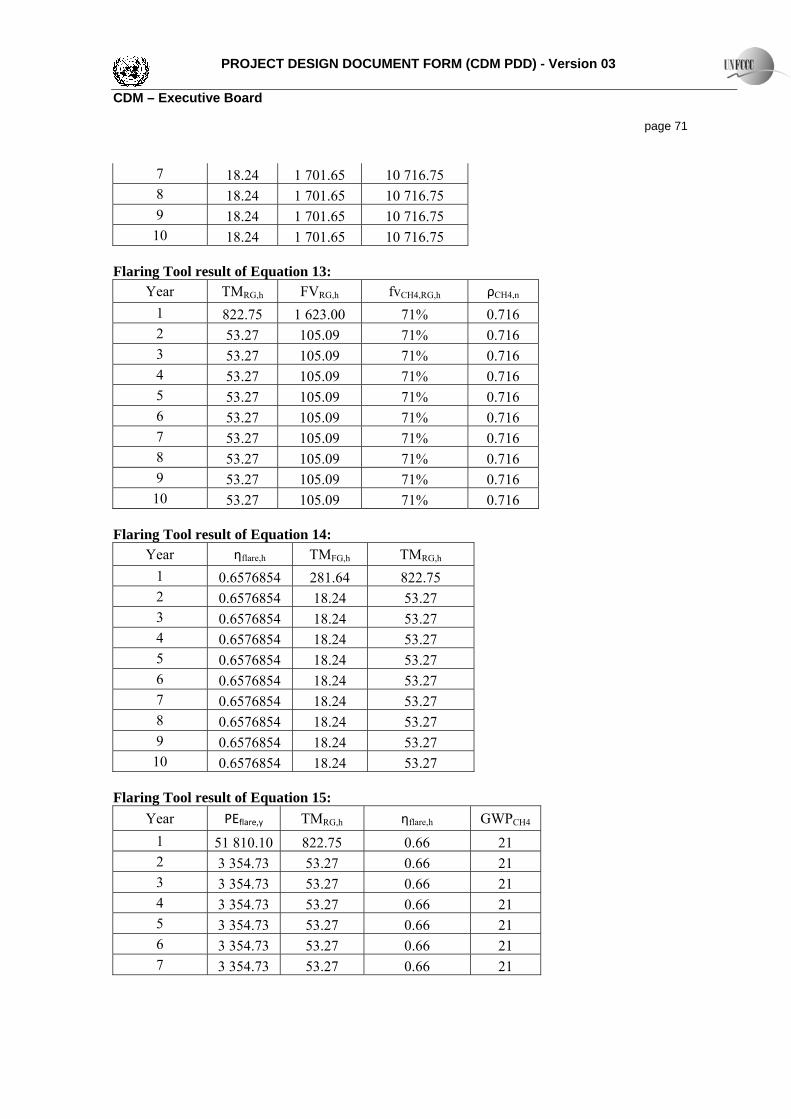
PROJECT DESIGN DOCUMENT FORM (CDM PDD) - Version 03 CDM – Executive Board page 71
7 18.24 1 701.65 10 716.75 8 18.24 1 701.65 10 716.75 9 18.24 1 701.65 10 716.75 10 18.24 1 701.65 10 716.75
Flaring Tool result of Equation 13:
Year TMRG,h FVRG,h fvCH4,RG,h ρCH4,n 1 822.75 1 623.00 71% 0.716 2 53.27 105.09 71% 0.716 3 53.27 105.09 71% 0.716 4 53.27 105.09 71% 0.716 5 53.27 105.09 71% 0.716 6 53.27 105.09 71% 0.716 7 53.27 105.09 71% 0.716 8 53.27 105.09 71% 0.716 9 53.27 105.09 71% 0.716 10 53.27 105.09 71% 0.716
Flaring Tool result of Equation 14:
Year ηflare,h TMFG,h TMRG,h 1 0.6576854 281.64 822.75 2 0.6576854 18.24 53.27 3 0.6576854 18.24 53.27 4 0.6576854 18.24 53.27 5 0.6576854 18.24 53.27 6 0.6576854 18.24 53.27 7 0.6576854 18.24 53.27 8 0.6576854 18.24 53.27 9 0.6576854 18.24 53.27 10 0.6576854 18.24 53.27
Flaring Tool result of Equation 15:
Year PEflare,y TMRG,h ηflare,h GWPCH4 1 51 810.10 822.75 0.66 21 2 3 354.73 53.27 0.66 21 3 3 354.73 53.27 0.66 21 4 3 354.73 53.27 0.66 21 5 3 354.73 53.27 0.66 21 6 3 354.73 53.27 0.66 21 7 3 354.73 53.27 0.66 21

PROJECT DESIGN DOCUMENT FORM (CDM PDD) - Version 03 CDM – Executive Board page 72
8 3 354.73 53.27 0.66 21 9 3 354.73 53.27 0.66 21 10 3 354.73 53.27 0.66 21

PROJECT DESIGN DOCUMENT FORM (CDM PDD) - Version 03 CDM – Executive Board page 73 The “Tool to calculate the emission factor for an electricity system” (EB 63, Annex 19, Version 02.2.1) This tool was used to calculate the emission factor for all the grid electricity that the project will be displacing.
STEP 1: IDENTIFY THE RELEVANT ELECTRICITY SYSTEMS
This tool will serve project activities that prospect to displace grid electricity in South Africa. The project electricity system is defined by the spatial extent of the power plants that are physically connected through transmission and distribution lines to the project activity and that can be displaced without significant transmission constraints. Similarly, a connected electricity system, e.g. national or international, is defined as an electricity system that is connected by transmission lines to the project electricity system. Power plants within the connected electricity system can be dispatched without significant transmission constraints, but transmission to the project electricity system has significant transmission constraints. The DNA of South Africa has not published a delineation of the project electricity system and connected electricity systems. Also, the application of the criteria with regards to determining significant transmission constraints does not result in a clear grid boundary due to a lack of sufficient data. For these reasons the following was chosen for the reference system of this project:
• The project electricity system entails all the Eskom power plants in the South African electricity grid.
• Due to a lack of data available in the public domain (in order to evaluate significant transmission constraints), all other power stations (non-Eskom) and countries with power grids connected to South Africa, are treated as connected electricity systems, and emission factors for imports from these systems are conservatively assumed to be 0 tCO2/MWh.
All electricity generated by the Eskom power stations is taken into consideration when calculating the grid emission factor; exports are not subtracted. All the data for the Eskom power stations are obtained from the Eskom website, where they have a specific webpage dedicated to CDM grid emission factor related data(Eskom Holdings SOC Limited , 2011). This data includes commissioning dates, electricity generated, and fuel consumed. Data for the imported electricity are obtained from the Eskom annual report, where “Total purchased for the Eskom system (GWh)” is shown in the “Statistical overview” table on pg. 324 of the report(Eskom Holdings SOC Limited, 2011).

PROJECT DESIGN DOCUMENT FORM (CDM PDD) - Version 03 CDM – Executive Board page 74
STEP 2: CHOSE WHETHER TO INCLUDE OFF-GRID POWER PLANTS IN THE PROJECT ELECTRICITY SYSTEM
This step is optional according to the tool. The grid emission factor is calculated from only grid power plants (Option I). Off-grid power plants are not included in the calculations.
STEP 3: SELECT A METHOD TO DETERMINE THE OPERATING MARGIN (OM)
The OM is calculated using the simple OM method (Option a). The simple OM method can be used provided that the low-cost/must-run resources constitute less than 50% of the total grid generation in average of the five most recent years. The average percentage of low-cost/must-run resources amount to 0.00% of the total grid generation for this project electricity system. Therefore, Option (a) is applicable. In terms of data vintages, the ex ante option were chosen to calculate the simple OM. In this option a 3 year generation-weighted average are used for the grid power plants. Using this option also means that

PROJECT DESIGN DOCUMENT FORM (CDM PDD) - Version 03 CDM – Executive Board page 75 the emission factor is determined only once at the validation stage, thus no monitoring and recalculation is required during the crediting period. The data used in OM calculations are for the 3 year period of 1 April 2008 – 31 March 2011 (Eskom financial year runs from 1 April – 31 March). This is the latest available data.
STEP 4: CALCULATE THE OPERATING MARGIN EMISSION FACTOR ACCORDING TO THE SELECTED METHOD
The simple OM emission factor (EFgrid,OMsimple,y) is calculated as the generation-weighted average CO2 emissions per unit net electricity generation (tCO2/MWh) of all generating power plants serving the system, not including low-cost/must-run power plants/units. Hence, the hydro and nuclear power plants are excluded from the calculation of the OM. Option A is used for calculating the simple OM. The calculations in this option are based on the total net electricity generation and a CO2 emission factor of each power plant. Option A – Calculation based on average efficiency and electricity generation of each plant Under this option, the simple OM emission factor is calculated based on the net electricity generation of each power plant and an emission factor of each power plant, as follows:
∑∑ ×
=
mym
mymELym
yOMsimplegrid EG
EFEGEF
,
,,,
,,
Where: EFgrid, OMsimple,y = Simple operating margin CO2 emission factor in year y (tCO2/MWh) EGm,y = Net quantity of electricity generated and delivered to the grid by power unit m
in the year y (MWh) EFEL,m,y = CO2 emission factor of power unit m in year y (tCO2/MWh) m = All power units serving the grid in year y except low-cost/must-run power units y = The relevant year as per data vintage chosen in Step 3
Determination of EFEL,m,y The emission factor for each power plant m were determined as follows (Option A1):
( )y
iyiCOyiyi
yOMsimplegrid EG
EFNCVFCEF
∑ ××=
,,2,,
,, (6)
Where:

PROJECT DESIGN DOCUMENT FORM (CDM PDD) - Version 03 CDM – Executive Board page 76
EFgrid, OMsimple,y = Simple operating margin CO2 emission factor in year y (tCO2/MWh) FCi,y = Amount of fossil fuel type i consumed in the project electricity system in year
y (mass or volume unit) NCVi,y = Net calorific value (energy content) fossil fuel type i in year y (GJ/mass or
volume unit) EFCO2,i,y = CO2 emission factor of fossil fuel type i in year y (tCO2/GJ) EGy = Net electricity generated and delivered to the grid by all power sources serving
the system, not including low-cost/must-run power plants/units, in year y (MWh)
i = All fossil fuel types combusted in power sources in the project electricity system in year y
y = The relevant year as per data vintage chosen in Step 3. Electricity imports are treated as one power plant, as per the tool guidance. The constants used in calculations appear in Table 1.
Table 1: Constants used in calculations Constants
NCVother bituminous coal 19.9 GJ/T NCVother kerosene 42.9 GJ/T EFCO2other bituminous coal 0.0895 tCO2/GJ EFCO2,other kerosene 0.0708 tCO2/GJ
Using equation 6, the OM is calculated as 1.018 tCO2e/MWh.
STEP 5: CALCULATE THE BUILD MARGIN (BM) EMISSION FACTOR
In terms of vintage of data, one Option 1 was selected: For the first crediting period, calculate the build margin emission factor ex ante based on the most recent information available on units already built for sample group m at the time of CDM-PDD submission to the DOE for validation. The sample group of power units m used to calculate the build margin were determined as per the procedure delineated in the tool, consistent with the data vintages selected. The following diagram summarizes the procedure of identifying the sample group:

PROJECT DESIGN DOCUMENT FORM (CDM PDD) - Version 03 CDM – Executive Board page 77
The build margin emissions factor is the generation-weighted average emission factor (tCO2/MWh) of all power units m during the most recent year y for which power generation data is available, calculated as follows:
∑∑ ×
=
mym
mymELym
yBMgrid EG
EFEGEF
,
,,,
,, (13)
Where:
EFgrid,BM,y = Build margin CO2 emission factor in year y (tCO2/MWh)

PROJECT DESIGN DOCUMENT FORM (CDM PDD) - Version 03 CDM – Executive Board page 78
EGm,y = Net quantity of electricity generated and delivered to the grid by power unit m in year y (MWh)
EFEL,m,y = CO2 emission factor of power unit m in year y (tCO2/GJ) m = Power units included in the build margin y = Most recent historical year for which power generation data is available.
The CO2 emission factor of each power unit m (ELEL,m,y) should be determined as per the guidance in Step 4 (a) for the simple OM, using Option A1 using for y the most recent historical year for which power generation data is available, and using for m the power units included in the build margin. If for a power unit m data on fuel consumption and electricity generation is available the emission factor (EFEL,m,y) should be determined as follows:
∑∑ ××
=
mym
iyiCOyiymi
ymEL EG
EFNCVFCEF
,
,,2,,,
,,
(2)
Where:
EFEL,m,y = CO2 emission factor of power unit m in year y (tCO2/MWh) FCi,m,y = Amount of fossil fuel type i consumed by power unit m in year y (mass or
volume unit) NCVi,y = Net calorific value (energy content) fossil fuel type i in year y (GJ/mass or
volume) EFCO2,i,y = CO2 emission factor of fossil fuel type i in year y (tCO2/GJ) EGm,y = Net electricity generated and delivered to the grid by power unit m in year y
(MWh) m = All power plants/units serving the grid in year y except low-cost/must-run
power plants/units i = All fossil fuel types combusted in power plant/unit m in year y y = The relevant year as per data vintage chosen in Step 3.
Using equation 13, the BM is calculated as 1.024 tCO2e/MWh.
STEP 6: CALCULATE THE COMBINED MARGIN (CM) EMISSION FACTOR
The combined margin factor is calculated as follows:
BMyBMgridOMyOMgridyCMgrid wEFwEFEF ×+×= ,,,,,, (14) Where:
EFgrid,BM,y = Build Margin CO2 emission factor in year y (tCO2/MWh) EFgrid,OM,y = Operating margin CO2 emission factor in year y (tCO2/MWh) wOM = Weighting of operating margin emissions factor (%) wBM = Weighting of build margin emissions factor (%)
The emission factors for the the final combined margin appear in Table 8.

PROJECT DESIGN DOCUMENT FORM (CDM PDD) - Version 03 CDM – Executive Board page 79
Table 3: CM emission factor wOM wBM Combined Margin Emission
Factor Wind and solar power generation project activities for the first crediting period and for subsequent crediting periods.
0.75 0.25 1.020
All other projects for the first crediting period. 0.5 0.5 1.021
All other projects for the second and third crediting period. 0.25 0.75 1.023

PROJECT DESIGN DOCUMENT FORM (CDM PDD) - Version 03 CDM – Executive Board page 80 The “Tool to calculate baseline, project and/or leakage emissions from electricity consumption” (EB 39, Annex 7, Version 01) The equipment for the destruction and utilisation of mine methane will use electricity from the South African National Grid. Project Emissions from Electricity Consumption for Mine Methane During the project case, grid electricity and captive electricity (electricity generated by the project) will be required for the capture, transportation, compression and utilisation or destruction of the mine methane (PEELEC,y). In order to calculate PEELEC,y, the “Tool to calculate baseline, project and/or leakage emissions from electricity consumption” must be applied. This tool provides the procedure to estimate the project emissions associated with the consumption of electricity. Applying this tool: Scenario C applies to the proposed project activity. Scenario C is presented below (verbatim text is in italics): “Scenario C: Electricity consumption from the grid and (a) fossil fuel fired captive power plant(s). One or more fossil fuel fired captive power plants operate at the site of the electricity consumption source. The captive power plant(s) can provide electricity to the electricity consumption source. The captive power plant(s) is/are also connected to the electricity grid. Hence, the electricity consumption source can be provided with electricity from the captive power plant(s) and the grid”. Scenario C was selected as the electricity consumed by the proposed project activity will be sourced either from the grid or from the captive power plant (the project).This captive power plant will be connected to the grid. Hence, it will not be possible to determine how much of the electricity consumed in the project case is sourced from the captive power plant and how much is purchased from the grid. Furthermore, Case C.I applies (italic text is verbatim from the tool): “Case C.I: Grid electricity. The implementation of the project activity only affects the quantity of electricity that is supplied from the grid and not the operation of the captive power plant. This applies, for example,
• If at all times during the monitored period the total electricity demand at the site of the captive power plant(s) is, both with the project activity and in the absence of the project activity, larger than the electricity generation capacity of the captive power plant(s); or
• If the captive power plant is operated continuously (apart from maintenance) and feeds any excess electricity into the grid, because the revenues for feeding electricity into the grid are above the plant operation costs; or
• If the captive power plant is centrally dispatched and the dispatch of the captive power plant is thus outside the control of the project participants.”

PROJECT DESIGN DOCUMENT FORM (CDM PDD) - Version 03 CDM – Executive Board page 81 Case C.I. applies since the implementation of the project activity will only affect the quantity of electricity that the Beatrix mine imports from the grid and not the operation of the captive power plant. The total electricity demand at the Beatrix mine, which is the site of the captive power plant, is always larger than the electricity generation capacity of the plant.
• The total electricity demand of Beatrix is approximately 864,000MWh/year. • The total captive generation ability is 9.415 installed MW electrical.
The captive power plant will be operated continuously (apart from maintenance) and the electricity generated by the plant will be dispatched centrally. The dispatch of the electricity will be outside the control of the GFI Mining South Africa’ Beatrix mine. Since, Scenario C.I applies to the project activity; the electricity emission factor can be calculated using either Option A1 or Option A2. Option A1 was selected in order to calculate the electricity emission factor. Option A1 states (verbatim test in italics): “Option A1: Calculate the combined margin emission factor of the applicable electricity system, using the procedures in the latest approved version of the “Tool to calculate the emission factor for an electricity system” (EFEL,j/k/l,y = EFgrid,CM,y).” The identified term, EFgrid,CM,y, refers to Step 6 of the “Tool to calculate the emission factor for an electricity system” (version 02.2.1), which states (verbatim text in italics): “Step 6. Calculate the combined margin emissions factor The combined margin emissions factor is calculated as follows: (Equation 13 in the “Tool to calculate the emission factor for an electricity system”) EFgrid,BM,y = Build margin CO2 emission factor in year y (tCO2/MWh) EFgrid,OM,y = Operating margin CO2 emission factor in year y (tCO2/MWh) wOM = Weighting of operating margin emissions factor (%) wBM = Weighting of build margin emissions factor (%)
• Wind and solar power generation project activities: wOM = 0.75 and wBM = 0.25 (owing to their intermittent and non-dispatchable nature) for the first crediting period and for subsequent crediting periods.
• All other projects: wOM = 0.5 and wBM = 0.5 for the first crediting period, and wOM = 0.25 and
wBM = 0.75 for the second and third crediting period, unless otherwise specified in the approved methodology which refers to this tool.”
The default value of wOM = 0.5 and wBM = 0.5 will be used.
BMyBMgridOMyOMgridyCMgrid wEFwEFEF ×+×= ,,,,,,

PROJECT DESIGN DOCUMENT FORM (CDM PDD) - Version 03 CDM – Executive Board page 82 The electricity emission factor is then used to determine the project emissions due to electricity consumption by the proposed project activity. These emissions can be determined by applying Equation 1 from the “Tool to calculate baseline, project and/or leakage emissions from electricity consumption,” version 01:
( )yjyjELj
yjPJyEC TDLEFECPE ,,,,,, 1+××= ∑
(Equation 1 from the “Tool to calculate, project and/or leakage emissions from electricity consumption) Where: PEEC,y Project emissions from electricity consumption in year y (tCO2/yr) ECPJj,y Quantity of electricity consumed by the project electricity consumption source j in year y
(MWh/year) EFEL,j,y Emission factor for electricity generation for source j in year y (tCO2/MWh) TDLj,y Average technical transmission and distribution losses for providing electricity to source l
in year y j Sources of electricity consumption in the project l Leakage sources of electricity consumption This equation could then be applied to this project taking into account that the sources of electricity (j) will only be the national grid. There will be one source of electricity consumption in the project. Hence, ‘j’ will be one. Applied to this project, Equation 1 becomes: A default of 3% was used for the average technical transmission and distribution losses for providing electricity (TDLj,y). A default was chosen as there is no recent, accurate and reliable data available within South Africa. The 3% was used since the electricity consumption by the proposed project activity is smaller than the electricity consumption of all the baseline electricity consumption sources.
)1(,,, yyELyPJyEC TDLEFECPE +××=
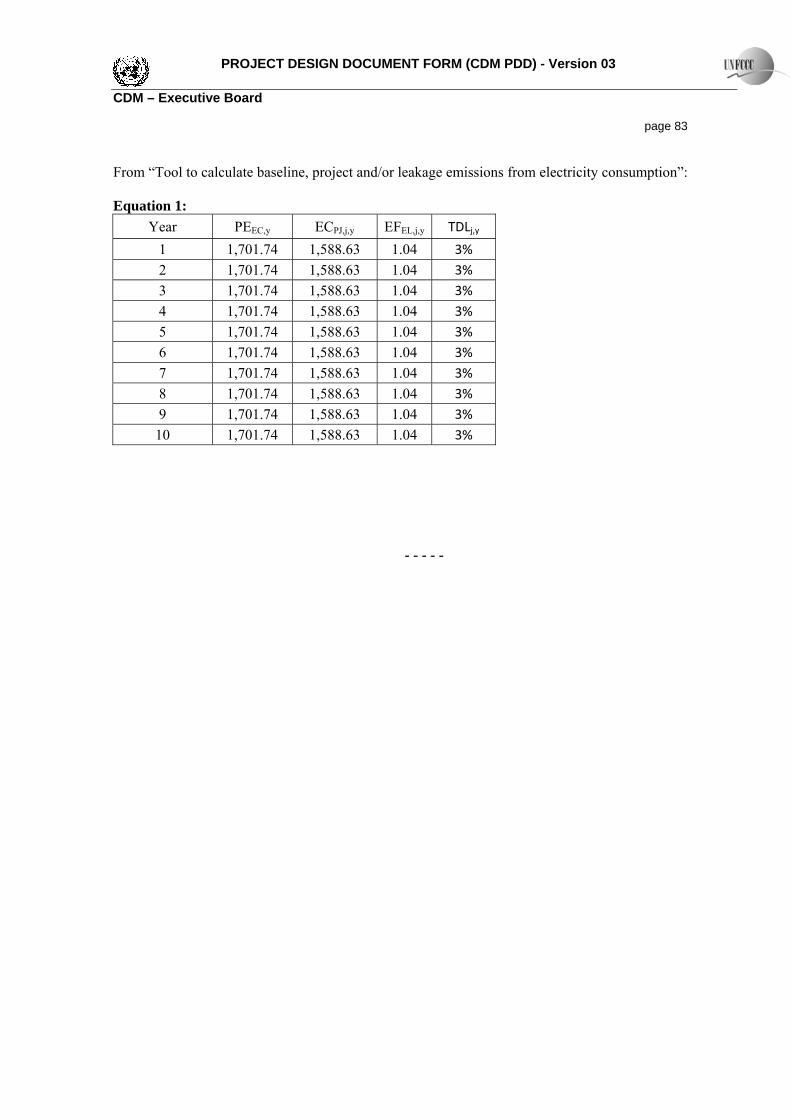
PROJECT DESIGN DOCUMENT FORM (CDM PDD) - Version 03 CDM – Executive Board page 83 From “Tool to calculate baseline, project and/or leakage emissions from electricity consumption”: Equation 1:
Year PEEC,y ECPJ,j,y EFEL,j,y TDLj,y 1 1,701.74 1,588.63 1.04 3% 2 1,701.74 1,588.63 1.04 3% 3 1,701.74 1,588.63 1.04 3% 4 1,701.74 1,588.63 1.04 3% 5 1,701.74 1,588.63 1.04 3% 6 1,701.74 1,588.63 1.04 3% 7 1,701.74 1,588.63 1.04 3% 8 1,701.74 1,588.63 1.04 3% 9 1,701.74 1,588.63 1.04 3%
10 1,701.74 1,588.63 1.04 3%
- - - - -