clean development mechanism project design document … whr project_.pdf · clean development...
TRANSCRIPT
PROJECT DESIGN DOCUMENT FORM (CDM PDD) - Version 03.1.
CDM – Executive Board
page 1
CLEAN DEVELOPMENT MECHANISM
PROJECT DESIGN DOCUMENT FORM (CDM-PDD)
Version 03 - in effect as of: 28 July 2006
CONTENTS
A. General description of project activity
B. Application of a baseline and monitoring methodology
C. Duration of the project activity / crediting period
D. Environmental impacts
E. Stakeholders’ comments
Annexes
Annex 1: Contact information on participants in the project activity
Annex 2: Information regarding public funding
Annex 3: Baseline information
Annex 4: Monitoring plan
Appendix 1: WHR power projects in Chhattisgarh state as per UNFCCC website
PROJECT DESIGN DOCUMENT FORM (CDM PDD) - Version 03.1.
CDM – Executive Board
page 2
SECTION A. General description of project activity
A.1 Title of the project activity:
>>
API WHR Project
Version 4
26/04/2009
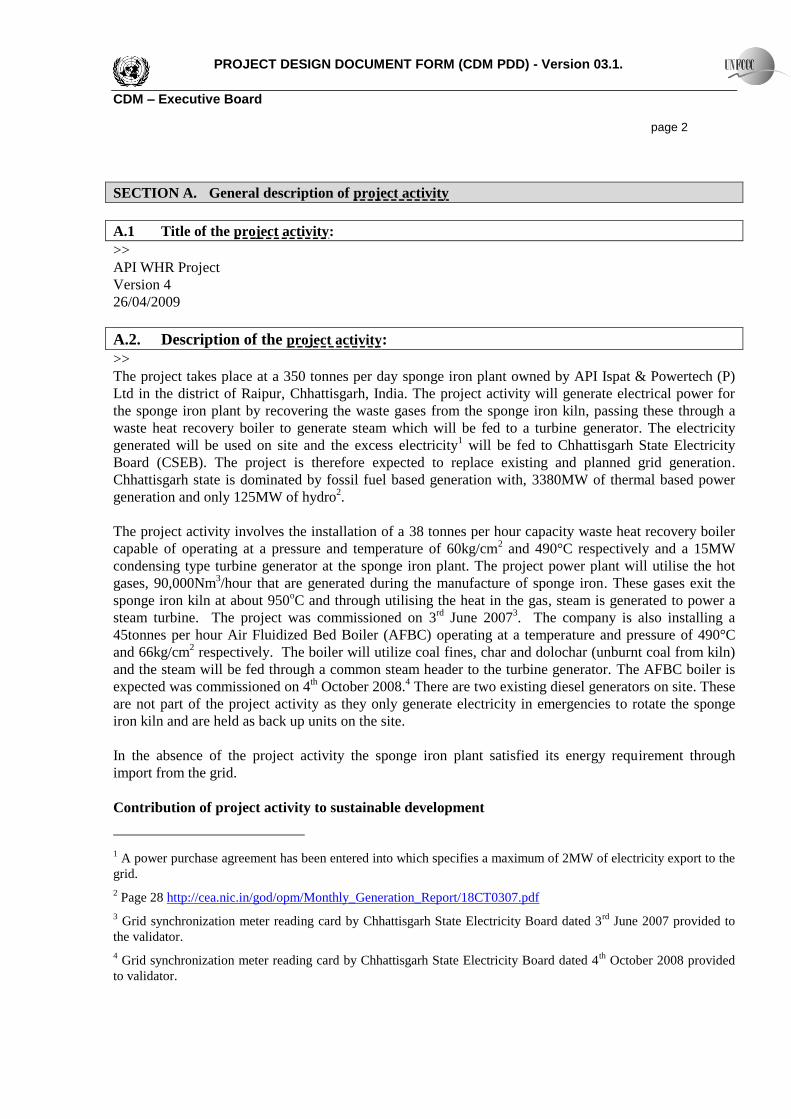
A.2. Description of the project activity:
>>
The project takes place at a 350 tonnes per day sponge iron plant owned by API Ispat & Powertech (P)
Ltd in the district of Raipur, Chhattisgarh, India. The project activity will generate electrical power for
the sponge iron plant by recovering the waste gases from the sponge iron kiln, passing these through a
waste heat recovery boiler to generate steam which will be fed to a turbine generator. The electricity
generated will be used on site and the excess electricity1 will be fed to Chhattisgarh State Electricity
Board (CSEB). The project is therefore expected to replace existing and planned grid generation.
Chhattisgarh state is dominated by fossil fuel based generation with, 3380MW of thermal based power
generation and only 125MW of hydro2.
The project activity involves the installation of a 38 tonnes per hour capacity waste heat recovery boiler
capable of operating at a pressure and temperature of 60kg/cm2 and 490°C respectively and a 15MW
condensing type turbine generator at the sponge iron plant. The project power plant will utilise the hot
gases, 90,000Nm3/hour that are generated during the manufacture of sponge iron. These gases exit the
sponge iron kiln at about 950oC and through utilising the heat in the gas, steam is generated to power a
steam turbine. The project was commissioned on 3rd
June 20073. The company is also installing a
45tonnes per hour Air Fluidized Bed Boiler (AFBC) operating at a temperature and pressure of 490°C
and 66kg/cm2 respectively. The boiler will utilize coal fines, char and dolochar (unburnt coal from kiln)
and the steam will be fed through a common steam header to the turbine generator. The AFBC boiler is
expected was commissioned on 4th October 2008.
4 There are two existing diesel generators on site. These
are not part of the project activity as they only generate electricity in emergencies to rotate the sponge
iron kiln and are held as back up units on the site.
In the absence of the project activity the sponge iron plant satisfied its energy requirement through
import from the grid.
Contribution of project activity to sustainable development
1 A power purchase agreement has been entered into which specifies a maximum of 2MW of electricity export to the
grid.
2 Page 28 http://cea.nic.in/god/opm/Monthly_Generation_Report/18CT0307.pdf
3 Grid synchronization meter reading card by Chhattisgarh State Electricity Board dated 3
rd June 2007 provided to
the validator.
4 Grid synchronization meter reading card by Chhattisgarh State Electricity Board dated 4
th October 2008 provided
to validator.

PROJECT DESIGN DOCUMENT FORM (CDM PDD) - Version 03.1.
CDM – Executive Board
page 3
The project will contribute directly to employment in the area, employing about 40 people in the power
plant and will contribute to sustainable development through the substitution of fossil fuel based
generation which currently dominates the grid. Chhattisgarh is heavily dependent on coal with less than
10%5 of generation sourced from non-fossil fuels. The introduction of such small scale generation
schemes is therefore a positive step towards reducing the dependence on fossil fuels.
Contribution of project activity to Environment
Through the generation of electricity for captive use and supply to the grid, the project activity will have
a direct environmental benefit. The generation of power from waste gases has long term benefits related
to climate change given that the alternative is a fossil fuel based generation system. Local pollution will
also be reduced as the alternative is predominantly fossil fuel combustion for the supply of electricity
which will give rise to increased emissions of NOx, SOx and ash. Moreover the utilization of waste gases
which were being released to the atmosphere before the project activity reduces the local pollution in the
surrounding area.
A.3. Project participants:
>>
Name of Party involved
((host) indicates a host Party)
Private and/or public
entity(ies) project participants
(as applicable)
If Party wishes to be
considered as a project
participant
India (host) API Ispat & Powertech (P) Ltd No
United Kingdom Agrinergy Pte Ltd No
The official contact for the project activity will be API Ispat & Powertech (P) Ltd, contact details as
listed in Annex I.
A.4. Technical description of the project activity:
A.4.1. Location of the project activity:
>>
A.4.1.1. Host Party(ies):
>>
India
A.4.1.2. Region/State/Province etc.:
>>
Chhattisgarh
A.4.1.3. City/Town/Community etc:
>>
5 Page 28 on the following web link gives the total and non fossil generation
http://cea.nic.in/god/opm/Monthly_Generation_Report/18CT0307.pdf

PROJECT DESIGN DOCUMENT FORM (CDM PDD) - Version 03.1.
CDM – Executive Board
page 4
Raipur district, Village Siltara
A.4.1.4. Detail of physical location, including information allowing the
unique identification of this project activity (maximum one page):
>>
Siltara Growth Center
The main khasra numbers of the site are: 384/3,384/12,384/8,384/5,384/7,390/1,390/3, 399/2,
384/4,384/11,391/2-3,430,390/2,392/5,384/6,291/1,292/2.
The site is about two and a half kilometre away from the nearest highway and railway station.
The grid reference6 of the project activity site is:
Latitude - 21°21’ N
Longitude - 81°40’ E
Project Activity
6 Page 1.2, Environmental Impact Assessment report provided to the validator.

PROJECT DESIGN DOCUMENT FORM (CDM PDD) - Version 03.1.
CDM – Executive Board
page 5
A.4.2. Category(ies) of project activity:
>>
Sectoral Scope 1: Energy Industries (renewable/non renewable sources)
Sectoral Scope 4: Manufacturing Industries
A.4.3. Technology to be employed by the project activity:
>>
The project will install a waste heat recovery boiler and a turbine generator to generate electrical power
from the waste heat gases produced during the manufacture of sponge iron. The majority of sponge iron
in India is manufactured through the direct reduced iron process (DRI). This process involves passing
coal and iron ore through a rotary kiln at high temperatures (over 1000oC) to reduce the iron ore to
sponge iron. The reduction process yields carbon dioxide and carbon monoxide at a temperature of
around 950oC, it is these gases which are used in the generation of electricity.
After leaving the kiln the waste gases of 90,000Nm3/hr at 950°C are passed through an after burner
chamber (ABC) and then fed to the waste heat recovery boiler, the gases then pass through an
electrostatic precipitator and are eventually released to the atmosphere via the stack. The electrostatic
precipitator is a much more effective means of collecting particles from waste gases and therefore the
benefits of installing waste heat recovery will be reflected not just in the displacement of fossil fuel
based power generation but also in the reduced particle matter being released into the atmosphere.
The technology employed in the generation of electrical power will be one 38 tonnes per hour 66 bar
single drum natural circulation water tube boiler manufactured by Thermax India. The boiler will
generate superheated steam of 490oC and have an inlet steam temperature at the economiser of 126
oC.
The boiler is connected to a 15MW condensing type turbine generator. In addition, the factory has
installed an air fluidised bed boiler (AFBC) that is also connected to the turbine generator. This boiler
will burn coal fines, char and dolochar (the unburnt coal from the kiln) to generate steam that will be fed
through a common steam header to the turbine generator. The turbine speed is 7,700 rpm and has an inlet
pressure and temperature of 62 bar and 488oC respectively.
The capacity of waste heat recovery unit is to produce 8MW of power and another 7MW is from the coal
based system. The consent to establish and the technical specifications have been provided to the DOE to
demonstrate the capacities.
In the event of shut down of the sponge iron kiln, the waste heat recovery boiler also shuts down due to
unavailability of waste gas. During this shutdown, the AFBC boiler produces power to run the two
induction furnace units. The electrical power will be generated at 11kV for use in the sponge iron unit
and excess power will be stepped up at the plant to 33kV for use in the grid.
There is no transfer of technology to the host country since the technology is available in, and supplied
from India.
The specifications of the equipments installed are as given below:
Waste heat recovery boiler steam generation 38,000 kg/hr
Type of boiler Single drum natural circulation water tube

PROJECT DESIGN DOCUMENT FORM (CDM PDD) - Version 03.1.
CDM – Executive Board
page 6
Orientation of boiler Vertical
Steam pressure 60kg/cm2
Steam temperature at super heater outlet 490°C
Feed water temperature at economiser inlet 126°C
Blowdown loss 2%
Radiation loss 2%
AFBC Boiler steam generation 45000kg/hr
Steam pressure 66 kg/cm2
Steam temperature at super heater outlet 490°C
Turbine capacity 15MW
Specified steam pressure 62 ata
Specified inlet steam pressure 488°C
Speed 7700 rpm
A.4.4 Estimated amount of emission reductions over the chosen crediting period:
>>
Year Annual estimation of emission reductions in
tonnes of CO2e
2009-2010 29,904
2010-2011 29,904
2011-2012 29,904
2012-2013 29,904
2013-2014 29,904
2014-2015 29,904
2015-2016 29,904
2016-2017 29,904
2017-2018 29,904
2018-2019 29,904
Total estimated reductions (tonnes CO2e) 299,040
Total number of crediting years 10
Annual average over the crediting period of
estimated reductions (tonnes of CO2e)
29,904
A.4.5. Public funding of the project activity:
>>
The project has not received any public funding.
PROJECT DESIGN DOCUMENT FORM (CDM PDD) - Version 03.1.
CDM – Executive Board
page 7
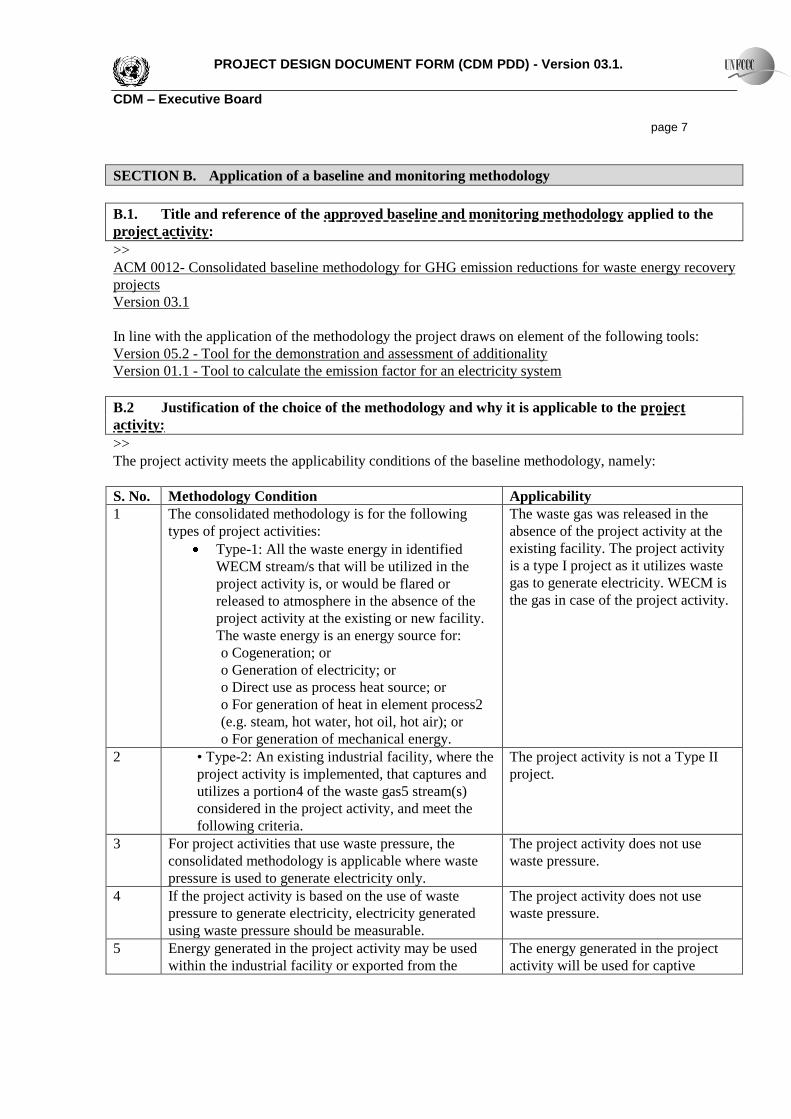
SECTION B. Application of a baseline and monitoring methodology
B.1. Title and reference of the approved baseline and monitoring methodology applied to the
project activity:
>>
ACM 0012- Consolidated baseline methodology for GHG emission reductions for waste energy recovery
projects
Version 03.1
In line with the application of the methodology the project draws on element of the following tools:
Version 05.2 - Tool for the demonstration and assessment of additionality
Version 01.1 - Tool to calculate the emission factor for an electricity system
B.2 Justification of the choice of the methodology and why it is applicable to the project
activity:
>>
The project activity meets the applicability conditions of the baseline methodology, namely:
S. No. Methodology Condition Applicability
1 The consolidated methodology is for the following
types of project activities:
Type-1: All the waste energy in identified
WECM stream/s that will be utilized in the
project activity is, or would be flared or
released to atmosphere in the absence of the
project activity at the existing or new facility.
The waste energy is an energy source for:
o Cogeneration; or
o Generation of electricity; or
o Direct use as process heat source; or
o For generation of heat in element process2
(e.g. steam, hot water, hot oil, hot air); or
o For generation of mechanical energy.
The waste gas was released in the
absence of the project activity at the
existing facility. The project activity
is a type I project as it utilizes waste
gas to generate electricity. WECM is
the gas in case of the project activity.
2 • Type-2: An existing industrial facility, where the
project activity is implemented, that captures and
utilizes a portion4 of the waste gas5 stream(s)
considered in the project activity, and meet the
following criteria.
The project activity is not a Type II
project.
3 For project activities that use waste pressure, the
consolidated methodology is applicable where waste
pressure is used to generate electricity only.
The project activity does not use
waste pressure.
4 If the project activity is based on the use of waste
pressure to generate electricity, electricity generated
using waste pressure should be measurable.
The project activity does not use
waste pressure.
5 Energy generated in the project activity may be used
within the industrial facility or exported from the
The energy generated in the project
activity will be used for captive

PROJECT DESIGN DOCUMENT FORM (CDM PDD) - Version 03.1.
CDM – Executive Board
page 8
industrial facility. consumption in the sponge iron plant.
Excess electricity if any will be
exported to the grid.
6 The electricity generated in the project activity may be
exported to the grid or used for captive purposes.
Energy generated by the project will
be used in the adjacent sponge iron
plant and if excess will be exported to
the grid.
7 Energy in the project activity can be generated by the
owner of the industrial facility producing the waste
energy or by a third party (e.g. ESCO) within the
industrial facility.
Energy is being generated by the
owner of the sponge iron plant that
produces the waste gas.
8 Regulations do not constrain the industrial facility that
generates waste energy from using fossil
fuels prior to the implementation of the project activity
Coal was used in the industrial
facility for generating waste gas prior
to implementation of the project.
There are no regulations constraining
the use of coal by the sponge iron
plant and this will continue to be used
after the implementation of the
project.
9 The methodology covers both new and existing
facilities. For existing facilities, the methodology
applies to existing capacity. If capacity expansion is
planned, the added capacity must be treated as a new
facility
The facility is an existing facility and
no capacity expansion is planned. If
capacity expansion is planned in
future it will be treated as a new
facility.
10 The emission reductions are claimed by the generator
of energy using waste energy.
The emission reductions are claimed
by API Ispat & Powertech (P) Ltd, the
generator of electricity using the
waste gas.
11 In cases where the energy is exported to other
facilities, an official agreement exists between the
owners of the project energy generation plant
(henceforth referred to as generator, unless specified
otherwise) with the recipient plant(s) that the emission
reductions would not be claimed by the recipient
plant(s) for using a zero-emission energy source.
Excess energy, if any will not be
exported to any recipient plant but to
the regional grid of India.
12 For those facilities and recipients included in the
project boundary, that prior to implementation of the
project activity (current situation) generated energy on-
site (sources of energy in the baseline), the credits can
be claimed for minimum of the following time periods:
o The remaining lifetime of equipments currently
being used; and
o Credit period.
No energy was generated on site prior
to the project activity.
Emission reductions will be claimed
for the entire crediting period of 10
years.
13 Waste energy that is released under abnormal
operation (for example, emergencies, shut down) of the
The waste gas released under
abnormal conditions will not be

PROJECT DESIGN DOCUMENT FORM (CDM PDD) - Version 03.1.
CDM – Executive Board
page 9
plant shall not be accounted for. accounted.
14 This methodology is not applicable to projects where
the waste gas/heat recovery project is implemented in a
single-cycle power plant (e.g. gas turbine or diesel
generator) to generate power.
The project activity is implemented in
a steam turbine to generate power.
Demonstration of use of waste energy in absence of CDM project activity
As per the methodology it has to be demonstrated that the waste energy utilized in the project activity
was flared or released in the absence of the project activity at the existing facility.
In case of the project activity this has been proved by providing energy (electricity) bills to demonstrate
that all the energy required for the process has been procured commercially from the regional grid.
B.3. Description of the sources and gases included in the project boundary
>> Source Gas Included? Justification/Explanation
Ba
seli
ne
Electricity generation,
grid or captive source
CO2 Included Electricity generation in the grid using fossil fuels is the
main emission source.
CH4 Excluded Excluded for simplification
N2O Excluded Excluded for simplification
Fossil fuel
consumption in boiler
for thermal energy
CO2 Excluded No fossil fuels were used to generate thermal energy
hence this has not been included.
CH4 Excluded Excluded for simplification. This is conservative.
N2O Excluded Excluded for simplification. This is conservative.
Fossil fuel
consumption in
cogeneration plant
CO2 Excluded There was no consumption of fossil fuels hence this has
been excluded.
CH4 Excluded Excluded for simplification. This is conservative.
N2O Excluded Excluded for simplification. This is conservative.
Baseline emissions
from generation of
steam used in the
flaring process, if any
CO2 Excluded The waste gas was released to the atmosphere hence
this has been excluded from the project boundary.
CH4 Excluded Excluded for simplification. This is conservative.
N2O Excluded Excluded for simplification. This is conservative.
Pro
ject
act
ivit
y
Supplemental fossil
fuel consumption at
the project plant
CO2 Excluded No fossil fuel will be consumed at the project site as a
result of the project activity.
CH4 Excluded Excluded for simplification
N2O Excluded Excluded for simplification
Supplemental
electricity
consumption
CO2 Excluded No electricity is consumed as a result of the project
activity.
CH4 Excluded Excluded for simplification
N2O Excluded Excluded for simplification
Electricity import to
replace captive
electricity, which was
generated using waste
gas in absence of
project activity
CO2 Excluded This has been excluded as no captive electricity in the
baseline is replaced by import electricity.
CH4 Excluded Excluded for simplification
N2O Excluded Excluded for simplification

PROJECT DESIGN DOCUMENT FORM (CDM PDD) - Version 03.1.
CDM – Executive Board
page 10
Project emissions
from cleaning of gas
CO2 Excluded Excluded as no cleaning of waste gas takes place and
hence does not lead to any emissions.
CH4 Excluded Excluded for simplification
N2O Excluded Excluded for simplification
As per the methodology:
“The geographical extent project boundary shall include the following:
(1) The industrial facility where waste energy is generated, including the part of the industrial facility
where the waste gas was utilized for generation of captive electricity prior to implementation of the
project activity)
In accordance with the above condition the boundary includes the sponge iron manufacturing plant.
(2) The facility where process heat in the element process/steam/electricity/mechanical energy is
generated (generator of process heat/steam/electricity/mechanical energy). Equipment providing
auxiliary heat to the waste energy recovery process shall be included within the project boundary; and
In accordance with the above conditions the geographical project boundary includes the sponge iron
plant, equipments installed for the operation of the power plant, the main elements of which are: the
WHR and AFBC boiler, turbine generator, condenser, water treatment plant, effluent treatment plant,
electrostatic precipitator, step-up transformer. There is no equipment providing auxiliary heat to the
waste heat recovery process.
(3) The facility (ies) where the process heat in the element process/steam/electricity/ mechanical energy
is used (the recipient plant(s)) and/or grid where electricity is exported, if applicable.
As the boundary for the determination of the grid carbon emission factor in India is not clearly defined
we follow the guidance in the “Tool to calculate emission factor for an electricity system”. To date, the
DNA has not issued guidance on the delineation of grid boundaries and we therefore follow the guidance
for the layered despatch systems and adopt a regional grid. The Indian electricity system is split into five
regional grids, North, West, East, South and North-East. The project activity falls under the western grid.
The following diagram explains the project boundary clearly:
Kiln After Burning
Chamber
WHRB
AFBC
Commo
n
Steam
Header
15
MW
Sponge
iron plant
& grid
PROJECT DESIGN DOCUMENT FORM (CDM PDD) - Version 03.1.
CDM – Executive Board
page 11
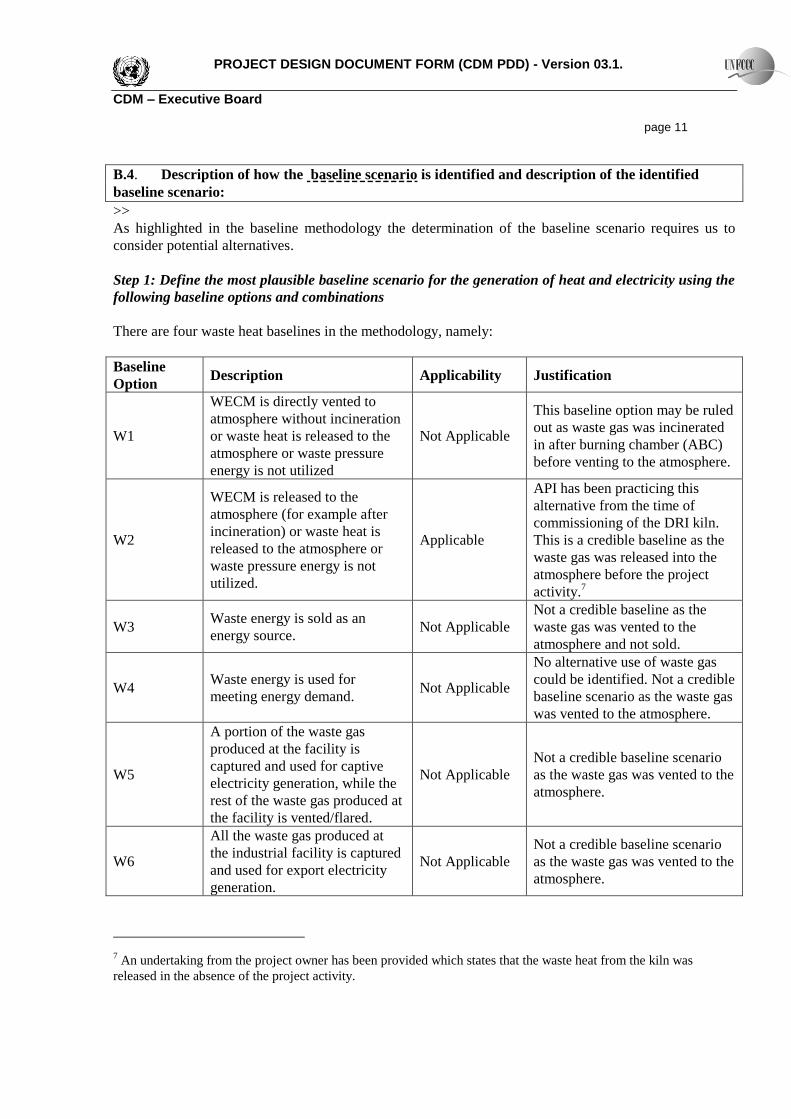
B.4. Description of how the baseline scenario is identified and description of the identified
baseline scenario:
>>
As highlighted in the baseline methodology the determination of the baseline scenario requires us to
consider potential alternatives.
Step 1: Define the most plausible baseline scenario for the generation of heat and electricity using the
following baseline options and combinations
There are four waste heat baselines in the methodology, namely:
Baseline
Option Description Applicability Justification
W1
WECM is directly vented to
atmosphere without incineration
or waste heat is released to the
atmosphere or waste pressure
energy is not utilized
Not Applicable
This baseline option may be ruled
out as waste gas was incinerated
in after burning chamber (ABC)
before venting to the atmosphere.
W2
WECM is released to the
atmosphere (for example after
incineration) or waste heat is
released to the atmosphere or
waste pressure energy is not
utilized.
Applicable
API has been practicing this
alternative from the time of
commissioning of the DRI kiln.
This is a credible baseline as the
waste gas was released into the
atmosphere before the project
activity.7
W3 Waste energy is sold as an
energy source. Not Applicable
Not a credible baseline as the
waste gas was vented to the
atmosphere and not sold.
W4 Waste energy is used for
meeting energy demand. Not Applicable
No alternative use of waste gas
could be identified. Not a credible
baseline scenario as the waste gas
was vented to the atmosphere.
W5
A portion of the waste gas
produced at the facility is
captured and used for captive
electricity generation, while the
rest of the waste gas produced at
the facility is vented/flared.
Not Applicable
Not a credible baseline scenario
as the waste gas was vented to the
atmosphere.
W6
All the waste gas produced at
the industrial facility is captured
and used for export electricity
generation.
Not Applicable
Not a credible baseline scenario
as the waste gas was vented to the
atmosphere.
7 An undertaking from the project owner has been provided which states that the waste heat from the kiln was
released in the absence of the project activity.
PROJECT DESIGN DOCUMENT FORM (CDM PDD) - Version 03.1.
CDM – Executive Board
page 12
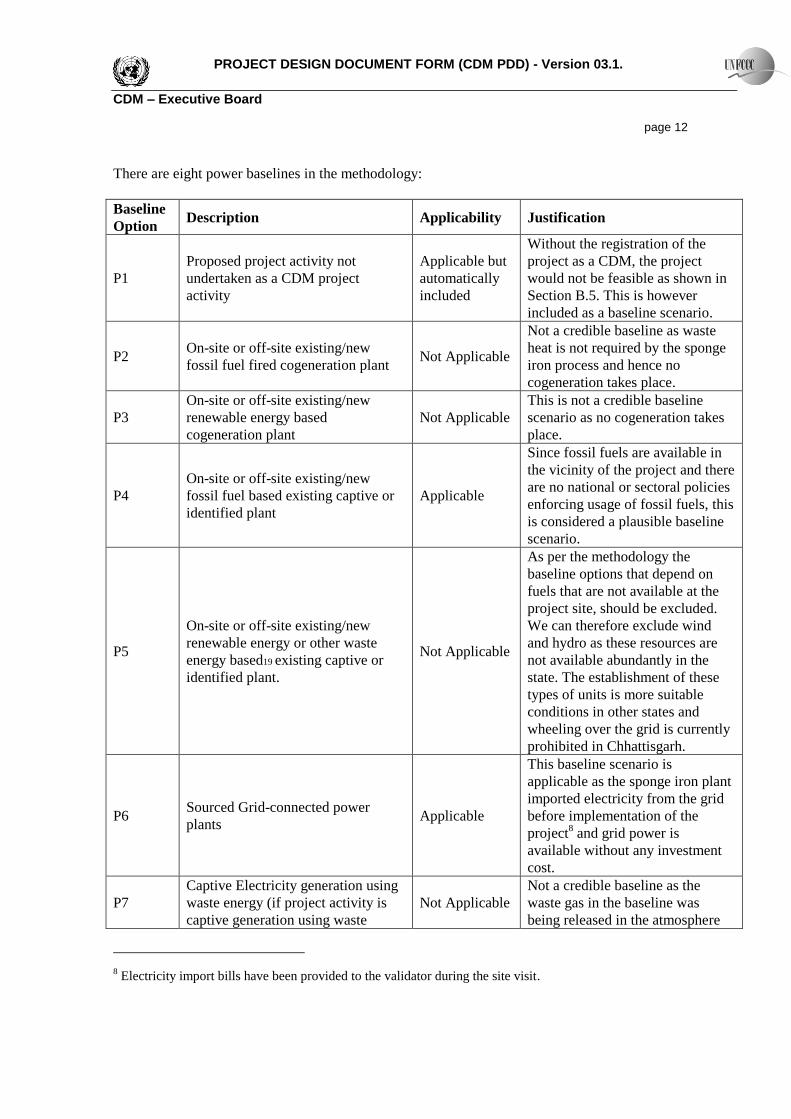
There are eight power baselines in the methodology:
Baseline
Option Description Applicability Justification
P1
Proposed project activity not
undertaken as a CDM project
activity
Applicable but
automatically
included
Without the registration of the
project as a CDM, the project
would not be feasible as shown in
Section B.5. This is however
included as a baseline scenario.
P2 On-site or off-site existing/new
fossil fuel fired cogeneration plant Not Applicable
Not a credible baseline as waste
heat is not required by the sponge
iron process and hence no
cogeneration takes place.
P3
On-site or off-site existing/new
renewable energy based
cogeneration plant
Not Applicable
This is not a credible baseline
scenario as no cogeneration takes
place.
P4
On-site or off-site existing/new
fossil fuel based existing captive or
identified plant
Applicable
Since fossil fuels are available in
the vicinity of the project and there
are no national or sectoral policies
enforcing usage of fossil fuels, this
is considered a plausible baseline
scenario.
P5
On-site or off-site existing/new
renewable energy or other waste
energy based19 existing captive or
identified plant.
Not Applicable
As per the methodology the
baseline options that depend on
fuels that are not available at the
project site, should be excluded.
We can therefore exclude wind
and hydro as these resources are
not available abundantly in the
state. The establishment of these
types of units is more suitable
conditions in other states and
wheeling over the grid is currently
prohibited in Chhattisgarh.
P6 Sourced Grid-connected power
plants Applicable
This baseline scenario is
applicable as the sponge iron plant
imported electricity from the grid
before implementation of the
project8 and grid power is
available without any investment
cost.
P7
Captive Electricity generation using
waste energy (if project activity is
captive generation using waste
Not Applicable
Not a credible baseline as the
waste gas in the baseline was
being released in the atmosphere
8 Electricity import bills have been provided to the validator during the site visit.

PROJECT DESIGN DOCUMENT FORM (CDM PDD) - Version 03.1.
CDM – Executive Board
page 13
energy, this scenario represents
captive generation with lower
efficiency than the project activity.)
and this would continue in the
absence of the project activity.
Electricity would have been
imported from the grid and
therefore this is not a credible
baseline scenario.
P8
Cogeneration using waste energy (if
project activity is cogeneration with
waste energy, this scenario
represents cogeneration with lower
efficiency than the project activity)
Not Applicable
Not a credible baseline as the
project activity is not a
cogeneration system and no heat is
required by the sponge iron
process.
P9
Existing power generating
equipment (used previous to
implementation of project activity
for captive electricity generation
from a captured portion of waste
gas) is either decommissioned to
build new more efficient and larger
capacity plant or modified or
expanded (by installing new
equipment), and resulting in higher
efficiency, to produce and only
export electricity generated from
waste gas.20 The electricity generated
by existing equipment for captive
consumption is now imported from
the grid
Not Applicable No existing power generating
equipments exist.
P10
Existing power generating
equipment (used previous to
implementation of project activity
for captive electricity generation
from a captured portion of waste
gas) is either decommissioned to
build a new more efficient and larger
capacity plant or modified or
expanded (by installing new
equipment), and resulting in higher
efficiency, to produce electricity
from waste gas (already utilized
portion plus the portion
flared/vented) for own consumption
and for export.
Not Applicable No existing power generating
equipments exist.
P11
Existing power generating
equipment is maintained and
additional electricity generated by
grid connected power plants.
Not Applicable No existing power generating
equipments exist.

PROJECT DESIGN DOCUMENT FORM (CDM PDD) - Version 03.1.
CDM – Executive Board
page 14
With respect to heat generation nine baseline scenarios have been given in the methodology but since the
project activity is generation of electricity only, these have not been considered.
With respect to mechanical energy, five baseline scenarios have been given in the methodology but since
the project activity does not result in production of mechanical energy, these have not been considered.
An analysis to determine the economically attractive alternative is done to identify the baseline scenario.
This analysis is based on the February 2004 – “Report of Expert Committee on fuels for power
generation” by Planning Wing, Central Electricity Authority, Government of India.
P6 Sourced grid connected power plants
Capital cost (Rs crore/ MW) 0
Cost of import (Rs/ kWh) 2.41+ Fixed demand charge (electricity tariff at which the
sponge iron plant imported electricity in the absence of
the project activity)
Conclusion This scenario is economically attractive as no capital
investment is required.
P4 On-site or off-site existing/new fossil fuel based
existing captive or identified plant
Coal based captive power generation on site
Capital cost of power plant (Rs crore/ MW) 4.09
Cost of generation at 80% PLF (Rs/ kWh) 1.5810
(At 200km between the source and load centre) the
project activity is located in Chhattisgarh where coal can
be procured from South Eastern Coal Fields Ltd.11
Conclusion High capital investment but cost of power generation is
low.
On-site or off-site existing/new fossil fuel based
existing captive or identified plant
Diesel based captive power generation on site
Capital cost of power plant (Rs crore/ MW) 3.58
Cost of generation at 80% PLF (Rs/ kWh) 5.969 (At load centre)
Conclusion Financially unattractive option
The project participant shall exclude baseline options that:
Do not comply with legal and regulatory requirements; or
Depend on fuels (used for generation of heat, power or mechanical energy), that are not
available at the project site.
9 Page (xi) of the “Report of Expert Committee on fuels for power generation”
10 Page (vi) of the “Report of Expert Committee on fuels for power generation”
11 http://www.secl.nic.in/mcoalfields.htm

PROJECT DESIGN DOCUMENT FORM (CDM PDD) - Version 03.1.
CDM – Executive Board
page 15
In terms of the alternatives mentioned all conform to local and national policies and are therefore
probable. There is no enforcement of power generation in sponge iron plants in Chhattisgarh. There are
also no restrictions on establishing captive power plants or importing electricity from the grid.
We can rule out natural gas as if it were available locally it would also be used in the sponge iron
manufacturing process.
Coal based captive power plant is a lucrative baseline scenario as cost of generation is low but as per the
methodology – “As a conservative approach, the available fuel with the lowest carbon emission factor
(e.g. natural gas) shall be used” and a coal baseline would be less conservative than grid based
generation. We may therefore rule out the alternative baseline scenario P4 on the basis of remaining
conservative. Hence the power baseline has been chosen as P6. However the investment comparison in
Section B.5 has been done by comparing the waste heat recovery system with a coal based captive power
plant.
Analyzing the alternatives above, the scenario that results from P6 and W2 is Scenario 1 for generation
of electricity:
Scenario Waste Gas Power Heat Description of situation
1 W2 P6 Not relevant The electricity is obtained from
the grid and the waste gas was
released to the atmosphere.
The project activity therefore gives rise to emission reductions through the displacement of grid based
power generation sources in the supply of electricity to the sponge iron plant and to the Chhattisgarh
State Electricity Board.
B.5. Description of how the anthropogenic emissions of GHG by sources are reduced below
those that would have occurred in the absence of the registered CDM project activity (assessment
and demonstration of additionality): >>
The following section demonstrates that the project activity is not part of the baseline scenario by
drawing on the latest version 05.2 of the “Tool for the demonstration and assessment of additionality”.
Step 1 – Identification of alternatives to the project activity consistent with current laws and
regulations
Sub-step 1a: Define alternatives to the project activity
The demonstration of the baseline scenarios (in section B4) incorporated the steps contained within this
section and therefore to summarise the conclusions of the baseline scenario it was shown that the
alternatives may be limited to the project activity not undertaken as a CDM and the supply of electricity
from the grid.
Sub-step 1b: Consistency with mandatory laws and regulations

PROJECT DESIGN DOCUMENT FORM (CDM PDD) - Version 03.1.
CDM – Executive Board
page 16
In terms of the alternatives identified above, all conform to local and national policies and are therefore
probable. There is no enforcement of power generation in sponge iron plants. There are also no
restrictions on establishing captive power plants or importing electricity from the grid.
Step 2 – Investment analysis
Sub –step 2a – Determine appropriate analysis method
Investment comparison analysis (Option II) has been used to demonstrate additionality of the project.
The project owners have identified the unit cost of service (levelized cost of electricity production in
Rs/MWh) as the most important financial indicator.
Sub-step 2b – Option II Apply investment comparison analysis
Project proponent have identified unit cost of service (i.e. levelized cost of electricity production in
Rs./kWh) as most suitable financial indicator for the project type and decision making context.
Sub-step 2c. Calculation and comparison of financial indicators
The project activity waste heat recovery power system of 8MW has been compared to a coal based power
system of 13MW. The major parameters used in the analysis are as follows:
WHRB Based Power Plant
S. No. Parameter Value Unit Source
1 PLF 85 % Assumed. Verified against other
CDM projects which have been
issued CER’s
2 Operating days 300 Days Calculated. Verified against
historical operating days.
3 Debt Component 70 % CERC Tariff Order
4 Equity Component 30 % CERC Tariff Order
5 Auxiliary Consumption 10 % CERC Tariff Order
6 Depreciation on buildings 3.34 % Indian Companies Act 1956
7 Depreciation on plant and
machinery
5.28 % Indian Companies Act 1956
8 Interest rate on term loan 7.75 % Loan approval document
9 Interest rate on working capital 10 % Loan approval document
10 Repair & Maintenance cost 2.5 % CERC Tariff Order
11 Escalation in O & M 4 % CERC Tariff Order
12 Deficit power cost 2,500 Rs/MWh CSEB cost
Contracted power demand 2 MVA Old electricity bills
Minimum demand charge 260 Rs/kVA Old electricity bills

PROJECT DESIGN DOCUMENT FORM (CDM PDD) - Version 03.1.
CDM – Executive Board
page 17
AFBC Based Power Plant
S. No. Parameter Value Unit Source
1 PLF 95 % NTPC Press Release
2 Operating days 350 Days Assumed
3 Debt Component 70 % CERC Tariff Order
4 Equity Component 30 % CERC Tariff Order
5 Auxiliary Consumption 10 % CERC Tariff Order
6 Depreciation on buildings 3.34 % Indian Companies Act 1956
7 Depreciation on plant and
machinery
5.28 % Indian Companies Act 1956
8 Interest rate on term loan 7.75 % Loan approval document
9 Interest rate on working
capital
10 % Loan approval document
10 Repair & Maintenance cost 2.5 % CERC Tariff Order
11 Escalation in O & M 4 % CERC Tariff Order
12 Backup power cost 0 Rs million
13 Deficit power cost 0 Rs/MWh
14 Cost of coal fines 800 Rs/ tonne Chhattisgarh Market Price 2005
15 Cost of char 50 Rs/ tonne Transportation and handling
costs
16 Cost of dolochar 50 Rs/ tonne Transportation and handling
costs
17 Coal fines required per MWh 0.840 tonnes/MWh Technical Consultant letter
18 Char required per MWh 0.373 tonnes/MWh Technical Consultant Letter
19 Dolochar required per MWh 0.373 tonnes/MWh Technical Consultant Letter
As per the values and calculations provided the comparative levelized unit cost of services is found as
below:
Levelized cost of power with WHRB without CDM support at 85% PLF: Rs 1,367/MWh
Levelized cost of power with AFBC without CDM support at 95% PLF : Rs 990/MWh
Levelized cost of power with WHRB with CDM support at 85% PLF : Rs 614/MWh
The choice for a project proponent establishing a captive power generation facility is to establish a route
by which the cost of power is minimized and the availability and reliability of power is maximized. The
WHRB power is available for a maximum of 300 days as the WHR boiler shuts down with the shutdown
of the sponge iron kiln. The sponge iron kiln has to be cleaned every 46 days to prevent corrosion. The
cleaning takes a maximum of 10 days and hence the operating days have been taken at a maximum of
300days. Whereas the power from a coal based power plant would be available for 350days. In addition
the lower plant load factor (PLF) in a WHR boiler makes power availability a risk for the project owner.
Whereas the coal based captive power plant would normally operate at a PLF of 95%. Hence a captive
power project proponent setting up a WHRB power plant would also require spending a substantial
amount in procurement of backup power from the grid, for which they will have to pay additional
demand charges, in Chhattisgarh at the rate of Rs.260/kVA.

PROJECT DESIGN DOCUMENT FORM (CDM PDD) - Version 03.1.
CDM – Executive Board
page 18
Comparing the cost required to set up a WHR plant and an AFBC plant, it was found that cost per MW
for a waste heat recovery system supports the project owner’s decision to set up a coal based power
system.
On making a clear comparison of the financial indicators for the proposed project activity and alternative
used, it is found that the coal based captive power plant has the lowest cost of power, hence the project
activity cannot be considered as the most financially attractive option.
The project owners have made an economic comparison of “the unit cost of electricity generation” from
the project activity with that of a 13 MW coal based power plant for the following reasons:
1. The 8MW waste heat recovery power plant with a maximum of 85% PLF, along with back up
grid support to draw the deficit energy to make up for fluctuations in generation and 7MW coal
based power plant with 95% PLF, can provide an equivalent level of electricity generation as
compared to a 13MW coal based power plant with 95% PLF which is the baseline (to be
conservative the baseline has been taken as the grid).
2. It is technically not possible to generate the same amount of power from an 8MW WHRB and an
8MW AFBC boiler.
Even comparing an 8MW waste heat recovery system with 95% PLF to a 8MW coal based power system
with 95% PLF it was found that the coal based system was a financially more attractive option and hence
the preferred choice for project owners.
Hence the 8MW project activity compared to a 13MW coal based system to provide same level of output
is justified.
Sub-step 2d. Sensitivity Analysis
Coal should have a analysis of fixed carbon (% ash, % volatile matter and % moisture deducted from
100%) above 40. The fixed carbon is the % of usable carbon of coal in the process and for lower fixed
carbon coal; the usage of coal per ton of ore charged is higher. The sponge iron kiln has a fixed hourly
charge weight of ore, coal and dolomite. So poor quality coal means a higher ore to coal ratio, which
refers to lower ore charging rate. This leads to lower production of sponge iron and lower generation of
waste gas per hour.
For a rotary kiln coal based sponge iron manufacturing process to be successful, it is absolutely essential
to use non coking coals having high reactivity characteristics and high ash fusion temperatures12
. But
Indian non coking coal does not satisfy the above criteria and therefore lead to less capacity utilization of
the sponge iron plant, which in turn is the reason for low PLF of the waste heat based power plant.
Reduction in capacity utilization results in reduction in power generation capacity thereby affecting the
project activity’s financial viability.
12This has been established in a research paper available on the website www.steelworld.com. The paper has been
provided to the validator.

PROJECT DESIGN DOCUMENT FORM (CDM PDD) - Version 03.1.
CDM – Executive Board
page 19
The comparative cost of power at 75%, 80%, 85% and 90% PLF for WHRB has been considered,
however as per the practical experience in WHRB operating with Sponge Iron Plants in the region, it is
experienced that the normal PLF achievable from WHRB is at an average of 75%13
.
However for the sake of the sensitivity an analysis in terms of cost of power from WHRB with a 75%,
80%, 85% and 90% PLF was carried out without CDM support, and it was found to be higher than coal
based power plant, where as with CDM support the cost of power from WHRB is reduced below that of
coal based captive power plant.
Levelized cost of power with WHRB without CDM support at 75% PLF: Rs 1,849/MWh
Levelized cost of power with WHRB without CDM support at 80% PLF: Rs 1,593/MWh
Levelized cost of power with WHRB without CDM support at 85% PLF: Rs 1,367/MWh
Levelized cost of power with AFBC without CDM support at 95% PLF : Rs 990/MWh
Levelized cost of power with WHRB without CDM support at 90% PLF: Rs 1,166/MWh
Levelized cost of power with WHRB with CDM support at 85% PLF : Rs 614/MWh
This sensitivity analysis conclusively establishes that the coal based captive power plant is financially
more attractive than WHRB based power (without CDM). Therefore the project is found to be
additional.
Step 3 – Barrier analysis
Investment analysis has been undertaken.
Step 4. Common practice Analysis
Sub-step 4a. Analyze other activities similar to the proposed project activity:
The following table details the sponge iron plants in the state of Chhattisgarh and indicates whether they
have or are in the process of installing waste heat recovery boilers14
. In line with the tool and the
guidance from the Executive Board15
the proposed and registered CDM project activities have not been
included in the analysis.
SPONGE IRON PLANTS IN THE STATE OF CHHATTISGARH
S.
No.
Company Name District Kiln
Capacity
(tpdx300
days)
WHRB Whether
CDM?
1 Agrawal Sponge Pvt. Ltd Raipur 0.60 No No
2 Aryan Ispat & Power Ltd Bilaspur 0.60 No No
13 An analysis of the PLF achieved by projects registered with the UNFCCC has been provided to the validator.
14 This data has been taken from a study conducted by the project owners’ consultants with help from internet data,
local and internal sources.
15 CDM EB 38 paragraph 60

PROJECT DESIGN DOCUMENT FORM (CDM PDD) - Version 03.1.
CDM – Executive Board
page 20
3 Anjani Steels Pvt. Ltd. Raigarh 0.72 No No
4 B.S. Sponge Iron Ltd. Raigarh 0.60 No No
5 Bhagwati Power & Steel Pvt. Ltd. Raipur 0.60 No No
6 Gopal Sponge & Power (P) Ltd. Raipur 0.60 No No
7 Harsh Sponge Raipur 0.60 No No
8 HEG Limited Durg 1.20 Yes No
9 Maa Shakambari Steel Ltd. Raigarh 0.60 No No
10 Niro’s Ispat (P) Ltd Durg 0.90 No No
11 N.R. Sponge Pvt. Ltd Raipur 0.60 No No
12
Nutan Ispat & Power
Pvt. Ltd. Raipur 0.60 No No
13 Shidhi Vinayak Sponge Iron (P) Ltd. Raigarh 0.60 No No
14 Shiv Shakti Steel Ltd. Raigarh 0.98 No No
15 Shivalaya Ispat & Power (P) Ltd Raipur 0.60 No No
16 Shri Shyam Ispat (I) Pvt. Ltd. Raigarh 0.60 No No
17
S.K. Saraogi &
Company Pvt. Ltd. Raipur 0.60 No No
18 Sunil Sponge Pvt. Ltd. Raipur 0.60 No No
19 Trimula Sponge Ltd. Raipur 0.60 No No
Sub-step 4b. Discuss any similar options that are occurring:
Out of the 19 sponge iron plants listed above only 4 are operating at a scale similar (Anjani Steels Pvt.
Ltd., HEG Limited, Niro’s Ispat (P) Ltd. and Shiv Shakti Steel Ltd.) to the project activity. Kiln capacity
of project is 1.05 lakh tons. Of these only HEG Limited has installed a Waste Heat Recovery System but
this started operation in March 199716
when CDM benefits were not available and HEG Limited is an old
and financially healthy company set up in 1977. Other plants of a lower capacity also do not have waste
heat recovery systems clearly highlighting the importance of CDM in commissioning of such project
types.
Till date the implementation of waste heat recovery has mainly taken place amongst the larger plants and
all are being commissioned on the basis of CDM funding. From the above it is clear that the proposed
project activity is not a common practice in the state.
Based on the above facts, it is evident that the project activity is additional and requires CDM revenues
to overcome the barriers discussed above.
16 http://www.hegltd.com/pp/whr_plant.aspx
PROJECT DESIGN DOCUMENT FORM (CDM PDD) - Version 03.1.
CDM – Executive Board
page 21
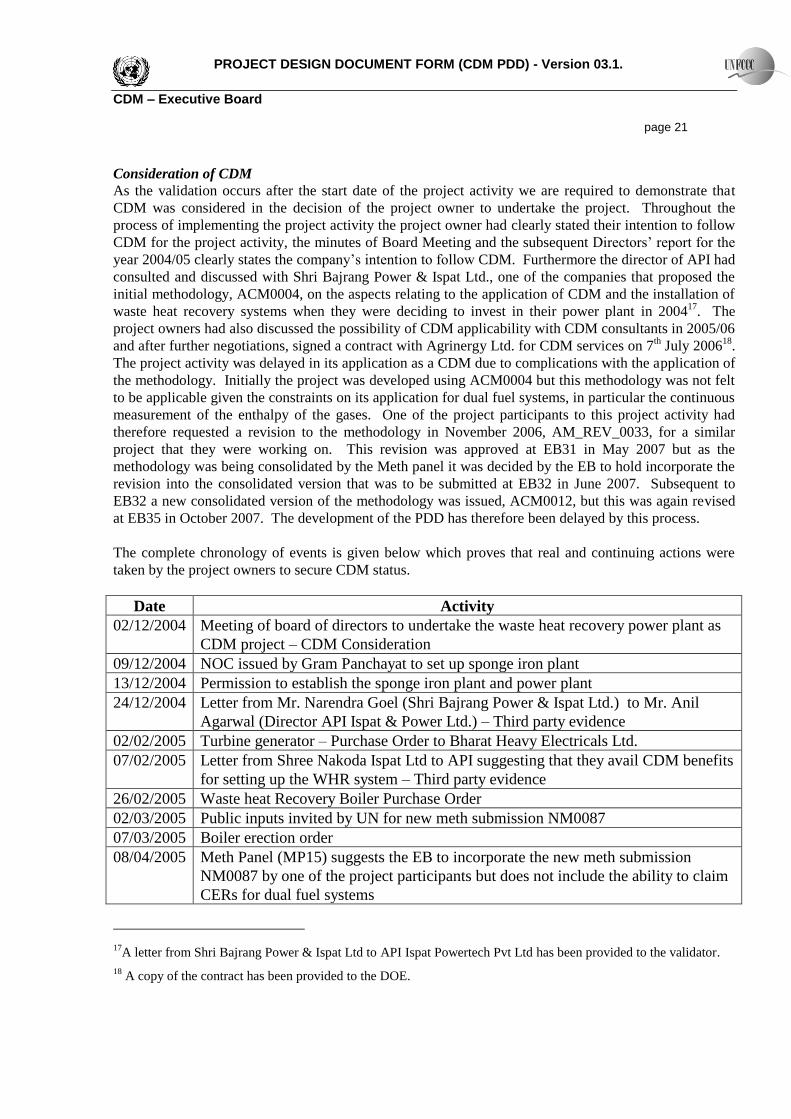
Consideration of CDM
As the validation occurs after the start date of the project activity we are required to demonstrate that
CDM was considered in the decision of the project owner to undertake the project. Throughout the
process of implementing the project activity the project owner had clearly stated their intention to follow
CDM for the project activity, the minutes of Board Meeting and the subsequent Directors’ report for the
year 2004/05 clearly states the company’s intention to follow CDM. Furthermore the director of API had
consulted and discussed with Shri Bajrang Power & Ispat Ltd., one of the companies that proposed the
initial methodology, ACM0004, on the aspects relating to the application of CDM and the installation of
waste heat recovery systems when they were deciding to invest in their power plant in 200417
. The
project owners had also discussed the possibility of CDM applicability with CDM consultants in 2005/06
and after further negotiations, signed a contract with Agrinergy Ltd. for CDM services on 7th July 2006
18.
The project activity was delayed in its application as a CDM due to complications with the application of
the methodology. Initially the project was developed using ACM0004 but this methodology was not felt
to be applicable given the constraints on its application for dual fuel systems, in particular the continuous
measurement of the enthalpy of the gases. One of the project participants to this project activity had
therefore requested a revision to the methodology in November 2006, AM_REV_0033, for a similar
project that they were working on. This revision was approved at EB31 in May 2007 but as the
methodology was being consolidated by the Meth panel it was decided by the EB to hold incorporate the
revision into the consolidated version that was to be submitted at EB32 in June 2007. Subsequent to
EB32 a new consolidated version of the methodology was issued, ACM0012, but this was again revised
at EB35 in October 2007. The development of the PDD has therefore been delayed by this process.
The complete chronology of events is given below which proves that real and continuing actions were
taken by the project owners to secure CDM status.
Date Activity
02/12/2004 Meeting of board of directors to undertake the waste heat recovery power plant as
CDM project – CDM Consideration
09/12/2004 NOC issued by Gram Panchayat to set up sponge iron plant
13/12/2004 Permission to establish the sponge iron plant and power plant
24/12/2004 Letter from Mr. Narendra Goel (Shri Bajrang Power & Ispat Ltd.) to Mr. Anil
Agarwal (Director API Ispat & Power Ltd.) – Third party evidence
02/02/2005 Turbine generator – Purchase Order to Bharat Heavy Electricals Ltd.
07/02/2005 Letter from Shree Nakoda Ispat Ltd to API suggesting that they avail CDM benefits
for setting up the WHR system – Third party evidence
26/02/2005 Waste heat Recovery Boiler Purchase Order
02/03/2005 Public inputs invited by UN for new meth submission NM0087
07/03/2005 Boiler erection order
08/04/2005 Meth Panel (MP15) suggests the EB to incorporate the new meth submission
NM0087 by one of the project participants but does not include the ability to claim
CERs for dual fuel systems
17A letter from Shri Bajrang Power & Ispat Ltd to API Ispat Powertech Pvt Ltd has been provided to the validator.
18 A copy of the contract has been provided to the DOE.

PROJECT DESIGN DOCUMENT FORM (CDM PDD) - Version 03.1.
CDM – Executive Board
page 22
13/05/2005 EB 19 incorporates the meth submission
27/05/2005 Sanction of loan from State Bank of Travancore
22/09/2005 Work order for civil construction of power plant
17/11/2005 Email from API Ispat to Agrinergy
27/04/2006 Consent to operate the sponge iron plant
28/04/2006 Email from Agrinergy to API Ispat
07/07/2006 Contract signed with Agrinergy to develop the CDM project
23/10/2006 NOC issued by Gram panchayat for setting up power plant and applying for carbon
credits
27/11/2006 Request submitted for revision of ACM0004 by one of the project participants –
AM_REV_0033
07/12/2006 Permission for synchronization with Chhattisgarh State Electricity Board grid
27/02/2007 Amendment in consent to operate for Waste Heat Recovery Based Power Plant
03/06/2007 Synchronization of power plant with grid
12/06/2007 Power purchase agreement with Chhattisgarh State Electricity Board
22/06/2007 EB 32 approves the methodology ACM0012
19/10/2007 EB35 revises the methodology ACM0012
19/01/2008 Baseline and monitoring study completed
07/03/2008 PDD version 1
23/04/2008 Proposals from various DOE requested
08/05/2008 Validation Contract signed with the DOE
B.6. Emission reductions:
B.6.1. Explanation of methodological choices:
>>
The methodology requires us to measure the net generation arising from the waste heat recovery unit and
multiply this by an appropriate carbon dioxide emission factor to arrive at the baseline emissions. In the
case of the project activity the turbine is fed from two boilers, one waste heat recovery boiler and one
coal based AFBC boiler. The apportioning of the generation is carried out as outlined in the
methodology, on the basis of the steam supplied by these units.
Baseline emissions
The baseline emissions for the year y shall be determined as follows:
yflstyEny BEBEBE ,, (1)
Where:
BEy Total baseline emissions during the year y in tons of CO2
BEEn,y Baseline emissions from energy generated by project activity during the year y in tons of
CO2
BEflst,y Baseline Emissions from steam generation, if any, using fossil fuel that would have been
used for flaring the waste gas in the absence of the project activity (tCO2e per year). This

PROJECT DESIGN DOCUMENT FORM (CDM PDD) - Version 03.1.
CDM – Executive Board
page 23
is relevant for those project activities where in the baseline steam is used to flare the
waste gas.
Since in the baseline steam was not used to flare waste gas, the equation is reduced to:
yENy BEBE ,
The project falls under scenario 1 of the methodology – “
Scenario 1 represents the situation where the electricity is obtained from a specific existing power plant
or from the grid, mechanical energy (displaced waste energy based mechanical turbines in project) is
obtained by electric motors and heat from a fossil fuel based element process (e.g. steam boiler, hot
water generator, hot air generator, hot oil generator).”
yTheryElecyEn BEBEBE ,,, (1a)
Where:
BEelec,y Baseline emissions from electricity during the year y in tons of CO2
BETher,y Baseline emissions from thermal energy (due to heat generation by element process)
during the year y in tons of CO2
a) Baseline emissions from electricity (BEelectricity,y) Type – I activities
yjiElecyji
j i
wcmcapyElec EFEGfCfBE ,,,,,, (1a-1)
Where:
BEelec,y Baseline emissions due to displacement of electricity during the year y in tons of CO2
EGi,j,y The quantity of electricity supplied to the recipient j by generator, that in the absence of
the project activity would have been sourced from ith source (i can be either grid or
identified source) during the year y in MWh, and
EFelec,i,j,y The CO2 emission factor for the electricity source i (i=gr (grid) or i=is (identified
source)), displaced due to the project activity, during the year y in tons CO2/MWh
fwcm Fraction of total electricity generated by the project activity using waste energy. This
fraction is 1 if the electricity generation is purely from use of waste energy. If the boiler
providing steam for electricity generation uses both waste and fossil fuels, this factor is
estimated using equation (1d). If the steam used for generation of the electricity is
produced in dedicated boilers but supplied through common header, this factor is
estimated using equation (1d/1e). Note: For project activity using waste pressure to
generate electricity, electricity generated from waste pressure use should be measurable
and this fraction is 1
fcap Energy that would have been produced in project year y using waste energy generated in
base year expressed as a fraction of total energy produced using waste source in year y.
The ratio is 1 if the waste energy generated in project year y is same or less than that
generated in base year. The value is estimated using equations (1f), or (1f-1) or (1f-2), or
(1g), (1g-1) or (1h)
PROJECT DESIGN DOCUMENT FORM (CDM PDD) - Version 03.1.
CDM – Executive Board
page 24
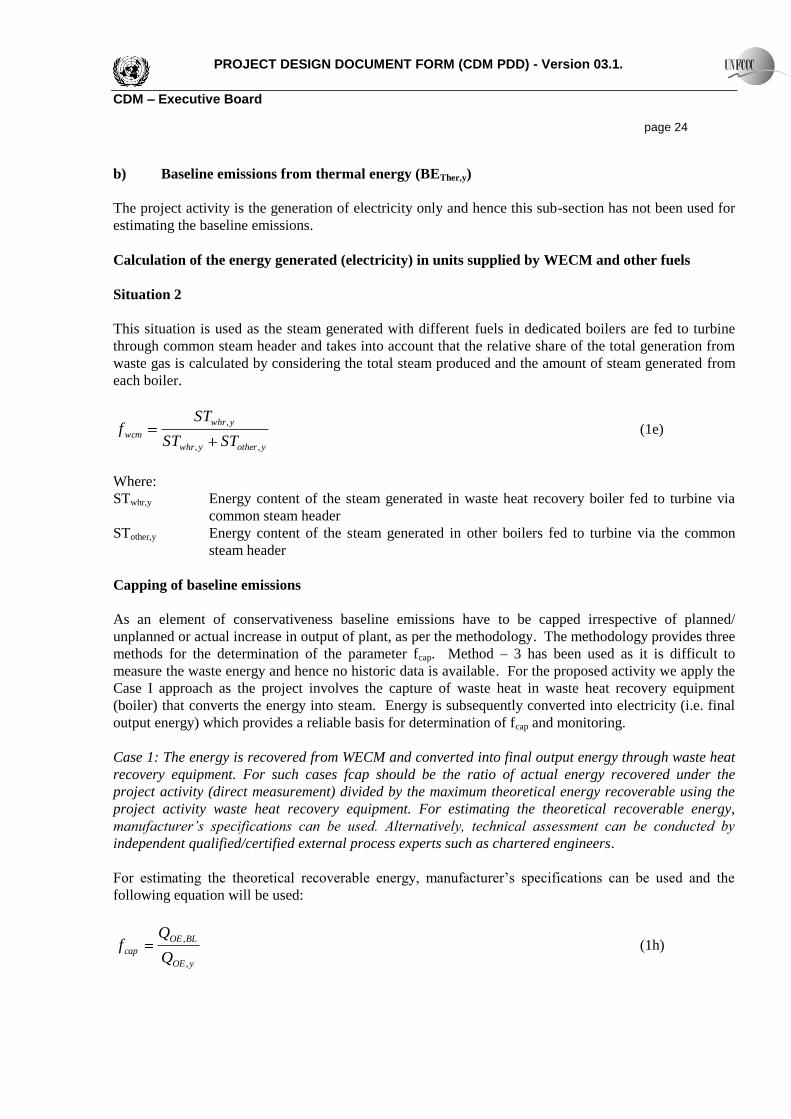
b) Baseline emissions from thermal energy (BETher,y)
The project activity is the generation of electricity only and hence this sub-section has not been used for
estimating the baseline emissions.
Calculation of the energy generated (electricity) in units supplied by WECM and other fuels
Situation 2
This situation is used as the steam generated with different fuels in dedicated boilers are fed to turbine
through common steam header and takes into account that the relative share of the total generation from
waste gas is calculated by considering the total steam produced and the amount of steam generated from
each boiler.
yotherywhr
ywhr
wcmSTST
STf
,,
, (1e)
Where:
STwhr,y Energy content of the steam generated in waste heat recovery boiler fed to turbine via
common steam header
STother,y Energy content of the steam generated in other boilers fed to turbine via the common
steam header
Capping of baseline emissions
As an element of conservativeness baseline emissions have to be capped irrespective of planned/
unplanned or actual increase in output of plant, as per the methodology. The methodology provides three
methods for the determination of the parameter fcap. Method – 3 has been used as it is difficult to
measure the waste energy and hence no historic data is available. For the proposed activity we apply the
Case I approach as the project involves the capture of waste heat in waste heat recovery equipment
(boiler) that converts the energy into steam. Energy is subsequently converted into electricity (i.e. final
output energy) which provides a reliable basis for determination of fcap and monitoring.
Case 1: The energy is recovered from WECM and converted into final output energy through waste heat
recovery equipment. For such cases fcap should be the ratio of actual energy recovered under the
project activity (direct measurement) divided by the maximum theoretical energy recoverable using the
project activity waste heat recovery equipment. For estimating the theoretical recoverable energy,
manufacturer’s specifications can be used. Alternatively, technical assessment can be conducted by
independent qualified/certified external process experts such as chartered engineers.
For estimating the theoretical recoverable energy, manufacturer’s specifications can be used and the
following equation will be used:
yOE
BLOE
capQ
Qf
,
, (1h)

PROJECT DESIGN DOCUMENT FORM (CDM PDD) - Version 03.1.
CDM – Executive Board
page 25
Where:
QOE,BL Output/intermediate energy that can be theoretically produced (in appropriate unit), to be
determined on the basis of maximum recoverable energy from the WECM, which would
have been released (or WECM would have been flared or energy content of WECM
would have been wasted) in the absence of CDM project activity.
QOE,y Quantity of actual output/intermediate energy during year y (in appropriate unit)
In the case of the proposed project activity QOE,BL consists of the theoretical maximum electrical output
(in MW) that can be generated with the available waste heat, while QOE,y is the actual electrical output of
the project in year y (in MW).
In case of a planned expansion, a separate CDM project would be registered for additional capacity.
Project emissions and leakage
As the project activity does not involve the combustion of any other auxiliary fossil fuel to supplement
waste gas and neither is any electricity consumed for cleaning of waste gas before energy generation, the
project emissions are hence taken as zero.
In line with the methodology leakage is also zero.
Emission Reductions
Emission reductions are calculated by the following formula:
yyENy PEBEER , (3)
Where:
ERy Total emissions reductions during the year y in tons of CO2
PEy Emissions from the project activity during the year y in tons of CO2
BEEN,y Baseline emissions for the project activity during the year y in tons of CO2
Since the project emissions are zero the above formula is reduced to:
yENy BEER ,
We have adopted the approach specified in the “Tool to calculate the emission factor for an electricity
system” to calculate the emission factor of the Northern regional grid. The average of approximating
operating margin and build margin has been used for calculation of the baseline. The grid emission
factor has been obtained from the CO2 baseline database, Central Electricity Authority and is fixed ex-
ante at 0.79 tCO2/MWh and is calculated as shown in table below:
Calculation of the combined margin
tCO2/MWh
Operating Margin 0.99

PROJECT DESIGN DOCUMENT FORM (CDM PDD) - Version 03.1.
CDM – Executive Board
page 26
Build Margin 0.59
Combined Margin 0.79
B.6.2. Data and parameters that are available at validation:
Data / Parameter: EFEleci,j,y
Data unit: tCO2/MWh
Description: The CO2 emission factor for the electricity source i (i=grid), displaced due to
the project activity, during the year y
Source of data used: Central Electricity Authority CO2 baseline database version 3
Value applied: 0.79
Justification of the
choice of data or
description of
measurement methods
and procedures
actually applied :
This value is for the Northern regional grid, provided by the Central Electricity
Authority (CEA), a government body.
Any comment: http://cea.nic.in/planning/c%20and%20e/Government%20of%20India%20webs
ite.htm
The value has been fixed ex-ante.
Data / Parameter: fcap
Data unit: Fraction
Description: Energy that would have been produced in project year y using waste energy
generated in base year expressed as a fraction of total energy produced using
waste source in year y. The ratio is 1 if the waste energy generated in project
year y is same or less than that generated in base year.
Source of data used: Calculated in accordance with Method-3, Case-1 as described in the
methodology
Value applied 1
Justification of the
choice of data or
description of
measurement methods
and procedures
actually applied :
The value of fcap has been calculated on the basis of the output that can
theoretically be produced on the basis of available waste heat when the sponge
iron kiln is operated under normal load factors and projected power output.
Any comment: This parameter is fixed ex-ante.
Data / Parameter: QOE,BL
Data unit: MW
Description: Output/intermediate energy that can be theoretically produced (in appropriate
unit), to be determined on the basis of maximum recoverable energy from the
WECM, which would have been released (or WECM would have been flared
or energy content of WECM would have been wasted) in the absence of CDM
project activity.
Source of data used: Manufacturer’s specification

PROJECT DESIGN DOCUMENT FORM (CDM PDD) - Version 03.1.
CDM – Executive Board
page 27
Value applied 8
Justification of the
choice of data or
description of
measurement methods
and procedures
actually applied :
As per the methodology the manufacturer’s data has been used.
Any comment: This parameter is fixed ex-ante.
B.6.3 Ex-ante calculation of emission reductions:
>>
To be conservative the baseline scenario is determined to be the import of power from the regional grid.
In line with the methodology the emission reductions have been calculated using equations as in Section
B.6.
S. No. Parameter Explanation Unit Value
1 EGi,j,y The quantity of electricity supplied
to the recipient j by generator, that in
the absence of the project activity
would have been sourced from ith
source (i can be either grid or
identified source) during the year y
MWh 91,745
2 EFelec,i,j,y The CO2 emission factor for the
electricity source i (i=gr (grid) or
i=is (identified source)), displaced
due to the project activity, during the
year y
tCO2/MWh 0.79
3 fwcm Fraction of total electricity generated
by the project activity using waste
energy. This fraction is 1 if the
electricity generation is purely from
use of waste energy.
Fraction 0.458
4 fcap Energy that would have been
produced in project year y using
waste energy generated in base year
expressed as a fraction of total
energy produced using waste source
in year y
Fraction 1
5 BEelec,y Baseline emissions from electricity
during the year y
tCO2 29,904
6 BEEN,y Baseline emissions from energy
generated by project activity during
the year y in tons of CO2
tCO2 29,904
B.6.4 Summary of the ex-ante estimation of emission reductions:
>>

PROJECT DESIGN DOCUMENT FORM (CDM PDD) - Version 03.1.
CDM – Executive Board
page 28
Year
Estimation of
project activity
emissions (tonnes
of CO2e)
Estimation of
baseline
emissions (tonnes
of CO2e)
Estimation of
leakage (tonnes of
CO2e)
Estimation of
overall emission
reductions
(tonnes of CO2e)
2009-2010 0 29,904 0 29,904
2010-2011 0 29,904 0 29,904
2011-2012 0 29,904 0 29,904
2012-2013 0 29,904 0 29,904
2013-2014 0 29,904 0 29,904
2014-2015 0 29,904 0 29,904
2015-2016 0 29,904 0 29,904
2016-2017 0 29,904 0 29,904
2017-2018 0 29,904 0 29,904
2018-2019 0 29,904 0 29,904
Total tonnes of
CO2e
0 299,040 0 299,040
B.7 Application of the monitoring methodology and description of the monitoring plan:
B.7.1 Data and parameters monitored:
Data / Parameter: EG,i,j,y
Data unit: MWh
Description: The quantity of electricity supplied to the recipient j by generator, that in the
absence of the project activity would have been sourced from ith source (i can be
either grid or identified source) during the year y
Source of data to be
used:
Plant records
Value of data applied
for the purpose of
calculating expected
emission reductions in
section B.5
91,745
Description of
measurement methods
and procedures to be
applied:
The plant will install energy meter and meter reading will be taken on a shift
wise basis and collated daily by the shift operator. This monitored data will be
collated into a monthly report from which the emission reductions will be
calculated.
QA/QC procedures to
be applied:
The meters will be calibrated annually by an independent third party.
Any comment: All data will be kept for a period 2 years after the end of the crediting period.
Data / Parameter: EGAUX
Data unit: MWh
Description: Auxiliary consumption of the power plant
Source of data to be
used:
Plant records

PROJECT DESIGN DOCUMENT FORM (CDM PDD) - Version 03.1.
CDM – Executive Board
page 29
Value of data applied
for the purpose of
calculating expected
emission reductions in
section B.5
9,175
Description of
measurement methods
and procedures to be
applied:
The plant will install auxiliary meter and reading will be taken on a shift wise
and daily basis by the shift operators. These recordings will be collated into a
monthly report from which the emission reductions will be calculated.
QA/QC procedures to
be applied:
The meter will be calibrated annually by independent third party.
Any comment: All data will be kept for a period 2 years after the end of the crediting period.
Data / Parameter: EGNet
Data unit: MWh
Description: Net electricity generation by the power plant
Source of data to be
used:
Calculated
Value of data applied
for the purpose of
calculating expected
emission reductions in
section B.5
82,571
Description of
measurement methods
and procedures to be
applied:
EG,i,j,y - EGAUX
QA/QC procedures to
be applied:
--
Any comment: All data will be kept for a period 2 years after the end of the crediting period.
Data / Parameter: QWG,y
Data unit: Nm3
Description: Quantity of waste gas used for energy generation during year y
Source of data to be
used:
Plant records
Value of data applied
for the purpose of
calculating expected
emission reductions in
section B.5
The parameter is not used in calculation of emission reductions
Description of
measurement methods
and procedures to be
applied:
It is difficult to measure the waste gas before point of use (i.e. waste heat
recovery boiler) hence a meter has been put up between stack and WHRB. The
conditions as per methodology have been met:
Demonstration of technical limitation that prevents measurement of
waste gas at inlet of WHRB

PROJECT DESIGN DOCUMENT FORM (CDM PDD) - Version 03.1.
CDM – Executive Board
page 30
The flow meter will be calibrated according to temperature and pressure
of waste gas at monitoring point.
QA/QC procedures to
be applied:
Any comment: All data will be kept for a period 2 years after the end of the crediting period.
Data / Parameter: STWHR,y
Data unit: kcal/kg
Description: Energy content of the steam generated in waste heat recovery boiler fed to
turbine via common steam header
Source of data to be
used:
Steam Tables
Value of data applied
for the purpose of
calculating expected
emission reductions in
section B.5
531,244,560
Description of
measurement methods
and procedures to be
applied:
As per the methodology this has to be recorded as kcal/kg which is total energy.
This has been calculated by multiplying energy in steam (using steam tables for
temperature and pressure of steam) and the measured amount of steam from the
WHRB.
QA/QC procedures to
be applied:
Not applicable as per the methodology
Any comment: All data will be kept for a period 2 years after the end of the crediting period.
Data / Parameter: STother,y
Data unit: kcal/kg
Description: Energy content of the steam generated in other boilers fed to turbine via common
steam header
Source of data to be
used:
Steam Tables
Value of data applied
for the purpose of
calculating expected
emission reductions in
section B.5
627,581,520
Description of
measurement methods
and procedures to be
applied:
As per the methodology this has to be recorded as kcal/kg which is total energy.
This has been calculated by multiplying energy in steam (using steam tables for
temperature and pressure of steam) and the measured amount of steam from the
AFBC.
QA/QC procedures to
be applied:
Not applicable as per the methodology
Any comment: All data will be kept for a period 2 years after the end of the crediting period.
Data / Parameter: Tempwg
Data unit: °Celsius

PROJECT DESIGN DOCUMENT FORM (CDM PDD) - Version 03.1.
CDM – Executive Board
page 31
Description: Temperature of steam from waste heat recovery boiler
Source of data to be
used:
Plant records
Value of data applied
for the purpose of
calculating expected
emission reductions in
section B.5
490
Description of
measurement methods
and procedures to be
applied:
The temperature of the steam will be monitored at the outlet of waste heat
recovery boiler. The DCS system installed at the plant will directly measure the
temperature of steam from WHRB boiler and readings taken hourly manually.
This will be collated at the end of the 8 hour shift and then at the end of the day.
QA/QC procedures to
be applied:
--
Any comment: Recorded to calculate energy in steam from waste gas
Data / Parameter: Pressure wg
Data unit: kg/cm2
Description: Pressure of steam from waste heat recovery boiler
Source of data to be
used:
Plant records
Value of data applied
for the purpose of
calculating expected
emission reductions in
section B.5
60
Description of
measurement methods
and procedures to be
applied:
The DCS system installed at the plant will directly measure the pressure of steam
at the outlet of WHRB boiler and readings taken hourly manually. This will be
collated at the end of the 8 hour shift and then at the end of the day.
QA/QC procedures to
be applied:
--
Any comment: Recorded to calculate energy in steam from waste gas
Data / Parameter: QuantityWG
Data unit: tonnes per hour
Description: Quantity of steam from waste heat recovery boiler
Source of data to be
used:
Plant records
Value of data applied
for the purpose of
calculating expected
emission reductions in
section B.5
38
Description of
measurement methods
The waste heat recovery boiler will have a steam flow meter at the steam
pipeline before turbine at the main powerhouse building. The DCS system

PROJECT DESIGN DOCUMENT FORM (CDM PDD) - Version 03.1.
CDM – Executive Board
page 32
and procedures to be
applied:
installed at the plant will directly measure the steam flow from the WHRB.
QA/QC procedures to
be applied:
--
Any comment: --
Data / Parameter: Temp other
Data unit: °Celsius
Description: Temperature of steam from other boiler
Source of data to be
used:
Plant records
Value of data applied
for the purpose of
calculating expected
emission reductions in
section B.5
490
Description of
measurement methods
and procedures to be
applied:
The DCS system installed at the plant will directly measure the temperature of
steam from other boiler and readings taken hourly manually. This will be
collated at the end of the 8 hour shift and then at the end of the day.
QA/QC procedures to
be applied:
--
Any comment: Recorded to calculate energy in steam from other boiler
Data / Parameter: Pressure other
Data unit: kg/cm2
Description: Pressure of steam from other boiler
Source of data to be
used:
Plant records
Value of data applied
for the purpose of
calculating expected
emission reductions in
section B.5
66
Description of
measurement methods
and procedures to be
applied:
The DCS system installed at the plant will directly measure the pressure of steam
at the outlet of other boiler and readings taken hourly manually. This will be
collated at the end of the 8 hour shift and then at the end of the day
QA/QC procedures to
be applied:
--
Any comment: Recorded to calculate energy in steam from other boiler
Data / Parameter: Quantityother
Data unit: tonnes per hour
Description: Quantity of steam from other boiler
Source of data to be Plant records
PROJECT DESIGN DOCUMENT FORM (CDM PDD) - Version 03.1.
CDM – Executive Board
page 33
used:
Value of data applied
for the purpose of
calculating expected
emission reductions in
section B.5
45
Description of
measurement methods
and procedures to be
applied:
The AFBC boiler will have a steam flow meter at the steam pipeline before
turbine at the main powerhouse building. The DCS system installed at the plant
will directly measure the steam flow from the AFBC boiler.
QA/QC procedures to
be applied:
--
Any comment: To calculate energy in steam from other boiler. The boiler efficiency has been
taken as 85%.
B.7.2 Description of the monitoring plan:
>>
The sponge iron plant which supplies the waste gas and the power plant both are ISO 9001:2000
accredited. The following procedures will be implemented for the monitoring of the project activity in
order to provide a calculation of the Emission Reductions (ERs) arising from the project activity.
As highlighted in section B.6.1 of the PDD the quantity of emission reductions is given by the product of
the total electrical power generation and the grid carbon dioxide emission factor taking into account the
capping factor and the apportioning factor.
Metering is provided for all the data within the monitoring plan and regular calibration of the meters will
take place. The energy meters will be checked and calibrated on an annual basis and calibration
certificated will be provided to the DOE during verification. The transmitters will be calibrated annually,
however it should be noted that these do not have an accuracy class. The calibrating equipments used
conform to national standards and if percentage error is not within permissible limits it is shown as such
and necessary steps would be taken to replace the meters.
The meter readings will be taken by the shift operator in charge and the DCS operators and signed off
daily and monthly by the power plant manager. Once this data is signed off it will be transmitted to
Agrinergy to form the basis of monthly calculations of the emission reductions.
The monitoring of the temperature, pressure and flow of the steam used to calculate the parameters STwg
and STother will be taken from the DCS system on site. The DCS will convert the flow of steam to a
standard temperature and pressure, adjusted flow, and therefore from this adjusted flow the calculation of
STwg and STother will be relatively straightforward. The actual flow and temperature and pressure of the
steam sources will be continuously recorded (every second) by the DCS but records of this data will be
maintained on a hourly, shift wise and monthly basis. The calculation of the energy content of the
different steam sources will be performed monthly.
An internal audit will be carried out at the project site annually wherein it will be verified that the data is
being monitored and compiled in accordance with the PDD. Based on audits, corrective actions will be
taken to coordinate for further effectiveness.

PROJECT DESIGN DOCUMENT FORM (CDM PDD) - Version 03.1.
CDM – Executive Board
page 34
All monitored data will be kept for a minimum of two years after the end of the crediting period and will
be archived electronically. 100% of the data will be monitored.
B.8 Date of completion of the application of the baseline study and monitoring methodology
and the name of the responsible person(s)/entity(ies)
>>
19/01/2008
Bhawna Singh
Agrinergy Consultancy Pvt Ltd
The entity is not a project participant
Mr. Anil Kumar Aggarwal, API Ispat & Powertech Pvt Ltd, project participant, contact details as listed
in Annex I.

PROJECT DESIGN DOCUMENT FORM (CDM PDD) - Version 03.1.
CDM – Executive Board
page 35
SECTION C. Duration of the project activity / crediting period
C.1 Duration of the project activity:
C.1.1. Starting date of the project activity:
>>
02/02/2005
This refers to the date of turbine generator purchase order.
C.1.2. Expected operational lifetime of the project activity:
>>
20y-00m
C.2 Choice of the crediting period and related information:
A fixed ten year crediting period has been chosen.
C.2.1. Renewable crediting period
C.2.1.1. Starting date of the first crediting period:
>>
This section has been left blank on purpose.
C.2.1.2. Length of the first crediting period:
>>
This section has been left blank on purpose.
C.2.2. Fixed crediting period:
C.2.2.1. Starting date:
>>
01/10/2009 or Date of registration (whichever is later)
C.2.2.2. Length:
>>
10y-00m
PROJECT DESIGN DOCUMENT FORM (CDM PDD) - Version 03.1.
CDM – Executive Board
page 36
SECTION D. Environmental impacts
>>
D.1. Documentation on the analysis of the environmental impacts, including transboundary
impacts:
>>
In relation to the baseline scenario no negative environmental impacts will arise as a result of the project
activity. The baseline scenario involves the combustion of coal and other fossil fuels for the generation of
grid based power. The baseline scenario therefore generates carbon dioxide, NOx, SOx and ash.
The positive environmental impacts arising from the project activity are therefore:
A reduction in carbon dioxide emissions from the replacement of fossil fuels which would be
generated under the baseline scenario
A reduction in the emissions of other harmful gases (NOx and SOx) that arise from the
combustion of fossil fuels in power generation
The factory will meet all environmental legislations as set out by the State Pollution Control Board and
there will be on-going monitoring of the plant by this state body. A “Consent to Operate” will be taken
by the State Pollution Control Board for the project activity regularly.
The plant will install an electrostatic precipitator at the exit of the boiler as per the consents from
Chhattisgarh Environment Conservation Board (CECB) to limit suspended particulate matter in the flue
gases to less than 100 mg/Nm3. There will also be investment in waste water systems to treat the water
de-mineralization plant effluent and also the blow down water from the cooling tower and steam
generator.
Monitoring of air and water quality will be undertaken on a regular basis as per the State Pollution
Control Board guidelines after the plant is commissioned. The testing of the environmental parameters
will be undertaken by an independent third party.
An Environmental Impact Assessment (EIA) is not required for the power plant but the project owners
have voluntarily undertaken an EIA study from Anacon Laboratories Pvt Ltd, Nagpur which shows no
negative environmental impacts due to the project activity.
D.2. If environmental impacts are considered significant by the project participants or the host
Party, please provide conclusions and all references to support documentation of an environmental
impact assessment undertaken in accordance with the procedures as required by the host Party:
>>
The environmental impacts are not considered significant.

PROJECT DESIGN DOCUMENT FORM (CDM PDD) - Version 03.1.
CDM – Executive Board
page 37
SECTION E. Stakeholders’ comments
>>
E.1. Brief description how comments by local stakeholders have been invited and compiled:
>>
The local stakeholder review has been conducted on two levels:
A local stakeholder review was conducted by consulting the Gram Panchayat of Siltara on 09th
December 2004. The meeting was attended by the village heads of the panchayat and a
unanimous decision was taken to provide a no objection certificate to the project activity19
.
Another no objection certificate was issued by the panchayat on 23rd
October 2006 to allow the
company to undertake the project as a CDM project activity.
A national stakeholder review is done through the approval by the Ministry of Environment and Forests
(the Indian DNA).
Other stakeholders that have been notified of the project, through consents and approvals required for the
investment, are the Chhattisgarh State Electricity Board through the Power Purchase Agreement and the
State Boiler and State Electrical Inspectorate which have visited the site to approve the plans and
construction.
E.2. Summary of the comments received:
>>
No comments have been received on the project to date.
E.3. Report on how due account was taken of any comments received:
>>
No comments were received hence no action has been taken.
19 A copy of the NOC, minutes of meeting and list of attendees have been provided to the validator during site visit.

PROJECT DESIGN DOCUMENT FORM (CDM PDD) - Version 03.1.
CDM – Executive Board
page 38
Annex 1
CONTACT INFORMATION ON PARTICIPANTS IN THE PROJECT ACTIVITY
Organization: API Ispat & Powertech Pvt Ltd
Street/P.O.Box: Main Rohtak Road
Building: D-15, Udyog Nagar
City: New Delhi
State/Region: New Delhi
Postfix/ZIP: 110041
Country: India
Telephone: 91-11-25471765-66
FAX: 91-11-25479387
E-Mail: [email protected]
URL:
Represented by:
Title: Director
Salutation: Mr.
Last Name: Aggarwal
Middle Name: Kumar
First Name: Anil
Department:
Mobile:
Direct FAX: 91-11-25479387
Direct tel: 91-11-25471765-66
Personal E-Mail: --

PROJECT DESIGN DOCUMENT FORM (CDM PDD) - Version 03.1.
CDM – Executive Board
page 39
Organization: Agrinergy Pte Ltd
Street/P.O.Box: 10 Hoe Chiang Road
Building: #08-04 Keppel Towers
City: Singapore
State/Region:
Postfix/ZIP: 089315
Country: Singapore
Telephone: +65 6592 0400
FAX: +65 6347 6181
E-Mail:
URL: www.agrinergy.com
Represented by:
Title: Managing Director
Salutation: Mr
Last Name: Atkinson
Middle Name:
First Name: Ben
Department:
Mobile:
Direct FAX: +65 6592 0401
Direct tel: +65 6592 0398
Personal E-Mail: [email protected]

PROJECT DESIGN DOCUMENT FORM (CDM PDD) - Version 03.1.
CDM – Executive Board
page 40
Annex 2
INFORMATION REGARDING PUBLIC FUNDING
The project activity has not received any public funding.

PROJECT DESIGN DOCUMENT FORM (CDM PDD) - Version 03.1.
CDM – Executive Board
page 41
Annex 3
BASELINE INFORMATION
We have adopted the approach specified in the tool to calculate the CO2 emission coefficient of the
electricity grid. The average of approximating operating margin and build margin has been used for
calculation of the baseline. The grid emission factor has been obtained from the Central Electricity
Authority, CO2 baseline database, version 03 and is fixed ex-ante at 0.79tCO2/MWh and is calculated as
shown in table below:
Calculation of the combined margin
tCO2/MWh
Operating Margin 0.99
Build Margin 0.59
Combined Margin 0.79

PROJECT DESIGN DOCUMENT FORM (CDM PDD) - Version 03.1.
CDM – Executive Board
page 42
Annex 4
MONITORING INFORMATION
In addition to monitoring plan laid down in Section B.7.2, the monitoring of the project activity will be
the responsibility of power plant manager. The monitored data will be reported through him to Agrinergy
on a monthly basis for the calculation and estimation of emission reductions. This data will be checked
against initial estimates and a summary report will be provided quarterly by Agrinergy. If the project is
not performing as expected or if there are any negative impacts on the volume of emission reductions
obtained, on the basis of the monthly data being monitored, a report will be sent to API Ispat &
Powertech Pvt Ltd outlining where the project is deviating in its generation of emission reductions and
the immediate measures which need to be undertaken to maintain the expected generation of emission
reductions from the operation of this project. Should there be significant changes to the set-up or
operation of the plant, these will be notified to Agrinergy and amendments to the PDD will be requested
through a DOE.
At the end of each year of operation Agrinergy will prepare a monitoring report that will be submitted to
a DOE for verification, however visits to the site may be undertaken by Agrinergy during the first year to
check that the procedures and monitoring plan are being followed. All data will be kept for a minimum of
2 years following issuance of certified emission reductions or the end of the crediting period, whichever
is later, and the storage of this data will be the responsibility of the project developers.

PROJECT DESIGN DOCUMENT FORM (CDM PDD) - Version 03.1.
CDM – Executive Board
page 43
Appendix 1
WHR power projects in Chhattisgarh state as per UNFCCC website:
S. No. Company Name
Kiln Capacity
lacs(tpdx300da
ys) District UN website link
1
Abhijeet Infrastructure
Limited 1.05 Raipur
http://cdm.unfccc.int/Projects/
Validation/DB/575321F3V2J3
1FK9NQT8YCMWKSKAX3/
view.html
2
Arti Sponge & Power Pvt.
Ltd. 0.60 Raipur
http://cdm.unfccc.int/Projects/
Validation/DB/GJLUXNB9N
TTDLKGWWR7ZGE0GMQS
T69/view.html
3 Corporate Ispat Alloys Ltd. 1.50 Raipur
http://cdm.unfccc.int/Projects/
Validation/DB/H0KUA7IOZU
VQCNUEWMFBOU2Z8FIQP
D/view.html
4
Crest Steel & Power
Pvt. Ltd. 1.05 Durg
http://cdm.unfccc.int/Projects/
Validation/DB/8BT6LBKZHD
5UJ1UH3P9508VCIIAW6O/v
iew.html
5
Drolia Electro Steel Pvt.
Ltd. 0.60 Raipur
http://cdm.unfccc.int/Projects/
Validation/DB/O05FAHI4CX
ZMS1SOENCSKKFW54ER1
D/view.html
6 G.R. Sponge & Power Ltd. 0.60 Raipur
http://cdm.unfccc.int/Projects/
DB/DNV-
CUK1178352647.53/view
7
Godawari Power & Ispat
Ltd. 4.95 Raipur
http://cdm.unfccc.int/Projects/
DB/SGS-
UKL1139564002.3/view
8 Hi-Tech Power& Steel Ltd. 0.60 Raipur
http://cdm.unfccc.int/Projects/
Validation/DB/FM79CDWNJ
UJC2WUUFG34AW54KCNC
QF/view.html
9 Ind Synergy Ltd. 2.10 Raigarh
http://cdm.unfccc.int/Projects/
DB/SGS-
UKL1168434870.74/view
10
Mahendra Sponge &
Power Pvt. Ltd. 0.60 Raipur
http://cdm.unfccc.int/Projects/
DB/DNV-CUK1179810034.49
11
Monnet Ispat & Energy
Ltd. 3.00 Raigarh
http://cdm.unfccc.int/Projects/
DB/SGS-
UKL1146048256.38/view
12 MSP Steel & Power 2.00 Raigarh http://cdm.unfccc.int/Projects/
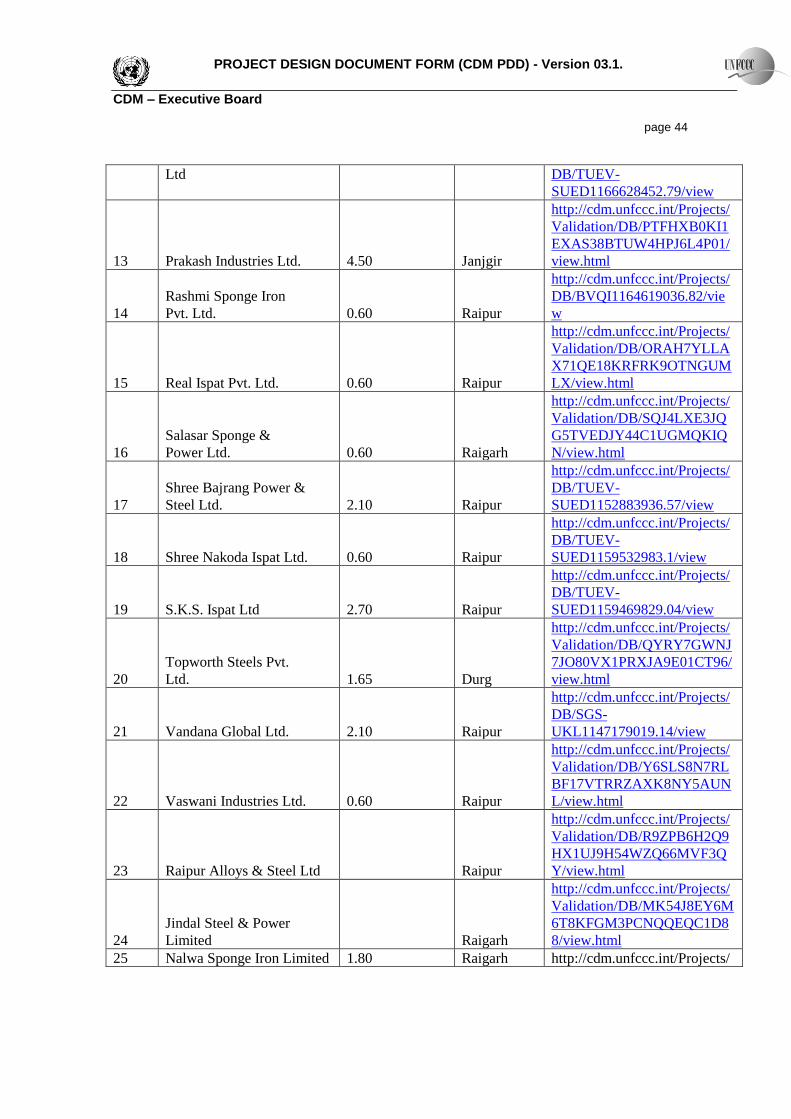
PROJECT DESIGN DOCUMENT FORM (CDM PDD) - Version 03.1.
CDM – Executive Board
page 44
Ltd DB/TUEV-
SUED1166628452.79/view
13 Prakash Industries Ltd. 4.50 Janjgir
http://cdm.unfccc.int/Projects/
Validation/DB/PTFHXB0KI1
EXAS38BTUW4HPJ6L4P01/
view.html
14
Rashmi Sponge Iron
Pvt. Ltd. 0.60 Raipur
http://cdm.unfccc.int/Projects/
DB/BVQI1164619036.82/vie
w
15 Real Ispat Pvt. Ltd. 0.60 Raipur
http://cdm.unfccc.int/Projects/
Validation/DB/ORAH7YLLA
X71QE18KRFRK9OTNGUM
LX/view.html
16
Salasar Sponge &
Power Ltd. 0.60 Raigarh
http://cdm.unfccc.int/Projects/
Validation/DB/SQJ4LXE3JQ
G5TVEDJY44C1UGMQKIQ
N/view.html
17
Shree Bajrang Power &
Steel Ltd. 2.10 Raipur
http://cdm.unfccc.int/Projects/
DB/TUEV-
SUED1152883936.57/view
18 Shree Nakoda Ispat Ltd. 0.60 Raipur
http://cdm.unfccc.int/Projects/
DB/TUEV-
SUED1159532983.1/view
19 S.K.S. Ispat Ltd 2.70 Raipur
http://cdm.unfccc.int/Projects/
DB/TUEV-
SUED1159469829.04/view
20
Topworth Steels Pvt.
Ltd. 1.65 Durg
http://cdm.unfccc.int/Projects/
Validation/DB/QYRY7GWNJ
7JO80VX1PRXJA9E01CT96/
view.html
21 Vandana Global Ltd. 2.10 Raipur
http://cdm.unfccc.int/Projects/
DB/SGS-
UKL1147179019.14/view
22 Vaswani Industries Ltd. 0.60 Raipur
http://cdm.unfccc.int/Projects/
Validation/DB/Y6SLS8N7RL
BF17VTRRZAXK8NY5AUN
L/view.html
23 Raipur Alloys & Steel Ltd Raipur
http://cdm.unfccc.int/Projects/
Validation/DB/R9ZPB6H2Q9
HX1UJ9H54WZQ66MVF3Q
Y/view.html
24
Jindal Steel & Power
Limited Raigarh
http://cdm.unfccc.int/Projects/
Validation/DB/MK54J8EY6M
6T8KFGM3PCNQQEQC1D8
8/view.html
25 Nalwa Sponge Iron Limited 1.80 Raigarh http://cdm.unfccc.int/Projects/

PROJECT DESIGN DOCUMENT FORM (CDM PDD) - Version 03.1.
CDM – Executive Board
page 45
Validation/DB/57M0ZKVMB
ZL6T2YBNJQ9KMGD1IOPC
T/view.html
- - - - -