clean development mechanism project opportunities in ... · pdf fileclean development...
TRANSCRIPT

Clean Development Mechanism Project Opportunities in Bangladesh Pre-Feasibility Report on a Vegetable Cold Storage Cogeneration CDM Project Chemical Engineering Department Petroleum and Mineral Resources Engineering Department Bangladesh University of Engineering and Technology Dhaka, Bangladesh E-mail: [email protected]
October 2002
Pre-Feasibility Report on a Vegetable Cold Storage Cogeneration CDM Project — October 2002
Contents 1. Project Description..................................................................................................................................1
Baseline and Mitigation Technologies ......................................................................................................1 Project Definition ......................................................................................................................................4 Project Location ........................................................................................................................................6 Project Purpose..........................................................................................................................................7 Project Type ..............................................................................................................................................8 How GHG Emissions Will Be Reduced by the Project ............................................................................8 Why This Project Would Not Otherwise Go Ahead and Its Improvement on Current Technologies or Practices (Additionality)............................................................................................................................8 How the Technology Will Be Transferred ................................................................................................8 Project Life and Credit Period...................................................................................................................9 Contribution to Sustainable Development and Environmental and Social Benefits (Including Comparison with Host Country Criteria if They Exist) ............................................................................9 The Recipient of These Benefits ...............................................................................................................9 Adverse Environmental or Social Impacts ..............................................................................................10
2. Partner Industry/NGO in Host Country.............................................................................................10 3. Project Scope/Boundary .......................................................................................................................10 4. Emissions Baseline.................................................................................................................................11
General ....................................................................................................................................................11 Load Curve..............................................................................................................................................11 Existing and Planned Power Plants .........................................................................................................14 Carbon Dioxide Emission Coefficient of the Grid ..................................................................................16 Dispatch Rule ..........................................................................................................................................16
5. Emissions Estimation ............................................................................................................................17 6. Monitoring and Verification Approach...............................................................................................20 7. Project Components and Costs ............................................................................................................21 8. Investment Plan .....................................................................................................................................24 9. Financial and Credit Analysis ..............................................................................................................24 10. Risk Assessment/Sensitivity Analysis ................................................................................................26 11. Summary of Results ............................................................................................................................27
Page i
Pre-Feasibility Report on a Vegetable Cold Storage Cogeneration CDM Project — October 2002
Preface The Pembina Institute for Appropriate Development and the Tata Energy Research Institute are exploring the application of the Clean Development Mechanism (CDM) in Asia. This multi-year project is being undertaken in collaboration with:
The Bangladesh University of Engineering and Technology in Dhaka, Bangladesh; • • •
The Global Climate Change Institute at Tsinghua University in Beijing, China; and The Centre for Research on Material and Energy at the Technology University in Bandung, Indonesia.
The following publications have been produced by the project partners:
• Canada’s Potential Role in the Clean Development Mechanism (2000) • Negotiating the CDM: A North–South Perspective (2000) • Reports on CDM activities and potential CDM project opportunities in Bangladesh,
China, India and Indonesia (2001) • A User’s Guide to the CDM (2002) • Reports on individual CDM project opportunities in Bangladesh, China, India and
Indonesia (2001) For more information on this project visit the following Web sites:
• www.teriin.org • www.pembina.org/international_eco3.asp
The project is being undertaken with the financial support of the Government of Canada provided through the Canadian International Development Agency (CIDA), online at www.acdi-cida.gc.ca, and is being implemented in collaboration with the International Institute for Sustainable Development (IISD), online at www.iisd.ca. The following report was produced by the Bangladesh University of Engineering and Technology. The views expressed in this report are entirely those of the authors.
Page ii

Pre-Feasibility Report on a Vegetable Cold Storage Cogeneration CDM Project — October 2002
1. Project Description
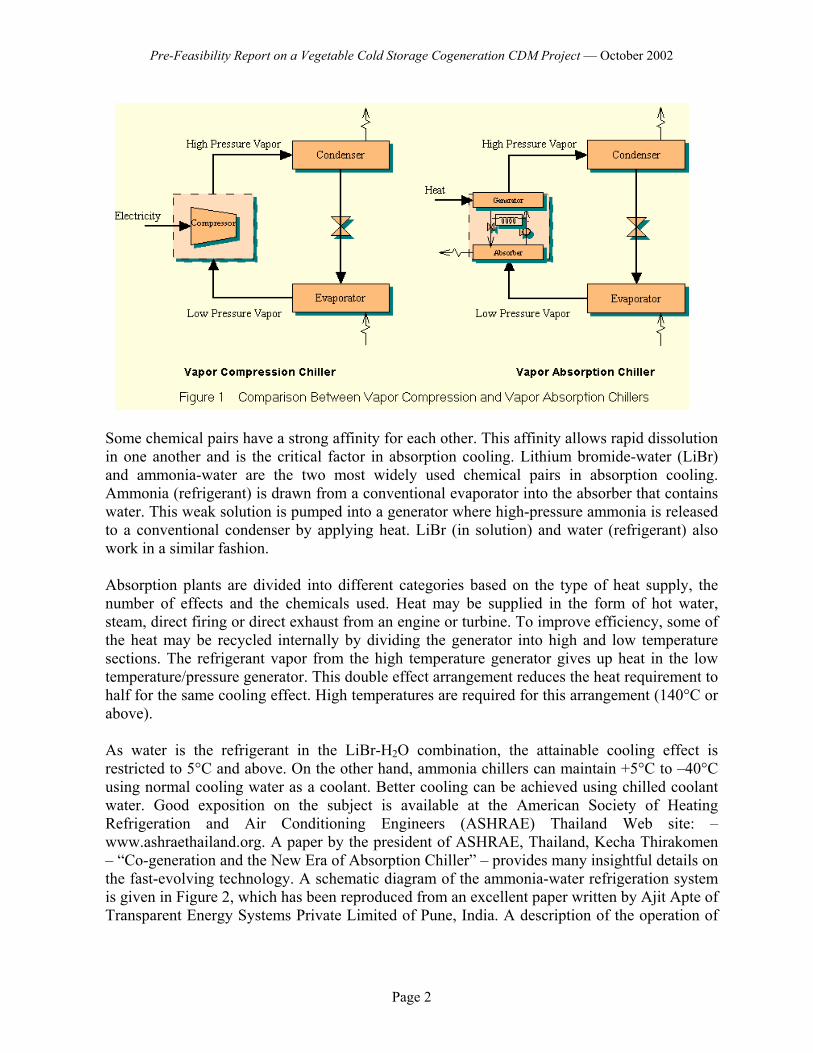
Baseline and Mitigation Technologies Bangladesh is a tropical country with daytime temperatures between 18oC and 34oC. Vegetables, spices, fruits, etc. grown seasonally require preservation in refrigerated warehouses (known in Bangladesh as “cold storages”) for consumption in the off-season. The unreliable supply of grid electricity is a major concern for cold storages. As a result of this, all cold storages have standby generators. Power outages become more frequent in the summer, when cold storages have to operate at their peak load, and every year the owners and clients of cold storages suffer financial losses. Owners of cold storages are actively seeking a source of electricity that is both reliable and economic. Cogeneration, which generates electricity on-site and utilizes the waste heat to run vapor absorption refrigeration, can conveniently partially replace the vapor compression refrigeration equipment, and is a very good alternative to the present unreliable source of power from the national grid. Vapor compression refrigeration systems are used in all cold storages in Bangladesh. A low initial cost, reliable and easy-to-use technology and availability in the widest range of sizes have made these exceptionally popular. The vast majority of chillers around the world also use electric vapor compression systems. Due to the widespread use, and hence standardization, of this technology, consumers can choose from a wide variety of sizes and manufacturers. The three most common types are centrifugal, reciprocating and screw compressors. Most of the compressors used in Bangladesh are of the reciprocating type. The working principle of all refrigeration systems is based on the physical properties of liquid – when it boils, it does so by absorbing heat from its surrounding (latent heat of vaporization). Conversely, it gives up heat when it condenses. The boiling and condensing temperatures are directly proportional to the pressure. All cold storages in Bangladesh use ammonia as the refrigerant. In vapor compression chillers (VCCs), the refrigerant evaporates at low pressure, creating the cooling effect. The vapor is compressed to a high pressure and gives up all of the heat collected during evaporation while condensing in a cooling tower. In vapor absorption chillers (VACs), the condenser and evaporator are exactly the same. An absorber and generator replace the compressor in raising the refrigerant pressure.
Page 1
Pre-Feasibility Report on a Vegetable Cold Storage Cogeneration CDM Project — October 2002
Some chemical pairs have a strong affinity for each other. This affinity allows rapid dissolution in one another and is the critical factor in absorption cooling. Lithium bromide-water (LiBr) and ammonia-water are the two most widely used chemical pairs in absorption cooling. Ammonia (refrigerant) is drawn from a conventional evaporator into the absorber that contains water. This weak solution is pumped into a generator where high-pressure ammonia is released to a conventional condenser by applying heat. LiBr (in solution) and water (refrigerant) also work in a similar fashion. Absorption plants are divided into different categories based on the type of heat supply, the number of effects and the chemicals used. Heat may be supplied in the form of hot water, steam, direct firing or direct exhaust from an engine or turbine. To improve efficiency, some of the heat may be recycled internally by dividing the generator into high and low temperature sections. The refrigerant vapor from the high temperature generator gives up heat in the low temperature/pressure generator. This double effect arrangement reduces the heat requirement to half for the same cooling effect. High temperatures are required for this arrangement (140°C or above). As water is the refrigerant in the LiBr-H2O combination, the attainable cooling effect is restricted to 5°C and above. On the other hand, ammonia chillers can maintain +5°C to –40°C using normal cooling water as a coolant. Better cooling can be achieved using chilled coolant water. Good exposition on the subject is available at the American Society of Heating Refrigeration and Air Conditioning Engineers (ASHRAE) Thailand Web site: – www.ashraethailand.org. A paper by the president of ASHRAE, Thailand, Kecha Thirakomen – “Co-generation and the New Era of Absorption Chiller” – provides many insightful details on the fast-evolving technology. A schematic diagram of the ammonia-water refrigeration system is given in Figure 2, which has been reproduced from an excellent paper written by Ajit Apte of Transparent Energy Systems Private Limited of Pune, India. A description of the operation of
Page 2
Pre-Feasibility Report on a Vegetable Cold Storage Cogeneration CDM Project — October 2002
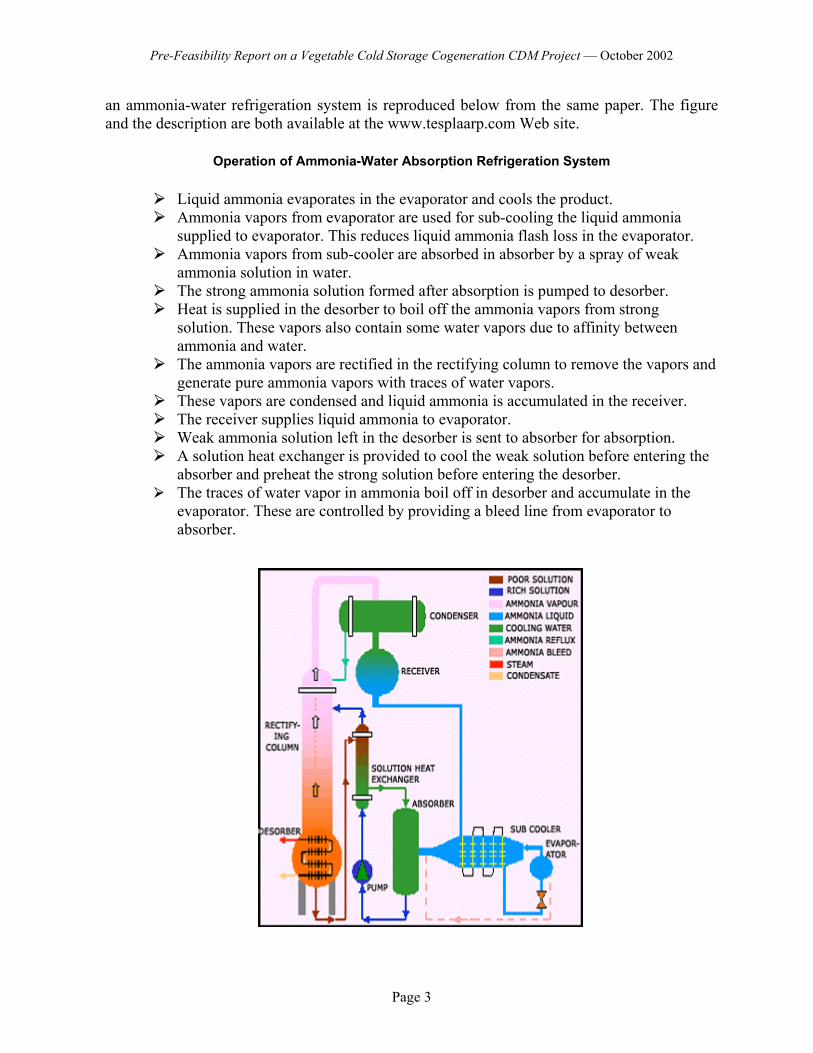
an ammonia-water refrigeration system is reproduced below from the same paper. The figure and the description are both available at the www.tesplaarp.com Web site.
Operation of Ammonia-Water Absorption Refrigeration System
Liquid ammonia evaporates in the evaporator and cools the product. Ammonia vapors from evaporator are used for sub-cooling the liquid ammonia
supplied to evaporator. This reduces liquid ammonia flash loss in the evaporator. Ammonia vapors from sub-cooler are absorbed in absorber by a spray of weak
ammonia solution in water. The strong ammonia solution formed after absorption is pumped to desorber. Heat is supplied in the desorber to boil off the ammonia vapors from strong
solution. These vapors also contain some water vapors due to affinity between ammonia and water. The ammonia vapors are rectified in the rectifying column to remove the vapors and
generate pure ammonia vapors with traces of water vapors. These vapors are condensed and liquid ammonia is accumulated in the receiver. The receiver supplies liquid ammonia to evaporator. Weak ammonia solution left in the desorber is sent to absorber for absorption. A solution heat exchanger is provided to cool the weak solution before entering the
absorber and preheat the strong solution before entering the desorber. The traces of water vapor in ammonia boil off in desorber and accumulate in the
evaporator. These are controlled by providing a bleed line from evaporator to absorber.
Page 3
Pre-Feasibility Report on a Vegetable Cold Storage Cogeneration CDM Project — October 2002
Source: Ajit Apte of Transparent Energy Systems Private Limited, Pune, India.
Figure 2 Schematic Diagram of an Ammonia-Water Absorption Refrigeration System
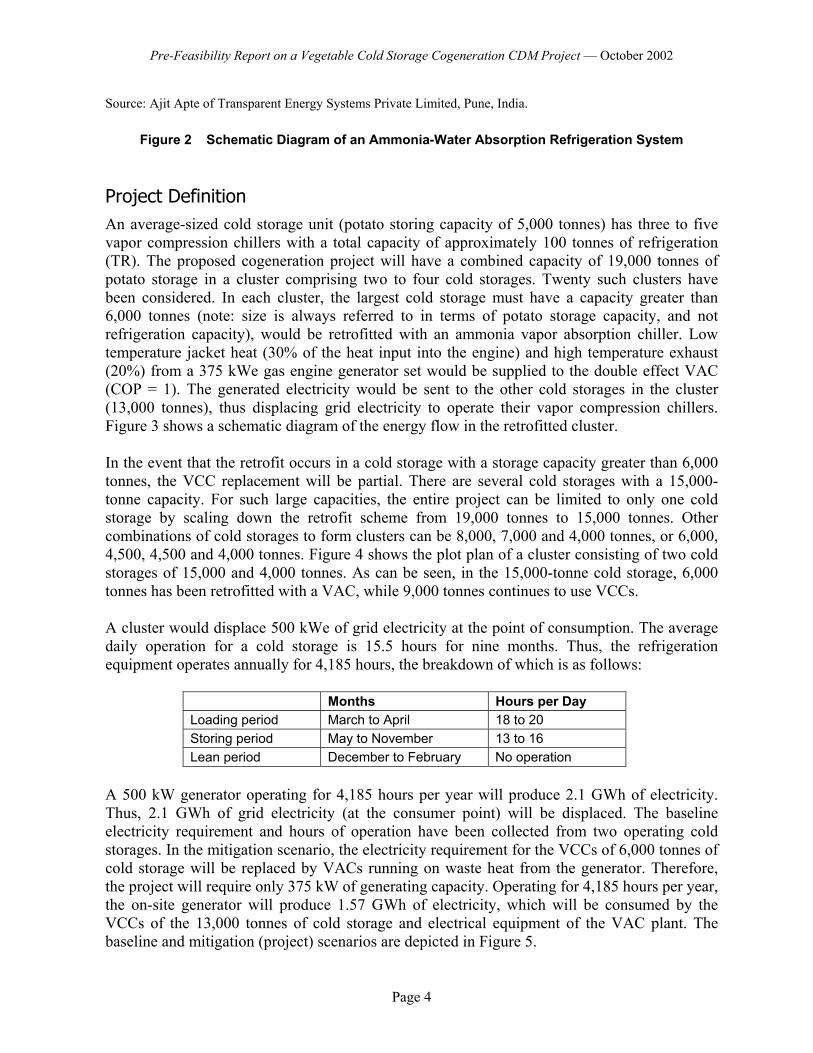
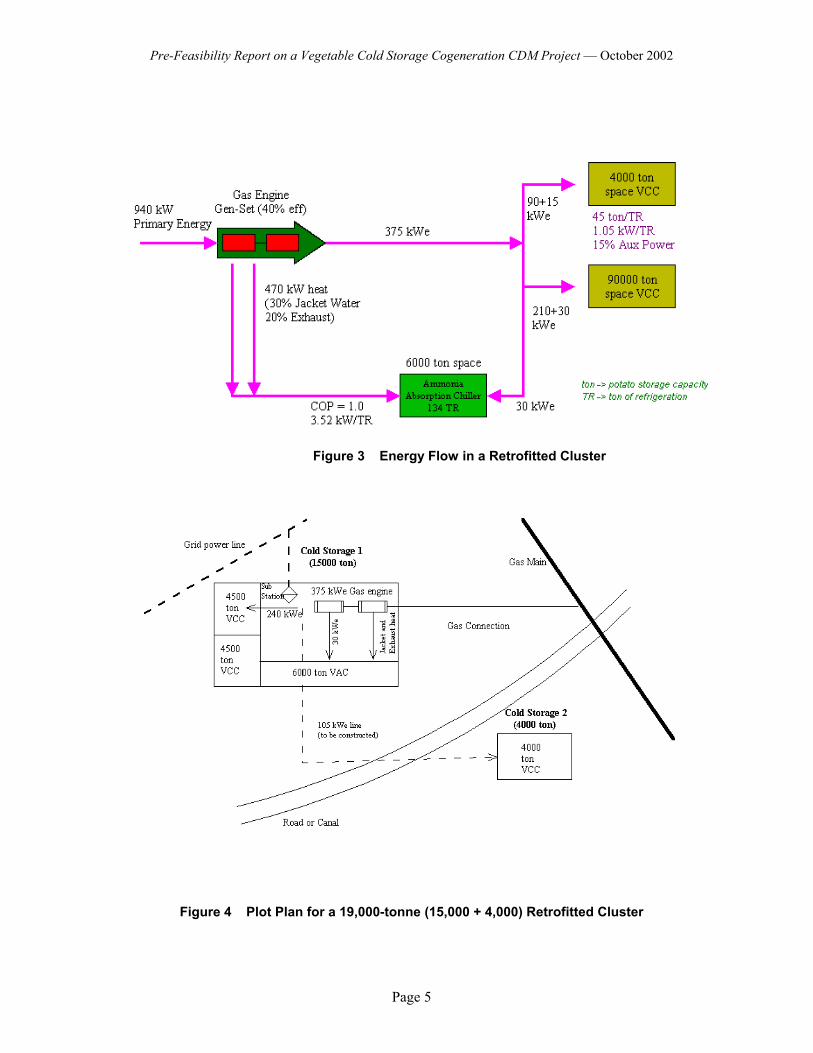
Project Definition An average-sized cold storage unit (potato storing capacity of 5,000 tonnes) has three to five vapor compression chillers with a total capacity of approximately 100 tonnes of refrigeration (TR). The proposed cogeneration project will have a combined capacity of 19,000 tonnes of potato storage in a cluster comprising two to four cold storages. Twenty such clusters have been considered. In each cluster, the largest cold storage must have a capacity greater than 6,000 tonnes (note: size is always referred to in terms of potato storage capacity, and not refrigeration capacity), would be retrofitted with an ammonia vapor absorption chiller. Low temperature jacket heat (30% of the heat input into the engine) and high temperature exhaust (20%) from a 375 kWe gas engine generator set would be supplied to the double effect VAC (COP = 1). The generated electricity would be sent to the other cold storages in the cluster (13,000 tonnes), thus displacing grid electricity to operate their vapor compression chillers. Figure 3 shows a schematic diagram of the energy flow in the retrofitted cluster. In the event that the retrofit occurs in a cold storage with a storage capacity greater than 6,000 tonnes, the VCC replacement will be partial. There are several cold storages with a 15,000-tonne capacity. For such large capacities, the entire project can be limited to only one cold storage by scaling down the retrofit scheme from 19,000 tonnes to 15,000 tonnes. Other combinations of cold storages to form clusters can be 8,000, 7,000 and 4,000 tonnes, or 6,000, 4,500, 4,500 and 4,000 tonnes. Figure 4 shows the plot plan of a cluster consisting of two cold storages of 15,000 and 4,000 tonnes. As can be seen, in the 15,000-tonne cold storage, 6,000 tonnes has been retrofitted with a VAC, while 9,000 tonnes continues to use VCCs. A cluster would displace 500 kWe of grid electricity at the point of consumption. The average daily operation for a cold storage is 15.5 hours for nine months. Thus, the refrigeration equipment operates annually for 4,185 hours, the breakdown of which is as follows:
Months Hours per Day Loading period March to April 18 to 20 Storing period May to November 13 to 16 Lean period December to February No operation
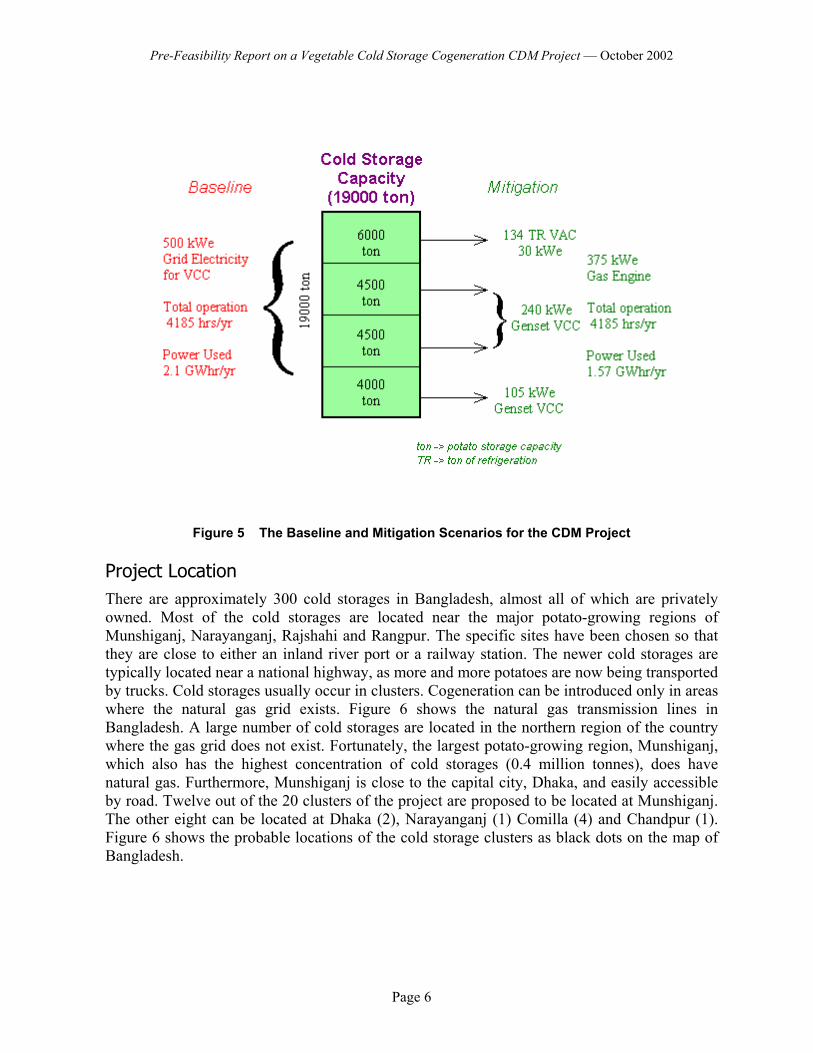
A 500 kW generator operating for 4,185 hours per year will produce 2.1 GWh of electricity. Thus, 2.1 GWh of grid electricity (at the consumer point) will be displaced. The baseline electricity requirement and hours of operation have been collected from two operating cold storages. In the mitigation scenario, the electricity requirement for the VCCs of 6,000 tonnes of cold storage will be replaced by VACs running on waste heat from the generator. Therefore, the project will require only 375 kW of generating capacity. Operating for 4,185 hours per year, the on-site generator will produce 1.57 GWh of electricity, which will be consumed by the VCCs of the 13,000 tonnes of cold storage and electrical equipment of the VAC plant. The baseline and mitigation (project) scenarios are depicted in Figure 5.
Page 4
Pre-Feasibility Report on a Vegetable Cold Storage Cogeneration CDM Project — October 2002
Figure 3 Energy Flow in a Retrofitted Cluster
Figure 4 Plot Plan for a 19,000-tonne (15,000 + 4,000) Retrofitted Cluster
Page 5
Pre-Feasibility Report on a Vegetable Cold Storage Cogeneration CDM Project — October 2002
Figure 5 The Baseline and Mitigation Scenarios for the CDM Project
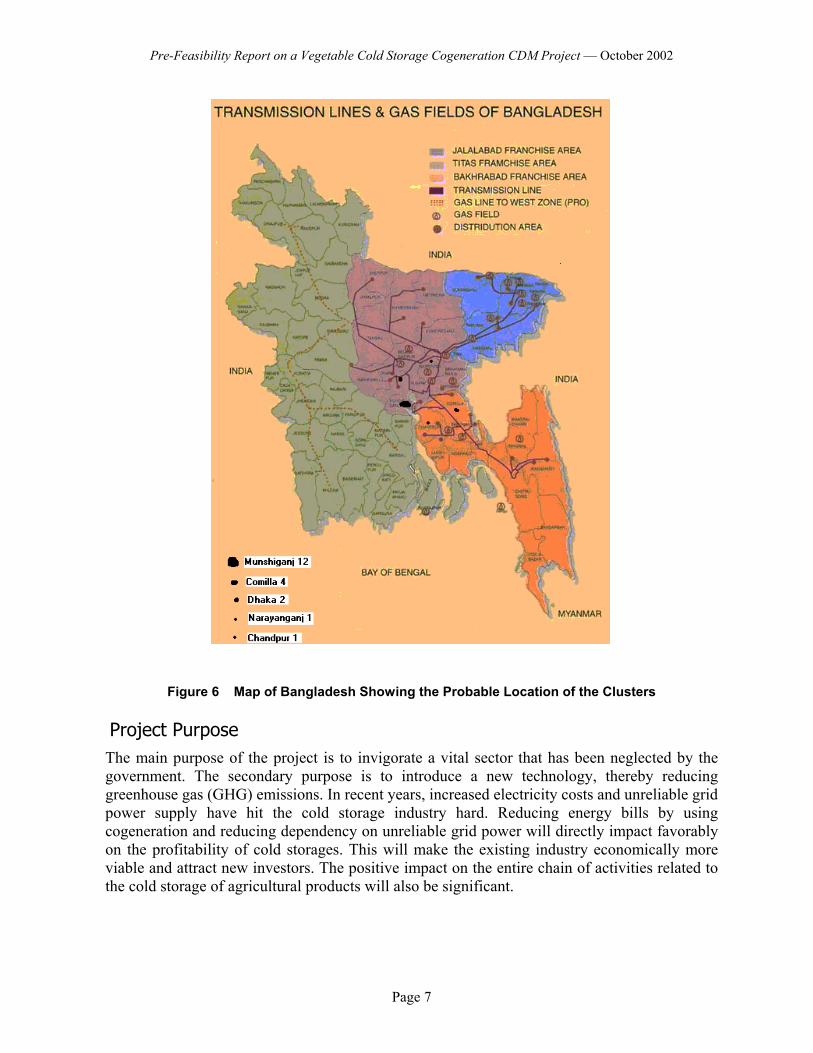
Project Location There are approximately 300 cold storages in Bangladesh, almost all of which are privately owned. Most of the cold storages are located near the major potato-growing regions of Munshiganj, Narayanganj, Rajshahi and Rangpur. The specific sites have been chosen so that they are close to either an inland river port or a railway station. The newer cold storages are typically located near a national highway, as more and more potatoes are now being transported by trucks. Cold storages usually occur in clusters. Cogeneration can be introduced only in areas where the natural gas grid exists. Figure 6 shows the natural gas transmission lines in Bangladesh. A large number of cold storages are located in the northern region of the country where the gas grid does not exist. Fortunately, the largest potato-growing region, Munshiganj, which also has the highest concentration of cold storages (0.4 million tonnes), does have natural gas. Furthermore, Munshiganj is close to the capital city, Dhaka, and easily accessible by road. Twelve out of the 20 clusters of the project are proposed to be located at Munshiganj. The other eight can be located at Dhaka (2), Narayanganj (1) Comilla (4) and Chandpur (1). Figure 6 shows the probable locations of the cold storage clusters as black dots on the map of Bangladesh.
Page 6
Pre-Feasibility Report on a Vegetable Cold Storage Cogeneration CDM Project — October 2002
Figure 6 Map of Bangladesh Showing the Probable Location of the Clusters
Project Purpose The main purpose of the project is to invigorate a vital sector that has been neglected by the government. The secondary purpose is to introduce a new technology, thereby reducing greenhouse gas (GHG) emissions. In recent years, increased electricity costs and unreliable grid power supply have hit the cold storage industry hard. Reducing energy bills by using cogeneration and reducing dependency on unreliable grid power will directly impact favorably on the profitability of cold storages. This will make the existing industry economically more viable and attract new investors. The positive impact on the entire chain of activities related to the cold storage of agricultural products will also be significant.
Page 7

Pre-Feasibility Report on a Vegetable Cold Storage Cogeneration CDM Project — October 2002
Project Type According to CDM terminology, this is an energy efficiency option because it performs the work of electricity through the combined heat and power (CHP) technique. Among the energy supply options, CHP is the most difficult to classify because it requires not only altering the electricity supply portion, i.e., displacing grid generation with on-site generation, but also changing a portion of the end-use device, i.e., partially replacing vapor compression with vapor absorption refrigeration.
How GHG Emissions Will Be Reduced by the Project The project will reduce GHG emissions predominantly by utilizing waste heat to perform the same work that would have been performed by grid electricity. In addition, some GHG reduction will be achieved due to the displacement of grid electricity with on-site electricity generation. The second GHG reduction component is, however, critically dependent on the emissions associated with the grid due to electricity consumed at the cold storage. In normal circumstances there would not be any reduction because grid generation efficiency is higher than on-site small generator efficiency. But in this case the reduction arises from the large technical transmission and distribution losses of electricity supply in the national grid. Another important point is that lean burn gas engines, the type proposed to be used in this project, even in small engine sizes are capable of giving extremely high thermal efficiency. Efficiencies as high as 50% have been reported.
Why This Project Would Not Otherwise Go Ahead and Its Improvement on Current Technologies or Practices (Additionality) The first and foremost reason why this project would not otherwise go ahead is that, to say the least, the entire scheme of proposed retrofit is unconventional. Even though the use of waste heat and cogeneration are well-known technologies, in the context of the cold storages of Bangladesh, their implementation is certainly daunting. The second equally important factor inhibiting the project is the financial state of the cold storages. Thus, even though the benefits of the proposed cogeneration retrofit project are quite clear, the cash-strapped industry will not make any additional investment and the reality is that many owners are trying to get out of the low-profit business. Discussions with the Cold Storage Owners’ Association have revealed that they are wary of the proposed retrofit, and without external support in the form of both technology and finance, they would not like to undertake additional complications.
How the Technology Will Be Transferred Vapor absorption chillers are becoming popular as a result of energy-saving drives all over the world. Even electric chiller manufacturers are offering many vapor absorption chiller options. Japan is a technology leader in absorption refrigeration technology. VACs are also gaining acceptance and popularity in energy-starved China, India and Southeast Asian countries. China, with the highest demand for chillers, has moved substantially to direct fired VAC systems in the last decade. This has spurred competitive manufacturing in China, and the price of VACs has been driven down from $700/TR to $400/TR. India is also entering the VAC manufacturing market as pressure for improving energy efficiency grows. From a cost point of view, the best option for Bangladesh would be to procure the technology from either China or India.
Page 8
Pre-Feasibility Report on a Vegetable Cold Storage Cogeneration CDM Project — October 2002
Direct exhaust absorption chillers are now being manufactured in combination with gas turbines as cogeneration systems and can be customized for gas engines. This project will require customization for gas engine exhaust, and, because of this requirement, the price per TR has been taken as US$ 600, even though it is proposed that the technology will be obtained from either India or China. Standard-sized packages for gas engines are available from 75 kW to 10 MW (www.ashraethailand.org). Direct exhaust absorption chillers equipped with auxiliary burners can be ordered in all sizes, starting at 1 TR and going up to 5,000 TR. However, it is axiomatic that if standard sizes are selected, the cost will be significantly lower.
Project Life and Credit Period The project life for the retrofit would be at least 20 years because both gas engine generators and absorption refrigeration equipment have long lives. For the financial analysis, the life has been taken as 30 years. However, it must be emphasized that project lives greater than 15 years have a negligible effect on the calculated FIRRs because of the discounting at 15%. For this project, either the 10-year or the three seven-year periods, with baseline revisions crediting period options, can be chosen. However, considering the overall complications of the project, it is better to limit the involvement with the CDM investor to one 10-year period.
Contribution to Sustainable Development and Environmental and Social Benefits (Including Comparison with Host Country Criteria if They Exist) An abundance of fruits and vegetables cultivated during the four-month winter growing period cannot be consumed. A lot is wasted or sold at a much lower price. Ninety-eight percent of cold storage space in Bangladesh is used for potatoes. Tremendous opportunities exist for other kinds of vegetables to be stored, thus providing good seasonal distribution of perishable food. Since there is no culture of either canning or dehydrating agricultural products, cold storages are an important aspect of sustainable agriculture, because without them large quantities of agricultural products would be wasted. Storing perishables in cold storages also ensures that farmers receive a fair price for agricultural produce.
The Recipient of These Benefits The direct recipient of the benefits will be the owners of the retrofitted cold storages. As a result of this project, there is distinct prospect of transforming the existing marginally profitable cold storage business into a truly profitable business. Demonstrating the proposed technology in new cold storages may induce others to get into the business, leading to real benefits for the country. It is worth pointing out that if these cold storages did not exist, potatoes would have to be imported from India during the non-growing season, causing a financial drain on the exchequer. As explained earlier, preserving vegetable products by refrigeration can be an important aspect of sustainable agriculture. The benefits reaped by the cold storages may trickle down to the farmer level because farmers will hopefully be able to get cheaper rates for storing their products.
Page 9

Pre-Feasibility Report on a Vegetable Cold Storage Cogeneration CDM Project — October 2002
Adverse Environmental or Social Impacts The two following environmental issues associated with this project:
(i) On-site air pollution (ii) Noise pollution
Due to this project, air pollution that would have occurred at the power plant will be shifted to the cold storages. This will certainly have some impact because power plants are usually situated in areas that minimize the impact of air pollution, while cold storages are usually in semi-industrial areas. However, some cold storages are in areas where the impact will be minimal. The air pollution impact will, however, be limited due to the fact that Bangladesh natural gas has negligible sulfur. If desired, catalytic converters can be fitted to the engines to minimize NOx and CO. Noise pollution may be significant, and if the cold storage is close to human habitation then some measure must be adopted to alleviate this problem. The use of acoustic enclosures can easily reduce noise levels from their normal value of around 100 dB(a) at 1 m to 65 dB(a) to 75 dB(a), well below the typical legislative limit of 85 dB(a). There are no social issues associated with the execution of the project. In fact, the number of people employed will rise as a result of the retrofit.
2. Partner Industry/NGO in Host Country This project envisages retrofitting 20 cold storages in several clusters (one to four cold storage(s) in a cluster). The true partners of this project should be the owners of the cold storages. Since it is not possible for the CDM investor to deal with such a large number of people, the execution of this project necessitates an operator who will be responsible for the CDM project development. Ultimately, this CDM operator will remain responsible for delivering the CERs to the CDM investor and the financing to the project developers/owners. The CDM operator could be one of these three entities: (i) Cold Storage Owners’ Association; (ii) an existing environmental/development NGO; or (iii) a private group interested in promoting CDM projects in Bangladesh. It would be the responsibility of the operator to locate the prospective project developers/owners.
3. Project Scope/Boundary The 20 clusters and the national electricity grid constitute the boundary of the project. The national grid enters the boundary because grid electricity is being displaced. In baseline emissions estimates the details of grid generation and transmission and distribution losses of electricity have been taken into account. However, since this project is expected to be small-scale, with a simplified baseline, there should be no requirement for monitoring the baseline during the crediting period, and, therefore, the true boundary of the project is the cold storages in the clusters. The project involves straightforward substitution of grid electricity with cogenerated electricity, the fuel in both cases being natural gas (the grid is predominantly natural gas–based
Page 10
Pre-Feasibility Report on a Vegetable Cold Storage Cogeneration CDM Project — October 2002
generation). There are no leakage issues in this project except for the fact that there are slightly greater GHG emissions involved in delivering natural gas to a distributed user than to a centralized power plant.
4. Emissions Baseline
General The baseline technology consumes grid electricity throughout the day for approximately nine months. The vapor compression refrigeration system consumes electricity on an on-off basis, which is determined by the temperature inside the cold storage. When the temperature reaches the lowest allowable temperature, the machines are turned off. The machines are turned on when the temperature inside the cold storage rises to the highest allowable temperature. The length of time that the refrigeration machines need to be kept on during the year to achieve the desired cooling cannot be predicted accurately because it is critically dependent on the ambient temperature, which varies from year to year. The best that can be achieved under the circumstances is an estimate based on the historical electricity consumption of the cold storage. The cold storage units under study are not likely to be affected by any sort of regulation or legislation that will force better or cleaner technology to be introduced. The proposed CDM project displaces grid electricity. The baseline is, therefore, emissions due to the generation of electricity in the national grid. As is well known, this is not easy to estimate, even for the present situation. In the future, the emissions due to electricity generation will change, making estimates over the 10-year crediting period a real challenge. To estimate the baseline emissions, two things are required: the load curve and the power plants dispatched to satisfy that load curve for every hour of the day. The problem can be simplified by using a typical daily load curve as representative of the entire year. It is virtually impossible to predict the future daily load curve, but the marginal power plants for the national grid can be predicted with reasonable accuracy from existing plans and knowledge about technological changes in the sector. In the following sections, the load curve for the grid and the existing and planned power plants of the utility are discussed.
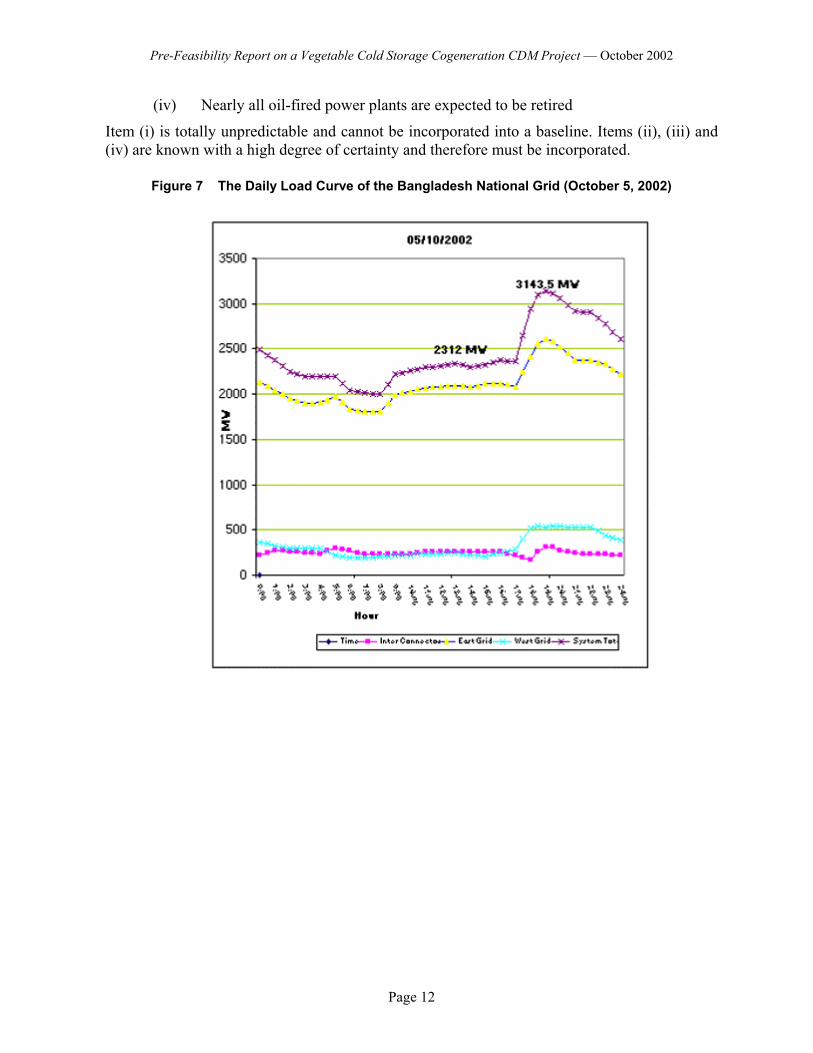
Load Curve Figures 7 and 8 show the Load and Energy Curves for the national grid. As can be seen, the power requirement at the peak, at around 8:00 p.m., is nearly 50% greater than at the minimum point, at around 3:00 p.m. In Bangladesh at present, the peak load is being supplied by a mixture of gas combustion turbines and some very low-efficiency oil-fired power plants. In the next 10 years, all oil-fired power plants will be phased out and the peaking plants will all be combustion turbines with efficiencies between 25% and 32%. The estimation of emissions in the next 10 years will be complicated by the following factors:
(i) Demand-side management may lead to valley filling and peak shaving (ii) Several low-efficiency baseload plants will be replaced by high-efficiency
combined-cycle natural gas plants (iii) A coal-fired power plant is expected to go into operation by 2006
Page 11
Pre-Feasibility Report on a Vegetable Cold Storage Cogeneration CDM Project — October 2002
(iv) Nearly all oil-fired power plants are expected to be retired
Item (i) is totally unpredictable and cannot be incorporated into a baseline. Items (ii), (iii) and (iv) are known with a high degree of certainty and therefore must be incorporated.
Figure 7 The Daily Load Curve of the Bangladesh National Grid (October 5, 2002)
Page 12
Pre-Feasibility Report on a Vegetable Cold Storage Cogeneration CDM Project — October 2002
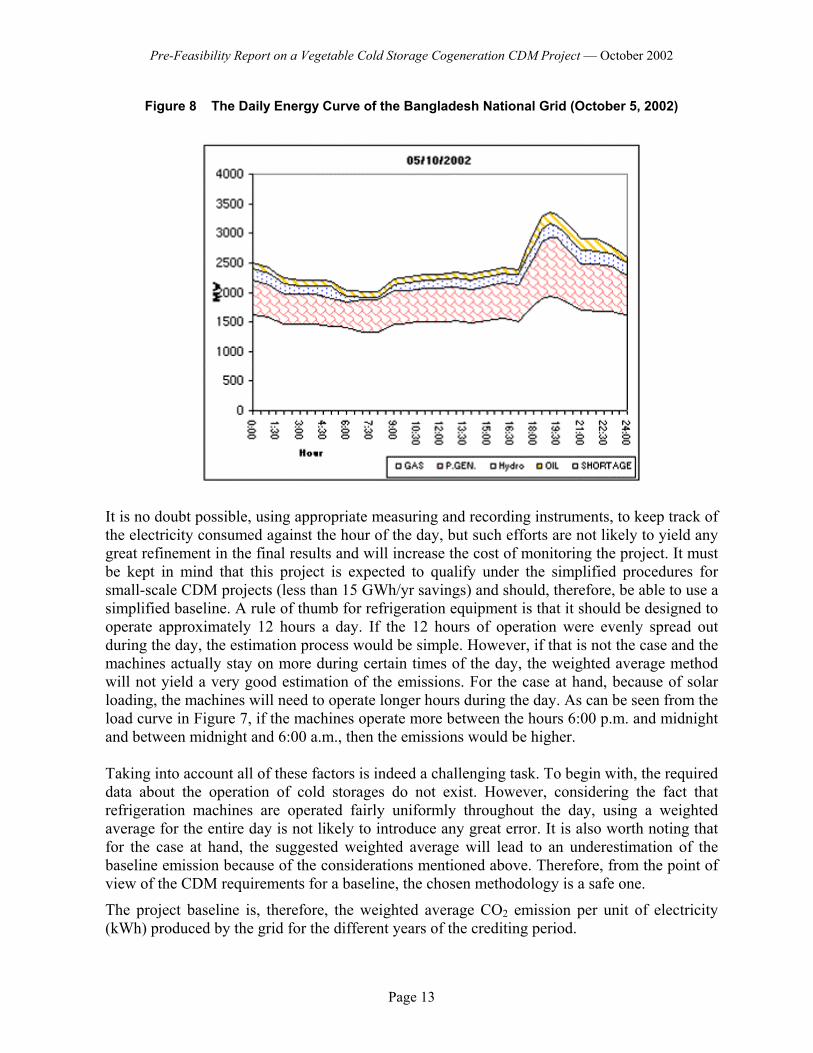
Figure 8 The Daily Energy Curve of the Bangladesh National Grid (October 5, 2002)
It is no doubt possible, using appropriate measuring and recording instruments, to keep track of the electricity consumed against the hour of the day, but such efforts are not likely to yield any great refinement in the final results and will increase the cost of monitoring the project. It must be kept in mind that this project is expected to qualify under the simplified procedures for small-scale CDM projects (less than 15 GWh/yr savings) and should, therefore, be able to use a simplified baseline. A rule of thumb for refrigeration equipment is that it should be designed to operate approximately 12 hours a day. If the 12 hours of operation were evenly spread out during the day, the estimation process would be simple. However, if that is not the case and the machines actually stay on more during certain times of the day, the weighted average method will not yield a very good estimation of the emissions. For the case at hand, because of solar loading, the machines will need to operate longer hours during the day. As can be seen from the load curve in Figure 7, if the machines operate more between the hours 6:00 p.m. and midnight and between midnight and 6:00 a.m., then the emissions would be higher. Taking into account all of these factors is indeed a challenging task. To begin with, the required data about the operation of cold storages do not exist. However, considering the fact that refrigeration machines are operated fairly uniformly throughout the day, using a weighted average for the entire day is not likely to introduce any great error. It is also worth noting that for the case at hand, the suggested weighted average will lead to an underestimation of the baseline emission because of the considerations mentioned above. Therefore, from the point of view of the CDM requirements for a baseline, the chosen methodology is a safe one.
The project baseline is, therefore, the weighted average CO2 emission per unit of electricity (kWh) produced by the grid for the different years of the crediting period.
Page 13

Pre-Feasibility Report on a Vegetable Cold Storage Cogeneration CDM Project — October 2002
It is proposed that this will be computed using a simple dispatch rule from the following information:
• The daily load curve • The type of power plant, i.e., baseload or peaking • The efficiencies of the different power plants • The fuel used in each power plant • Planned capacity expansion • Assumed marginal power plants beyond the utility plan period
Existing and Planned Power Plants The load curve (Figure 7) shows that approximately 85% of the energy dispatched is baseload, even though the peak power requirement is nearly 50% of the baseload requirement. This implies that the intermediate and peaking plants will have an average annual load factor (ALF) below 30%, and indeed some will have an ALF of 20% or less. For baseline determination for this project, the baseload plants are more relevant because they account for 85% of the emissions. In the last 10 years or so, the national grid has been unable to supply the full load, and several gas turbine generators have been used as baseload for a considerable period during the year. This situation is, however, changing fast, and by the time this CDM project is likely to be implemented, there will be baseload surplus, and, depending on the implementation of peaking plants, there may be a shortage in peaking capacity. An additional point about the present generation is that approximately 5% of the baseload plants are oil-fired, and this is expected to become an insignificant number beyond 2010. Therefore, considering the fact that supply will be predominantly gas-based, it is important to analyze the existing gas-based baseload capacity of the grid system. Table 1 presents data related to the gas-based power plants that can only be used as baseload.
Table 1 Base Load Power Plants and Their Base Year (FY01) Generation
No. Name Type (fuel)
Generation Capacity (MW)
Base Year Net Generation (GWh)
Heat Rate
Retirement Year
1 Ashuganj 1-2 ST (gas) 100 670 15,034 2006 2 Ghorasal 1-2 ST (gas) 80 415 16,022 2006 3 Siddhirganj ST (gas) 50 293 13,812 2006 5 Ashuganj CC (gas) 74 173 15,873 2010 7 Chittagong ST (gas) 55 328 15,350 2014 8 Ashuganj 3-5 ST (gas) 450 2,730 11,724 2015 9 Fenchuganj CC (gas) 90 273 13,110 2015 10 Ghorasal 3-6 ST (gas) 840 4,077 12,141 2017 11 Rauzan ST (gas) 420 1,583 11,981 2017 Total 2,159 10,542
From the existing power plants, nearly 1,500 MW will remain operational up to and beyond 2014. If a CDM project is implemented, the earliest it can become operational is early 2004.
Page 14
Pre-Feasibility Report on a Vegetable Cold Storage Cogeneration CDM Project — October 2002
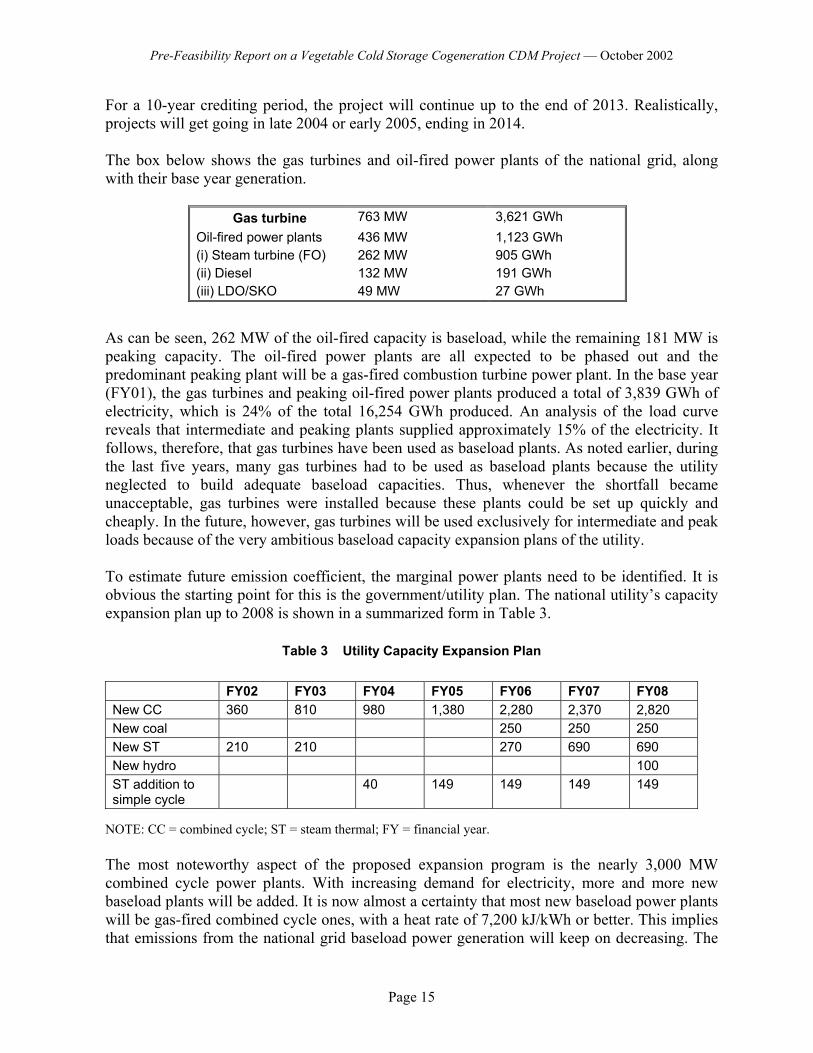
For a 10-year crediting period, the project will continue up to the end of 2013. Realistically, projects will get going in late 2004 or early 2005, ending in 2014. The box below shows the gas turbines and oil-fired power plants of the national grid, along with their base year generation.
Gas turbine 763 MW 3,621 GWh Oil-fired power plants (i) Steam turbine (FO) (ii) Diesel (iii) LDO/SKO
436 MW 262 MW 132 MW 49 MW
1,123 GWh 905 GWh 191 GWh 27 GWh
As can be seen, 262 MW of the oil-fired capacity is baseload, while the remaining 181 MW is peaking capacity. The oil-fired power plants are all expected to be phased out and the predominant peaking plant will be a gas-fired combustion turbine power plant. In the base year (FY01), the gas turbines and peaking oil-fired power plants produced a total of 3,839 GWh of electricity, which is 24% of the total 16,254 GWh produced. An analysis of the load curve reveals that intermediate and peaking plants supplied approximately 15% of the electricity. It follows, therefore, that gas turbines have been used as baseload plants. As noted earlier, during the last five years, many gas turbines had to be used as baseload plants because the utility neglected to build adequate baseload capacities. Thus, whenever the shortfall became unacceptable, gas turbines were installed because these plants could be set up quickly and cheaply. In the future, however, gas turbines will be used exclusively for intermediate and peak loads because of the very ambitious baseload capacity expansion plans of the utility. To estimate future emission coefficient, the marginal power plants need to be identified. It is obvious the starting point for this is the government/utility plan. The national utility’s capacity expansion plan up to 2008 is shown in a summarized form in Table 3.
Table 3 Utility Capacity Expansion Plan
FY02 FY03 FY04 FY05 FY06 FY07 FY08 New CC 360 810 980 1,380 2,280 2,370 2,820 New coal 250 250 250 New ST 210 210 270 690 690 New hydro 100 ST addition to simple cycle
40 149 149 149 149
NOTE: CC = combined cycle; ST = steam thermal; FY = financial year. The most noteworthy aspect of the proposed expansion program is the nearly 3,000 MW combined cycle power plants. With increasing demand for electricity, more and more new baseload plants will be added. It is now almost a certainty that most new baseload power plants will be gas-fired combined cycle ones, with a heat rate of 7,200 kJ/kWh or better. This implies that emissions from the national grid baseload power generation will keep on decreasing. The
Page 15

Pre-Feasibility Report on a Vegetable Cold Storage Cogeneration CDM Project — October 2002
information in Tables 1 and 2, along with some assumptions, has been used to calculate the project’s baseline and is presented in the next section.
Carbon Dioxide Emission Coefficient of the Grid As argued earlier, emissions based on historical averages are wholly inappropriate because the CO2/kWh will change from year to year. The aspect of future electricity generation that will influence emissions most significantly is the addition of hundreds of megawatts of extremely high-efficiency combined cycle baseload power plants to the national grid. This capacity addition is known with certainty and up to the end of the crediting period, its magnitude is several times that of the existing baseload capacity. This, therefore, clearly suggests a dynamic baseline. The only other credible baseline is the marginal power plant concept. However, that imposes even more severe stress on project viability because the marginal baseload power plant is a high-efficiency natural gas–fired combined cycle power plant.
Dispatch Rule A very simplified dispatch rule, as detailed below, was used to estimate the year-wise CO2/kWh for the national grid for the crediting period from 2005 to 2014.
(i) In the financial year 2001 (FY2000-01), the central load dispatch center dispatched 16,254 GWh of electricity. The power plants used for this purpose, along with their base year data, are shown in Appendix A. The base year production has been used to determine the annual load factor (ALF) for the existing plants in the national grid.
(ii) The available capacity during the crediting period has been worked out based on the information provided in Table 1 about the existing gas-fired baseload plants.
(iii) The general shape of the load curve is assumed to remain the same over the 10-year crediting period. In particular, it is assumed that the intermediate and peak electricity will be a fixed proportion of the total electricity requirement.
(iv) From an analysis of the energy curve of August 20, 2002, the intermediate and peak electricity consumed is estimated to be 15% of the total electricity consumed. Since it has been assumed that this ratio will remain fixed for every day of the crediting period, the annual energy electricity requirement can be multiplied by 0.15 to determine the intermediate and peak electricity requirement for any given year.
(v) During the crediting period, the intermediate and peak MWh requirement, above that which can be supplied by the existing plants and those planned up to 2008, has been assumed to be entirely supplied by gas turbine power plants with an efficiency of 27.5% (heat rate of 13,091 kJ/kWh).
(vi) The electricity requirement up to 2008 is met by the existing plants minus the retired ones plus the planned power plants shown in Table 1.
(vii) Beyond 2008, the baseload is supplied predominantly by combined cycle gas-fired power plants with a thermal efficiency of 50% (heat rate of 7,200 kJ/kWh). A small amount of supply is projected to be available from a 250 MW addition to the coal-fired power plant expected to go into operation in 2006. Additionally, 1,000 MW of steam thermal power plants, which might be built as extensions to the existing and planned steam thermal plants, and for which finance may be made available through mechanisms like supplier’s credit, have been assumed.
Page 16

Pre-Feasibility Report on a Vegetable Cold Storage Cogeneration CDM Project — October 2002
The Bangladesh Power Development Board’s Power Sector Master Plan has estimated that the electricity demand growth would be approximately 8% up to 2015. There is already evidence that such a high growth rate will probably not be realized. There are clear indications that the economy will not perform as projected and that the ambitious capacity expansion plans will not materialize. Thus, for this project, a 7% demand growth has been used. Assuming a demand growth of 7%, the electricity requirement between 2005 and 2014 has been calculated starting with a base year (FY01) net generation of 16,254 GWh, and is presented in the second column of Table 4. These data have been used along with the dispatch rule discussed above to arrive at the weighted average CO2 emission of the grid. The full details of the calculations appear in Appendix A. Table 4 presents a summary of the final results of those calculations. Column 3 presents the power requirement in MW to meet the projected demand. The weighted average CO2 emission for the grid is presented in column 5, while column 4 presents the hypothetical equivalent based on entirely natural gas generation.
Table 4 Weighted Average CO2 Emissions During the Crediting Period (2005 to 2014)
YEAR GWh MW Average Heat Rate Based on Natural Gas Generation (kJ/kWh)
Weighted Average CO2 Emissions (kg/kWh)
2001 16,254 3,588 12,993 0.7289
2005 21,306 4,242 11,168 0.6159 2006 22,797 4,465 11,587 0.6421 2007 24,393 4,803 11,614 0.6455 2008 26,100 5,068 11,375 0.6329 2009 27,927 5,343 11,137 0.6202 2010 29,882 5,590 11,293 0.6313 2011 31,974 5,922 11,055 0.6183 2012 34,212 6,270 10,856 0.6075 2013 36,607 6,643 10,673 0.5974 2014 39,170 6,946 10,358 0.5788 Mean (2005 to 2014) weighted average CO2 emissions = 0.6190 kg/kWh
5. Emissions Estimation The baseline emissions have been discussed and quantified in the previous section. Here the emissions as a result of implementing the CDM project will be discussed and the year-wise emission reduction will be quantified. Natural gas from the national gas grid will be used by the project. In this regard, there is really no leakage issue, except for the fact that there is slightly more emission for natural gas delivered to a distributed customer than to, say, a power plant. Natural gas will be combusted in a gas engine. The flue gas composition available from the manufacturers of typical machines is as follows:
Page 17

Pre-Feasibility Report on a Vegetable Cold Storage Cogeneration CDM Project — October 2002
Pollutants (lb/MWh)
Lean Burn Gas Engine
Rich Burn Gas Engine
NOx 2.2 0.5 PM-10 0.03 0.03 CO 5 4 CO2 1,108 1,376
The non-CO2 emissions of the project will be similar to those of the baseline, and are an insignificant portion of the total emissions. Therefore, non-CO2 emissions of the project may be ignored. The CO2 emission due to the combustion of natural gas can be calculated using the coefficient available in the IPCC 1996 revised guidelines. The use of standard, as opposed to actual, emission coefficients for natural gas should not introduce any significant error because the baseline emission has also been estimated with standard IPCC coefficients. It is worth noting that over 90% of grid electricity is from natural gas–based generation. A certain amount of electricity is consumed in the baseline for lighting, cooling (fans), water pumping and other small uses. This consumption will remain exactly the same in the mitigation project. In both cases, this is grid electricity and, therefore, disregarded from the calculation of emission reduction. To compute the primary energy requirement, the transmission and distribution losses of electricity must be accounted for. In Bangladesh, the technical transmission and distribution loss is not known. The total loss figure, which varies from year to year, includes what is known as “non-technical” system loss and consists of consumption that was not paid for. The utility estimates that roughly half of the system loss is technical loss. There is no way of confirming this. Many experts believe that given the poor state of the infrastructure, this loss cannot be less than 15%. A technical system loss greater than 20% is highly unlikely. An average of these two figures, i.e., 17.5%, appears reasonable. On the assumption that 50% of the total loss is technical loss, the total transmission and distribution loss of grid electricity amounts to 35%, which is very close to the average total loss in Bangladesh. Thus, for this project, a technical transmission and distribution loss of 17.5% has been assumed for the first year of the project. After that, this is assumed to improve by 0.5% per year. A critical aspect of the project is the estimation of the amount of electricity displaced by the absorption refrigeration technology. There is no way of estimating this in a 100% accurate manner. The best approach is to use the average of the following: (i) The specific electricity consumption per ton of refrigeration (ii) The historical average kWh consumed by the retrofitted cold storage Table 5 provides the estimation of the baseline CO2 emissions. Column 1 shows the grid electricity displaced at the cold storage sites (20 clusters – approximately 60 cold storages). These values must be corrected for the transmission and distribution losses to arrive at the electricity displaced at the power plants. The electricity displaced at the power plants is multiplied by the weighted average emission coefficients to determine the baseline CO2
Page 18
Pre-Feasibility Report on a Vegetable Cold Storage Cogeneration CDM Project — October 2002
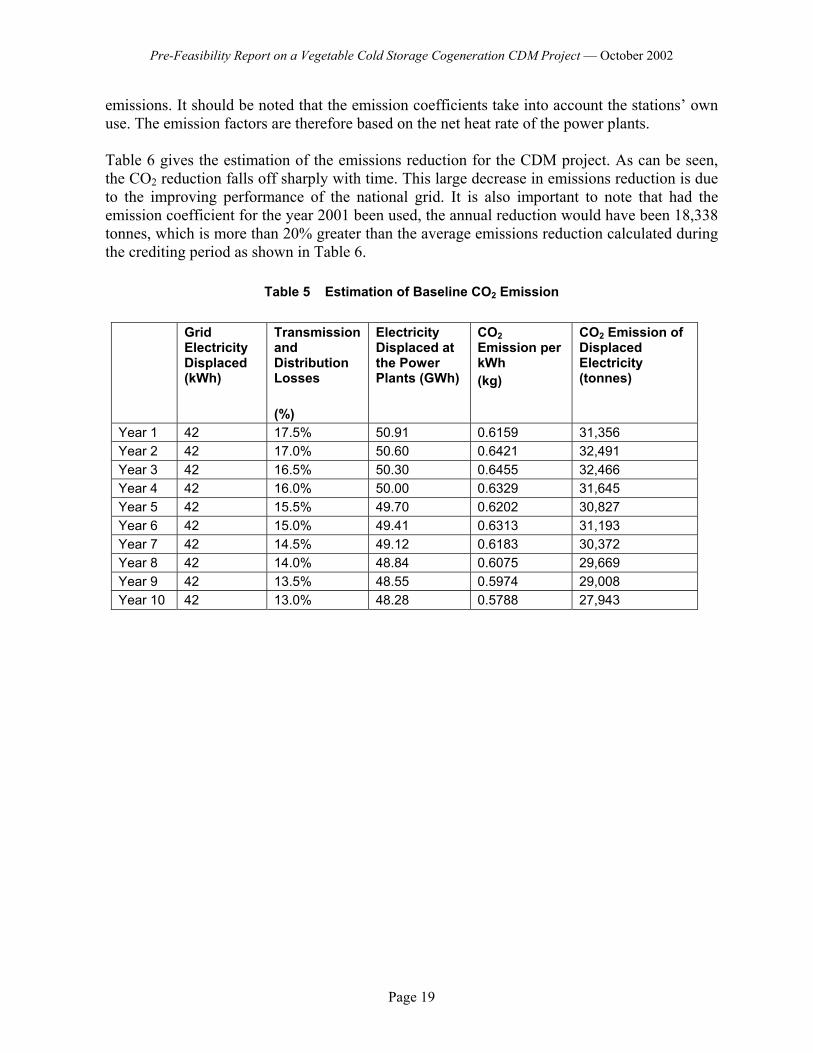
emissions. It should be noted that the emission coefficients take into account the stations’ own use. The emission factors are therefore based on the net heat rate of the power plants. Table 6 gives the estimation of the emissions reduction for the CDM project. As can be seen, the CO2 reduction falls off sharply with time. This large decrease in emissions reduction is due to the improving performance of the national grid. It is also important to note that had the emission coefficient for the year 2001 been used, the annual reduction would have been 18,338 tonnes, which is more than 20% greater than the average emissions reduction calculated during the crediting period as shown in Table 6.
Table 5 Estimation of Baseline CO2 Emission
Grid
Electricity Displaced (kWh)
Transmission and Distribution Losses (%)
Electricity Displaced at the Power Plants (GWh)
CO2 Emission per kWh (kg)
CO2 Emission of Displaced Electricity (tonnes)
Year 1 42 17.5% 50.91 0.6159 31,356 Year 2 42 17.0% 50.60 0.6421 32,491 Year 3 42 16.5% 50.30 0.6455 32,466 Year 4 42 16.0% 50.00 0.6329 31,645 Year 5 42 15.5% 49.70 0.6202 30,827 Year 6 42 15.0% 49.41 0.6313 31,193 Year 7 42 14.5% 49.12 0.6183 30,372 Year 8 42 14.0% 48.84 0.6075 29,669 Year 9 42 13.5% 48.55 0.5974 29,008 Year 10 42 13.0% 48.28 0.5788 27,943
Page 19

Pre-Feasibility Report on a Vegetable Cold Storage Cogeneration CDM Project — October 2002
Table 6 CO2 Emission Reduction of the Project
CO2 Emission of Displaced Electricity (tonnes)
Annual Natural Gas Consumption (m3)
CO2 Emission On-site (tonnes)
CO2 Emission Reduction (tonnes)
Year 1 31,356 8,092,594 15,861 15,495 Year 2 32,491 8,092,594 15,861 16,630 Year 3 32,466 8,092,594 15,861 16,605 Year 4 31,645 8,092,594 15,861 15,784 Year 5 30,827 8,092,594 15,861 14,965 Year 6 31,193 8,092,594 15,861 15,332 Year 7 30,372 8,092,594 15,861 14,510 Year 8 29,669 8,092,594 15,861 13,807 Year 9 29,008 8,092,594 15,861 13,147 Year 10 27,943 8,092,594 15,861 12,081
6. Monitoring and Verification Approach The emission characteristics of the project can be summarized as follows:
Description Emissions Baseline Technology
500 TR vapor compression refrigeration system running on grid electricity. Auxiliary electricity consumption negligible.
OFF-SITE Emissions from grid electricity generation.
Mitigation Technology
300 TR vapor compression system running on electricity generated by a natural gas–fired gas engine generator, and 200 TR absorption refrigeration system running on waste heat of the gas engine. Auxiliary consumption of electricity to operate pumps. Other auxiliary consumption same as baseline.
ON-SITE Emissions from burning natural gas.
It must be emphasized that the actual emissions from the project must be monitored and verified. At this stage (project development), estimation must be based on the historical electricity consumption of the baseline technology and the theoretical (as calculated from design specifications) energy consumed by the mitigation technology to provide equivalent energy services. This estimation is expected to be correct within an error of ±10%, but higher errors cannot be ruled out and thus good monitoring of the project emissions and other data is required. A reasonable estimate of the emission reduction of the project is required to establish the cost per tonne of carbon abated, and indeed to establish the viability of the project.
Page 20

Pre-Feasibility Report on a Vegetable Cold Storage Cogeneration CDM Project — October 2002
In this project, the following would need to be monitored:
1. The natural gas consumed by the gas engine 2. The electricity (MWh) generated 3. The electricity (MWh) consumed from the grid 4. The quantity of potatoes (or other vegetables) stored 5. The hours of operation of the engine, generator and refrigeration machines
The nature of the project is such that grid electricity must be kept as back up. Several times during the year, it may be necessary to use grid electricity because of system malfunctioning and routine maintenance of the gas engine generator and/or absorption refrigeration system. Therefore, the amount of electricity consumed from the grid must be monitored to enable the actual grid electricity displaced to be calculated. This value must be entered every year in Column 2 in Table 5 to compute the baseline emissions. In this project, all 20 cold storage clusters must be monitored every year. This level of monitoring stipulates that a local monitor should be engaged. Thus, a local monitor will need to visit each of the 20 projects once a year to perform detailed auditing. In addition, sometime during the year an unannounced random quick check may be performed to ensure that storage targets are being met. The data collection per cluster, including travel time, will require one full day. The monitor, however, should be able to manage at least one spot check in another cluster during the day’s work. Compiling all the data for the year and producing a monitoring report will require about 10 days. Thus, 30 days, or one man-month, must be allocated for this work. At the rate of US$ 100/day, the local monitoring professional cost would be US$ 3,000 annually, or US$ 30,000 for the entire 10-year duration of the CDM project. Assuming travel costs for the local monitor to be US$ 1,000 per year, the total local monitoring cost amounts to US$ 40,000. A regional or international monitor/verifier would probably need to visit every two years initially and later every three years to audit the local monitor’s reports, visit all the project sites and collect general information about the CDM project and its baseline from independent sources. The effort required to achieve this will be approximately one man-month, of which approximately two weeks will be in the field (host country) and two weeks in the regional or international monitor’s/verifier’s own station. Including travel, this cost may vary between US$ 10,000 and US$ 20,000, for an average of US$ 15,000. During the crediting period of 10 years, four such expenditures would be necessary, the total amounting to US$ 60,000. Thus, a total of US$ 100,000 must be allocated for monitoring and verification of the CDM project.
7. Project Components and Costs This is a retrofit project. The major change will take place in only one of the facilities, where the entire existing VCC, or a significant part of it, will be replaced by a VAC. Most of the existing piping systems and low-pressure side of the equipment can be retained with minor modifications. The cost of the engine-generator set has been estimated using a rate of $466/kW (actual data for similar-sized equipment available in the country), while the cost of the VAC
Page 21
Pre-Feasibility Report on a Vegetable Cold Storage Cogeneration CDM Project — October 2002
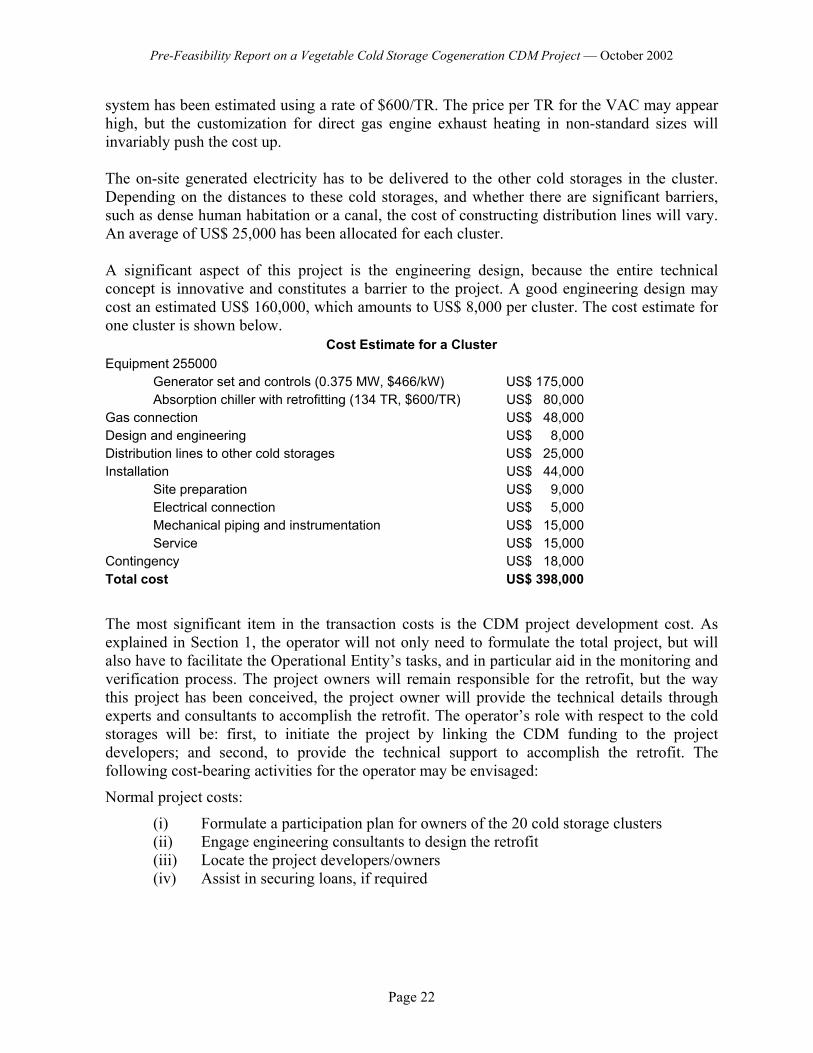
system has been estimated using a rate of $600/TR. The price per TR for the VAC may appear high, but the customization for direct gas engine exhaust heating in non-standard sizes will invariably push the cost up. The on-site generated electricity has to be delivered to the other cold storages in the cluster. Depending on the distances to these cold storages, and whether there are significant barriers, such as dense human habitation or a canal, the cost of constructing distribution lines will vary. An average of US$ 25,000 has been allocated for each cluster. A significant aspect of this project is the engineering design, because the entire technical concept is innovative and constitutes a barrier to the project. A good engineering design may cost an estimated US$ 160,000, which amounts to US$ 8,000 per cluster. The cost estimate for one cluster is shown below.
Cost Estimate for a Cluster Equipment 255000 Generator set and controls (0.375 MW, $466/kW) US$ 175,000 Absorption chiller with retrofitting (134 TR, $600/TR) US$ 80,000 Gas connection US$ 48,000 Design and engineering US$ 8,000 Distribution lines to other cold storages US$ 25,000 Installation US$ 44,000 Site preparation US$ 9,000 Electrical connection US$ 5,000 Mechanical piping and instrumentation US$ 15,000 Service US$ 15,000 Contingency US$ 18,000 Total cost US$ 398,000
The most significant item in the transaction costs is the CDM project development cost. As explained in Section 1, the operator will not only need to formulate the total project, but will also have to facilitate the Operational Entity’s tasks, and in particular aid in the monitoring and verification process. The project owners will remain responsible for the retrofit, but the way this project has been conceived, the project owner will provide the technical details through experts and consultants to accomplish the retrofit. The operator’s role with respect to the cold storages will be: first, to initiate the project by linking the CDM funding to the project developers; and second, to provide the technical support to accomplish the retrofit. The following cost-bearing activities for the operator may be envisaged:
Normal project costs:
(i) Formulate a participation plan for owners of the 20 cold storage clusters (ii) Engage engineering consultants to design the retrofit (iii) Locate the project developers/owners (iv) Assist in securing loans, if required
Page 22
Pre-Feasibility Report on a Vegetable Cold Storage Cogeneration CDM Project — October 2002
Additional CDM transaction costs include:
(v) Complete formalities with the government’s Climate Change Focal Point (vi) Formalize the financial transaction with the CDM investor (vii) Formulate a monitoring plan during the crediting period (viii) Manage the monitoring and verification during the crediting period (ix) Assist the Operational Entity in managing the CERs
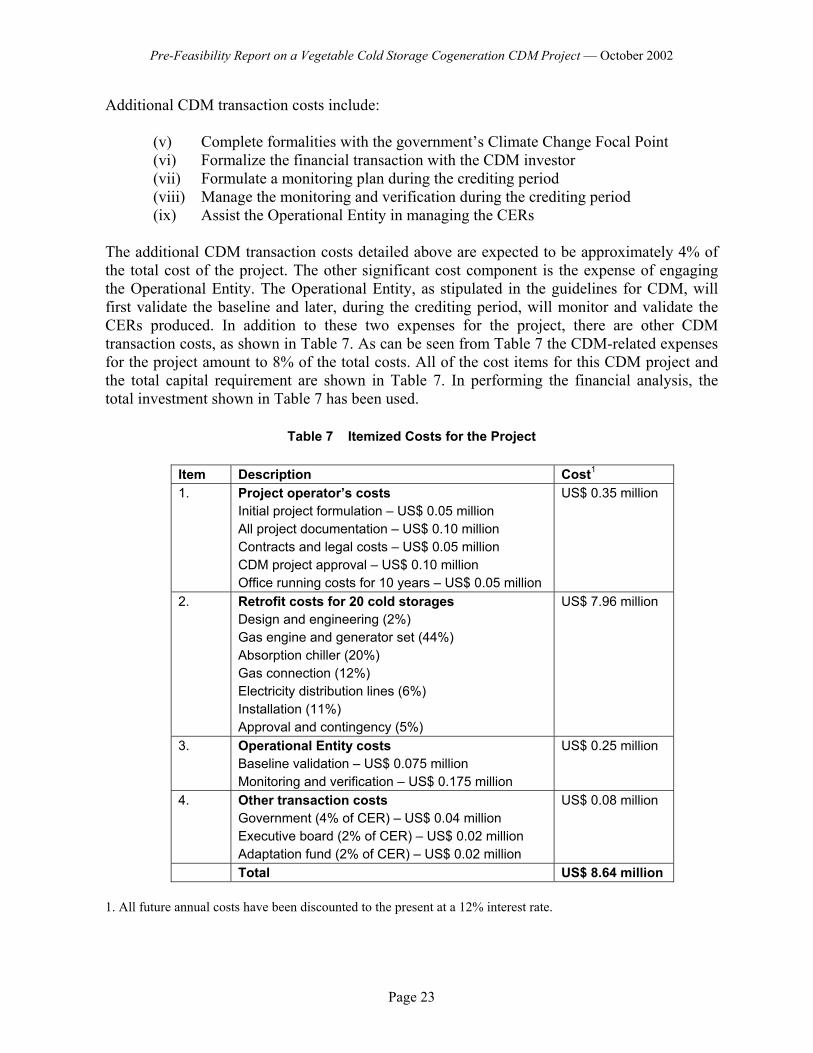
The additional CDM transaction costs detailed above are expected to be approximately 4% of the total cost of the project. The other significant cost component is the expense of engaging the Operational Entity. The Operational Entity, as stipulated in the guidelines for CDM, will first validate the baseline and later, during the crediting period, will monitor and validate the CERs produced. In addition to these two expenses for the project, there are other CDM transaction costs, as shown in Table 7. As can be seen from Table 7 the CDM-related expenses for the project amount to 8% of the total costs. All of the cost items for this CDM project and the total capital requirement are shown in Table 7. In performing the financial analysis, the total investment shown in Table 7 has been used.
Table 7 Itemized Costs for the Project
Item Description Cost1
1. Project operator’s costs Initial project formulation – US$ 0.05 million All project documentation – US$ 0.10 million Contracts and legal costs – US$ 0.05 million CDM project approval – US$ 0.10 million Office running costs for 10 years – US$ 0.05 million
US$ 0.35 million
2. Retrofit costs for 20 cold storages Design and engineering (2%) Gas engine and generator set (44%) Absorption chiller (20%) Gas connection (12%) Electricity distribution lines (6%) Installation (11%) Approval and contingency (5%)
US$ 7.96 million
3. Operational Entity costs Baseline validation – US$ 0.075 million Monitoring and verification – US$ 0.175 million
US$ 0.25 million
4. Other transaction costs Government (4% of CER) – US$ 0.04 million Executive board (2% of CER) – US$ 0.02 million Adaptation fund (2% of CER) – US$ 0.02 million
US$ 0.08 million
Total US$ 8.64 million 1. All future annual costs have been discounted to the present at a 12% interest rate.
Page 23

Pre-Feasibility Report on a Vegetable Cold Storage Cogeneration CDM Project — October 2002
8. Investment Plan The fact that this project has very favorable FIRR (see Section 8 – Financial and Credit Analysis), even without carbon financing, but suffers from numerous barriers, allows it to be developed into a CDM project. It is expected the carbon financing will be able to effectively remove the barriers to this project and allow it to go forward for implementation. The investment plan would require the project office to help the owners of the cold storages to set up the suggested modification by providing the technical know-how. The owners of the cold storages are mostly solvent people with sufficient creditworthiness to be able to secure loans from commercial banks if they can show projects with good FIRR. For this project, a debt-equity ratio of 50-50 has been assumed. As can be seen from Table 9, the equity support from CDM is very small, and therefore a large burden falls on the cold storage owners. As explained above, this is not considered to be significant because the owners are capable of financing the equity. In the event that they are not capable or reluctant, the loan percentage can be increased because the project has very favorable FIRR with CDM support. Discussions with the Cold Storage Owners’ Association have revealed that they are only interested in the project if a significant portion of the initial investment for the retrofit is made available. Since the project has numerous barriers that need to be removed, the up-front contribution per retrofit cannot be very large. The dilemma is, therefore, how to make this otherwise good project happen. The obvious answer is bank loans. Even though banks will be willing to extend loans to the cold storages, the owners are hesitant first, because they are unsure of the technology, and second, because they do not want to be burdened with repaying a loan from an otherwise low-profit business. The task is, therefore, to somehow convince the owners of cold storages that the retrofit has the potential to transform their entire business from a low-profit one into a healthy one. To achieve that, the project operator or the CDM investor may need to involve himself or herself very intimately with the project. Another way of constructing this project is to treat the entire CDM amount as a loan guarantee provision. Some sort of insurance scheme in case of failure of the technology may also be considered. The fact that this is a retrofit project implies that the banks will enjoy the full security of the mortgaged cold storage plant.
9. Financial and Credit Analysis The FIRR calculations for this project have been done on a baseline minus mitigation basis for the following three costs: (i) Fuel (project uses natural gas; baseline uses none) (ii) Power (baseline uses electricity; project uses none) (iii) Operations and maintenance This project achieves significant cost savings as a result of shifting from grid electricity to captive generation. In the baseline, electricity is purchased from the national grid, while in the mitigation (project), natural gas has to be bought from the national gas grid. Table 10 shows the cost difference between these two energy carriers. Operations and maintenance costs for gas
Page 24

Pre-Feasibility Report on a Vegetable Cold Storage Cogeneration CDM Project — October 2002
engines are in the range of $0.005/kWh to $0.01/kWh. Annual maintenance of the chiller for an NH3-H2O system would be less than the maintenance of the vapor compression chiller of the baseline predominantly because absorption equipment has very few moving parts. The operations and maintenance costs of the project have been taken as 4%, compared to the baseline’s 1.5%. The increased cost is due to the engine-generator set. The financial analysis has been worked out based on the assumption that the CERs would be sold at US$ 10/tonne of CO2 abated. From a CDM perspective, the following two mechanisms of financing have been considered:
(i) Annual Purchase of CERs – transaction costs paid by project host (ii) Up-front contribution – transaction costs paid by carbon financier
The summarized results for the two financing mechanisms are presented in Tables 8 and 9. As can be seen, the up-front contribution per cold storage amounts to US$ 0.0285 (0.57/20), which is 13% of equity and 7% of the total cost of one retrofit. The question that immediately arises is, will this carbon financing remove the barriers to the project? The critical point here is not so much the direct contribution to the project, which is not very much, but the technical assistance provided to developers. The promotion of an innovative concept is the key CDM contribution in this case. Even without the carbon financing, the project has FIRR on equity of 24.6% and FIRR on total costs of 21.1%. The effect of carbon financing is to increase these percentages by approximately 3.3% and 1.6%, respectively. These increases should not be underestimated in any way because many uncertainties exist in the project analysis. The project parameters can easily shift in a direction that lowers the FIRR of the project. In that case, the 2% to 3% FIRR increase due to carbon financing will be the determining factor in keeping the project viable.
Table 8 Summary of Financial Analysis of the Project Type of Financing Financing FIRR on Equity Total
Costs 1
Without carbon financing Total costs: US$ 8.64 million Equity: US$ 4.3 million
24.6% 21.1%
2
With up-front carbon financing – transaction costs paid by carbon financier
CDM contribution towards equity: US$ 0.57 million
27.9% 22.7%
3
With sale of CERs – transaction costs paid by project host
CER purchase per year: US$ 0.15 million
27.4% 22.7%
Page 25

Pre-Feasibility Report on a Vegetable Cold Storage Cogeneration CDM Project — October 2002
10. Risk Assessment/Sensitivity Analysis The predominant risk in this project comes from the technology. Even though the absorption technology is nothing new, many assumptions have been made about its performance when running on waste heat of gas engines. With gas turbines, whose exhaust is at a higher temperature, linking the absorption refrigeration unit is straightforward and a reasonably high COP can be achieved. With gas engine exhaust, this is possible, especially by using double effect, but the performance of such systems has not been widely tested. Therefore, the COP that will be achieved by the project’s refrigeration unit is somewhat uncertain. The performance of the project’s refrigeration unit will have a direct impact on the emissions reduction. As a result of inferior performance of the waste heat absorption refrigeration system, the project may fail to deliver the stipulated quantity of CERs.
Table 9 Snapshot View of the Financing Mechanisms (costs in US$) Items Units Value Claim period years 10 Annual emissions reduction tonnes/year 14,814 Annual purchase of CERs – transaction costs paid by project host
Price paid per CER $/tonne 10.0 Annual carbon financing million $/year 0.15 Proceeds to CDM adaptation fund (2.0% of CERs) million $/year 0.003 Proceeds to CDM executive board administration (2.0% of CERs)
million $/year 0.003
Operational Entity costs (0.5% of project cost) million $/year 0.043 Net contribution million $/year 0.10 NPV of contribution at discount rate of 12.0% million $ 0.56 Percent of equity % 13% Percent of total costs % 6% Up-front contribution – transaction costs paid by carbon financier
Percent of equity % 13.2% Percent of total costs % 7% Financial contribution million $ 0.57 Annual carbon financing at discount rate of 12.0% million $/year 0.10 Proceeds to CDM adaptation fund (2.0% of CERs) million $/year 0.003 Proceeds to CDM executive board administration (2.0% of CERs)
million $/year 0.003
Operational Entity costs (0.5% of project cost) million $/year 0.043 Net carbon financing million $/year 0.15 Net cost of CERs $/tonne 10.0
Page 26

Pre-Feasibility Report on a Vegetable Cold Storage Cogeneration CDM Project — October 2002
The project may experience all kinds of technical logistical hitches, both during implementation and during operation, because the proposed retrofit involves many changes to the existing situation and several aspects – especially related to the gas and power utilities – may pose serious difficulties. It has been assumed that these hitches can be managed, especially if the government is willing to encourage CDM projects and hence provide all kinds of support. One example of the kind of problem the project may encounter is the demand charge that the utility may want for keeping the grid electricity available as a standby. If this charge is too high then it will adversely impact the project’s profitability. Another example is the necessity of grid extension in many places to get gas to the cold storage clusters. Since there is no fixed guideline for this, the gas utility may demand an exorbitant charge. In some cases, they may refuse an extension. Invoking special dispensation from the government, it has been assumed, can iron out all of these issues.
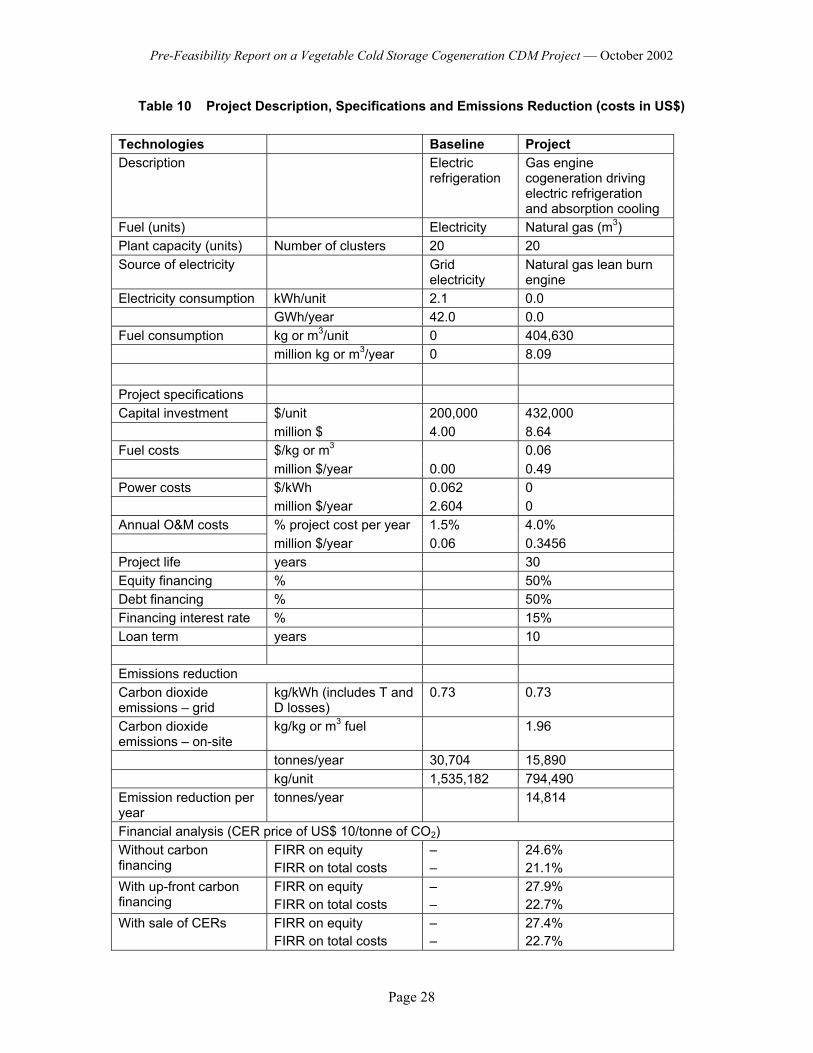
11. Summary of Results The results of the CDM project, which aims to retrofit 20 cold storage clusters (three to four cold storages) is presented in Table 10. The retrofit involves replacing grid electricity with on-site generated electricity, and replacing vapor compression units in one cold storage with absorption refrigeration, which will run on the waste heat of the gas engine. The FIRR calculations have been performed assuming a CER price of US$ 10 per tonne of CO2 abated.
Page 27
Pre-Feasibility Report on a Vegetable Cold Storage Cogeneration CDM Project — October 2002
Table 10 Project Description, Specifications and Emissions Reduction (costs in US$)
Technologies Baseline Project Description Electric
refrigeration Gas engine cogeneration driving electric refrigeration and absorption cooling
Fuel (units) Electricity Natural gas (m3) Plant capacity (units) Number of clusters 20 20 Source of electricity Grid
electricity Natural gas lean burn engine
Electricity consumption kWh/unit 2.1 0.0 GWh/year 42.0 0.0 Fuel consumption kg or m3/unit 0 404,630 million kg or m3/year 0 8.09 Project specifications Capital investment $/unit 200,000 432,000 million $ 4.00 8.64 Fuel costs $/kg or m3 0.06 million $/year 0.00 0.49 Power costs $/kWh 0.062 0 million $/year 2.604 0 Annual O&M costs % project cost per year 1.5% 4.0% million $/year 0.06 0.3456 Project life years 30 Equity financing % 50% Debt financing % 50% Financing interest rate % 15% Loan term years 10 Emissions reduction Carbon dioxide emissions – grid
kg/kWh (includes T and D losses)
0.73 0.73
Carbon dioxide emissions – on-site
kg/kg or m3 fuel 1.96
tonnes/year 30,704 15,890 kg/unit 1,535,182 794,490 Emission reduction per year
tonnes/year 14,814
Financial analysis (CER price of US$ 10/tonne of CO2) Without carbon financing
FIRR on equity FIRR on total costs
– –
24.6% 21.1%
With up-front carbon financing
FIRR on equity FIRR on total costs
– –
27.9% 22.7%
With sale of CERs FIRR on equity FIRR on total costs
– –
27.4% 22.7%
Page 28

Pre-Feasibility Report on a Vegetable Cold Storage Cogeneration CDM Project — October 2002
Page 29