clean development mechanism project … oven hot flue gas... · project design document form (cdm...
TRANSCRIPT

PROJECT DESIGN DOCUMENT FORM (CDM PDD) - Version 03.1. CDM – Executive Board page 1
CLEAN DEVELOPMENT MECHANISM PROJECT DESIGN DOCUMENT FORM (CDM-PDD)
Version 03 - in effect as of: 28 July 2006 CONTENTS A. General description of project activity B. Application of a baseline and monitoring methodology C. Duration of the project activity / crediting period D. Environmental impacts E. Stakeholders’ comments Annexes Annex 1: Contact information on participants in the project activity Annex 2: Information regarding public funding Annex 3: Baseline information
Annex 4: Monitoring plan

PROJECT DESIGN DOCUMENT FORM (CDM PDD) - Version 03.1. CDM – Executive Board page 2 SECTION A. General description of project activity A.1 Title of the project activity: >> Coke oven hot flue gas and waste combustible gases utilization for generating 130 MW of power at, JSW Steel Limited, at Toranagallu, Bellary, Karnataka Version: 01 Date: 20/12/2007 A.2. Description of the project activity: >> Background The conventional iron making process in the steel industry requires the use of metallurgical coke for reduction of iron ore to iron in the Blast Furnace unit. The Company Euro Coke and Energy Pvt. Ltd. was incorporated in the year 2003(Date of incorporation –22/08/2003) for setting up a coke oven plant of a capacity of 1.2 MPTA to cater to the future expansion needs of JSW Steel Limited (JSWSL). JSW Steel Limited (JSWSL) in the year 2004 enhanced its capacity of crude steel production from 1.6 MTPA to 2.5 MTPA by installing a blast furnace of 0.9 MTPA and subsequently to 4 MTPA in 2006 by adding another blast furnace of 1.5 MPTA. Currently, JSW Steel Ltd is expanding the crude steel-capacity further to 7.0 MTPA by adding another blast furnace of 3.0 MTPA. The said coke oven plant consists of 8 Nos. of coke oven batteries which was set up in two phases with 4 Nos. of batteries in each phase. The first phase of the coke oven batteries was commissioned between November 2004 to March 20051 and second phase was commissioned between March 2006 to July 20062. Euro coke and Energy Pvt Ltd was subsequently merged with JSW Steel Limited on 14/11/2005. Project activity The purpose of the project activity is to generate power by utilization of waste heat in flue gases of the coke ovens of Euro Coke and Energy Pvt Limited and combustable waste gases available in excess in the gas grid. The project activity, involving an investment on INR 2930 million, was undertaken by JSW Power Limited, which was later merged with JSWSL3 in the year 2005. The coke oven plant consisting of 279 ovens in a total of 8 coke oven batteries generate huge volume (Estimated to generate between 93000-113600 Nm3/Hr) of flue gases at very high temperature (with an estimated temperature between 1050 – 1310o C). The flue gases from the coke oven plant have a considerable amount of waste heat, which is recovered for generating electrical power in this project activity. The uncertainty in volume (by about 20%) and uncertainty in temperature (by about 25%) makes the total available heat very uncertain (by about 45%).This is a challenge for design, implementation and 1 Evidence will be shown to DOE 2 Evidence will be shown to DOE 3 Evidence will be shown to DOE

PROJECT DESIGN DOCUMENT FORM (CDM PDD) - Version 03.1. CDM – Executive Board page 3 investment into projects involving waste heat recovery to generate power. It may also be noted that the proposed power generation activity was the first unit to be installed in the country and no prior data on performance of waste heat recovery from a non recovery type coke oven was available. In this activity the high temperature coke oven flue gases from the ovens of individual battery is connected to a gas duct. This gas duct has two alternate paths – one to waste heat recovery boiler and the other to atmosphere through coke oven stack. The waste heat recovery boilers are located close to the coke ovens. There are total of eight (8) waste heat recovery boilers i.e. one (1) for each battery of coke ovens. It was estimated that sufficient high pressure and temperature steam could be produced by waste heat recovery boilers from the eight (8) coke oven batteries that would generate about 130 MW of electrical power. The coke oven plant uses Sesa Kembla Energy Recovery Coke technology for coke production. After commissioning of all waste heat recovery boilers in the project activity, the generation of power was only around 70 MW4 even at maximum coke oven plant utilization. Due to this, the project activity had to be altered to use excess waste gas from the steel plant to augment heat for power generation for which JSWSL placed the order on M/s Coen Bharat Limited (CBL) to supply four numbers of Hot Air Generators (HAGs). Realising the constraint of Power generation system based on HAG’s during actual generation the project activity was further modified to include a new boiler termed as 9th Boiler, supplied by TBW India limited, which will utilise Blast furnace gas to generate steam for power generation to meet the plants rated capacity. Hence, the total project activity is borne out of continuous experimentation as there is no previous experience, in public domain, of actual generation of power using waste heat from non-recovery type coke ovens. The power generated by this project activity will replace/ substitute the equivalent quantity of electricity generation that could have been otherwise purchased from the grid or generated with consumption of coal. Contribution of the project activity to sustainable development Ministry of Environment and Forests, Govt. of India has stipulated social well being, economic well being, environmental well being and technological well being as the four indicators for sustainable development in the interim approval guidelines for Clean Development Mechanism (CDM) projects. Social well being
• The project will result in a positive social return (e.g. Employment growth, improve education, improve facilities) in the southern region.
• The unit will create direct employment and indirect employment opportunities, with more than 500 persons will be employed during the course of construction of the project activity.
• The project is in conformity with policies of Government of India to promote waste utilisation and could catalyse such activities in the region and nation by its demonstration.
4 Daily Generation Report when only coke oven gas was used for power generation.

PROJECT DESIGN DOCUMENT FORM (CDM PDD) - Version 03.1. CDM – Executive Board page 4 Environmental well being
• Thermal Power plant based on coal, gas and other petroleum fuel constitutes majority of the power generation in the state of Karnataka. The project activity will displace/replace the equivalent quantity of electricity that could have been otherwise generated in the state or grid by using fossil fuels. This will result in substantially reduced emissions; not only sulphur dioxide, nitrogen oxide and suspended particulate matter but also of carbon monoxide associated with coal / gas/other petroleum fuel based power plants. Hence the project contributes to pollution prevention and resource conservation.
• This project involves utilization of waste gases/heat for Power generation which is more environmental friendly process for power generation than conventional fossil fuel based power plants.
Economic well being
• This project will demonstrate the use of new financial mechanism (CDM) in raising finance for power generation from waste gases/heat.
Technological well being
• This plant installed by JSWSL is a clean “technology demonstration” which uses waste heat/ waste gas for power generation. In the absence of this project activity, these gases would have been flared or let into the atmosphere.
• The promotion of project activity will not only enhance the sustainability of the project proponent but also ensure that other parties can be aware of those technologies which will be a benefit to and enable them to contribute significantly to the objectives of the Kyoto Protocol.
A.3. Project participants: >> Name of Party involved (*)((host) indicates a host Party)
Private and/or public entity(ies) project participants (*) (as applicable)
Kindly indicate if the Party involved wishes to be considered as project participant (Yes/No)
Govt. of India JSW Steel Limited No
JSW Steel Limited will be the sole owner of the CERs generated from the project. A.4. Technical description of the project activity: A.4.1. Location of the project activity: >> A.4.1.1. Host Party(ies): >> Government of India

PROJECT DESIGN DOCUMENT FORM (CDM PDD) - Version 03.1. CDM – Executive Board page 5 A.4.1.2. Region/State/Province etc.: State- Karnataka, South India A.4.1.3. City/Town/Community etc: >> Toranagallu Village and inside JSW Steel Plant in the district of Bellary, Karnataka A.4.1.4. Detail of physical location, including information allowing the unique identification of this project activity (maximum one page): >> The power plant (in the project activity) is located to the East of the Coke oven plants in JSW Steel premises. The geographical location is approximately 15° 9’ latitude (N) and 76° 51’ longitude (E). A state high way (No. 42) connecting Bellary and Sandur is adjacent to the plant. The site is situated almost at the centre point between the two famous towns Bellary and Hospet, which are 60 km apart. The nearest railway station is Toranagallu of South Central Railway. The existing steel plant has railway line link. A.4.2. Category(ies) of project activity: >>
JSW JSW Limited

PROJECT DESIGN DOCUMENT FORM (CDM PDD) - Version 03.1. CDM – Executive Board page 6 The project activity is categorised under Scope Number 1: Energy Industries (renewable/non renewable sources) as per the sectoral scope of the project activities enlisted in the sectoral scopes for accreditation of operational entities A.4.3. Technology to be employed by the project activity: >> The project activity involved installation of eight waste heat recovery steam generators (WHRSGs), which were designed for utilising the waste heat from the coke oven flue gases, four number of Hot air generators each of capacity 30 M Kcal/hr each and an additional boiler of capacity 200TPH of steam to supplement heat by using lean blast furnace gas. The non recovery type coke ovens are environmentally safe from emission of toxic pollutants and waste heat recovery from these coke ovens is inherently uncertain and is not widely prevalent. In spite of these uncertain parameters the power generation system for the project activity was designed. The individual WHRSG is rated to generate about 56.6 t/h of superheated steam at a pressure of 96ata and temperature of 540 degree C. The steam turbine is a single cylinder machine with facility for turbine bypass, driving a turbo-generator at 3000 RPM to produce about 125 MW output at 0.80 power factor at the generator terminal (Maximum Continuous Rating (MCR))and 130 MW at valve wide open(VWO). The Thermal Systems (Hyderabad) Pvt Ltd has supplied, erected, commissioned the waste heat recovery Boilers5. The technology for the waste heat boilers was supplied by Alstom Power Energy Recovery GmBH, Germany6. Coen Bharat limited supplied the four hot air generators (HAG). The Steam turbine and generator (TG) were supplied by DDIT, Siemens7. Corex gas fired Hot Air Generator (HAG) is vertical, up-fired, double shell type having heat release capacity of 30 M KCals / hr (each). Each HAG is designed to generate 104500kg/hr of hot air at 1250oC. This hot gas is made to flow along with the hot coke oven gas to supplement heat requirement in generating steam quantity from each waste heat recovery steam generators (WHRSGs). The mixing of hot gases from coke oven plant and hot air from HAG is an innovative concept8. The hot air generated in the HAGs will be sent to the HRBs to supplement the flue gases generated from the Coke Oven to optimize power generation. During start up of the HAG, LPG is used as a start up fuel for firing the COREX gas for 10 to 20 second duration. Since steam generation from the above project facilities was not able to generate steam around 260TPH-300 TPH, to meet the rated capacity of the plant, one more boiler (termed 9th Boiler) of capacity 200TPH was further added. This boiler will use both Blast Furnace Gas (BFG) and other excess waste gas generated as waste gas from the steel plant. The other waste gases have the flexibility to be used either in 9th boiler or in HAGs depending upon the requirement. The 9th boiler has been ordered to M/s Thermax Babcock & Wilcox Limited (TBW)9. The steam generated having the rated pressure of 96 ATA & 540±5 5 General condition of contract between JSW power, Thermal system Pvt Ltd and Alstom Power Energy Recovery, GmBh, Germany 6 General condition of contract between JSW power, Thermal system Pvt Ltd and Alstom Power Energy Recovery, GmBh, Germany 7 Contract Agreement between JSW Power Limited and DDIT Pvt Ltd for supply of Steam Turbine 8 Certificate by HAG supplier 9 Contract between Thermax Babcock & Wilcox and JSW Steel Limited for Supply of BF Gas fired Boiler

PROJECT DESIGN DOCUMENT FORM (CDM PDD) - Version 03.1. CDM – Executive Board page 7 deg C will be used in existing turbine to optimise the power output. The other waste gases will be used as the start-up fuel which will be diverted from the existing HAG’s during start-up of the boiler.
In summary, the power generation system is designed for 130 MW but due to the lower levels (than what was estimated) of waste heat generation in the coke ovens, only 60 to 70 MW power could be generated. As the operation of the project activity at this configuration is not financially viable, even with CDM revenue the project activity was altered in design. Four Hot Air Generators and one 200 TPH waste gas fired boiler was added to support 130 MW plant capacity. The estimation of quantum of waste heat available for power generator is inherently uncertain as the processes in non- recovery type ovens are unstable and require continuous online controls making quantum of utilizable waste heat uncertain. Salient Features of the technology employed in the project activity:
• The project activity is the first of its kind to generate Power using the waste heat from non recovery Coke oven in the Country.
• Also the project activity is a first of its kind to generate power by mixing of hot gases from coke oven plant and hot air from HAG.

PROJECT DESIGN DOCUMENT FORM (CDM PDD) - Version 03.1. CDM – Executive Board page 8
• The project activity is unique as it uses both, waste heat from non recovery coke ovens and waste gases from Corex/blast furnace for power generation unlike waste gas or waste heat based power plants, who generate power either using waste heat or waste gas.
A.4.4 Estimated amount of emission reductions over the chosen crediting period:
>>
Year
Annual estimation of emission reductions in tonnes of CO2e
2008-09 858869
2009-10 858869
2010-11 858869
2011-12 858869
2012-13 858869
2013-14 858869
2014-15 858869
2015-16 858869
2016-17 858869
2017-18 858869
Total estimated reductions (tones of CO2e)
8588690
Total Number of Crediting Years 10 Annual average over the
crediting period of estimated reductions (tones of CO2e)
858869
A.4.5. Public funding of the project activity: >> This is a unilateral CDM Project Activity undertaken by the project proponent. Public funding from Annex I and use of official development assistance (ODA) is not involved in this project. SECTION B. Application of a baseline and monitoring methodology

PROJECT DESIGN DOCUMENT FORM (CDM PDD) - Version 03.1. CDM – Executive Board page 9 B.1. Title and reference of the approved baseline and monitoring methodology applied to the project activity: >> Approved consolidated baseline and monitoring methodology ACM0012. Title: Consolidated Baseline methodology for GHG emission reductions for waste gas or waste heat or waste pressure based energy system. Reference: UNFCCC Approved Consolidated Baseline methodology ACM0012/version 02 Sectoral Scope: 01 and 04 Title: “Tool for the demonstration and assessment of additionality” Version 04 Title : “Tool to calculate the emission factor for an electricity system” EB 35 B.2 Justification of the choice of the methodology and why it is applicable to the project activity: The applicability of the methodology to the project activity can be justified by means of the table given below: Applicability Condition Comment for Justification The consolidated methodology is for project activities that utilize waste gas and/or waste heat (henceforth referred to as waste gas/heat) as an energy source for: • Cogeneration; or • Generation of electricity; or • Direct use as process heat source; or • For generation of heat in element process (e.g. steam, hot water, hot oil, hot air); The consolidated methodology is also applicable to project activities that use waste pressure to generate electricity.
The proposed project activity utilizes waste heat from flue gases and waste gases for generation of electricity. At present configuration, the project activity utilizes:
• Waste heat in the flue gases of the non recovery type coke ovens to generate electricity upto 70 MW10
• Excess waste gases through hot air generators to generate electricity upto 10- 20 MW11
• Waste gas from blast furnace through a boiler to generate electricity upto 50 to 55 MW12.
If project activity is use of waste pressure to generate electricity, electricity generated using waste gas pressure should be measurable
In this project activity waste gas pressure is not used to generate electricity.
Energy generated in the project activity may be used within the industrial facility or exported
Energy generated in this project activity will be used within JSWSL.
10 Daily Generation Report from coke oven 11 Daily Generation Report from HAG’s 12 Evidence will be shown to DOE

PROJECT DESIGN DOCUMENT FORM (CDM PDD) - Version 03.1. CDM – Executive Board page 10 outside the industrial facility The electricity generated in the project activity may be exported to the grid
The electricity generated is used for the consumption within the industrial facility of JSWSL. No electricity is exported to grid.
Energy in the project activity can be generated by the owner of the industrial facility producing the waste gas/heat or by a third party (e.g. ESCO) within the industrial facility
The energy in the project activity is generated by the owner of the industrial facility i.e. project proponent itself. However, at the planning stage the power generator was a third party (JSW power Limited) within the industrial facility, which was subsequently merged within the industrial facility.
Regulations do not constrain the industrial facility generating waste gas from using the fossil fuels being used prior to the implementation of the project activity
There are no regulations in the country that constrain the industrial facility generating waste gas to use the fossil fuels to generate electricity that would have been used in absence of the project activity
The methodology covers both new and existing facilities. For existing facilities, the methodology applies to existing capacity. If capacity expansion is planned, the added capacity must be treated as a new facility
The industrial facility has expanded capacity in 2004 from 1.6 Million Tones per Annum (MTPA) to 2.5 MTPA which led to establishment of 8 coke oven batteries. Further the facility has plans to expand to 7MTPA in 200813. The project activity would also utilize the blast furnace gases from Blast furnaces that would be established during the expansion. Accordingly the facility would be considered new facility.
The waste gas/pressure utilized in the project activity was flared or released into the atmosphere in the absence of the project activity at existing facility. This shall be proven by either one of the following:
• By direct measurements of energy content and amount of the waste gas for the least three years prior to the start of the project activity
• Energy balance of relevant sections of the plant to prove that the waste gas/heat was not a source of energy before the implementation of the project activity. For the energy balance the representative process parameters are required. The energy balance must demonstrate that the
The project Activity Proponent will submit Process plant manufacturer’s original specification/information, schemes and diagrams which specify that the
• Waste heat generated from Coke Ovens is -93,000 Nm3/hr to 1,13,600 Nm3/hr14
• waste gas generated from the corex I & II is 3,34,000 Nm3/hr15
• Waste gases generated from BF3 plant is 5,23,500 Nm3/hr16
The Scheme does not include utilization of such excess waste gases and heat.
13 Board approval note 14 Minutes of meeting held at JVSL with technology supplier & coke oven consultant on 18.02.2004 regarding installation of Power Plant based on Coke Oven Gases. 15 General Operating Manual Chapter 3 – General Plant Information VAI Industries Ltd. 16 Technical specification for New Blast Furnace by Siemens VAI Industries Ltd.

PROJECT DESIGN DOCUMENT FORM (CDM PDD) - Version 03.1. CDM – Executive Board page 11
waste gas/heat was not used and also provide conservative estimations of the energy content and amount of waste gas/heat released
• Energy bills (electricity, fossil fuel) to demonstrate that all the energy required for the process (e.g. based on specific energy consumption specified by the manufacturer) has been procured commercially. Project participants are required to demonstrate through the financial documents (e.g. balance sheets, profit and loss statement) that no energy was generated by waste gas and sold to other facilities and/or the grid. The bills and financial statements should be audited by competent authorities.
• Process plant manufacturer’s original specification/information, schemes and diagrams from the construction of the facility could be used as an estimate of quantity and energy content of waste gas/heat produced for rated plant capacity/per unit of product produced.
• On site checks by DOE prior to project implementation can check that no equipment for waste gas recovery and use has been installed prior to the implementation of the CDM project activity
All such evidences will be made available to DOE for inspection.
The credits are claimed by the generator of energy using waste gas/heat/pressure.
• In case the energy is exported to other facilities an agreement is signed by the owner’s of the project energy generation plant (henceforth referred to as generator, unless specified otherwise) with the recipient plant(s) that the emission reductions would not be claimed by recipient plant(s) for using a zero-emission energy source.
The credits are being claimed by JSWSL. In the project activity JSWSL is the industrial facility as well as the power generator and user. The waste heat/waste gas produced during the steel manufacturing process of JSWSL is used for electricity generation by JSWSL in the same premises.
For those facilities and recipients, included in the project boundary, which prior to implementation of the project activity (current situation) generated energy on-site (sources of energy in the baseline), the credits can be claimed for minimum of the following time periods:
The project activity is taking place at a facility where capacity expansion is taking place. Hence the credits are being claimed for the credit period as the life time of the equipments being used are more than the crediting period.

PROJECT DESIGN DOCUMENT FORM (CDM PDD) - Version 03.1. CDM – Executive Board page 12
• The remaining lifetime of equipments currently being used; and
• Credit period. Waste gas/pressure that is released under abnormal operation (emergencies, shut down) of the plant shall not be accounted for
The waste gas released under abnormal condition will not be accounted.
Cogeneration of energy is from combined heat and power and not combined cycle mode of electricity generation
In the project activity only electricity is generated. Hence this condition is not applicable
The above arguments justify that the project activity meets all applicability criteria of the selected approved consolidated methodology ACM0012 and hence is applicable to the project activity. B.3. Description of the sources and gases included in the project boundary As per ACM0012, the project boundary is: “The geographical extent project boundary shall include the following:
• The industrial facility where waste gas/heat/pressure is generated (generator of waste energy) • The facility where process heat in element process/steam/electricity are generated (generator of
process heat/steam/electricity). Equipment providing auxiliary heat to the waste heat recovery process shall be included within the project boundary; and
• The facility/s where the process heat in element process/steam/electricity is used (the recipient plant(s)) and/or grid where electricity is exported, if applicable.
Thus, the spatial extent of the project boundary comprises waste gas /waste heat sources (Coke ovens operations and waste gas grid) & captive power plant. For these reasons all equipment and facilities necessary for transportation of coke oven flue gases / waste gases to the power plant and export of electricity generated using the waste heat entrapped in these waste gases to JSW are also included in the project boundary. Thus, all direct sources of emissions are covered.

PROJECT DESIGN DOCUMENT FORM (CDM PDD) - Version 03.1. CDM – Executive Board page 13
Project boundaries
The sources and gases included in the project boundary are tabulated below: Source
Gas
Included/ Excluded
Justification/ Explanation
CO2
Included
Main Emission Source.
CH4
Excluded
Excluded for simplification. This is conservative.
Electricity Generation, Grid or power source
N2O
Excluded
Excluded for simplification. This is conservative.
CO2
NA
CH4
NA
Baseline
Fossil fuel consumption in boiler for thermal energy N2O NA
Coke Oven Plant Phase-1
HRSG 1 to 4
Boiler No. 9 Project Boundary
TG
HRSG 5 to 8 Coke Oven Plant Phase-2
220 kV Switchyard
BF gas from BF3
From waste gas grid
Hot Air Generators
5 to 8

PROJECT DESIGN DOCUMENT FORM (CDM PDD) - Version 03.1. CDM – Executive Board page 14
Fossil Fuel consumption in cogeneration plant
NA NA
CO2
Included
There will not be any fossil fuel consumption in the proposed project activity.
CH4
Excluded
Excluded for simplification.
Supplemental fossil fuel consumption at the project plant
N2O
Excluded
Excluded for simplification.
CO2
Included
The auxiliary Consumption in included.
CH4
Excluded
Excluded for simplification.
Project
Supplemental electricity consumption.
N2O
Excluded
Excluded for simplification.
B.4. Description of how the baseline scenario is identified and description of the identified baseline scenario: >> According to the applicable methodology ACM0012, the baseline scenario is identified as the most plausible baseline scenario among all realistic and credible alternative(s). Realistic and credible alternatives should be determined for: • Waste gas/heat/pressure use in the absence of the project activity; and • Power generation in the absence of the project activity; and • Steam/heat generation in the absence of the project activity

PROJECT DESIGN DOCUMENT FORM (CDM PDD) - Version 03.1. CDM – Executive Board page 15 The methodology is applied in the context of the project activity by following 4 step procedures for determining the baseline as follows: Step 1: Define the most plausible baseline scenario for the generation of heat and electricity using the following baseline options and combinations. For use of waste gas, the realistic and credible alternatives may include: Baseline Scenario Comments W1 Waste gas is directly vented to atmosphere
without incineration Since it is required by safety regulations the waste gas is ‘incinerated and then vented’ into the atmosphere and hence cannot be an alternative current situation of waste gas.
W2 Waste gas is released to the atmosphere after incineration or waste heat is released to the atmosphere (waste pressure energy is not utilized)
The normal practice of steel industry in India is to release waste gas/heat into the atmosphere after incinerating/flaring the waste gas. Hence this is a plausible baseline alternative.
W3 Waste gas/heat is sold as an energy source This can not be a realistic alternative as in the neighbourhood there is no such industrial facility that requires usage of waste heat /waste gas
W4 Waste gas/heat/pressure is used for meeting energy demand
Waste Gas/waste heat is used for producing power in the CDM project activity. It cannot be the baseline scenario, as it is not financially viable and faces insurmountable barriers. Please refer the additionality discussed in section B.5
For Power Generation, the realistic and credible alternatives may include: P1 Proposed project activity if not undertaken
as a CDM project activity This alternative would not be sustainable if it did not envisage assistance from the CDM revenue, since it involves considerable uncertainties and risk. Apart from being financially unviable, as discussed in section B.5 the quantity of waste heat is not a pre- defined parameter. It can vary depending on various parameters such as:
1. Quantity of coke production 2. Quality of coke production 3. Quality of coal used for making coke 4. Waste heat available in the gas 5. Maintenance cycle of the coke ovens 6. Quantity of coke oven gas generated 7. Coking cycle time 8. Non availability of needed coking coal 9. Temperature of coke oven gas 10. Variation of volatile matter in coking coal
Since JSWSL’s core business is the production of steel and not generation of power it has to ensure that production takes precedence over energy generation, and that at no time does energy

PROJECT DESIGN DOCUMENT FORM (CDM PDD) - Version 03.1. CDM – Executive Board page 16
generation dictate production conditions. As a result of which the power generating unit may have to face risk caused by the uncertainties in the amount of waste heat that is made available to it. (Please refer to section B.5 below for details). Though, this alternative is in compliance with all applicable legal and regulatory requirements, it faces investment and other barriers and it is not the most economically attractive option. Hence this option is not a part of the baseline scenario.
P2 On-site or off-site existing/new fossil fuel fired cogeneration plant
The plausibility of on-site/off-site fossil fuel based cogeneration plant is ruled out as there is neither any steam requirement in JSWSL nor any steam requirement in units nearby JSWSL which can make use of the steam produced in the cogeneration plant.
P3 On-site or off-site existing /new renewable energy based cogeneration plant
Putting up a new renewable energy based cogeneration plant in not possible as there is neither any steam requirement in JSWSL nor in the units nearby JSWSL which can utilize the steam produced in the cogeneration plant. Hence this is not a plausible alternative.
P4 On-site or off-site existing/new fossil fuel based existing captive or identified plant
This is one of the most plausible alternatives as this is the common practice in most of the integrated steel plants in India.
P5 On-site or off-site existing /new renewable energy based existing captive or identified plant.
Hydro based power generation is not a realistic and credible alternative because of the following reasons: Karnataka was a pioneer in the development of hydropower and had a power surplus situation till the seventies. Due to rapid industrialisation and other structural problems it was facing acute power shortage. In 2003-04 against an unrestricted demand of 39467 MUs, as per the Karnataka Power Transmission Corporation Limited, the generation from the State grid was 20463 MUs and with the contribution of Central Stations of 9348 MUs, the State was left with a deficit of 9656 MUs. A major reason for chronic power shortage is the dependence on hydel power. The hydel thermal mix is 66:34, leaving the State with a heavy dependence on rainfall in catchment areas17. With this track record of Hydel Power in Karnataka, it is not a preferred option to
17 http://planning.kar.nic.in/AP0506-Volume%20I/AP0506-Volume%20I/chapter09.doc.

PROJECT DESIGN DOCUMENT FORM (CDM PDD) - Version 03.1. CDM – Executive Board page 17
depend on Hydel power to meet its power requirements. Wind Energy based power generation can be considered as a realistic and credible alternative. This alternative has been evaluated further.
P6 Sourced Grid- connected power plants The Power could also be sourced from the grid to meet the requirements of the Industrial facility. And hence this can be included as a plausible alternative to the baseline scenario.
P7 Captive electricity generation from waste gas (if project activity is captive generation with waste gas, this scenario represents captive generation with lower efficiency than the project activity)
As mentioned in option P 1 the project activity which is captive power generation with waste gas is facing investment barriers. Hence going for a lower efficiency technology is not a plausible baseline alternative as this option would also face the same barriers of investment as mentioned in Option P 1. Hence this option is not considered for further evaluation.
P8 Cogeneration from waste gas (if project activity is cogeneration with waste gas, this scenario represents cogeneration with lower efficiency than the project activity)
The plausibility of waste gas based cogeneration plant is ruled out as there is neither any steam requirement in JSWSL nor any steam requirement in units nearby JSWSL which can make use of the steam produced in the cogeneration plant. Hence this option is not considered for further evaluation.
Since heat generation is not a part of the project activity we have not considered weighing the plausible alternatives for this case. From the above discussion the following can be arrived to
Baseline options Scenario Waste Gas/waste heat
Power Heat Description of situation
1 W2 P4 NA
Waste Gas is released to the Atmosphere after incineration and On-site or off-site existing /new renewable energy (Wind) based existing captive or identified plant.
2 W2 P5 NA
Waste Gas is released to the Atmosphere after incineration and On-site or off-site existing/new fossil fuel based existing captive or identified plant for Power Generation.
3 W2 P6 NA Waste Gas is released to the Atmosphere after incineration and Electricity is sourced

PROJECT DESIGN DOCUMENT FORM (CDM PDD) - Version 03.1. CDM – Executive Board page 18
Grid- connected power plants STEP 2: Identify the fuel for the baseline choice of energy source taking into account the national and/or sectoral policies as applicable. As identified in step I one of the plausible electricity generation baseline scenarios is: P4/W2 - On-site or off-site existing/new fossil fuel based existing captive or identified plant. The various fuel options with JSWSL for a new fossil fuel based captive electricity generation are: Scenario Baseline Fuels Choice of energy source Waste Gas is released to the Atmosphere after incineration and On-site or off-site existing/new fossil fuel based existing captive or identified plant for Power Generation
Natural Gas/Coal/Diesel
Natural Gas cannot be the energy source in this project as Natural Gas is not available in the region and there were shortages in the country at the time of conceptualization of this project.
• At the time of planning this project the ongoing gas shortage had resulted in under- utilization of over 40 per cent of the country's gas-based capacity of 10,000 MW18.
• The fate of several of the upcoming gas-based stations during the tenth five plan period, adding up to 4,642 MW across the Central, State, and private sectors was hanging in the balance as a number of these projects were struggling to tie up fuel linkages in time for their commissioning schedule.
• In view of uncertainty over availability and price of gas for existing plants, the Power Ministry had even decided against pursuing new gas-based projects;
• To the site pipeline based gas transportation infrastructure does not exist; LNG cannot be transported due to absence of any dock/port infrastructure except at 400 km away
• JSWSL did not have an internal infrastructure to support LNG and gas based power generation.
Under the given scenario Natural gas/LNG based power generation is not a plausible scenario.
Hence the preferred choice of fuel will be either coal or Diesel. Coal will be the most preferred fuel due to the
18 http://www.thehindubusinessline.com/2005/10/15/stories/2005101503090100.htm

PROJECT DESIGN DOCUMENT FORM (CDM PDD) - Version 03.1. CDM – Executive Board page 19
following reasons; • Coal is abundantly available in India. The total Coal
reserves in India are about 287 billion tonnes19. • JSWSL had coal handling facility which makes it the
next obvious choice to choose a fuel which is reliable, whose handling facilities already exist.
Hence from the above statements it can be concluded that one of the baseline scenario that can be considered for further evaluation in Step III is ‘coal/diesel based captive power plant with the waste gas being released into the atmosphere’.
Option Waste Gas Power Baseline fuel 1. Waste gas is released to the atmosphere after incineration and on site or off site new fossil fuel based captive power plant.
W2 P4 Coal/HSD for power generation
STEP 3: Step 2 and/or step 3 of the latest approved version of the “Tool for the demonstration and assessment of additionality” shall be used to identify the most plausible baseline scenarios by eliminating non feasible options (e.g. alternatives where barriers are prohibitive or which are clearly economically unattractive)
Further as per the methodology the alternatives are to be evaluated on the basis of economic attractiveness to find the appropriate baseline scenario. The broad parameters for the evaluation of sources of power are capital cost and unit cost of electricity purchased or produced. Option Alternative Cost/MW
(INR million)
Unit cost of generation (INR/kwh)
Conclusion
1. Waste Gas is released to the Atmosphere after incineration and On-site or off-site existing/new fossil fuel based existing captive or identified plant for Power Generation
Coal based captive power plant
30 2.20 • The normal practice in the steel sector in India is to have a captive power plant and minimize the dependence on the power from the grid.
• The electricity consumption in Iron and steel Industry in India was 19897 GWh during the period 2003-2004 out of which 7102 GWh of
19 www.coalindia.co.in
PROJECT DESIGN DOCUMENT FORM (CDM PDD) - Version 03.1. CDM – Executive Board page 20
electricity was generated from the captive power plant20.
• In the state of Karnataka too, the Iron & steel Industry meets the power requirement using coal. The captive generation in Iron & steel Industry is dominantly thermal & coal based21. More so in the case of Karnataka as it is a power deficient state.
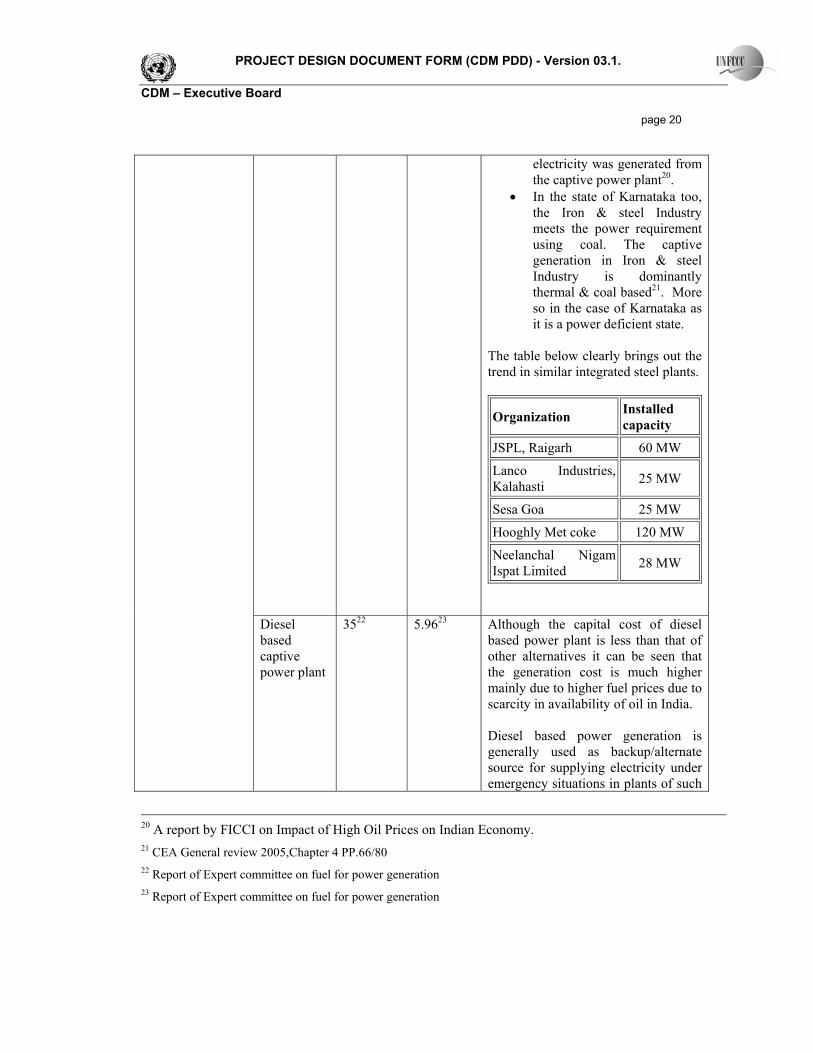
The table below clearly brings out the trend in similar integrated steel plants.
Organization Installed capacity
JSPL, Raigarh 60 MW
Lanco Industries, Kalahasti 25 MW
Sesa Goa 25 MW
Hooghly Met coke 120 MW
Neelanchal Nigam Ispat Limited 28 MW
Diesel based captive power plant
3522 5.9623 Although the capital cost of diesel based power plant is less than that of other alternatives it can be seen that the generation cost is much higher mainly due to higher fuel prices due to scarcity in availability of oil in India. Diesel based power generation is generally used as backup/alternate source for supplying electricity under emergency situations in plants of such
20 A report by FICCI on Impact of High Oil Prices on Indian Economy. 21 CEA General review 2005,Chapter 4 PP.66/80 22 Report of Expert committee on fuel for power generation 23 Report of Expert committee on fuel for power generation

PROJECT DESIGN DOCUMENT FORM (CDM PDD) - Version 03.1. CDM – Executive Board page 21
magnitude. In fact, in 2003-04 out of the 19879 GWh of energy consumed in Iron and Steel Sector on 5 GWh of energy was generated from Diesel based captive power plant.24 Hence it can be concluded that this alternative is not financially attractive
2.Waste Gas is released to the Atmosphere after incineration and On-site or off-site existing /new renewable energy based existing captive or identified plant
Wind Energy based Captive Power Plant
50 2.9525 As compared to other option wind energy based renewable energy generation require very high capital investment and the unit cost of generation is also high. There also exists uncertainty related to wheeling the electricity generated through grid. Also the wind energy based electricity generation is seasonal and infirm. Hence from the above it can be seen that wind energy based power generation is not the most financially attractive option.
3.Waste gas is released to the atmosphere after incineration and source the power from grid connected power plants
Grid based power plant and release the waste gas after incineration in the atmosphere
- 4.3026 Although this alternative doesn’t not require any capital investment, it cannot be considered as a financially attractive option for the reasons mentioned below :
• The electricity purchase rate of INR 4.30 per unit is much higher when compared to captive based power generation cost.
• Also the company has to face likely power cuts by grid
24 A report by FICCI on Impact of High Oil Prices on Indian Economy 25 The relevant worksheet will be shown to the DOE 26 KERC tariff order-2005 for HT consumer

PROJECT DESIGN DOCUMENT FORM (CDM PDD) - Version 03.1. CDM – Executive Board page 22
resulting in production loss as the region facing more than 8% peak power deficit27.
Hence the option of considering import of electricity from grid is not a financially attractive option.
From the above statements it can be seen that the only plausible alternative for integrated steel plant like JSWSL which requires a continuous and reliable power source is to go for a coal based power plant and release the waste gas into the atmosphere after incineration. Thus the alternative of captive power generation on-site using coal is the baseline scenario in this project activity. This methodology is only applicable if the baseline scenario, for all the waste gas generator(s) and the recipient plant(s) identified, is one of the two scenarios described in Table below. If the methodology is to be applicable where the waste/gas is used for generating one form of energy only (electricity or heat), then the baseline too should be only generation of one form of energy (electricity or heat respectively). As per ACM 0012 for Project Scenario: Generation of Electricity or Heat only
Baseline Options Scenario Waste Gas
Power/Heat Description of situation
1 W2 P4 or P6/H4 The electricity is obtained from a specific existing plant or from the grid and heat from a fossil fuel based steam boiler.
Applicable Baseline Scenario for JSWSL
Baseline Options Scenario Waste Gas
Power/Heat Description of situation
1 W2 P4 Waste gas is released into the atmosphere after incineration and going for an onsite new coal based captive power plant.
Hence the applicable baseline scenario for this project activity is as per the baseline scenario applicability condition of ACM 0012. B.5. Description of how the anthropogenic emissions of GHG by sources are reduced below those that would have occurred in the absence of the registered CDM project activity (assessment and demonstration of additionality):
27 www.epwrf.res.in/upload/MER/mer10703005.pdf

PROJECT DESIGN DOCUMENT FORM (CDM PDD) - Version 03.1. CDM – Executive Board page 23 It is required to describe how the anthropogenic emissions of GHG by sources are reduced below those that would have occurred in the absence of registered CDM activity. The purpose of the project activity is to generate power by extraction of waste heat in flue gases of the coke ovens and combusting waste gases of blast furnace plant and others. In the absence of the project activity power requirement would have been met by generating electricity from coal for captive consumption. Hence project activity achieves reduction in CO2 emission due to avoidance of use of coal for equivalent amount of power generation. As required by the approved methodology, the additionality of the project activity shall be demonstrated and assessed using the latest version of the “Tool for the demonstration and assessment of additionality” (Version 4) Steps followed under the “Tool for the demonstration and assessment of additionality” are as follows: Step 1. Identification of alternatives to the project activity consistent with current laws and regulations Sub-Step 1a: Define alternatives to the project activity. 1. Identify realistic and credible alternative(s) available to the project participants or similar project Developers that provide outputs or services comparable with the proposed CDM project activity. These alternatives are to include: • The proposed project activity undertaken without being registered as a CDM project activity; • Other realistic and credible alternative scenario(s) to the proposed CDM project activity scenario that deliver outputs and on services (e.g. electricity, heat or cement) with comparable quality, properties and application areas, taking into account, where relevant, examples of scenarios identified in the underlying methodology; • If applicable, continuation of the current situation (no project activity or other alternatives undertaken). If the proposed CDM project activity includes several different facilities, technologies, outputs or services, alternative scenarios for each of them should be identified separately. Realistic combinations of these should be considered as possible alternative scenarios to the proposed project activity. The list of identified realistic and credible alternatives available to the project participant apart from the project activity is as below:
1. Waste gas is released to the atmosphere after incineration and on site or off site new renewable energy (Wind) based captive power plant.
2. Waste gas is released to the atmosphere after incineration and on site or off site fuel new fossil fuel (coal/HSD) based captive power plant.
3. Waste gas is released to the atmosphere after incineration and source the power from grid connected power plants.
These alternatives are discussed in the section B.4 above. Sub- Step 1b: Enforcement of applicable laws and regulations. 2. The alternative(s) shall be in compliance with all mandatory applicable legal and regulatory requirements, even if these laws and regulations have objectives other than GHG reductions, e.g. to

PROJECT DESIGN DOCUMENT FORM (CDM PDD) - Version 03.1. CDM – Executive Board page 24 mitigate local air pollution. (This sub-step does not consider national and local policies that do not have legally-binding status.). 3. If an alternative does not comply with all mandatory applicable legislation and regulations, then show that, based on an examination of current practice in the country or region in which the law or regulation applies, those applicable legal or regulatory requirements are systematically not enforced and that noncompliance with those requirements is widespread in the country. If this cannot be shown, then eliminate the alternative from further consideration; 4. If the proposed project activity is the only alternative amongst the ones considered by the project participants that is in compliance with mandatory regulations with which there is general compliance, then the proposed CDM project activity is not additional. The list of alternatives described in sub step 1a are in compliance with all mandatory applicable legal and regulatory requirements. Hence the proposed project activity is not the only alternative that is in compliance with all mandatory applicable legal and regulatory requirements. The project activity has crossed sub-step 1 of additionality demonstration, and hence this assessment has moved to the next step 2 investment analysis or step 3 barrier analysis. “Proceed to Step 2 (Investment analysis) or Step 3 (Barrier analysis). (Project participants may also select to complete both steps 2 and 3.)” Before proceeding with Investment analysis it is necessary to understand the various stages that were involved in setting up the project activity: Sr. No Investment
decision taken during
Stage of Investment Entity that took investment
1 February 2004
Decision taken to set up a 130 MW power plant considering the availability of coke oven gas from the coke oven plant set up by Euro Coke Limited.
JSW Power Limited
2 2005 Decision to install 4 HAG’s to use the excess waste gas from steel plant
JSW Steel Ltd
3 April 2007 Decision to install the 9th boiler which will utilize the BF gas to generate steam for power generaion
JSW Steel Ltd
Sub-step 2a. Determine appropriate analysis method Here Tool for the demonstration and assessment of additionality suggests we have to determine whether to apply simple cost analysis, investment comparison analysis or benchmark analysis (sub-step 2b). If the CDM project activity generates no financial or economic benefits other than CDM related income, then we would apply the simple cost analysis (Option I). Otherwise we would use the investment comparison analysis (Option II) or the benchmark analysis (Option III).

PROJECT DESIGN DOCUMENT FORM (CDM PDD) - Version 03.1. CDM – Executive Board page 25 Option 1 as per Tool for the demonstration and assessment of additionality is Simple Cost Analysis. It is applicable when CDM project activity produces no economic benefits other than CDM related income. Option I, use of simple cost analysis, is not applicable as the project activity generates and uses the power generated for its own plant requirement and derives economic benefits. JSWSL proposes to use Option II – Investment Comparison analysis as it derives economic benefits from the project activity by generation and use of electricity. Financial indicators like IRR/DSCR/NPV are not applicable as the objective of JSWSL is to procure power that is reliable to run its steel business i.e the investment is to gain low cost access to reliable power to run its steel making operations and not to achieve higher return on investment into new power generation business. Hence the levelized cost of electricity generation (INR/kwh) is the most suitable financial indicator in this decision making context. Sub-step 2b – Option II. Apply Investment Comparison analysis The Investment comparison analysis has been carried out by calculating the levelized cost of electricity generation (INR/kwh) for the alternatives:
• Coal based power generation. • Utilization of waste gas for power generation.
Sub-step 2c. Calculation and comparison of financial indicators: The levelized cost calculation has been carried out on the basis of following assumptions:
• The price of the waste gas is determined on the basis of coal price at 6500 kcal/kg (calorific value of the imported coal is 6500 kcal/kg) for equivalent Gcal based on guidance provided by Central Electricity Authority. The price formula accounts for the change in calorific value of coal. So JSWSL CPP 2 does not have incentive for change in fuel configuration or maximization of the use of waste gas/waste heat in the fuel configuration.
Assumptions for Coal Based power plants
Sr. No Assumptions Units
1 Cost per MW INR(in millions) /MW 30
2 Debt : Equity % 70:30 3 PLF % 85 4 Auxiliary Consumption % 7% 5 Rate of depreciation % 5.28 6 O&M cost including insurance % of capital cost 2.5 7 Heat Rate kcal/kwh 230028
8 Cost of coal INR/tonne of coal 3000
9 Discount factor for calculating levelized cost % 10
28 PG test measured data of existing 130 MW coal based power plant of JSWEL

PROJECT DESIGN DOCUMENT FORM (CDM PDD) - Version 03.1. CDM – Executive Board page 26 Assumptions for Waste Gas Based power plants
Sr. No Assumptions Units
1 Cost per MW INR(in millions)/MW 22.5
2 Debt: Equity % 70:30 3 PLF % 77 4 Auxiliary Consumption % 6.5 5 Rate of depreciation % 5.28 6 O&M cost including insurance % of capital cost 2.5 7 Heat Rate kcal/kwh 290029
8 Cost of waste gas supplied by JSWSL to CPP-2 INR/Gcal 415
9 Discount factor for calculating levelized cost % 10
The levelized unit cost of generation calculated based on above assumptions is
Sr. No Scenario Levelized Cost of generation (INR/kwh)
1 Coal based captive power plant. 2.20
2 Waste gas is used for power generation 2.46
Sub-step 2d. Sensitivity analysis A sensitivity analysis was carried out to confirm the results obtained above. The sensitivity analysis has been carried out considering the following parameters:
1 PLF 2 Heat Rate
As variation in these parameters can impact the comparison of alternative investments.
3 Rate of Interest These parameters also impact levelized cost estimates and also the parameters can change in the period of decision making.
Parameter
Heat Rate (kcal/kwh) (% change)
Levelised cost for waste gas based
power plant (INR/Kwh)
Levelised cost for coal based power plant
( INR/ Kwh)
-5% 2.38 2.15 PLF (% change)
- 5%
0% 2.48 2.39
29 As per the Power Purchase Agreement between JSW Power Limited and JSWSL

PROJECT DESIGN DOCUMENT FORM (CDM PDD) - Version 03.1. CDM – Executive Board page 27
+5% 2.58 2.32
-5% 2.36 2.12
0% 2.46 2.20 0%
+5% 2.55 2.29
-5% 2.34 2.095 0% 2.43 2.18 5%
+5% 2.53 2.26
Parameter
Interest rate (% change)
Levelised cost for waste gas based
power plant (INR/Kwh)
Levelised cost for coal based power plant
( INR/ Kwh)
-2% 2.45 2.21
0 2.48 2.4 - 5%
+2% 2.51 2.26
-2% 2.43 2.18
0 2.46 2.20 0%
+2% 2.48 2.31
-2% 2.41 2.15 0 2.43 2.17
PLF (% change)
5% +2% 2.46 2.20
From the above sensitivity analysis it can be clearly seen that from all the plausible scenarios coal based power generation is financially more lucrative option than waste gas/waste heat based power generation. But considering the CDM revenue in mind and its concern for environment, JSWSL decided to have a waste gas/waste heat based power plant instead of coal based power plant. Step 3. Barrier analysis Here the realistic and credible barriers that would have prevented the implementation of the proposed project activity will be established thereby proving its additionality. Such realistic and credible barriers may include, among others: Technological Barriers:

PROJECT DESIGN DOCUMENT FORM (CDM PDD) - Version 03.1. CDM – Executive Board page 28 As has already been pointed out earlier, this CDM project activity had been altered at various stages, requiring additional experimentation and investments. The major investment decisions in these stages of experimentation was done in anticipation of CDM revenues. The technological barriers to the project activity are
• The waste heat available in coke oven gas is utilised for producing steam in waste heat recovery boilers. Utilising this type of waste heat itself is a new technology and did not have any proven base.
• There are 8 coke oven batteries and each battery is having a dedicated WHRSG producing steam.
Each WHRSG will generate steam based on the availability of waste heat in the coke oven gas and mixing of steam from all 8 WHRSG and feeding a single turbine is very difficult and needs highly skilled personnel. Due to this the personnel of the proponent of the project activity had to be trained to handle all predicted abnormalities. Such a barrier does not exist for any of the alternative to the project activity.
• Due to the low temperature of the coke oven flue gas, the following operational hurdles, have
resulted in lowering the plant efficiency,
1. Low main steam temperature 2. High specific steam consumption 3. High exit temperature of the gas leaving the boiler resulting in higher induced draft fan loading. o Due to the less heat available from the coke oven plant, the WHRB run at part load subsequently
causing steaming at economizer zone and frequent failure of the economizer tubes. The inefficiencies caused due to such failures discourage the project proponent installing Power generating system depending on Waste heat/waste gas.
• Further, the loss of generation is caused by other uncertainties like the quantity of hot coke oven
gas generation, variation in volatile matter in coking coal, variation in time needed for making quality coke, draft limitations etc resulting in under utilisation of power plant. The above short fall is planned to be bridged by adding hot air generators, which is using waste combustible gas from waste gas grid. This is again a new technology involving risk in achieving predicted performance.
• Power generation capacity gets reduced, due to uncertainty in reaching coke generation capacity (1.2 MTPA), there by losing full utility of power plant capacity.
• The Quantity and Quality of waste heat from coke oven could not be ascertained due to the
inherent uncertainties with the coke oven operations as:
1. At times excess air is given to ensure complete combustion 2. The excess losses at various stages cannot be determined.

PROJECT DESIGN DOCUMENT FORM (CDM PDD) - Version 03.1. CDM – Executive Board page 29
• At the time while the decision was being taken to install the 9th Boiler, it was claimed that while it will be fired using blast furnace gas, it would not require any support fuel at full load. It was a risky proposition for the project proponent as :
1. There was no proven track record with the boiler supplier with similar boiler capacity to assure the project proponent.
2. Incase the boiler failed to run independently with blast furnace gas at full load as claimed by the supplier, the project proponent would have to rely on Corex as a support fuel on a continuous basis. This further added uncertainty to the whole power generation system as Corex availability depends on consumption patterns within the steel plant and after meeting the internal requirements of the steel plant, it is allowed to be used in the power plant.
3. The Project proponent had already experienced shut downs of HAGs due to corex unavailability, and hence going ahead with the decision to install the 9th boiler without any proven track record was a major barrier for the project proponent.
These barriers have in fact prevented and delayed the investment decision. However, in spite of all the aforementioned barriers JSWSL management has taken on board the recommendation for the project activity only after consideration of CDM benefits. JSWSL is shouldering the additional fund cost by showing confidence in the Kyoto Protocol/CDM system and the CDM benefits are envisaged to reduce the risks associated with the project activity. Step 4. Common practice analysis Sub-step 4a. Analyze other activities similar to the proposed project activity: The project activity is the “first of its kind” in India with only one found in United States at Sun coke with a capacity of 90 MW, which again is only on waste heat and not in combination of waste heat and waste gas as is the project activity. At the time of conceptualization of this project activity there was no plant operational in India with similar technology. Sub-step 4b. Discuss any similar options that are occurring: The above argument justifies that the Project activity is not a common practice. Sub Step 4a and Sub-step 4b is satisfied. Based on the above analysis, it is concluded that the project activity would not have been undertaken in the absence of CDM project benefits and without the CDM revenue JSWSL had no direct economic incentive to precede for the project activity. Therefore, the project activity is additional and the baseline scenario is “Waste gas is released into the atmosphere after incineration and going for an onsite new coal based captive power plant” B.6. Emission reductions:
B.6.1. Explanation of methodological choices: >> The baseline emissions for the year y shall be determined as follows:
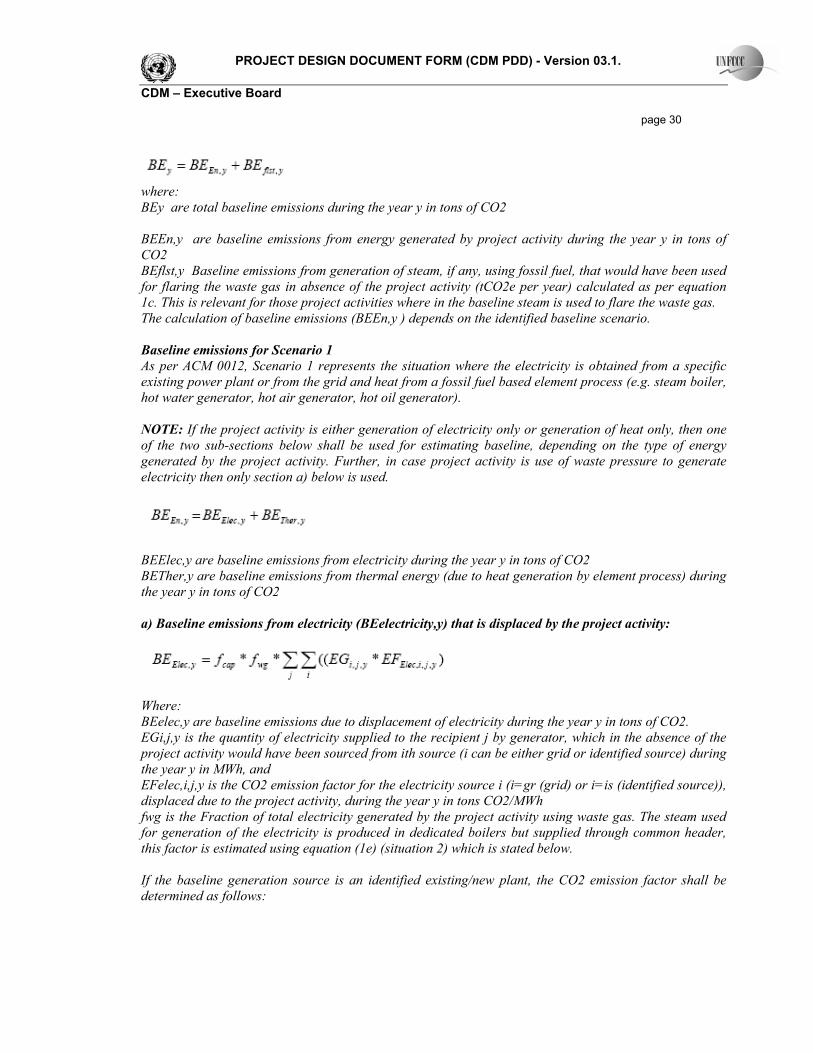
PROJECT DESIGN DOCUMENT FORM (CDM PDD) - Version 03.1. CDM – Executive Board page 30
where: BEy are total baseline emissions during the year y in tons of CO2 BEEn,y are baseline emissions from energy generated by project activity during the year y in tons of CO2 BEflst,y Baseline emissions from generation of steam, if any, using fossil fuel, that would have been used for flaring the waste gas in absence of the project activity (tCO2e per year) calculated as per equation 1c. This is relevant for those project activities where in the baseline steam is used to flare the waste gas. The calculation of baseline emissions (BEEn,y ) depends on the identified baseline scenario. Baseline emissions for Scenario 1 As per ACM 0012, Scenario 1 represents the situation where the electricity is obtained from a specific existing power plant or from the grid and heat from a fossil fuel based element process (e.g. steam boiler, hot water generator, hot air generator, hot oil generator). NOTE: If the project activity is either generation of electricity only or generation of heat only, then one of the two sub-sections below shall be used for estimating baseline, depending on the type of energy generated by the project activity. Further, in case project activity is use of waste pressure to generate electricity then only section a) below is used.
BEElec,y are baseline emissions from electricity during the year y in tons of CO2 BETher,y are baseline emissions from thermal energy (due to heat generation by element process) during the year y in tons of CO2 a) Baseline emissions from electricity (BEelectricity,y) that is displaced by the project activity:
Where: BEelec,y are baseline emissions due to displacement of electricity during the year y in tons of CO2. EGi,j,y is the quantity of electricity supplied to the recipient j by generator, which in the absence of the project activity would have been sourced from ith source (i can be either grid or identified source) during the year y in MWh, and EFelec,i,j,y is the CO2 emission factor for the electricity source i (i=gr (grid) or i=is (identified source)), displaced due to the project activity, during the year y in tons CO2/MWh fwg is the Fraction of total electricity generated by the project activity using waste gas. The steam used for generation of the electricity is produced in dedicated boilers but supplied through common header, this factor is estimated using equation (1e) (situation 2) which is stated below. If the baseline generation source is an identified existing/new plant, the CO2 emission factor shall be determined as follows:

PROJECT DESIGN DOCUMENT FORM (CDM PDD) - Version 03.1. CDM – Executive Board page 31
Where: EFCO2,is,j is the CO2 emission factor per unit of energy of the fossil fuel used in the baseline generation source i in (tCO2 / TJ), obtained from reliable local or national data if available, otherwise, taken from the country specific IPCC default emission factors ηPlant,j is the overall efficiency of the existing plant that would be used by jth recipient in the absence of the project activity. Efficiency of the power plant (ηplant,j) shall be one of the following: i) Assume a constant efficiency of the captive plant and determine the efficiency, as a conservative approach, for optimal operation conditions i.e. design fuel, optimal load, optimal oxygen content in flue gases, adequate fuel conditioning (temperature, viscosity, moisture, size/mesh etc), representative or favorable ambient conditions (ambient temperature and humidity); or ii) Highest of the efficiency values provided by two or more manufacturers for power plants with specifications similar to that that would have been required to supply the recipient with electricity that it receives from the project activity; or iii) Assume a captive power generation efficiency of 60% based on the net calorific values as a conservative approach; or iv)Estimated from load v/s efficiency curve(s) established for equipment(s) through measurement and described in Annex I. Follow international standards for estimation of efficiency of power plants. The baseline scenario identified for this project activity in the above section B.4 is ‘Waste gas is released into the atmosphere after incineration and going for an onsite new coal based captive power plant’ The overall plant efficiency considered for the baseline scenario is 34.77% (considering gross heat rate of 2300kcal/kwh30). Hence EFelec, i, j,y = 25.8*44/12*3.6*10-3 34.77 % = 0.98 tCO2/MWh Calculation of the energy generated (electricity and/or steam) in units supplied by waste gas/heat and other fuels The calculation of the energy generated (electricity and/or steam) in units supplied by waste gas/heat and other fuels has been done taking into consideration situation 2 as described in ACM 0012 Situation 2 (As per ACM 0012) An alternative method that could be used when it is not possible to measure the net calorific value of the waste gas/heat, and steam generated with different fuels in dedicated boilers are fed to turbine/s through common steam header takes into account that the relative share of the total generation from waste gas is 30 PG test measured data of existing 130 MW coal based power plant of JSWEL

PROJECT DESIGN DOCUMENT FORM (CDM PDD) - Version 03.1. CDM – Executive Board page 32 calculated by considering the total steam produced and the amount of steam generated from each boiler. The fraction of energy produced by the waste gas in project activity is calculated as follows:
Where: ST whr y, Energy content of the steam generated in waste heat recovery boiler fed to turbine via common steam header ST other y,Energy content of steam generated in other boilers fed to turbine via common steam header As mentioned earlier the total power generation capacity of the steam that will be generated from heat of coke oven gas, blast furnace gas and other waste gas from the gas grid considered for this project activity is 130 MW. No steam generated from other fossil fuel fired boilers will be fed to the common steam header. ST whr y = ST coke 1 + ST coke 2 + ST coke 3 + ST coke 4+ ST (coke+corexr gas) 5+ ST (coke+corex gas) 6+ ST (coke+corex gas) 7+ ST (coke+corex gas) 8 + STBF Where, STcoke 1 = Energy content of steam generated in WHRB 1 (feed – coke oven gas) in kcal/kg ST coke 2 = Energy content of steam generated in WHRB 2 (feed – coke oven gas) in kcal/Kg ST coke 3 = Energy content of steam generated in WHRB 3 (feed – coke oven gas) in kcal/Kg ST coke 4 = Energy content of steam generated in WHRB 4 (feed – coke oven gas) in kcal/Kg ST coke 5 = Energy content of steam generated in WHRB 5 (feed – coke oven gas and corex gas) in kcal/Kg ST coke 6 = Energy content of steam generated in WHRB 6 (feed – coke oven gas and corex gas) in kcal/Kg ST coke 7 = Energy content of steam generated in WHRB 7 (feed – coke oven gas and corex gas) in kcal/Kg ST coke 8 = Energy content of steam generated in WHRB 8 (feed – coke oven gas and corex gas) in kcal/Kg STBF = Energy content of steam generated in BFG fired boiler in kcal/Kg The table below provides the information on the total steam generation capacity of various waste gas/waste heat utilizing equipments, as per manufacturer’s information.
Equipment Steam production Capacity (TPH)
Energy Content of Steam (kcal)
WHRB 1 26 ST coke 1 20989800 WHRB 2 26 ST coke 2 20989800 WHRB 3 26 ST coke 3 20989800 WHRB 4 26 ST coke 4 20989800 WHRB 5 35 ST coke+corex 5 28882000 WHRB 6 35 ST coke+corex 6 28882000

PROJECT DESIGN DOCUMENT FORM (CDM PDD) - Version 03.1. CDM – Executive Board page 33
WHRB 7 35 ST coke+corex 7 28882000 WHRB 8 35 ST coke+corex 8 28882000
BFG fired boiler 200 STBF 166200000 Total Power produced –
130MW 444
Hence in an ideal condition, wherein the power is generated using only waste gas/waste heat ,
fwg = 1 Capping of baseline emissions as per ACM 0012 As an introduction of element of conservativeness, this methodology requires that baseline emissions should be capped irrespective of planned/ unplanned or actual increase in output of plant, change in operational parameters and practices, change in fuels type and quantity resulting into increase in waste gas generation. In case of planned expansion a separate CDM project should be registered for additional capacity. The cap can be estimated using the two methods described below. Project proponents shall use method 1 to estimate the cap if data is available. In case of project activities using waste pressure to generate electricity or is implemented in a new facility, method 2 shall be used. Method-2: The manufacturer’s data for the industrial facility shall be used to estimate the amount of waste gas/heat/pressure the industrial facility generates per unit of product generated by the process that generates waste gas/heat/pressure (either product of departmental process or product of entire plant, whichever is more justifiable and accurate). In case any modification is carried out by project proponent or in case the manufacturer’s data is not available for an assessment should be carried out by independent qualified/certified external process experts such as a chartered engineer on a conservative quantity of waste gas generated by plant per unit of product manufactured by the process generating waste gas/heat/pressure. The value arrived based on above sources of data, shall be used to estimate the baseline cap (fcap). The documentation of such assessment shall be verified by the validating DOE. The basis for using the capped value, (including manufacturer’s design document/letter and the expert’s analysis) should be provided to DoE during validation. Under this method, following equations should be used to estimate fcap.
Where:

PROJECT DESIGN DOCUMENT FORM (CDM PDD) - Version 03.1. CDM – Executive Board page 34 QWG, BL Quantity of waste gas generated prior to the start of the project activity estimated using equation 1f-1. (Nm3) Q BL product , Production by process that most logically relates to waste gas generation in baseline. This is estimated based on 3 years average prior to start of project activity. q wg, product Amount of waste gas/heat/pressure the industrial facility generates per unit of product generated by the process that generates waste gas/heat/pressure. As per manufacturer’s specification: Quantity of coke oven waste gas QWG,BL coke = QBL,coke * , q wg, coke
= 103330 Nm3/hr31
Total Blast furnace gas production at BF-3 = QBL,hot metal * , q wg,hot metal = 32532 MT/hr of hot metal * 1610 Nm3/hr
= 523500 Nm3/hr Quantity of Blast Furnace gas used for power generation after in house consumption
QWG,BL hot metal = 180000 Nm3/hr
Quantity of HAG gas used for power generation = 40000 Nm3/hr (Max) The value of fcap will be equal to 1 as the project is a new installed facility in the planned expansion of the manufacturing unit. Project Emissions include emissions due to combustion of auxiliary fuel to supplement waste gas and electricity emissions due to consumption of electricity for cleaning of gas before being used for generation of heat/energy/electricity.
Where: PEy Project emissions due to project activity. PE AF y, Project activity emissions from on-site consumption of fossil fuels by the cogeneration plant(s), in case they are used as supplementary fuels, due to non-availability of waste gas to the project activity or due to any other reason. PE EL y, Project activity emissions from on-site consumption of electricity for gas cleaning equipment. 1) Project emissions due to auxiliary fossil fuel
These emissions are calculated by multiplying the quantity of fossil fuels (FFi,y) used by the recipient plant(s) with the CO2 emission factor of the fuel type i (EFCO2,i), as follows: 31 It should be noted that no guarantee was given by the coke oven supplier for quantity of waste gas generation from the coke oven plant. 32 As per the technical specifications of VAI

PROJECT DESIGN DOCUMENT FORM (CDM PDD) - Version 03.1. CDM – Executive Board page 35
Where: PEAF,y are the emissions from the project activity in year y due to combustion of auxiliary fuel in tonnes of CO2 FFi,y is the quantity of fossil fuel type i combusted to supplement waste gas in the project activity during the year y, in energy or mass units NCVi is the net calorific value of the fossil fuel type i combusted as supplementary fuel, in TJ per unit of energy or mass units, obtained from reliable local or national data, if available, otherwise taken from the country specific IPCC default factors EFCO2,i is the CO2 emission factor per unit of energy or mass of the fuel type i in tons CO2 obtained from reliable local or national data, if available, otherwise taken from the country specific IPCC default factors As per the project activity LPG is used as auxiliary fuel in HAG’s and Boiler-9. As the emission due to firing of the above mentioned auxiliary fuels is negligible the project emission due to auxiliary fuel consumption s considered as zero. 2) Project emissions due to electricity consumption of gas cleaning equipment Project emissions are calculated by multiplying the CO2 emission factor for electricity (EFCO2,EL) by the total amount of electricity used as a result of the project activity (ECPJ,y). The source of electricity may be the grid or a captive power plant. Project emissions from consumption of additional electricity by the project are determined as follows:
Where: PEEL,y = Project emissions from consumption of electricity in gas cleaning equipment of project activity (t CO2/yr) ECPJ,y = Additional electricity consumed in year y as a result of the implementation of the project activity (MWh) EFCO2,EL,y = CO2 emission factor for electricity consumed by the project activity in year y (t CO2/MWh) The total auxiliary power consumed in GCP is 1135 MWh as per the rated capacity. But as the source of electricity is waste gas/waste heat based power generation unit, the emission factor for the power consumed will be equal to zero.
B.6.2. Data and parameters that are available at validation:
Data / Parameter: nBL

PROJECT DESIGN DOCUMENT FORM (CDM PDD) - Version 03.1. CDM – Executive Board page 36 Data unit: % Description: Baseline efficiency of the captive power plant Source of data used: As per the information provided by equipment suppliers
Value applied: 34.77 % Justification of the choice of data or description of measurement methods and procedures actually applied :
The net efficiency of baseline captive power plant has been calculated considering gross heat rate of 2300 kcal/kwh .
Any comment: This value will remain constant throughout crediting period
Data / Parameter: EFelec,i,j,y Data unit: tCO2/Mwh Description: CO2 emission factor for the electricity source i (i=gr (grid) or i=is (identified
source)) , displaced due to the project activity, during the year y
Source of data used: Calculated as per supplier’s information Value applied: 0.98 Justification of the choice of data or description of measurement methods and procedures actually applied :
The emission factor of the baseline electric source will be calculated based on ACM 0012 by considering the following parameters
1) Emission factor of the fuel used in the baseline scenario. 2) Efficiency of captive power plant considered in the baseline scenario.
Any comment: This value will remain constant throughout crediting period
Data / Parameter: QWG,BL, coke Data unit: m3/hr Description: Estimated quantity of flue gas that will be generated from coke oven. Source of data used: Manufacturer’s specifications Value applied: 103330 Justification of the choice of data or description of measurement methods and procedures actually applied :
Estimated based on information provided by the technology supplier.33
Any comment: - Data / Parameter: QWG,BL hot metal Data unit: Nm3/hr 33 No guarantee was given by the equipment supplier on the quantity of waste gas generation from the coke oven plant.

PROJECT DESIGN DOCUMENT FORM (CDM PDD) - Version 03.1. CDM – Executive Board page 37 Description: Estimated quantity of waste gas available for power generation from Blast
Furnace during production of hot metal, after in house consumption. Source of data used: Manufacturer’s specifications Value applied: 5,23,500 Justification of the choice of data or description of measurement methods and procedures actually applied :
Estimated based on information provided by the technology supplier on the waste gas generation per unit of product and volume or quantity of production.
Any comment: - Data / Parameter: QBL, hot metal Data unit: Tons/hr Description: Quantity of hot metal produced per hour Source of data used: Manufacturer’s specifications Value applied: 325 Justification of the choice of data or description of measurement methods and procedures actually applied :
Estimated based on information provided by the technology supplier on the quantity of production.
Any comment: -
Data / Parameter: qwg, hot metal Data unit: m3/Ton Description: Specific waste gas production from Blast Furnace per unit of hot metal
produced as per manufacturer’s or external expert’s data.
Source of data used: As per manufacturer specification’s
Value applied: 1610 Nm3/tonne of hot metal production Justification of the choice of data or description of measurement methods and procedures actually applied :
Information provided by the technology supplier
Any comment: - B.6.3 Ex-ante calculation of emission reductions:
Sr. No Description Unit
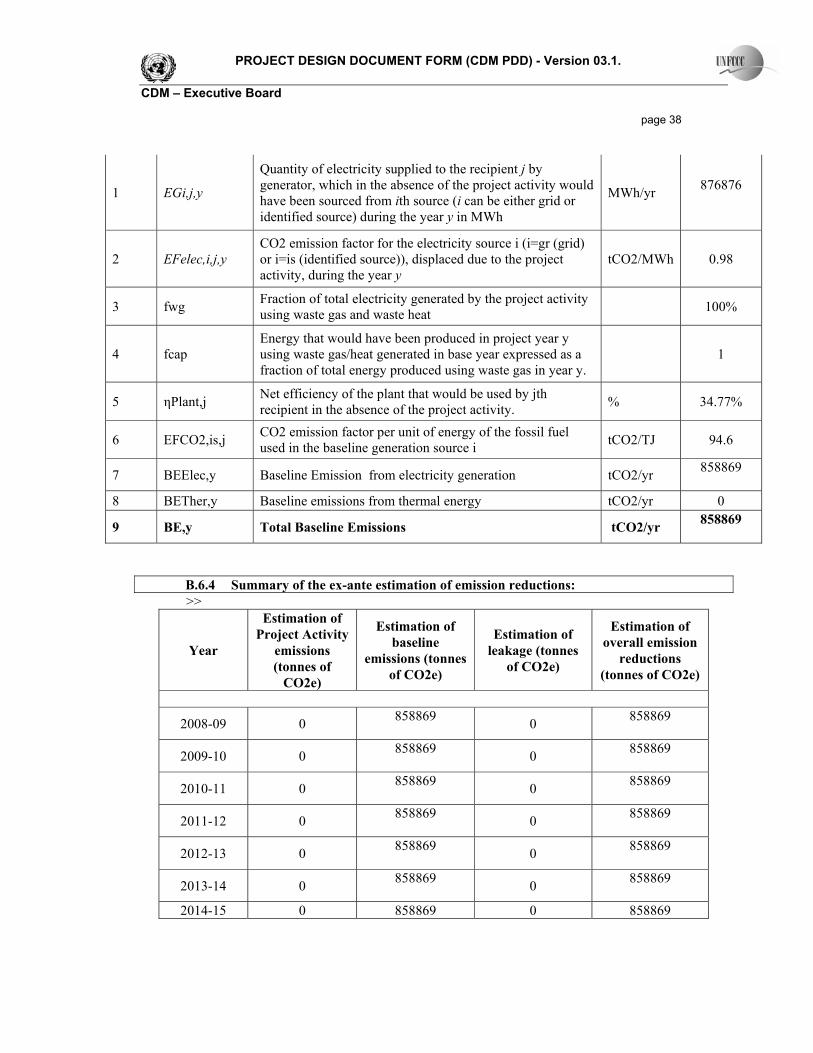
PROJECT DESIGN DOCUMENT FORM (CDM PDD) - Version 03.1. CDM – Executive Board page 38
1 EGi,j,y
Quantity of electricity supplied to the recipient j by generator, which in the absence of the project activity would have been sourced from ith source (i can be either grid or identified source) during the year y in MWh
MWh/yr 876876
2 EFelec,i,j,y CO2 emission factor for the electricity source i (i=gr (grid) or i=is (identified source)), displaced due to the project activity, during the year y
tCO2/MWh 0.98
3 fwg Fraction of total electricity generated by the project activity using waste gas and waste heat 100%
4 fcap Energy that would have been produced in project year y using waste gas/heat generated in base year expressed as a fraction of total energy produced using waste gas in year y.
1
5 ηPlant,j Net efficiency of the plant that would be used by jth recipient in the absence of the project activity. % 34.77%
6 EFCO2,is,j CO2 emission factor per unit of energy of the fossil fuel used in the baseline generation source i tCO2/TJ 94.6
7 BEElec,y Baseline Emission from electricity generation tCO2/yr 858869
8 BETher,y Baseline emissions from thermal energy tCO2/yr 0
9 BE,y Total Baseline Emissions tCO2/yr 858869
B.6.4 Summary of the ex-ante estimation of emission reductions: >>
Year
Estimation of Project Activity
emissions (tonnes of
CO2e)
Estimation of baseline
emissions (tonnes of CO2e)
Estimation of leakage (tonnes
of CO2e)
Estimation of overall emission
reductions (tonnes of CO2e)
2008-09 0 858869 0 858869
2009-10 0 858869 0 858869
2010-11 0 858869 0 858869
2011-12 0 858869 0 858869
2012-13 0 858869 0 858869
2013-14 0 858869 0 858869
2014-15 0 858869 0 858869

PROJECT DESIGN DOCUMENT FORM (CDM PDD) - Version 03.1. CDM – Executive Board page 39
2015-16 0 858869 0 858869
2016-17 0 858869 0 858869
2017-18 0 858869 0 858869
Total
(tonnes of CO2e)
0 8,588,690 0 8,588,690
B.7 Application of the monitoring methodology and description of the monitoring plan:
B.7.1 Data and parameters monitored: Data / Parameter: NCVi
Data unit: Kcal/kg Description: Net calorific value of the LPG Source of data: LPG Supplier’s data Value of data 10910 Description of measurement methods and procedures to be applied:
Analyzed in JSWSL Chemistry laboratory & hard copy is maintained in a file by operation support Engineer
QA / QC procedures Not applicable Any comment: NCV data collected from LPG gas supplier i.e. M/s Elf and stored in hard copy
with the control room shift in-charge
Data / Parameter: Ffiy Data unit: Ton/annum Description: LPG used to supplement waste gas in the project activity Source of data: Generation report Value of data 0.36 Description of measurement methods and procedures to be applied:
Use of number of LPG cylinders recorded on daily basis and consumption of LPG recorded on a monthly basis.
Monitoring frequency: On daily basis & aggregated monthly QA / QC procedures Part of ISO 9001 documentation Any comment: LPG is used as start up fuel for a short duration of 10 – 20 seconds during start
up of HAGs and boiler-9. Data / Parameter: EGj,y

PROJECT DESIGN DOCUMENT FORM (CDM PDD) - Version 03.1. CDM – Executive Board page 40 Data unit: MWh/annum Description: Quantity of electricity supplied to the recipient j by the generator, which in the
absence of project activity would have sourced from ith source (i can be either grid or identified source) during the year y in MWh
Source of data: Generation report file of cpp-2_opn_shared folder at control room shift in charge computer
Value of data 876876
Description of measurement methods and procedures to be applied:
Readings are taken by recipient from 0.2 class energy meter installed in the recipients panel and also standby auxiliary power consumed from RMHS noted from 0.2 class energy meter. Net power supplied to recipient j is the difference of energy meter reading of recipient and energy meter reading of RMHS.
Monitoring frequency: Monthly QA / QC procedures The accuracy level of all the electricity meters under the control of the project
participant is of accuracy class 0.2. The measurement and calibration procedure shall be done as specified in the CEA (Government/Regulatory authority) regulations. The measurement will be done on-line and the data is recorded in the control system. Thus, the uncertainty level of this data is low
Any comment: No additional QA/QC procedures will be applied.Reading are taken on daily basis. RMHS energy meter available in switch gear room of CPP2
Data / Parameter: EFCO2,I Data unit: Tonnes CO2 / TJ Description: CO2 emission factor per tonne of fuel (coal) used Source of data to be used:
IPCC Default Value
Value of data 94.6 Description of measurement methods and procedures to be applied:
As per IPCC, the emission factor for coal is 25.8 tC/TJ
QA/QC procedures to be applied:
No QA/QC procedure is required
Any comment: -
B.7.2 Description of the monitoring plan: The project is operated and managed by JSWSL which is the project proponent. JMD and CEO has constituted the main CDM project team, which is responsible for the project activity. The team comprising of 1) In charge of JSWSL CPP2 (O&M) 2) Operation support Engineer and 3) In charge, Electrical & Instrumentation would be responsible for monitoring, verification and recording of the data.

PROJECT DESIGN DOCUMENT FORM (CDM PDD) - Version 03.1. CDM – Executive Board page 41 JSWSL has a well diversified procedure for collection of data and analysis of data at different levels and for subsequent corrective actions. Inspection and record daily check list of critical parameters of project activity is maintained. The maintenance staff access the condition of all the power plant equipment and measuring equipment and any action required is taken.
Monitor and verify the CDM project and data. List of Key person: Project Head : JMD Project Executor and Controller : JSWSL CPP2 (O & M) Site Main Controller : Operation support engineer Controller : In charge ( E &I )
Designation Responsibility Project Head: Registration
Project Executer and Controller:Project Execution and Operation.
Control of documents. Site Main Controller Monitoring & Verification of
data (once in a day), Operation
Project Head
Project Executer and Controller
Site Main Controller
P R O J E C T T E A M
Maintenance Engineer
Operator
Controller

PROJECT DESIGN DOCUMENT FORM (CDM PDD) - Version 03.1. CDM – Executive Board page 42
Controller Monitoring of data collection Checking of data, Operation, Power generation, Data collection, Checking data accuracy, Data recording cross checking.
Maintenance Engineer Mechanical Maintenance, Energy Input meter monitoring & Maintenance, Energy output meters, WHRB maintenance, BFG boiler maintenance, TG, and Pump House.
Operator Data collection, data recording, data storage
JSWSL has been covered under all the three management System i.e. ISO 9001, ISO 14001 and OHSAS 1800134. Accordingly, the monitoring plan used herein shall become an integral part of the Management Programmes and would be constituent of operational and management structure of this Environment Management System. B.8 Date of completion of the application of the baseline study and monitoring methodology and the name of the responsible person(s)/entity(ies) >> Date of completing the final draft of this baseline section (DD/MM/YYYY): 05/11/2007 Name of person/entity determining the baseline: JSWSL and CantorCO2e India Private Limited SECTION C. Duration of the project activity / crediting period C.1 Duration of the project activity: C.1.1. Starting date of the project activity: >> 20/09/2005 C.1.2. Expected operational lifetime of the project activity: >> 25 years.
34 Evidence that All the three Mangement systems exist/certificates

PROJECT DESIGN DOCUMENT FORM (CDM PDD) - Version 03.1. CDM – Executive Board page 43 C.2 Choice of the crediting period and related information: C.2.1. Renewable crediting period C.2.1.1. Starting date of the first crediting period: >> NA C.2.1.2. Length of the first crediting period: >> NA C.2.2. Fixed crediting period: C.2.2.1. Starting date: >> 01/03/2008 C.2.2.2. Length: >> 10 years 0 months SECTION D. Environmental impacts >> D.1. Documentation on the analysis of the environmental impacts, including transboundary impacts: >> An environmental Impact Assessment for the proposed project has been undertaken and copy of the report would be made available to the DOE. The summary of the main impacts are as follows. Environmental component Environmental impact Water environment 8488 m3/day water will be used in the process for cooling. The cycle of
concentration of about 5 in the water circulation system is adopted. Approximately 720 m3/day of blow down water will be discharged from the plant. There would be significant impact on the environment, if it is not treated to meet the norms laid down by Karnataka State Pollution Control Board (KSPCB) or even treated by chromate based chemicals.
Air environment
The proposed activity utilizes waste heat for power generation, which otherwise would have been let into the atmosphere. Hence, there in no generation of any primary and secondary pollutants. On the contrary, commissioning of a similar capacity coal based power plant would result in the following emissions SPM – 75 mg/m3 SO2 – 1256 mg/m3

PROJECT DESIGN DOCUMENT FORM (CDM PDD) - Version 03.1. CDM – Executive Board page 44
NOx – 800 mg/m3 These emissions are avoided in the waste heat / gas based power generation.
Noise environment The major source of noise identified due to the proposed activity would be from
Steam turbine generator Boiler house Combustion induced noises Flow induced noises
which may have a resonating effect Land environment There would not be any critical land use changes or disturbances as the
proposed power plant is coming up within the JSW complex. No displacement of habitation is envisaged. The proposed utility would be an entirely waste free activity (no ash generation), as it is based on waste gas utilisation for electricity generation. The impact due to discharge of water on land may be envisaged if it does not meet the discharge standards for on land irrigation laid down by KSPCB.
Ecological environment The impact on the flora and fauna will be envisaged if the water does not meet the discharge standards for on land irrigation laid down by KSPCB.
Socio – economic environment The proposed power generation activity would provide employment and livelihood opportunities and hence improve the quality of life of the people in the surrounding habitations. The impact is minor positive.
There are no trans-boundary impacts due to the project activity. D.2. If environmental impacts are considered significant by the project participants or the host Party, please provide conclusions and all references to support documentation of an environmental impact assessment undertaken in accordance with the procedures as required by the host Party: >> Indian environmental regulations (EIA notification under the Environmental Protection Act, 1986) do not require an EIA to be prepared for the CDM project for obtaining clearances and permits. The project proponents have prepared an EIA to be cognizant of the impacts and take mitigation measures as needed. A summary of the main mitigation measures and residual impacts is presented in the table below. Mitigation measures Residual impacts Water – Phosphate based chemicals (Anti-scalant / anti-corrosive agents and dispersants) will be used to maintain the circulating water chemistry. To control the algal growth, chlorine is dosed. To maintain the water chemistry, blow down needs to be taken. The blow down collected in a guard pond will be used for coke quenching in coke oven & for greenbelt development. The blow down water quality will be within the discharge standards of Karnataka State Pollution Control Board specified
Regular monitoring of TDS, phosphates, chlorides, hardness, PH, oil & grease in the circulation water will be carried out. The blow down water meeting the KSPCB discharge norms will be used for greenbelt development within the JVSL premises. Residual impacts – Nil as • The blow down water from the power plant
meets the discharge norms of KSPCB.

PROJECT DESIGN DOCUMENT FORM (CDM PDD) - Version 03.1. CDM – Executive Board page 45 for on land irrigation. Noise – Acoustic measures, dampers, and insulators will be provided in the Steam turbine generator, Boiler house and such other areas to reduce vibrations and resonating effect of gas flow. Ear plugs & ear muffs will be used where the exposure to noise is more than 85 dB (A).
Residual impacts – marginal
Land – The blow down water used for greenbelt development / irrigation will be meeting discharge standards of KSPCB.
Residual impacts – Nil as the blow down water quality meets the standards stipulated by KSPCB for on land irrigation.
SECTION E. Stakeholders’ comments >> E.1. Brief description how comments by local stakeholders have been invited and compiled: >> The stakeholders for the project activity were identified at the outset by a team of JSW Steel staff and the stakeholders were duly informed of the consultation meeting. In addition public notices were also issued for the local stakeholder consultation meeting. Local stakeholder consultation meeting to discuss stakeholder concerns on the proposed Clean Development Mechanism (CDM) project – waste gas use for electricity generation at JSW Steel, was held at 11:00 a.m. on 26th May 2007 at J Max, JVSL Township, Vidyanagar, Dist. Bellery, Karnataka, India. The local stakeholders appreciated the CDM initiative and applauded the fact that it would be without additional resource use and also without emissions of harmful gases. The stakeholders viewed JSW Steel as a reputed company contributing to local environmental benefits and socio-economy through such initiatives. Overall there was unanimous agreement that the project activity was really a proactive initiative by the project party, which contributes, to the sustainable development. E.2. Summary of the comments received: >> Stakeholder concerns / question / comment
Answer / clarifications
What is waste gas? Any fuel, after burning leads to high temperature gases. The radiant and sensible heat of these gases is used to heat substances, like steel in our furnaces. After its use, the gases are exhausted to the atmosphere. These gases which are exhausted are called waste gases.
What is the adverse impact of waste heat & waste gas which was being flared or emitted into the atmosphere
Waste heat is “energy” wasted. If we are able to utilize this waste heat, the requirement of fuel in steel making comes down. This means that our process becomes efficient, our costs comes down and more importantly, less use of fuel reduces the carbon dioxide to the atmosphere, which is a green house gas.
Why should you reduce GHG All the nations ratifying Kyoto Protocol have recognized the need to

PROJECT DESIGN DOCUMENT FORM (CDM PDD) - Version 03.1. CDM – Executive Board page 46 Stakeholder concerns / question / comment
Answer / clarifications
emissions while it is the commitment of developed nations?
reduce emissions of GHG’s. Since Government of India has ratified the protocol, we have taken these initiatives which would also improve the local environment
Does this project lead to increase in discharge of gaseous, liquid and/or solid wastes? If yes, what are the impacts?
By using waste heat, we are reducing the use of fuel. Thus there will be reduction in the release of gaseous emissions, which will mean fewer effluents and much fewer wastes. The impact is positive to the environment.
Which division of the ministry in environment and forest handles climate change?
There is a climate change division in MoEF and Mr. R.K.Sethi, Director, heads this Division. You can know more details by logging on to www.envfor.nic.in
What development in the region can be availed from the projects?
The implementation of these projects will lead to direct and indirect employment to the people in the surrounding areas. Development of any kind will lead to improvements in infrastructure, local economy and the quality of life in the area.
Does the project increase employment opportunities in the area?
The implementation of these projects will mean installation of new equipment, facilities and systems. We will require men to operate these facilities efficiently.
E.3. Report on how due account was taken of any comments received: >> The stakeholders were provided clarifications on the issues raised as above to their satisfaction. None of the concerns expressed by the stakeholders required an action to be taken by the JSW Steel during the project operation and at any other stage.
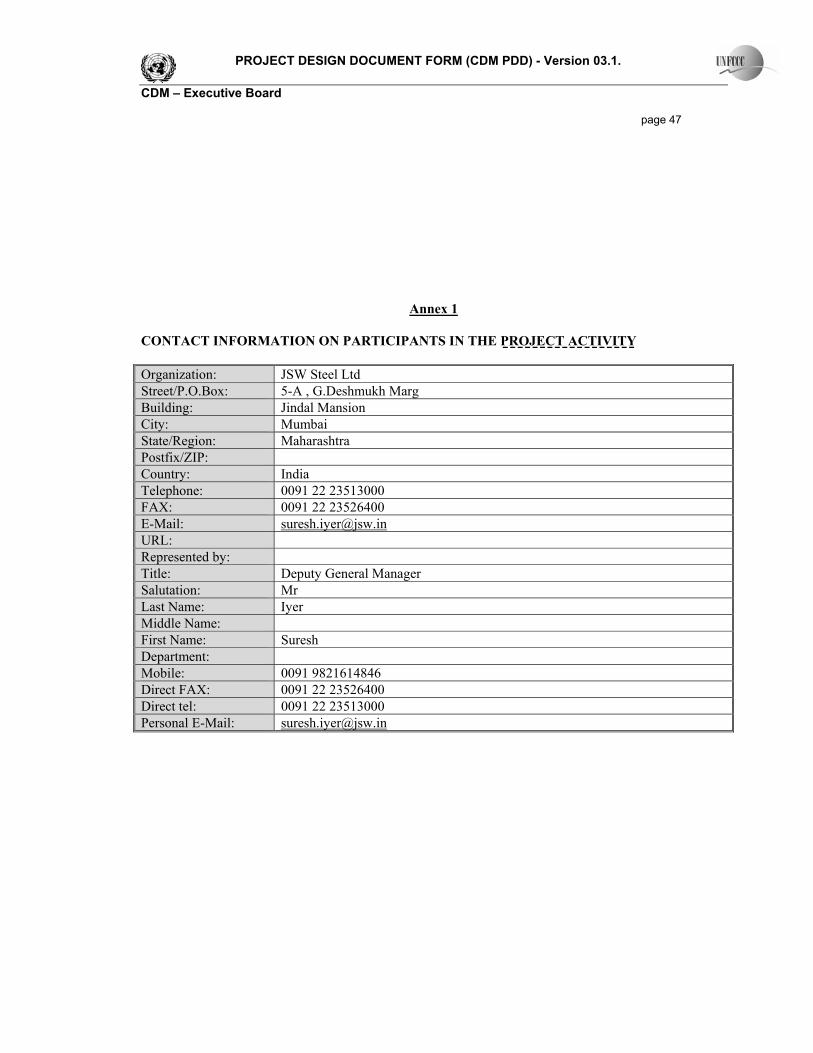
PROJECT DESIGN DOCUMENT FORM (CDM PDD) - Version 03.1. CDM – Executive Board page 47
Annex 1 CONTACT INFORMATION ON PARTICIPANTS IN THE PROJECT ACTIVITY Organization: JSW Steel Ltd Street/P.O.Box: 5-A , G.Deshmukh Marg Building: Jindal Mansion City: Mumbai State/Region: Maharashtra Postfix/ZIP: Country: India Telephone: 0091 22 23513000 FAX: 0091 22 23526400 E-Mail: [email protected] URL: Represented by: Title: Deputy General Manager Salutation: Mr Last Name: Iyer Middle Name: First Name: Suresh Department: Mobile: 0091 9821614846 Direct FAX: 0091 22 23526400 Direct tel: 0091 22 23513000 Personal E-Mail: [email protected]

PROJECT DESIGN DOCUMENT FORM (CDM PDD) - Version 03.1. CDM – Executive Board page 48
Annex 2
INFORMATION REGARDING PUBLIC FUNDING No funding from any Annex I party has been taken.

PROJECT DESIGN DOCUMENT FORM (CDM PDD) - Version 03.1. CDM – Executive Board page 49
Annex 3
BASELINE INFORMATION Please refer section B.1, B.3 and B.4
Annex 4
MONITORING INFORMATION The monitoring plan has been prepared in accordance with ACM 0012.The project proponent has a well defined project management structure for monitoring the project activity. The monitoring plan is discussed in section B.7.2.