clean energy for the mena region’s tomorro gas investors...clean energy for the mena region’s...
TRANSCRIPT

www.danagas.com 1
Dana Gas Investor Presentation
November 2013
Clean Energy For the MENA Region’s Tomorrow

www.danagas.com
Forward Looking Statement
This presentation contains forward-looking statements which may be identified by their use of words like “plans,” “expects,” “will,” “anticipates,” “believes,” “intends,” “projects,” “estimates” or other words of similar meaning. All statements that address expectations or projections about the future, including, but not limited to, statements about the strategy for growth, product development, market position, expenditures, and financial results, are forward looking statements.
Forward-looking statements are based on certain assumptions and expectations of future events. The Company, its subsidiaries and its affiliates (the “Companies”) referred to in this presentation cannot guarantee that these assumptions and expectations are accurate or will be realised. The actual results, performance or achievements of the Companies, could thus differ materially from those projected in any such forward-looking statements. The Companies assume no responsibility to publicly amend, modify or revise any forward looking statements, on the basis of any subsequent developments, information or events, or otherwise.
2

www.danagas.com
Presentation Outline
� The MENA Region and its relevance
� Dana Gas: A Brief Overview
� Recent Performance
� Country Operations
� Valuations
� Summary
3

www.danagas.com
Focused on a region that holds the largest share of global conventional oil & gas reserves and production
Countries included:
Iran, Iraq, Saudi Arabia, United Arab Emirates,
Qatar, Kuwait, Oman Syria, Jordan, Egypt, Libya,
Tunisia & Algeria
Source: BP Statistical Review 2013
Proved Oil Reserve (2012)
Proved Gas Reserve (2012) Global Gas Production (2012)
Global Oil Production (2012)
4
6614 Tcf
1669 Bln
bbl
118
Tcf p.a
86.2 mln bopd

www.danagas.com
Natural Gas fast becoming the Fuel of Choice for the growing energy demand in MENA and else where
5
Global Population Trends(Source: UN)
Global Primary Energy Demand(Source: IEA)
� Growing economies fueling demand for energy
� Increased demand for denuclearization
� 70% less CO2 than coal in power generation (old plants)
� Small physical footprint versus coal, nuclear or renewables
� Able to operate near full capacity reliably all the time
� Increasing pan-geographic pipeline connectivity and growing LNG trade addressing cross-border product demand
� Globally, in 2012 c.25 bn boe of discoveries were made, of which, c.70% were natural gas (100 TCF)
� 250+ years of conventional / unconventional (shale gas) reserve life
www.danagas.com
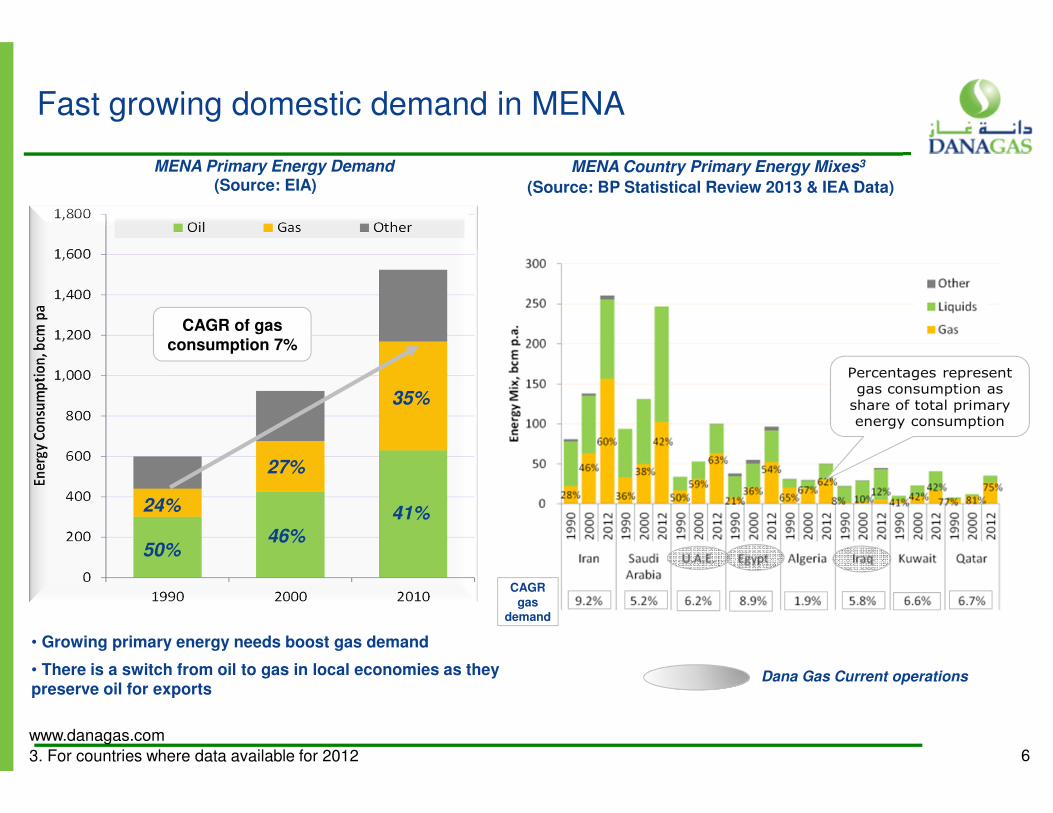
Fast growing domestic demand in MENA
3. For countries where data available for 2012
MENA Country Primary Energy Mixes3MENA Primary Energy Demand(Source: EIA) (Source: BP Statistical Review 2013 & IEA Data)
• Growing primary energy needs boost gas demand
• There is a switch from oil to gas in local economies as they preserve oil for exports
50%
35%
46%
27%
41%24%
CAGR of gas consumption 7%
CAGRgas
demand
6
Percentages represent gas consumption as share of total primary energy consumption
Dana Gas Current operations
CAGRgas
demand

www.danagas.com
Dana Gas: A Brief Overview
7

www.danagas.com
Independent E&P company listed on the ADX
� Dana Gas is a MENASA focused gas independent headquartered in the UAE
� Dana Gas is quoted in the UAE stock exchange (Abu Dhabi Securities Exchange). Bloomberg: DANA:UH
� Shares outstanding: 6,602 millionMarket capitalisation: approx. $1.2 billionEnterprise value: $1.8 billion
� Net Debt/(Cash)1: $629 million
� Current Production: 63.4 kboed (9M 2013)
� 2P Reserves2 : 147 mmboe
� Strong Corporate Governance structure and a unique pan-MENA Board of Directors access to business opportunities in the world’s largest hydrocarbon region
1.Total interest bearing debt less cash 2.Includes Egypt & UAE reserves only
Dana Gas is operating at the heart of the World’s Largest Hydrocarbon region
8

www.danagas.com
Board of Directors consisting of luminaries from the MENA region provide unparalleled access to key markets
9
Dr. Adel Al Sabeeh
Chairman
KUWAITFormer Oil Minister of
Kuwait, Chairman & MD of
National Industries Company
(NIC)
Dr. Tawfeeq Al Moayed
Deputy Chairman
BAHRAINChairman of T.A. Almoayed
& Sons W.L.L. and Chairman
of Almoayed Wilhelmsen
Hamid Jafar
UAEChairman of Crescent
Group of Companies
Sheikh Sultan Bin Ahmed
Al Qasimi
UAEDeputy Chairman of Sharjah
Petroleum Council &
Chairman of Sharjah Pipeline
Co
Ahmed Al Arbeed
KUWAIT Former Chairman of Board
of Directors of Kuwait Oil
Co. (KOC), GM of Seven
Sisters Company
Saeed Arrata
EGYPTChairman of Sea Dragon
Energy Company
Ziad Galadari
UAEFounder & Chairman of
Galadari Advocates & Legal
Consultants
Majid Jafar
Managing Director of the
Board - UAECEO of Crescent Petroleum,
and Vice-Chairman of the
Crescent Group of
Companies
Rashid Al Jarwan
Executive Director
UAEFormer GM of ADGAS, Board
Director of Emirates General
Petroleum Corporation ,
Oman Insurance Company
and DIFC Investments
Abdulaziz Al Jomaih
SAUDI ARABIAMD of International
Investments of Aljomaih
Group

www.danagas.com
10
Board of Directors consisting of luminaries from the MENA region providing unparalleled access to key markets
Abdullah Al Majdouie
SAUDI ARABIAGroup President and Vice
Chairman of the Almajdouie
Group
Ahmed Al Midfaa
UAEChairman of Sharjah
Chamber of Commerce &
Industry, Expo Centre
Sharjah and Ruwad
Establishment in Sharjah
Varouj Nerguizian
UAEED & GM of Bank of Sharjah,
Chairman and GM of
Emirates Lebanon Bank SAL
Nasser Al Nowais
UAEChairman of Rotana Hotels,
MD of Abu Dhabi Trade
Centre
Salah Al Qahtani
SAUDI ARABIAVice Chairman of Abdel Hadi
Abdullah Al-Qahtani & Sons
Group of Companies
Khalid Al Rajhi
SAUDI ARABIACEO of Al-Rajhi Partners &
Al- Rajhi Holdings
Rashad Al Zubair
OMANChairman of The Zubair
Corporation

www.danagas.com
Portfolio with substantial upside
11

www.danagas.com
Proven track record based on top class exploration, accelerated development and inorganic opportunities
� Drill bits success– Nile delta exploration success– Reserve growth
� M&A– Egypt entry: acquisition of Centurion Energy– KRI partnership structure in Pearl Petroleum
for long term gas monetisation– Komombo farm out
� Project Delivery– Timely completion and on budget on key
projects– Production build up in Egypt– Fast track KRI development– Nile Delta development (best-in-class
discovery-to-gas of 12 months; Allium production commenced in 3 months)
– Managed investments in sync with receivables
� Major financial transactions– IPO in 2005 attracting $78 billion– $ 1 billion Sukuk issue in 2007– $ 850 million Sukuk restructuring in 2013
Exploration
M&AProject Delivery
√ Nile Delta Exploration2007-2012
(47 exploratory wells with success rate of 53%)
√ Centurion Energy (2006)- $1.1 billion
√ Komombo farm-out (2009) –$45 million
√ Nile Delta Production (2007-
√ Kor Mor 180k.m. onshore pipeline+ Gas production (2008 -
Value Delivery Model
√ Pearl Petroleum (2009) –Farm out to MOL & OMV - $370
million
√ Egypt LPG plant (2012 -
√ UAE subsea pipeline + gas sweetening plant (2006 -
√ Kor Mor LPG plant (2010 -
12

www.danagas.com
International and Experienced Management Team
13
Patrick Allman-WardCEO
Over 30 years in the Oil & Gas business. Held senior roles at Shell as VP Exploration Asia-
Pacific, CEO and Board Director of the South Rub Al Khali
Company (JV between Shell, Total & Saudi Aramco). Width of experience spanning the entire
upstream value chain from exploration to project
management to delivering sustainable returns across
multiple geographies in the Far East, Middle East, Europe and
Africa
Rashid Al JarwanExecutive Director
Over 35 years in Oil & Gas, held the position of Acting CEO and
GM in Dana Gas. Board of Directors at Emirates General Petroleum Corporation, Oman Insurance Company and DIFC Investments. Also held various
executive and technical positions in ADNOC Group of companies for 28 years. Served as a Board
Member of the National Petroleum Construction Co., the National Drilling Co. & Sharjah
Industrial Development Co.
Mark FentonDGE– General Manager
Over 28 years of experience in operating oil and gas
companies, 17 years of which working with Shell International.
He has experience in both offshore and onshore oil field developments, particularly in
the Middle East. He has held a range of technical,
management and executive positions in oil companies. He
is Member of the Society of Petroleum Engineers (SPE)
Robinder SinghIR Director
Over 25 years of international experience in Investor Relations,
marketing and corporate communications, product
management and business development with Reliance
Industries, HSBC and Bank of America. Experienced in multiple
billion dollar financial transactions; developing investor
support for large scale capital raising programmes and a range
of mergers and acquisitions

www.danagas.com
0
20
40
60
80
Dana Gas Genel DNO Kuwait Energy
Corp
Pico GKP
H1 2
013
WI P
rodu
ctio
n (0
00 b
oe/d
)
0
20
40
60
80
Dana Gas Genel DNO Kuwait Energy
Corp
Pico GKP
H1 2
013
WI P
rodu
ctio
n (0
00 b
oe/d
)
0
200
400
600
800
1000
1200
1400
GKP Genel Dana Gas DNO Kuwait
Energy Corp
Pico
WI C
omm
erci
al a
nd
Tech
nica
l Res
erve
s
(mm
boe)
Technical
Commercial
0
200
400
600
800
1000
1200
1400
GKP Genel Dana Gas DNO Kuwait
Energy Corp
Pico
WI C
omm
erci
al a
nd
Tech
nica
l Res
erve
s
(mm
boe)
Technical
Commercial
Largest independent gas producer amongst regionally owned peers
Reserve Ranking of MENA region owned Independent E&P companies(Source: Woodmac)
Production Ranking of MENA region owned Independent E&P companies(Source: Woodmac)
Privately owned
6
5
5. Working Interest Commercial: Fields in production, under development or likely to be developed in the near future; Technical: unlikely to be developed in the next 2-5 years, but with potential for commerciality 14

www.danagas.com
Key Financial Metrics have doubled in 6 years
Revenue: Profit After Tax:
Operations Cash Flow: EBITDAX:
15

www.danagas.com
Dana Gas: Recent Performance Highlights
16

www.danagas.com
3Q/9M 2013 Performance Highlights
17
Production
� Group production up at 63,400 BOEPD, up by 6% on a year-on-year basis
� In Egypt, total production up 16% to 36,100 BOEPD and in July 2013 achieved highest production
(39,000 BOEPD) since 2011
� Production in Kurdistan Region of Iraq remained flat at just over 27,000 BOEPD
Financials
� Profit After Tax of $ 121 million for 9M 2013, decline of 10% on a year-on-year basis due to weaker
hydrocarbon prices and suspension of LPG since mid 2012. LPG capacity has been restored in July
2013
� $ 132 million collected in 9M 2013 compared to $ 229 million in 9M 2012. Collections were mainly
lower in Egypt which was negatively impacted by macro economics during the period.

www.danagas.com
9M 2013 Financial Performance
18
(In $ million) 9M – 2013 9M – 2012Percentage
Change
Gross Revenue 466 482 (3)
Net Profit 121 134 (10)
EBITDAX 261 311 (16)
EPS (AED fils) 6.7 7.5 (11)
� Higher production in Egypt offset by lower hydrocarbon prices in 9M 2013 and suspension of LPG
production in KRI since June 2012
� Decline in revenue and higher cost of sales impacted net profit, which was lower by 10%
� EBITDAX lower by 16%

www.danagas.com
Dana Gas: Country Business Highlights
19

www.danagas.com 20
� Economic and political situation appears to be gradually stabilizing
� Egyptian government continues to confirm its commitment to subsidy removal including
implementation plans for high consumption industrials by end 2013
� Staring to see signs of consolidation - Apache sale to Sinopec announced
� Government appears focused on attracting new investment in exploration and production assets
� Aim to reduce reliance on domestic production – tender for LNG receiving facilities via Floating
Storage Regasification Unit recently issued
� Egyptian government has confirmed commitment to pay down receivables by the end of Q4
announcing plan to allow producers to set-off receivables against direct export production and other
measures to reduce debt
Egypt: Business Environment

www.danagas.com
Source: BP Statistical Review 2013
Western Desert
Gulf of Suez / Sinai / Eastern Desert
Nile Delta / East Mediterranean
Dana Gas focus area in Egypt
Meaningful position in rich hydrocarbon zones in Egypt
0.0
0.2
0.4
0.6
0.8
1.0
1.2
1.4
1.6
1.8
2.0
Oil
and
Gas
Pro
duct
ion,
mln
boe
pd
Gas
Oil
0.0
0.2
0.4
0.6
0.8
1.0
1.2
1.4
1.6
1.8
2.0
Oil
and
Gas
Pro
duct
ion,
mln
boe
pd
Gas
Oil
0
2
4
6
8
10
12
14
16
18
20
Oil
and
Gas
Res
erve
s, B
n b
oe Gas
Oil
0
2
4
6
8
10
12
14
16
18
20
Oil
and
Gas
Res
erve
s, B
n b
oe Gas
Oil
Egypt Proved Oil and Gas Reserves History
Egypt has managed c. 100% reserves
replacement of oil since mid-1980s
Egypt Oil and Gas Production History
Production has stabilised in recent years following the
decline in the ‘90s
21

www.danagas.com 22
Egypt: Nile Delta Operations
El Wastani
South El Manzala
New Development Leases under Ministerial approval:– El Basant Amendment (Allium)– Balsam– Begonia
Av. Production Rate (3Q13):– 39.4 kboepd luca (+14.7%)
Projects in Progress:– El Basant Compression Station
ETD: 2H2014– EW Capacity De-bottlenecking
(200mmscf/d of rich gas)ETD: 1H2014
– Salma/Tulip tie-inETD: 1H2014
Drilling:3 wells (1 dev + 2 sidetrack) Added production: 2.4 kboepd

www.danagas.com
0
20
40
60
80
100
120
KRI Brazil Angola
Gas
Re
sou
rce
Po
ten
tial
(Tcf
)
0
20
40
60
80
100
120
KRI Brazil Angola
Gas
Re
sou
rce
Po
ten
tial
(Tcf
)
0
10
20
30
40
50
60
70
Brazil (incl Pre
Salt)
KRI Angola (incl.
Presalt)
Res
ou
rce
Po
ten
tial
(Bln
bb
l)
0
10
20
30
40
50
60
70
Brazil (incl Pre
Salt)
KRI Angola (incl.
Presalt)
Res
ou
rce
Po
ten
tial
(Bln
bb
l)Largest Investor and gas producer in high-potential Kurdistan Region of Iraq
Oil Resource Potential(Source: ANP,MNR,USGS)
Gas Resource Potential(source: MNR, ANP, Songas)
Mostly associated
gas
0
1000
2000
3000
4000
5000
6000
7000
Oil
Pro
du
ctio
n (
kbo
pd
) Tight oil
Oil
0
1000
2000
3000
4000
5000
6000
7000
Oil
Pro
du
ctio
n (
kbo
pd
) Tight oil
Oil
Top 10 sources of production growth in 2012-2030 (Source: IEA & Woodmac)
Including KRI
Pro
du
cti
on
gro
wth
0
500
1000
1500
2000
2500
2011 2012 2016E 2020E
Oil
Pro
du
ctio
n (
kbp
d)
0
500
1000
1500
2000
2500
2011 2012 2016E 2020E
Oil
Pro
du
ctio
n (
kbp
d)
KRI production growth(source: KRG,MNR)
23

www.danagas.com
Rich gas and condensate producer with strong growth track record
24
Kor Mor Field Production, Dana Gas net share

www.danagas.com 25
Operations in Kurdistan Region of Iraq
• Total net production averaged at 27,133 BOEPD during 3Q 2013:
� 132 MMSCFD of natural gas
� 5,210 Bbl/D of condensate
• Completed the new LPG loading bay resulting in restoration of the facility with capacity of 900 MT on July 17, 2013
� System fully tested
� MNR advised by letter that LPG facility is commercially ready for operations

www.danagas.com
26
� Pearl Petroleum appointed Gaffney, Cline & Associates Limited (GCA), to provide an estimate of
hydrocarbons in-place as at 31st December, 2012 for both the Khor Mor and Chemchemal fields
� GCA have estimated the gas initially in-place volumes (unrisked*) for 12 Khor Mor and 3 Chemchemal fault
blocks
� Dana Gas has calculated an aggregated arithmetic sum Best Estimate (P50) volume of 22 Tscf for Khor Mor
and 30 Tscf for Chemchemal fields. Dana Gas’ 40% share of these Best Estimate in-place volumes for Khor
Mor and Chemchemal combined corresponds to 20 Tscf
� The GCA report also indicates that both fields have considerable additional upside potential
� GCA report also stated that certain Khor Mor fault blocks may contain oil instead of gas and determined oil
initially in-place volumes (unrisked*) for these individual blocks
� Dana Gas has calculated an aggregated arithmetic sum Best Estimate (P50) in-place oil volume (unrisked*)
of around 1.8 billion barrels, in place of around 3 Tscf of gas in these blocks
* Note that a risk factor accounting for geological and commercial uncertainties has not been assessed or applied at this time.
However, both fields are surrounded by producing oil and/or gas fields which calibrates and reduces the geological and reservoir
risks. The reported hydrocarbon volumes are estimates based on professional judgment and are subject to future revisions,
upwards or downwards, as a result of future operations or as additional information becomes available.
Dana Gas Kurdistan Assets – Substantial Resources Upside*

www.danagas.com 27
UAE: Zora Gas Field Development Update
27
• Proven shallow water Gas Field across Sharjah & Ajman
• Long term concession agreement in place
• Project scope includes the following:
– Offshore platform– Offshore & Onshore Pipeline (35 km
offshore & 2.5km onshore – Gas Treatment Onshore Plant (to
receive 40 MMSCFD of gas and 300 bbl/day associated hydrocarbon condensate
• Offshore platform fabrication contract final negotiations under way.
• Contracting strategy for other scopes complete
• Terms sheet for project financing are in the process of being agreed with a prominent local bank

www.danagas.com
Dana Gas: Relative Valuations
28

www.danagas.com
5.2
2.8 2.6
1.4 1.41.0 0.7
0.40.0
1.0
2.0
3.0
4.0
5.0
6.0
P/B
201
3e (
x)
5.2
2.8 2.6
1.4 1.41.0 0.7
0.40.0
1.0
2.0
3.0
4.0
5.0
6.0
P/B
201
3e (
x)
Significantly undervalued relative to peers
Source: Bloomberg Consensus
P/B
11.09.5
8.4
6.1
4.0 4.0 3.4 2.9
0.0
2.0
4.0
6.0
8.0
10.0
12.0
EV/E
BIT
DA
20
13
e (x
)
11.09.5
8.4
6.1
4.0 4.0 3.4 2.9
0.0
2.0
4.0
6.0
8.0
10.0
12.0
EV/E
BIT
DA
20
13
e (x
)
40.3
27.3 26.4
11.9 10.6 9.3 8.95.9
0
5
10
15
20
25
30
35
40
45
P/EP
S 2
01
3e
(x)
40.3
27.3 26.4
11.9 10.6 9.3 8.95.9
0
5
10
15
20
25
30
35
40
45
P/EP
S 2
01
3e
(x)
29
P/EEV/EBITDA

www.danagas.com
0
10
20
30
40
50
60
70
80
90
100
0
1
2
3
4
5
H1
20
13
Pro
du
ctio
n (
kb
oe
pd
)
En
terp
rise
Va
lue
($
bn
)
EV ($bn) H1 2013 Production (kboepd)
0
10
20
30
40
50
60
70
80
90
100
0
1
2
3
4
5
H1
20
13
Pro
du
ctio
n (
kb
oe
pd
)
En
terp
rise
Va
lue
($
bn
)
EV ($bn) H1 2013 Production (kboepd)
EV and Production valuation relative to peers
Source: Company Data, Bloomberg
Enterprise Value vs. Production
16.3 7.5
1.6
30

www.danagas.com
31
Recent developments positively impacting stock performance

www.danagas.com
Summary
32

www.danagas.com
Summary
● Strong operational track record of organic and inorganic growth across the natural gas value chain
● Unique composition of the Board of Directors and network of relationships providing unparalleled
access to the resource-rich MENA region
● Track record of project delivery and HSSE performance across geographies
● Delivering sustained growth across key financial metrics supported by a strong balance sheet
● Taking a cautious approach towards capital investments in sync with cash collections
● Priority given to adding reserves and replacing production
● Continue to actively identify and evaluate organic growth opportunities in keeping with the Company’s
growth strategy
33

www.danagas.com
Reach Us:
Dana Gas PJSCP. O. Box 2011, Sharjah, UAEwww.danagas.comE-mail : [email protected] : +971 6 519 4401Fax : +971 6 556 6522

www.danagas.com
Back-up Information

www.danagas.com 36
KPI12 months rolling
to September 2013End 3Q
2013End 3Q
20122013 target 1
Fatalities 0 0 5 0
Recordable Injury Frequency 2 0.27 0.30 1.10 0.603
Loss of Primary Containment Incidents 27 15 55 50
Safety observations frequency 2 248 181 159 2301 2013 target versus 12 month rolling data 2 Against 200,000 man hours 3 2012 OGP benchmark of 0.34
� Exceeding targets in all aspects of HSE :
– On track to beat all the HSE metrics on our Group scorecard, but do not under estimate what needs to be done to maintain this level of performance
– Significant progress in closing out audit actions following a Group audit of Egypt in 2012
– Placement of senior technical leaders in both Egypt and Kurdistan enabling us to drive down operating risks and improve reliability
HSSE - On Track to Outperform Performance Metrics
www.danagas.com
www.danagas.com
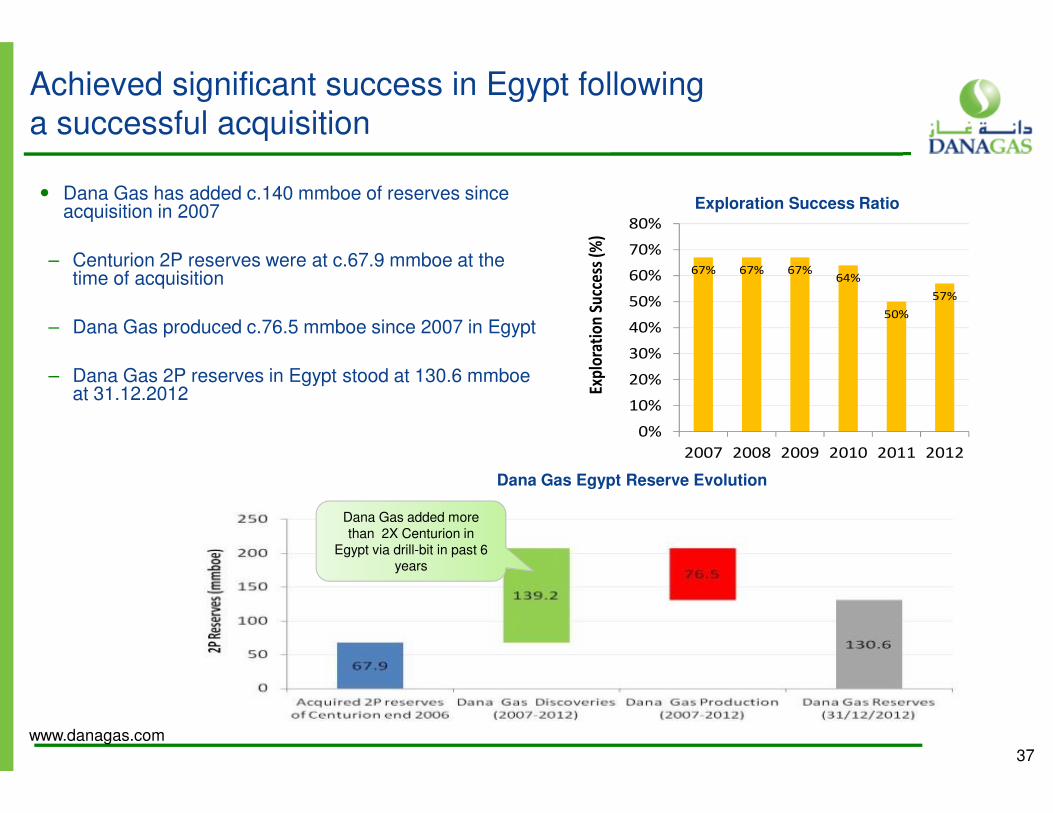
Achieved significant success in Egypt following a successful acquisition
� Dana Gas has added c.140 mmboe of reserves since acquisition in 2007
– Centurion 2P reserves were at c.67.9 mmboe at the time of acquisition
– Dana Gas produced c.76.5 mmboe since 2007 in Egypt
– Dana Gas 2P reserves in Egypt stood at 130.6 mmboeat 31.12.2012
Dana Gas Egypt Reserve Evolution
Exploration Success Ratio
67% 67% 67%64%
50%
57%
0%
10%
20%
30%
40%
50%
60%
70%
80%
2007 2008 2009 2010 2011 2012
Exp
lora
tio
n S
ucc
ess
(%)
67% 67% 67%64%
50%
57%
0%
10%
20%
30%
40%
50%
60%
70%
80%
2007 2008 2009 2010 2011 2012
Exp
lora
tio
n S
ucc
ess
(%)
Dana Gas added more than 2X Centurion in
Egypt via drill-bit in past 6 years
37

www.danagas.com
0
200
400
600
800
1000
1200
WI G
as P
rodu
ctio
n, m
mcf
d
Offshore
Onshore
0
200
400
600
800
1000
1200
WI G
as P
rodu
ctio
n, m
mcf
d
Offshore
Onshore
-
0.2
0.4
0.6
0.8
1.0
1.2
1.4
1.6
1.8
2.0
WI C
omm
erci
al &
Tec
hnic
al
Rese
rves
, bn
boe
Technical Commercial
-
0.2
0.4
0.6
0.8
1.0
1.2
1.4
1.6
1.8
2.0
WI C
omm
erci
al &
Tec
hnic
al
Rese
rves
, bn
boe
Technical Commercial
12. Dana Gas H1 2013 production, other data based on Woodmac estimates
Reserve holders in Egypt(source: Woodmac)
Egypt gas production ranking (2013e)(source: Woodmac)
Dana Gas is the 3rd largest onshore gas producer
3.6 2.1
38
Established itself as a key onshore gas player in Egypt

www.danagas.com
Significantly undervalued relative to listed peers in international markets
Source: Bloomberg Consensus
P/E ranking of Dana Gas Peers(Source: Bloomberg Consensus 03rd Sep 2013)
39
0
5
10
15
20
25
30
35
40
45
P/E
(X)
2013e
2014e
0
5
10
15
20
25
30
35
40
45
P/E
(X)
2013e
2014e

www.danagas.com
The End