clean inc. 79448 p.o. box 4754 , fc.lkhart, in 46514 fileelevation at the conrail site is about 600...
TRANSCRIPT

EPA Region 5 Records Ctr
CLEAN INC. 79448
P.O. Box 4754 ,G
fc.lkhart, IN 46514
•i-Jun-95
Mr Kurt Lindland EsqU.S I:PA"7 West JacksonChicago. II. 60604
Re Ground Water ModelConrail/CR 1 Superfund Site
Jea' Kurt
: nclosed please find a copy of the Review of the Conrail Ground Water ExtractionSystem Model CLEAN Inc., would request that you review and retain this document forour Files CLEAN, Inc is concerned as to the accuracy and completeness of the ground
vatt:r model performed by Conrail and their consultants. CLEAN Inc., would like toormatly register this concern as a matter of record
• hank you for >our time and consideration in this matter.
Vejy Truly Your>,Tf^Z-X- /^L
.or-na Rickard CI..FAN
< , I D d v i d Demko Gl II'om Pemergast, Conrail
-Brad Bradley EPAK n « a Duncan, IDEM

Review of the Conrail
Ground Water Extraction System Model
preparedfor
CLEAN, Inc.
by
John R. Barnhart, C.P.G.
Review of the Conrail Ground Water Extraction System Model
prepared for
CLEAN, Inc.
by
John R. Barnhart, C.P.G.
Introduction«
To answer concerns by CLEAN over the remediation effort being undertaken by Conrail, a
review of the accuracy and appropriate of the ground water extraction model was made. This model
was prepared by Groundwater Technology, Inc., Carmel, Indiana for Consolidated Rail Corporation.
The purpose of the model was to serve as the design base for the ground water extraction system.
Groundwater Technology, Inc. used the model to evaluate several extraction system scenarios for
containment of the principal zone of contamination both on- and off-site. Since this ground water
flow model is the basis for the design of the extraction system, the correctness of this model is of
utmost concern to the residents directly down gradient of the Conrail site.
There were three main objectives of this review:
1 To ensure that the data used in the construction of the model were appropriate for the
hydrogeologic setting.
2. To determine if the model was constructed in accordance with the best hydrogeologic
1
practice.
3. To determine if the model accurately portrayed the ground water system in its domain.
To meet the first objective of this review the physical parameters of the model, the aquifer
thickness, bedrock depth, and aquifer lithology were compared with well logs and published reports
of the geology of the area. The hydraulic parameters, hydraulic conductivity, recharge, and aquifer
type were compared with published values for these parameters. The second objective was met by
examining the locations and types of boundary conditions in the model and comparing them with
established standards of modeling. The third objective was met by obtaining the model input files from
Conrail and re-running the model and comparing the model output with known measured water levels
and flows.
Model Input Data and Conceptualization
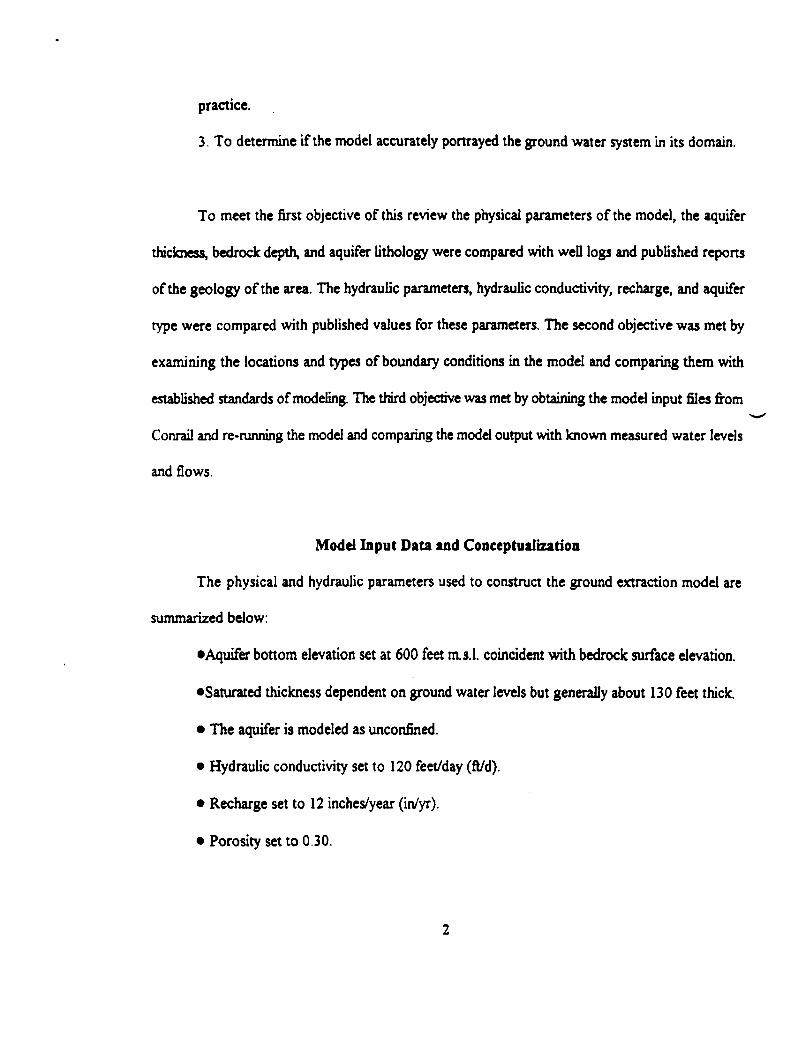
The physical and hydraulic parameters used to construct the ground extraction model are
summarized below:
•Aquifer bottom elevation set at 600 feet m.s.l. coincident with bedrock surface elevation.
•Saturated thickness dependent on ground water levels but generally about 130 feet thick.
• The aquifer is modeled as unconfined.
• Hydraulic conductivity set to 120 feet/day (ft/d).
• Recharge set to 12 inches/year (in/yr).
• Porosity set to 0.30.
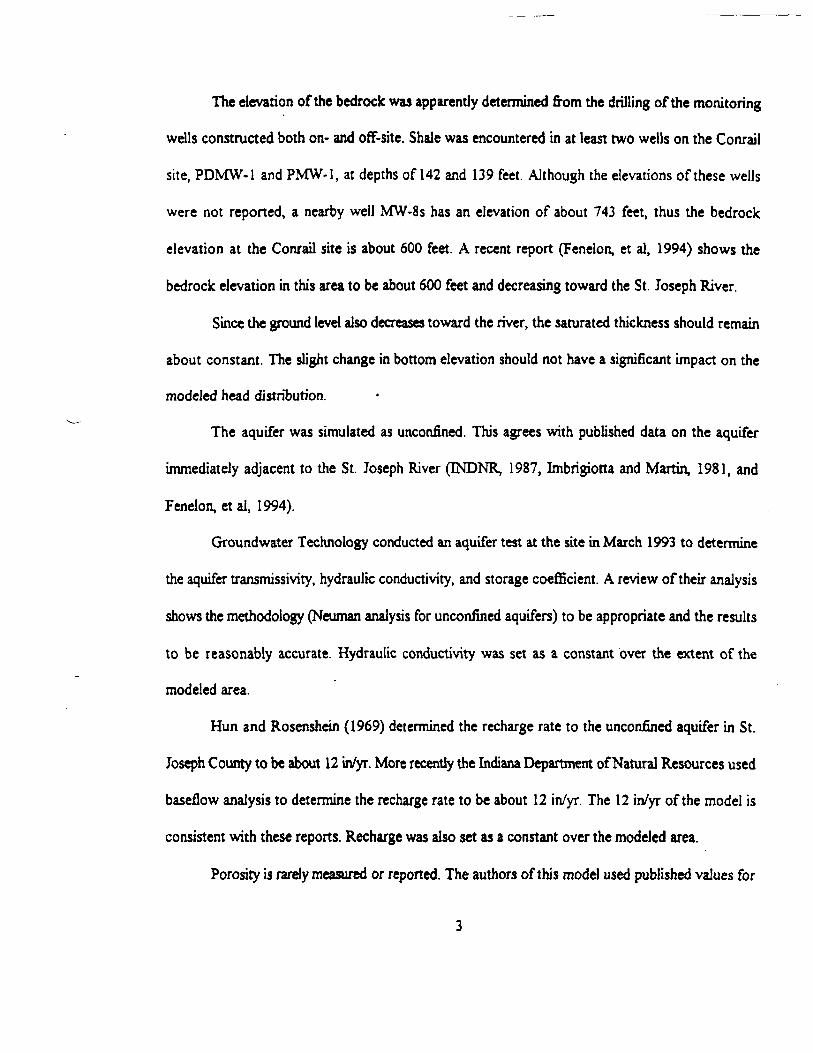
The elevation of the bedrock was apparently determined from the drilling of the monitoring
wells constructed both on- and off-site. Shale was encountered in at least two wells on the Conrail
site, PDMW-1 and PMW-1, at depths of 142 and 139 feet. Although the elevations of these wells
were not reported, a nearby well MW-8s has an elevation of about 743 feet, thus the bedrock
elevation at the Conrail site is about 600 feet. A recent report (Fenelon, et al, 1994) shows the
bedrock elevation in this area to be about 600 feet and decreasing toward the St. Joseph River.
Since the ground level also decreases toward the river, the saturated thickness should remain
about constant. The slight change in bottom elevation should not have a significant impact on the
modeled head distribution.
The aquifer was simulated as unconfined. This agrees with published data on the aquifer
immediately adjacent to the St. Joseph River (INDNR, 1987, Imbrigiotta and Martin, 1981, and
Fenelon, etal, 1994).
Groundwater Technology conducted an aquifer test at the site in March 1993 to determine
the aquifer transmissivity, hydraulic conductivity, and storage coefficient. A review of their analysis
shows the methodology (Neuman analysis for unconfined aquifers) to be appropriate and the results
to be reasonably accurate. Hydraulic conductivity was set as a constant over the extent of the
modeled area.
Hun and Rosenshein (1969) determined the recharge rate to the unconfined aquifer in St.
Joseph County to be about 12 in/yr. More recently the Indiana Department of Natural Resources used
baseflow analysis to determine the recharge rate to be about 12 in/yr. The 12 in/yr of the model is
consistent with these reports. Recharge was also set as a constant over the modeled area.
Porosity is rarely measured or reported. The authors of this model used published values for

sand and gravels as described in Fetter (1980). This value may be greater than the preferred effective
porosity (Marsily, 1986) but the difference is probably not significant. Further analysis is not possible
without site specific measurements.
Model Construction
Groundwater Technology constructed their model with a grid with 69 rows and 66 columns
for the 30% Design. The number of rows was increased to 83 and the number of columns increased
to 88 for the Final Design Report to address comments by the U.S. EPA. No changes in aquifer
parameters, recharge, or boundary conditions were made.^
Boundary conditions are mathematical statements specifying the hydraulic head or ground
water flux at the boundaries of the problem domain (Anderson and Woessner, 1992). The selection
of the correct boundary conditions is an important step in the design of a model because in a steady
state model the ground water Sow is strongly determined by the boundary conditions. In the Conrail
Site model the lower boundary is set by the bottom of the aquifer and the upper boundary is set by
recharge. The northern and western boundaries are set by specified head nodes to simulate the St.
Joseph River and Baugo Bay, respectively (Figure 1). The southern and eastern boundaries are also
set by specified head nodes. In their model, Groundwater Technology used specified heads that
represented field measured static water levels (Figure 1).
Generally, using physical boundaries for model domain boundaries is more preferred than
specified heads because physical boundaries are permanent features. The St. Joseph River and Baugo
Bay are physical boundaries that can be considered permanent for the purpose of modeling. The
lowering of the river for bridge repairs was a short term anomaly with no long term effects on the
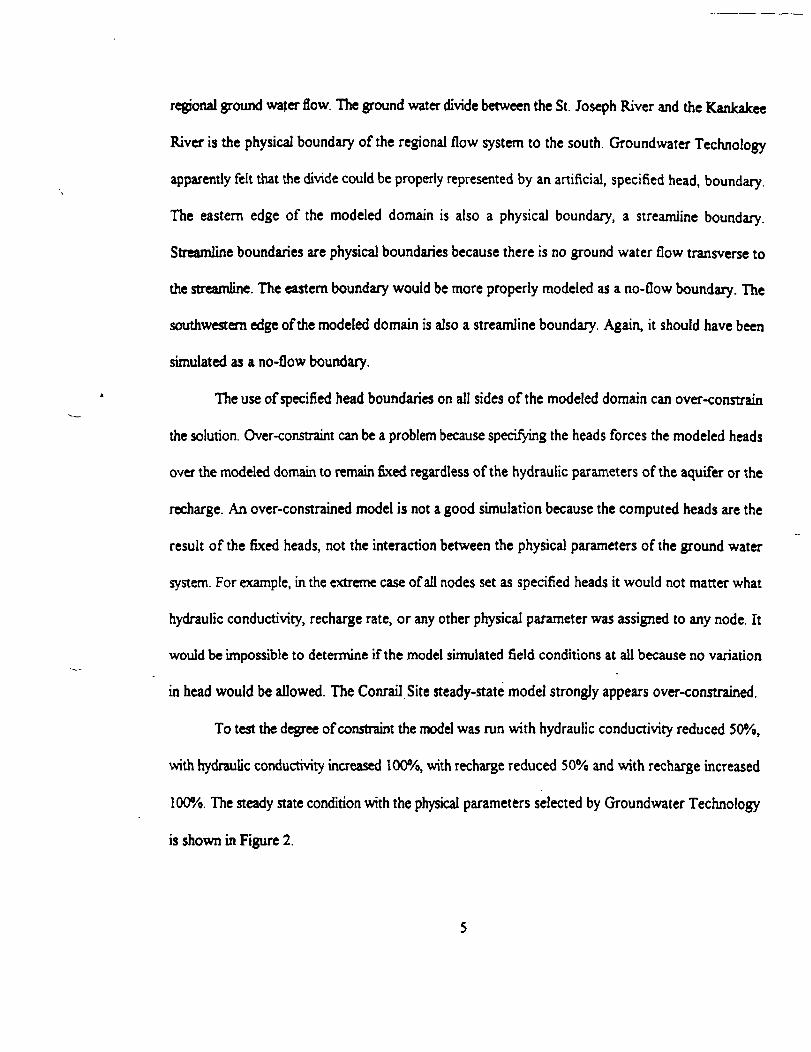
regional ground water flow. The ground water divide between the St. Joseph River and the Kankakee
River is the physical boundary of the regional flow system to the south. Groundwater Technology
apparently felt that the divide could be properly represented by an artificial, specified head, boundary.
The eastern edge of the modeled domain is also a physical boundary, a streamline boundary.
Streamline boundaries are physical boundaries because there is no ground water flow transverse to
the streamline. The eastern boundary would be more properly modeled as a no-flow boundary. The
southwestern edge of the modeled domain is also a streamline boundary. Again, it should have been
simulated as a no-flow boundary.
The use of specified head boundaries on all sides of the modeled domain can over-constrain
the solution. Over-constraint can be a problem because specifying the heads forces the modeled heads
over the modeled domain to remain fixed regardless of the hydraulic parameters of the aquifer or the
recharge. An over-constrained model is not a good simulation because the computed heads are the
result of the fixed heads, not the interaction between the physical parameters of the ground water
system. For example, in the extreme case of all nodes set as specified heads it would not matter what
hydraulic conductivity, recharge rate, or any other physical parameter was assigned to any node. It
would be impossible to determine if the model simulated field conditions at all because no variation
in head would be allowed. The Conrail Site steady-state model strongly appears over-constrained.
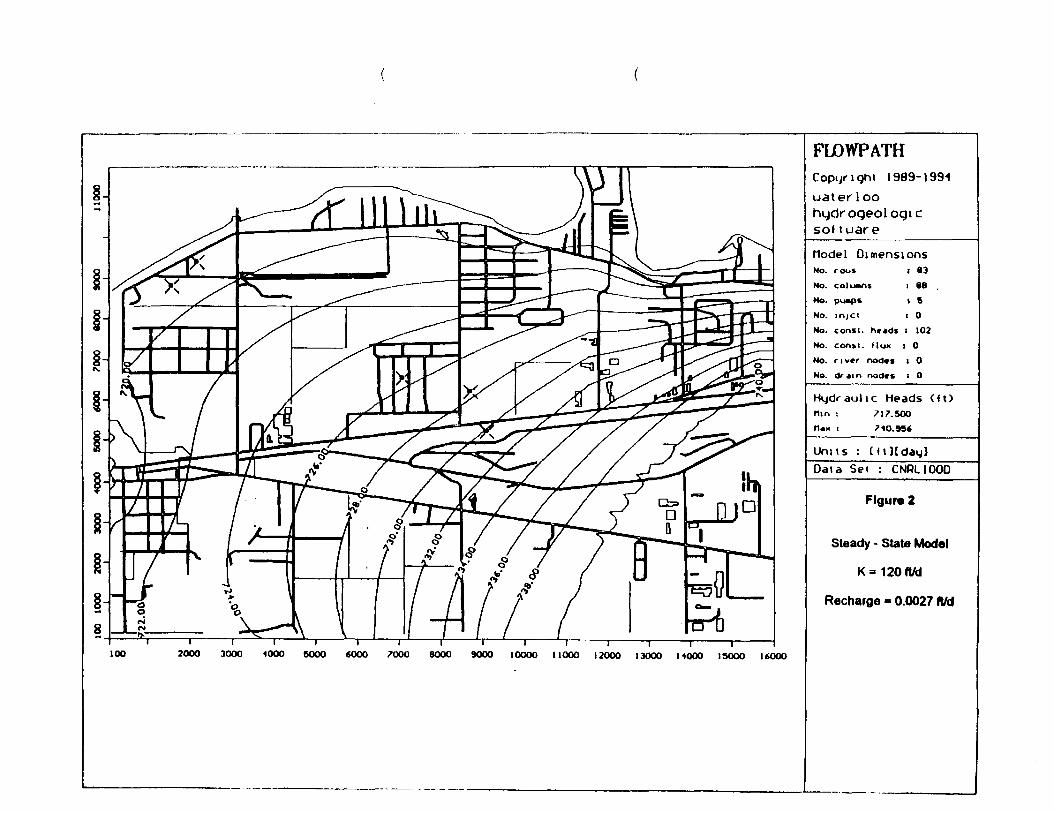
To test the degree of constraint the model was run with hydraulic conductivity reduced 50%,
with hydraulic conductivity increased 100%, with recharge reduced 50% and with recharge increased
100%. The steady state condition with the physical parameters selected by Groundwater Technology
is shown in Figure 2.
A 50% reduction in hydraulic conductivity raised water levels in the center of the modeled
area about 1.0 to 1.5 feet (Figure 3).
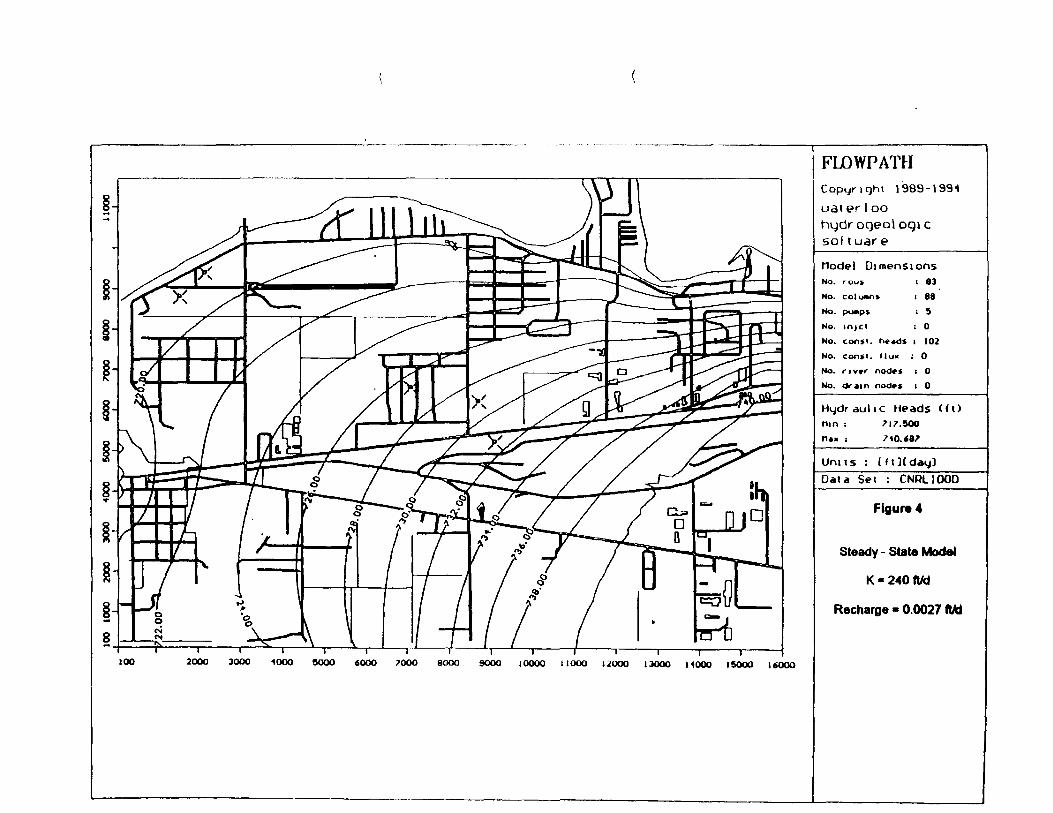
A 100% increase in conductivity raised water levels in the central part of the model about 1.0
feet to 1.5 feet. This is contrary to expectations since a decrease in resistance to flow should
result in a decreased gradient and lower water levels (Figure 4)
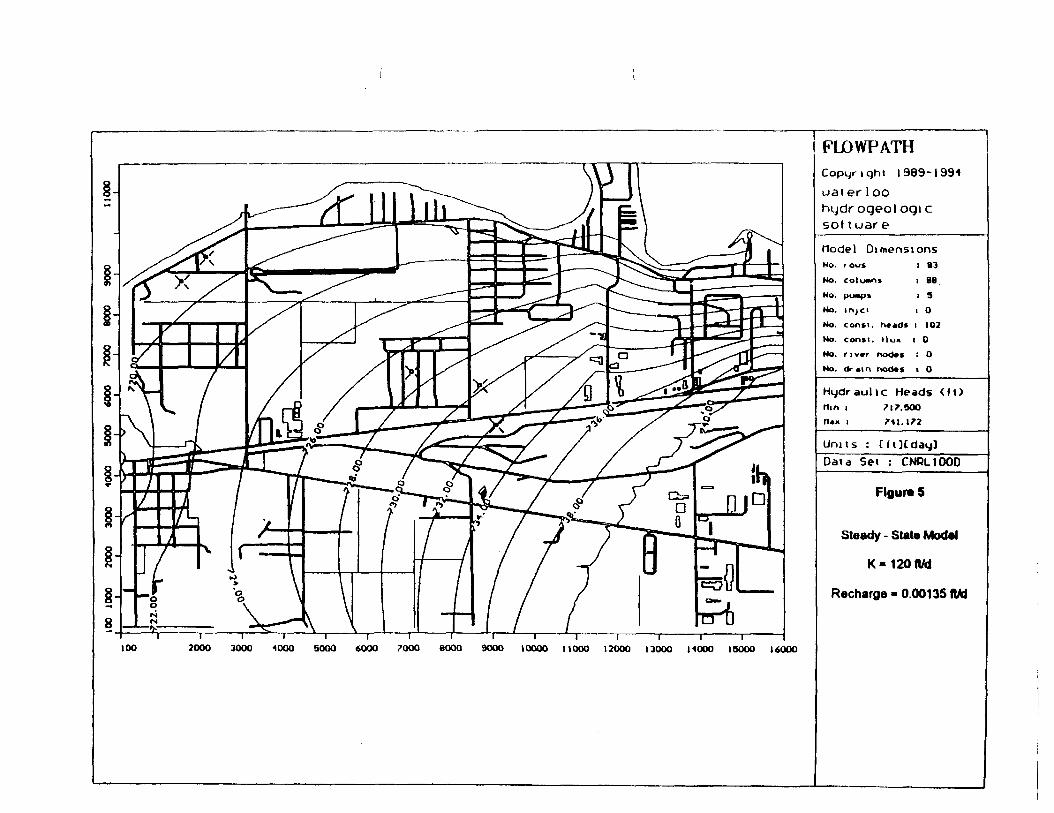
A 50% reduction in recharge, form 12 in/yr to 6 in/yr, raised water levels in the center of the
modeled area about 2.0 feet. This is contrary to expectations since a reduction in flow intrN—
the model should result in lowered water levels (Figure 5)
A 100% increase in recharge, from 12 in/yr to 24 in/yr, raised water levels in the central
portion of the model about 2 feet (Figure 6).
Water levels near the constant head boundaries remained unchanged. For increases in
hydraulic conductivity and decreases in recharge the model performs contrary to the expecte-'
response. Overall, the model is relatively insensitive to changes in physical properties due to the
constraint of the constant head boundaries.
Once the authors had "calibrated" their steady-state model, they used it to predict hydraulic
heads and capture zones of the remediation wells. Over-constraint in a predictive steady-state model
can lead to erroneous results if changes in applied stresses affect the flux rates along the model
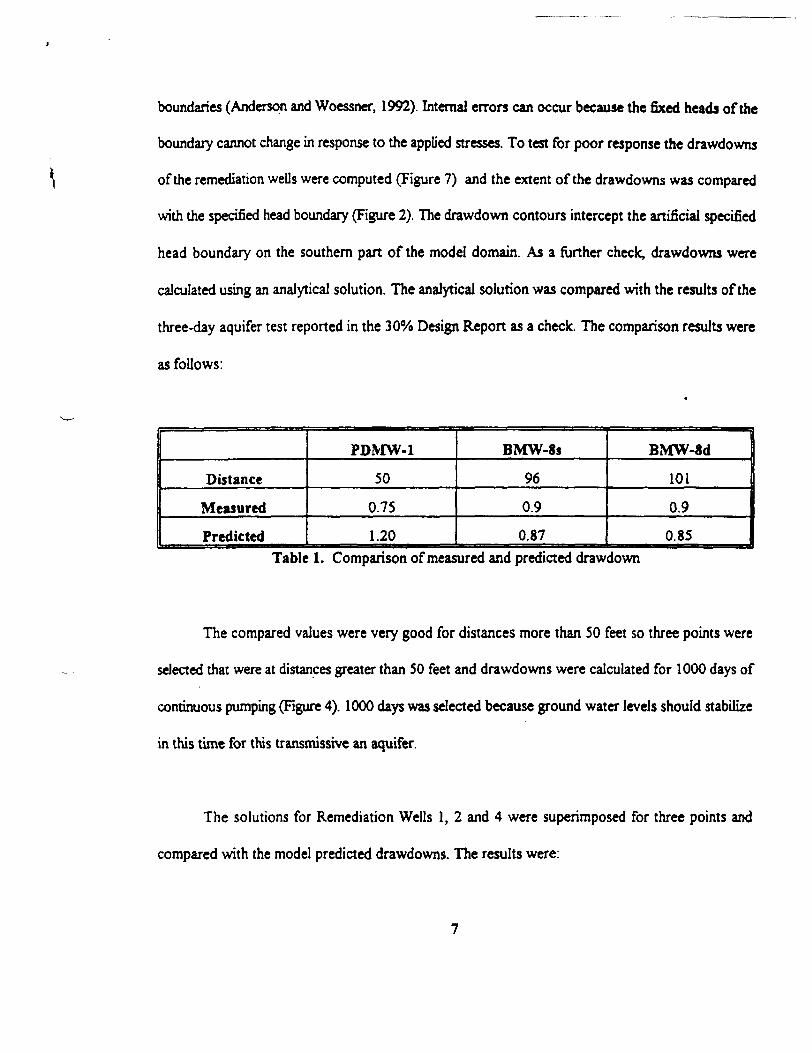
boundaries (Anderson and Woessner, 1992). Internal errors can occur because the fixed heads of the
boundary cannot change in response to the applied stresses. To test for poor response the drawdowns
of the remediation wells were computed (Figure 7) and the extent of the drawdowns was compared
with the specified head boundary (Figure 2). The drawdown contours intercept the artificial specified
head boundary on the southern part of the model domain. As a further check, drawdowns were
calculated using an analytical solution. The analytical solution was compared with the results of the
three-day aquifer test reported in the 30% Design Report as a check. The comparison results were
as follows:
Distance
Measured
Predicted
PDMW-1
50
0.75
1.20
BMW-Ss
96
0.9
0.87
BMW-8d
101
0.9
0.85
Table 1. Comparison of measured and predicted drawdown
The compared values were very good for distances more than 50 feet so three points were
selected that were at distances greater than 50 feet and drawdowns were calculated for 1000 days of
continuous pumping (Figure 4). 1000 days was selected because ground water levels should stabilize
in this time for this transmissive an aquifer.
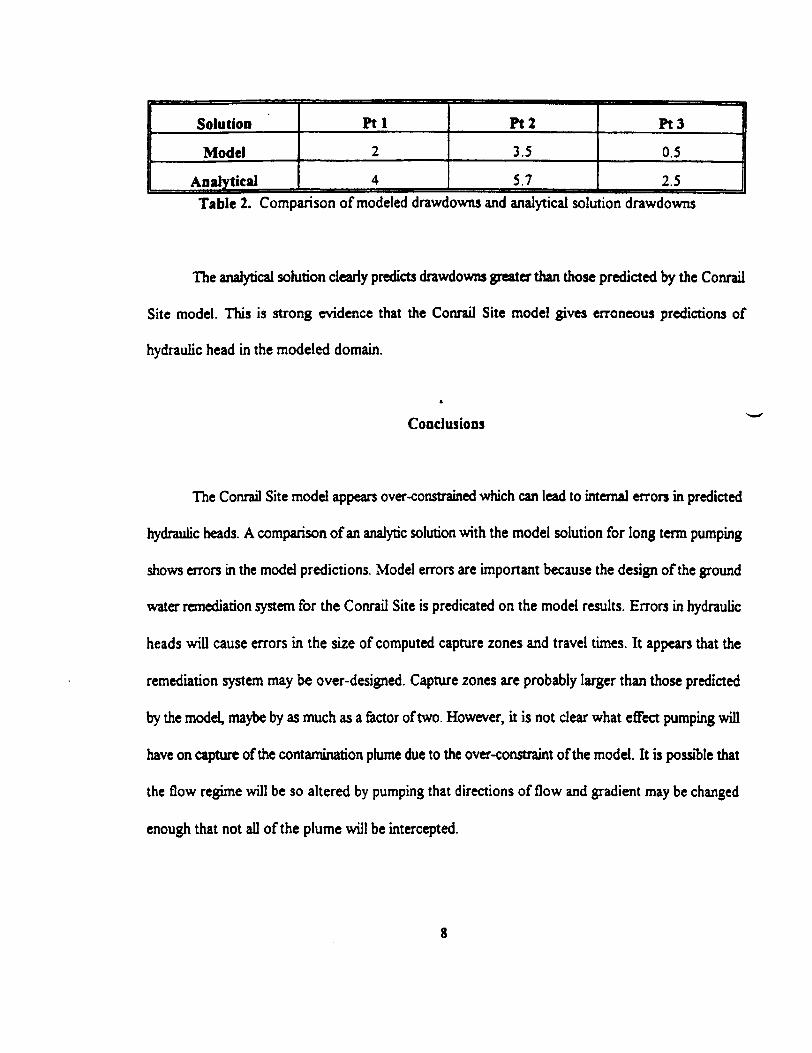
The solutions for Remediation Wells 1, 2 and 4 were superimposed for three points and
compared with the model predicted drawdowns. The results were:
Solution
Model
Analytical
Ptl
2
4
Pt2
3.5
5.7
Pt3
0.5
2.5Table 2. Comparison of modeled drawdowns and analytical solution drawdowns
The analytical solution clearly predicts drawdowns greater than those predicted by the Conrail
Site model. This is strong evidence that the Conrail Site model gives erroneous predictions of
hydraulic head in the modeled domain.
*
Conclusions
The Conrail Site model appears over-constrained which can lead to internal errors in predicted
hydraulic heads. A comparison of an analytic solution with the model solution for long term pumping
shows errors in the model predictions. Model errors are important because the design of the ground
water remediation system for the Conrail Site is predicated on the model results. Errors in hydraulic
heads will cause errors in the size of computed capture zones and travel times. It appears that the
remediation system may be over-designed. Capture zones are probably larger than those predicted
by the model, maybe by as much as a factor of two. However, it is not clear what effect pumping will
have on capture of the contamination plume due to the over-constraint of the model. It is possible that
the flow regime will be so altered by pumping that directions of flow and gradient may be changed
enough that not all of the plume will be intercepted.
It is recommended that further study of the Conrail Site model be conducted. Particularly to
further evaluate the flux conditions on the constant head boundary. An evaluation of the flux
conditions is necessary to assess the effects of pumping on the capture zones so that the effectiveness
of the locations and pumping rates of the remediation wells can be evaluated.
John R. Barnhart, C.P.G.

2000 3000 1000 5000 tfOOO 7000 80OO 9OOO IOOOO I IOOO 17DOO 13OOO MOOO ISOOO I6OOO
FLOWPATHCopyright 1989-1991
uaierIoorujdroqeo logicsof t uare
Model DimensionsNo. rout
Ho. coluans
Mo. pump!
No. injct
No. const. ht«d>
No. conn. tlu.
No. r i v«r nodvs
No. ov am nod**
83
8t
5
0
102
i 0
: 0
I 0
Hydraulic Heads <H>rim i ?IASOO
Uniis :
Data Set : CNRL1000
Figur* 1
Specified Headsand
RemediationWell
Locations
2000 3000 1000 5000 «OOO 7000 8OOO 9000 lOOOO I lOOO I20OO 13OOO MOOO I5OOO 16OOO
FLOWPATHCopyright 1989-1994
uater loohijdrogeologicsof tuare
Model DimensionsNo. rous i 83
No. columns i 88
No. pumps I 5
No. injci i 0
No. const, heads i 102
No. const. IIox i 0
No. river nodes i 0
No. drain nodes t 0
Hydraulic Heads ( f t )Hin : 7I7.5OOflaK i 710.95*
Units : UtHday]
Data Set : CNRLIOOO
Figure 2
Steady - State Model
K=120ft/d
Recharge • 0.0027 rt/d

9OOO lOOOO IIOOO 12000 I3OOO 110OO 15OOO ICOOO100 2000 3000 1000 SOOO 4000 7OOO BOOO
FLDWPATHCopyright 1989-1991
uater loohydr oqeologi cso f t uar e
Model DimensionsNo. rous i 83
No. columns : 88
No. pumps I 9
No. injci i 0
No. const, heads I 102
No. const. HUM i 0
No. river nodes : 0
No. drain nodes : 0
Hydraulic Heads «Onin : 7I7.SOO
Oa« i 712.212
Units : UlHdayl
Data Set : CNRLIOOO
Figure 3
Steady - State Model
K = 60(»/d
Recharge - 0.0027 Wd
2OOO 3OOO 1OOO SOOO 6000 70OO 8OOO 9OOO 10000 I IOOO I2OOO I3OOO 11000 I50OO I6OOO
FLOWPATHCopynghi 1989-1991
uaierIoohgdr ogeol ogicsof t uare
Model Dimensions
No. rous : 83
No. columns s 88
No. pumps : 5
No. injct i 0
No. const, heads i 102
No. const, flux : 0
No. river nodes i 0
No. drain nodes I 0
Hydraulic Heads ( f t )
nin : 7I7.5OO
Flax i 710.487
Units : UtHday]
Data Set : CNRLIOOD
Figure 4
Steady - Stale Model
K = 240 ft/d
Recharge • 0.0027 (Md
100 2000 3000 5000 6000 7000 8OOO 90OO 10OOO IIOOO 12OOO I30OO 1100O ISOOO I600O
FLOWPATHCopyright 1989-1991
uaterIoohijdr ogeol ogicsof luar e
Model DimensionsNo. rout | 83
No. columns ; 88,
No. pumps i 5
No. mjci i 0
No. const, heads i 102
No. const, llux i 0
No. river nodes : 0
No. drain nodes i 0
Hydraulic Heads ( I t )tlin i 717.500tlax : 711.172
Units : [ f t ] (day)
Data Set : CNRL100D
Figure 5
Steady-Slate Model
K « 120 n/d
Recharge-0.00135 IMd

100 3000 1000 500O £000 700O 8OOOT—'—i—" i r 1 1—" r
9000 10000 IIOOO I20OO I30OO 11000 I5OOO 14000
FLOWPATHCopyright 1989-1991
uater I oohydrogeologicsof tuar e
Model DimensionsNo. rous i 83No. columns i 88
No. pumps : 5
No. injct i 0
No. const, heads : I02
No. const. Mu> : 0
No. r i ver nodes i 0
No. drain nodes i 0
Hydraulic Heads ( f t )tlm ; 717.500
n«x i 712.198
Units : ( f tKdayl
Data Set : CNRLIOOO
Figure I
Steady - State Model
K=120fVd
Recharge - 0.0054 ft/d

100 2000 3000 1OOO 5000 6OOO 7000 8000 90OOT 1 \ 1 1 r
10000 11000 12000 13000 HOOO ISOOO 16OOO
FLOWPATHCopyright 1989-1991
uater loohgdr ogeol ogi csof luare
Model DimensionsNo. rous I 83No. columns i 80
No. pumps : 5
No. injct i 0
No. const, heads i 102
No. const. HUM I 0No. river nodes I 0
No. drain nodes i 0
Dr audoun ( f t )nin i -o.oooMax i 6.6M
Units : t f t )Cday ]
Data Set : CNRLIOOO
Figure 7
Steady-State Model
Drawdown
K - 120 ft/d
Recharge » 0.0027 ft/d