clean tax cuts for commercial real...
TRANSCRIPT

Clean Tax Cuts for Commercial Real Estate
Steven Nadel and Brian Stickles
June 2017
An ACEEE White Paper
© American Council for an Energy-Efficient Economy
529 14th Street NW, Suite 600, Washington, DC 20045
Phone: (202) 507-4000 • Twitter: @ACEEEDC
Facebook.com/myACEEE • aceee.org

CLEAN TAX CUTS FOR COMMERCIAL REAL ESTATE © ACEEE
i
Table of Contents
About the Authors ............................................................................................................................. iii
Acknowledgments ............................................................................................................................. iii
Abstract ................................................................................................................................................ iv
Introduction: Tax Reform and Clean Tax Cuts ................................................................................ 1
The Commercial Real Estate Market ................................................................................................. 2
Size of the Sector ....................................................................................................................... 2
Role of REITs, LLCs, and Partnerships .................................................................................. 2
Commercial Buildings Classification ..................................................................................... 3
Energy Efficiency in Commercial Real Estate .................................................................................. 4
Opportunity ............................................................................................................................... 4
Some Leading Programs .......................................................................................................... 6
Options for Clean Tax Cuts for Commercial Real Estate ............................................................... 9
Reduced Tax Rate on Income from Efficient Buildings ...................................................... 9
Expensing or Accelerated Depreciation?............................................................................. 11
Savings and Cost of These Proposals .............................................................................................. 13
How to Pay for This Tax Cut ............................................................................................................ 15
Other Issues ......................................................................................................................................... 15
Tax Reform Priorities ............................................................................................................. 15
Government and Nonprofit Owners ................................................................................... 15
Tenant Improvements ............................................................................................................ 15
Extending Accelerated Depreciation to the Industrial Sector .......................................... 16
Applying Clean Tax Cuts to Property Taxes ...................................................................... 16
Conclusions and Next Steps ............................................................................................................. 17
References ............................................................................................................................................ 18
Appendix A. Charrette Workshop Participants ............................................................................ 23

CLEAN TAX CUTS FOR COMMERCIAL REAL ESTATE © ACEEE
ii
Appendix B. IRS Data on Partnerships and Their Taxes .............................................................. 24
Appendix C. Analysis of Two Proposals ........................................................................................ 25
Appendix D. Other Work on Clean Tax Cuts ................................................................................ 27
CLEAN TAX CUTS FOR COMMERCIAL REAL ESTATE © ACEEE
iii
About the Authors
Steven Nadel has been ACEEE’s executive director since 2001. He has worked in the energy efficiency field for more than 30 years and has more than 200 publications. His current research interests include state and federal energy policy, utility sector energy efficiency programs, and policies and strategies for transforming markets for efficient products and practices. He joined ACEEE in 1989 and previously served as deputy director of the organization and director of ACEEE’s Utilities and Buildings programs. Prior to ACEEE, Steve planned and evaluated energy efficiency programs for New England Electric, a major electric utility; directed energy programs for the Massachusetts Audubon Society, the state’s largest environmental organization; and ran energy programs for a community organization working on housing rehabilitation in the poorest neighborhoods of New Haven, Connecticut. Steve earned a master of science in energy management from the New York Institute of Technology and a master of arts in environmental studies and a bachelor of arts in government from Wesleyan University.
Brian Stickles assists with research and analysis for ACEEE’s Economics and Finance Policy team. His current focus is on identifying and studying best practice approaches for financing energy efficiency improvements. Brian holds a master of arts in economics from New York University and a bachelor of science in economics and business from Skidmore College.
Acknowledgments
This paper was made possible through the generous support of the Grace Richardson Fund and the Rockefeller Brothers Fund. The authors gratefully acknowledge participants in the March 23, 2017 charrette, who provided extensive commentary and input on the concepts. We also thank the external reviewers, internal reviewers, colleagues, and sponsors who supported this paper. Charrette participants are listed in Appendix A. External expert reviewers were Iain Campbell, Rocky Mountain Institute; Michael Gerrard, Columbia University Law School; Philip Henderson, Natural Resources Defense Council; Adam Hinge, Sustainable Energy Partnerships; and Rod Richardson, Grace Richardson Fund. Internal reviewers were Jim Barrett, Neal Elliott, and Lowell Ungar. Charrette participation, external review, and support do not imply affiliation or endorsement. Finally, we are grateful to Fred Grossberg for managing the editorial process, to Keri Schreiner, Sean O'Brien, and Roxanna Usher for copy editing, to Eric Schwass for assistance with the graphics, and to Patrick Kiker and Maxine Chikumbo for their help in launching this paper.

CLEAN TAX CUTS FOR COMMERCIAL REAL ESTATE © ACEEE
i
Abstract
Congress is likely to consider federal tax reform in 2017 and many new ideas may be considered. One such idea is clean tax cuts—the application of supply-side tax rate cuts to clean investments that reduce emissions of various pollutants. The idea is that, by cutting tax rates for income from clean investments (where clean is specifically defined), investors will be more interested in making these investments and large amounts of private capital can be leveraged.
Clean tax cuts can potentially work in a wide variety of applications, but might be particularly influential in markets where investment returns are passed on to individuals and included on individual tax returns. Such investors are often in above-average tax rate brackets, making a tax cut enticing. Commercial real estate (including multifamily housing) is one such market, where individuals often invest in real estate investment trusts (REITs), limited liability corporations (LLCs), and limited liability partnerships (LLPs). In all of these structures, the returns (or losses) are passed on to the investors to include in their personal income taxes; thus, commercial real estate could be an excellent place to launch the clean tax cut concept.
In this discussion paper, we provide background information on commercial buildings, commercial real estate structures, and opportunities for additional energy improvements. We then outline two proposals for clean tax cuts for commercial real estate. These proposals are based on discussions at a charrette workshop hosted by ACEEE in March 2017.1 The first proposal involves providing a lower tax rate (the long-term capital gains rate) for income from buildings that are ENERGY STAR® certified. The second proposal involves expensing energy efficiency investments used to achieve at least 10% energy savings for all commercial buildings, including those where income is passed on to individual tax returns and those covered by business tax returns.
Following the charrette, ACEEE further analyzed these two proposals. Our analysis finds that the lower tax rate would provide a strong incentive for energy efficiency upgrades in the approximately 30% of the commercial real estate market owned by REITs, LLCs, and LLPs. The immediate expensing would provide a more modest incentive, but applies to about 75% of the commercial real estate market that is taxable (and could apply to untaxed government and nonprofit buildings if they are allowed to pass the value of expensing to the architects, engineers, and contractors that work on efficiency upgrade projects).
1 A charrette is an intensive planning session.
CLEAN TAX CUTS FOR COMMERCIAL REAL ESTATE © ACEEE
1
Introduction: Tax Reform and Clean Tax Cuts
Federal income taxes last went through a major reform in 1986. Pressure has been building for a new tax reform effort, and President Trump, House Speaker Paul Ryan, and Senate Majority Leader Mitch McConnell are all on record as wanting a major tax reform bill enacted this year. While tax reform will likely focus on simplifying the tax code and reducing marginal tax rates, the conversation will also include other major policy objectives such as spurring economic development and job creation.
In this context, many new ideas are being considered. For example, House Republicans have put forth a new tax policy paradigm that challenges traditional thinking. It would allow expensing of most investments, do away with the deduction for interest expenses, eliminate taxes on foreign income of US corporations and income related to exports, and include a border tax adjustment for imports (see Real Estate Roundtable 2017). Among the other new ideas that could be considered are clean tax cuts: applying supply-side tax cuts to clean, decarbonizing investments. The idea is that by cutting tax rates for income from clean investments (where clean is specifically defined) or reducing the amount of income taxed as a result of clean investments, investors will be more interested in making such investments, and large amounts of private capital can be leveraged.
The Grace Richardson Fund, Rocky Mountain Institute, and others have pioneered and developed the concept of clean tax cuts (see for example Blades 2016 and Grace Richardson Fund 2016). These tax cuts could be used to reduce interest rates on “green” bonds, encourage land and natural resource conservation, and encourage energy efficiency in commercial buildings. For example, clean tax cuts could provide lower tax rates for income from energy-efficient buildings (e.g., ENERGY STAR certified buildings), which could spur building owners to make efficiency improvements in order to qualify.
Clean tax cuts have a wide variety of potential applications, but might be particularly influential in markets where investment returns are passed on to individuals and included on individual tax returns. One such market is commercial real estate (including multifamily buildings), where individuals often invest in Real Estate Investment Trusts (REITs), limited liability corporations (LLCs), and limited liability partnerships (LLPs). In all of these structures, the returns (or losses) are passed on to investors to include in their personal income taxes. Because most of these individual investors have substantial net worth and are interested in low tax rates, they are a prime target (corporations also want lower taxes, but in 2006–2012, the average effective corporate federal income tax rate was 14% for profitable companies [GAO 2016]; corporate taxes have declined over time as companies take advantage of various tax code provisions to reduce their taxes). Furthermore, commercial real estate investments are driven in part by the historic increase in real estate valuations; as discussed later, green investments can help drive up these valuations.
Thus, commercial real estate could be an excellent place to begin the clean tax cut concept, focusing on individual investors while also providing opportunities for all investors. This said, we recognize that commercial real estate comes in many flavors and any proposal must recognize the diversity of entities and tax situations, including the fact that major commercial real estate investors know the tax code well and typically take advantage of allowed ways to reduce their taxes. Some of these investors might not be able to take advantage of additional tax breaks.

CLEAN TAX CUTS FOR COMMERCIAL REAL ESTATE © ACEEE
2
The Commercial Real Estate Market
SIZE OF THE SECTOR
According to a report by Savills, an international real estate adviser, the total value of global real estate reached $217 trillion in 2015, representing 60% of mainstream global assets. Residential real estate makes up three-quarters of the global real estate market and the remaining 25% is divided almost evenly between commercial real estate ($29 trillion) and agricultural or forestry land ($26 trillion). North America represents nearly half of the entire global commercial market and 21% of the residential market, despite having only 5% of the world’s population (Hackett 2016).
In its 2012 Commercial Buildings Energy Consumption Survey (CBECS), the Energy Information Administration (EIA) reports that the United States has more than 5.5 million commercial buildings, totaling almost 90 billion square feet (EIA 2016). Of those buildings, almost 2.5 million are owner occupied, 1.75 million are leased to a tenant, 776,000 are government owned, nearly 350,000 are partly owner occupied and partly leased, and 221,000 are unoccupied. In terms of building floor area, approximately 40% is owner occupied but not government owned, 35% is leased, and 22% is government owned.2 In terms of annual commercial building energy use, the figures change slightly; 43% is owner occupied but not government owned, 34% is leased, and 23% is government owned. The average site energy usage in 2012 was 80.0 British thermal units (Btu) per square foot, which is down from 91.0 Btus in 2003 (EIA 2016).3
ROLE OF REITS, LLCS, AND PARTNERSHIPS
Commercial real estate is often managed or owned by REITs, LLCs, or LLPs. A REIT is a company that owns real estate that generates income. Investors can purchase stock in REITs, thereby investing in real estate without actually owning physical assets. Owning physical real estate can generate a return on investment and diversify a portfolio, but the assets are relatively illiquid compared to stock ownership. REIT ownership allows investors some of the benefits of owning real estate without the complications of physical asset ownership. REITs pass along the tax burden of their generated income to investors, requiring them to pay these taxes. Income from REITs is predominantly taxed as ordinary income, which can be significantly higher than taxes on qualified dividends or long-term capital gains (Morningstar 2015).
REITs in the US own roughly $1.8 trillion of commercial real estate assets. In 2015, these REITs paid out $51 billion dollars in dividends; 66% ($33.7 billion) of those dividends are classified as ordinary taxable income, while 12% ($6.1 billion) are a return of capital and 22% ($11.2 billion) are long-term capital gains (NAREIT 2016a). According to the North American REIT trade association, REITs have historically performed better than the Dow Jones Industrial Average and the NASDAQ Composite Index (NAREIT 2016a). Two important sectors of the REIT industry, office and retail, are expected to see rent growth of
2 These figures split the 10% that is both owner occupied and leased evenly between owner occupied and leased; the other 2% is unoccupied.
3 Site energy usage is the energy used on-site and does not include distribution system losses or inefficiencies in electricity generation.

CLEAN TAX CUTS FOR COMMERCIAL REAL ESTATE © ACEEE
3
1.5% and 1.7%, respectively, and forecasters estimate that an additional 50 million square feet of office space will be built in 2017 (CBRE 2016). Data are available on US REITs because 200 of the 1,100 are publicly traded, and their reports to the Securities and Exchange Commission are public information (NAREIT 2017).
Unfortunately, data on partnerships and LLCs are more difficult to ascertain as these entities are privately held and therefore not required to report. One industry expert suggests REITs, LLCs, and LLPs compose at least 20% of the commercial real estate market. This expert notes that the figure is higher for regional shopping malls (60–70% are REIT owned), lower for multifamily buildings (approximately 15% REIT owned), with other building types in between (Calvin Schnure, senior vice president, NAREIT, pers. comm., February 2, 2017). It is difficult to confirm this estimate given the lack of available data on LLCs and LLPs. On the other hand, the fact that about 35% of commercial floor area is leased could indicate that the REIT, LLC, and LLP share is larger. At our Commercial Real Estate Charrette (discussed below), participants typically estimated the REIT, LLC, and LLP share of commercial building floor area at 35% rather than 20%. Given this range, for our calculations, we estimate that 30% of commercial building floor area is owned by REITs, LLCs, and LLPs.
Like REITs, LLCs and LLPs are organized in a way that passes taxation along to the owners. Although these corporate structures do not have publicly traded stock, they are designed to have multiple owners who provide capital for real estate investments and share in the profits. The true benefit of both LLCs and LLPs is the limited liability, which can protect owners from lawsuits related to the property (Weaver 2014). The primary difference between the two corporate structures is that LLCs offer limited liability to all owners, whereas LLPs have a general partner that has unlimited liability (Investopedia 2017). Owners of REIT stock are protected from personal liability due to the stock’s structure as an investment mechanism.
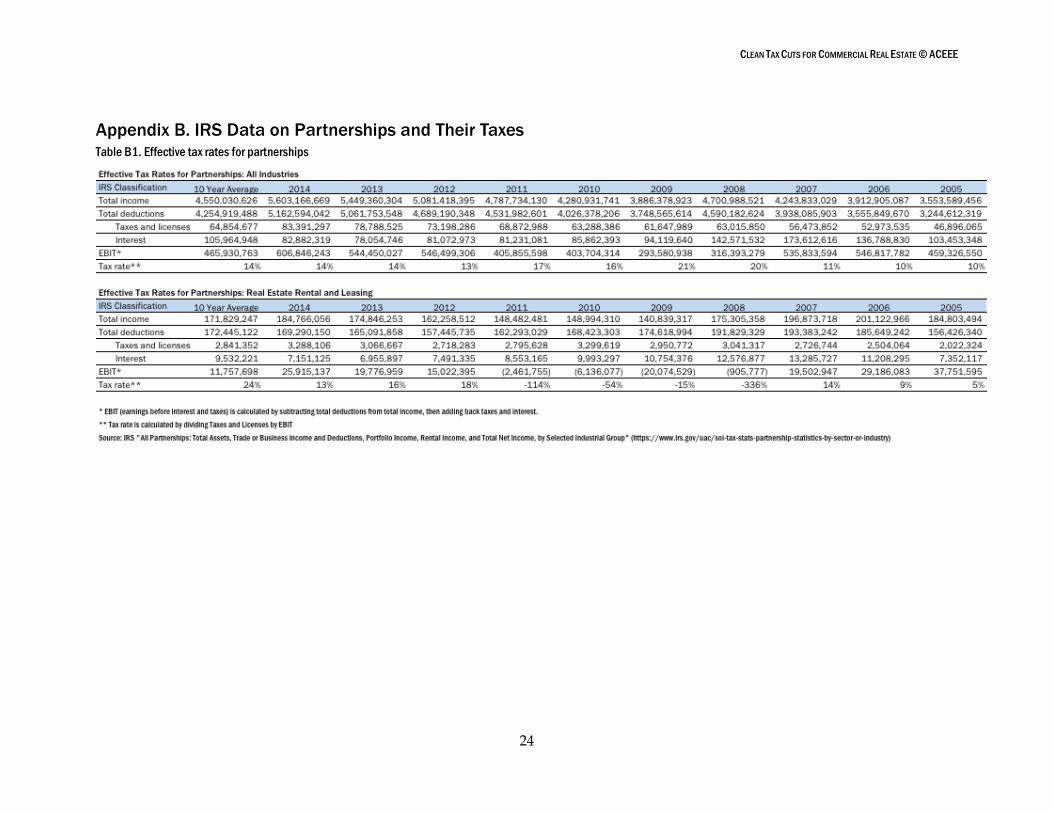
The IRS publishes data each year on the income of partnerships and the taxes paid on that income, including a breakout for just the real estate sector. The data show that, over the past 10 years, the average tax rate on real estate partnership income has been 24%, which is nearly double the approximately 13.5% average federal income tax rate.4 Appendix B shows the IRS data and our analysis of them.
COMMERCIAL BUILDINGS CLASSIFICATION
US commercial buildings are generally categorized into Class A, B, or C, with Class A being a better classification than Class B, and Class B better than Class C. This is important for energy efficiency and sustainability efforts because owners of Class A buildings pay much more attention to energy efficiency and sustainability opportunities than the other classes. Getting Class B owners to pay more attention to these issues is an important goal.5
4 www.fool.com/retirement/2017/03/04/whats-the-average-americans-tax-rate.aspx.
5 For more information about this market, see Bell, Sienkowski, and Kwatra 2013.

CLEAN TAX CUTS FOR COMMERCIAL REAL ESTATE © ACEEE
4
There are no formal standards for determining which class a building is placed in, and the Building Owners and Managers Association International (BOMA International) recommends against publishing the classifications for individual buildings (BOMA 2017). The building’s appearance, age, and infrastructure are critical to the classification; Class A buildings tend to be newer and have higher-quality materials and systems than their Class B counterparts. However the classifications are relative to other buildings within the same marketplace, so a Class A building in one market may not be a Class A in another. Additionally, the classifications are not based entirely on the quality of the building itself, but also account for the location’s desirability as well as amenities offered by the building management. All combined, the classifications represent a scale of desirability for potential tenants. Higher classifications also correspond with higher rents (Imperiale 2006). In research done by the National Association of Realtors, Class A office buildings received an average annual rent of $135 per square foot, while Class B and C office buildings received an average of $93 per square foot (National Association of Realtors 2017).
Class A building owners tend to invest more in energy efficiency than owners of Class B and C buildings. This is partly because building owners seek to attract tenants who prefer green certification, and partly because Class A owners and tenants have more resources for these types of improvements. Studies suggest that organizations with highly skilled and compensated employees tend to prefer LEED and ENERGY STAR buildings to their non-green counterparts (DOE 2015). Partially as a result of this, green certifications are becoming the standard for Class A building developers in large metropolitan areas (Kolstad 2016). Although Class B tenants may be interested in green improvements, these tenants are more price-sensitive and less willing to pay more for such improvements (Hughes 2014). Also, Class A tenants typically have more room in their capital budgets, letting them self-finance energy efficiency improvements when building owners are unable or unwilling to do so (Bell, Sienkowski, and Kwatra 2013). This is not always an option for tenants of Class B and C buildings. Although Class B and C buildings have considerable potential for energy efficiency investment, Class A buildings currently dominate the efficiency market. Thus, charrette participants suggested that clean tax cuts pay specific attention to the Class B and C markets.
Learning from Historic Building Tax Credits
The Rehabilitation Tax Credit is a tax break for repairs to historic buildings. The National Park
Service must certify a building for it to qualify. The credit amounts to 20% of the costs
associated with the rehabilitation of certified historic structures and 10% for buildings placed
in service prior to 1936 (IRS 2017). To date, the tax credit has preserved more than 40,000
buildings and used $23.1 billion in tax credits. Those funds have also generated $28.1 billion
in tax revenue, created more than two million jobs, and generated more than $120 billion in
private investment (National Trust for Historic Preservation 2017).
Energy Efficiency in Commercial Real Estate
OPPORTUNITY
The commercial sector accounts for about 19% of US energy use. In 2015, energy bills in the commercial sector totaled $183 billion (EIA 2017b).

CLEAN TAX CUTS FOR COMMERCIAL REAL ESTATE © ACEEE
5
Energy efficiency represents a substantial investment opportunity in commercial real estate. The Rockefeller Foundation, in collaboration with Deutsche Bank, estimated that there is $72 billion worth of available upgrades in existing commercial real estate in the United States. By not investing in energy efficiency, those building owners are missing out on an estimated 848 trillion Btus of energy savings (Rockefeller Foundation and Deutsche Bank 2012). Table 1 summarizes some of the available efficiency opportunities in commercial buildings that the study identified. Globally, the study estimated that owners of commercial real estate will invest $960 billion dollars in 2014–2023 in greening their buildings, primarily through energy efficiency measures (Clancy 2014).
Table 1. Common energy efficiency measures used in commercial building retrofits
Measure
Payback
(years)
Controls
Controls retrofits and control strategies 3–4
Demand-controlled ventilation 2–5
Mechanical systems
Variable flow primary/secondary systems with controls 2–4
HVAC
Constant speed air handlers to variable air volume 2–4
VAV boxes, control setpoints, box flow minimums 5+
Boiler conversions from steam to hot water 5–8
High-efficiency fully condensing boilers 6–8
High-efficiency VFD chiller systems 8–12
Lighting
Install scheduling controls and interior systems 2–4
Convert incandescent to CFL 1–3
Replace exit signs with LED kits <2
Convert T12 to high-efficiency T8s with electronic ballasts 2–5
Source: Rockefeller Foundation and Deutsche Bank, 2012
The above figures are for buildings used for commercial purposes. However REITs, LLCs, and LLPs are sometimes used for multifamily housing, including low-income housing. In 2015, multifamily buildings with five or more apartment units represented almost 18% of all housing units in the United States (21.1 million of the 118.2 million units [EIA 2017a]). In 2009, multifamily homes represented nearly 17% of US housing units and nearly 9% of residential energy usage (EIA 2013). A 2012 study suggests that the multifamily sector represents approximately $17 billion in potential energy efficiency investments that would result in 175 trillion Btus of annual energy savings (Rockefeller Foundation and Deutsche Bank 2012). A 2017 ACEEE paper reports that utility spending in this space has grown significantly in recent years, but still represents an opportunity for further investment (Samarripas, York, and Ross 2017). The 50 largest apartment owners in the United States

CLEAN TAX CUTS FOR COMMERCIAL REAL ESTATE © ACEEE
6
own nearly 3 million units, with 21 of the 50 reporting ownership of subsidized, low-income apartments. Of the top 50 owners, eight REITs made the list, with a combined total capitalization of nearly $150 billion and more than 500,000 apartments (NMHC 2016). Market experts see multifamily as a growth sector for investments, particularly as homeownership rates are trending downwards, driving demand for rental properties (NAREIT 2016a, NAREIT 2016b). Based on these considerations, we also include multifamily housing within the scope of potential clean energy tax cuts.
The Rationale for Public Involvement in Energy Efficiency
Investments in energy efficiency reduce costs and provide other benefits to building owners.
But promoting greater efficiency investments in commercial buildings also serves various
other public purposes. Efficiency can contribute to lower energy rates for all customers by
reducing the need for more expensive investments in power system generation, transmission,
and distribution (see for example Walton 2016). It also reduces emissions that adversely
affect public health and contribute to global climate change. Finally, efficiency provides jobs
(more than two million according to DOE 2017) and contributes to product innovation and
economic development (see for example Area Development Fund 2010).
SOME LEADING COMMERCIAL BUILDING PROGRAMS
Three leading programs, ENERGY STAR Buildings, Leadership in Energy and Environmental Design (LEED), and the Global Real Estate Sustainability Benchmark (GRESB), seek to use a certification and/or benchmarking process to identify energy-efficient or green buildings and portfolios (there are also several other programs, including regional ones).
ENERGY STAR Buildings, a program created in 1992 and run by the Environmental Protection Agency (EPA), invites commercial building owners to voluntarily participate in a benchmarking practice (Energy Star 2017) that rates buildings on a scale of 0–100 (with 50 representing the industry average). Thus far, 25,000 commercial buildings have earned the ENERGY STAR certification by scoring 75 or higher and having these results certified by an engineer or architect (Energy Star 2017). From the program’s inception through 2015, more than 450,000 buildings, representing more than 40 billion square feet, have been benchmarked. Certified ENERGY STAR buildings have saved an estimated $3.4 billion as a result of their efforts (Energy Star 2017). The text box below offers further information on the ENERGY STAR Buildings program.
LEED, developed by the US Green Building Council (USGBC), is another program that has developed a rating system for all types of buildings. LEED buildings across the globe represent 17.1 billion square feet of building space; on average, they use 25% less energy compared to noncertified buildings according to USGBC (2017b). LEED awards points for buildings that meet specific criteria or green-building practices. Depending on the number of points awarded, buildings are classified as LEED Certified, LEED Silver, LEED Gold, or LEED Platinum (USGBC 2017a).
GRESB seeks to assess and benchmark real estate investments. Created in 2009 to provide sustainability data to investors, GRESB evaluates and scores the environmental, social, and governance (ESG) performance of real estate portfolios, real estate debt providers, and
CLEAN TAX CUTS FOR COMMERCIAL REAL ESTATE © ACEEE
7
infrastructure funds and assets. After assessing the data, each fund or portfolio receives a GRESB score that benchmarks it to other rated funds and portfolios (Sciullo 2015, GRESB 2017). More than 250 members, 60 of which are pension funds or their fiduciaries, rely on GRESB information to understand the sustainability risks of potential or actual investments (GRESB 2017). So far, GRESB has analyzed more than 1,000 property companies and funds and nearly 200 infrastructure assets and funds (GRESB 2017). GRESB evaluates portfolios of buildings, and not individual buildings.
Benefits of energy efficiency investment in commercial real estate extend beyond energy savings. A 2012 study showed that important financial metrics such as return on assets and return on equity were positively correlated with LEED or ENERGY STAR certification (Eichholtz, Kok, and Yonder 2012). A study that compared ENERGY STAR and LEED office buildings to similar office buildings showed that green building rental rates were 3% higher per square foot than their non-green counterparts. When maintenance and operating costs were factored in, the green buildings had an effective rent that was 7% higher than similar non-green buildings.6 ENERGY STAR and LEED office buildings also saw a 16% premium in their selling prices and experienced lower default rates (Eichholtz, Kok, and Quigley 2010; An and Pivo 2015).
How ENERGY STAR Buildings Work
Using EPA’s ENERGY STAR Portfolio Manager tool, building owners and managers can
benchmark their buildings’ energy efficiency on a 1–100 scale (and many have done so). Users
enter whole-building energy use for a 12-month period, along with key business activities, such
as hours of operation. The 1–100 score adjusts for these business activities, as well as for
weather and building size. Buildings that score 75 or higher are in the top quartile of energy
6 Effective rent is income after all maintenance and operating costs are factored in.

CLEAN TAX CUTS FOR COMMERCIAL REAL ESTATE © ACEEE
8
performance for similar buildings and are eligible to apply for ENERGY STAR certification. A
registered architect or professional engineer must review the building’s energy and other data,
visit the building, and stamp the application before it can be submitted to EPA. If lower tax rates
are available to buildings making substantial energy use reductions (as proposed below), the
same certification system could be used.
ENERGY STAR 1–100 scores are available for most commercial building types, including offices,
retail, schools, hospitals, and multifamily. These building types represent approximately 60% of
US commercial floor area.
Most ENERGY STAR scoring models are based on CBECS, with the remainder based on other
nationally representative survey data. EPA updates the models that use CBECS data when EIA
updates the CBECS. Presently, the CBECS-based models use data from the 2003 survey; EPA is
currently updating these models based on the 2012 CBECS, and it plans to release the updated
models in 2018.7
ENERGY STAR certification is based on the entire building. For leased buildings that are
submetered, owners need access to data on tenant energy use in order to calculate whole-
building energy use. Some states have procedures whereby owners can obtain aggregated
tenant consumption data from their utility (aggregated so that individual tenant privacy is
preserved). Charrette participants agreed that such mechanisms are essential for a tax incentive
based on ENERGY STAR.
Because ENERGY STAR certification is based on a year of performance data, buildings must be
recertified each year. Our thinking is that this could be done early in a calendar year based on
data for the preceding calendar year, and the results reported to taxpayers before they file their
taxes in April (although we understand that extensions are common for real estate investors).
Still, this schedule may be tight; one option might be to allow certifications from a year earlier to
count (e.g., for 2016 income filings, allow certification on 2015 data if the 2016 data are not
available in time). However, if this option is used, taxpayers should not be able to claim a lower
tax rate for two consecutive years using the same certification; each year, a new certification
would be needed.
7 See www.energystar.gov/buildings/facility-owners-managers/existing-buildings/use-portfolio-manager/update-energy-star-scores-cbecs.

CLEAN TAX CUTS FOR COMMERCIAL REAL ESTATE © ACEEE
9
Options for Clean Tax Cuts for Commercial Real Estate
Clean tax cuts offer several options to encourage energy efficiency investments in commercial real estate. A variety of these options were discussed at our charrette workshop in March 2017. From these discussions, two principal clean tax cut options emerged:
• A reduced tax rate on individual income from trusts and partnerships that derive from efficient buildings
• Expensing or accelerated depreciation on investments to improve the efficiency of commercial real estate (and potentially extend this to other types of businesses)
We now discuss these options based primarily on the charrette discussion but also based on the results of ACEEE’s post-charrette analysis that directly affect these issues.8
REDUCED TAX RATE ON INCOME FROM EFFICIENT BUILDINGS
Basic Proposal
The concept is simple: income from ENERGY STAR certified buildings will qualify for a lower tax rate.9 We think an appropriate tax rate on income might be the same tax rate as that used for long-term capital gains. Currently this rate is 15% for most taxpayers and 20% for those in the highest tax bracket. Under the Better Way proposal put forward by the House of Representatives’ leadership, long-term capital gains would be taxed at half the rate of normal income (Better.gop 2016). Other variations are likely to emerge as part of tax reform discussions. The long-term capital gains rate is well-known to investors and is substantially lower than the marginal tax rate on normal income that many of these investors pay. A variation on this option would be to cut the capital gains tax rate on these buildings in half (e.g., reducing a 15% capital gains rate to 7.5% for clean investments). However the additional financial benefits to the average building owner would be modest,10 and cutting the capital gains rate further would entail substantial political challenges.11
Other Suggestions
Because it would be very difficult for some old buildings to reach ENERGY STAR levels, charrette participants suggested that the lower tax rate also be available to those trying hard to improve the efficiency of their properties. Specifically, they suggested that owners who achieved at least a 30% improvement in their ENERGY STAR Portfolio Manager score could also qualify for a lower tax rate. This lower rate for substantial improvement might apply for five years, but then an additional 30% savings relative to the new base (or reaching
8 In addition, we note that participants in the Columbia University March 6, 2017 charrette on applying clean tax cuts to green bonds suggested tax exemption for mortgage-backed securities that are backed by ENERGY STAR certified buildings (Richardson et al. 2017).
9 This proposal assumes that the ENERGY STAR program will continue, despite a proposal by the Office of Management and Budget (OMB) to eliminate federal funding for the program (OMB 2017).
10 As we discussed earlier, an average of approximately 12% of REIT income is capital gains, and hence a lower tax rate would apply only to this 12% of income, far less than the 66% of REIT income that is not capital gains (remaining REIT income is return of capital, which is not taxed).
11 Some Democrats want to raise the tax rate on capital gains, not lower it.

CLEAN TAX CUTS FOR COMMERCIAL REAL ESTATE © ACEEE
10
ENERGY STAR certified levels) would be needed to continue qualifying for the lower tax rate.
Alternative qualifying criteria could include LEED, and there also might be a way to leverage GRESB reviews. Both include energy efficiency features but, unlike ENERGY STAR, do not incorporate actual building performance. In addition to energy, both include a variety of other sustainability features. Given its focus on actual performance per an objective metric (energy use), charrette participants preferred ENERGY STAR over LEED. They further noted that GRESB is for entire portfolios and includes a variety of judgment calls; it therefore would be hard to use for a tax credit.
Some charrette participants suggested offering multiple ways to qualify for lower tax rates, maximizing ways to participate. But other participants noted that savvy building owners would look at the various systems and find the easiest one to qualify for, reducing energy savings and encouraging gaming. Many participants agreed with this second viewpoint.
Required Documentation
We suggest that property owners or managers report qualification for the lower tax rate on official IRS forms that report income to investors such as the IRS Schedule K-1. Owners and managers would need to keep supporting paperwork on file; for individual taxpayers, it would be sufficient to have a K-1 (or similar form) with a checkbox to indicate that the income qualifies for the lower tax rate.
Portfolios of Buildings
For trusts or partnerships owning more than one building, there are two options. First, they could separate income into two categories: normal income and income qualifying for the reduced tax rate. This is generally how long-term and short-term capital gains are reported to investors. Alternatively, and perhaps more simply, they could report total income and then report the percentage of that income that qualifies for the lower tax rate. This approach is similar to how many mutual funds report foreign or tax-exempt interest to investors. Charrette participants thought either option could work.
Increasing Qualification Levels
If a tax cut is based on ENERGY STAR Buildings certification, then the criteria to be in the top quartile and be certified will slowly increase. Currently certification is based on 2003 CBECS data, but this will be changed to 2012 CBECS data as of 2018. This implies that the next Portfolio Manager might be released around 2024 (assuming that the next CBECS will gather building characteristic and energy use data for 2018 and it will take six years to process the data and update Portfolio Manager). Charrette participants thought this would be adequate to keep the tax cut reasonably current.
Charrette participants also discussed the slow pace of this update process, tentatively observing that CBECS updates will generally have only a modest impact on qualification levels. This implies that some additional improvement could be required to maintain eligibility for the lower tax rate. The charrette discussed requiring a higher Portfolio

CLEAN TAX CUTS FOR COMMERCIAL REAL ESTATE © ACEEE
11
Manager score (e.g., 85) after five years.12 Charrette participants thought this proposal would be too complicated and would not capture the full value of the ENERGY STAR brand and the advantages of a simple system that applies to all buildings.
However, as we discuss below in the “Savings and Cost of These Proposals” section, on subsequent analysis we observed that a tax reduction that does not expire and is based only on ENERGY STAR is fairly expensive per unit of energy saved. If policymakers are interested in reducing this cost, then it might be necessary to consider either limiting the tax rate cut to a certain number of years (such as five) or raising the criteria in order to continue to qualify (e.g., a Portfolio Manager score of 85 instead of 75). If the latter approach were chosen, perhaps ENERGY STAR could develop and publicize a higher tier (e.g., ENERGY STAR Gold) for buildings that meet this higher Portfolio Manager threshold.
Limitations on Lower Tax Rates
The charrette participants noted that the lower tax rate discussed above would primarily apply to the approximately 30% of commercial building energy use that is in leased buildings owned by REITs, LLCs, and LLPs. It could potentially be applied to corporate income taxes, but that would require separating income and expenses from individual buildings on corporate tax returns, a substantial undertaking that would reduce the incentive of a lower tax rate. Further, lower tax rates would not apply to the approximately 23% of commercial building energy use in government-owned buildings, not to mention buildings owned by nonprofit organizations or those that do not have net income and therefore are not paying taxes (e.g., buildings with large available write-offs). To address this much larger market, charrette participants suggested that other approaches will be needed as an alternative or a complement to lower tax rates. Participants particularly focused on accelerated depreciation, which we now discuss.
EXPENSING OR ACCELERATED DEPRECIATION
Under current tax law, when a commercial building is built or purchased, it is depreciated over 39 years, meaning that 1/39 of this cost is treated as an expense for tax purposes each year. The same 39-year depreciation period applies to building improvements that are attached to the building, such as lighting fixtures and HVAC systems, even though this equipment has a typical equipment life of 15–20 years. This long depreciation period can be a disincentive for energy-saving investments because, if inefficient equipment is replaced before 39 years, the undepreciated balance is treated as an expense in the year the equipment is replaced. This issue is discussed in more depth by Nadel and Farley (2013). One exception to this 39-year period is for tenant improvements, that is, funds provided by the owner to new tenants to fit out their new space. Such leasehold improvements are depreciated over 15 years.
The House Republicans’ Better Way plan suggests that all business investments not be depreciated, but instead they be expensed, meaning that all costs would be counted against income in the year the expenses were incurred. On the other hand, this provision would no longer allow interest expenses to be deducted. This proposal is an expensive provision. The
12 The five years could be continuous or intermittent, depending on whether the building misses certification in some years.

CLEAN TAX CUTS FOR COMMERCIAL REAL ESTATE © ACEEE
12
Tax Policy Center estimates a 10-year cost of this provision to the federal treasury of $437 billion (Nunns et al 2016). The real estate industry does not like the provision to end the deductibility of interest expenses, because real estate relies on long-term financing in which interest expenses are substantial (Real Estate Roundtable 2017). Thus, in some experts’ view, there is a significant chance that immediate expensing may not be included in tax reform legislation. If immediate expensing of all investments is not included in tax reform, expensing or accelerated depreciation (depreciating over a period longer than one year but less than 39 years) could be used as a more targeted clean tax cut, applicable only to energy efficiency investments (and potentially other clean investments).
Financial Benefits of Expensing and Accelerated Depreciation
Table 2 below looks at the net present value (NPV) of a $100,000 investment under different depreciation periods. For 39-year depreciation, the NPV of the depreciation is only 29% of the investment amount. By contrast, for expensing (the same as one-year depreciation), the NPV is 92% of the investment amount, a significant difference of 63%. Relative to 15-year depreciation, the NPV of expensing is 36% of the investment. Short of expensing, another option is accelerated depreciation. Relative to 39-year depreciation, for a 5-year or 10-year depreciation period, the accelerated depreciation’s NPV would be 50% or 37% of the investment, respectively.
Table 2. Net present value (NPV) analysis of various depreciation periods for a
$100,000 investment
Depreciation
period
(years)
NPV of
depreciation
NPV as
% of
investment
Value of accelerated
depreciation
Relative to
39 years
Relative to
15 years
1 92,396 92% 62,666 36,125
5 79,372 79% 49,642 23,102
10 66,410 66% 36,680 10,140
15 56,270 56% 26,540 —
20 48,262 48% 18,532 NA
39 29,730 30% — NA
Discount rate based on weighted average cost of capital. The weighted average cost of capital
for “real estate general/diversified” was 8.27% as of January 2017 according to the NYU Stern
School of Management (Stern 2017). Source: ACEEE analysis.
The value of expensing or accelerated depreciation to taxpayers depends on their tax bracket. If immediate expensing has a benefit of $63,000 (rounding from line 1 in the table above) and a taxpayer has a marginal tax rate of 20%, then immediate expensing would reduce the person’s taxes by about $12,600 (that is, 20% of $63,000). We found no data in our research on typical marginal tax rates for income from commercial real estate. We did find two recent estimates for the average tax rate. First, the Department of the Treasury (2016) estimates the effective federal corporate tax rate by industry over the 2007–2011 period. For real estate, it reports a 20% average effective tax rate. Second, data collected by the Stern School of Business (2017) reports, for general/diversified real estate, an average effective tax rate of 15.32% for all firms, but 22.36% for profitable firms. However the sample size for

CLEAN TAX CUTS FOR COMMERCIAL REAL ESTATE © ACEEE
13
general/diversified real estate was only 11 firms, so for our calculations, we use the 20% rate found by the Department of the Treasury. But some taxpayers probably pay considerably more or less than these amounts. For example, as noted earlier, the GAO reports that for the largest corporations, the average income tax was 14% for those paying taxes, and only 11% when those who do not owe taxes are included (GAO 2016). At the other end of the spectrum, Gravelle (2014) reports marginal effective tax rates for buildings and equipment of 23–29% (including state corporate income taxes in addition to federal taxes). So, while we use the 20% tax rate, given this range of effective tax rates, we caution that variation around this estimate is large.
Proposal for Expensing and Accelerated Depreciation
Based on the analysis in table 2, expensing and accelerated depreciation could provide a useful incentive for energy efficiency investments. One idea discussed at the charrette workshop is to scale the depreciation with the amount of energy savings achieved, as measured with Portfolio Manager relative to the base building. For example, buildings achieving 30% energy savings could be granted immediate expensing for the energy efficiency investment costs needed to achieve the 30% savings, buildings saving 20% could be given 5-year depreciation for their associated investment costs, and buildings saving 10% could be given 10-year expensing. Because all of these periods are less than the current 15-year depreciation for leasehold improvements, they would also encourage building owners to work with tenants to improve energy efficiency in tenant spaces.
However, following the charrette, we conducted further analysis on how much incentive accelerated depreciation would provide compared to immediate expensing. We found that immediate expensing would provide an average incentive of about 12% of the needed investment, which is a modest incentive. Accelerated depreciation would be significantly less valuable. Based on this analysis result and the fact that a three-tier structure is complicated, we now recommend a simpler structure: immediate expensing if at least 10% savings are achieved. Subsequent investments would also be eligible for immediate expensing if they achieve at least 10% energy savings relative to the new baseline.
Note that if Portfolio Manager becomes the basis of determining eligibility for immediate expensing, then the instructions for use of Portfolio Manager should be carefully reviewed, and any ambiguities clarified. Under ENERGY STAR, a licensed engineer or architect must certify Portfolio Manager scores. A similar certification would be useful if Portfolio Manager is used for depreciation purposes, although perhaps the Secretary of the Treasury could develop criteria for certifying Portfolio Manager experts who are not engineers or architects.
Effect of Expensing for All Investments
This proposal would not work if the Better Way proposal to allow expensing for all business investments is enacted. Charrette participants discussed this possibility and suggested that if this were to happen, then tax deductions or credits might be needed, with the size of the deduction or credit based on the level of energy savings achieved.
Savings and Cost of These Proposals
We prepared a very approximate estimate of how much energy these two options—reduced tax rate and immediate expensing—might save and how much they might cost the federal treasury. Appendix C explains our many estimates and assumptions, and table 3
CLEAN TAX CUTS FOR COMMERCIAL REAL ESTATE © ACEEE
14
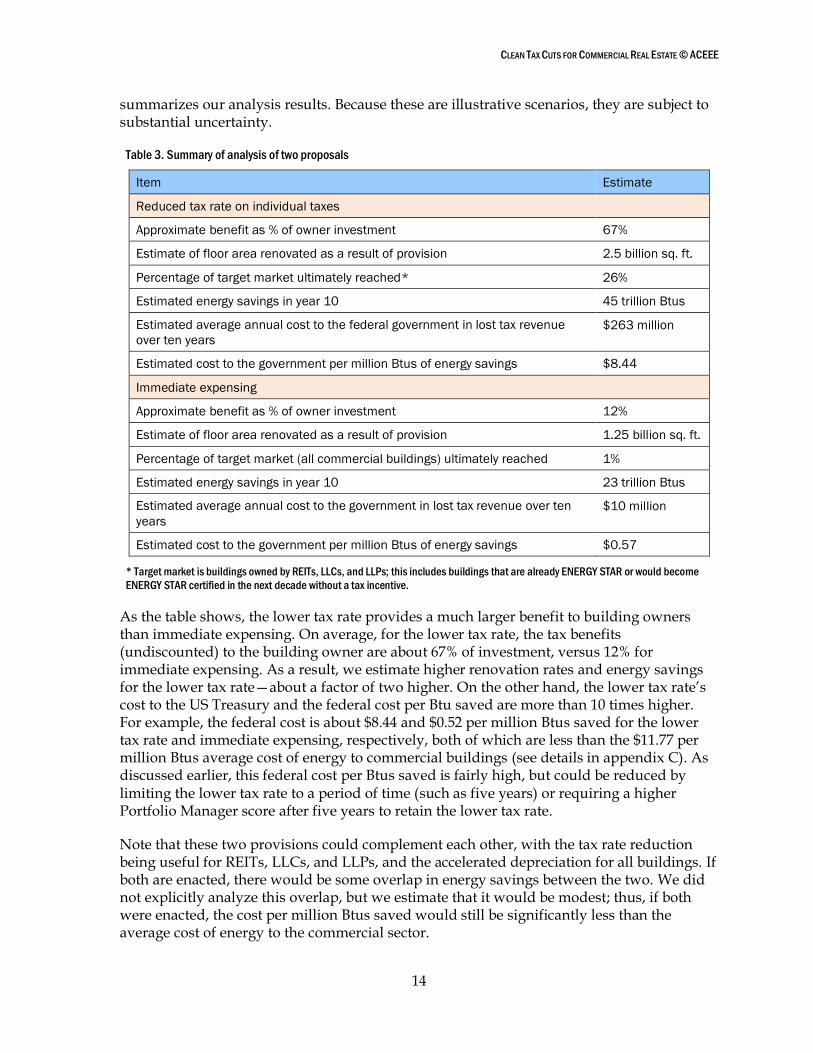
summarizes our analysis results. Because these are illustrative scenarios, they are subject to substantial uncertainty.
Table 3. Summary of analysis of two proposals
Item Estimate
Reduced tax rate on individual taxes
Approximate benefit as % of owner investment 67%
Estimate of floor area renovated as a result of provision 2.5 billion sq. ft.
Percentage of target market ultimately reached* 26%
Estimated energy savings in year 10 45 trillion Btus
Estimated average annual cost to the federal government in lost tax revenue
over ten years
$263 million
Estimated cost to the government per million Btus of energy savings $8.44
Immediate expensing
Approximate benefit as % of owner investment 12%
Estimate of floor area renovated as a result of provision 1.25 billion sq. ft.
Percentage of target market (all commercial buildings) ultimately reached 1%
Estimated energy savings in year 10 23 trillion Btus
Estimated average annual cost to the government in lost tax revenue over ten
years
$10 million
Estimated cost to the government per million Btus of energy savings $0.57
* Target market is buildings owned by REITs, LLCs, and LLPs; this includes buildings that are already ENERGY STAR or would become
ENERGY STAR certified in the next decade without a tax incentive.
As the table shows, the lower tax rate provides a much larger benefit to building owners than immediate expensing. On average, for the lower tax rate, the tax benefits (undiscounted) to the building owner are about 67% of investment, versus 12% for immediate expensing. As a result, we estimate higher renovation rates and energy savings for the lower tax rate—about a factor of two higher. On the other hand, the lower tax rate’s cost to the US Treasury and the federal cost per Btu saved are more than 10 times higher. For example, the federal cost is about $8.44 and $0.52 per million Btus saved for the lower tax rate and immediate expensing, respectively, both of which are less than the $11.77 per million Btus average cost of energy to commercial buildings (see details in appendix C). As discussed earlier, this federal cost per Btus saved is fairly high, but could be reduced by limiting the lower tax rate to a period of time (such as five years) or requiring a higher Portfolio Manager score after five years to retain the lower tax rate.
Note that these two provisions could complement each other, with the tax rate reduction being useful for REITs, LLCs, and LLPs, and the accelerated depreciation for all buildings. If both are enacted, there would be some overlap in energy savings between the two. We did not explicitly analyze this overlap, but we estimate that it would be modest; thus, if both were enacted, the cost per million Btus saved would still be significantly less than the average cost of energy to the commercial sector.
CLEAN TAX CUTS FOR COMMERCIAL REAL ESTATE © ACEEE
15
How to Pay for This Tax Cut
For all tax cuts, a key question is how the federal government will pay for them. In this case, by reducing energy use in commercial buildings, we increase their profitability, which can increase the amount of taxes paid by these buildings. In addition, taxes will be paid on the wages of workers who perform the building upgrades and on business profits from the firms providing these services and equipment. Based on some very rough calculations, we estimate that additional taxes might cover somewhat more than 10% of the cost of these tax cuts to the Treasury.
There are also other ways to pay for this clean tax cut. In recent years, the federal government has paid approximately $1.14 billion per year for energy efficiency tax incentives (JCT 2014). The tax incentives expired at the end of 2016. In the past, these tax credits have been extended retroactively, and this could potentially happen this year. Thus, a portion of historic tax expenditures could be channeled to these clean tax cuts.
Furthermore, some economists believe that capital tax cuts such as these will help grow the economy by increasing revenue. For example, papers by two recent chairs of the Council of Economic Advisors, one under George W. Bush (Greg Mankiw, now at Harvard) and one under Barack Obama (Christina Romer, now at UC Berkeley), attempt to quantify these effects, leading to Mankiw’s rough estimate that perhaps 50% of a capital tax cut’s cost might be recouped from additional tax revenue (Richardson 2016).
Other Issues
Several other notable issues were raised in the charrette workshop.
TAX REFORM PRIORITIES
Tax reform involves many issues, including lower tax rates and whether interest expenses will continue to be deductible on business taxes. Because the real estate industry cares much more about these issues than about modest energy efficiency tax incentives, it is unclear how much active support the real estate industry would put behind a clean tax cut effort.
GOVERNMENT AND NONPROFIT OWNERS
More than 20% of commercial floor area is owned by branches of government that don’t pay taxes. And, when nonprofit ownership is also added, the figure is higher. However the present 179D federal tax deduction includes a provision whereby government and nonprofit owners can assign their deduction to their project architect or engineer, who in turn would reduce their fees. Charrette participants recommended a similar provision for any clean tax cut targeting commercial real estate. For example, the benefit of the tax rate cut and the accelerated depreciation could be calculated and assigned as a deduction to the project architect, engineer, or contractor.
TENANT IMPROVEMENTS
Tenants generally provide their own plug-load equipment, frequently specify lighting systems, and sometimes specify other energy-using systems. These choices have a substantial impact on commercial building energy use. As part of the tenant build-out, charrette participants agreed that tenant sub-metering should be encouraged (tenants tend to use less energy when they pay for it) as should plug-load controls (controls that turn off

CLEAN TAX CUTS FOR COMMERCIAL REAL ESTATE © ACEEE
16
plug loads when a tenant space or even an individual office or cubicle is not in use). Owners could use the expensing provision to help with tenant improvements, and tenants could also use expensing if they pay for some improvements themselves. A recent federal law also establishes a new federal Tenant Star program to encourage and recognize energy efficiency as part of tenant improvements. Tenant Star has developed a recommended five-step approach for tenants to follow.13
EXTENDING ACCELERATED DEPRECIATION TO THE INDUSTRIAL SECTOR
The accelerated depreciation concept could also be extended to improvements in the industrial sector. For the industrial sector, Portfolio Manager cannot be used, but methods have been developed to benchmark a facility’s industrial energy consumption.14
APPLYING CLEAN TAX CUTS TO PROPERTY TAXES
Generally, commercial buildings pay much more for local property taxes than they pay on federal income taxes.15 Thus, applying the clean tax concept to local property taxes would be very attractive to building owners. However local governments would not want to lose too much in tax revenue. A whole new research effort to explore such a concept would be useful.
Property taxes are generally set and collected at the local level, although a few states also have property taxes. These taxes are a large source of income for the local government, and the rate is determined by various factors including other sources of tax revenue, median property value, and local government spending. As a result, property tax rates vary significantly depending on the locality. In 2015, the average effective tax rate on commercial buildings over $1 million was 2.11%, but this rate varied considerably among cities; Detroit and Seattle, for example, had rates of 4.13% and 0.88%, respectively (Lincoln Institute of Land Policy and Minnesota Center for Fiscal Excellence 2016). The five cities with the highest commercial tax rates are Detroit, New York, Providence, Chicago, and Bridgeport, Connecticut. The lowest commercial tax rates are in Cheyenne, Seattle, Honolulu, Virginia Beach, Washington, DC, and Wilmington, Delaware (Lincoln Institute of Land Policy and Minnesota Center for Fiscal Excellence 2016).
Some states and localities provide property tax exemption or credits for clean technology. Many states provide some type of exemption for renewable energy, predominately in the form of property tax exemption from the value that equipment adds to the property. Massachusetts, for example, grants a 20-year property tax exemption for the value that renewable energy equipment adds to the property (DSIRE 2016). Nevada provides a tax abatement program for green buildings that qualify for the Silver Level or higher through the LEED or Green Globes rating system (Nevada Governor’s Office of Energy 2017). The value of the tax abatement is determined by a point system based on LEED or Green Globe
13 See www.energystar.gov/buildings/tenants/about_tenant_star.
14 See www.energystar.gov/buildings/facility-owners-and-managers/industrial-plants/measure-track-and-benchmark/tools-tracking-and .
15 As discussed below, property taxes average about 2% of building value. By contrast, if annual rents are 12% of building value, expenses are 80% of rents, and the effective federal income tax rate is 20% (all “ballpark” figures), then income taxes are on the order of 0.19% of building value.
CLEAN TAX CUTS FOR COMMERCIAL REAL ESTATE © ACEEE
17
standards.16 Montgomery County, Maryland, also has a similar tiered-system based on the varying LEED qualifications (Montgomery County Department of Finance 2017).
Conclusions and Next Steps
Based on the charrette discussion and our further analysis, we find that the lower tax rate for ENERGY STAR certified buildings would provide a strong incentive for energy efficiency upgrades in the approximately 30% of the commercial real estate market owned by REITs, LLCs, and LLPs. The immediate expensing provision would provide a more modest incentive, but applies to about 75% of the commercial real estate market that is taxable (and could potentially apply to untaxed government and nonprofit buildings if they are allowed to pass the value of expensing to the architects, engineers, and contractors who work on efficiency upgrade projects). Thus both of these concepts are worth further exploration, including in discussions with commercial real estate firms, market experts, and policymakers. This could lead to refinements of this proposal and the development of implementing legislation.
It might also be possible to combine commercial real estate clean tax cuts with other clean tax cuts (see appendix D) in an integrated package. For example, clean investments could be defined to include efficient buildings as well as emissions-free power generation, efficient cars and trucks, and other emissions-reduction techniques. A variety of tax reductions could be offered for these investments, including lower tax rates on generated income, accelerated depreciation, and opportunities for tax-free green bonds.17
16 Full details available at energy.nv.gov/uploadedFiles/energynvgov/content/Programs/NAC701A.280.pdf.
17 Richardson et al. (2017) discuss this last concept.

CLEAN TAX CUTS FOR COMMERCIAL REAL ESTATE © ACEEE
18
References
An, X., and G. Pivo. 2015. Default Risk of Securitized Commercial Mortgages: Do Sustainability Property Features Matter? Hartford, CT: Real Estate Research Institute. www.reri.org/research/files/2014funded_An-and-Pivo.pdf.
Area Development Fund. 2010. “LED Lighting Company Cree Investing $135M in Durham, North Carolina.” Area Development News. www.areadevelopment.com/newsitems/9-20-2010/cree-durham-north-carolina09204.shtml.
Bell, C., S. Sienkowski, and S. Kwatra. 2013. Financing for Multi-Tenant Building Efficiency: Why This Market Is Underserved and What Can Be Done to Reach It. Washington, DC: ACEEE. aceee.org/research-report/e13e.
Better.gop (Office of the Speaker of the House). 2016. A Better Way: Our Vision for a Confident America—Tax. Washington, DC: Better.gop. abetterway.speaker.gov/_assets/pdf/ABetterWay-Tax-PolicyPaper.pdf.
Blades, J. 2016. “Could Tax Cuts Help Cure Climate Change? A Surprising Left/Right Conversation.” The Huffington Post, December 15. www.huffingtonpost.com/living-room-conversations/could-tax-cuts-help-cure-_b_8813872.html.
BOMA International (Building Owners and Managers Association International). 2017. “Building Class Definitions.” www.boma.org/research/pages/building-class-definitions.aspx.
CBRE (Coldwell Banker Richard Ellis). 2016. 2017 U.S. Market Outlook. Los Angeles: CBRE. www.cbre.us/research/2016-U-S-Reports/Pages/2017-US-Outlook.aspx.
Clancy, H. 2014. “In California, at Least, the Case for Energy Efficiency Is Building.” Forbes, December 30. www.forbes.com/sites/heatherclancy/2014/12/30/in-california-at-least-the-case-for-energy-efficiency-is-building/ - 361a93b5324f.
Department of the Treasury. 2016. “Average Effective Federal Corporate Tax Rates.” www.treasury.gov/resource-center/tax-policy/tax-analysis/Documents/Average-Effective-Tax-Rates-2016.pdf.
DOE (US Department of Energy). 2015. Energy Efficiency & Financial Performance: A Review of Studies in the Market. Washington, DC: DOE. betterbuildingssolutioncenter.energy.gov/resources/energy-efficiency-financial-performance-a-review-studies-market.
——— . 2017. U.S. Energy and Employment Report. Washington, DC: DOE. energy.gov/downloads/2017-us-energy-and-employment-report.
DSIRE (Database of State Incentives for Renewables & Efficiency®). 2016. “Renewable Energy Property Tax Exemption.” programs.dsireusa.org/system/program/detail/146.
EIA (Energy Information Administration). 2013. “2009 Residential Energy Consumption Survey Data.”
CLEAN TAX CUTS FOR COMMERCIAL REAL ESTATE © ACEEE
19
www.eia.gov/consumption/residential/data/2009/index.php?view=characteristics - structural.
——— . 2016. “2012 Commercial Buildings Energy Consumption Survey Data.” www.eia.gov/consumption/commercial/data/2012/.
——— . 2017a. “2015 Residential Energy Consumption Survey Data.” www.eia.gov/cohnsumption/residential/data/2015/.
——— . 2017b. 2017 Annual Energy Outlook. Washington, DC: EIA. www.eia.gov/outlooks/aeo/.
Eichholtz, P., N. Kok, and J. Quigley. 2010. “Doing Well by Doing Good? Green Office Buildings.” American Economic Review 100 (5): 2494–2511. urbanpolicy.berkeley.edu/pdf/AER_Revised_Proof_101910.pdf.
Eichholtz, P., N. Kok, and E. Yonder. 2012. “Portfolio Greenness and the Financial Performance of REITs.” Journal of International Money and Finance 31 (7): 1911–1929. www.fir-pri-awards.org/wp-content/uploads/Article-Eichhiltz-Kok-Yonder.pdf.
ENERGY STAR. 2017. “Facts and Stats.” www.energystar.gov/buildings/about-us/facts-and-stats.
GAO (Government Accountability Office). 2016. Corporate Income Tax: Most Large Profitable U.S. Corporations Paid Tax but Effective Tax Rates Differed Significantly from the Statutory Rate. Washington, DC: GAO. www.gao.gov/assets/680/675844.pdf.
Grace Richardson Fund. 2016. GRF Report on the Clean Tax Cuts Working Group Charrette at Columbia University. Greensboro, NC: Grace Richardson Fund. gracerichardsonfund.org/wp-content/uploads/2016/10/grf-charrette-report-161029.pdf.
Gravelle, J. 2014. International Corporate Tax Rate Comparisons and Policy Implications. Washington, DC: Congressional Research Service. fas.org/sgp/crs/misc/R41743.pdf.
GRESB (Global Real Estate Sustainability Benchmark). 2017. “Who We Are.” www.gresb.com/who-we-are.
Hackett, R. 2016. “How Critical Real Estate Is to the Global Economy—In One Chart.” Fortune, January 26. fortune.com/2016/01/26/rea-estate-global-economy/.
Hughes, C. 2014. “Manhattan’s Second-Tier Office Buildings Make Energy Efficiency a Goal.” New York Times, November 11. www.nytimes.com/2014/11/12/realestate/commercial/manhattans-second-tier-office-buildings-make-energy-efficiency-a-goal.html?_r=0.
Imperiale, R. 2006. Getting Started in Real Estate Investment Trusts. Hoboken, NJ: John Wiley & Sons.

CLEAN TAX CUTS FOR COMMERCIAL REAL ESTATE © ACEEE
20
Investopedia. 2017. “Real Estate Limited Partnership—RELP.” www.investopedia.com/terms/r/realestatelimitedpartnership.asp?lgl=myfinance-layout.
IRS (Internal Revenue Service). 2017. “Rehabilitation Tax Credit—Real Estate Tax Tips.” www.irs.gov/businesses/small-businesses-self-employed/rehabilitation-tax-credit-real-estate-tax-tips.
JCT (Joint Committee on Taxation). 2014. Estimated Revenue Effects of H.R. 5771, The “Tax Increase Prevention Act of 2014,” Scheduled for Consideration by the House of Representatives on December 3, 2014. Washington, DC: JCT. www.jct.gov/publications.html?func=startdown&id=4677.
Kolstad, L. 2016. Energy Efficiency Finance for Commercial Buildings: Insights from Lenders. Washington, DC: Institute for Market Transformation. www.imt.org/uploads/resources/files/Energy_Efficiency_Finance_for_Commercial_Buildings_Insights_From_Lenders.pdf.
Lincoln Institute of Land Policy and Minnesota Center for Fiscal Excellence. 2016. 50-State Property Tax Comparison Study for Taxes Paid in 2015. Cambridge, MA: Lincoln Institute of Land Policy; St. Paul: Minnesota Center for Fiscal Excellence. www.lincolninst.edu/sites/default/files/pubfiles/50-state-property-tax-study-2016-full.pdf.
Montgomery County Department of Finance. 2017. “Property Tax Credit and Exemption Information.” www.montgomerycountymd.gov/finance/taxes/tax_credit_exempt.html - p19.
Morningstar. 2015. “Benefits of REITs.” news.morningstar.com/classroom2/course.asp?docId=145579&page=2.
Nadel, S., and K. Farley. 2013. Tax Reforms to Advance Energy Efficiency. Washington, DC: ACEEE. aceee.org/research-report/e132.
NAREIT (National Association of Real Estate Investment Trusts). 2016a. REITWatch, December. www.reit.com/sites/default/files/reitwatch/RW1612.pdf.
——— . 2016b. “Resurgent Demand for Rentals Buoys Multifamily REITs.” Market Commentary, August 5. www.reit.com/data-research/research/market-commentary/resurgent-demand-rentals-buoys-multifamily-reits.
——— . 2017. “Frequently Asked Questions About REITs.” www.reit.com/investing/reit-basics/frequently-asked-questions-about-reits.
National Association of Realtors. 2017. 2016 Q4 Commercial Real Estate Market Survey. Washington, DC: National Association of Realtors. www.nar.realtor/2016-q4-commercial-real-estate-market-survey.
National Trust for Historic Preservation. 2017. “Historic Tax Credits.” savingplaces.org/historic-tax-credits - .WQdn_4nytTZ.

CLEAN TAX CUTS FOR COMMERCIAL REAL ESTATE © ACEEE
21
Nevada Governor’s Office of Energy. 2017. “Green Building Tax Abatements.” Accessed April. energy.nv.gov/Programs/Green_Building_Tax_Abatements/.
NMHC (National Multifamily Housing Council). 2016. NMHC 50. Washington, DC: NMHC. www.nmhc.org/uploadedFiles/Final_Govt_Affairs_Research_Insight_Content/Research-Reports/2016-NMHC-50.pdf.
Nunns, J., L. Burman, B. Page, J. Rohaly, and J. Rosenberg. 2016. An Analysis of the House GOP Tax Plan. Washington, DC: Tax Policy Center. www.taxpolicycenter.org/publications/analysis-house-gop-tax-plan/full.
OMB (Office of Management and Budget). 2017. America First: A Budget Blueprint to Make America Great Again. Washington, DC: OMB. www.whitehouse.gov/sites/whitehouse.gov/files/omb/budget/fy2018/2018_blueprint.pdf.
Real Estate Roundtable. 2017. Real Estate: A Foundation for Growth—2017 National Policy Agenda. Washington, DC: Real Estate Roundtable. www.rer.org/2017-Policy-Agenda/.
Richardson, R. 2016. Clean Tax Cuts and Deregulation. Greensboro, NC: Grace Richardson Fund. gracerichardsonfund.org/wp-content/uploads/2016/11/GRF-CTCwhitepaper-160919.pdf.
Richardson, R., T. Bradford, S. Dejonckheere, and W. Winegarden. 2017. Clean Tax Cuts for Green Bonds: Charrette Report. New York: Columbia University School of International and Public Affairs. cleantaxcuts.org/wp-content/uploads/char-rpt-greenbonds-170306.pdf.
Rockefeller Foundation and Deutsche Bank Group. 2012. United States Building Energy Efficiency Retrofits: Market Sizing and Financing Models. New York: Rockefeller Foundation; Frankfurt: Deutsche Bank Group. assets.rockefellerfoundation.org/app/uploads/20120301221532/United-States-Building-Energy-Efficiency-Retrofits.pdf.
Samarripas, S., D. York, and L. Ross. 2017. More Savings for More Residents: Progress in Multifamily Housing Energy Efficiency. Washington, DC: ACEEE. aceee.org/research-report/u1702.
Sciullo, J. 2015. “Everything You Need to Know About the Global Real Estate Sustainability Benchmark.” Linkedin, March 24. www.linkedin.com/pulse/everything-you-need-know-global-real-estate-benchmark-julie-taylor.
Stern (Stern School of Business, New York University). 2017. “Tax Rates by Sector.” pages.stern.nyu.edu/~adamodar/New_Home_Page/datafile/margin.html.
USGBC (United States Green Building Council). 2017a. “About LEED.” www.usgbc.org/articles/about-leed.
——— . 2017b. “Benefits of Green Building.” www.usgbc.org/articles/green-building-facts.

CLEAN TAX CUTS FOR COMMERCIAL REAL ESTATE © ACEEE
22
Walton, R. 2016. “The Non-Wire Alternative: ConEd’s Brooklyn-Queens Pilot Rejects Traditional Grid Upgrades.” Utility Dive, August 3. www.utilitydive.com/news/the-non-wire-alternative-coneds-brooklyn-queens-pilot-rejects-traditional/423525/.
Weaver, J. 2014. “Forming an LLC for Real Estate Investments: Pros & Cons.” www.legalzoom.com/articles/forming-an-llc-for-real-estate-investments-pros-cons.

CLEAN TAX CUTS FOR COMMERCIAL REAL ESTATE © ACEEE
23
Appendix A. Charrette Workshop Participants
Jennifer Amann, ACEEE Deborah Burke, RBF Iain Campbell, RMI Candace Damon, HR&A Advisors, Inc. Duane Desiderio, Real Estate Roundtable Joseph Eaves, NEMA Elizabeth Halliday, Grace Richardson Fund Jason Hartke, US DOE Philip Henderson, NRDC Adam Hinge, Sustainable Energy Partnerships Patrick Hughes, NEMA Kevin Lucas, Alliance to Save Energy Jean Lupinacci, US EPA Steve Nadel, ACEEE Peter Nelson, K+L Gates Rod Richardson, Grace Richardson Fund Dan Seligman, Ceres Adam Sledd, Institute for Market Transformation Brian Stickles, ACEEE Elizabeth Tate, Johnson Controls Lowell Ungar, ACEEE
CLEAN TAX CUTS FOR COMMERCIAL REAL ESTATE © ACEEE
24
Appendix B. IRS Data on Partnerships and Their Taxes Table B1. Effective tax rates for partnerships
CLEAN TAX CUTS FOR COMMERCIAL REAL ESTATE © ACEEE
25
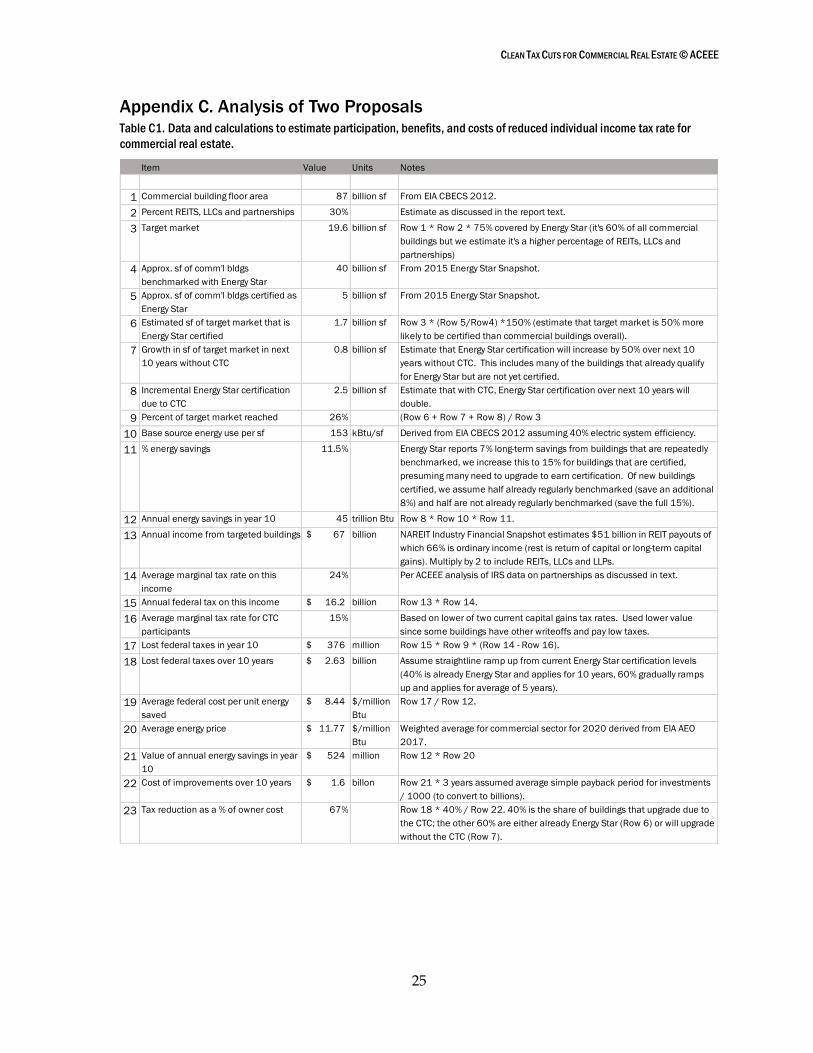
Appendix C. Analysis of Two Proposals Table C1. Data and calculations to estimate participation, benefits, and costs of reduced individual income tax rate for
commercial real estate.
Item Value Units Notes
1 Commercial building floor area 87 billion sf From EIA CBECS 2012.
2 Percent REITS, LLCs and partnerships 30% Estimate as discussed in the report text.
3 Target market 19.6 billion sf Row 1 * Row 2 * 75% covered by Energy Star (it's 60% of all commercial
buildings but we estimate it's a higher percentage of REITs, LLCs and
partnerships)
4 Approx. sf of comm'l bldgs
benchmarked with Energy Star
40 billion sf From 2015 Energy Star Snapshot.
5 Approx. sf of comm'l bldgs certified as
Energy Star
5 billion sf From 2015 Energy Star Snapshot.
6 Estimated sf of target market that is
Energy Star certified
1.7 billion sf Row 3 * (Row 5/Row4) *150% (estimate that target market is 50% more
likely to be certified than commercial buildings overall).
7 Growth in sf of target market in next
10 years without CTC
0.8 billion sf Estimate that Energy Star certification will increase by 50% over next 10
years without CTC. This includes many of the buildings that already qualify
for Energy Star but are not yet certified.
8 Incremental Energy Star certification
due to CTC
2.5 billion sf Estimate that with CTC, Energy Star certification over next 10 years will
double.
9 Percent of target market reached 26% (Row 6 + Row 7 + Row 8) / Row 3
10 Base source energy use per sf 153 kBtu/sf Derived from EIA CBECS 2012 assuming 40% electric system efficiency.
11 % energy savings 11.5% Energy Star reports 7% long-term savings from buildings that are repeatedly
benchmarked, we increase this to 15% for buildings that are certified,
presuming many need to upgrade to earn certification. Of new buildings
certified, we assume half already regularly benchmarked (save an additional
8%) and half are not already regularly benchmarked (save the full 15%).
12 Annual energy savings in year 10 45 trillion Btu Row 8 * Row 10 * Row 11.
13 Annual income from targeted buildings 67$ billion NAREIT Industry Financial Snapshot estimates $51 billion in REIT payouts of
which 66% is ordinary income (rest is return of capital or long-term capital
gains). Multiply by 2 to include REITs, LLCs and LLPs.
14 Average marginal tax rate on this
income
24% Per ACEEE analysis of IRS data on partnerships as discussed in text.
15 Annual federal tax on this income 16.2$ billion Row 13 * Row 14.
16 Average marginal tax rate for CTC
participants
15% Based on lower of two current capital gains tax rates. Used lower value
since some buildings have other writeoffs and pay low taxes.
17 Lost federal taxes in year 10 376$ million Row 15 * Row 9 * (Row 14 - Row 16).
18 Lost federal taxes over 10 years 2.63$ billion Assume straightline ramp up from current Energy Star certification levels
(40% is already Energy Star and applies for 10 years, 60% gradually ramps
up and applies for average of 5 years).
19 Average federal cost per unit energy
saved
8.44$ $/million
Btu
Row 17 / Row 12.
20 Average energy price 11.77$ $/million
Btu
Weighted average for commercial sector for 2020 derived from EIA AEO
2017.
21 Value of annual energy savings in year
10
524$ million Row 12 * Row 20
22 Cost of improvements over 10 years 1.6$ billon Row 21 * 3 years assumed average simple payback period for investments
/ 1000 (to convert to billions).
23 Tax reduction as a % of owner cost 67% Row 18 * 40% / Row 22. 40% is the share of buildings that upgrade due to
the CTC; the other 60% are either already Energy Star (Row 6) or will upgrade
without the CTC (Row 7).

CLEAN TAX CUTS FOR COMMERCIAL REAL ESTATE © ACEEE
26
Table C2. Data and calculations to estimate participation, benefits, and costs of immediate expensing for commercial
buildings.
Item Value Units Notes
1 Commercial building floor area 87 billion sf From EIA CBECS 2012.
2 Approx. sf of comm'l bldgs
benchmarked with Energy Star
40 billion sf From 2015 Energy Star Snapshot.
3 Approx. sf of comm'l bldgs certified as
Energy Star
5 billion sf From 2015 Energy Star Snapshot.
4 Growth in sf of target market in next
10 years without CTC
2.5 billion sf Estimate that Energy Star certification will increase 50% over next 10 years
without CTC.
5 Incremental sf upgraded due to
accelerated depreciation
1.25 billion sf Estimamte that with accelerated depreciation, 2.5 billion sf of buildings will
be upgraded (i.e., 25% of the sf now Energyy Star certified).
6 Percent of target market reached 1% Row 5 / Row 3.
7 Base source energy use per sf 153 kBtu/sf Derived from EIA CBECS 2012 assuming 40% electric system efficiency.
8 % energy savings 12% On average get a little more than minimum threshold
9 Incremental annual energy savings in
year 10
23 trillion Btu Row 5 * Row 7 * Row 8.
10 Average energy price 11.77$ $/million
Btu
Weighted average for commercial sector for 2020 derived from EIA AEO
2017.
11 Value of energy savings in year 10 270$ million Row 9 * Row 10
12 Cost of improvements 810$ million Row 11 * Estimated 3 year average simple payback
13 Average amount of increased
depreciation due to immediate
expensing compared to current law
61% From data underlying table 2; weight current depreciation at 67% 39 years
and 33% 15 years.
14 Average effective tax rate 20% From Dept. of the Treasury 2016. For this calculation we should use the
average marginal tax rate, but there is a lack of data on marginal tax rate so
we use the average.
15 Cost to Treasury over 10 years 99$ million Row 12 * Row 13 * Row 14
16 Tax reduction as a % of owner cost 12% Row 15 / Row 12

CLEAN TAX CUTS FOR COMMERCIAL REAL ESTATE © ACEEE
27
Appendix D. Other Work on Clean Tax Cuts
This work on commercial real estate is one of seven clean-tax-cut topic areas ACEEE is investigating under the auspices of the Grace Richardson Foundation. The other topics are:
• Green bonds, facilitated by the Sabin Center for Climate Change Law, Columbia Law School and Energy and Environment Program, School of International and Public Affairs, Columbia University
• Agriculture, forestry and other land use, facilitated by The Nature Conservancy, Rodale Institute, and Climate Advisers
• Transportation, facilitated by the R Street Institute
• Oil and gas, facilitated by One Step In Foundation and the Getches-Wilkinson Center for Natural Resources, Energy, and the Environment, University of Colorado Law School, Boulder
• Utilities and power, facilitated by the American Renewable Energy Institute (AREI)
• Clean technology, facilitated by LightWorks, Center for Negative Carbon Emissions, Arizona State University
Further information on all these topics can be found at: www.cleantaxcuts.org.