clear exam review
TRANSCRIPT
A Journal
CLEARExam Review
Volume XXVI, Number 1Summer 2016

CLEAR Exam Review is a journal, published twice a year, reviewing issues affecting testing and credentialing. CER is published by the Council on Licensure, Enforcement, and Regulation, 403 Marquis Ave., Suite 200, Lexington, KY 40502.
Design and composition of this journal have been underwritten by Prometric, which specializes in the design, development, and full-service operation of high-quality licensing, certification and other adult examination programs.
Subscriptions to CER are sent free of charge to all CLEAR members and are available for $30 per year to others. Contact CLEAR at (859) 269-1289 or [email protected] for membership and subscription information.
Advertisements and Classified (e.g., position vacancies) for CER may be reserved by contacting CLEAR at the address or phone number noted above. Ads are limited in size to 1/4 or 1/2 page, and cost $100 or $200, respectively, per issue.
Editorial BoardSteven NettlesRetired, Applied Measurement Professionals, Inc.
Jim Zukowski360training
CoeditorElizabeth Witt, Ph.D.Witt Measurement ConsultingLaingsburg, [email protected]
CoeditorSandra Greenberg, Ph.D.Professional Examination ServiceNew York, [email protected]
CLEAR Exam Review
Contents
FROM THE EDITORS ................................................................ 1Sandra Greenberg, Ph.D.
Elizabeth Witt, Ph.D.
COLUMNS
Abstracts and Updates ......................................................... 3George T. Gray, Ed.D.
Legal Beat ............................................................................. 9Dale J. Atkinson, Esq.
Technology in Testing ....................................................... 11Brian D. Bontempo, Ph.D.
ARTICLES
A Study of Potential Methods to Increase Response Rates on Task Inventory Surveys ....................... 15Adam E. Wyse, Ph.D., Carol Eckerly, Ph.D., Ben Babcock, Ph.D.,
and Dan Anderson, M.S.
Evaluating Item-Banking Systems: What to Consider and Why ............................................... 23Adrienne W. Cadle, Ph.D.
Options for Establishing the Passing Score on a New Test Form for Small Volume Programs ............. 28Andrew C. Dwyer, Ph.D.
VOLUME XXVI, NUMBER 1 SUMMER 2016
Copyright ©2016 Council on Licensure, Enforcement, and Regulation. All rights reserved. ISSN 1076-8025
From the Editors
We are pleased to present the Summer 2016 issue of the CLEAR Exam Review, volume XXVI, number 1. This issue includes three regular columns and three articles, covering an assortment of topics and presenting information we expect many will find useful.
In Abstracts and Updates, George Gray summarizes recent research related to Angoff standard setting, the meaning and use of coefficient alpha as a measure of reliability, and computer based testing (CBT). CBT issues addressed include alignment with content specifications, item position effects, and response time as a flag for advance knowledge of test content. Dr. Gray goes on to describe recent publications in health care assessment and certification. The column concludes with summaries of articles related to the consistency of the pass/fail decision of a credentialing examination and establishing the equivalence of cut scores across exam forms.
The Legal Beat column describes a lawsuit initiated by a candidate who felt he was given insufficient time to complete an examination and sued for “breach of contract, discrimination, failure to accommodate, and retaliation . . . .” The court ruled in favor of the testing organization. The case not only demonstrates the court’s understanding that candidates who expect testing accommodations must clearly request them in advance but also illustrates an inherent hazard of testing related to policies and procedures around the granting of accommodations. When the stakes of testing are high, a failing candidate may resort to suing the testing organization even when the case is apparently without merit. Testing organizations that develop and implement strong, standardized policies and procedures are much more likely to prevail if sued.
In Technology in Testing, Brian Bontempo returns with the third in a series of articles on data visualization. This issue introduces readers to the concept and use of digital dashboards. Dr. Bontempo describes how these under-utilized tools can be of value to credentialing organizations for monitoring and evaluating their programs using multiple sources of data.
A solid job analysis, or practice analysis, is the foundation of validity evidence in professional licensure and certification programs. A common problem in conducting a job analysis survey is the difficulty of inspiring a response rate high enough to provide dependable results. Researchers from the American Registry of Radiologic Technologists and the University of Wisconsin investigated various methods designed to improve response rates on task analysis surveys. Their findings are presented in this issue and include a discussion of age and gender differences.
1CLEAR EXAM REVIEW SUMMER 2016 n

2 CLEAR EXAM REVIEW n SUMMER 2016
Next is an informational paper that will be of interest to organizations with a need to improve the development and management of their test items. Developing a propriety item-banking system can be expensive, and making a selection from existing systems can be a daunting task. Whether establishing a new item-banking system or upgrading to a system that better meets a testing program’s current needs, there are many issues to be addressed and questions that should be asked up front to ensure that the final product will be well suited to address the program’s unique needs. Adrienne Cadle provides a discussion of issues and a checklist of questions that will be instructive to agencies considering adopting a new item-banking system. (Our thanks to members of CLEAR’s Examination Resources and Advisory Committee [ERAC] for their feedback on an early draft of this paper.)
Finally, we include an article that will be of special interest to small volume certification programs seeking NCCA accreditation. The recently updated NCCA Standards require programs to establish the equivalence of different test forms in content and difficulty, specifically mentioning statistical equating procedures. Andrew Dwyer discusses options for small programs to demonstrate form equivalency when seeking accreditation. Dr. Dwyer is also the author of the final article reviewed in Abstracts and Updates, which addresses this topic from a more academic perspective.
May this issue provide you with food for thought and solutions to your testing issues. Read on, and enjoy…
National Commission for Certifying Agencies. (2014). Standards for the Accreditation of Certification Programs. Retrieved from http://www.credentialingexcellence.org/p/cm/ld/fid=66.

This column contains a variety of examination-related material, primarily focused on certification testing, accreditation of certification programs, and research related to applied measurement concepts. Of particular interest are research on computer–based testing, Angoff passing score methods, and a group of papers related to the Cronbach’s alpha reliability coefficient.
Angoff Passing Score Studies
Margolis, M.J., Mee, J., Clauser, B.E., Winward, M., and Clauser, J.C. (2016). Effect of content knowledge on Angoff-style standard setting judgments. Educational Measurement: Issues and Practice 35(1) 29-37.
This article reports on two studies conducted by the National Board of Medical Examiners. The authors state that for Angoff passing score studies, “one important issue related to judge selection is whether the extent of judges’ content knowledge impacts their perceptions of the probability that a minimally proficient examinee will answer the item correctly” (p. 29). This topic has not been well researched. In the first study, conducted using USMLE (US Medical Licensure Examination) data, judges answered the questions themselves and then rated them one day later. Sixty-seven percent of the items were answered correctly by the content experts. The study found an effect size related to content knowledge and Angoff rating. Thus, the more that the content expert knew, the more knowledge was assumed on the part of the minimally knowledgeable candidate. The second study considered the effect of providing the answer key to the test items and compared judgments for those items where judges were provided the answer key and those for which the answer was not provided. This study “found no evidence that providing the answer key impacts the mean or the standard deviation of the resulting judgments” (p. 35).
Harrison, G.M. (2015). Non-numeric intrajudge consistency feedback in an Angoff procedure. Journal of Educational Measurement 52(4), 399-418.
Harrison emphasizes that feedback to judges in an Angoff study should include both information about variance across judges for items and the individual judge’s consistency over the set of items. While judges may have differing levels of performance in mind regarding the level of ability required for the minimally competent/knowledgeable candidate, each judge should be consistent with respect to the relationship of the item ratings and the difficulty level of the items (intrajudge consistency). Difficult items should receive lower ratings than easier items on a consistent basis. The author reviews approaches to providing feedback to judges and focuses the research on non-numerical data, as numerical feedback may target ratings to a specific level of item difficulty. Judges in the experimental condition of the study were given individual recommendations to reconsider items for which their ratings had been internally inconsistent. Harrison also
Abstracts and UpdatesGEORGE T. GRAY, Ed.D.testing and measurement consultant
3CLEAR EXAM REVIEW SUMMER 2016 n
looked at “the degree of confidence that can be placed in a panel’s recommended cut score when large variability exists among judges in their Angoff ratings” (p. 403). Reported results “showed that without the feedback, cut score variability worsened; with the feedback, idiosyncratic item-level variability improved. These results suggest that non-numeric intrajudge consistency feedback achieves its intended effect and potentially improves interjudge consistency” (p. 399).
Reliability Concepts: What is Reliability of Scores?
As there are four citations below that discuss reliability as measured by Cronbach’s alpha (1951), a statistic that was the subject of a publication 65 years ago, a little historical background might be in order. The reliability statistic KR20 was introduced in a publication by Kuder and Richardson in 1937. It is applicable only to tests consisting of items that are scored one/zero, but in that case the results are the same as coefficient alpha. In 1978, Cronbach reflected on coefficient alpha: “As a research assistant in 1939 I was taught to use a ‘Kuder-Richardson Formula 20’ developed by experts who worked in the office next door. None of us realized it, but KR20 is the ancient intraclass correlation, specialized to fit items scored 1/0 (pass/fail). The KR20 paper made heroic assumptions. It was an easy and intriguing exercise to derive the formula from variant assumptions, and that exercise became, as someone said, the second favorite indoor sport of psychometricians.” So let us move on to the literature of 2015–2016. What’s happening now?
Davenport, E.C., Davison, M.L., Liou, P., and Love, Q.U. (2015). Reliability, dimensionality and internal consistency as defined by Cronbach: Distinct albeit related concepts. Educational Measurement: Issues and Practice 34(4) 4-9.
Sitjsma, K. (2015). Delimiting coefficient α from internal consistency and unidimensionality. Educational Measurement: Issues and Practice 34(4) 10-13.
Green, S.B. and Yang, Y. (2015). Evaluation of dimensionality in the assessment of internal consistency reliability: Coefficient alpha and omega coefficients. Educational Measurement: Issues and Practice 34(4) 14-20.
Davenport, E.C., Davison, M.L., Liou, P., and Love, Q.U. (2016). Easier said than done: Rejoinder on Sijtsma and on Green and Yang. Educational Measurement: Issues and Practice 35(1) 6-10.
This set of papers is based on the distinctions among three areas: the coefficient alpha reliability coefficient (Cronbach, 1951), multidimensionality, and the concept of internal consistency. All authors agree that these concepts are often
confused, and even in the assembly of the resources for this column, a reference was noted in which coefficient alpha was represented as a measure of internal consistency. An original article is presented by Davenport, Davison, Liou, and Love, followed by two responses. In the next issue of Educational Measurement: Issues and Practice, the original authors reply to invited responses.
Davenport, Davison, Liou, and Love (DDL&L) start with Cronbach’s definition of reliability as “the accuracy or dependability of measurement. Homogeneity or internal consistency is the degree to which items measure the same thing. For a test to be interpretable, according to Cronbach, the items need to have a large first principal factor saturation, but the common factor structure accounting for the covariances need not be unidimensional” (p. 4). DDL&L ask whether high levels of Cronbach’s alpha require high levels of internal consistency or unidimensionality (p. 4). In the discussion section of the article, they conclude that alpha does measure reliability. “However, alpha is not a measure of internal consistency because α also depends on test length…α is also not a measure of dimensionality…α is a function of both internal consistency and first component saturation, but it is a pure measure of neither” (p. 8). DDL&L conclude by stating that “reliability is a necessary but insufficient attribute for a test…Internal consistency describes items, not the test, because internal consistency does not reflect the test’s length. Internal consistency reliability only requires positively correlated items, although low item correlations will necessitate more items. Even multidimensional items can have moderately high levels of internal consistency, and tests composed of multidimensional items can be both reliable and interpretable, given enough items and/or the test assesses a higher order construct” (p. 9).
Sijtsma states, “I argue that coefficient α is a lower bound to reliability and that concepts of internal consistency and unidimensionality, however defined, belong to the realm of validity, viz. the issue of what the test measures. Internal consistency and unidimensionality may play a role in the construction of tests when the theory of the attribute for which the test is constructed implies that the items be internally consistent or unidimensional” (p. 10). Sijtsma recommends treating α as a lower bound reliability not related to internal consistency or unidimensionality. “If a theory of the attribute is available and implies that items measuring the attribute have high internal consistency or are unidimensional, then use these requirements to select items for the test; else, use other requirements the theory implies…If a theory is unavailable, by studying the items
4 CLEAR EXAM REVIEW n SUMMER 2016
selected or rejected based on high internal consistency or unidimensionality, the researcher may learn about the attribute and its measurement” (p. 13). To pursue this goal, he recommends test construction by methods such as factor analysis and item response theory (p. 13).
Green and Yang agree with DDL&L’s distinction between reliability, internal consistency, and dimensionality. They state, “Although we agree with the major points made by DDLL, we choose to view coefficient alpha within a modeling framework. Our preference is to model the relationships among items and choose an internal consistency estimate of reliability that is consistent with the chosen model and the intended purpose of the measure” (p. 14). Their examples compute “reliability coefficients based on parameter estimates from a factor analytic model” (p. 14). The conclusion of the article proposes, “Coefficient alpha can provide a relatively accurate assessment of reliability under some conditions, but not under others. Regardless, researchers may misinterpret it as an index of internal consistency or homogeneity. The various omega coefficients provide more detailed information about the reliability of measures and are less likely to be misinterpreted because of the transparent relationship between these coefficients and the factor model that they are based on” (p. 19). Finally, limitations of omega coefficients are discussed.
In the next issue of Educational Measurement: Issues and Practice, DDL&L offer a rejoinder to the comments on their original paper. There is consensus among the authors concerning misinterpretations of coefficient alpha, but DDL&L remind us that the context of their article was based on the extreme popularity of α and its frequent misinterpretations. They then respond to other perspectives offered by Sijtsma and Green and Yang.
Computer-Based Testing Research
Wise, S.L., Kingsbury, G.G., and Webb, N.L. (2015). Evaluating content alignment in computerized adaptive testing. Educational Measurement: Issues and Practice 34(4) 41-48.
This article considers the two major constraints on computer adaptive testing: meeting content requirements and measurement precision of candidate ability. As the online selection of items for each candidate has to meet the specified content distribution, there may be an issue with the availability of items that are appropriate for the candidate’s level of ability unless the item bank is very large. The authors also consider an elementary school student who is performing below grade level. In order to measure what the student can do, the test would have to include content
from the lower grade level. The authors offer a model for alignment of information on an adaptive test: looking at the item pool, the item selection algorithm, and the candidate test event records. They also refer to the detection of specific problems that may exist: alignment of the test plan and content domain, accuracy of the item meta-tags, and the number of items in the pool, along with their range of difficulty (p. 45).
Skaggs, G. (2015). Determining item position effects in a computer- based test. International Journal of Quantitative Research in Education 3(1/2) 94-108.
Anyone who has been involved in selecting an anchor set of items for a classical equating will remember one of the rules of thumb: be careful about varying the position of the items from one form to another because of context effects. The difficulty of the items may be affected by their position on the test—their context within the test. Skaggs states that “context effects due to item position have been a concern for test developers for many years. Prior research on these effects has shown mixed results for print-based test forms with a fixed length and fixed item order, but little research has been conducted to date on fixed-length tests administered by computer” (p. 105). In contrast to paper-and-pencil traditions, there is often a preference for presenting the items in random order on computer-based tests for security reasons. Candidates are less likely to pass on specific information concerning “the third item,” and it may also be less obvious how many test forms are online. Obviously there is a disconnect between the concern for maintaining item position and an interest in displaying the items in random order. This is where research reported in the Skaggs publication fills an important need.
The study utilized data from an accounting test that consisted of two different forms of 80 multiple-choice items with a link of 29 common anchor items. A total of 841 examinee records were available for one form and 928 records for the other. Two studies were performed to investigate two types of position effects: “One was a fixed effect due to the position of the item that affects all items in the same way. Another was a random, or interaction, effect in which items could behave differently to a specific position” (p. 98). As the studies were focused on varying positions of 80 items, a large number of statistics was available, and some results indicating a context effect (e.g., item performance differences outside a confidence interval) could be expected by chance. Only a small number of these differences were obtained. The major conclusion of the study was that “little evidence was found in this study for item position effects, and so this method would not be
5CLEAR EXAM REVIEW SUMMER 2016 n

expected to undermine certification decisions” (p. 106). Skaggs does recommend caution, however, and suggests that “each testing program conduct an item position investigation for items” (p. 94) before committing to presentation of items in random order.
Qian, H., Staniewska, D., Reckase, M., and Woo, A. (2016). Using response time to detect item preknowledge in computer-based licensure examinations. Educational Measurement: Issues and Practice 35(1) 38-47.
Test candidates should have knowledge of content going into an examination administration, but they should not have knowledge of specific items on the examination. How is preknowledge of items to be detected? The authors note that person misfit has been used in past research—based on less able candidates answering more difficult items correctly than their overall ability would imply. The authors also state, “However, this method usually has a low detection rate and a high false alarm rate and cannot be used in operational testing” (p. 38). For computer-based testing, they argue for the study of item response times, based on the assumption that a candidate who has seen the item previously and knows the answer will answer the item quickly and move on to other items. Two studies were conducted: one featuring a non-adaptive computer-based test for the financial industry and the second an adaptive test for the health professions. For the linear test, the authors found that two of 111 items were potentially exposed and two candidates of over a thousand “showed some indications of preknowledge on multiple items” (p. 38). For the second study, featuring an adaptive licensure test, they found no aberrant findings. The authors recommend withdrawing suspect items from administration as quickly as possible but performing careful follow-up investigation before acting on candidate findings.
Health-Related Certification and Assessments
Boyle, D.K., Cramer, E., Potter, C., and Staggs, V.S. (2015). Longitudinal association of registered nurse national nursing specialty certification and patient falls in acute care hospitals. Nursing Research 64(4) 291-299.
This study looked at the potential correlation between RN national nursing specialty certification and a specific clinical measure—number of patient falls in acute care hospitals. As the researchers indicate, “Although national nursing specialty certification rates generally have increased over time whereas inpatient fall rates generally have decreased over time, researchers have not examined whether these national level trends are simply coincidence or reflect an actual association between increasing national nursing specialty certification rates and decreasing fall rates. Using longitudinal data with standardized variable definitions
across sites from the National Database of Nursing Quality Indicators (NDNQI), we explored the issue by systematically examining the relationship over time between changes in RN national nursing specialty certification status and changes in total fall rates at the patient care unit level” (p. 292).
After the data analysis, the authors conclude, “We found a small, statistically inverse association between unit level changes in RN national nursing specialty certification rates and unit level changes in total fall rates during 2004–2010” (p. 295). Although the design of the study did not allow inference of a causal relationship, the authors conclude that results “may suggest that increases in RN national nursing specialty certification rates are associated with improvements in total fall rates in acute care settings” (p. 296).
Ghaderi, I., Manji, F., Park, Y.S., Juul, D., Ott, M., Haris, I., and Farrell, T.M. (2015). Technical skills assessment toolbox: A review using the unitary framework of validity. Annals of Surgery 261(2), 251-262.
As the authors state, “The purpose of this study was to create a technical skills assessment toolbox for 35 basic and advanced skills/procedures that comprise the American College of Surgeons (ACS)/Association of Program Directors in Surgery (APDS) surgical skills curriculum and to provide a critical appraisal of the tools, using contemporary framework of validity” (p. 251). A literature search was conducted to identify relevant assessments. Twenty-three assessment tools were identified, some covering more than one skill. Of the 35 modules for which assessment tools were sought, “. . . 30 modules had at least 1 assessment tool, with some common surgical procedures being addressed by several tools. Five modules had none” (p. 251).
The results of the match of the assessment tools to the unitary framework of validity were disappointing. “Only 3 studies used Messick’s framework to design their validity studies. The remaining studies used an outdated framework on the basis of ‘types of validity.’ When analyzed using the contemporary framework, few of these studies demonstrated validity for content, internal structure, and relationship to other variables.” The authors concluded that few studies “. . . have used the contemporary unitary concept of validity for development of their assessment tools. As we progress toward competency-based training, future studies should provide evidence for various sources of validity using the contemporary framework” (p. 251).
Jackson, J.L., Kay, C., and Frank, M. (2015). The validity and reliability of attending evaluations of medicine residents. SAGE Open Medicine. DOI: 10:1177/2050312115589648.
6 CLEAR EXAM REVIEW n SUMMER 2016
This article investigates monthly evaluations of residents by attending physicians, the most common method of evaluating resident performance. The authors conducted a retrospective study of evaluations of over two hundred residents by over three hundred attending physicians at a midwestern medical college. Six competencies were designated in the evaluation forms. The results of the analysis suggested that “there was poor construct validity with modest inter-rater reliability and evidence that attendings were rating residents on a single factor rather than the six competencies intended to be measured. There was poor predictive validity as attending ratings correlated weakly with performance on the in-service training examination or American Board of Internal Medicine certification exam.” They state, “It may be time to move beyond evaluations that rely on global, end-of-rotation appraisals.”
Brown, K.A., Fenn, J.P., Freeman, V.S., Fisher, P.B., Genzen, J.R., Goodyear, N., Houston, M.L., O’Brien, M.E., and Tanabe, P.A. (2015). Impact of time lapse on ASCP Board of Certification Medical Laboratory Scientist (MLS) and Medical Laboratory Technician (MLT) Examination Scores. Lab Medicine 46(3), e53-e58.
Conventional wisdom suggests that certification or licensure examinations should be taken soon after training is concluded to assure the best performance. This research examined the impact of delaying the examination after completion of an educational program on the American Society of Clinical Pathology’s MLS and MLT examinations. The date after completion of training was broken up into three-month intervals. The outcome variables of interest were pass rates on the examination and scaled scores. Sample sizes included approximately 6,000 MLS and 4,000 MLT candidates. The authors indicate, “We observed significant decreases in mean (SD) scaled scores and pass rates after the first quarter in MLS and MLT examinations for applicants who delayed taking their examination until the second, third, and fourth quarter after completing their training programs” (p. e53). They recommend that applicants take their examinations soon after completion of training.
Gray, B.H., Jaff, M.R., Slovut, D.P., Bacharach, J.M., Carman, T., Creager, M., Halperin, J., von Mering, G., and Kinlay, S. (2015). The first 10 years of the American Board of Vascular Medicine. Vascular Medicine 20(1) 69-73.
This article provides a history of a medical specialty board examination originating from an initiative undertaken by the Society for Vascular Medicine, beginning with the establishment of the ABVM, setting eligibility requirements, developing a test outline, writing items, developing the
first test form, and analyzing statistics from the first administration. Two examinations have been offered: one covering vascular medicine and the other endovascular medicine. “To date, there have been 651 and 820 successful diplomates of the general and endovascular tests, respectively” (p. 69). The article concludes with plans for the future: “The specialty recognition of vascular and endovascular medicine through the ABMS (American Board of Medical Specialties) requires a primary board sponsor (i.e., the ABIM–American Board of Internal Medicine). It is the desire of the ABVM and the Society for Vascular Medicine to continue our pursuit of this status. . . . Hopefully, as the number of ABVM diplomates grows our petition for specialty recognition will be accepted” (p. 71).
Hulla, J.E., Kinter, L.B., and Kelman, B. (2015). A standard of knowledge for the professional practice of toxicology. Environmental Health Perspectives 123, 743-748; http://dx.doi.org/10.1289/chp.1408643
This article reports on the development of “a current Standard of Knowledge in general toxicology compiled from the experience and opinions of 889 practicing professional toxicologists” (p. 743). Consistent with the standards of the National Commission on Certifying Agencies (NCCA), the American Board of Toxicology (ABT) assigned a committee to develop a survey of “specific knowledge domains and, within each domain, specific knowledge elements essential to effective employment/practice as a professional toxicologist.” Four categories were also defined to rank the importance of knowledge from most important to unimportant. These categories were complemented by characterization of the knowledge from “working knowledge” (most important) to “not needed” (unimportant).
The initial survey document was developed from tables of contents of texts in toxicology and refined by the contributions of the committee members. The survey was administered in two phases—an initial small sample pilot phase and a second phase of distribution to the entire ABT membership. Responses were received from 34% of 2,606 ABT diplomates. The findings of the survey related to the importance to the practice of toxicology are summarized in the article.
Measuring Candidate Performance
Wyse, A.E., and Babcock, B. (2016). Does maximizing information at the cut score always maximize classification accuracy and consistency? Journal of Educational Measurement 53(1), 23-44.
7CLEAR EXAM REVIEW SUMMER 2016 n
When item response theory methods are used, estimation of the ability of examinees is dependent upon the availability of items having information that matches to candidate ability. For example, on a computer adaptive test, to determine the level of ability of a high ability candidate, there must be some difficult items for the candidate to take. In contrast, for certification and licensure testing, the focus is on whether the candidate should be on the passing side of the standard or the failing standard; therefore, test construction is often focused on providing the most information in the area of item difficulty represented by the cut score. Wyse and Babcock consider the desirability of this practice for fixed-length classification tests. The authors use “simulated examples to illustrate that one can obtain higher classification and consistency by designing tests that have maximum information at locations other than the cut score. We show that the location where one should maximize the test information is dependent on the length of the test, the mean of the ability distribution in comparison to the cut score, and to a lesser degree, whether . . . one wants to optimize classification accuracy or consistency” (p. 23).
Dwyer, A.C. (2016). Maintaining equivalent cut scores for small sample test forms. Journal of Educational Measurement 53(1), 3-22.
Equating methods are able to maintain a standard of a constant level of ability to pass different forms of an examination; however, some measurement error is always present. Unfortunately, smaller sample sizes are associated with larger measurement error. Some methodologies for
calculating cut scores may be more effective than others where small sample sizes are involved. The author examined three methods: “(1) common item equating, (2) resetting the standard, and (3) rescaling the standard. Rescaling the standard (i.e., applying common-item equating methodology to standard setting ratings to account for systematic differences between standard setting panels) has received almost no attention in the literature” (p. 3). Data from a large national certification examination was used for the study. The author concludes that “results were inconclusive concerning the relative effectiveness of resetting and rescaling the standard. Small sample equating, however, consistently produced new form cut scores that were less biased and less prone to random error than new form scores based on resetting or rescaling the standard” (p.3).
References
Cronbach, L.J. (1951). Coefficient alpha and the internal structure of tests. Psychometrika 16(3), 297-334.
Cronbach, L.J. (1978) Citation Classics (13) http://garfield.library.upenn.edu/classics.html.
Kuder, G.F., and Richardson, M.W. (1937). The theory of the estimation of test reliability. Psychometrika 2(3), 151-160.
Messick, S. (1995). Validity of psychological assessment: Validation of inferences from persons’ responses and performances as scientific inquiry into score meaning. American Psychologist 50 (9), 741-749.
8 CLEAR EXAM REVIEW n SUMMER 2016

The administration of examinations that are subject to various state and federal disabilities laws occurs throughout multiple junctures of one’s academic and professional careers. Application for state or provincial licensure in a regulated profession may include, as one criterion, passage of an entry-level examination. Many professions use a uniform entry-level examination administered on a regular basis throughout the year. Such examinations are validated using industry standards to be legally defensible with scores accepted by all jurisdictions for purposes of entry-level competence.
Prior to a uniform entry-level competence examination and while enrolled in an academic program, students are tested at numerous times throughout the completion of the curriculum. Unsuccessful examination performance may prohibit graduation from the academic program. Failure to matriculate through the program may be a bar to licensure in the chosen field. Duly enrolled students may be entitled to accommodations under applicable state and federal law, specifically the Americans with Disabilities Act, as amended. In some professions, nationally administered exams are given to students as they progress through the academic program. Consider the following.
A student at George Washington University was dismissed from the medical school based upon a violation of the school’s Honor Code related to the administration of the Step 1 Shelf Examination, also referred to as the Board Examination. After completing his first two years of medical school, the student postponed the September 2012 Step 1 Shelf Exam because he was “exhausted, depressed, and having difficulty studying for the exam.” He was ineligible to begin his clinical rotations until he completed the exam.
The student contacted and met with the associate dean regarding his issues. Immediately thereafter, a university professor emailed the student regarding poor performance on other exams within the curriculum and recommended a professional counselor who specialized in helping students with test-taking anxiety. Feeling like he had no time, the student did not contact the counselor. On December 14, 2012, the student sat for the Step 1 Surgery Shelf Examination, a test published by the National Board of Medical Examiners (NBME). Prior to its administration, the proctor read aloud to examinees the administration instructions. They included the facts that credit would be given only for answers properly recorded on the answer sheet and that time would not be extended beyond the close of the examination for transferring answers to the answer sheet. Approximately thirty minutes before the time period was to expire, examinees were again given these instructions.
When the exam period was called, the student continued to fill in answers on his bubble sheet. Even when told by the proctor to stop, the student continued to fill in his answers and continued to do so when the proctor physically attempted to remove the sheet from his desk. The student filled in answers on his bubble sheet for between ninety seconds and two minutes after the expiration of the test.
Legal BeatTime’s Up, Pencils Down
DALE J. ATKINSON, Esq.Dale Atkinson is a partner in the law firm of Atkinson & Atkinson. http://www.lawyers.com/atkinson&atkinson/
9CLEAR EXAM REVIEW SUMMER 2016 n

The examination incident was reported by the proctor to the dean and other relevant faculty, explaining that the student continued to transfer answers after time expired in spite of being told three times to put his pencil down. The proctor also reported that the student “became aggressive” when asked to stop filling in answers and covered his test with his arms and continued filling in the bubble answers. Finally, the proctor reported that the student approached her after the exam and apologized, admitting that his behavior was inappropriate.
The incident report generated an investigation by the program that included written responses and interviews. Following the internal procedures, the Subcommittee on Professional Comportment found a violation of the Honor Code by a preponderance of the evidence and recommended the student receive an “F” for the course and be dismissed from the program. Specifically, the Honor Code requires students to not “violate any other commonly understood principles of academic honesty.” In his defense, the student admitted his wrongdoing and “blatant disregard of the [proctor’s] authority.” The dismissal recommendation was upheld after a hearing by the Medical Student Evaluation Committee. On May 6, 2013, the dean of the Medical School affirmed the ruling.
On May 30, 2014, the student filed a lawsuit against the school arguing breach of contract, discrimination, failure to accommodate, and retaliation in violation of the Rehabilitation Act of 1973 and the Americans with Disabilities Act (ADA). In response, the school filed motions for summary judgment on all counts. A motion for summary judgment argues that there are no issues of material fact in dispute and the court can rule on the case as a matter of law without the need for a trial.
The court recognized the contractual relationship between a student and school in assessing the school’s motion. It also noted that the court is “extremely” deferential to the school when reviewing academic dismissal cases citing previous judicial opinions that have concluded that professional comportment issues fall under the umbrella of deference to academic decisions, “particularly for medical students.” Further, the court reviewed the facts with much detail and concluded that the student admitted that the proceedings were fair, the conduct occurred, he acted in “blatant disregard of the authority…,” and he knew of the rules regarding the exam administration. Regardless, the student argued that the school breached its contract.
The court also found that, in spite of the arguments of the student, he did cheat. Pursuant to the court, the student chose to ignore the Honor Code, gained an unfair advantage over his
peers who adhered to the rules, and “stole time.” The court held that there was a rational basis for the actions of the school in imposing dismissal on the student and that his actions did amount to insubordination and were contrary to commonly understood principles of academic honesty.
Addressing the disabilities claims, the court reviewed the facts and found that the student never placed the school on notice of his alleged ADHD condition. The school also argued that the student was not disabled under the relevant Rehabilitation Act or ADA. Although notice of a disability can be either actual or constructive, the student never notified the school of his disability during the disciplinary proceedings nor alleged that his conduct was caused by his disability. His alleged condition was not referenced during the meeting with the dean, was not mentioned in his written personal statement to the committee, and was not referenced in his appeal statement submitted with assistance from counsel.
Additionally, the court held that the record establishes that the student never requested accommodations from the school. Thus, even if the evidence supported the existence of a disability, his lack of request for accommodations precludes allegations that accommodations were not granted. The court rejected arguments that the student was unaware of the accommodations available to him. Without being made aware of a disability and requested accommodations, the school was under no duty to engage in an interactive process to identify what accommodations were available.
Finally, the court held that the school did not discriminate against the student for exercising his rights to advocate for his rights. Because the law requires a causal link between the discrimination and the disability, such a claim must be precluded if the defendant is unaware of the disability. The court also noted that no evidence was presented by the student to link the decision making committee to any disability or even knowledge thereof. Thus, any retaliation claim was deficient and subject to judgment in favor of the school.
All told, the court found that the entire complaint was subject to judgment in favor of the school. Accordingly, the court awarded the school summary judgment.
This case presents an example of how examining organizations must have actual or constructive notice of a disability and the requested accommodations in order to be responsible for providing examination accommodation(s).
Chenari v. George Washington University, 2016 U.S. Dist. LEXIS 37333 (U.S. District Ct DC 2016)
10 CLEAR EXAM REVIEW n SUMMER 2016

Introduction
Having spent some time in previous articles discussing data visualization, we turn our attention with this issue of Technology in Testing to a special application of data visualization, digital dashboards. In this article, I’ll define the term digital dashboard, explore its purpose and application in testing, and identify some design considerations. My objective is to inspire licensure and certification professionals to consider using dashboards and to give them the basic knowledge needed to participate in the procurement, design, or implementation of dashboards for their organization.
Although many people understand the term digital dashboard, very few of them can actually define the term. After reviewing a handful of definitions, I put forth the following, “A digital dashboard is an electronic interface that provides a snapshot of multiple concurrent metrics conveyed visually.” In deconstructing this definition, the term snapshot may be somewhat confusing since many useful digital dashboards contain longitudinal information. In this instance, the term snapshot indicates that multiple metrics are conveyed at a common moment in time, generally speaking, the current moment.
The primary purpose of a digital dashboard is monitoring. Licensure and certification organizations may wish to use a digital dashboard to monitor the following:
• The psychometric soundness of their examination
• The financial status of their organization
• The extent to which educational programs are meeting requirements
• The involvement of volunteers or members
• The nature of disciplinary actions
Many dashboards also provide a form of algorithmic evaluation. In these, the status of an entity may be classified. For example, a test form might be flagged for low reliability or an educational program for a low passing rate. Although providing evaluative information is not necessary, it is often a very desirable aspect of a digital dashboard.
One may wonder what digital dashboards have to offer above and beyond other monitoring or evaluation tools. The advantage of using a digital dashboard is that multiple metrics can be monitored and evaluated simultaneously. Digital dashboards use data visualizations to efficiently bring together the outcomes of many analyses or the data from multiple measurements.
Technology in TestingDigital Dashboards 101
BRIAN D. BONTEMPO, Ph.D.principal consultant, Mountain Measurement, Inc.
11CLEAR EXAM REVIEW SUMMER 2016 n
Despite their obvious utility, currently, dashboards are not commonly found within licensure and certification organizations. In a certain sense, this is logical since the monitoring and evaluation activities in licensure and certification are less complex than other industries such as manufacturing where the number of sources of raw data can be staggering. In testing, the major software vendors provide some modest dashboards within certification management systems and item banks. In addition, some organizations have created internal dashboards within their business intelligence systems.
Monitoring and Evaluation
Since the primary use of a digital dashboard is typically monitoring and evaluation, it is important to know a little about these activities before proceeding. The word monitoring is often accompanied by the word evaluation. In essence, monitoring is the act of collecting and analyzing data for the purpose of evaluation.
Monitoring varies in the following ways. The number and types of people or machines that conduct monitoring activities vary. The frequency of monitoring activities varies. The sources of data vary along with the accuracy, precision, and completeness of each data source. And, the technology used for monitoring varies. Each of these variations greatly impacts the design of a digital dashboard.
Evaluation is quite complex, so complex that there are doctoral programs, conferences, associations, and journals dedicated to it. For the purpose of digital dashboards, it is important to note that in addition to the variables identified above, the way in which the data will be analyzed is important. For example, will certain variables be more important than others? Will there be performance thresholds associated with any of the variables? Are there any variables that relate to each other? In addition, it is imperative to know what decisions will be made using the data.
Both monitoring and evaluation can be evolving activities. At first, organizations or users are typically overwhelmed by their monitoring and evaluation data. At some point, they understand their data sources, analyses, and decision making processes well enough to effectively make on-the-spot decisions with their dashboards. Eventually, the decision making process may evolve into an algorithm. At this point, the organization may modify its dashboards to convert the human aspect of evaluation into an automated, algorithmically triggered action. This begets a new type of monitoring and dashboard. Thus, the evaluation process can be ever evolving.
Planning
It is easy for an organization to presume that technology will solve things. And many have suffered the consequence of inadequate planning when purchasing or developing technology. Digital dashboards are like other technology. Although is it easy to believe that they will solve many monitoring and evaluation problems, they will only succeed with proper planning.
There are two approaches that one can take when planning to construct a dashboard, inductive and deductive. An inductive approach seeks to bring together a cadre of available data sources in hopes that the dashboard user can inductively figure out how to use the information provided for monitoring and evaluation. The deductive approach is one where the evaluation decisions are identified, the method for making those decisions defined, and the data sources needed to make those decisions collected. Although the deductive approach may seem more logical, sane, and sound, it is often difficult to achieve in the real world.
Dashboard Design
Digital dashboards can be classified into two distinct categories, those that are customizable and those that are not. Customizable digital dashboards align nicely with ever evolving evaluation. Fixed digital dashboards work well in situations where many users will rely on the same dashboard to make decisions. Most testing dashboards will involve a limited number of users, so customizable dashboards are typically a recommended direction.
Dashboards are successful when they
• contain just the right amount of information (not too much or too little);
• use effective data visualizations to convey the information from each data source;
• bring attention to the data sources that are most important;
• help the user to interpret the information.
This list can be operationalized into three basic questions:
• What information should be provided?
• How should that information be provided?
• Where should we put that?
One of the keys to dashboard design is deciding what information to provide. And, like most things in life, there is a balance between too much of a good thing and not enough.
12 CLEAR EXAM REVIEW n SUMMER 2016

Despite this, there tends to be an extremely strong urge to cram as many sources of data as possible into each dashboard. This can result in information overload as well as an overly cluttered dashboard. One way to curb this urge is to use summary statistics. By reporting the mean, total, or rate, many pieces of data can be reduced to a single data point. In testing, the mean score, testing volume, and passing rate are common examples of summary statistics.
Once the information to be displayed is identified, the next step is determining how to display it. Readers are encouraged to visit the two previous Technology in Testing articles on data visualization for a primer on how to display data using visualizations (Bontempo, 2014). These articles also provide a good overview of the different types of commonly used data visualization. Given their ability to convey summary information and comparison points in a relatively small space, bullet graphs (Few, 2004) are one of the more effective types of data visualization for digital dashboards. In addition, box plots and sparklines¹ (Tufte, 2006) can be effective since they too allow multiple data sources to be compared quickly and easily. On the other hand, a good old table can be a great way of conveying exact values if that is needed and there is sufficient real estate on the dashboard for it.
Figure 1 contains a simple example dashboard of a series of bullet graphs, one for each examination sponsored by a licensure program. The passing rate for the current year is depicted by the bar graph. The dashed line is the passing rate from the prior year.
The grey bar is the average annual passing rate for the history of the program.
Given that the most common physical dashboards are found in cars, digital dashboards have taken to using automobile gauges as a form of data visualization. Besides being a little kitsch, this is discouraged since visual information is not easily comprehensible in circular format. Instead, a sparkline, bar graph, or line graph can display this information quickly, efficiently, and easily.
Once the data sources and their format are established, it is necessary to identify how to arrange the objects on the dashboard. Relative importance and logical meaning should guide this activity. Information that is always important should be placed on a dashboard in such a manner as to highlight its importance. This can be accomplished by placing it in the center of the dashboard or in the top left corner (for languages that read left to right). It may also behoove designers to use size as a way of bringing attention to certain aspects of a digital dashboard. Objects that have logical associations should be located near one another and, if possible, as a group. And if there is a logical order in which the objects should be interpreted, that order should be maintained either horizontally from left to right or vertically.
If a dashboard was created that provided solely quantitative information as a set of data visualizations arranged usefully, it might succeed in assisting the user with monitoring a licensure program. However, it would not have provided
FIGURE 1. Sample Dashboard with a series of bullet graphs depicting the passing rate for some examinations
Exam
Content Development
Program Design
Psychometrics
Test Administration
Scoring & Reporting
0% 5% 10% 15% 20% 25% 30% 35% 40% 45% 50% 55% 60% 65% 70% 75% 80% 85% 90% 95%Passing Rate
13CLEAR EXAM REVIEW SUMMER 2016 n
1 A sparkline is a tiny, simple graph that fits in a single cell of a spreadsheet.

much in the way of assisting the user to interpret and evaluate the information provided. This is most often achieved by providing useful comparisons.
Normative comparison information can often be embedded into the data visualizations that pertain to each data source. By shading the regions of a bullet, line, or bar chart, current summary stats can be conveyed such as the overall mean, confidence interval, or quartile. If longitudinal comparisons (e.g., prior year) are useful, these can be added to the data visualization as a separate line, bar, or bullet.
Often users evaluating monitoring information wish to be alerted if a value exceeds a specified threshold. It is important with dashboard design to ensure that there are not too many thresholds (typically two to three are sufficient) and to allow users to adjust the threshold values whenever it makes sense to do so.
In addition to establishing thresholds, the way in which alerts are provided to the user must be established. Designers are encouraged to display the object in a different color, flash the object, or add a visual or audio alert. Keep in mind that alerts can be intrusive and annoying if there are too many of them going off at the same time. Oftentimes a simple visual icon is enough to alert seasoned users to a salient value on the dashboard.
Some designers may find it useful to implement hierarchical alerts. For example, if test volume is fine in a particular region but low in a state within that region, an alert would not be triggered for a visualization aggregated at the region level. However, a hierarchical alert might notify the user of this issue by having a slightly different icon, sound, or color for the alert associated with the region of concern.
This leads to the need for interactivity in order to drill deeper into the data. Keep in mind that dashboards typically provide high level monitoring and evaluation. Once an issue is detected, further investigation is typically required to understand, troubleshoot, or fix the issue. Oftentimes interactivity within the dashboard can make it possible to drill into things quickly and easily. In the test volume example above, an interactive system may allow a user to click on the region with the alert and inspect the volume for each of the states within the region, thereby allowing her to identify the state or even city where volumes have declined.
As was mentioned in the prior articles on data visualization, dashboard design is as much art as it is science. Practice
makes perfect, and organizations interested in taking their program monitoring and evaluation to the next level may wish to make dashboard development part of their normal business activities.
Summary
Digital dashboards are an effective way to help licensure and certification organizations monitor and evaluate their programs. Like other forms of technology, the more resources that are spent planning the development or deployment of a dashboard, generally speaking, the more effective the dashboard will be.
Effective dashboards contain data from multiple data sources and use summary statistics to encapsulate the information contained within each source. They also present these summary statistics using effective data visualizations, of which the bullet graph may be one of the most effective visualizations for dashboards. Effective dashboards also help the user to prioritize the information provided by bringing attention to the data that are most important by either placing the data visualizations in a good location or by using color, highlighting, flashing, or sound to alert the user. Effective dashboards also provide useful comparison points to help the user interpret the information provided.
Although digital dashboards are quite useful, they are not currently found within licensure and certification organizations to the extent that they could be. It is hoped that this article will increase the comfort and motivation level of industry professionals thereby making them more accessible to licensure and certification organizations.
BibliographyBontempo, Brian (2014). Technology in testing: An introduction to data visualization for testing. CLEAR Exam Review XXIV (1): 8-12.
Bontempo, Brian (2014). Technology in testing: Designing effective data visualizations for testing. CLEAR Exam Review XXIV (2): 9-14.
Few, Stephen (2004). Show Me the Numbers. Analytic Press: Oakland, CA.
Few, Stephen (2013). Information Dashboard Design 2nd Edition. Analytic Press: Burlingame, CA.
Tufte, Edward (2006). Beautiful Evidence. Graphics Press: New Haven, CT.
14 CLEAR EXAM REVIEW n SUMMER 2016
Abstract
A recent challenge faced by many credentialing programs has been low and declining response rates on task inventory surveys. This study investigates how modifying mailing materials to make them more engaging and personalized, giving people a Starbucks® gift card, or offering a cash prize drawing work as methods to potentially increase task inventory survey response rates. Results indicate that changing the mailing materials and offering a prize drawing either had no effect or decreased response rates, while giving people a Starbucks® gift card increased response rates. Additional analyses showed that, while the condition of giving a Starbucks® gift card with the regular mailing materials and no prize drawing had the highest response rate, the increase in response rate was not significantly different from the baseline condition of no special interventions. Results also suggested that there were important differences in response rates by gender and age.
Introduction
One of the pillars used to build a validity argument in support of the use of examination scores to make credentialing candidate classification decisions comes from a practice analysis of the profession (Chinn & Hertz, 2010; Kane, 1994, 1997; Knapp & Knapp, 1995; LaDuca, 1994; Raymond, 2001, 2016; Raymond & Neustel, 2006; Tannenbaum, Robustelli, & Baron, 2008; Wang, Schnipke, & Witt, 2005). Practice analyses provide the link between what people must know and be able to do in the workplace and the content of the exam used to certify that candidates have the knowledge, skills, and abilities to competently and safely perform the job. One of the most commonly used methods of performing practice analysis for credentialing programs is the task inventory method (Gael, 1983; Raymond, 2001, 2016; Raymond & Neustel, 2006; Wang et al., 2005; Wang & Stahl, 2012).
The task inventory method typically involves the following steps:
1. Ask a group of subject matter experts to compile a list of tasks thought to be necessary to safely and competently perform the duties of the profession and that are a part of the domain of content knowledge associated with the profession. This list is typically compiled by reviewing previous task inventory surveys and results, educational curriculum, research articles, job descriptions, regulations, private and publicly
A Study of Potential Methods to Increase Response Rates on Task Inventory Surveys
ADAM E. WYSE, Ph.D. The American Registry of Radiologic Technologists
CAROL ECKERLY, Ph.D. University of Wisconsin-Madison
BEN BABCOCK, Ph.D. The American Registry of Radiologic Technologists
AND DAN ANDERSON, M.S.The American Registry of Radiologic Technologists
15CLEAR EXAM REVIEW SUMMER 2016 n

available data (e.g., CMS data), and the professional experience of the subject matter experts.
2. Compile the list of tasks into a survey. The survey usually includes one or more rating scales (e.g., frequency, responsibility, criticality, need at entry) for each of the tasks, demographic and workplace questions, and potentially questions about specific knowledge, skill, and ability statements thought to underlie the tasks.
3. Select a sample of respondents to send the survey to.
4. Have the sample of respondents complete the survey by rating the tasks and, if included, the knowledge, skill, and ability statements and by responding to the demographic and workplace questions.
5. Analyze the responses of the survey respondents.
6. Have the subject matter experts review the survey results and decide what tasks are necessary to competently and safely perform the duties of the profession, and from this list of tasks infer what underlying knowledge, skills, and abilities should represent the content of the exam.
7. Use the survey results and judgments of the subject matter experts to decide the number of exam questions that should be assigned to each content area (Wang et al., 2005; Wang & Stahl, 2012).
An important part of obtaining quality data to decide what should be included in the exam content specifications is how many people respond to the task inventory survey and how representative these respondents are of the population of interest. When the number of survey respondents is too small, the accuracy of the survey results may be called into question. Wang, Wiser, and Newman (1999) point out that low response rates on task inventory surveys can be a particular challenge because they may introduce systematic errors into the data, greatly reducing the validity of the results. This can be especially problematic when the low response rate produces a small number of respondents who may not be representative of the full population of interest. There are many situations where task inventory surveys have lower than desired response rates. Knapp and Knapp (1995) indicated that typical response rates obtained on task inventory surveys ranged between 25% and 35%. Henderson and Smith (2015) suggested similar findings, reporting response rates between 20% and 35%. Some organizations observe response rates much lower than 20%, with declines in recent years (Webb & Becker, 2014). The challenge of low and declining response rates is not unique to task inventory surveys, as other types of surveys have also struggled with these issues (Cummings, Savitz, & Kondrad, 2001; Keeter, Kennedy, Dimrock, Best, & Craighill, 2006; Sheehan, 2001).
There are many factors that may be contributing to lower than desired and declining response rates. Some of these include the length of time that it takes to complete the survey, increasing work demands and less available time to complete the survey, how and when the survey is administered, the amount and types of incentives that are offered for completing the survey, how people are asked to participate, the frequency and type of follow-up reminders sent to respondents, and the complexity of the scales used in the survey.
The American Registry of Radiologic Technologists (ARRT), like other credentialing organizations, has observed declines in response rates to its recent task inventory surveys. Whereas response rates fifteen years ago were usually over 50%, it is now common to see response rates between 20% and 25%, with even lower response rates found in some cases. ARRT administered three task inventory surveys in 2015 for radiography, radiation therapy, and nuclear medicine technology, and each survey was eight pages long. The surveys contained questions about tasks conducted on the job, as well as demographic and workplace questions. The surveys were sent out in the mail, and a reminder postcard was sent after two weeks. The radiography and nuclear medicine technology surveys were offered only on paper, while the radiation therapy survey was offered in both paper and online formats. Respondents were given six weeks to complete and return the survey. The response rates were around 25% for all three disciplines. These represented drops in return rates of 20-25 percentage points compared to similar task inventory surveys that had been administered six years prior.
ARRT was concerned with this pattern of low and declining response rates and decided to perform an experimental study with its computed tomography (CT) task inventory survey to see if changing certain factors in its task inventory survey process could increase response rates. The next section of this article provides some additional context on the study and the factors that were manipulated in an effort to increase response rates. The following section outlines the data and methods used to select the survey sample and send out the survey. This is followed by a description of the study results. The article concludes with discussion and some practical suggestions regarding methods that other organizations may want to consider in an effort to increase response rates for their task inventory surveys.
Study Context and Factors Manipulated
ARRT offers 14 certifications in medical imaging, interventional procedures, and radiation therapy. Of these 14 disciplines, radiography is the largest discipline with 307,484
METHODS TO INCREASE RESPONSE RATES
16 CLEAR EXAM REVIEW n SUMMER 2016

METHODS TO INCREASE RESPONSE RATES
people certified and registered as of December 2015. CT is the second largest discipline with 61,772 people certified and registered as of December 2015. Given the number of people certified and registered in CT, ARRT felt that the CT task inventory survey planned for the end of 2015 afforded a ripe opportunity to perform an experiment to see if modifying some parts of its typical task inventory survey process would help increase response rates.
ARRT began offering CT certification and registration in 1995. ARRT has conducted three previous comprehensive
practice analyses prior to the one it began in 2015. In each case, a task inventory survey was used to determine exam content specifications. Table 1 provides key details about these previous task inventory surveys. Response rates decreased from 1993 to 2010, although the response rate in 2010 was almost 60%. The primary difference among the surveys has been the number and types of scales used to rate tasks. Scales have included: 1. responsibility for performing, 2. criticality, 3. frequency of performance, and 4. difficulty of learning a task.
TABLE 1. Summary of previous CT task inventory survey results
Year Task Scales (see above)
Other Survey Sections N Length Return Rate
1993 1, 2, 3 1. knowledge domains 2. demographic and workplace questions
1,000 149 tasks; 12 total pages 70.0%
2001 1, 3, 4 1. demographic and workplace questions 1,000 144 tasks; 12 total pages 60.2%
2010 1, 3 1. equipment2. demographic and workplace questions
3,000 122 tasks; 8 total pages 58.5%
Over the past 20 years, CT task inventory surveys have become shorter with fewer scales, and those changes reflect the general thinking of ARRT with regard to effective practice analysis for all disciplines. The typical process that ARRT has used to perform practice analyses in recent years has continued to utilize the task inventory method and has followed the seven steps listed above. Current surveys are usually eight pages long with an introductory cover letter, directions for completing the survey, at least 100 tasks, and demographic and workplace questions. Surveys are usually sent out via United States Postal Service (USPS) mail, and recent surveys can be completed by returning the mailed questionnaire or by filling out the survey online. The cover letter is generic and not personalized to the survey respondent, while the mailing envelope and return materials are black and white with a bulk postage-paid envelope. The survey usually includes a single scale, which is a combination of a frequency and responsibility scale (Raymond, 2001). Survey respondents are typically given six weeks to return the survey with a simple black and white reminder postcard sent out after two weeks to remind participants of the survey deadline. No incentives have been offered for completing the survey.
After reviewing the literature for factors that may impact survey response rates in other contexts, we modified the
typical process in three ways in an effort to increase survey response rates. The first way that we modified the process was by creating an enhanced mailing condition by adapting the mailing materials sent to participants. First, the cover letter was modified to be more personalized by including the respondent’s name in the salutation. Second, we changed the cover letter to be shorter and include simplified and engaging language. This included asking an expert in communications to rewrite portions of the cover letter. Third, we changed the initial and return mailing envelopes to be in color instead of black and white, and we used an actual stamp instead of bulk postage. We also simplified the language of the reminder postcard and changed it to be in color as well. This package of modifications to the mailing materials was based on previous research that suggests that survey response rates tend to increase when the materials used are more engaging and personalized (Fox, Crask, & Kim, 1988; Heberlein & Baumgartner, 1978).
The second experimental factor was including a $5 Starbucks® gift card with the mailed survey. Survey respondents were free to keep the Starbucks® gift card whether or not they returned the survey. ARRT has not previously included a gift card with its task inventory surveys. Previous survey research suggests that giving people a small amount of cash or a gift card can increase response
17CLEAR EXAM REVIEW SUMMER 2016 n
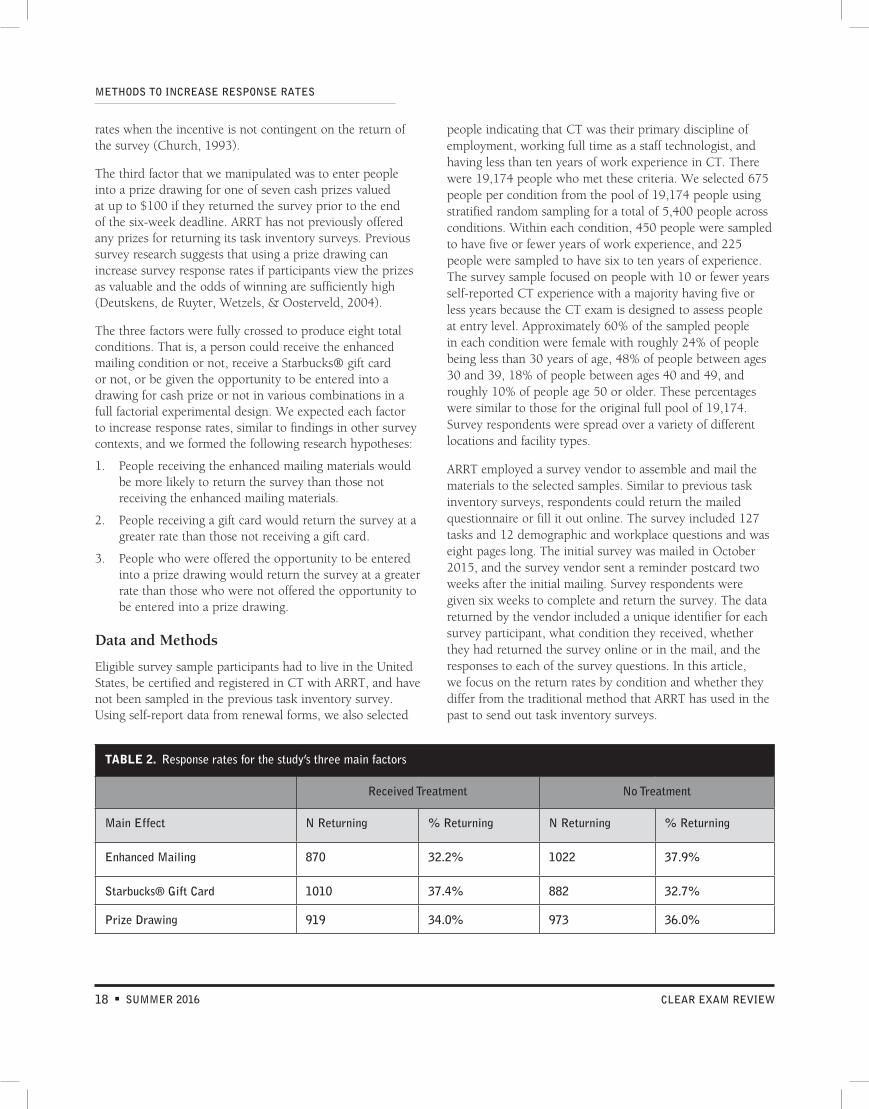
TABLE 2. Response rates for the study’s three main factors
Received Treatment No Treatment
Main Effect N Returning % Returning N Returning % Returning
Enhanced Mailing 870 32.2% 1022 37.9%
Starbucks® Gift Card 1010 37.4% 882 32.7%
Prize Drawing 919 34.0% 973 36.0%
rates when the incentive is not contingent on the return of the survey (Church, 1993).
The third factor that we manipulated was to enter people into a prize drawing for one of seven cash prizes valued at up to $100 if they returned the survey prior to the end of the six-week deadline. ARRT has not previously offered any prizes for returning its task inventory surveys. Previous survey research suggests that using a prize drawing can increase survey response rates if participants view the prizes as valuable and the odds of winning are sufficiently high (Deutskens, de Ruyter, Wetzels, & Oosterveld, 2004).
The three factors were fully crossed to produce eight total conditions. That is, a person could receive the enhanced mailing condition or not, receive a Starbucks® gift card or not, or be given the opportunity to be entered into a drawing for cash prize or not in various combinations in a full factorial experimental design. We expected each factor to increase response rates, similar to findings in other survey contexts, and we formed the following research hypotheses:
1. People receiving the enhanced mailing materials would be more likely to return the survey than those not receiving the enhanced mailing materials.
2. People receiving a gift card would return the survey at a greater rate than those not receiving a gift card.
3. People who were offered the opportunity to be entered into a prize drawing would return the survey at a greater rate than those who were not offered the opportunity to be entered into a prize drawing.
Data and Methods
Eligible survey sample participants had to live in the United States, be certified and registered in CT with ARRT, and have not been sampled in the previous task inventory survey. Using self-report data from renewal forms, we also selected
people indicating that CT was their primary discipline of employment, working full time as a staff technologist, and having less than ten years of work experience in CT. There were 19,174 people who met these criteria. We selected 675 people per condition from the pool of 19,174 people using stratified random sampling for a total of 5,400 people across conditions. Within each condition, 450 people were sampled to have five or fewer years of work experience, and 225 people were sampled to have six to ten years of experience. The survey sample focused on people with 10 or fewer years self-reported CT experience with a majority having five or less years because the CT exam is designed to assess people at entry level. Approximately 60% of the sampled people in each condition were female with roughly 24% of people being less than 30 years of age, 48% of people between ages 30 and 39, 18% of people between ages 40 and 49, and roughly 10% of people age 50 or older. These percentages were similar to those for the original full pool of 19,174. Survey respondents were spread over a variety of different locations and facility types.
ARRT employed a survey vendor to assemble and mail the materials to the selected samples. Similar to previous task inventory surveys, respondents could return the mailed questionnaire or fill it out online. The survey included 127 tasks and 12 demographic and workplace questions and was eight pages long. The initial survey was mailed in October 2015, and the survey vendor sent a reminder postcard two weeks after the initial mailing. Survey respondents were given six weeks to complete and return the survey. The data returned by the vendor included a unique identifier for each survey participant, what condition they received, whether they had returned the survey online or in the mail, and the responses to each of the survey questions. In this article, we focus on the return rates by condition and whether they differ from the traditional method that ARRT has used in the past to send out task inventory surveys.
18 CLEAR EXAM REVIEW n SUMMER 2016
METHODS TO INCREASE RESPONSE RATES

ResultsAcross all eight conditions, a total of 1,892 people returned the survey for a total return rate of 35.0%. Of those responses, 1,503 responses were returned via mail and 389 were returned online. This total response rate was notably higher than response rates that ARRT had observed for other task inventory surveys it had conducted earlier in the year. The increase in response rates for this survey compared to the other recent surveys was encouraging, but still lower than hoped for. The return rate was also considerably lower than the return rate observed in 2010.
Table 2 shows the response rates for each of the three main study factors. The main effects for the enhanced mailing and the Starbucks® gift card were statistically significant at the 0.05 alpha level, while the prize drawing was not statistically significant. The Starbucks® gift card appeared to work as intended, as response rates were about 5% higher; but, surprisingly, both the enhanced mailing and the prize drawing were seen to reduce return rates.
Based on the results from Table 2, one may think that the best option is to offer a gift card without an enhanced mailing or a prize drawing. The real question, however, is about how the specific factors work in combination and whether certain combinations of factors are better than ARRT’s baseline condition of no enhanced mailing, no Starbucks® gift card, and no prize drawing. Table 3 presents the results for the eight conditions. One can see that the best condition is in fact the condition where a person is given a
Starbucks® gift card without an enhanced mailing or a prize drawing. One can also see, however, that the response rate for this condition is only slightly greater than for Condition #1, which is the baseline. The baseline had the second best return rate. We fit a fully crossed logistic regression model and found that the only conditions that were significantly different from the baseline at the 0.05 alpha level were Conditions #2, #5, and #6, which had lower response rates. It appears that the typical process yielded returns in many cases that were better than other alternatives.
We decided to take a closer look at the return rates for several important demographic variables to see if there may be differences associated with some of these characteristics that were not captured in the overall results. We found that there were statistically significant differences by age and gender.
Table 4 shows the response rates by age. One can see that people in the 30-39 age group returned at the lowest rate, with people in the under 30 and 40-49 age groups returning at about the same rate and people 50 or older returning at the highest rate. One can also see that the age groups returned at different rates by condition. For the baseline condition, response rates increased with age. Compared to the baseline condition, people under 30 and 40-49 returned at higher rates for Condition #3 (i.e., the gift card only condition), while people 30-39 returned at about the same rate, and people 50 or older returned at a much lower rate. For this condition, there was not a pattern of increasing
TABLE 3. Response rates for eight different study conditions
Condition Enhanced Mailing Starbucks® Gift Card Prize Drawing N %
1 (baseline) No No No 271 40.1%
2 No No Yes 223 33.0%
3 No Yes No 277 41.0%
4 No Yes Yes 251 37.2%
5 Yes No No 184 27.3%
6 Yes No Yes 204 30.2%
7 Yes Yes No 241 35.7%
8 Yes Yes Yes 241 35.7%
Total 1892 35.0%
19CLEAR EXAM REVIEW SUMMER 2016 n
METHODS TO INCREASE RESPONSE RATES
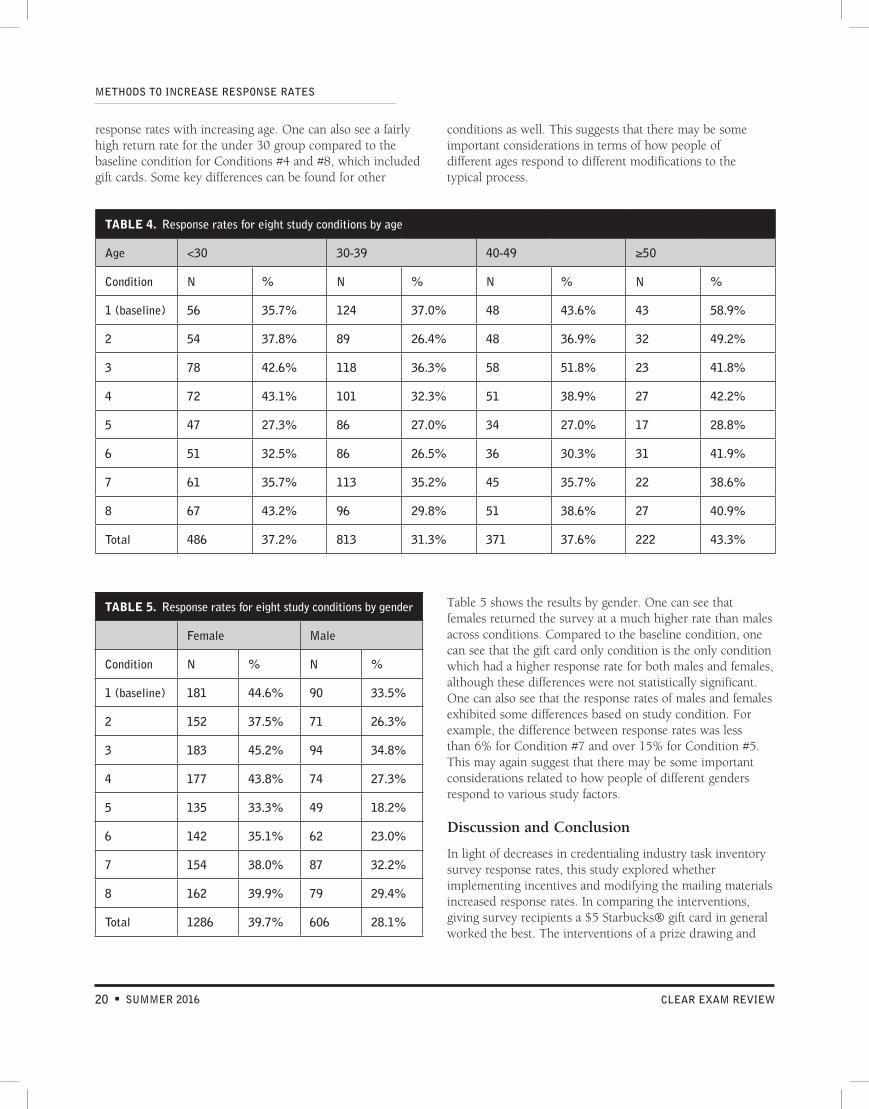
response rates with increasing age. One can also see a fairly high return rate for the under 30 group compared to the baseline condition for Conditions #4 and #8, which included gift cards. Some key differences can be found for other
conditions as well. This suggests that there may be some important considerations in terms of how people of different ages respond to different modifications to the typical process.
Table 5 shows the results by gender. One can see that females returned the survey at a much higher rate than males across conditions. Compared to the baseline condition, one can see that the gift card only condition is the only condition which had a higher response rate for both males and females, although these differences were not statistically significant. One can also see that the response rates of males and females exhibited some differences based on study condition. For example, the difference between response rates was less than 6% for Condition #7 and over 15% for Condition #5. This may again suggest that there may be some important considerations related to how people of different genders respond to various study factors.
Discussion and Conclusion
In light of decreases in credentialing industry task inventory survey response rates, this study explored whether implementing incentives and modifying the mailing materials increased response rates. In comparing the interventions, giving survey recipients a $5 Starbucks® gift card in general worked the best. The interventions of a prize drawing and
TABLE 4. Response rates for eight study conditions by age
Age <30 30-39 40-49 ≥50
Condition N % N % N % N %
1 (baseline) 56 35.7% 124 37.0% 48 43.6% 43 58.9%
2 54 37.8% 89 26.4% 48 36.9% 32 49.2%
3 78 42.6% 118 36.3% 58 51.8% 23 41.8%
4 72 43.1% 101 32.3% 51 38.9% 27 42.2%
5 47 27.3% 86 27.0% 34 27.0% 17 28.8%
6 51 32.5% 86 26.5% 36 30.3% 31 41.9%
7 61 35.7% 113 35.2% 45 35.7% 22 38.6%
8 67 43.2% 96 29.8% 51 38.6% 27 40.9%
Total 486 37.2% 813 31.3% 371 37.6% 222 43.3%
TABLE 5. Response rates for eight study conditions by gender
Female Male
Condition N % N %
1 (baseline) 181 44.6% 90 33.5%
2 152 37.5% 71 26.3%
3 183 45.2% 94 34.8%
4 177 43.8% 74 27.3%
5 135 33.3% 49 18.2%
6 142 35.1% 62 23.0%
7 154 38.0% 87 32.2%
8 162 39.9% 79 29.4%
Total 1286 39.7% 606 28.1%
20 CLEAR EXAM REVIEW n SUMMER 2016
METHODS TO INCREASE RESPONSE RATES
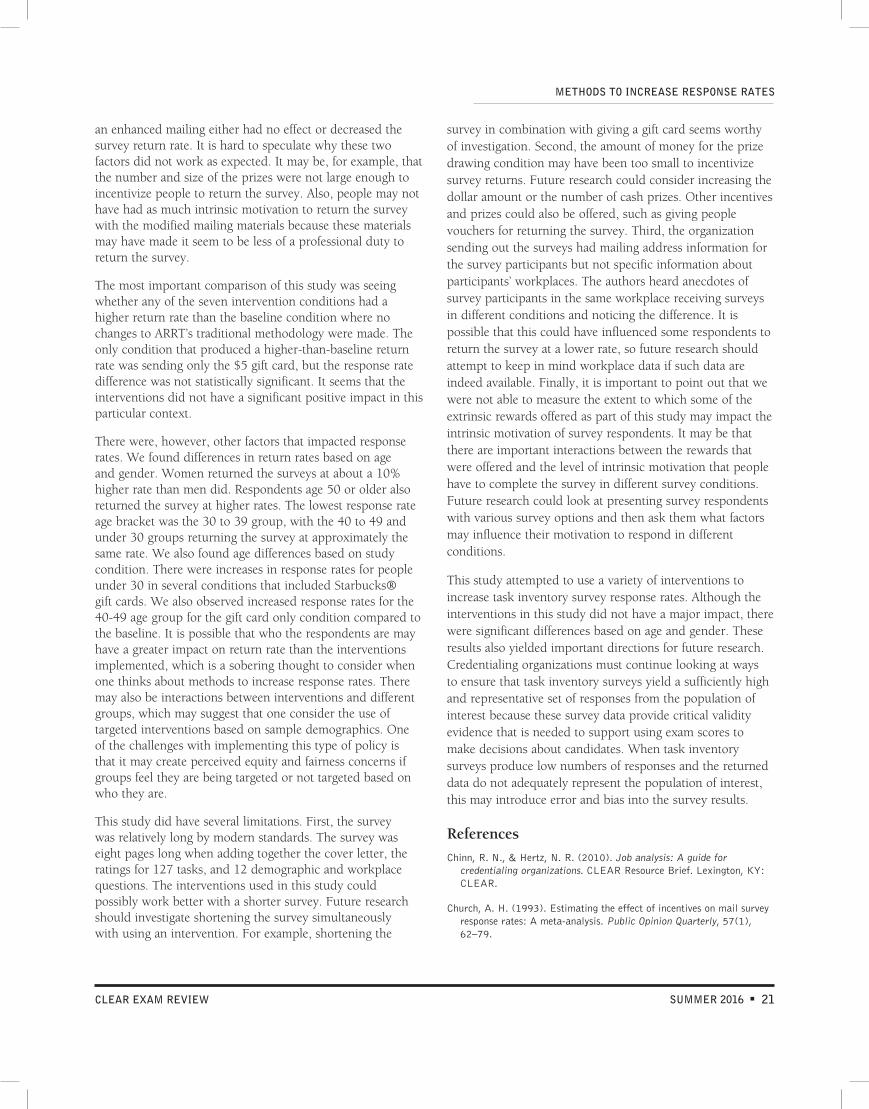
an enhanced mailing either had no effect or decreased the survey return rate. It is hard to speculate why these two factors did not work as expected. It may be, for example, that the number and size of the prizes were not large enough to incentivize people to return the survey. Also, people may not have had as much intrinsic motivation to return the survey with the modified mailing materials because these materials may have made it seem to be less of a professional duty to return the survey.
The most important comparison of this study was seeing whether any of the seven intervention conditions had a higher return rate than the baseline condition where no changes to ARRT’s traditional methodology were made. The only condition that produced a higher-than-baseline return rate was sending only the $5 gift card, but the response rate difference was not statistically significant. It seems that the interventions did not have a significant positive impact in this particular context.
There were, however, other factors that impacted response rates. We found differences in return rates based on age and gender. Women returned the surveys at about a 10% higher rate than men did. Respondents age 50 or older also returned the survey at higher rates. The lowest response rate age bracket was the 30 to 39 group, with the 40 to 49 and under 30 groups returning the survey at approximately the same rate. We also found age differences based on study condition. There were increases in response rates for people under 30 in several conditions that included Starbucks® gift cards. We also observed increased response rates for the 40-49 age group for the gift card only condition compared to the baseline. It is possible that who the respondents are may have a greater impact on return rate than the interventions implemented, which is a sobering thought to consider when one thinks about methods to increase response rates. There may also be interactions between interventions and different groups, which may suggest that one consider the use of targeted interventions based on sample demographics. One of the challenges with implementing this type of policy is that it may create perceived equity and fairness concerns if groups feel they are being targeted or not targeted based on who they are.
This study did have several limitations. First, the survey was relatively long by modern standards. The survey was eight pages long when adding together the cover letter, the ratings for 127 tasks, and 12 demographic and workplace questions. The interventions used in this study could possibly work better with a shorter survey. Future research should investigate shortening the survey simultaneously with using an intervention. For example, shortening the
survey in combination with giving a gift card seems worthy of investigation. Second, the amount of money for the prize drawing condition may have been too small to incentivize survey returns. Future research could consider increasing the dollar amount or the number of cash prizes. Other incentives and prizes could also be offered, such as giving people vouchers for returning the survey. Third, the organization sending out the surveys had mailing address information for the survey participants but not specific information about participants’ workplaces. The authors heard anecdotes of survey participants in the same workplace receiving surveys in different conditions and noticing the difference. It is possible that this could have influenced some respondents to return the survey at a lower rate, so future research should attempt to keep in mind workplace data if such data are indeed available. Finally, it is important to point out that we were not able to measure the extent to which some of the extrinsic rewards offered as part of this study may impact the intrinsic motivation of survey respondents. It may be that there are important interactions between the rewards that were offered and the level of intrinsic motivation that people have to complete the survey in different survey conditions. Future research could look at presenting survey respondents with various survey options and then ask them what factors may influence their motivation to respond in different conditions.
This study attempted to use a variety of interventions to increase task inventory survey response rates. Although the interventions in this study did not have a major impact, there were significant differences based on age and gender. These results also yielded important directions for future research. Credentialing organizations must continue looking at ways to ensure that task inventory surveys yield a sufficiently high and representative set of responses from the population of interest because these survey data provide critical validity evidence that is needed to support using exam scores to make decisions about candidates. When task inventory surveys produce low numbers of responses and the returned data do not adequately represent the population of interest, this may introduce error and bias into the survey results.
References
Chinn, R. N., & Hertz, N. R. (2010). Job analysis: A guide for credentialing organizations. CLEAR Resource Brief. Lexington, KY: CLEAR.
Church, A. H. (1993). Estimating the effect of incentives on mail survey response rates: A meta-analysis. Public Opinion Quarterly, 57(1), 62–79.
21CLEAR EXAM REVIEW SUMMER 2016 n
METHODS TO INCREASE RESPONSE RATES

Cummings, S. M., Savitz, L. A., & Konrad, T. R. (2001). Reported response rates to mailed questionnaires. Health Services Research, 35(6), 1347-1355.
Deutskens, E., de Ruyter, K., Wetzels, M., & Oosterveld, P. (2004). Response rate and response quality of internet-based surveys: An experimental study. Marketing Letters, 15(1), 21-36.
Fox, R. J., Crask, M. R., & Kim, J. (1988). Mail survey response rate: A meta-analysis of selected techniques for inducing response. Public Opinion Quarterly, 52, 467-491.
Gael, S. (1983). Job analysis: A guide to assessing work activities. San Francisco, CA: Jossey-Boss.
Heberlein, T., & Baumgartner, R. (1978). Factors affecting response rates to mailed questionnaires: A quantitative analysis of the published literature. American Sociological Review, 43, 447-62.
Henderson, J. P., & Smith, D. (2015). Job/practice analysis. In J. Knapp, L. Anderson, & C. Wild (Eds.) Certification: The ICE Handbook (2nd ed. pp. 121-146). Washington, DC: Institute for Credentialing Excellence.
Kane, M. T. (1997). Model-based practice analysis and test specifications. Applied Measurement in Education, 10, 5-18.
Kane, M. T. (1994). Validating interpretive arguments for licensure and certification examinations. Evaluation & the Health Professions, 17, 133-159.
Keeter, S., Kennedy, C., Dimrock, M., Best, J., & Craighill, P. (2006). Gauging the impact of growing nonresponse on estimates from a national RDD telephone survey. Public Opinion Quarterly, 70(5), 759- 779.
Knapp, J., & Knapp, L. (1995). Practice analysis: Building the foundation for validity. In J. C. Impara (Ed.). Licensure testing: Purposes, procedures, and practices (pp. 93-116). Lincoln, NE: Buros Institute of Mental Measurements.
LaDuca, A. (1994). Validation of professional licensure examinations: Professions theory, test design, and construct validity. Evaluation & the Health Professions, 17, 178-197.
Raymond, M. R. (2016). Job analysis, practice analysis and the content of credentialing examinations. In S. Lane, M. R. Raymond, & T. M. Haladyna (Eds.), Handbook of test development (2nd edition, pp. 144-164). New York, NY: Routledge.
Raymond, M. R. (2001). Job analysis and the specification of content for licensure and certification examinations. Applied Measurement in Education, 14, 369-415.
Raymond, M. R., & Neustel, S. (2006). Determining the content of credentialing examinations. In S. M. Downing & T. M. Haladyna (Eds.), Handbook of test development (pp. 181-223). Mahwah, NJ: Lawrence Erlbaum.
Sheehan, K. B. (2001). Email survey response rates: A review. Journal of Computer Mediated Communication, 6(2). Retrieved April 25, 2016 from http://onlinelibrary.wiley.com/ doi/10.1111/j.1083-6101.2001.tb00117.x/full.
Tannenbaum, R. J., Robustelli, S. L., & Baron, P. A. (2008). Evidence- centered design: A lens through which the process of job analysis may be focused to guide the development of knowledge-based test content specifications. CLEAR Exam Review, 19(2), 26-33.
Wang, N., Schnipke, D., & Witt, E. A. (2005). Use of knowledge, skill and ability statements in developing licensure and certification examinations. Educational Measurement: Issues and Practice, 24(1), 15-22.
Wang, N., & Stahl, J. (2012). Obtaining content weights for test specifications from job analysis task surveys: An application of the Many-Facets Rasch model. International Journal of Testing, 12, 299- 320.
Wang, N., Wiser, R. F., & Newman, L. S. (1999). Examining reliability and validity of job analysis survey data. Paper presented at the annual meeting of the National Council on Measurement in Education, Montreal, Canada.
Webb, L. C., & Becker, K. A. (2014). Using the Delphi method to determine test specifications from a job analysis. CLEAR Exam Review, 24(1), 18-22.
22 CLEAR EXAM REVIEW n SUMMER 2016
METHODS TO INCREASE RESPONSE RATES
Acknowledgements
The authors would like to thank The American Registry of Radiologic Technologists (ARRT) Board of Trustees for their support of this research. The authors would also like to thank Christopher Cook for his assistance putting together the materials for the enhanced mailing conditions and Gary Wilson and the staff at Survey Systems, Inc. for their help carrying out this research. The authors would also like to thank ARRT’s Computed Tomography Practice Analysis committee members who helped create the task inventory survey and Jerry Reid, Lauren Wood, Kevin Rush, Blaze Lanoue, and Jerilyn Powell for several helpful comments and suggestions that they made on an earlier version of this manuscript. Any opinions, findings, conclusions, or recommendations expressed in this manuscript are those of the authors and are not necessarily the official position of ARRT.
ADDRESS CORRESPONDENCE TO: Adam E. Wyse, Ph.D.
The American Registry of Radiologic Technologists 1255 Northland Drive St. Paul, MN 55120
Email: [email protected]
An item bank is an electronic database of test questions (items). Item banks have become a crucial component of any credentialing examination program, as they allow for storing and organizing not only item content but any information related to the items (e.g., item statistics, relationships, histories). In 2006, Vale argued that “although a significant portion of the test items in use today reside in electronic item banks, such item banks do not generally follow a standard of structure or representation” (p. 261). Not much has changed in the 10+ years since Vale wrote those words. Today, there are numerous item-banking systems with many differences between them.
Establishing (or transitioning to) a new or different item-banking system has major implications for any examination program, as these systems can be costly to set up, the transition of all existing items and related content can be time-consuming and error-prone, and selecting the wrong system could result in having to move all the items back out again. However, if the right item-banking system is selected for an examination program, the system may make many activities related to test development easier. Since the choices in item-banking systems are as varied as the examination programs that use them, following is guidance on what to consider when evaluating different systems.
Item Development and Item Types
The two factors that will most likely have the biggest impact on the selection of an item-banking system are the process by which an organization develops their items and the item types that are used as part of the examination. Some systems are designed for staff use only. Others anticipate use by numerous subject matter experts (SMEs), often remotely. The test development process will prompt the following considerations:
• Is there an item authoring interface for SMEs?
» If so, how user-friendly is the item authoring interface?
» How much training will the SMEs need before they can use the item authoring tool?
» Can the tool be set to require SMEs to enter certain categories of information, such as content domain, references, and rationale?
» Are SMEs able to see other SMEs’ work product?
• Does the item-banking system allow for item-development workflow?
» If a workflow exists, can it readily be customized (some systems are designed with a particular workflow in mind)?
» Are designated reviewers somehow notified when new items need to be reviewed (e.g., by email, on a dashboard)?
Evaluating Item-Banking Systems What to Consider and Why
ADRIENNE W. CADLE, Ph.D.senior psychometrician, Professional Testing
23CLEAR EXAM REVIEW SUMMER 2016 n

EVALUATING ITEM-BANKING SYSTEMS: WHAT TO CONSIDER AND WHY
» Can administrators track workflow progress?
» Can multiple reviewers edit and comment on one item, or is the workflow linear?
» Can multiple reviewers comment on a draft item, and can the writer develop updates to the item?
• Are there error checking algorithms that provide warnings based on common item writing techniques (e.g., some systems will warn SMEs if they write a negatively worded item)?
• How easily can item content be updated, formatted, or manipulated?
» Can options be reordered easily?
» Can item versions be combined for further editing?
• Are item classification categories customizable?
» Are there limitations on the number of classification categories?
• Is the system desktop-based or browser-based (e.g., local or cloud delivery)?
» If it is browser-based, what security features are provided for online item development?
» If it is browser-based, is it compatible across multiple browsers (e.g., Chrome, Edge, Mozilla, Safari, and Internet Explorer)?
» If the system is local, can more than one user access it at a time?
• Does the system have an auto-save or recovery feature?
• How user-friendly is the item editing interface?
• How does the system handle formulas, equations, and special characters?
• Does the system log changes to items by individuals, and can changes be reverted?
• Can the system be set to lock an item after it reaches a certain status (usually operational use) so that no changes can be made without a documented administrator override?
• Can the system clone items?
» Are cloning parameters customizable?
» Is cloning an automatic feature (e.g., will each edit to an item cause a clone to be created)?
• Is spell check available as a feature?
» Are other dictionaries pre-programmed into the item-banking system (e.g., medical dictionary)? Can custom dictionaries be created?
In terms of item types, some item-banking systems are developed to manage only traditional item types like multiple choice, multiple response, matching, and true/false. Other item-banking systems are designed to also include technology-enhanced items (TEIs) like hotspot, drag and drop, and items with audio or video clips. If an examination program currently utilizes TEIs (or plans to use TEIs in the future), then choosing an item-banking system that allows for the storage and maintenance of those item types is crucial. Some considerations related to item type (and multimedia storage) are as follows:
• Is there alignment between the item types available in the item-banking system and the item types used on the examination (or the item types that could be used on the exam)?
• Does the item-banking system allow for multimedia to be attached to item content (e.g., can a video be embedded in the item)?
» What multimedia formats are supported (e.g., can image files, audio files, and video files be stored in the system)?
» What are the size limitations for media?
» Can the same media be used across multiple items without multiple copies being stored and tracked?
» Can media be edited directly in the item-banking system, or does that have to be done outside of the system?
• Do software system storage capabilities align with requirements (e.g., if TEIs are used as part of the examination process, does the system have enough storage capacity to store all media)?
• Does the item-banking system support multiple languages if that is a necessity or envisioned to be in the future?
When considering both the item types used and the item-development process implemented by an examination program, the choices of item-banking systems that may be appropriate will be reduced; the next set of considerations will reduce the list further.
Test Assembly and Data Management
The next set of factors that will impact choice of an item-banking system is related to how the organization assembles exam forms and how it manages and stores all item-related data. Some item-banking systems have a test assembly feature built directly into the system by which a user can
24 CLEAR EXAM REVIEW n SUMMER 2016
EVALUATING ITEM-BANKING SYSTEMS: WHAT TO CONSIDER AND WHY
establish a set of parameters and the item-banking system will generate an exam form based on those parameters, while other systems allow the user to select the items to place on an exam form. Some considerations related to test assembly are as follows:
• How are exam forms assembled in the item-banking system?
» Does the item-banking system assemble the form using a set of parameters (e.g., item difficulty, item discrimination, overall test difficulty, and blueprint weights)?
• Will the item-banking system automatically assemble test forms based on pre-specified parameters?
• Can the assembly parameters be created manually?
» How easy is it to manually assemble a form in the item-banking system?
• How are past exam forms stored in the item-banking system?
» Is there version control of the exam forms (e.g., if an edit is made to an item, does the exam form store the version of the item when the form was administered)?
• Can a pick-list be imported to build a test form?
• Does the item-banking system recognize relationships between items when assembling a form?
» Will it provide notification if item enemies are placed on the same form?
» Will it keep items together that are linked to the same scenario?
• Can items be classified by both task and knowledge statements?
When it comes to item-related data, the type of data each item-banking system has the capacity to store varies widely. In an ideal world, all item-related data (e.g., item statistics, relationships, histories) can and should be stored within the item bank. Regardless of whether it is stored within or external to the item-banking system, the ease of access to this data should be considered. Here are some specific considerations related to data:
• Will the item-banking system hold item statistics?
» Does the item-banking system calculate statistics (either through an integrated test-delivery system, if such a system is used, or with the importation of examinee response strings)?
» Whether or not the item-banking system can calculate statistics, does it allow externally calculated statistics to be imported?
» Does it allow for item response theory (IRT) statistics?
» Does it allow for classical test theory (CTT) statistics?
» Does it allow for response-level statistics, where statistics are shown for each response, not just the credited response in selected-response items?
• Are statistics “promoted” (updated with new data)? And if so, how are they promoted?
» Are statistics averaged across time?
» Can the statistics from multiple administrations be combined?
• Does the item-banking system allow for item relationships (e.g., inclusive, exclusive, item friends and enemies)?
» Can the system automatically recognize similar content and recommend item relationships?
» How easy or difficult is it to establish item relationships?
• Does the item-banking system allow for historical tracking of item changes?
» Are changes to content, weights, statuses, notes, etc. stored?
» Does the system automatically track changes by date or user?
• Does the item-banking system allow for version control of item content?
• Does the item bank support multiple languages?
» How does the item bank store the same question in multiple languages (e.g., can a user toggle between languages, or does each language have to be stored separately)?
» Will the exam publish RTL language content (e.g., traditional Chinese, Arabic)?
» When a change is made to an English item, what happens to the translated version of the item?
• Will the item-banking system keep track of exposure rates for an item?
• Will the item-banking system allow for storage of rationale or references?
25CLEAR EXAM REVIEW SUMMER 2016 n

Another factor related to data management is how easily data can be imported into and exported out of the item-banking system. Data, in this instance, can be considered both item content and item-related data (e.g., content areas, weights, statuses). The ability to import data may be useful when establishing a new item bank or if there is a need to import item-related data (e.g., statistics). Even more critical, however, is how the item-banking system connects to test delivery platforms. Some systems provide for test delivery and assume users will deliver the test through the system. Users must assess whether this arrangement suits them. If not, it is essential that the system provide an efficient method of publishing. Some considerations related to importing and exporting data are:
• What data can easily be imported into the item-banking system?
» Can pre-calculated statistics be imported, or does the item-banking system only allow for response strings to be imported?
» Can item content be imported into the system?
» Can item content with HTML code or rich-text format (RTF) bold, italics, and other formatting be imported, or will the system only allow for plain text imports?
• Can the end user import data into the item-banking system, or is vendor involvement necessary?
• Can the item-banking system export tests for paper-based testing? Such a capability is sometimes useful for item-review purposes, where SMEs review printed items.
» How much flexibility does the user have with regard to test formatting (e.g., can some data be included or excluded, as required)?
» Can the type size, headers, footers, and the like be adjusted?
» What export formats (e.g., rich text format or RTF, comma-separated values or CSV, plain text or TXT, portable document format or PDF) are available?
• Can the exam (text and images) be formatted once exported, or will it only export directly into a PDF?
• Can the item-banking system export tests to a preferred vendor’s computer-based delivery system? This may include brick-and-mortar delivery or online delivery through a browser, tablet, or phone, with in-person, remote, or no proctoring.
» In exporting entire tests, how easy is it to set form-level specifications, such as the passing score and score scale?
• How can item-related data be exported out of the item-banking system (e.g., statistics, historical data, custom fields, images, media)?
Security, Administrative, and Other Factors
The level of security around the item-banking system is an important factor to consider when selecting an item-banking system. Having said that, every item-banking system that this author has vetted has a robust security system built around it. If the item-banking system stores item content on behalf of the organization (e.g., in the cloud) it is usually stored on secured servers with multiple levels of backup. If the security around user access is a concern, most systems will lock down areas of the item-banking system based on user-level. If more advanced security is a concern for an organization (e.g., the organization wants to require user authentication via token ID) then those discussions should be held with the item-banking system vendor.
Administrative factors may or may not be a concern for an organization depending on the number of people with access to the item-banking system (e.g., SMEs vs staff). Here are some considerations related to administrative factors:
• Are there different or custom roles for different users?
» For example, can SMEs, staff, translators, and administrators all have different roles with appropriate levels of access and editing privileges?
• Is there a different cost for different roles?
• Can access be limited based on roles, item types, or other custom fields?
• Can users be added or removed with ease, or does the item-banking vendor have to do that on behalf of the organization?
• Can multiple item-development activities be conducted at the same time (e.g., can there be more than one user in the system at any point in time)?
Lastly, there are all the “other” factors to consider. These are related to cost, technical capabilities, licensing, etc. and are as follows:
• What is the purchase or lease cost of the system?
• If the system is owned by a CBT vendor, is there a discount for those using the vendor to administer examinations?
26 CLEAR EXAM REVIEW n SUMMER 2016
EVALUATING ITEM-BANKING SYSTEMS: WHAT TO CONSIDER AND WHY
• Can a perpetual license of the software be purchased, or are there ongoing fees?
» If a perpetual license is an option, are future upgrades included?
• Does the vendor offer training and support for the product?
» If so, at what cost?
• Does the system offer training tutorials available on demand?
• What support is offered by the item-banking system vendor?
» Where are they located?
» What level of customer service is available?
» How big is the vendor? How many other accounts do they serve?
» What is their reputation in the industry?
• Is the item-banking system bundled with other services requiring the organization to purchase other services (i.e., psychometric services) in order to use the item-banking system?
While the number of item-banking systems continues to grow, so too will the list of considerations. Hopefully, this list of considerations will help organizations evaluate potential item-banking systems and determine what system will be the best fit for their examination program needs. If multiple item-banking systems meet an organization’s requirements, ultimately, the choice may come down to which system is most intuitive and comfortable for the end users, SMEs, and staff that will be using the system day after day.
Reference
Vale, D. C. (2006). Computerized Item Banking. In S.M. Downing & T.M. Haladyna (Eds.), Handbook of Test Development (261-286). Mahwah, NC: Lawrence Erlbaum Associates Inc. Publishers.
27CLEAR EXAM REVIEW SUMMER 2016 n
EVALUATING ITEM-BANKING SYSTEMS: WHAT TO CONSIDER AND WHY

28 CLEAR EXAM REVIEW n SUMMER 2016
Credentialing organizations routinely develop new forms of their examinations to protect the security of the exam and to ensure that exam content is up to date and reflective of current practice. Whenever a new test form is administered, it is critical that the pass/fail decisions based on the test scores from that new form are consistent with the decisions that would have been made if another test form had been administered.
Test equating refers to statistical methodology that is used to identify the difficulty level of a new test form (relative to other forms). If the new form is found to be more or less difficult than other forms, the passing score for the new form can be adjusted accordingly. The ultimate goal of equating is to ensure that all candidates are treated fairly and held to the same standard regardless of the test form they received.
The importance of test equating is reflected in the Standards for the Accreditation of Certification Programs, published by the National Commission for Certifying Agencies (NCCA, 2014). Certification programs seeking NCCA accreditation must adhere to Standard 21, which states, “The certification program must demonstrate that different forms of an examination do not advantage or disadvantage candidates because of differences in the content framework and/or difficulty of particular forms.” Essential Element B within that standard provides more specific instructions: “The certification program must use statistical equating procedures grounded in accepted psychometric practices.”
One challenge with test equating is that, like all statistical methods, its accuracy is dependent on sample size. In fact, the psychometric literature indicates that in certain small sample situations, not equating is preferable to equating (Kolen & Brennan, 2014). It is important to note that the concept of not equating is more frequently referred to as identity equating. Conceptually, identity equating is the assumption that a new test form is equivalent in difficulty to a previous test form, which implies that the scores from those forms are also equivalent. Operationally, identity equating means that no statistical equating analysis is performed and that the passing score from previous forms is simply applied to the new form.
As a result of the sample size challenge, testing programs with small candidate populations naturally want to ask, “What is the minimum sample size required for test equating?” Unfortunately, this question misses the bigger picture, which is that there are many approaches available for setting the passing score on a new form and that all
Options for Establishing the Passing Score on a New Test Form for Small Volume Programs
ANDREW C. DWYER, Ph.D.director of psychometrics for the American Board of Pediatrics
29CLEAR EXAM REVIEW SUMMER 2016 n
OPTIONS FOR ESTABLISHING THE PASSING SCORE ON A NEW TEST FORM FOR SMALL VOLUME PROGRAMS
approaches have the potential to produce an unfair (i.e., non-equivalent) passing score. Instead, small volume certification programs should be asking, “What options are available for setting the passing score on the new form, and which of those approaches is most likely to produce fair and accurate results?”
Before discussing the specific options available for establishing the passing score on a new form, it is necessary to mention another fundamental psychometric process, standard setting. It is critical to understand the intended roles of both standard setting and test equating in establishing the passing score for any particular test form.
Standard setting refers to the process for establishing a criterion-referenced passing standard, the minimum score required to pass the exam. Typically, standard setting involves convening a panel of subject matter experts to review a particular test form and to make professional judgments about the individual items within the test form or about the test form as a whole. These judgments are used to identify the score on that test form that reflects the minimum level of knowledge/skill required for safe and competent practice on the job (see Buckendahl & Davis-Becker, 2012, for a thorough summary of standard setting methodology for credentialing exams). In an ideal situation, standard setting would be used to establish the passing standard for the initial form, and test equating would be used to maintain that standard across all test forms by establishing the passing score on each subsequent form that is equivalent to the passing score that was set on the initial form.
Options for Setting the Passing Score
In reality, there are several approaches (and an almost unlimited number of variations and combinations of those approaches) for determining the passing score on a new form. For the sake of this discussion, they have been classified into three broad categories, defined below:
1. Equating with small samples – Although it is always preferable to have a large sample of representative candidates take each test form so that the equating analysis is as accurate as possible, these types of analyses can still be performed with very small samples. It is also worth mentioning that equating analyses can be performed using data from unofficial candidates. For example, a certifying organization may choose to recruit a group of current certificate holders to take both the new form and an old form in order to obtain data that could be used for equating. The larger point here is
that as the size and representativeness of the sample diminishes, concerns regarding the accuracy of the equating results increase.
2. Resetting the passing standard – Many certification programs perceive their sample sizes as being too small for equating purposes, and they are also reluctant to use identity equating (i.e., not equating) because it relies on the assumption of equivalent test forms and/or because it appears to lack psychometric rigor. Programs in this situation may instead opt to recruit a panel of subject matter experts to set a new passing standard on each new form (using standard setting methodology).
3. Building equivalent test forms (identity equating) – As mentioned above, identity equating requires the assumption that the new test form is equivalent to a previous form so that the previous passing score can be applied to the new form. The research is clear (and common sense tells us) that in situations where this assumption holds and test forms are equivalent, identity equating is, in fact, the best option. Most resources (e.g., psychometric text books, journal articles) portray identity equating as a passive activity where one simply develops a new form and hopes that the new form is equivalent to previous forms. For programs that intend to use identity equating, however, they would be better served by actively incorporating policies and procedures into the test development process that are specifically designed to create equivalent test forms.
A Quick Note Regarding Error
When a new form is developed, we often operate under the assumption that a single score exists on the new form that reflects the same level of knowledge as the passing score on the previous form. In other words, there is a true (albeit unknown) passing score on the new form that best maintains the passing standard across forms. All of the approaches above can be used to establish the passing score on the new form, and depending on the specific situation, each approach is more or less likely to produce a new form passing score that matches the true passing score. In this context, error can be considered the likelihood any particular method has of producing a passing score on the new form that is different from the true passing score.
The standard error of equating (SEE), for example, is a statistical index that tells us how much uncertainty exists in the equated scores when an equating analysis is performed. SEE can be computed for all possible score points, including the passing score. Certification programs that choose to employ small sample equating should review standard error
30 CLEAR EXAM REVIEW n SUMMER 2016
of equating estimates, especially at the passing score, in order to make objective judgments about the accuracy of the equating results.
In an ideal situation, a credentialing program would be able to quantify the level of error associated with all approaches under consideration and select the one with the smallest potential for error. Unfortunately, obtaining comparable statistical estimates for the other two approaches mentioned above (i.e., resetting the standard and identity equating) is difficult due to the lack of data that would be needed for that purpose. So it is not always easy or even possible to compare the approaches based on a statistical measure of error. For this reason, it is important to be aware of the relatively small (but hopefully growing) number of psychometric research studies devoted to this topic.
Brief Review of Psychometric Literature
Unfortunately, the psychometric community has not engaged in much research specifically aimed at helping practitioners in selecting the best approach (from the choices listed above) for their small volume programs. Few, if any, studies have compared the effectiveness of the third approach listed above (i.e., actively attempting to build equivalent test forms for identity equating purposes) to either of the other approaches (small sample equating and resetting the standard). The scarcity of research in this area is likely due to the fact that there is very little information available that offers general guidance or specific suggestions for how to develop equivalent forms when reliable statistical data are unavailable, despite the value such information and research would provide.
Resetting the standard is an interesting approach because, although it is viewed as an acceptable option by some psychometricians and other testing professionals, it requires that standard setting methodology be used to accomplish an objective for which it was clearly not intended, namely to maintain a consistent and fair passing standard across multiple forms. At least one recent study compares resetting the standard to small sample equating (Dwyer, 2016), and the evidence within that study strongly suggests that equating with small samples (even with as few as 10 candidates per form) is more effective at maintaining an equivalent passing standard across forms than recruiting a panel of subject matter experts to set a new passing standard on each new form. Another recent study by Clauser, Margolis, and Clauser (2014) documents the inherent unreliability of standard setting ratings. Although the Clauser et al. (2014) study does not mention equating, it provides an explanation of why resetting the standard would
be problematic for the purpose of maintaining an equivalent passing standard across forms.
One area where the research community has been fruitful is in the development and comparison of specific analytic techniques for test equating. Several equating methods have been proposed in recent years that are specifically designed for small sample equating, namely the Circle Arc (Livingston & Kim, 2009) and the Nominal Weights Mean (Babcock, Albano, & Raymond, 2012) equating methods. Although the research is relatively new, these methods appear to be more robust in small sample situations than many other traditional equating methods. Programs that anticipate equating with small samples (e.g., less than 50 candidates per form) would be wise to consider using one of those methods.
General guidance for meeting the requirements of NCCA Standard 21
Generally speaking, a credentialing program should examine the research literature and attempt to form an evidence-based rationale for any and all of its exam-related policies and procedures. In doing so, there is a strong chance that NCCA Standards will be met. With regards to what small-volume programs can do to meet Standard 21 (i.e., ensuring the empirical equivalence of pass/fail decisions via equating), the research literature does not provide as much guidance as one would hope, but there are a few emerging patterns worth noting.
First, unless one can make an argument that new forms are equivalent in difficulty to previous forms (without having reliable statistical information to support that argument), equating with even very small samples (e.g., 10-20 candidates per form) is likely the best choice. Of course, with small sample equating, the standard error of equating may be large, and credentialing organizations should consider this in selecting a passing score. There may be specific circumstances, however, where a program can make a relatively strong argument about the equivalence of new test forms. For example, if only a small percentage of the exam items are replaced on the new form and if a panel of subject matter experts reviews the new items and declares them to be equivalent in difficulty to the replaced items, the claim that the new form is equivalent may be reasonable, and the decision to reuse the previous passing score on the new form may be appropriate.
Much of this article is devoted to programs with small samples, but special consideration needs to be given to programs with no data available for equating purposes. For example, consider a very small program (e.g., 10 candidates per year) that does not administer its exam
OPTIONS FOR ESTABLISHING THE PASSING SCORE ON A NEW TEST FORM FOR SMALL VOLUME PROGRAMS

31CLEAR EXAM REVIEW SUMMER 2016 n
within a specified window of time but instead allows each candidate to schedule her exam date at her convenience (i.e., on-demand testing). In that case, the need to provide examinee scores in a timely manner would preclude the program from considering holding scores until an equating analysis could be performed. Similarly, programs that report test results to candidates upon the completion of their exam do not have data to perform post-hoc equating after a new form has been launched. For programs like those where small sample equating (using actual candidate data) is not an option, the remaining approaches for establishing the new form passing score need to be considered, and a rationale for the selected approach needs to be clearly documented (and communicated to NCCA within the accreditation application).
The selected approach for any small sample testing program will, of course, be situation specific. For some programs, equating with small samples will be most appropriate. For others, it may be most fair to candidates to use identity equating, assuming an argument can be made for the equivalence of new forms. In some cases, the best approach may be to recruit a large sample of current certificants and ask them to take the test forms in order to perform the equating analysis. In the interest of fairness to candidates, it may also be necessary for a program to consider changing other policies (e.g., on-demand testing or immediate score reporting) if it would allow the program to have greater confidence in the equivalence of the pass/fail decisions across test forms. Ultimately, the NCCA’s aim is to ensure all candidates are held to the same standard by requiring credentialing programs to use empirical data (or empirical research-based arguments, in situations where empirical data does not exist) in establishing the passing score for a new test form.
ReferencesBabcock, B., Albano, A., & Raymond, M. (2012). Nominal weights mean equating: A method for very small samples. Educational and Psychological Measurement, 72, 608–628.
Buckendahl, C. W., & Davis-Becker, S. L. (2012). Setting passing standards for credentialing programs. In G. J. Cizek (Ed.), Setting Performance Standards: Concepts, Methods, and Innovations (pp. 485-501). New York: Routledge.
Clauser, J. C., Margolis, M. J., & Clauser, B. E. (2014). An examination of the replicability of Angoff standard setting results within a generalizability theory framework. Journal of Educational Measurement, 51, 127–140.
Dwyer, A. C. (2016). Maintaining equivalent cut scores for small sample test forms. Journal of Educational Measurement, 53, 3-22.
Kolen, M. J., & Brennan, R. L. (2014). Test equating, scaling, and linking: Methods and practices. New York, NY: Springer.
Livingston, S. A., & Kim, S. (2009). The circle-arc method for equating in small samples. Journal of Educational Measurement, 46, 330–343.
National Commission for Certifying Agencies. (2014). Standards for the Accreditation of Certification Programs. Retrieved from http://www.credentialingexcellence.org/p/cm/ld/fid=66.
OPTIONS FOR ESTABLISHING THE PASSING SCORE ON A NEW TEST FORM FOR SMALL VOLUME PROGRAMS
