cleopatra hospitals group
TRANSCRIPT
Cleopatra Hospitals Group Investor Presentation 2Q21

2Cleopatra Investor Presentation 2Q21
Disclaimer
This presentation contains forward-looking statements, including, but not limited to, statements concerning expectations, projections,objectives, targets, goals, strategies, future events, future revenues or performance, capital expenditures, financing needs, plans orintentions relating to acquisitions, competitive strengths and weaknesses, plans or goals relating to financial position and futureoperations and development. Although Cleopatra Hospitals Group believes that the expectations and opinions reflected in such forwardlooking statements are reasonable, no assurance can be given that such expectations and opinions will prove to have been correct. Bytheir nature, these forward-looking statements are subject to a number of known and unknown risks, uncertainties and contingencies,and actual results and events could differ materially from those currently being anticipated as reflected in such statements. Importantfactors that could cause actual results to differ materially from those expressed or implied in forward-looking statements, certain ofwhich are beyond our control, include, among other things: business integration risk; compliance risk; recruitment and retention ofskilled medical practitioners risk: clinical risk; concentration of revenue; currency and macroeconomic; information technology andoperational risk; regional tensions and political risk; and other key factors that we have indicated could adversely affect our business andfinancial performance, which are contained elsewhere in this document and in our past and future filings and reports. No part of theseresults constitutes, or shall be taken to constitute, an invitation or inducement to invest in Cleopatra Hospital Group or any other entityand must not be relied upon in any way in connection with any investment decision. Cleopatra Hospital Group undertakes no obligationto update any forward-looking statements, whether as a result of new information, future events or otherwise, except to the extentlegally required. Nothing in this document should be construed as a profit forecast
CONTENTS
1
2
3
4
5
Unique Investment Story
Performance Review
Business Updates
Governance & Shareholder Information
Appendix

4Cleopatra Investor Presentation 2Q21
— We put our patients first by providing high quality healthcare services with a focus on patient safety and quality of outcomes while enhancing the quality of life of our patients
— We focus on creating sustainable growth with positive measurable impact on our stakeholders and on society while aiding in the transformation and institutionalization of the Egyptian healthcare sector
— We work with our payor stakeholders in a collaborative partnership model delivering value for service and invocation aiding overall market growth in patient coverage
— We grow by continuously investing in our infrastructure and in medical technology while maintaining a partnership approach with all our stakeholders in collaboration with our healthcare regulator the MoHP
— We strive to be the employer and partner of choice in the growing Egyptian healthcare sector to our employees and doctor consultants through investing in training and technology
— We aim to re-invest our scale synergies in our stakeholders through investing in quality and patient safety and improving service delivery through technology, innovation, and training
Our Mission & Values

5Cleopatra Investor Presentation 2Q21
• Leading integrated healthcare provider in Egypt with track record of acquiring and integrating leading operating hospital assets
• Institutionalizing the healthcare industry in Egypt with a focus on medical quality, value pricing and corporate governance
• Delivering quality healthcare in a safe, reliable and caring environment through investment in people and facil ities
• Significant under supply of beds relative to population and strength of payor network vs. other emerging countries
• Strong market volume growth supported by demographic profile and growing insured population
• While pricing is expected to continue growing inline with inflation it remains well below pre-devaluation levels in USD equivalent
• Group-wide tenders in pharmaceuticals and medical consumables that drive scale cost efficiencies and improve margins
• Scale volume benefits from providing payors with a healthcare services network solution
• Scale in attracting best-in-class doctors, consultants, nurses with a focus on quality of outcomes and patient safety
• Corporate office with matrix organization and centralized strategy management
• CHG has been introducing new functions in the Egyptian Healthcare Industry as it works to further institutionalize healthcare management in the country
• Diverse industry experience and multi disciplinary approach to healthcare management
A Unique Investment
Story
A Unique
Investment Story
A Unique Investment Story

6Cleopatra Investor Presentation 2Q21
• Cleopatra Hospitals Group is Egypt’s first and largest private hospital group by number of hospital beds and operating hospitals and consists of six operational hospitals and two polyclinics in addition to a leading IVF Centre all in Cairo. The Group’s network includes:i. Cleopatra Hospital (100.0% ownership)
ii. Nile Badrawy Hospital (99.9% ownership)
iii. Al Shorouk Hospital (100.0% ownership)
iv. Cairo Specialized Hospital (56.5% ownership)
v. Queens Hospital (100.0% ownership)
vi. Al Katib Hospital (100.0% ownership)
vii. Bedaya IVF Centre (60% ownership)
• Since inception, the Group has revolutionized the Egyptian healthcare industry by bringing high quality, integrated healthcare solutions to a growing number of patients across a constantly expanding geographical footprint.
• Around 75% of revenue generated from insured & contract patients Around 75% of CHG’s revenue is generated from hospital-focused services
18%
10%
27%12%
7%
3%
8%
4%
11%
Inpatients
Surgeries
Outpatient Cl inics
Laboratory Services
Cardiac
Catheterization
ER
Radiology
1,000Consultant physicians attracted from the top two medical universities
+4600+2800 medical staff including c. resident doctors and c. 1100 nursing staff
Outpatient Pharmacy
A Diversified Healthcare Services Group
6 Hospitals • 782 Beds • 150 fully equipped
ICU Beds • 6 Cath Labs • Full Comprehensive
Specialty Coverage
2 PolyclinicsOffering comprehensive outpatient and full array diagnostic services in addition to home visits
+1 New Polyclinic adjacent to Al Shorouk hospital, housing the hospital’s outpatient services
Bedaya IVF 1 Operating facility with 19 beds – acquired in 4Q2020
Expansion with 1 new facility as IVF and Gyna COE - 2021
Other

7Cleopatra Investor Presentation 2Q21
CHG commenced operations of its polyclinic feeder network; East Cairo polyclinic was operational as of Q1 2019 and West Cairo Polyclinic was operational as of Q2 2019
CHG signed a definitiveagreement to acquire ElKatib hospital in WestCairo as of September 2017
CHG acquired and began operating Queens hospital as of March 2019 and is currently being operated as one of the Group’s COVID designated facilities
CHG signed a Letter of Intent in June 2019 to acquire a 19- bed specialized IVF center located in the heart of Cairo and a 160+ bed hospital located to the north of Cairo
The first asset and the Group’s Flagship hospital, Cleopatra Hospital, was acquired early 2014
The Group’s 2nd asset, Cairo Specialized Hospital, was acquired in July 2014
CHG acquired Nile Badrawi Hospital in October 2015
Al Shorouk Hospital was
acquired in January 2016
2014 2016 2018 20192015 2017
CHG becomes the 1st
Hospitals Group to be listed on the EGX
CHG took over day-to-day
operations at El-Katib Hospital in November 2019, and is currently being operated as one of the Group’s COVID designated facilities
1 3 5
2 4
2020
CHG enters into a JV agreement with EHFS
Bedaya IVF Center commenced operations
The Evolution of CHG from a Single Asset into one of the Largest Hospital Platform in the Region
6
CHG’s Journey History & Timeline

8Cleopatra Investor Presentation 2Q21
Cleopatra Hospitals Group, is the largest private hospital group in Egypt by number of beds and operating hospitals with a broad network coverage across Greater Cairo
Providing high quality and affordable care to
c. 1 mn patients a year
Leveraging a growing footprint, CHG continues to penetrate new segments of the population and provide high quality care to currently underserved areas of Greater Cairo
494 thousand
Cases Served*in H12021
23 thousand
Inpatientsin H12021
17 thousand
Surgeries Performedin H12021
368 thousand
Outpatient Visitsin H12021
956 thousand
Diagnostic Tests** Performed in H12021
*Cases served includes number of in-patients, outpatient visits and ER visits; * * Diagnostic Tests include Laboratory and Radiology tests conducted
10
6 th October location 2021
9
Broad Network Coverage in Greater Cairo

9Cleopatra Investor Presentation 2Q21
Note: contributions based on 2Q2021 revenues, ** Calculated by subtracting revenues of polyclinics, diagnostics and pharmacy services from total revenues for 1Q2021, ***5 Year forecast growth rates refers to revenue growth for the vertical
CHG reports strong revenue growth in 2Q2021 and 1H2021 supported by growing volumes and improving utilization rates across all its facilities
New Revenue Stream as of Q4 2020
HOSPITALS*
73%
CHG operates six leading hospitals across the Greater Cairo Areanearly 1 million cases in 2020
CHG faci lities offer a full roster of medical services with each facility
housing multiple Centres of Excel lence
2Q2021 Performance Broad-based recovery across all
faci lities and service portfolio drivingan 84% y-o-y expansion in revenue generated by the hospitals vertical
EGP 471.4 mn2Q2021 Revenues**
(18% - 2017-20 CAGR)
5-year growth forecast15%-20% CAGR
POLYCLINICS
3%
CHG operates two polyclinics located in strategic neighborhoods
of East and West Cairo. A new polycl inic-like facility in the
bui lding adject to Al Shorouk Hospital has been rolled out this
quarter
2Q2021 Performance +204% y-o-y revenue growth+176% y-o-y volume growth
EGP 10 mn in referrals to CHG main hospitals in 1H2021
EGP 17.9 mn2Q2021 Revenues
+125% Top-line Growth vs 1H20
5-year growth forecast25%-30% CAGR
DIAGNOSTICS
20%
CHG operates a Radiology services throughout its facilities with a CoE
at i ts Cairo Specialised Hospital, l inked via PACS system
CHG offers Laboratory services on an in and outpatient basis,
al lowing it to s tand out from other competitors in the field
2Q2021 Performance 90% y-o-y laboratory revenue
growth34% y-o-y radiology revenue
growth
EGP 126.6 mn2Q2021 Revenues
(24% - 2017-20 CAGR)
5-year growth forecast20%-25% CAGR
OUTPATIENTPHARMACY
4%
CHG currently operates two pharmacies located in its polycl inics as well as four
outpatient pharmacies across its network of hospitals. The Group’s
strategy focuses on growing volumes through scale and reach
of i ts patient base and accessibility
2Q2021 Performance 128% y-o-y growth in outpatient
pharmacy revenue
EGP 27.6 mn2Q2021 Revenues
(23% - 2017-20 CAGR)
5-year growth forecast25%-30% CAGR
IVF
In September 2020, CHG s igned a Bus iness Transfer Agreement (BTA)
to transfer the assets and operations of Bedaya for Medical Services, Egypt’s leading Assisted
Reproductive Technology (ART) and fertility centre led by Dr. Ismail Aboul Foutouh, to a joint venture
(JV) held for 60% by Cleopatra Hospitals Group and for the
remaining 40% by Dr. Aboul Foutouh.
35%+ Post-ramp up EBITDA margin
5-year growth forecast30%-35% CAGR
2%2Q21 contribution to revenue
Diversified Service Offering and Revenue Stream

10Cleopatra Investor Presentation 2Q21
Integration, Optimization of
Operations
Integrating the platform to achieve higher efficiencies
Enhancing utilization and optimizing existing capacity while expanding capacities and feeder network
Integrating Cleopatra branding, sales and marketing approach
Leveraging payor and supplier relationships
Establish centers of excellence and achieve international accreditation
Group-wide digital transformation
Geographic expansion in Egypt linked to following
the main payor relationships to
meet their network needs
Optimize operations and management
Standardize and improve quality
Stronger bargaining power
Attract highly qualified medical staff
Shared cost benefitsEstablish Centres of
Excellence
Enhance marginsEstablish partnerships
with leading companies
Integration and
Optimization of Operations
Clearly Defined Core Growth Strategy
11Cleopatra Investor Presentation 2Q21
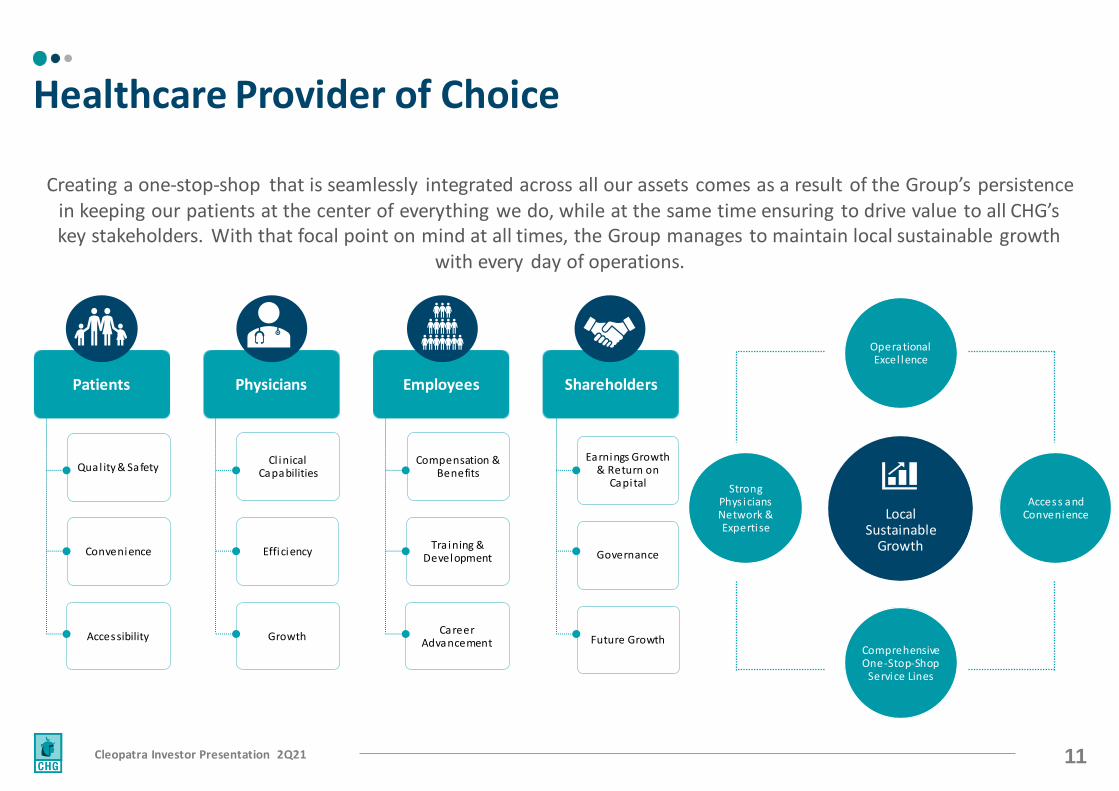
Creating a one-stop-shop that is seamlessly integrated across all our assets comes as a result of the Group’s persistence in keeping our patients at the center of everything we do, while at the same time ensuring to drive value to all CHG’s key stakeholders. With that focal point on mind at all times, the Group manages to maintain local sustainable growth
with every day of operations.
Local Sustainable
Growth
Operational Excel lence
Access and Convenience
Comprehensive One-Stop-Shop
Service Lines
Strong Phys icians Network & Expertise
Patients
Qual ity & Safety
Convenience
Accessibility
Physicians
Cl inical Capabilities
Efficiency
Growth
Employees
Compensation & Benefits
Tra ining & Development
Career Advancement
Shareholders
Earnings Growth & Return on
Capital
Governance
Future Growth
Healthcare Provider of Choice

12Cleopatra Investor Presentation 2Q21
Having been the amongst the first private healthcare providers to recognize the attractiveness of the Egyptian healthcare industry, the Group has played a central role in institutionalizing the sector and promoting its growth
and development over the years
Efficiency in Business Operations
Drive Growth
Speed to Market
Support Execution
Capital Resources Economies of
Scale & Integration
Base of Patient Volumes
Leadership and Governance
Innovation
First Movers Advantage
CHG was the first to introduce a 360-degree integrated management framework to oversee its operations, allowing the Group to consistently improve the quality of its services and patient experience while driving efficiency
enhancements throughout its constantly expanding facility network
Sources of Differentiation

13Cleopatra Investor Presentation 2Q21
EGP 643.6 mnConsolidated revenues in 2Q21
+89% y-o-y
↑72%Year-on-year growth in cases served for 2Q2021, with all segments returning to year-on-year growth
Cleopatra Hospitals Group continued to build on a strong start to the year, and in the second quarter of 2021 posted another set of record-breaking results supported by healthy volume growth.
As in the previous quarter, all our facilities witnessed strong growth, with CHG’s more established hospitals recording their highest-ever revenue for a single quarter during 2Q2021.
Moreover, the Group’s consolidated performance was boosted by remarkable results recorded at its polyclinics, which continue to outperform our expectations, and at its two COVID-19-dedicated hospitals, which witnessed steady demand as the country tackled its third wave of infections during the second quarter.
Further down the income statement, CHG continued to record strong growth with expanding margins at all levels of profitability as our Group-wide revenue growth and cost optimisation efforts continue to bear fruit.
249,870Cases served3 in 2Q21
EGP 171.6 mnEBITDA2 in 2Q21 with a
27% Margin, +292% y-o-y
EGP 199.2 mnAdjusted EBITDA1 in 2Q21 with a
31% Margin, +251% y-o-y
EGP 239.5 mnGross profit margin in 2Q21 with a
37% Margin, +149% y-o-y
1 Adjusted EBITDA: Earnings before Interest, Tax, Depreciation and Amortization adjusted for provisions, impairments, LTIP, acq uisitions expenses, pre-operating expenses and excluding contributions from other income.2 EBITDA does not adjust for impairments booked during the period.3 Cases served includes number of in-patients, outpatient visits and ER visits.
CHG 2Q2021 Financial Highlights

14Cleopatra Investor Presentation 2Q21
2Q2021 in Review

15Cleopatra Investor Presentation 2Q21
The robust top-line growth was supported by a 72% year-on-year increase in cases served during the quarter coupled with improving utilization rates, an increasingly optimised service mix, and the effective ramp up of the Group’s newer revenue verticals. Solid growth and margin
improvements at all levels of profitability were supported by the Group’s long-term efficiency enhancement strategy coupled with management’s integration and optimisation efforts. Margins recorded in line with the Group’s historical highs and long-term profitability targets.
1 Adjusted EBITDA: Earnings before Interest, Tax, Depreciation and Amortization adjusted for provisions, impairments, LTIP, acquisitions expenses, pre-operating expenses and excluding contributions from other income.
Group Revenue | EGP mn
864
1,127
1,456
1,7981,990
2016 2017 2018 2019 2020
340644
2Q2020 2Q2021
Net Profit | EGP mn
89 118
315265 298
10% 10%
22%15% 15%
2016 2017 2018 2019 2020Net profit Net profit margin
14
944%
15%
2Q2020 2Q2021
Adj. EBTIDA1 | EGP mn
197 259403
502 540
23% 23%28% 28% 27%
2016 2017 2018 2019 2020
Adj. EBITDA Adj. EBITDA Margin
57
199
17%
31%
2Q2020 2Q2021
Gross Profit | EGP mn
252 339514
626 690
29% 30%35% 35% 35%
2016 2017 2018 2019 2020Gross profit Gross profit margin
96
239
28%37%
2Q2020 2Q2021
ROIC & ROE
23%20%
33%
23%20%
27%
15%20% 22%
19%
2016 2017 2018 2019 2020
ROIC ROE
Management is targeting long-term ROIC of 30%
Financial Performance in 2Q2021
16Cleopatra Investor Presentation 2Q21
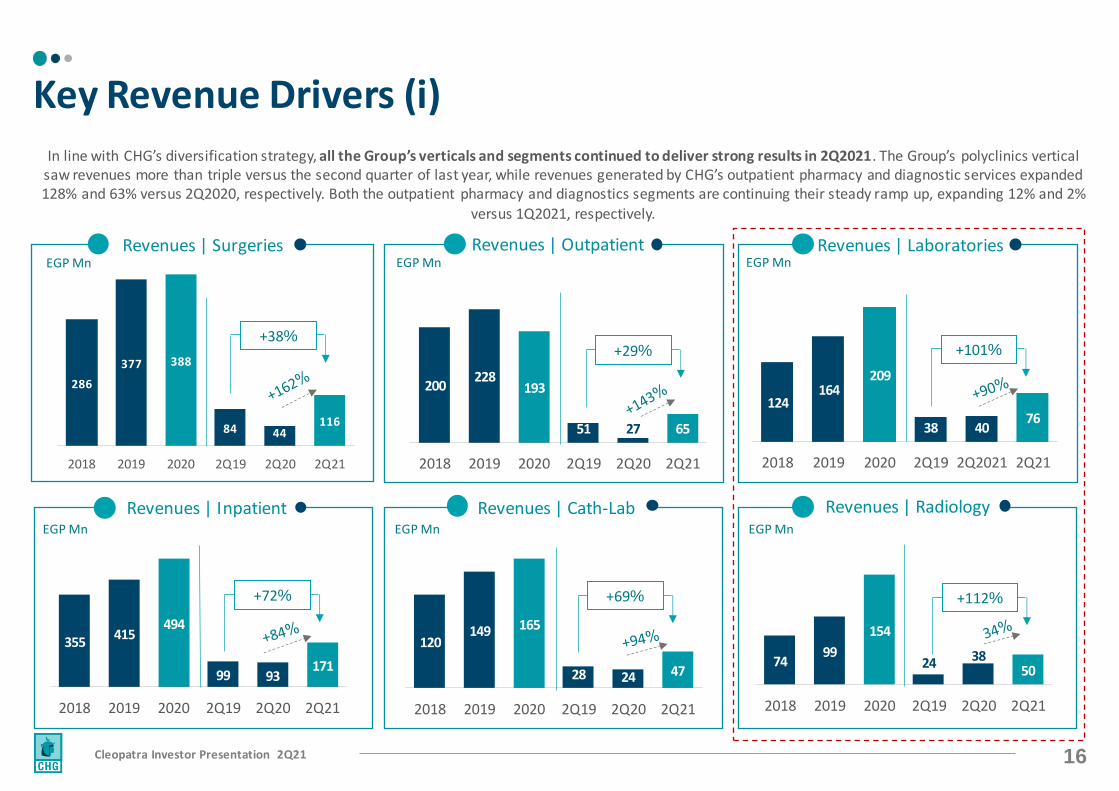
In line with CHG’s diversification strategy, all the Group’s verticals and segments continued to deliver strong results in 2Q2021. The Group’s polyclinics vertical saw revenues more than triple versus the second quarter of last year, while revenues generated by CHG’s outpatient pharmacy and diagnostic services expanded 128% and 63% versus 2Q2020, respectively. Both the outpatient pharmacy and diagnostics segments are continuing their steady ramp up, expanding 12% and 2%
versus 1Q2021, respectively.
Revenues | Surgeries
286
377 388
84 44116
2018 2019 2020 2Q19 2Q20 2Q21
+38%
Revenues | Inpatient
Revenues | Outpatient
Revenues | Cath-Lab
Revenues | Laboratories
Revenues | Radiology
EGP Mn
200228
193
51 27 65
2018 2019 2020 2Q19 2Q20 2Q21
EGP Mn
355415
494
99 93171
2018 2019 2020 2Q19 2Q20 2Q21
EGP Mn
124164
209
38 4076
2018 2019 2020 2Q19 2Q2021 2Q21
EGP Mn
120149 165
28 24 47
2018 2019 2020 2Q19 2Q20 2Q21
EGP Mn
7499
154
24 3850
2018 2019 2020 2Q19 2Q20 2Q21
EGP Mn
Key Revenue Drivers (i)
+72% +69%
+29% +101%
+112%

17Cleopatra Investor Presentation 2Q21
Volumes expanded 72% year-on-year in 2Q2021, with the Group recording its highest ever second quarter number of cases served. In fact, total cases served were up a solid 8% versus the comparable quarter of 2019 (pre-pandemic). Moreover, despite the quarter including the expected
slowdown associated with the holy month of Ramadan and Eid holiday, the Group managed to expand the total number of cases ser ved by 2% versus an already impressive 1Q2021.
Note: Cases served includes number of in-patients, outpatient visits and ER visits.
No. Outpatients | ‘000sARP / Outpatient | EGP
704 649
157 95185
2019 2020 2Q19 2Q20 2Q21
Diagnostic Tests | ‘000
240 230
4975
2019 2020 2Q20 20 2Q20 21
Radiology Tests
No. Inpatients | ‘000sARP / Inpatient | EGP
55
46
13 7 12
2019 2020 2Q19 2Q20 2Q21
No. of Surgeries | ‘000sARP / Surgery | EGP
3930
94
9
2019 2020 2Q19 2Q20 2Q21
No. ER Visits | ‘000sARP / ER Patient | EGP
254208
61 43 53
2019 2020 2Q19 2Q20 2Q21
No. Catherizations | ‘000sARP / Catherization | EGP
4.54.0
0.9 0.6 1.0
2019 2020 2Q19 2Q20 2Q21
1,380 1,309
244409
2019 2020 2Q20 20 2Q20 21
Laboratory Tests
Key Revenue Drivers (ii)
-9%+18%
+10%-13%
-5%
EGP 324EGP 298 EGP 322 EGP 281 EGP 352
EGP 7,578EGP 10,776
EGP 7,762
EGP 13,589
EGP 14,673 EGP 9,657
EGP 12,978EGP
9,304
EGP 11,598
EGP 13,555
EGP 33,080 EGP 40,713EGP
31,475
EGP 42,324
EGP 48,421
EGP 287EGP 323
EGP 290
EGP 406 EGP 385

18Cleopatra Investor Presentation 2Q21
The Group’s two polyclinics continued to witness steady growth throughout the quarter. Strong and steady volume growth displays the effectiveness of the polyclinic model in filling a supply gap for high quality outpatient clinics. Moreover, the two outpatient clinics are also
helping to drive up referrals to the Group’s main hospitals, with total refers in 1H2021 amounting to EGP 10 million. This is also in line with the Group’s one-stop-shop strategy which aims to retain patients for the entire treatment cycle from the initial diagnosis and treatment, all
the way through to providing pharmacy and long-term home care services.
Daily Average Outpatient* Visits at Flagship Hospitals
77% Y-o-YGrowth in average daily outpatients' visits across all facilities
67% Y-o-YGrowth in Laboratory Tests conducted
52% Y-o-YGrowth in Radiology Tests conducted
2.4 days ALOS**At our COVID free hospitals
9 days ALOS**At our COVID hospitals
1,851 1,767
2,000 2,035
1,754
1,027
1,825 1,951
1,785 1,762
1Q2019 2Q2019 3Q2019 4Q2019 1Q2020 2Q2020 3Q2020 4Q2020 1Q2021 2Q2021
Covid19 Wave 1
Covid19 Wave 2
Daily Average Outpatient* Visits at both Polyclinics
-
93 109
160 174
107
224
276 272 273
1Q2019 2Q2019 3Q2019 4Q2019 1Q2020 2Q2020 3Q2020 4Q2020 1Q2021 2Q2021
Covid19 Wave 1
Covid19 Wave 2
*Outpatients included are only paid visits and excludes follow-ups ** ALOS are averages across the group’s facilities
Patient Volumes Recovery

19Cleopatra Investor Presentation 2Q21
17
9
75
81 70 6
133
57
57
61
27
7
283
92
113
93
36
26 10
Cleopatra Hospital* Nile Badrawi Hospital Cairo Specialized Hospital Al-Shorouk Hospital El Katib Hospital Polyclinics** New Bedaya (IVF)
2Q2019
2Q2020
2Q2021
Top-line growth came on the back of strong performances recorded by all the Group’s more established facilities and was further bolstered by remarkable results posted by the Group’s polyclinics and COVID-19-dedicated facilities, both of which continue to record robust demand during the quarter. It is worth
noting that, COVID-19-related revenue made up less than 14% of consolidated Group revenue during the quarter.
Revenue Contribution by Hospital | 2Q2020
2Q Revenue Progression by Hospital | EGP mn
43%
14%
17%
14%
5%4% 2%
Cleopatra Hospital*
Nile Badrawi Hospital
Cairo Specialised Hospital
Al Shorouk Hospital
El Katib Hospital
Polyclinics**
Bedaya (IVF)
39%
17%
17%
18%
8% 2%Cleopatra Hospital*
Nile Badrawi Hospital
Cairo Specialised Hospital
Al Shorouk Hospital
El Katib Hospital
Polyclinics**
*Cleopatra Hospital includes contributions from Queens Hospital of EGP 11.1 million in 2020 and EGP 53.7 million in 2021.**Polyclinics revenues include revenues from the Group’s East and West Cairo Polyclinics as well as CHG Pharma.
Group Revenue Contribution in 2Q2021
Revenue Contribution by Hospital | 2Q2021

20Cleopatra Investor Presentation 2Q21
493
677 764 808
179 133 283
187 281 318 349
65 51 130
2017 2018 2019 2020 2Q19 2Q20 2Q21
Revenue Gross Profit
46%42%41%
38% 36%
191
255
301 320
70 61 93
42 69 87 92 18 15 29
2017 2018 2019 2020 2Q19 2Q20 2Q21
Revenue Gross Profit
31%29%27%
22%25%
202
257
323 338
75 57 9251 88 107 100 24 11 28
2017 2018 2019 2020 2Q19 2Q20 2Q21
Revenue Gross Profit
30%33%34%25%
32%30%19%
244 287
374 365
81 57 11369 87
129 112 26 13 36
2017 2018 2019 2020 2Q19 2Q20 2Q21
Revenue Gross Profit
32%34%30%28% 32%
43%31%
29%
Cleopatra Hospital (CHC) Cairo Specialized Hospital (CSH)
Nile Badrawi Hospital (NBH) Al Shorouk Hospital (ASH)
Financial Performance by Hospital (i)
38% 23%
26%

21Cleopatra Investor Presentation 2Q21
6 7
26
3
2Q19 2Q20 2Q21
Revenue Gross Profit
13
34
49 54
21 27 30
3Q20 4Q20 1Q21 2Q21
60
23
2020
Revenue Gross Profit
17
124
5 46
2019 2020
Revenue Gross Profit
35%37%
29%
41%
25
59
2019 2020
-36%
29%
Al- Katib Hospital (KHC) Queens Hospital (QHC)
East & West Polyclinics*
Financial Performance by Hospital (ii)
*Polyclinics revenues include revenues from the Group’s East and West Cairo Polyclinics as well as CHG Pharma.
56%
62%
-24%
17
27
37
5 11
13
4Q19 2Q20 2Q21
38%55%
-27% -67% -71%
12%
+315%+185%

22Cleopatra Investor Presentation 2Q21
The Group build on an already strong start to the year and in 2Q2021 reported a record -high top- and bottom-line performance. This was supported by the full recovery of patient volumes which returned to robust year-on-year growth and exceeded pre-COVID-19 levels alongside the strategic initiatives rolled out by the
Group to improve utilization rates, enhance its service mix, and drive additional costs saving and operation efficiencies.
Group Revenue Trend
Q1 2018 Q2 2018 Q3 2018 Q4 2018 Q1 2019 Q2 2019 Q3 2019 Q4 2019 Q1 2020 Q2 2020 Q3 2020 Q4 2020 Q1 2021 Q2 2021
The Group closed 2018 with solid growth in revenue on a
full year basis of 29% Y-o-Y, as well as on a quarterly basis of
27% Y-o-Y
Rebound of Performance to Pre-
COVID levels with 16% growth
Y-o-Y Growth momentum
maintained in the first quarter of 2020
reaching 21% vs. last year pre-COVID
The Group closed 2020 with 19% growth Y-o-Y on a quarterly basis and 11% Y-o-Y on a full year basis. The Group’s growth trajectory was maintained in Q1 2021 as patient volumes continued to recover,
recording 26% growth Y-o-Y
Short-term decrease in patient volumes following wave 1 of
COVID-19
2019 being the last COVID-free year, the Group recorded full year revenue growth of 23% Y-o-Y, as well on a quarterly basis
of 30% Y-o-Y
Positive growth trajectory maintained
for the first half of 2021, marking 51%
growth when comparing H1 2021
vs. H1 2020 and 55% when comparing H1
2021 vs H1 2019
Group Revenue Trend

23Cleopatra Investor Presentation 2Q21
The Group build on an already strong start to the year and in 2Q2021 reported a record -high top- and bottom-line performance. This was supported by the full recovery of patient volumes which returned to robust year-on-year growth and exceeded pre-COVID-19 levels alongside the strategic initiatives rolled out by the
Group to improve utilization rates, enhance its service mix, and drive additional costs saving and operation efficiencies.
Half-year Performance Review (1H2021 vs 1H2020 vs 1H2019)
825 8431,277
1H2019 1H2020 1H2021
51%
Revenue | EGP mn
+55%
Gross Profit, GPM| EGP mn, %
285 267481
35% 32%38%
1H2019 1H2020 1H2021
80%
+69%
Adj. EBITDA, margin | EGP mn, %
217 193
399
26%23%
31%
1H2019 1H2020 1H2021
107%
+84%
Net Profit, NPM| EGP mn, %
98 102202
12% 12%
16%
1H2019 1H2020 1H2021
98%
+107%
EGP mn 1H2019 1H2020 1H2021% change 1H2020 vs
1H2021CAGR 1H2019-1H2021
Revenue 825.0 843.1 1,276.8 51% 16%
Gross Profit 284.9 267.4 480.7 80% 19%
Gross Profit Margin 35% 32% 38% 6 pts
Adjusted EBITDA 217.4 193.4 399.4 107% 22%
Adj. EBITDA margin 26% 23% 31% 8 pts
Net Profit 97.7 102.0 202.0 98% 27%
Net Profit Margin 12% 12% 16% 4 pts
Half-year Summary Income Statement

24Cleopatra Investor Presentation 2Q21
Medical & Renovation Capex:• Investments need to refurbish/enhance
recently added facilities (Queens EGP 70mn in 2020, El Katib EGP 30mn in 2020, and Polyclinics EGP 30mn per site
• Bani Suef EGP 320mn between 2020 and 2021
Medical & Renovation Capex:• Investments Across the 4 Organic
Hospitals 125
160
358
408
128
143
160
115
2 0 1 7 2 0 1 8 2 0 1 9 2 0 2 0 2 0 2 1 Y T D
Organic Capex Expansion Capex Acquistions
Capex Investments
Organic Capex
Expansion Capex
Acquisition Investments:• El Katib (143mn Propco & 135mn Opco) • Queens (25mn Opco) • IVF (2020) EGP 115mn
Acquisitions
Capex Profile

25Cleopatra Investor Presentation 2Q21
2021 in Review

26Cleopatra Investor Presentation 2Q21
Hospital Renovations
Inpatient wards renovations
ongoing across all hospitals
Electromechanical upgrades across all
hospitals
Upgraded all medical equipment
ICU/CCU renovation and
system upgrades
Operating rooms renovations and
technical upgrades
CSH : Renovations 2 floors
Queens Hospital total renovation
project (currently put on hold as
facil ity is used for COVID-19 patients)
New Cath labs across NBH, Al Shorouk and
Cleopatra Hospitals
Facil ity Management
outsourcing via JV EHFS, rolled out across flagship
hospitals
NBH: 24 new beds (executive floor) began operating
Al ShoroukHospital:
Outpatients Clinics services building
successfully began operations
Renovations, Inaugurations, and Capacities Optimization Across the Group
Capacities Optimization
Inaugurations
CHC: Outpatient clinics renovations and upgrade began
operating
CSH: ER Department
upgraded and began operations
Successful roll out of CHG’s ERP/HIS system “Clinisys”
across all facilities.
Bedaya Satell ite clinics roll out across group
facil ities
Ongoing exploration of
M&A opportunities for expansion of
hospitals’ verticals and facil ities

27Cleopatra Investor Presentation 2Q21
Inpatient Services
The Group has completed the renovations of Nile Badrawi Hospital’s tenth and eleventh floors which now feature 24 modern and fully equipped patient suites.
Nile Badrawi – Upgrading Quality of Service Offerings
10th & 11th floor expansion (24 beds)

28Cleopatra Investor Presentation 2Q21
The Group has successfully launched Al Shorouk Hospital’s new outpatient clinics, that are located adjacently to the hospital’s premises. Housing the hospital’s outpatient clinics services, we have opened up more space within the
hospital’s main building allowing for further bed expansions for inpatients of at least 20 more beds.
Al – Sherouk Outpatient Clinics Inauguration & Capacity Optimization
Outpatient Services

29Cleopatra Investor Presentation 2Q21
The Group has completed the renovations of Cleopatra Hospital’s outpatient clinics, meeting the Group’s premium standards. We are currently studying further optimization strategies within the hospital, in addition to the complete
overhaul of the facilities exterior.
Cleopatra Hospital – Outpatient Clinics Renovations & Capacity Optimization
Outpatient Services

30Cleopatra Investor Presentation 2Q21
In line with the Group’s strategy to position the hospital as a state-of-the-art Trauma Center of Excellence, setting a new standard of excellence, we began operating the recently renovated world-class Emergency Room. We have also
managed to complement it with the latest diagnostics technologies the market has to offer.
Cairo Specialized Hospital – Emergency Room & Diagnostics Renovations & Capacity Optimization
Emergency Room & Radiology Departments Upgrades
31Cleopatra Investor Presentation 2Q21
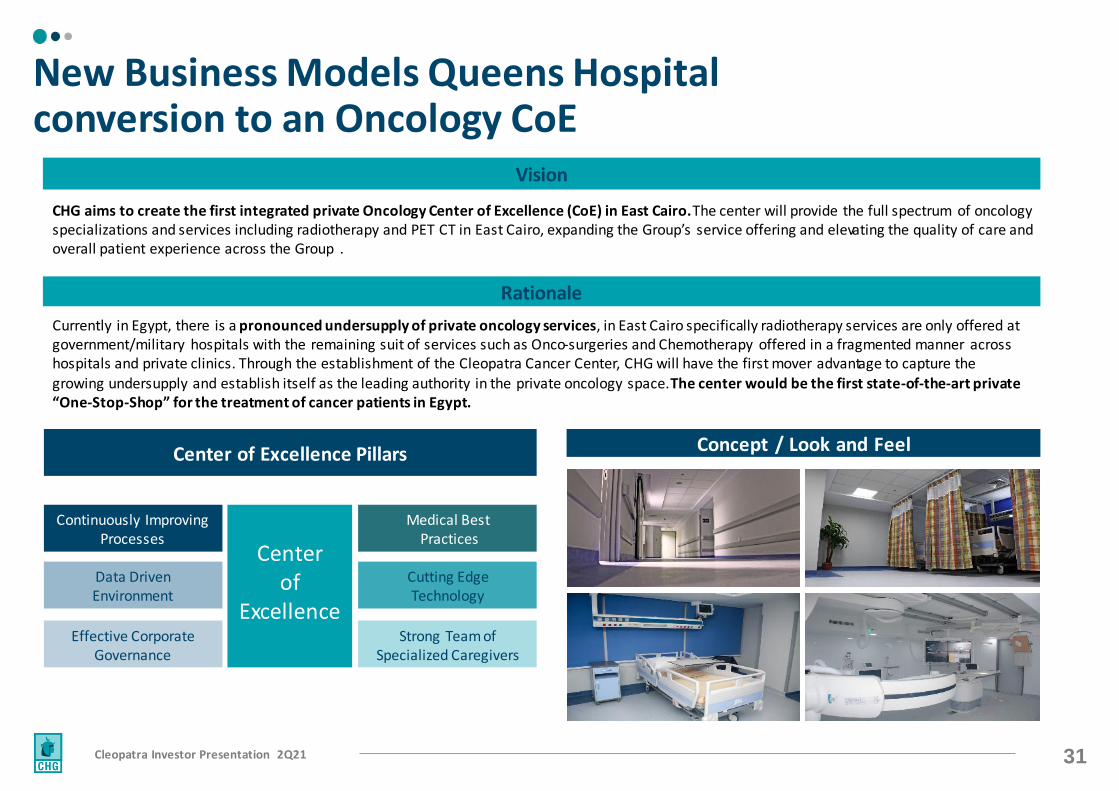
CHG aims to create the first integrated private Oncology Center of Excellence (CoE) in East Cairo. The center will provide the full spectrum of oncology specializations and services including radiotherapy and PET CT in East Cairo, expanding the Group’s service offering and elevating the quality of care and overall patient experience across the Group .
Vision
Concept / Look and Feel Center of Excellence Pillars
Currently in Egypt, there is a pronounced undersupply of private oncology services, in East Cairo specifically radiotherapy services are only offered at government/military hospitals with the remaining suit of services such as Onco-surgeries and Chemotherapy offered in a fragmented manner across hospitals and private clinics. Through the establishment of the Cleopatra Cancer Center, CHG will have the first mover advantage to capture the growing undersupply and establish itself as the leading authority in the private oncology space. The center would be the first state-of-the-art private “One-Stop-Shop” for the treatment of cancer patients in Egypt.
Rationale
New Business Models Queens Hospital conversion to an Oncology CoE
Center of
Excellence
Continuously ImprovingProcesses
Data DrivenEnvironment
Effective CorporateGovernance
Medical BestPractices
Cutting EdgeTechnology
Strong Team of Specialized Caregivers
32Cleopatra Investor Presentation 2Q21
Governance & Shareholder Information
33Cleopatra Investor Presentation 2Q21
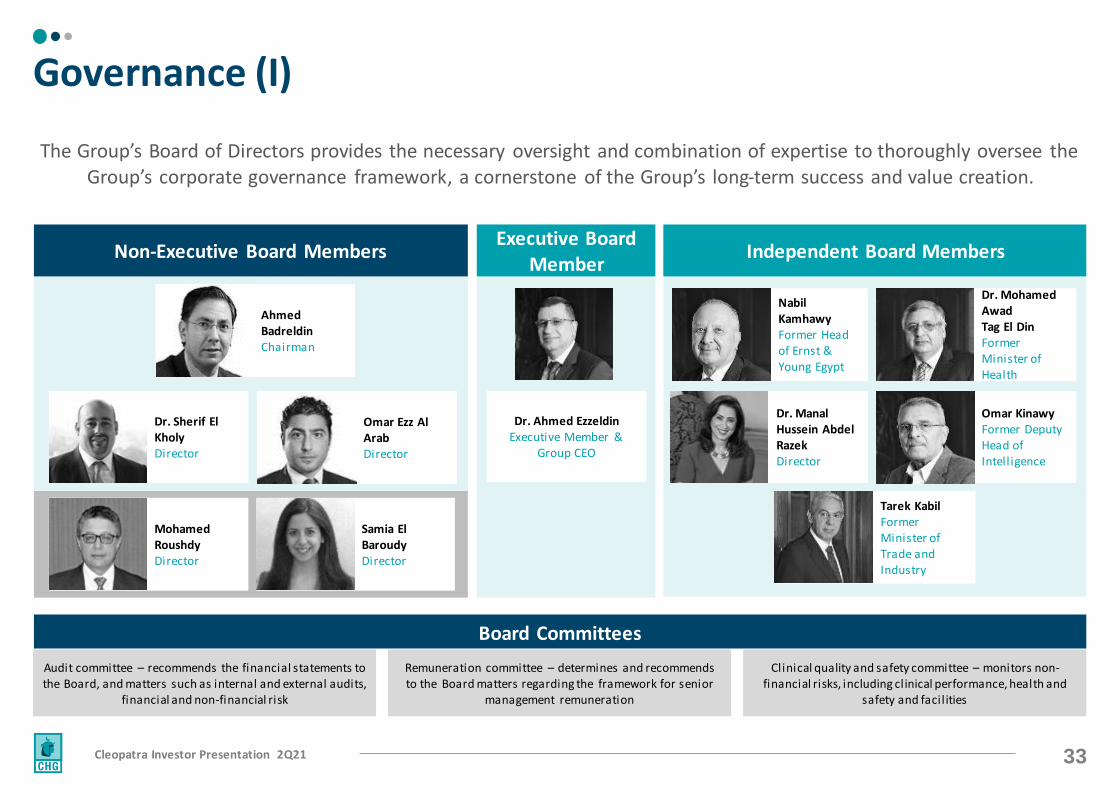
Non-Executive Board Members Independent Board Members
Nabil KamhawyFormer Head of Ernst & Young Egypt
Dr. Mohamed Awad Tag El DinFormer Minister of Health
Dr. Ahmed EzzeldinExecutive Member &
Group CEO
Executive Board Member
Ahmed BadreldinChairman
Omar Ezz Al ArabDirector
Dr. Sherif El KholyDirector
Samia El BaroudyDirector
Mohamed RoushdyDirector
The Group’s Board of Directors provides the necessary oversight and combination of expertise to thoroughly oversee the Group’s corporate governance framework, a cornerstone of the Group’s long-term success and value creation.
Omar KinawyFormer Deputy Head of Intell igence
Dr. Manal Hussein Abdel RazekDirector
Board Committees
Audit committee – recommends the financial statements to the Board, and matters such as internal and external audits,
financial and non-financial risk
Remuneration committee – determines and recommends to the Board matters regarding the framework for senior
management remuneration
Clinical quality and safety committee – monitors non-financial risks, including clinical performance, health and
safety and facil ities
Tarek KabilFormer Minister of Trade and Industry
Governance (I)

34Cleopatra Investor Presentation 2Q21
OPERATIONS
BOARD COMMITTEES
• CHG has a zero-tolerance approach to bribery and corruption with a clear anti -bribery and anti -corruption policy for all stakeholders to abide by
• CHG follows all applicable local laws and more stringent international frameworks to ensure that there are no facil itation or bribery payments made
• CHG does not pay any referral fees or kickbacks to physicians and instead has recently developed a Doctor Sales team to revolutionize the sector in Egypt
• The sales team focuses on improving the hospital service to the physician and maintains close communication - improving loyalty and engagement
• CHG recently launched a group-wide medical council with multiple responsibilities – including (1) ensuring that medical personnel are providing the best medical care and outcomes for their patients (2) keeping CHG at the forefront of medical research and technology across all relevant services
ABC No Referral Fees Medical Council
• The Audit Committee oversees the Group’s financial controls with emphasis on: (1) integrity of internal controls and financial reporting; (2) performance of the internal auditors and the function (3) review of audited financials and external auditor performance (4) compliance with legal and regulatory requirements
• The remuneration committee has established a formal and transparent process for fixing and reviewing the remuneration for the senior executives of the Company
• The remuneration committee also reviews KPIs and achievement of the Group’s targets
• The Quality and Medical Ethics Committee reviews the quality of care provided to the patient as well as medical KPIs for the Group in l ine with international standards
• The committee reports to the board compliance with the Group’s Quality manuals and realization of medical outcomes
Audit Committee Remuneration Committee Quality & Medical Ethics Committee
Governance (II)
35Cleopatra Investor Presentation 2Q21
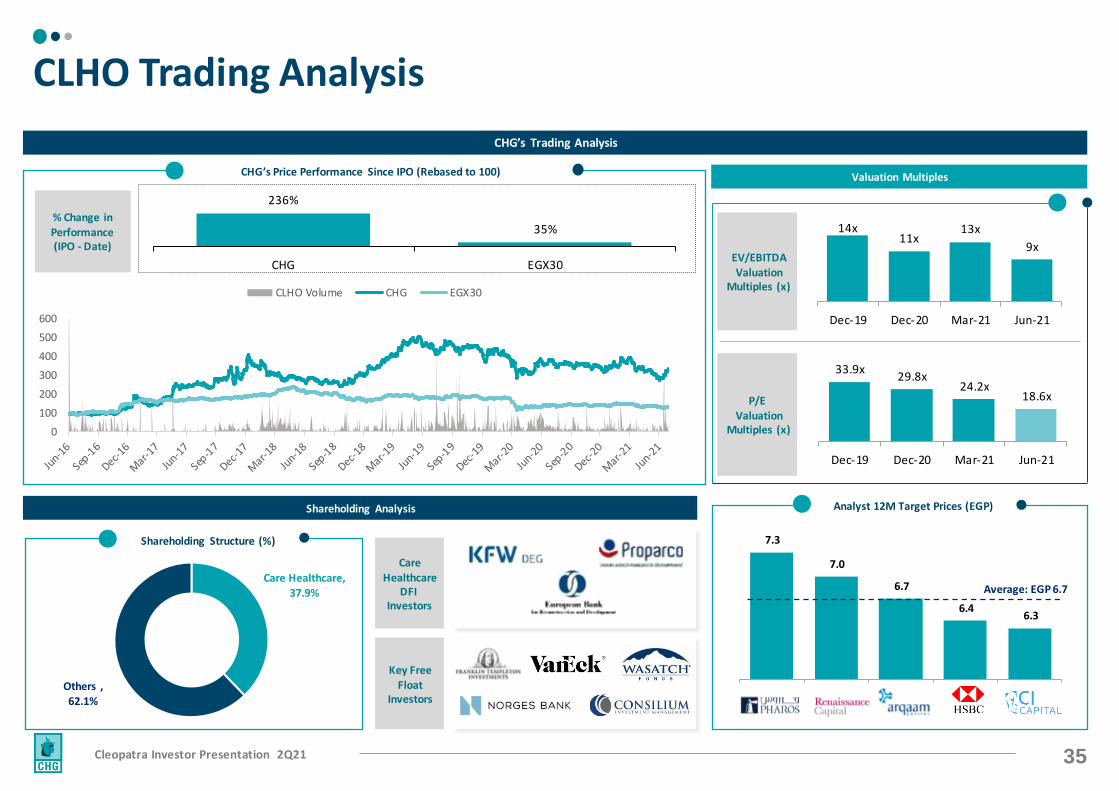
236%
35%
CHG EGX30
Care Healthcare, 37.9%
Others , 62.1%
Valuation Multiples
Shareholding Analysis Analyst 12M Target Prices (EGP)
CHG’s Trading Analysis
% Change in Performance (IPO - Date)
Care Healthcare
DFI Investors
Key Free Float
Investors
EV/EBITDA Valuation
Multiples (x)
P/E Valuation
Multiples (x)
7.3
7.0
6.7
6.4 6.3
Pharos Rencap ArqaamCapital
HSBC CI Capital
Average: EGP 6.7
0
100
200
300
400
500
600
CLHO Volume CHG EGX30
CLHO Trading Analysis
CHG’s Price Performance Since IPO (Rebased to 100)
Shareholding Structure (%)
33.9x29.8x
24.2x18.6x
Dec-19 Dec-20 Mar-21 Jun-21
14x11x
13x
9x
Dec-19 Dec-20 Mar-21 Jun-21

36Cleopatra Investor Presentation 2Q21
Appendix

37Cleopatra Investor Presentation 2Q21
CHG response protocol was developed to ensure the health and safety of its patients and staff while guaranteeing the quality and effectiveness of its medical care despite the ongoing difficulties.
Health and Safety Business Continuity
From the very beginning, the Group’s number one priority has been guaranteeing the safety and wellbeing of its staff, both medical and non-medical, and of its patients and their
families. Across all eight of the Group’s medical facilities and offices, health and safety protocols have been tightened, with additional measures including:
In parallel, the Group has enhanced its Hospital Incident Command System to guarantee CHG’s ability to adapt to the evolving COVID-19 situation from an operational point of view.
As of today, measures include:
Daily deep cleaning and steril ization of all medical
and non-medical facil ities.
Provision of necessary Personal Protective
Equipment (PPE) for all staff and patients.
Strict internal hygiene and sanitization
protocols for all medical staff, patients, and
visitors.
Infrared temperature screening at all group
hospital entrances.
Switch to facial recognition and away
from fingerprint identification across all
CHG facil ities.
New patient engagement and visitor management
protocols to minimize the risk of exposure.
New ER and outpatient clinic protocols to ensure prompt detection, isolation, and referral of all potential COVID-19-positive patients.
The draw up of an emergency staffing plan to ensure the Group can meet
round-the-clock staffing needs.
Back-office contingency planning to ensure business continuity.
Engagement programme with the Group’s consultants to address any needs or concerns that may arise.
Supply chain and inventory management protocols to ensure the availability of all necessary medical supplies and avoid disturbances to
operations.
Transformation of El Katib and Queens Hospitals into COVID-19-dedicated facilities to isolate potential positive and confirmed COVID-19 patients and allow the remaining
facil ities to continue to operate normally.
COVID-19 Response Protocols (I/IV)

38Cleopatra Investor Presentation 2Q21
Back office & Operations Medical Council Responsibilities
BC
P K
ey
Pill
ars
“To
Ad
op
t an
d A
gile
D
ecis
ion
-Ma
kin
g M
en
talit
y”
Cash preservation & cost efficiency
Revenue stabilization
Ensuring the safety of our staff and patients
Training Patient Pathway
Disinfection & PPE Space Optimization
Potential COVID-19-Positive Patient Identification and Referral Protocol
Lab Department Protocol:A set of unified tests as per guidelines is done per patient for each patient according to ER Protocol
Radiology Department Protocol:CT Scan done for every patient and reviewed by group of consultants before recommending next steps
Chest Department Protocol: Group of consultants across the group review and recommend next referral point/step across the group around the clock
ICU Department Protocol:ICU protocol to ensure right treatment and diagnostics
COVID-19 Response Protocols (II/IV)

39Cleopatra Investor Presentation 2Q21
Medical Council As demand for private COVID-19 treatment centres increased so did the number of suspected cases approaching CHG hospitals.
In response to this rise, CHG devised a clear strategy to treat and isolate suspected COVID-19-positive patients providing them with high-quality care.
The most significant step was the conversion of two of CHG’s hospitals into COVID-19 isolation facilities, allowing the remaining facilities to continue offering the full suite of services and procedures regularly offered by the Group.
STEP STEP STEP STEP1 2 3 4
Patients flowing into the ER’s of our four core hospitals CHC, CSH, NBH, ASH
Patients are triaged and suspected COVID-19 patients undergo a full assessment including lab tests, chest CT’s, and a swab is taken and sent to MOH for PCR COVID-19 testing
If results are positive and patient is asymptomatic, they are provided with the appropriate guidelines in l ine with MOHP protocols. If the patient requires hospitalization, they are transferred to Queens or El Katib Hospitals and MOHP is informed
Once the MOHP is informed they will either instructed CHG to treat the patient at one of the Group’s COVID-19 facil ities or arrange for the transfer of the patient to a dedicated government-run facil ity
Queens (East Hospital
Referrals)
El Katib(West Hospital
Referrals)
CHC, CSH, NBH, ASH
COVID-19 Response Protocols (III/IV)
40Cleopatra Investor Presentation 2Q21
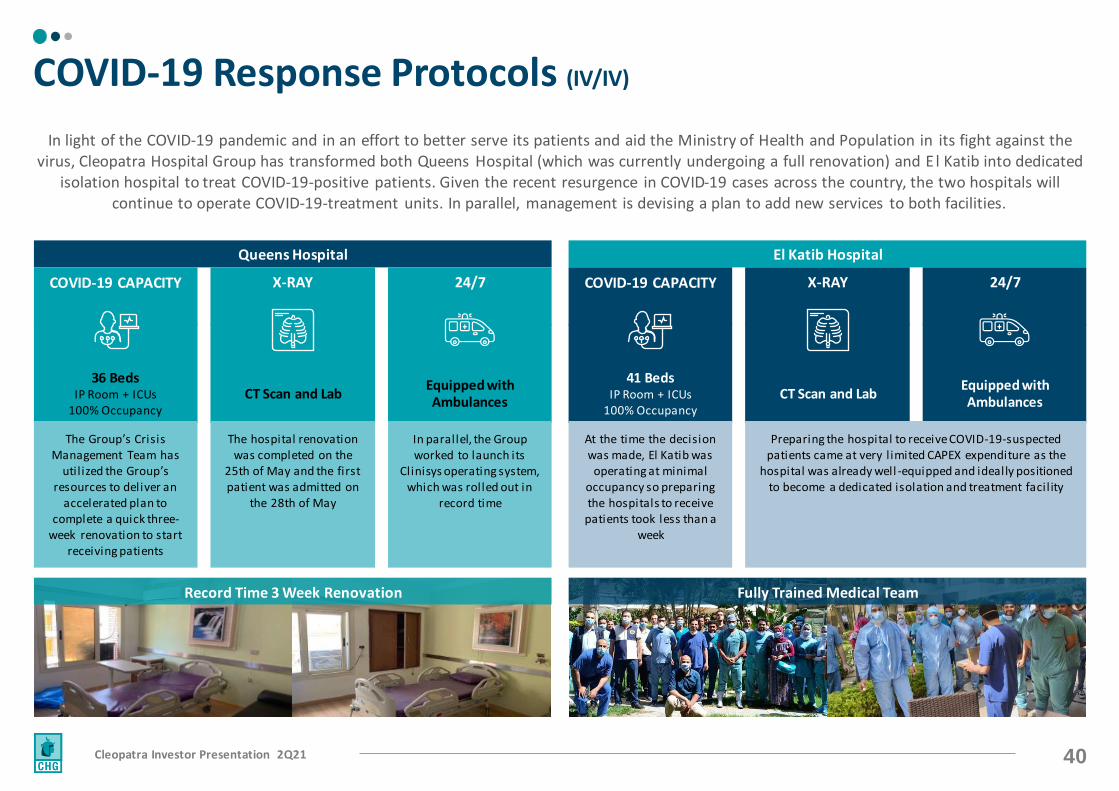
In light of the COVID-19 pandemic and in an effort to better serve its patients and aid the Ministry of Health and Population in its fight against the virus, Cleopatra Hospital Group has transformed both Queens Hospital (which was currently undergoing a full renovation) and E l Katib into dedicated
isolation hospital to treat COVID-19-positive patients. Given the recent resurgence in COVID-19 cases across the country, the two hospitals will continue to operate COVID-19-treatment units. In parallel, management is devising a plan to add new services to both facilities.
Queens Hospital El Katib Hospital
COVID-19 CAPACITY X-RAY 24/7
CT Scan and LabEquipped with Ambulances
36 BedsIP Room + ICUs
100% Occupancy
The hospital renovation was completed on the
25th of May and the first patient was admitted on
the 28th of May
In parallel, the Group worked to launch its
Clinisys operating system, which was rolled out in
record time
The Group’s Crisis Management Team has
utilized the Group’s resources to deliver an
accelerated plan to complete a quick three-
week renovation to start receiving patients
Record Time 3 Week Renovation
COVID-19 CAPACITY X-RAY 24/7
CT Scan and LabEquipped with Ambulances
41 BedsIP Room + ICUs
100% Occupancy
Preparing the hospital to receive COVID-19-suspected patients came at very l imited CAPEX expenditure as the
hospital was already well -equipped and ideally positioned to become a dedicated isolation and treatment facil ity
At the time the decision was made, El Katib was
operating at minimal occupancy so preparing the hospitals to receive
patients took less than a week
Fully Trained Medical Team
COVID-19 Response Protocols (IV/IV)

41Cleopatra Investor Presentation 2Q21
Additional Information
and Financial Disclosures

42Cleopatra Investor Presentation 2Q21
Market Leader in a Growing Market with Strong Long-term Prospects
• Highly fragmented market with a small number of institutionalized and strong brand players
• Significant under supply of beds relative to population and strength of payor network versus other emerging countries
• Strong and growing demand supported by demographic profile and growing insured population
• Pricing expected to grow inline with inflation but remains well below pre-devaluation levels in USD terms
• CHG is a leading integrated healthcare provider in Egypt with track record of acquiring and integrating key operating hospitals around the Greater Cairo area
• Since inception, CHG has been institutionalizing the healthcare industry in Egypt with a strong focus on medical service quality, value pricing and corporate governance
1.49
2.102.30
2.502.80 2.90
Egypt KSA Brazil Turkey Britain USA
93,600
32,353
127,600
Public Sector Private Sector Total Beds
CHG, 2%Ela j, 1%
Alameda, 2%
German Saudi, 1%
Andaluseya, 1%
Other, 93%
*Of total beds in Egypt (c.34k)
78216712
481
30032604
1. Building new capacity to reach c.1,000 beds, 2. Building new capacity to reach c.900 beds, 3. Building new capacity to reach c.600 beds 4. Building new capacity to reach c.500 beds
Number of Beds per 1,000 Citizens Egypt’s Number of Beds Breakdown
Market Share by # of Commercial Beds Hospital Groups in Cairo – Bed Count
A Unique Investment Story (I/III)

43Cleopatra Investor Presentation 2Q21
Strong Management with Structured Organizational Chart to Oversee All Aspects of the Business
• CHG has created a central management team that focuses on setting the overall strategy of the Group
• Centralized back-office functions
• A key initiative which has seen CHG stand out from other private hospital groups in the country has been its institutionalized approach of healthcare management with new concepts to the healthcare market in Egypt
• CHG continues to attract the most qualified and experienced talent across both its medical and non-medical departments
• CHG’s management brings a diverse skill set back by decades of experience in healthcare management
• The Group’s corporate office has a clear organizational matrix which allows for a smooth and efficient decision-making process
• When necessary, CHG introduces newbusiness functions to oversee various aspects of the business
Audit Committee
Internal Audit Chief Executive Officer
Board of Directors
Chief Operating OfficerChief Financial Officer
Supply Chain Manager
Marketing Director
Project Management Unit
Engineering & Project MD
Chair of Medical Council
Cleopatra MD El Katib MD
CSH MD
NBH MD
Queens MDASH MD
Pharma Director
Polyclinics Director
Legal Council Chief Human Resources Officer
Chief IT Officer
Quality DirectorCommercial Director
Transformation DirectorRevenue Cycle Management Director
Corporate Strategy & IR Director
• CEO• CFO• HR Officer• Corporate Strategy
• Supply Chain• IT• Hospitals MDs
• Legal• Investor Relations• Internal Audit• Commercial• Quality
• Marketing• Engineering PM• Patient Experience• Operations Officers• Polyclinics
• PM• RCM• Sales• Transformation
2015 2016 2017 2018 2019
Bu
ildin
g th
e fo
un
dat
ion
A Unique Investment Story (II/III)

44Cleopatra Investor Presentation 2Q21
Scale and Cost Synergies
• Group-wide tenders in pharmaceuticals and medical consumables that drive scale cost efficiencies and improve margins
• Scale volume benefits from providing payors with a network of healthcare services solutions
• The size of the Group’s operations facilitates the recruitment of experienced and highly-skilled doctors, consultants, and nurses with a focus on quality of outcomes and patient safety
• Sales and commercial strategy with focus on referrals and surgeries
• CHG’s Medical Council designs and implements medical policies in line with global best-practices
• Human resources and staff evaluation based on a series of benchmark KPIs to evaluate staff performance and intervene when necessary
• Cost Synergies • Inventory Management • HIS system• Group wide tenders • Capex purchasing • Medication tendering –
Pharma • Material Planning
• Comprehensive medical services allowing cross asset referrals
• Enhancing utilization across all revenue streams
• Case mix strategy • COE development • Capacity utilization
A Unique Investment Story (III/III)

45Cleopatra Investor Presentation 2Q21
Balance Sheet Summary
Balance Sheet and Leverage
Cashflow Movement
Balance Sheet Summary (EGP 000') Dec-20 Jun-21
Cash & Cash Equivalent 551 743
Inventory 66 63
Debtors and other debit balances 514 504
Current Assets 1,131 1,311
Fixed Assets 1,205 1,272
Intangible Assets 428 427
Non-Current Assets 20 193
Non-Current Assets 1,653 1,892
Total Assets 2,783 3,203
Current portion of capital lease 5 32
Creditors & other Credit balance 500 655
Current Liabilities 506 687
Non-Current Liabilities 104 288
Total Liabilities 609 975
Net Assets 2,174 2,228
Total Equity 2,174 2,228
Leverage Ratios Dec-20 Mar-21Total Liabilities / Total Assets 0.22 x 0.30 x
Net Bank Debt / Equity (0.25) (0.17)

46Cleopatra Investor Presentation 2Q21
DIO
61
40
Jun - 20 Jun - 21
107
84
Jun - 20 Jun - 21
121100
Jun - 20 Jun - 21
23
Jun - 20 Jun -21
Cash Conversion Cycle
DPO Cash Conversion Cycle
DSO
46

47Cleopatra Investor Presentation 2Q21
All figures in EGP mn 2Q2021 2Q2020 % change 1H2021 1H2020 % change
Revenues 643.6 340.2 89% 1,276.8 843.1 51%
Cost of sales (404.1) (244.0) 66% (796.1) (575.7) 38%
Gross profit 239.5 96.2 149% 480.7 267.4 80%
Gross Profit Margin 37% 28% 38% 32%
General & administrative expenses (108.4) (80.5) 35% (202.0) (150.5) 34%
Cost of acquisition activities (1.6) (4.9) -69% (6.9) (4.9) 39%
Provisions (1.7) (1.7) N/A (11.3) (5.6) 103%
Other income 1.0 2.1 -53% 7.2 3.9 85%
EBIT 128.8 11.2 N/A 267.7 110.3 143%
EBIT Margin 20% 3% 21% 13%
Interest income 13.6 13.9 -2% 26.2 32.2 -19%
Interest expense (9.2) (0.6) N/A (15.2) (1.2) N/A
Profit before tax 133.2 24.5 443% 278.7 141.3 97%
PBT Margin 21% 7% 22% 17%
Income tax (40.6) (9.8) 314% (78.0) (39.5) 98%
Deferred tax 1.5 (0.7) N/A 1.3 0.2 N/A
Net profit after tax 94.1 14.0 571% 202.0 102.0 98%
Net Profit Margin 15% 4% 16% 12% 143%
Distributed as follows:
Shareholders of the company 90.6 18.5 389% 191.9 100.6 91%
Minority rights 3.5 (4.5) N/A 10.1 1.4 N/A
Profit for the period 94.1 14.0 571% 202.0 102.0 98%
Consolidated Income Statement

48Cleopatra Investor Presentation 2Q21
All figures in EGP mn 31 December 2020 30 June 2021
Non-current assets
Fixed assets 1,205.2 1,271.7 Intangible assets 427.6 426.6 Right of use 18.8 186.6 Payment under investment - 5.7 Investment in associates 1.1 1.2 Total non-current assets 1,652.7 1,891.8
Current assets Inventory 66.3 63.3 Accounts receivables 418.8 421.3 Other receivables and debit balances 94.6 82.2 Due from related parties 0.4 0.6 Treasury bills 220.6 129.0 Cash 330.0 614.4 Total current assets 1,130.5 1,310.8 Total assets 2,783.3 3,202.6
EquityShare capital 800.0 800.0 Treasury Shares - (46.6)Reserves 281.3 292.3 Retained earnings 984.9 1,074.6 Equity attributable to the parent company 2,066.2 2,120.3 Non-controlling interest 107.7 107.4 Total equity 2,173.9 2,227.7
Non-current liabilitiesLong-term investments creditors 17.9 24.9Long-term debt – non-current portion - -Non-current portion of lease liability 8.0 186.4 Deferred tax liability 77.9 76.6 Total non-current liabilities 103.8 287.8
Current liabilitiesProvisions 21.6 22.4 Creditors and other credit balances 442.0 431.6 Due to related parties 0.6 -Current Portion of Borrowings - 138.4 Current portion of lease liability 5.3 32.4 Long term incentive plan - -Current income tax 36.1 62.2 Total current liabilities 505.5 687.0 Total liabilities 609.3 974.8 Total liabilities & shareholders’ equity 2,783.3 3,202.6
Consolidated Balance Sheet

49Cleopatra Investor Presentation 2Q21
All figures in EGP mn 30 June 2020 30 June 2021Cash flow from operating activities:
Profit before tax 141.3 278.7
Adjustments for:
Depreciation 40.2 54.5 Amortization of intangible assets - 7.9 Allowance for impairment of current assets 25.6 55.0 Provision (0.0) 0.8 Capital gain/loss (0.7) (0.0)Credit/debit interest (31.0) (11.1)Changes in current tax liability (82.8) (51.9)Gain/loss in investments in subsidiaries - (0.1)Employee incentive 7.8 -Operating profits before changes in assets and liabilities 100.3 333.9 Changes in working capital:
Changes in inventories (13.8) 2.8 Change in trade receivables, debtors, and other debit balances (7.1) (30.4)Changes in due from related parties 1.5 (0.8)Change in trade and other payables (19.2) (9.9)Paid from employee incentive plan (136.8) -Change in lease - (16.2)Net cash flows generated from operating activities (75.2) 279.4Cash flow from investment activities:
Proceeds from sale of fixed assets 0.7 0.2 Payments for purchase of fixed assets (37.3) (34.4)PUC purchased (121.2) (86.9)Advanced payments for purchase of fixed assets (37.8) (6.7)Payments for acquisition of a subsidiary, net cash acquired (6.6) -Payments under investment (35.5) (305.7)Credit interest collected 34.0 20.7 Treasury bills 50.1 -Paid under subsidiaries capital increase - -Paid for investment associates - -Net cash flow from investment activities (153.8) (412.7)Cash flow from financing activities:
Proceeds from minority share in subsidiary capital increase - -Treasury Shares - (46.6)Dividends paid (48.9) (47.2)Repayment of borrowings - -Cash proceed from overdraft - 219.3 Cash paid to overdraft - (80.8)Interest paid (1.2) (16.2)Net cash flow from financing activities (50.0) 28.5 Net change in cash & cash equivalents during the period (279) (104.8)Cash and cash equivalents at the beginning of the period 791.3 550.5 Cash and cash equivalent in acquired subsidiaries at beginning of period - -Cash & cash equivalents at the end of the period 512.3 445.7
Consolidated Cashflow Statement

50Cleopatra Investor Presentation 2Q21
Market Overview

51Cleopatra Investor Presentation 2Q21
Diabetes Prevalence in the 20-79 Age Group
Hospital Beds (/1,000 people) | 2017
9,146
5,007
1,569 808 632 608 336 309 189 151
In January 2014, a constitution was passed stipulating that the government must spend a minimum of 3% of Egypt’s GDP on healthcare
Population (millions)
83.0 86.0 88.0 90.0 92.0 96.0 98.0 101.0 110.0
2013 2014 2015 2016 2017 2018 2019 2020e 2025e
CAGR: 2.2 %
Public vs. Private Healthcare Expenditure | EGP bn
38.8 40.2 41.1 42.4 44.6 47.3 50.1 53.1 56.2
62.9 63.3 63.2 63.6 63.5 65.6 68.1 70.9 73.8
2014 2015 2016 2017E 2018E 2019E 2020E 2021E 2022E
Public Private
102 104 104 106 108 113 118 124 130
Cancer Prevalence in Egypt | 000 cases
28.0 29.0 30.0 31.0 16.0 16.6 17.1 17.7 8.0 8.3 8.6 8.9 8.0 8.3 8.6 8.9 3.0 3.1 3.2 3.3 63.0 65.3 67.5 69.8
2013 2015 2020 2025
Liver Breast Digestive track Brain Lung
23.9 19.0 16.6 14.9 14.8
11.5 9.4 9.4 7.9 7.9
10.5
4.63.5
2.5 2.2 1.8 1.8 1.3 1.1 1.1
Healthcare Expenditure per Capita (USD) | 2017
Supply Gap in Egyptian Healthcare Industry
Underserved and Under-penetrated Market with Steady Demand Growth
Healthcare Expenditure in Egypt
Lifestyle Disease Profile in Egypt

52Cleopatra Investor Presentation 2Q21
Source: CAPMAS, Egypt Ministry of Health, consultants
0%
20%
40%
60%
80%
100%
100% Public
> 100 Beds
Others
Basic Healthcare Centers
General Hospitals
Teaching Institutes
Specialized Medical Centers
Armed Forces Facilities
Private Public
35 98
No. of Hospital Beds in Egypt (K) Total = 133 Beds
Includes Hospitals Owned & Operated by Public Insurance
Highly Fragmented Space
C. 50 – 100+ Bed Hospitals only; Primarily in Cairo, Giza & Alexandria
Egypt Total Hospital Beds (I/III)

53Cleopatra Investor Presentation 2Q21
Basic HealthcareCenters
General Hospitals(Public Insurance)
Specialized Medical Centers
Teaching Institutes/ Medical Colleges
Armed Forces Facilities
Private Hospitals (Non-Government)
Level of Care
• Firs t level of public healthcare
• Access to basic preventive & diagnostic treatment for common diseases
& risk factors
• Support basic healthcare centers as wel l as some advanced care / treatment centers
• Accessible to members of the insurance scheme
• One of the highestlevel of public healthcare
• Provide advanced. Specialized care across key diseases &
intervention
• Provide medical education,specialization across levels & fields
• Faci litate tra ining & research
• High-end multi specialty facilities for the armed forces
• Avai lable for access by paying premium rate
• Provide diagnosis,treatment advice, specialist inpatient services, and advanced care
• Better equipped than
publ ic hospitals
Number of Units 153 420 42 19 20 1,484
Number of Beds C. 18,000 C. 50,000 C. 1,500 C. 5,000 5000+ > 34,000
Level of TechnicalFacilities
Basic Low Mid to High Medium Extremely HighMid to High(Depending on Location)
Presence / LocationAcross Egypt – national network
Located in all key cities / tows for each governorates
Concentrated in metro& tier 1 cities
Concentrated in metro& tier 1 cities
Located in key governorates / cities
Across Egypt –concentrated in metro & tier 1 cities
Client Type AllAll Egyptians with HIO / COO cover
All – primarily referrals for specialized care
AllArmed forces (free) private by paying
Mid to higher incomesegment
Price Negligible Low Low to Mid Low High Mid to High
Source: CAPMAS, Egypt Ministry of Health, consultantsFocus of Next Slide
Egypt Total Hospital Beds (II/III)

54Cleopatra Investor Presentation 2Q21
Large Hospitals(100+ Beds)
Medium Hospitals(50 – 100 Beds)
Small Hospitals(<50 Beds)
Level of Care
• Large multi super-specialty care centers with abil ity to do high-complexity cases
• Coverage across care continuum (potentially emerging tertiary care across key specialties)
• Potentially include CoEs with focus on 1 –2 key specialties
• Comprehensive OP, pharmacy, diagnostic (imaging & pathology), trauma / ER, etc.
• Multi-specialty centers focused on mid to basic complexity work - focused up to secondary level care
• Serve as a feeder network to large hospitals for more complex cases
• Basic OP, pharmacy, trauma / ER, etc.
• Basic centers with beds (average size of 15 – 20 beds) with focus on triage & observations
• Basic intervention work (e.g. suturing, bone-setting, and IV administration) conducted at such facil ities
• Only basic support amenities available (e.g. portable X-ray, suction machine, and a basic / minor surgery suite)
Number of Unites 40 – 50 50 – 100 C. 1,300
Number of Beds C. 5,000 C. 2,000 – 3,000 > 27,000
Level of Technical FacilitiesMid to High(Depending on level of care)
Mid – Low(As required for basic secondary care)
Low
Presence / Location All located in Cairo, Giza or AlexandriaMajority concentrated in metro & tier 1 cities
Across Egypt
Client TypeHigh to mid income individuals / families with high payor coverage
High to mid income individuals / families with low probability of any form of payor coverage
Mid to low income individuals & families with limited to no cover
Price High Mid to High Mid to Low
Source: CAPMAS, Egypt Ministry of Health, consultantsFocus of Next Slide
Egypt Total Hospital Beds (III/III)
55Cleopatra Investor Presentation 2Q21
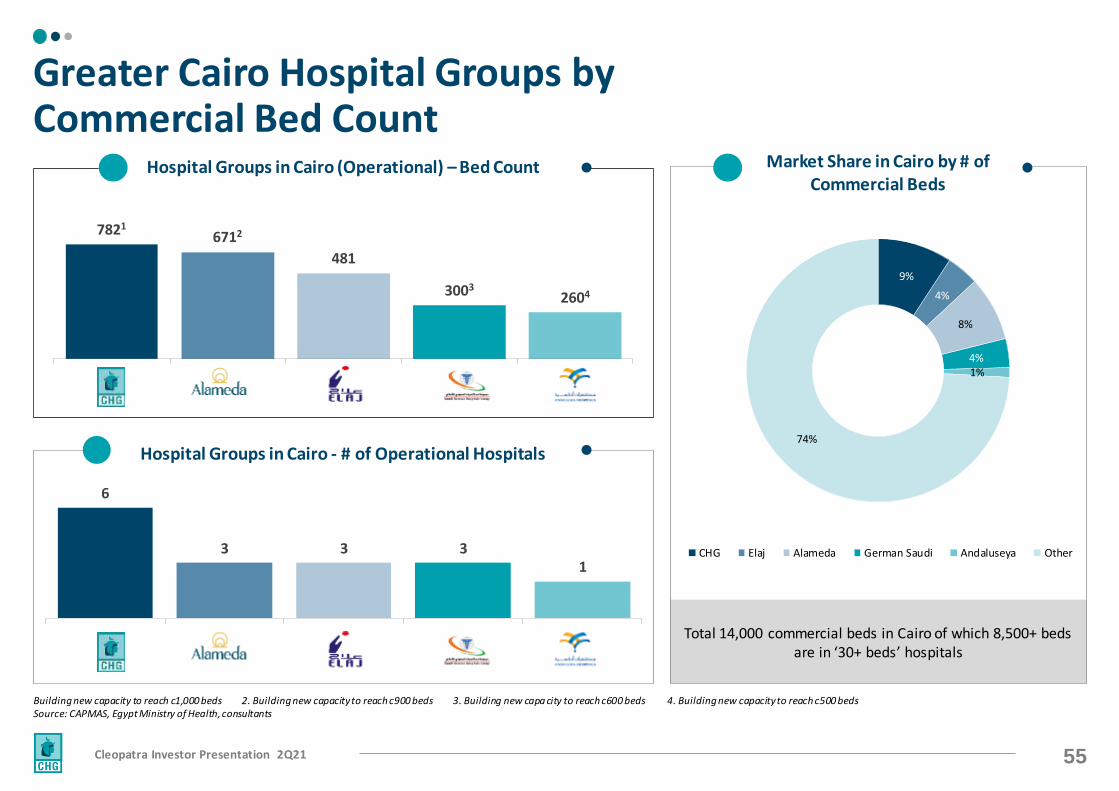
Total 14,000 commercial beds in Cairo of which 8,500+ beds are in ‘30+ beds’ hospitals
6
3 3 31
Building new capacity to reach c1,000 beds 2. Building new capacity to reach c900 beds 3. Building new capa city to reach c600 beds 4. Building new capacity to reach c500 bedsSource: CAPMAS, Egypt Ministry of Health, consultants
Hospital Groups in Cairo - # of Operational Hospitals
9%
4%
8%
4%1%
74%
CHG Elaj Alameda German Saudi Andaluseya Other
78216712
481
30032604
Greater Cairo Hospital Groups by Commercial Bed Count
Hospital Groups in Cairo (Operational) – Bed Count Market Share in Cairo by # of Commercial Beds

56Cleopatra Investor Presentation 2Q21
Distribution of Hospitals in Greater Cairo by # of Commercial Beds
Greater Cairo Distribution of Hospitals
by Commercial Beds
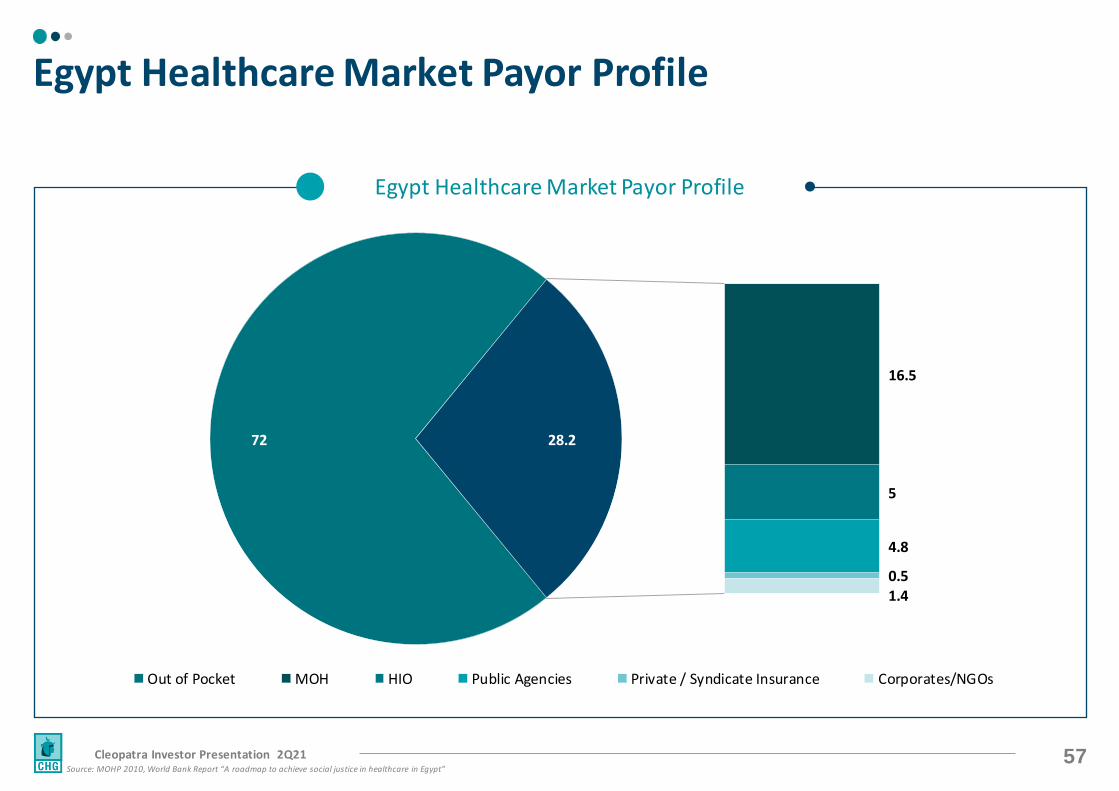
57Cleopatra Investor Presentation 2Q21Source: MOHP 2010, World Bank Report “A roadmap to achieve social justice in healthcare in Egypt”
Egypt Healthcare Market Payor Profile
72
16.5
5
4.8
0.51.4
28.2
Out of Pocket MOH HIO Public Agencies Private / Syndicate Insurance Corporates/NGOs
Egypt Healthcare Market Payor Profile

58Cleopatra Investor Presentation 2Q21
Thank you
INVESTOR RELATIONS CONTACTS
Telephone: +2 02 23103771E-mail: [email protected]
SHAREHOLDER INFORMATION
EGX: CLHO.CAListed: June 2016Shares Outstanding: 1.6 billion