clermont coal mine - supplementary eis report · figure e-1 density profile in the final void e-1...
TRANSCRIPT

SUPPLEMENTARYREPORT
CLERMONT COAL MINE PROJECTENVIRONMENTAL IMPACT STATEMENTJanuary 2005
Clermont Coal Mine Project – Supplementary Report PAGE i
Contents
1. Introduction 1-1
2. Project Description 2-1
2.1 In Pit Crushing and Conveying (IPCC) Option 2-12.1.1 Stage 1 2-42.1.2 Stage 2 2-5
2.2 Mine Layout Changes 2-82.3 Highway Alignment 2-92.4 Site Water Management 2-11
2.4.1 Water Balance Model 2-112.4.2 Surplus Groundwater Release 2-162.4.3 Gowrie Creek Diversion 2-17
2.5 Coal Conveyor 2-182.5.1 Conveyor Alignment 2-182.5.2 Conveyor Shielding 2-18
2.6 Explosives Facilities 2-192.6.1 Explosives Magazine 2-192.6.2 Bulk Explosives Facility 2-19
2.7 Miscellaneous Changes to Project Layout 2-19
3. Air Quality 3-1
3.1 Clermont Coal Mine Project – Revised Dust Modelling Results 3-13.2 Air Quality – In-Pit Crushing and Conveying 3-3
3.2.1 Emissions Estimation 3-33.2.2 Dust Emission Sources and Controls 3-33.2.3 Dispersion Modelling Inputs 3-4
3.3 Air – Potential Impacts 3-43.3.1 Sensitive Locations 3-43.3.2 PM10 3-53.3.3 TSP 3-63.3.4 Dust Deposition 3-63.3.5 Discussion of IPCC Results 3-6
4. Noise and Vibration 4-1
4.1 Noise and Vibration Assessment - In Pit Crushing and Conveying 4-14.1.1 Noise Modelling 4-14.1.2 Noise Predictions 4-24.1.3 Noise Impacts 4-3
4.2 Noise Assessment – Overland Conveyor 4-44.2.1 Noise Modelling 4-44.2.2 Low Frequency Analysis 4-5
5. Cultural Heritage Management Plan 5-1
6. Supplementary Report Response Table 6-1
7. Draft EMOS 7-1
PAGE ii Clermont Coal Mine Project – Supplementary Report
8. References 8-1
Appendix A Air Quality Appendices A-1
A.1 Revised Dust Levels A-1A.2 Comparison Between Truck and Shovel and IPCC A-8
A.2.1 Production Year 1 A-8A.2.2 Production Year 8 A-10
A.3 Example Modelling Files A-12A.4 Meteorological Comparison A-16
Appendix B Noise and Vibration Appendices B-1
B.1 Sound Power Levels B-1B.2 IPCC Equipment Locations B-2
Appendix C Additional Geochemistry Results C-1
Appendix D Revised Figures D-1
Appendix E Final Dump Landform E-1
Appendix F Final Void F-1
Appendix G Revised Traffic Volumes G-1
Appendix H Project Commitments H-1
Appendix I Surplus Groundwater and Sandy Creek Alluvial Aquifer WaterQuality I-1
Appendix J Summary of Surface Water Quality J-1
Appendix K Summary of Accommodation Providers K-1
Clermont Coal Mine Project – Supplementary Report PAGE iii
Tables
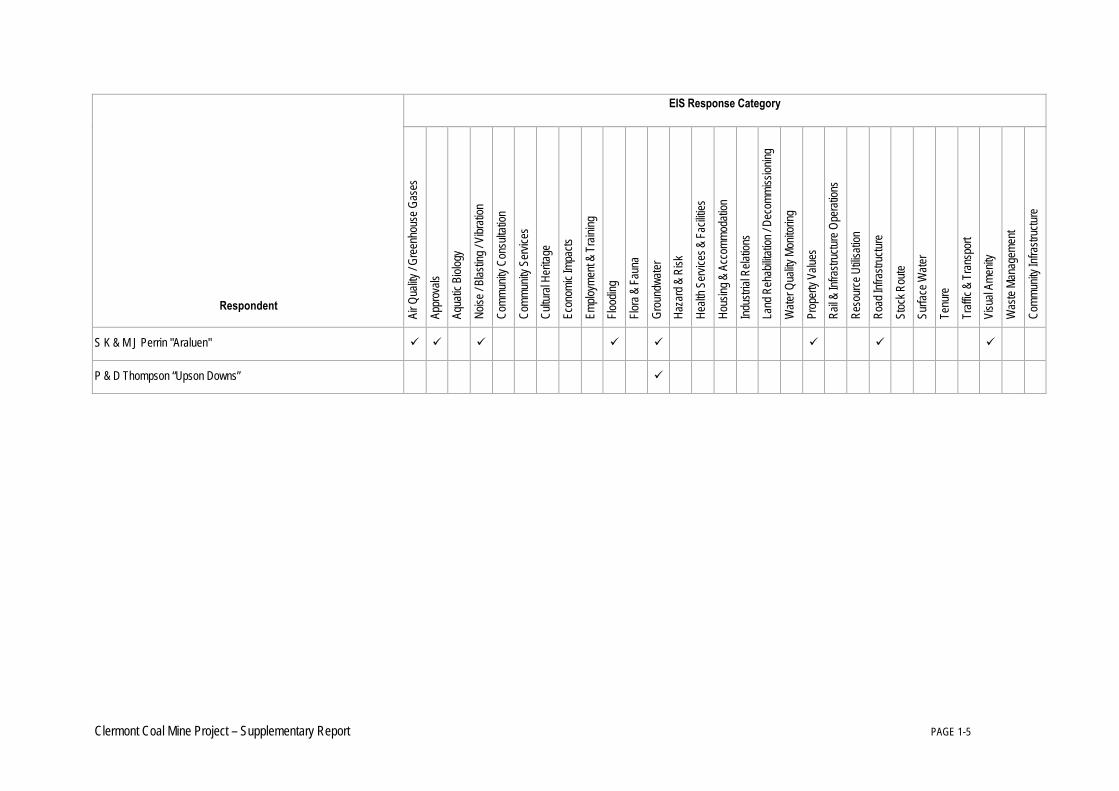
Table 1-1 Key Issues Raised by Respondents 1-2
Table 2-1 Areas of regional ecosystems to be cleared 2-9
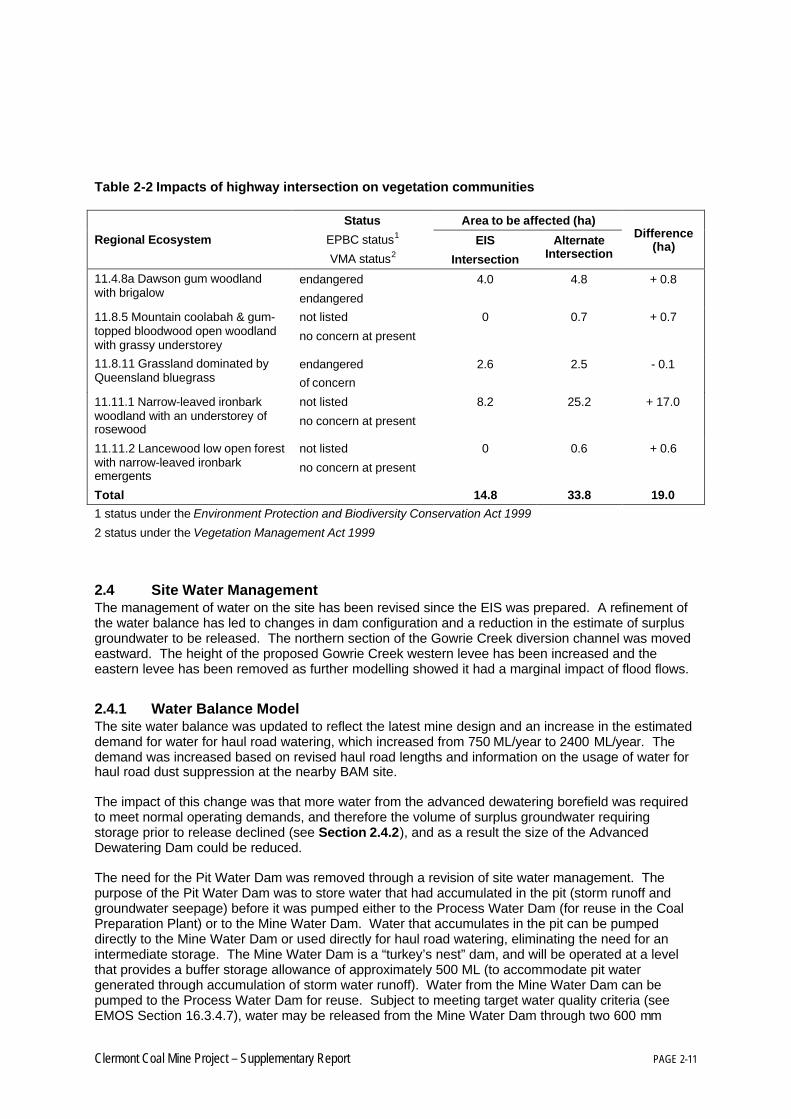
Table 2-2 Impacts of highway intersection on vegetation communities 2-11
Table 2-3 Water Balance Model Result Summary 2-16
Table 3-1 Revised Predicted Dust Concentrations and Deposition Rates at Nearby Sensitive Locations(including background levels) – Production Year 1 3-1
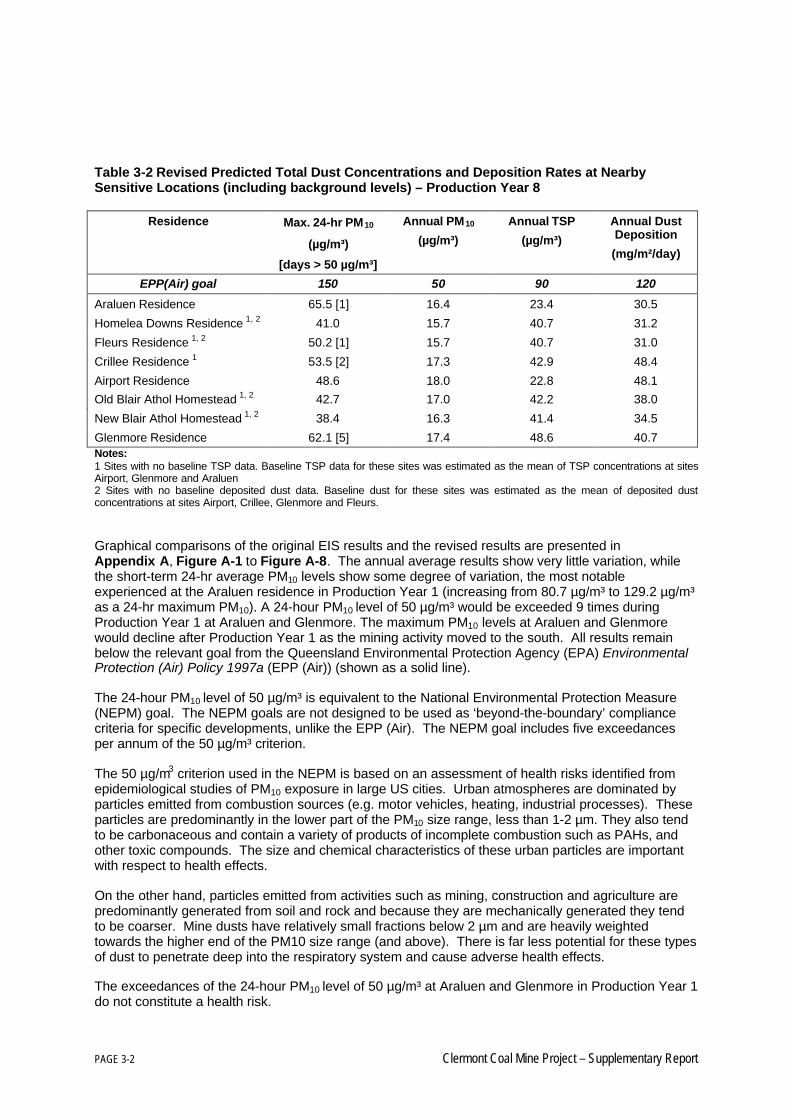
Table 3-2 Revised Predicted Total Dust Concentrations and Deposition Rates at Nearby SensitiveLocations (including background levels) – Production Year 8 3-2
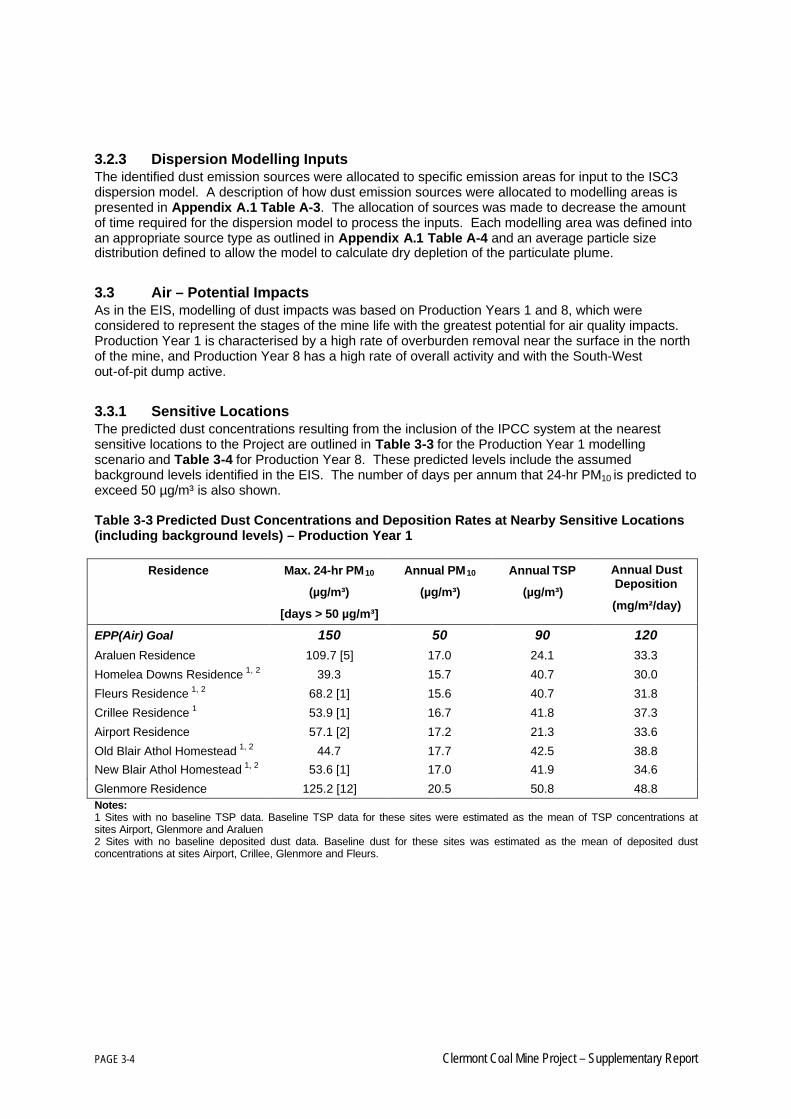
Table 3-3 Predicted Dust Concentrations and Deposition Rates at Nearby Sensitive Locations(including background levels) – Production Year 1 3-4
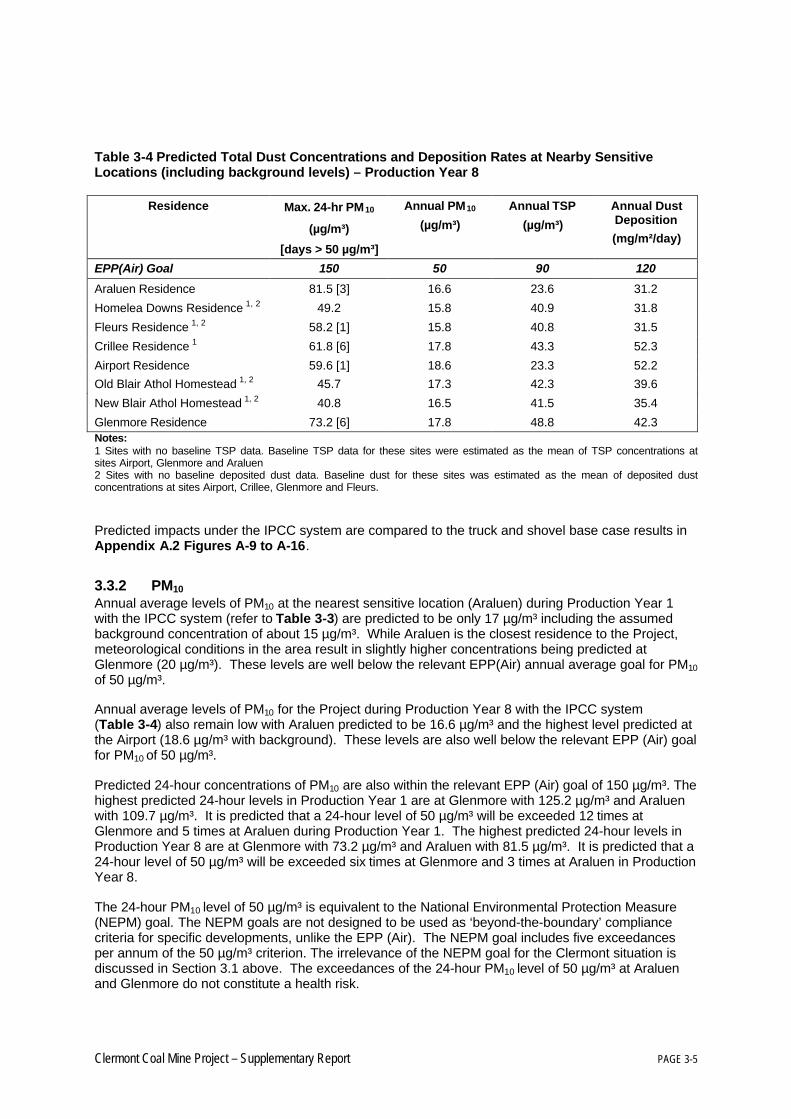
Table 3-4 Predicted Total Dust Concentrations and Deposition Rates at Nearby Sensitive Locations(including background levels) – Production Year 8 3-5
Table 4-1 Equipment List for Noise Model – IPCC Option 4-2
Table 4-2 Noise Levels at Nearby Residences during Mine Operation – Base Case 4-2
Table 4-3 Noise Levels at Nearby Residences during Mine Operation – IPCC Option 4-3
Table 4-4 Sound Pressure Level Spectrum at Most Affected Receivers (Araluen) 4-3
Table 4-5 Noise Levels at Nearby Residences during Project Operation 4-4
Table 4-6 Sound Pressure Level Spectrum at Most Affected Receivers (Old Blair Athol) 4-5
Table A-1 Dust Emissions (with IPCC) A-5
Table A-2 Dust Emission Controls A-6
Table A-3 ISC3 Source Allocation A-7
Table A-4 ISC3 Source Types A-7
Table B-1 Maximum Sound Power Level of Mine Equipment for Clermont Coal Mine Project B-1
Table C-1 Sample Results for Sodicity C-1
Table C-2 Distribution of Geochemical Types for Major Lithological Units C-1
Table F-1 Actual (2002) Traffic Volumes F-1
Table F-2 Construction Phase Traffic Volumes F-1
Table F-3 Construction Phase Pavement Impacts (Equivalent Standard Axles) F-2
Table F-4 Operational Stage Traffic Volumes – BAM and project Operating F-2
Table F-5 Operational Stage Traffic Volumes – Ten Year Horizon (2018) F-3
Table F-6 Operational Stage Pavement Impacts (Equivalent Standard Axles) F-3
PAGE iv Clermont Coal Mine Project – Supplementary Report
Figures
Figure 2-1 Mobile in-pit crushing station 2-3
Figure 2-2 In-pit conveyor 2-3
Figure 2-3 Ramp conveyor 2-3
Figure 2-4 Overburden spreader 2-4
Figure 2-5 Schematic of Stage 1 IPCC 2-5
Figure 2-6 Schematic of Stage 2 IPCC 2-6
Figure 2-7 Schematic of Stage 2 IPCC – In-pit Conveyor Relocated 2-7
Figure 2-8 Alternate Highway Intersection 2-13
Figure 2-9 Original Highway Intersection 2-14
Figure 2-10 Revised Water Management System 2-15
Figure 2-11 Annualised Chart of Dewatering Volume and Demands 2-17
Figure 2-12 General Layout of the Explosives Magazine 2-21
Figure 2-13 General Layout of the Bulk Explosives Store 2-22
Figure A-1 Production Year 1 24-hr PM10 A-1
Figure A-2 Production Year 1 Annual PM10 A-1
Figure A-3 Production Year 1 Annual TSP A-2
Figure A-4 Production Year 1 Annual Average Dust Deposition A-2
Figure A-5 Production Year 8 24-hr PM10 A-3
Figure A-6 Production Year 8 Annual PM10 A-3
Figure A-7 Production Year 8 Annual TSP A-4
Figure A-8 Production Year 8 Annual Average Dust Deposition A-4
Figure A-9 Comparison of Dust Levels with and without an IPCC System – Year 1 Maximum 24-hourAverage PM10 A-8
Figure A-10 Comparison of Dust Levels with and without an IPCC System – Year 1 Annual AveragePM10 A-8
Figure A-11 Comparison of Dust Levels with and without an IPCC System – Year 1 Annual AverageTSP A-9
Figure A-12 Comparison of Dust Levels with and without an IPCC System – Year 1 Annual AverageDust Deposition A-9
Figure A-13 Comparison of Dust Levels with and without an IPCC System – Year 8 Maximum 24-hourAverage PM10 A-10
Clermont Coal Mine Project – Supplementary Report PAGE v
Figure A-14 Comparison of Dust Levels with and without an IPCC System – Year 8 Annual AveragePM10 A-10
Figure A-15 Comparison of Dust Levels with and without an IPCC System – Year 8 Annual AverageTSP A-11
Figure A-16 Comparison of Dust Levels with and without an IPCC System – Year 8 Annual AverageDust Deposition A-11
Figure A-17 Wind Roses from CALMET Data Set A-16
Figure A-18 Average annual wind rose: Blair Athol June 1996 – March 1998 A-16
Figure B-1 Equipment Locations Production Year 1 B-2
Figure B-2 Equipment Locations Production Year 8 B-2
Figure E-1 Density profile in the final void E-1
Figure E-2 Density profile of waterbody receiving surface water inflows from a creek E-1


Clermont Coal Mine Project – Supplementary Report PAGE 1-1
1. Introduction
Purpose of Supplementary ReportThis Supplementary Report responds to issues raised in submissions from agencies and the public onthe Environmental Impact Statement (EIS) for the Clermont Coal Mine Project (the Project). It alsodescribes changes that have been made to the Project since the EIS was prepared in August 2004.This Supplementary Report should be read in conjunction with the EIS.
The EIS was placed on public display on 2 August 2004 and was available for comment until13 September 2004. A total of 28 submissions were received, including 11 from private individualsand 17 from Government departments, local authorities and private organisations.
The matters raised by each respondent are summarised in Table 1-1, with the more significant issuesand project changes referred to in Sections 2 – 5. Section 2 identifies changes to the original projectdescription, Section 3 provides revised information on air quality issues, particularly dust emissions,Section 4 considers revisions to noise and vibration forecasts stemming from project changes, andSection 5 provides an update on progress with the Cultural Heritage Management Plan. Section 6contains a Response Table specifically addressing the issues raised in each submission. A revisedDraft EMOS for the Project is included in Section 7.
The comments made by the Department of the Environment and Heritage, as shown in Section 6 arerestricted to the adequacy of the information provided in the EIS and do not encompass DEH'sassessment of the impacts of the action.
Additional information that supports the responses made by the Proponent is provided inAppendices A to K at the end of the Supplementary Report. This includes a revised list of ProjectCommitments in Appendix H.
PAGE 1-2 Clermont Coal Mine Project – Supplementary Report
Table 1-1 Key Issues Raised by Respondents
EIS Response Category
Respondent
Air Q
uality
/ G
reen
hous
e G
ases
Appr
oval
s
Aqua
tic B
iolo
gy
Noise
/ Bl
astin
g / V
ibra
tion
Com
mun
ity C
onsu
ltatio
n
Com
mun
ity S
ervic
es
Cultu
ral H
erita
ge
Econ
omic
Impa
cts
Empl
oym
ent &
Tra
inin
g
Floo
ding
Flor
a &
Faun
a
Gro
undw
ater
Haza
rd &
Risk
Heal
th S
ervic
es &
Fac
ilitie
s
Hous
ing
& Ac
com
mod
atio
n
Indu
stria
l Rel
atio
ns
Land
Reh
abilit
atio
n / D
ecom
miss
ioni
ng
Wat
er Q
uality
Mon
itorin
g
Prop
erty
Val
ues
Rail &
Infra
stru
ctur
e O
pera
tions
Reso
urce
Utili
satio
n
Road
Infra
stru
ctur
e
Stoc
k Ro
ute
Surfa
ce W
ater
Tenu
re
Traf
fic &
Tra
nspo
rt
Visu
al A
men
ity
Was
te M
anag
emen
t
Com
mun
ity In
frast
ruct
ure
Agency/Organisation
AgForce ü ü ü ü
Belyando Shire Council ü ü ü
Clermont Youth and Housing Association ü ü
Commonwealth Department of the Environment & Heritage ü
Department of Aboriginal and Torres Strait Islander Policy ü ü
Department of Emergency Services ü ü
Department of Employment and Training ü
Department of Housing ü ü ü
Department of Industrial Relations ü
Clermont Coal Mine Project – Supplementary Report PAGE 1-3
EIS Response Category
Respondent
Air Q
uality
/ G
reen
hous
e G
ases
Appr
oval
s
Aqua
tic B
iolo
gy
Noise
/ Bl
astin
g / V
ibra
tion
Com
mun
ity C
onsu
ltatio
n
Com
mun
ity S
ervic
es
Cultu
ral H
erita
ge
Econ
omic
Impa
cts
Empl
oym
ent &
Tra
inin
g
Floo
ding
Flor
a &
Faun
a
Gro
undw
ater
Haza
rd &
Risk
Heal
th S
ervic
es &
Fac
ilitie
s
Hous
ing
& Ac
com
mod
atio
n
Indu
stria
l Rel
atio
ns
Land
Reh
abilit
atio
n / D
ecom
miss
ioni
ng
Wat
er Q
uality
Mon
itorin
g
Prop
erty
Val
ues
Rail &
Infra
stru
ctur
e O
pera
tions
Reso
urce
Utili
satio
n
Road
Infra
stru
ctur
e
Stoc
k Ro
ute
Surfa
ce W
ater
Tenu
re
Traf
fic &
Tra
nspo
rt
Visu
al A
men
ity
Was
te M
anag
emen
t
Com
mun
ity In
frast
ruct
ure
Department of Main Roads ü ü ü ü ü
Department of Natural Resources and Mines ü ü ü ü ü ü ü ü ü ü ü ü ü
Department of Primary Industries and Fisheries ü ü ü
Environmental Protection Agency ü ü ü ü ü ü ü ü
Queensland Health ü ü ü ü ü ü
Queensland Rail ü
Queensland Transport ü ü ü ü
Queensland Treasury ü
PAGE 1-4 Clermont Coal Mine Project – Supplementary Report
EIS Response Category
Respondent
Air Q
uality
/ G
reen
hous
e G
ases
Appr
oval
s
Aqua
tic B
iolo
gy
Noise
/ Bl
astin
g / V
ibra
tion
Com
mun
ity C
onsu
ltatio
n
Com
mun
ity S
ervic
es
Cultu
ral H
erita
ge
Econ
omic
Impa
cts
Empl
oym
ent &
Tra
inin
g
Floo
ding
Flor
a &
Faun
a
Gro
undw
ater
Haza
rd &
Risk
Heal
th S
ervic
es &
Fac
ilitie
s
Hous
ing
& Ac
com
mod
atio
n
Indu
stria
l Rel
atio
ns
Land
Reh
abilit
atio
n / D
ecom
miss
ioni
ng
Wat
er Q
uality
Mon
itorin
g
Prop
erty
Val
ues
Rail &
Infra
stru
ctur
e O
pera
tions
Reso
urce
Utili
satio
n
Road
Infra
stru
ctur
e
Stoc
k Ro
ute
Surfa
ce W
ater
Tenu
re
Traf
fic &
Tra
nspo
rt
Visu
al A
men
ity
Was
te M
anag
emen
t
Com
mun
ity In
frast
ruct
ure
Individuals
D Bridgeman “Morbridge” ü ü ü
P J & M A Corbett, C Kelly and C Sypher ü ü ü
T & C Dennis “Kurrajong” ü ü
W D Fraser and R D Cross “Fleurs” ü ü ü ü ü ü ü ü ü ü
W D Fraser “Langfield” & “Fleurs” ü ü ü ü ü
G H & P Hurrey “Crillee” ü ü ü ü ü ü ü
S Mills “East Kurrajong” ü ü ü ü
P & S McLean “Kinsale” ü
R & E Otto “Homelea Downs” ü ü ü ü ü ü ü
Clermont Coal Mine Project – Supplementary Report PAGE 1-5
EIS Response Category
Respondent
Air Q
uality
/ G
reen
hous
e G
ases
Appr
oval
s
Aqua
tic B
iolo
gy
Noise
/ Bl
astin
g / V
ibra
tion
Com
mun
ity C
onsu
ltatio
n
Com
mun
ity S
ervic
es
Cultu
ral H
erita
ge
Econ
omic
Impa
cts
Empl
oym
ent &
Tra
inin
g
Floo
ding
Flor
a &
Faun
a
Gro
undw
ater
Haza
rd &
Risk
Heal
th S
ervic
es &
Fac
ilitie
s
Hous
ing
& Ac
com
mod
atio
n
Indu
stria
l Rel
atio
ns
Land
Reh
abilit
atio
n / D
ecom
miss
ioni
ng
Wat
er Q
uality
Mon
itorin
g
Prop
erty
Val
ues
Rail &
Infra
stru
ctur
e O
pera
tions
Reso
urce
Utili
satio
n
Road
Infra
stru
ctur
e
Stoc
k Ro
ute
Surfa
ce W
ater
Tenu
re
Traf
fic &
Tra
nspo
rt
Visu
al A
men
ity
Was
te M
anag
emen
t
Com
mun
ity In
frast
ruct
ure
S K & M J Perrin "Araluen" ü ü ü ü ü ü ü ü
P & D Thompson “Upson Downs” ü

Clermont Coal Mine Project – Supplementary Report PAGE 2-1
2. Project DescriptionSince the EIS was prepared in August 2004, the Proponent has undertaken additional mine feasibilitystudies. As a result of these studies, the following options are under consideration for adoption in thefinal design of the Project:
§ use of an In-Pit Crushing and Conveying (IPCC) system for the removal of part of the overburden;and
§ modification of the intersection of the Peak Downs Highway and the Gregory DevelopmentalRoad to the north-west of the mining lease.
The potential impacts that would be associated with adoption of these options are assessed in thisSupplementary Report.
In addition, further engineering studies have resulted in the following changes to the Project:
§ changes to the mine water management system, through rationalisation of dam sizing andlocation;
§ changes to the vertical alignment and configuration of the overland conveyor between the Projectand the Blair Athol Mine (BAM); and
§ changes to the location of the Explosives Facility and other miscellaneous changes.
The impacts associated with these changes are assessed in this Supplementary Report.
The environmental impact assessment in the Project described in the EIS and here in theSupplementary Report is based on a conceptual Project layout. Certain changes may occur to thelayout of facilities, infrastructure, the pit and waste rock dumps as detailed design is undertaken andas the mine develops.
2.1 In Pit Crushing and Conveying (IPCC) OptionThe Proponent is undertaking extensive investigations into the feasibility of an IPCC system to replacetruck and shovel removal of the top 45 m of overburden. A decision regarding the use of the IPCCoption will be made by the Proponent in early 2005, after consideration of the results of a test crushingprogram.
The purpose of the IPCC system is to provide a more cost effective system for the removal of surfaceoverburden, by allowing a reduction in the number of waste haul trucks and excavators required forthe Project. The IPCC option would require nine fewer operational trucks, one less grader and lessmachine time for dozers and haul road watering. The number of trucks required to move coal wouldbe the same, and the footprint and final configuration of the dumps and pit would be basically thesame.
The IPCC system is designed to operate at a maximum of 12 000 tonnes of waste rock per hour(average of 10 000 tonnes per hour). For the purposes of this assessment, the conveying system isassumed to continuously operate at its maximum rate of 12 000 tonnes per hour.
If implemented the IPCC system would be used for the life of the mine.
The following is a description of the major components of the IPCC system:
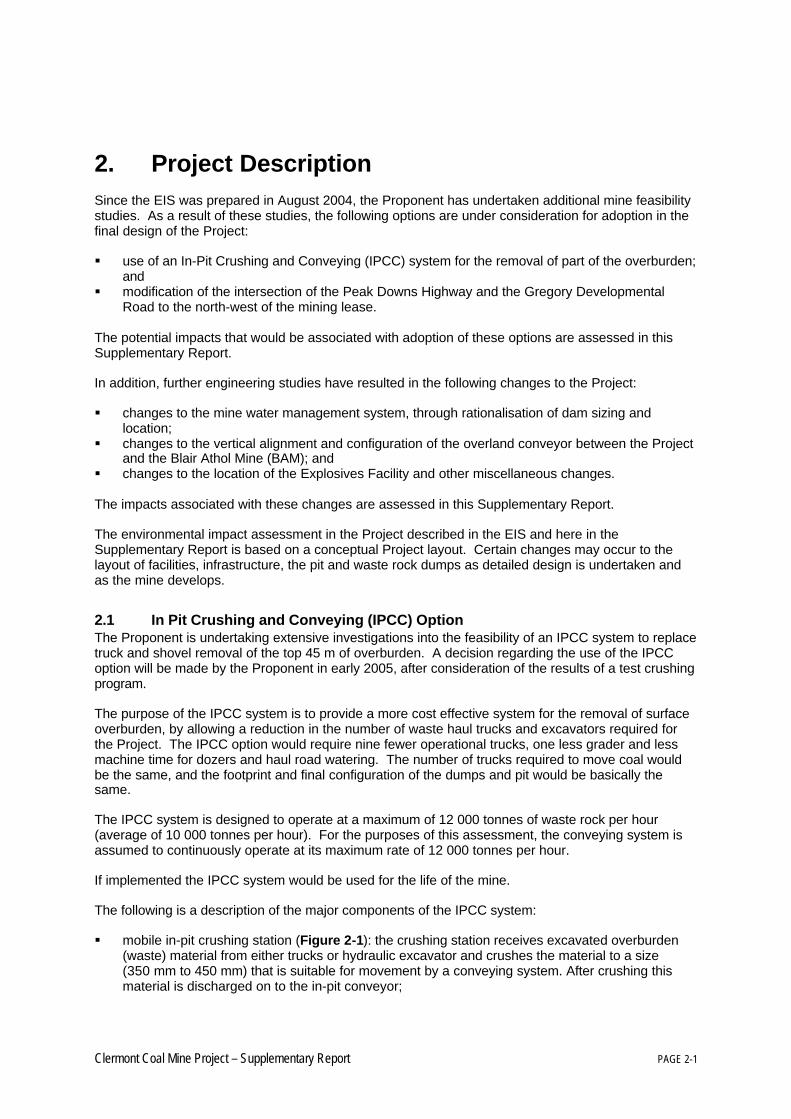
§ mobile in-pit crushing station (Figure 2-1): the crushing station receives excavated overburden(waste) material from either trucks or hydraulic excavator and crushes the material to a size(350 mm to 450 mm) that is suitable for movement by a conveying system. After crushing thismaterial is discharged on to the in-pit conveyor;
PAGE 2-2 Clermont Coal Mine Project – Supplementary Report
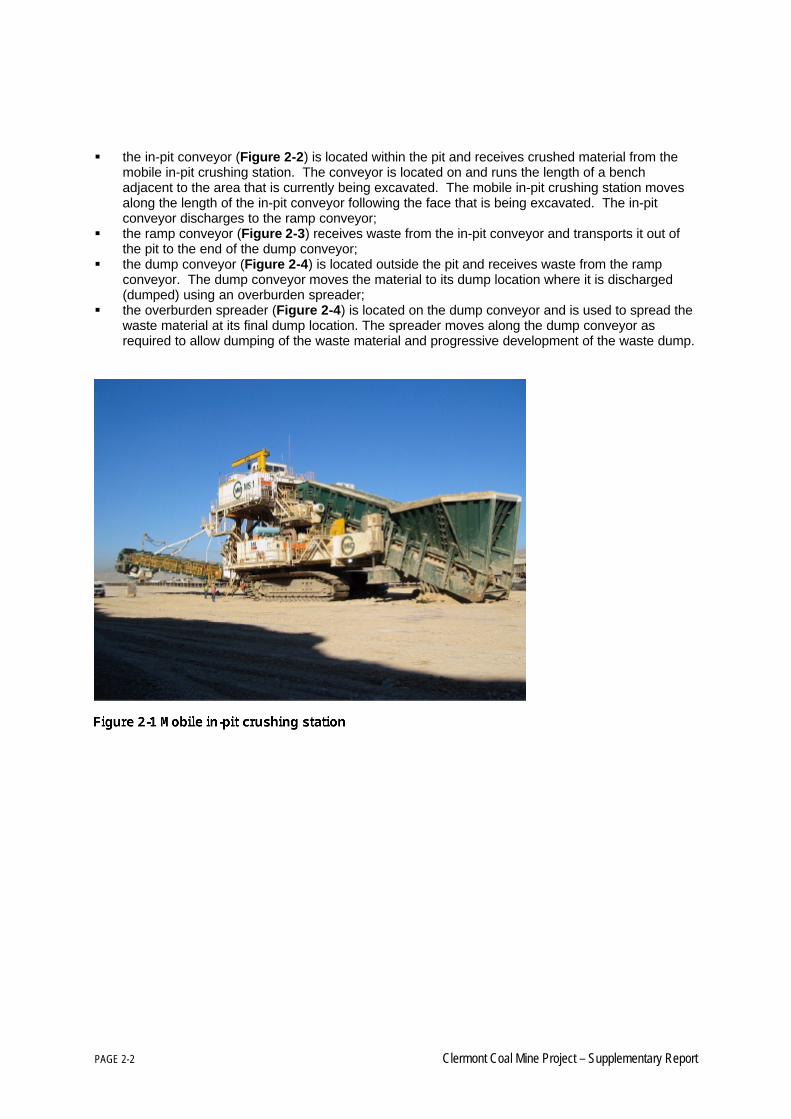
§ the in-pit conveyor (Figure 2-2) is located within the pit and receives crushed material from themobile in-pit crushing station. The conveyor is located on and runs the length of a benchadjacent to the area that is currently being excavated. The mobile in-pit crushing station movesalong the length of the in-pit conveyor following the face that is being excavated. The in-pitconveyor discharges to the ramp conveyor;
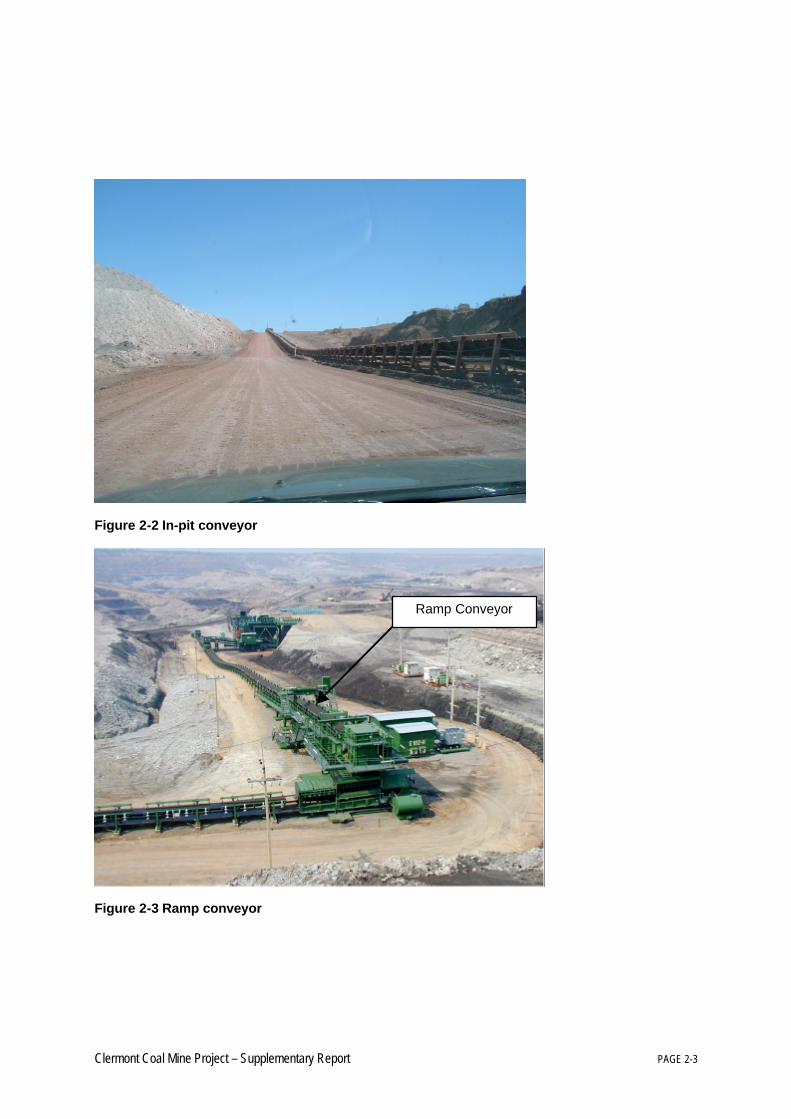
§ the ramp conveyor (Figure 2-3) receives waste from the in-pit conveyor and transports it out ofthe pit to the end of the dump conveyor;
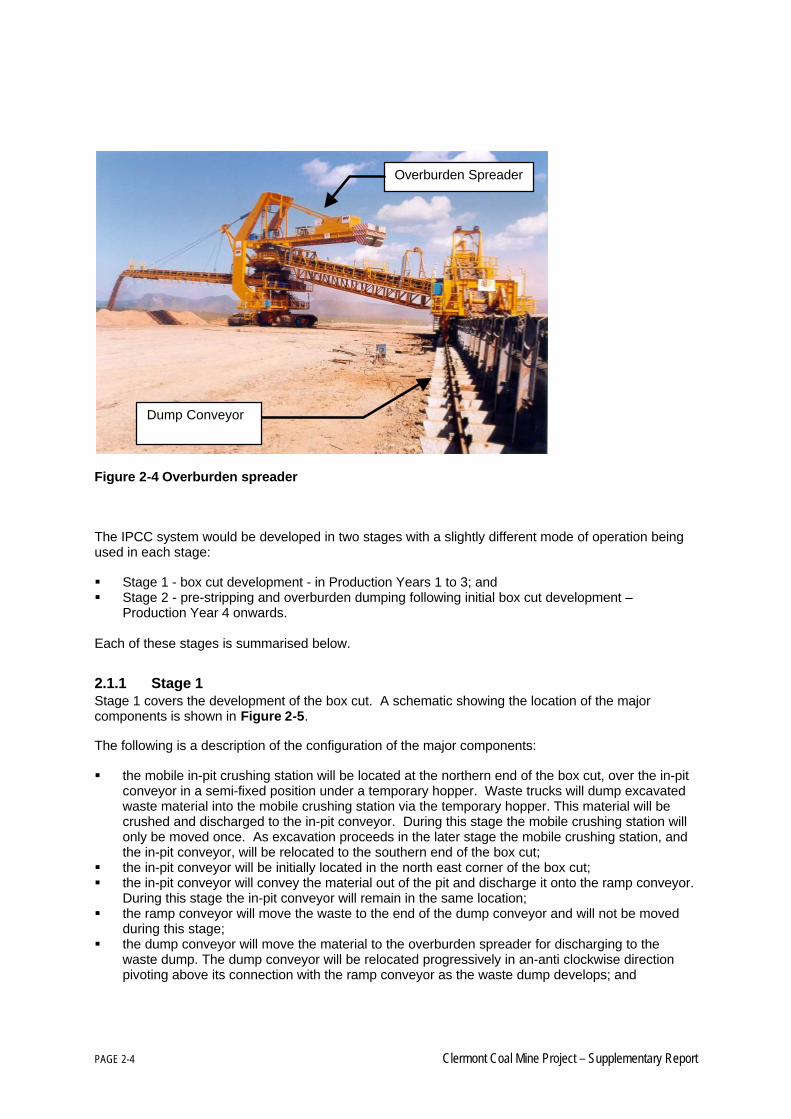
§ the dump conveyor (Figure 2-4) is located outside the pit and receives waste from the rampconveyor. The dump conveyor moves the material to its dump location where it is discharged(dumped) using an overburden spreader;
§ the overburden spreader (Figure 2-4) is located on the dump conveyor and is used to spread thewaste material at its final dump location. The spreader moves along the dump conveyor asrequired to allow dumping of the waste material and progressive development of the waste dump.
Clermont Coal Mine Project – Supplementary Report PAGE 2-3
Figure 2-2 In-pit conveyor
Figure 2-3 Ramp conveyor
Ramp Conveyor
PAGE 2-4 Clermont Coal Mine Project – Supplementary Report
Figure 2-4 Overburden spreader
The IPCC system would be developed in two stages with a slightly different mode of operation beingused in each stage:
§ Stage 1 - box cut development - in Production Years 1 to 3; and§ Stage 2 - pre-stripping and overburden dumping following initial box cut development –
Production Year 4 onwards.
Each of these stages is summarised below.
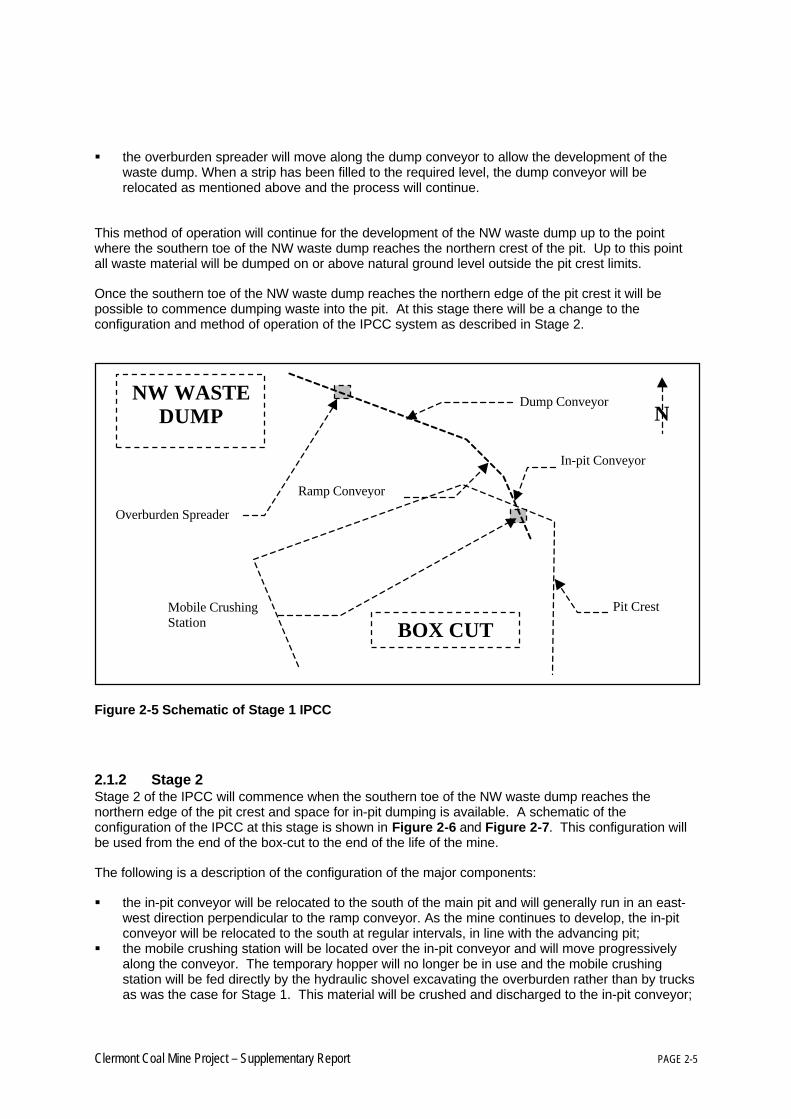
2.1.1 Stage 1Stage 1 covers the development of the box cut. A schematic showing the location of the majorcomponents is shown in Figure 2-5.
The following is a description of the configuration of the major components:
§ the mobile in-pit crushing station will be located at the northern end of the box cut, over the in-pitconveyor in a semi-fixed position under a temporary hopper. Waste trucks will dump excavatedwaste material into the mobile crushing station via the temporary hopper. This material will becrushed and discharged to the in-pit conveyor. During this stage the mobile crushing station willonly be moved once. As excavation proceeds in the later stage the mobile crushing station, andthe in-pit conveyor, will be relocated to the southern end of the box cut;
§ the in-pit conveyor will be initially located in the north east corner of the box cut;§ the in-pit conveyor will convey the material out of the pit and discharge it onto the ramp conveyor.
During this stage the in-pit conveyor will remain in the same location;§ the ramp conveyor will move the waste to the end of the dump conveyor and will not be moved
during this stage;§ the dump conveyor will move the material to the overburden spreader for discharging to the
waste dump. The dump conveyor will be relocated progressively in an-anti clockwise directionpivoting above its connection with the ramp conveyor as the waste dump develops; and
Overburden Spreader
Dump Conveyor
Clermont Coal Mine Project – Supplementary Report PAGE 2-5
§ the overburden spreader will move along the dump conveyor to allow the development of thewaste dump. When a strip has been filled to the required level, the dump conveyor will berelocated as mentioned above and the process will continue.
This method of operation will continue for the development of the NW waste dump up to the pointwhere the southern toe of the NW waste dump reaches the northern crest of the pit. Up to this pointall waste material will be dumped on or above natural ground level outside the pit crest limits.
Once the southern toe of the NW waste dump reaches the northern edge of the pit crest it will bepossible to commence dumping waste into the pit. At this stage there will be a change to theconfiguration and method of operation of the IPCC system as described in Stage 2.
Figure 2-5 Schematic of Stage 1 IPCC
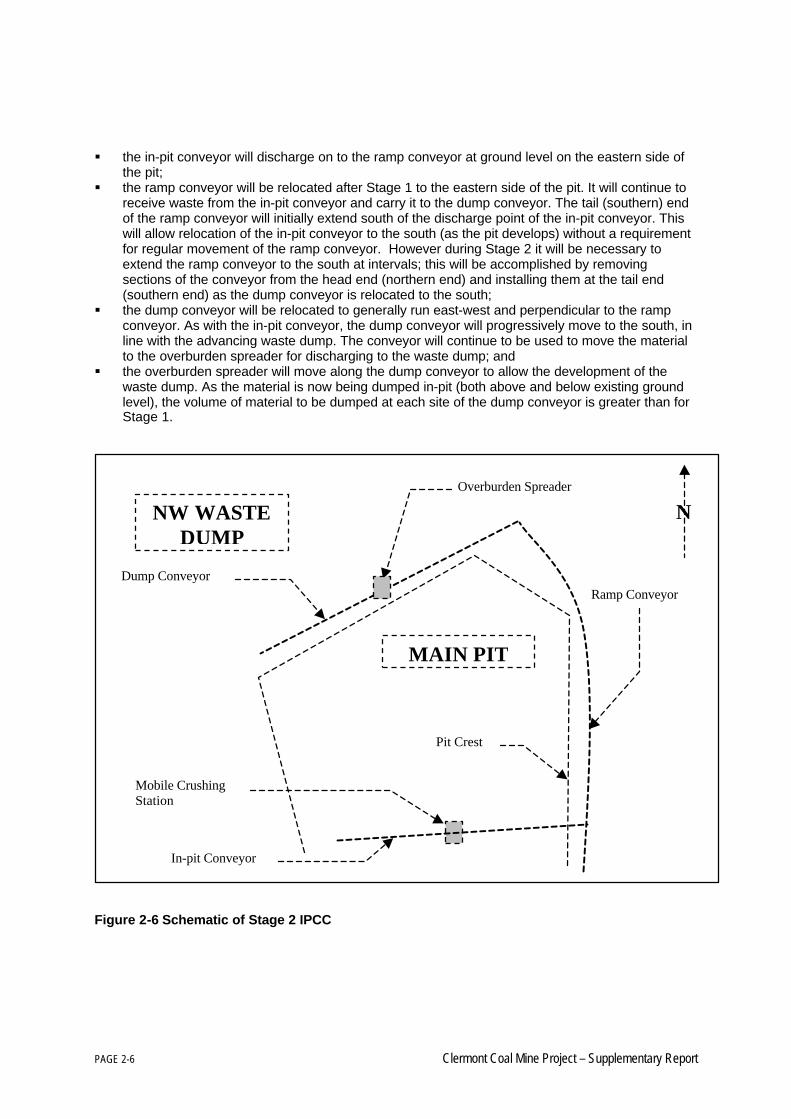
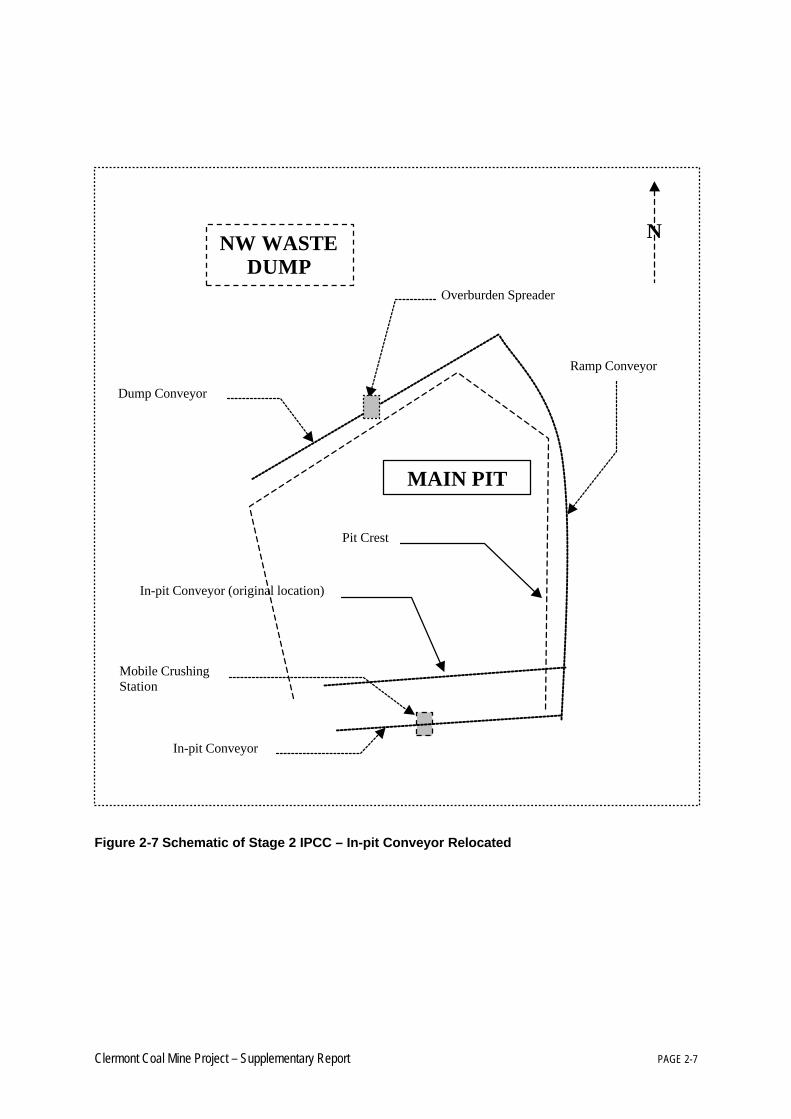
2.1.2 Stage 2Stage 2 of the IPCC will commence when the southern toe of the NW waste dump reaches thenorthern edge of the pit crest and space for in-pit dumping is available. A schematic of theconfiguration of the IPCC at this stage is shown in Figure 2-6 and Figure 2-7. This configuration willbe used from the end of the box-cut to the end of the life of the mine.
The following is a description of the configuration of the major components:
§ the in-pit conveyor will be relocated to the south of the main pit and will generally run in an east-west direction perpendicular to the ramp conveyor. As the mine continues to develop, the in-pitconveyor will be relocated to the south at regular intervals, in line with the advancing pit;
§ the mobile crushing station will be located over the in-pit conveyor and will move progressivelyalong the conveyor. The temporary hopper will no longer be in use and the mobile crushingstation will be fed directly by the hydraulic shovel excavating the overburden rather than by trucksas was the case for Stage 1. This material will be crushed and discharged to the in-pit conveyor;
Dump Conveyor
Overburden Spreader
BOX CUT
NW WASTEDUMP
Ramp Conveyor
In-pit Conveyor
Mobile CrushingStation
Pit Crest
N
PAGE 2-6 Clermont Coal Mine Project – Supplementary Report
§ the in-pit conveyor will discharge on to the ramp conveyor at ground level on the eastern side ofthe pit;
§ the ramp conveyor will be relocated after Stage 1 to the eastern side of the pit. It will continue toreceive waste from the in-pit conveyor and carry it to the dump conveyor. The tail (southern) endof the ramp conveyor will initially extend south of the discharge point of the in-pit conveyor. Thiswill allow relocation of the in-pit conveyor to the south (as the pit develops) without a requirementfor regular movement of the ramp conveyor. However during Stage 2 it will be necessary toextend the ramp conveyor to the south at intervals; this will be accomplished by removingsections of the conveyor from the head end (northern end) and installing them at the tail end(southern end) as the dump conveyor is relocated to the south;
§ the dump conveyor will be relocated to generally run east-west and perpendicular to the rampconveyor. As with the in-pit conveyor, the dump conveyor will progressively move to the south, inline with the advancing waste dump. The conveyor will continue to be used to move the materialto the overburden spreader for discharging to the waste dump; and
§ the overburden spreader will move along the dump conveyor to allow the development of thewaste dump. As the material is now being dumped in-pit (both above and below existing groundlevel), the volume of material to be dumped at each site of the dump conveyor is greater than forStage 1.
Figure 2-6 Schematic of Stage 2 IPCC
Dump Conveyor
Overburden Spreader
MAIN PIT
NW WASTEDUMP
Ramp Conveyor
In-pit Conveyor
Mobile CrushingStation
N
Pit Crest
Clermont Coal Mine Project – Supplementary Report PAGE 2-7
Figure 2-7 Schematic of Stage 2 IPCC – In-pit Conveyor Relocated
In-pit Conveyor (original location)
Pit Crest
Overburden Spreader
MAIN PIT
Ramp Conveyor
Dump Conveyor
NW WASTEDUMP
In-pit Conveyor
Mobile CrushingStation
N
PAGE 2-8 Clermont Coal Mine Project – Supplementary Report
2.2 Mine Layout ChangesSince the EIS was prepared, the layout of the Project has been modified and includes the followingchanges:
§ greater disturbance assumed between the eastern edge of north-west waste dump and theGowrie Creek levee by roads, power lines, bores and other infrastructure;
§ expansion of the footprint of the south-west waste rock dump due to height restriction (as a resultof proximity to airport);
§ provision for an alternative Highway intersection adjacent to the north-west corner of the MiningLeases;
§ relocation of the Advanced Dewatering Dam;§ consolidation of the Pit Water Dam into the Mine Water Dam;§ relocation of the Mine Water Dam; and§ relocation of Gowrie Creek diversion further east;§ removal of the eastern levee of the Gowrie Creek diversion; and§ expansion in area for topsoil stockpiles.
Revised Figure 2-5 to Figure 2-10 in Appendix D illustrate the new mine layout, during the life of theProject.
Revised Figure 5-4 in Appendix D shows the mine footprint in relation to vegetation communities. Asa result of these changes to the mine layout, the area of vegetation to be cleared has increased by235 ha to a total of 937 ha. The area of each regional ecosystem to be cleared is shown in Table 2-1.
Communities listed under the Environment Protection and Biodiversity Conservation Act 1999 will beaffected by the revised mine layout. These communities are:
§ Dawson gum woodland with brigalow (11.4.8 Association 1, 2 and 3); and§ grassland dominated by Queensland bluegrass (11.8.11).
The area of the Queensland bluegrass community to be cleared will increase from 35 ha to 44 ha.Approximately 73 ha of this community will remain undisturbed on the Mining Leases. The area ofDawson gum woodland with brigalow community that will be cleared will increase from 188 ha to234 ha. Approximately 130 ha of this community will remain undisturbed on the Mining Leases.
There is approximately 188 484 ha of bluegrass grassland RE 11.8.11 remaining within the BrigalowBelt of Central Queensland (Bruce Wilson, Queensland EPA, pers. comm. Derived from QueenslandHerbarium regional ecosystem mapping, draft version 4.0, August 9, 2003). The area of bluegrassgrassland RE 11.8.11 to be cleared for the Project remains approximately 0.02% of that total area,which is unchanged from the EIS.
Approximately 81 158 ha of Dawson gum woodland (RE 11.4.8) remains in the Brigalow Belt ofCentral Queensland (Bruce Wilson, Queensland EPA, pers. comm. Derived from QueenslandHerbarium regional ecosystem mapping, draft version 4.0, August 9, 2003). The total area of Dawsongum woodland community that may be cleared for the Project comprises approximately 0.29% of thecurrently mapped area of RE 11.4.8 in the Brigalow Belt.
The Proponent will implement off-set strategies for the unavoidable loss of 44 ha of the bluegrasscommunity by compensatory establishment of 44 ha of bluegrass on in-situ black soil. This replantingis likely to be adjacent to remnant bluegrass in the highway reserve in the north-east of ML 1884.
The seed mix used in the mine rehabilitation program will include key dominant and understoreyspecies from RE 11.3.3, RE 11.4.8, RE 11.5.3 and RE 11.11.1. These species will be selected for useon areas where suitable soil types have been replaced.

Clermont Coal Mine Project – Supplementary Report PAGE 2-9
Table 2-1 Areas of regional ecosystems to be cleared
RegionalEcosystem Description
EIS area to becleared (ha)
Revisedarea to be
cleared (ha)
Difference(ha)
11.11.1 Narrow-leaved ironbark (Eucalyptus crebra)woodland with a moderate to dense understorey ofrosewood (Acacia rhodoxylon)
89 154 65
11.11.2 Lancewood (Acacia shirleyi) low open forest withnarrow-leaved ironbark (Eucalyptus crebra)emergents
3 3 0
11.3.3 Coolibah (Eucalyptus coolabah) woodland with agrassy understorey
176 236 60
11.3.3a Black tea-tree (Melaleuca bracteata) woodland witha grassy understorey
1 1 0
11.5.3 Silver-leaved ironbark (Eucalyptus melanophloia)open woodland with scattered poplar box(Eucalyptus populnea)
192 245 53
11.8.5 Mountain coolibah (Eucalyptus orgadophila) andgum-topped bloodwood (Corymbia erythrophloia)open woodland with a grassy understorey
15 17 2
11.4.8 Ass 1* Dawson gum (Eucalyptus cambageana) woodlandwith brigalow (Acacia harpophylla)
53 89 36
11.4.8 Ass 2* Dawson gum woodland (Eucalyptus cambageana)with scattered brigalow (Acacia harpophylla)
123 125 2
11.4.8 Ass 3* Dawson gum (Eucalyptus cambageana) woodlandwith shrubby understorey
12 20 8
11.4.9* Brigalow (Acacia harpophylla) and yellowwood(Terminalia oblongata) woodland
3 3 0
11.8.11* Grassland dominated by Queensland bluegrass(Dichanthium sericeum ) with no significant floraspecies
3 8 5
11.8.11* Grassland dominated by Queensland bluegrasswith King Bluegrass (Dichanthium queenslandicum)
31 35 4
11.8.11* Grassland dominated by Queensland bluegrasswith King Bluegrass and Belyando Cobblers Pegs(Trioncinia refroflexa)
1 1 0
Total 702 937 235
* EPBC Listed Community
2.3 Highway AlignmentThe preferred alignment for the diversion of the Peak Downs Highway, the Gregory DevelopmentalRoad, and the intersection of these roads was described in Section 2.16.11 and 2.16.12 of the EIS.
In summary, it was proposed to divert the Peak Downs Highway along the northern boundary of theClermont MLs, to an intersection with the Gregory Developmental Road near the north-west boundaryof the site. The Gregory Highway was to be diverted along the western boundary of theClermont MLs, where it would join the existing highway at the southern boundary of the site.
In the EIS, the preferred arrangement included a T-intersection of the Peak Downs Highway with theGregory Developmental Road, with the Peak Downs Highway carrying the through traffic.

PAGE 2-10 Clermont Coal Mine Project – Supplementary Report
Since the EIS was prepared, the Proponent has continued discussions with the Department of MainRoads (DMR) on the detail of the highway alignment and intersection arrangements.
The intersection arrangement preferred by DMR gives priority to traffic on the Gregory DevelopmentalRoad, which carries Type 2 Road Trains and a higher volume of heavy vehicles than the Peak DownsHighway. This arrangement is considered by DMR to be a safer intersection between the twohighways, compared to the intersection in the EIS.
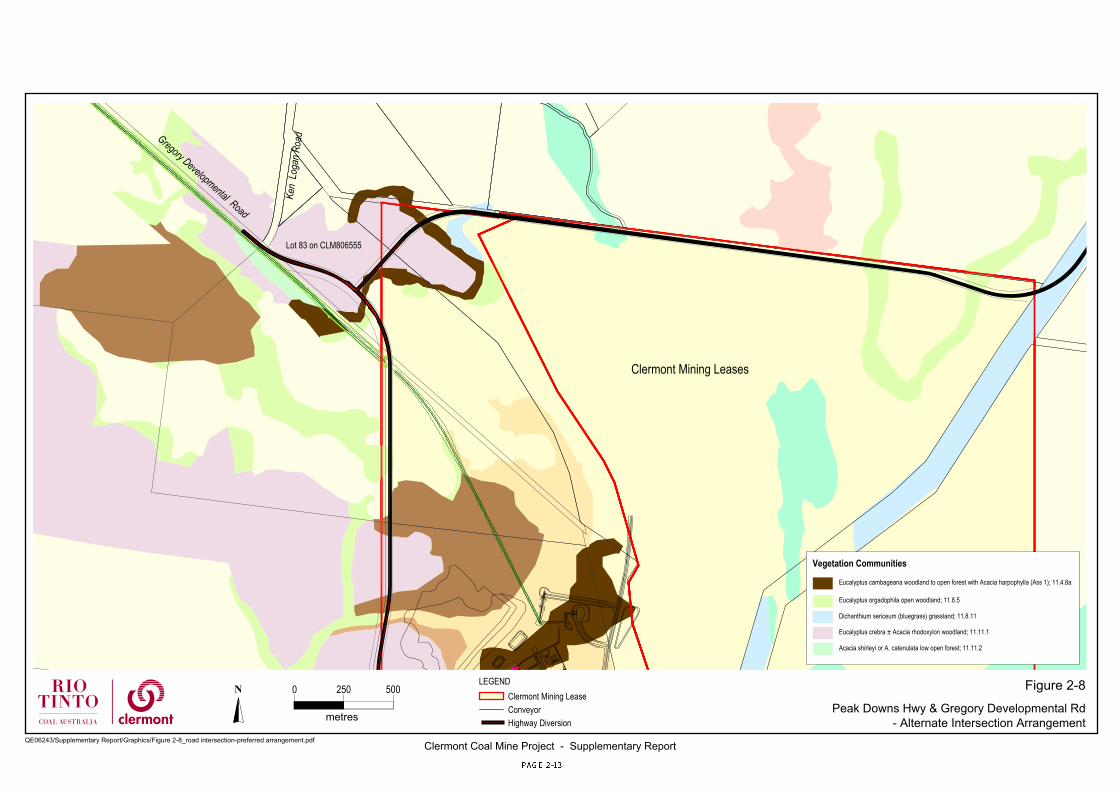
Figure 2-8 shows the intersection arrangement preferred by DMR. This arrangement is currentlybeing discussed between the Proponent and DMR.
Figure 2-9 shows the original arrangement for the intersection of the Peak Downs Highway and theGregory Developmental Road, as described in the EIS.
Should the alternate arrangement be adopted, it would be constructed on a parcel of land bounded bythe Gregory Developmental Road, Ken Logan Road and the western boundary of the Clermont MLs.
This land is not owned by the Proponent, however discussions are being held with the owner.
The real property description of the parcel is Lot 83 on CLM 806555. The tenure of the land is agrazing homestead pastoral lease. Native title does not exist in this parcel.
The impacts of this alternate intersection arrangement compared to the arrangement shown in the EISare:
§ land outside the mining lease boundary would need to be acquired for the intersection;§ an additional area of 0.8 ha would need to be cleared of ecosystem 11.4.8 (Eucalyptus
cambageana woodland with Acacia harpophylla), an endangered ecological community listedunder the Environment Protection and Biodiversity Conservation Act 1999 and the VegetationManagement Act 1999;
§ a reduction in clearing of 0.1 ha of ecosystem 11.8.11 (grassland dominated by Queenslandbluegrass), an endangered ecological community under the Environment Protection andBiodiversity Conservation Act 1999 and an “of concern” community under the VegetationManagement Act 1999;
§ improved road safety at the intersection; and§ the need to create a new section of road reserve and stock route for the new alignment and
intersection.
The alternate intersection would require the clearing of 33.8 ha of mapped remnant vegetation,compared with an area of 14.8 ha for the original intersection, an increase of 19 ha. Table 2-2 liststhe vegetation communities that would be affected and the status of the communities, along with theareas to be cleared and difference in clearing for the two intersections.
The vegetation community to be cleared to the greatest extent is the Narrow-leaved ironbarkwoodland with an understorey of rosewood (RE 11.11.1). This community is not listed under theEnvironment Protection and Biodiversity Conservation Act 1999. Its status under the VegetationManagement Act 1999 is “not of concern” at present.
Clermont Coal Mine Project – Supplementary Report PAGE 2-11
Table 2-2 Impacts of highway intersection on vegetation communities
Area to be affected (ha)
Regional Ecosystem
Status
EPBC status1
VMA status2
EIS
Intersection
AlternateIntersection
Difference(ha)
11.4.8a Dawson gum woodlandwith brigalow
endangered
endangered
4.0 4.8 + 0.8
11.8.5 Mountain coolabah & gum-topped bloodwood open woodlandwith grassy understorey
not listed
no concern at present
0 0.7 + 0.7
11.8.11 Grassland dominated byQueensland bluegrass
endangered
of concern
2.6 2.5 - 0.1
11.11.1 Narrow-leaved ironbarkwoodland with an understorey ofrosewood
not listed
no concern at present
8.2 25.2 + 17.0
11.11.2 Lancewood low open forestwith narrow-leaved ironbarkemergents
not listed
no concern at present
0 0.6 + 0.6
Total 14.8 33.8 19.0
1 status under the Environment Protection and Biodiversity Conservation Act 1999
2 status under the Vegetation Management Act 1999
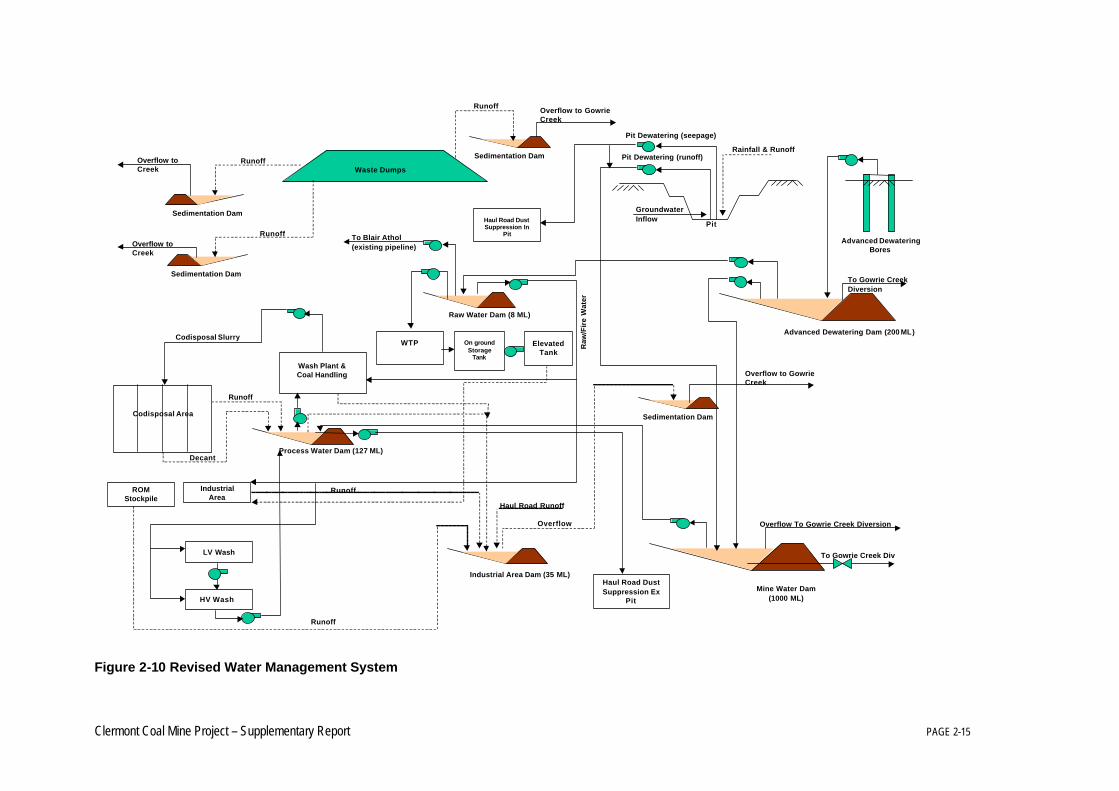
2.4 Site Water ManagementThe management of water on the site has been revised since the EIS was prepared. A refinement ofthe water balance has led to changes in dam configuration and a reduction in the estimate of surplusgroundwater to be released. The northern section of the Gowrie Creek diversion channel was movedeastward. The height of the proposed Gowrie Creek western levee has been increased and theeastern levee has been removed as further modelling showed it had a marginal impact of flood flows.
2.4.1 Water Balance ModelThe site water balance was updated to reflect the latest mine design and an increase in the estimateddemand for water for haul road watering, which increased from 750 ML/year to 2400 ML/year. Thedemand was increased based on revised haul road lengths and information on the usage of water forhaul road dust suppression at the nearby BAM site.
The impact of this change was that more water from the advanced dewatering borefield was requiredto meet normal operating demands, and therefore the volume of surplus groundwater requiringstorage prior to release declined (see Section 2.4.2), and as a result the size of the AdvancedDewatering Dam could be reduced.
The need for the Pit Water Dam was removed through a revision of site water management. Thepurpose of the Pit Water Dam was to store water that had accumulated in the pit (storm runoff andgroundwater seepage) before it was pumped either to the Process Water Dam (for reuse in the CoalPreparation Plant) or to the Mine Water Dam. Water that accumulates in the pit can be pumpeddirectly to the Mine Water Dam or used directly for haul road watering, eliminating the need for anintermediate storage. The Mine Water Dam is a “turkey’s nest” dam, and will be operated at a levelthat provides a buffer storage allowance of approximately 500 ML (to accommodate pit watergenerated through accumulation of storm water runoff). Water from the Mine Water Dam can bepumped to the Process Water Dam for reuse. Subject to meeting target water quality criteria (seeEMOS Section 16.3.4.7), water may be released from the Mine Water Dam through two 600 mm

PAGE 2-12 Clermont Coal Mine Project – Supplementary Report
diameter pipes when there are natural flows in Gowrie Creek or Wolfang Creek. Peak release wouldbe 2.4 m3/s. The location of the Mine Water Dam has been changed to move it farther away from thefinal pit crest. This was done to maximise the geotechnical stability of the pit wall.
The modelled releases have the following characteristics:
§ the peak release (once in the lifetime of the mine) is modelled at 205 ML/day;§ on average the release rate is 106 ML/day when releasing;§ the average annual release is 872 ML per year; and§ on average the Mine Water Dam releases during two months of the year. These are commonly
during the wet season.
The revised water management system is shown as a schematic in Figure 2-10.
The water balance model was run with the revised reconfiguration of the site water managementsystem. The entire recorded climatic history of the site was tested through the model to optimise thesize of storages and test the security of supply for mine operations.
Blair Athol Mining Lease
Clermont Mining Leases
Gregory Developmental Road
Ken
Log
an R
oad
Peak
D
owns
High
way
Gregory
Cement Hill
Lot 83 on CLM806555
Dichanthium sericeum (bluegrass) grassland; 11.8.11
Eucalyptus crebra ± Acacia rhodoxylon woodland; 11.11.1
Acacia shirleyi or A. catenulata low open forest; 11.11.2
Eucalyptus orgadophila open woodland; 11.8.5
Eucalyptus cambageana woodland to open forest with Acacia harpophylla (Ass 1); 11.4.8a
Vegetation Communities
Figure 2-8Peak Downs Hwy & Gregory Developmental Rd
- Alternate Intersection Arrangement
Clermont Coal Mine Project - Supplementary ReportQE06243/Supplementary Report/Graphics/Figure 2-8_road intersection-preferred arrangement.pdf
LEGENDClermont Mining LeaseConveyorHighway Diversion
5002500
metres
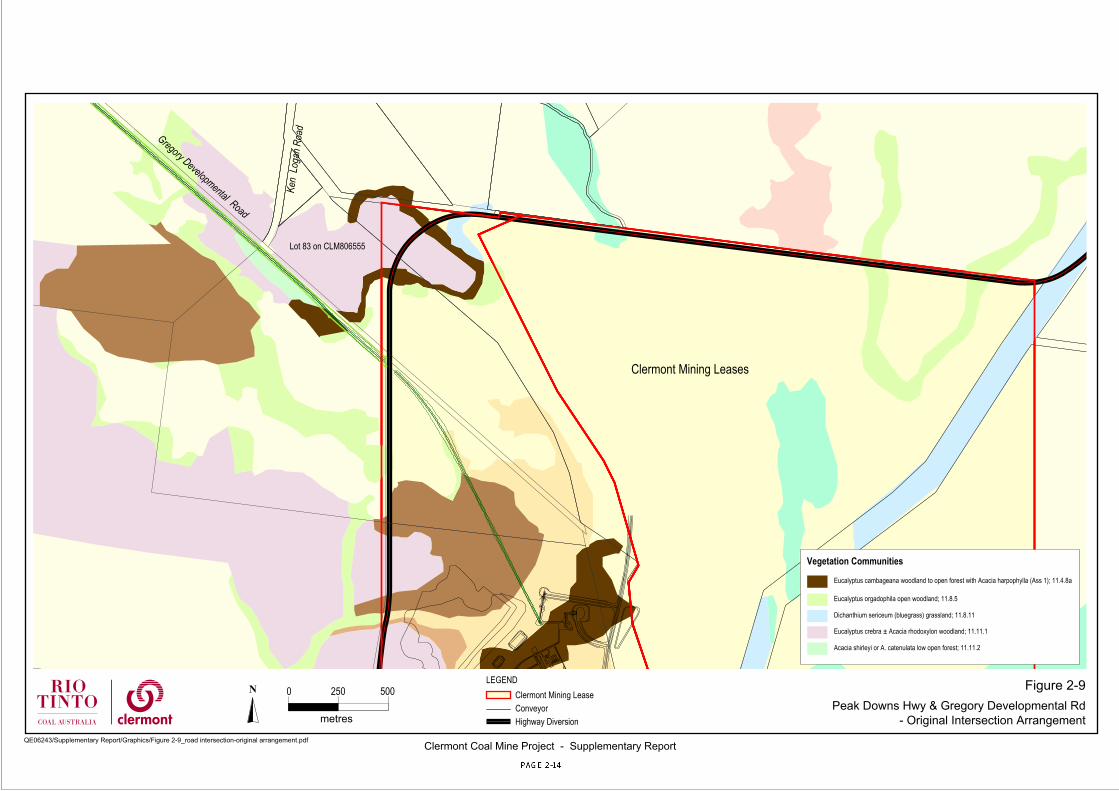
Blair Athol Mining Lease
Clermont Mining Leases
Gregory Developmental Road
Ken
Log
an R
oad
Peak
D
owns
High
way
Gregory
Cement Hill
Lot 83 on CLM806555
Dichanthium sericeum (bluegrass) grassland; 11.8.11
Eucalyptus crebra ± Acacia rhodoxylon woodland; 11.11.1
Acacia shirleyi or A. catenulata low open forest; 11.11.2
Eucalyptus orgadophila open woodland; 11.8.5
Eucalyptus cambageana woodland to open forest with Acacia harpophylla (Ass 1); 11.4.8a
Vegetation Communities
Figure 2-9Peak Downs Hwy & Gregory Developmental Rd
- Original Intersection Arrangement
Clermont Coal Mine Project - Supplementary ReportQE06243/Supplementary Report/Graphics/Figure 2-9_road intersection-original arrangement.pdf
LEGENDClermont Mining LeaseConveyorHighway Diversion
5002500
metres
Clermont Coal Mine Project – Supplementary Report PAGE 2-15
Figure 2-10 Revised Water Management System
Waste Dumps
Runoff
Runoff
Overflow toCreek
Overflow toCreek
Mine Water Dam(1000 ML)
Sedimentation Dam
Sedimentation Dam
Process Water Dam (127 ML)
Raw Water Dam (8 ML)
Industrial Area Dam (35 ML)
GroundwaterInflow
Rainfall & RunoffPit Dewatering (runoff)
Advanced DewateringBores
To Gowrie Creek Div
Overflow To Gowrie Creek Diversion
HV Wash
LV Wash
IndustrialArea
Codisposal Area
Wash Plant &Coal Handling
WTP
Haul Road DustSuppression Ex
Pit
To Blair Athol(existing pipeline)
Codisposal Slurry
Runoff
Runoff
ROMStockpile
Overflow
Haul Road Runoff
Overflow to GowrieCreek
Sedimentation Dam
Advanced Dewatering Dam (200 ML)
Decant
Runoff
On groundStorage
Tank
Haul Road DustSuppression In
Pit
Sedimentation Dam
Overflow to GowrieCreek
Runoff
Pit Dewatering (seepage)
ElevatedTank
Pit
Raw
/Fir
e W
ater
To Gowrie CreekDiversion
PAGE 2-16 Clermont Coal Mine Project – Supplementary Report
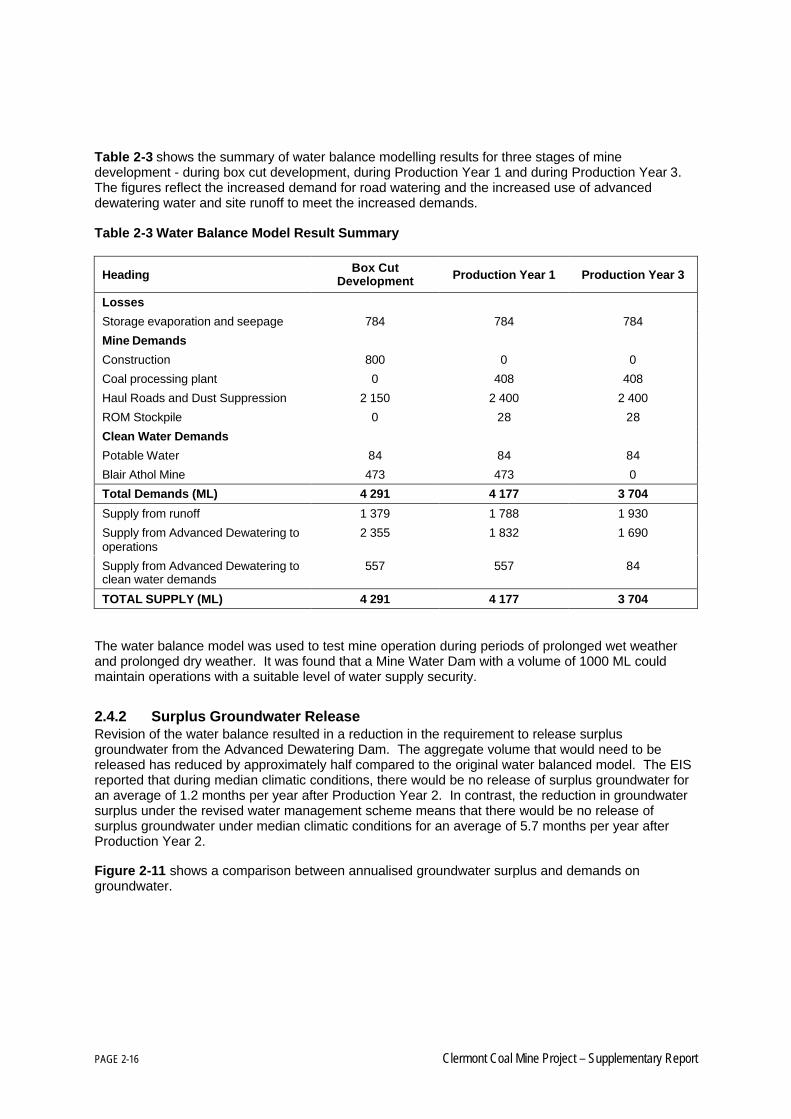
Table 2-3 shows the summary of water balance modelling results for three stages of minedevelopment - during box cut development, during Production Year 1 and during Production Year 3.The figures reflect the increased demand for road watering and the increased use of advanceddewatering water and site runoff to meet the increased demands.
Table 2-3 Water Balance Model Result Summary
Heading Box CutDevelopment Production Year 1 Production Year 3
Losses
Storage evaporation and seepage 784 784 784
Mine Demands
Construction 800 0 0
Coal processing plant 0 408 408
Haul Roads and Dust Suppression 2 150 2 400 2 400
ROM Stockpile 0 28 28
Clean Water Demands
Potable Water 84 84 84
Blair Athol Mine 473 473 0
Total Demands (ML) 4 291 4 177 3 704
Supply from runoff 1 379 1 788 1 930
Supply from Advanced Dewatering tooperations
2 355 1 832 1 690
Supply from Advanced Dewatering toclean water demands
557 557 84
TOTAL SUPPLY (ML) 4 291 4 177 3 704
The water balance model was used to test mine operation during periods of prolonged wet weatherand prolonged dry weather. It was found that a Mine Water Dam with a volume of 1000 ML couldmaintain operations with a suitable level of water supply security.
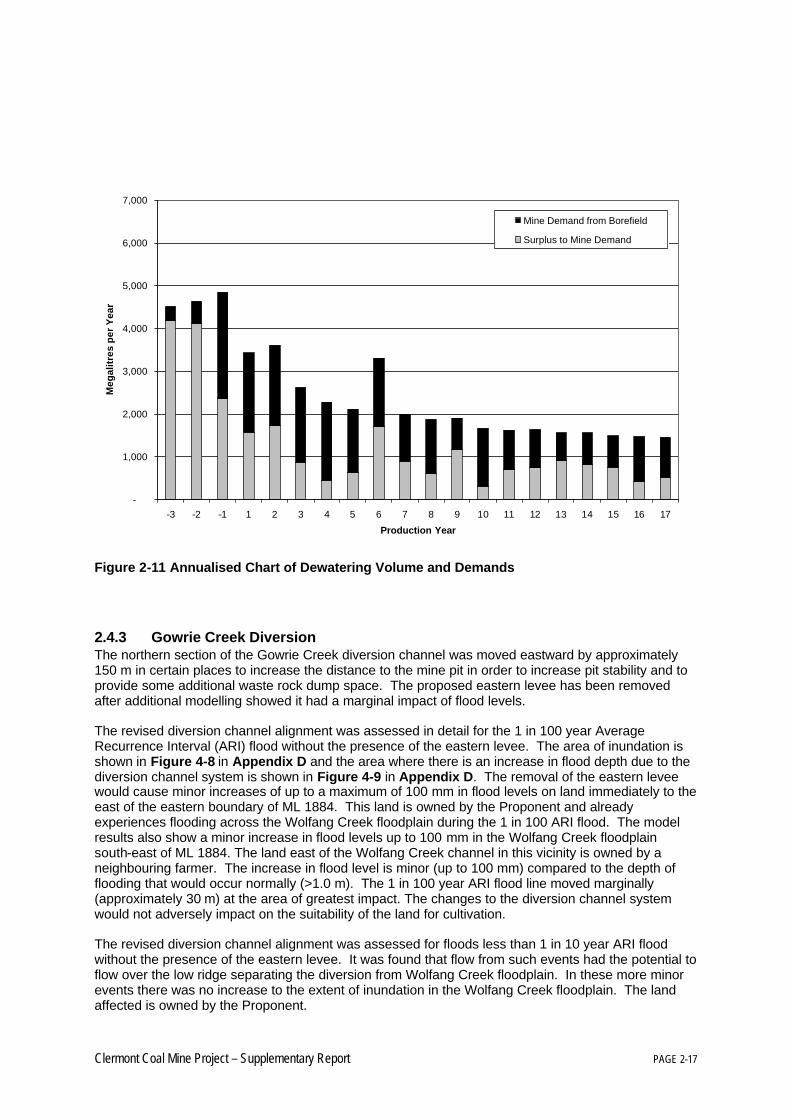
2.4.2 Surplus Groundwater ReleaseRevision of the water balance resulted in a reduction in the requirement to release surplusgroundwater from the Advanced Dewatering Dam. The aggregate volume that would need to bereleased has reduced by approximately half compared to the original water balanced model. The EISreported that during median climatic conditions, there would be no release of surplus groundwater foran average of 1.2 months per year after Production Year 2. In contrast, the reduction in groundwatersurplus under the revised water management scheme means that there would be no release ofsurplus groundwater under median climatic conditions for an average of 5.7 months per year afterProduction Year 2.
Figure 2-11 shows a comparison between annualised groundwater surplus and demands ongroundwater.
Clermont Coal Mine Project – Supplementary Report PAGE 2-17
-
1,000
2,000
3,000
4,000
5,000
6,000
7,000
-3 -2 -1 1 2 3 4 5 6 7 8 9 10 11 12 13 14 15 16 17
Production Year
Meg
alit
res
per
Yea
r
Mine Demand from Borefield
Surplus to Mine Demand
Figure 2-11 Annualised Chart of Dewatering Volume and Demands
2.4.3 Gowrie Creek DiversionThe northern section of the Gowrie Creek diversion channel was moved eastward by approximately150 m in certain places to increase the distance to the mine pit in order to increase pit stability and toprovide some additional waste rock dump space. The proposed eastern levee has been removedafter additional modelling showed it had a marginal impact of flood levels.
The revised diversion channel alignment was assessed in detail for the 1 in 100 year AverageRecurrence Interval (ARI) flood without the presence of the eastern levee. The area of inundation isshown in Figure 4-8 in Appendix D and the area where there is an increase in flood depth due to thediversion channel system is shown in Figure 4-9 in Appendix D. The removal of the eastern leveewould cause minor increases of up to a maximum of 100 mm in flood levels on land immediately to theeast of the eastern boundary of ML 1884. This land is owned by the Proponent and alreadyexperiences flooding across the Wolfang Creek floodplain during the 1 in 100 ARI flood. The modelresults also show a minor increase in flood levels up to 100 mm in the Wolfang Creek floodplainsouth-east of ML 1884. The land east of the Wolfang Creek channel in this vicinity is owned by aneighbouring farmer. The increase in flood level is minor (up to 100 mm) compared to the depth offlooding that would occur normally (>1.0 m). The 1 in 100 year ARI flood line moved marginally(approximately 30 m) at the area of greatest impact. The changes to the diversion channel systemwould not adversely impact on the suitability of the land for cultivation.
The revised diversion channel alignment was assessed for floods less than 1 in 10 year ARI floodwithout the presence of the eastern levee. It was found that flow from such events had the potential toflow over the low ridge separating the diversion from Wolfang Creek floodplain. In these more minorevents there was no increase to the extent of inundation in the Wolfang Creek floodplain. The landaffected is owned by the Proponent.
PAGE 2-18 Clermont Coal Mine Project – Supplementary Report
The modelling results for a 1 in 100 ARI event also showed that there would be a minor increase inflood levels (up to 100 mm) in the Gowrie and Tea Tree Creek floodplains north of the northernboundary of ML 1884. This is primarily due to the presence of the realigned Peak Downs Highway.The culverts under the highway have been designed to minimise this increased flood risk. The terrainin the area is steeper than the downstream floodplain this will result in limiting the spread of theflooding impacts upstream. In an extreme event (1 in 100 years), an additional area of land of up to5 ha could be temporarily inundated. This land is not cropped.
The height of the western Gowrie Creek levee that protects the pit has been increased to provideprotection during a 1 in 500 year flood event, compared to the 1 in 100 year criterion used in the EIS.This increase in height reduces the Annual Exceedance Probability of the pit being flooded duringoperations and after mine closure, from 1% to 0.2%. The increase in the height of the levee does notchange the assessment of flood impacts made in Section 4.2.4.2 of the EIS.
2.5 Coal ConveyorSince the EIS was prepared, Project optimisation has led to two changes in the overland conveyor thatwill transport coal from the Clermont Mining Leases (MLs) to the coal handling facilities on the BAM.These changes are:
§ alteration to the conveyor’s vertical alignment, so that it now goes under the Gregory Highwayand stock route, under the Blair Athol-Clermont railway line and under the BAM haul road; and
§ an alteration of the shielding over the overland conveyor.
2.5.1 Conveyor AlignmentThe original alignment of the coal conveyor between the Clermont MLs and BAM was above groundfor the full length of the conveyor. With further design work completed during the Project feasibilitystudy, parts of the coal conveyor will now be constructed underneath roads and railway lines. Thehorizontal alignment of the conveyor has not been changed.
The decision to locate the conveyor under the Gregory Highway, stock route and railway line has beenmade to improve access for conveyor maintenance. It will also enable the construction of themaintenance road next to the conveyor for a longer continuous length than when the conveyor wasconstructed over the highway, stock route and railway line, improving access to the conveyor.
The corridor for the overland coal conveyor is 30 m wide. The conveyor corridor will be fenced andwill contain the conveyor, a gravel road to allow access for maintenance and all associatedinfrastructure. All impacts will be limited to the conveyor corridor.
The length of the conveyor that passes beneath the Gregory Highway, stock route and railway line isapproximately 150 m, with the length of the conveyor being 13 kilometres. Impacts arising from theplacement of the conveyor beneath the Highway, stock route and railway line are very localised andcontained within the conveyor corridor. Erosion controls and drainage controls will be implemented aspart of the construction of the conveyors and associated infrastructure.
2.5.2 Conveyor ShieldingEngineering studies undertaken as part of the Project feasibility study identified a requirement formaintenance access from the conveyor service road on the northern side of the conveyor. Theshielding that was formerly proposed for the whole length of the northern side of the conveyor hastherefore been reduced to cover only those parts of the conveyor that are required to be shielded fornoise control. A total of one kilometre of shielding, centred on New Blair Athol homestead, will beprovided on the northern side of the conveyor to provide noise protection for the homestead.Similarly, 3 km of shielding will be provided on the southern side of the conveyor, centred on Old BlairAthol homestead to provide noise protection for that location.
The results of noise modelling for the revised conveyor configuration are presented in Section.4.2.
Clermont Coal Mine Project – Supplementary Report PAGE 2-19
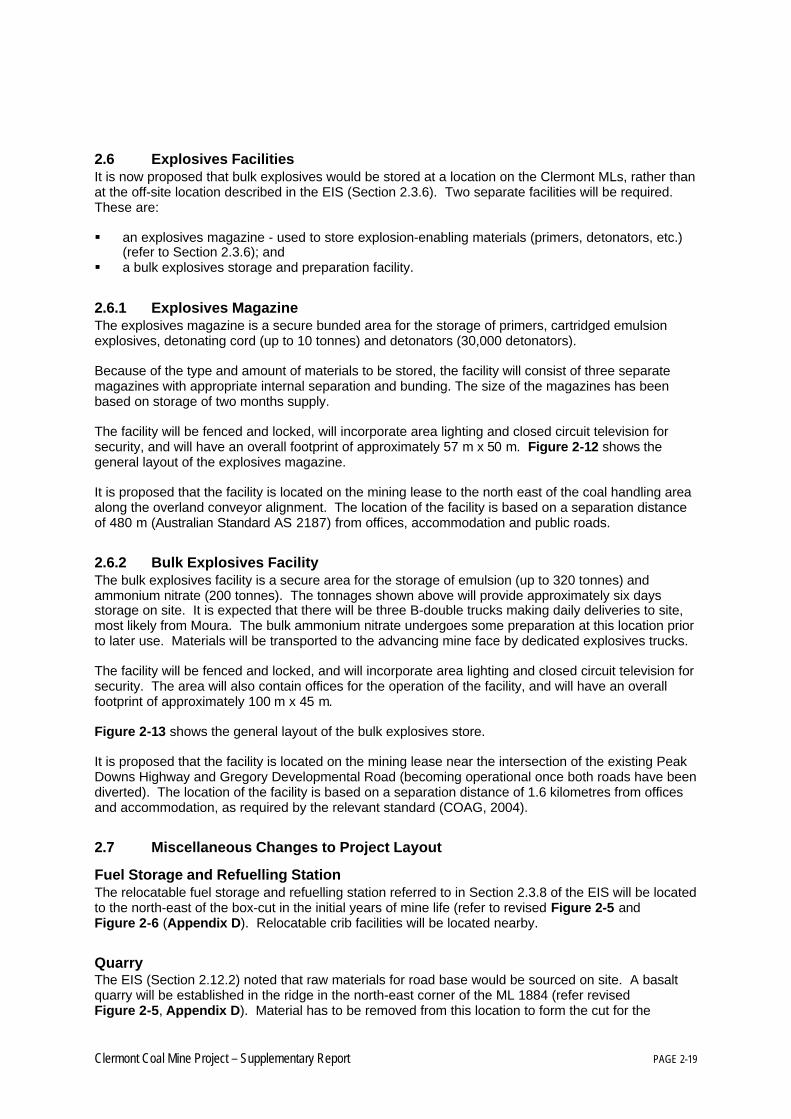
2.6 Explosives FacilitiesIt is now proposed that bulk explosives would be stored at a location on the Clermont MLs, rather thanat the off-site location described in the EIS (Section 2.3.6). Two separate facilities will be required.These are:
§ an explosives magazine - used to store explosion-enabling materials (primers, detonators, etc.)(refer to Section 2.3.6); and
§ a bulk explosives storage and preparation facility.
2.6.1 Explosives MagazineThe explosives magazine is a secure bunded area for the storage of primers, cartridged emulsionexplosives, detonating cord (up to 10 tonnes) and detonators (30,000 detonators).
Because of the type and amount of materials to be stored, the facility will consist of three separatemagazines with appropriate internal separation and bunding. The size of the magazines has beenbased on storage of two months supply.
The facility will be fenced and locked, will incorporate area lighting and closed circuit television forsecurity, and will have an overall footprint of approximately 57 m x 50 m. Figure 2-12 shows thegeneral layout of the explosives magazine.
It is proposed that the facility is located on the mining lease to the north east of the coal handling areaalong the overland conveyor alignment. The location of the facility is based on a separation distanceof 480 m (Australian Standard AS 2187) from offices, accommodation and public roads.
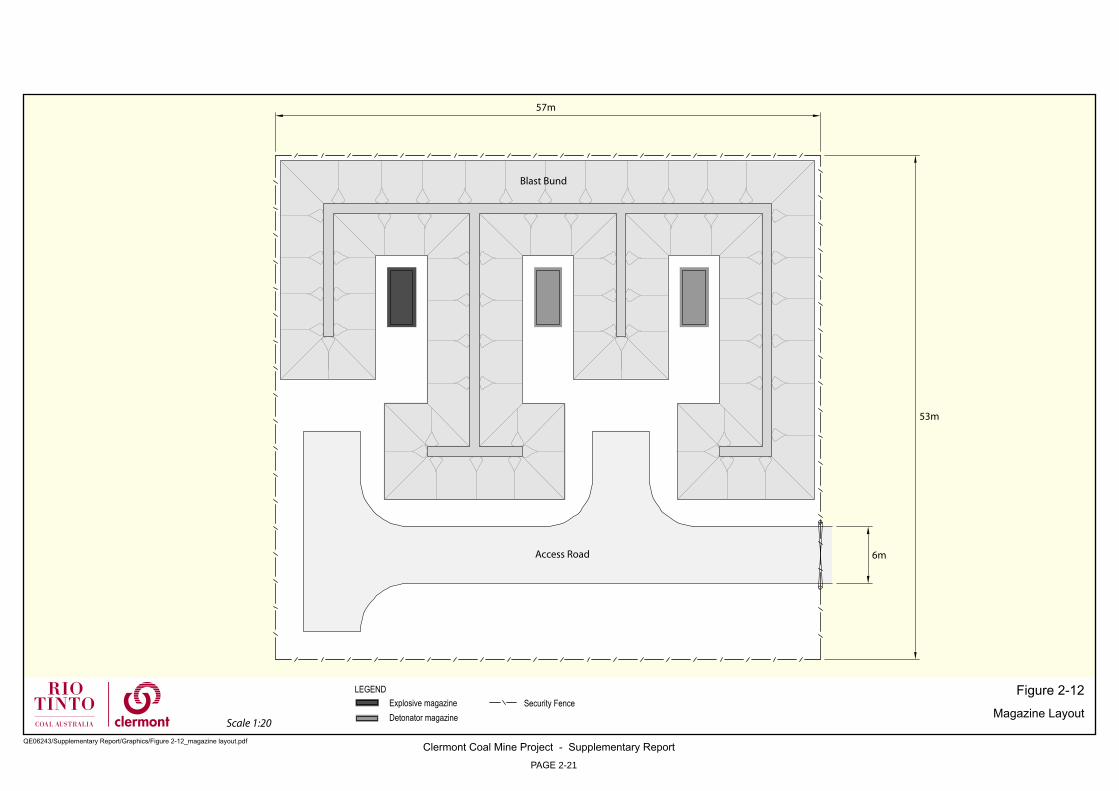
2.6.2 Bulk Explosives FacilityThe bulk explosives facility is a secure area for the storage of emulsion (up to 320 tonnes) andammonium nitrate (200 tonnes). The tonnages shown above will provide approximately six daysstorage on site. It is expected that there will be three B-double trucks making daily deliveries to site,most likely from Moura. The bulk ammonium nitrate undergoes some preparation at this location priorto later use. Materials will be transported to the advancing mine face by dedicated explosives trucks.
The facility will be fenced and locked, and will incorporate area lighting and closed circuit television forsecurity. The area will also contain offices for the operation of the facility, and will have an overallfootprint of approximately 100 m x 45 m.
Figure 2-13 shows the general layout of the bulk explosives store.
It is proposed that the facility is located on the mining lease near the intersection of the existing PeakDowns Highway and Gregory Developmental Road (becoming operational once both roads have beendiverted). The location of the facility is based on a separation distance of 1.6 kilometres from officesand accommodation, as required by the relevant standard (COAG, 2004).
2.7 Miscellaneous Changes to Project Layout
Fuel Storage and Refuelling StationThe relocatable fuel storage and refuelling station referred to in Section 2.3.8 of the EIS will be locatedto the north-east of the box-cut in the initial years of mine life (refer to revised Figure 2-5 andFigure 2-6 (Appendix D). Relocatable crib facilities will be located nearby.
QuarryThe EIS (Section 2.12.2) noted that raw materials for road base would be sourced on site. A basaltquarry will be established in the ridge in the north-east corner of the ML 1884 (refer revisedFigure 2-5, Appendix D). Material has to be removed from this location to form the cut for the

PAGE 2-20 Clermont Coal Mine Project – Supplementary Report
realignment of the Peak Downs Highway. The quarry will extend the dimensions of this cut in thislocation. The material will be used for road base and other construction purposes during theconstruction phase of the Project.
Site Construction VillageIn order to mitigate the impact of increased demand on accommodation in the Clermont area, it isproposed that the Site Construction Village be kept operational after the end of the constructionphase. This will provide additional accommodation capacity during the overlap period when theClermont Coal Mine and Blair Athol Mine are both in production. The Site Construction Village wouldbe closed and decommissioned once the Blair Athol Mine ceases production.
Access Road
Blast Bund
6m
53m
57m
Scale 1:20
Figure 2-12Magazine Layout
Clermont Coal Mine Project - Supplementary ReportPAGE 2-21
QE06243/Supplementary Report/Graphics/Figure 2-12_magazine layout.pdf
LEGENDExplosive magazineDetonator magazine
Security Fence
Scale 1:200
Gasser
AmmoniumNitrateStore
Emulsion Tanks
Mobile Mixing Unit Route
Raw Material Delivery Route
Workshop
Truckport
100m
45m
Office & Crib Room
Storage Tank
Figure 2-13Bulk Explosive Facility Layout
Clermont Coal Mine Project - Supplementary ReportPAGE 2-22
QE06243/Supplementary Report/Graphics/Figure 2-13_bulk explosive facility.pdf
LEGENDSecurity fence
Clermont Coal Mine Project – Supplementary Report PAGE 3-1
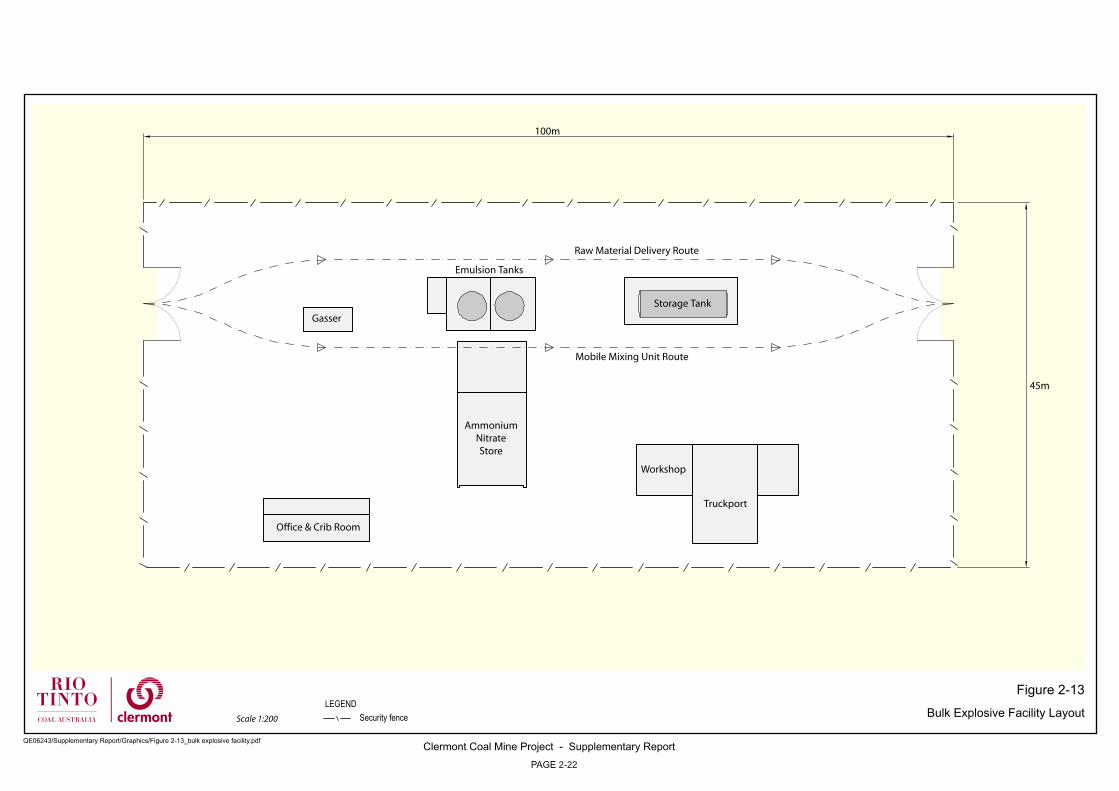
3. Air Quality
3.1 Clermont Coal Mine Project – Revised Dust Modelling ResultsIn the process of assessing the potential impacts associated with the introduction of the IPCC systemfor the Project, it was noticed that some of the emission rates used in the air quality modellingconducted for the EIS were incorrect. This was caused by a transcription error converting theemission estimation results into a suitable format for dispersion modelling. As the Industrial SourceComplex version 3 (ISC3) model utilises flux rates for area sources (i.e. g/m2/s), the erroneousnumbers were not immediately apparent as would have been the case had total emission rates beenused.
Modelling has now been revised, incorporating the corrected emission rates.
The cumulative predicted levels at the nearest sensitive locations to the Project are outlined inTable 3-1 and Table 3-2 for the Production Years 1 and 8 respectively. Note that these predictedlevels include the assumed background levels.
Table 3-1 Revised Predicted Dust Concentrations and Deposition Rates at Nearby SensitiveLocations (including background levels) – Production Year 1
Residence Max. 24-hr PM10
(µg/m³)
[days > 50 µg/m³]
Annual PM10
(µg/m³)
Annual TSP
(µg/m³)
Annual DustDeposition
(mg/m²/day)
EPP(Air) goal 150 50 90 120
Araluen Residence 129.2 [9] 17.7 25.1 35.4
Homelea Downs Residence 1, 2 47.9 15.8 40.9 30.4
Fleurs Residence 1, 2 54.5 [1] 15.8 40.9 32.0
Crillee Residence 1 45.3 16.9 42.2 37.1
Airport Residence 61.5 [2] 17.5 21.8 33.6
Old Blair Athol Homestead 1, 2 43.1 17.7 42.9 38.5
New Blair Athol Homestead 1, 2 47.5 17.0 42.2 34.5
Glenmore Residence 83.5 [9] 19.9 51.3 47.7Notes:1 Sites with no baseline TSP data. Baseline TSP data for these sites were estimated as the mean of TSP concentrations atsites Airport, Glenmore and Araluen2 Sites with no baseline deposited dust data. Baseline dust for these sites was estimated as the mean of deposited dustconcentrations at sites Airport, Crillee, Glenmore and Fleurs.
PAGE 3-2 Clermont Coal Mine Project – Supplementary Report
Table 3-2 Revised Predicted Total Dust Concentrations and Deposition Rates at NearbySensitive Locations (including background levels) – Production Year 8
Residence Max. 24-hr PM10
(µg/m³)
[days > 50 µg/m³]
Annual PM10
(µg/m³)
Annual TSP
(µg/m³)
Annual DustDeposition
(mg/m²/day)
EPP(Air) goal 150 50 90 120
Araluen Residence 65.5 [1] 16.4 23.4 30.5
Homelea Downs Residence 1, 2 41.0 15.7 40.7 31.2
Fleurs Residence 1, 2 50.2 [1] 15.7 40.7 31.0
Crillee Residence 1 53.5 [2] 17.3 42.9 48.4
Airport Residence 48.6 18.0 22.8 48.1
Old Blair Athol Homestead 1, 2 42.7 17.0 42.2 38.0
New Blair Athol Homestead 1, 2 38.4 16.3 41.4 34.5
Glenmore Residence 62.1 [5] 17.4 48.6 40.7Notes:1 Sites with no baseline TSP data. Baseline TSP data for these sites was estimated as the mean of TSP concentrations at sitesAirport, Glenmore and Araluen2 Sites with no baseline deposited dust data. Baseline dust for these sites was estimated as the mean of deposited dustconcentrations at sites Airport, Crillee, Glenmore and Fleurs.
Graphical comparisons of the original EIS results and the revised results are presented inAppendix A, Figure A-1 to Figure A-8. The annual average results show very little variation, whilethe short-term 24-hr average PM10 levels show some degree of variation, the most notableexperienced at the Araluen residence in Production Year 1 (increasing from 80.7 µg/m³ to 129.2 µg/m³as a 24-hr maximum PM10). A 24-hour PM10 level of 50 µg/m³ would be exceeded 9 times duringProduction Year 1 at Araluen and Glenmore. The maximum PM10 levels at Araluen and Glenmorewould decline after Production Year 1 as the mining activity moved to the south. All results remainbelow the relevant goal from the Queensland Environmental Protection Agency (EPA) EnvironmentalProtection (Air) Policy 1997a (EPP (Air)) (shown as a solid line).
The 24-hour PM10 level of 50 µg/m³ is equivalent to the National Environmental Protection Measure(NEPM) goal. The NEPM goals are not designed to be used as ‘beyond-the-boundary’ compliancecriteria for specific developments, unlike the EPP (Air). The NEPM goal includes five exceedancesper annum of the 50 µg/m³ criterion.
The 50 µg/m3 criterion used in the NEPM is based on an assessment of health risks identified fromepidemiological studies of PM10 exposure in large US cities. Urban atmospheres are dominated byparticles emitted from combustion sources (e.g. motor vehicles, heating, industrial processes). Theseparticles are predominantly in the lower part of the PM10 size range, less than 1-2 µm. They also tendto be carbonaceous and contain a variety of products of incomplete combustion such as PAHs, andother toxic compounds. The size and chemical characteristics of these urban particles are importantwith respect to health effects.
On the other hand, particles emitted from activities such as mining, construction and agriculture arepredominantly generated from soil and rock and because they are mechanically generated they tendto be coarser. Mine dusts have relatively small fractions below 2 µm and are heavily weightedtowards the higher end of the PM10 size range (and above). There is far less potential for these typesof dust to penetrate deep into the respiratory system and cause adverse health effects.
The exceedances of the 24-hour PM10 level of 50 µg/m³ at Araluen and Glenmore in Production Year 1do not constitute a health risk.
Clermont Coal Mine Project – Supplementary Report PAGE 3-3
3.2 Air Quality – In-Pit Crushing and Conveying
Variation from EISIn the EIS, the air quality assessment for the project was based on all waste rock being removed fromthe pit via haul trucks. As part of the feasibility study for the Project, the option of installing a mobilein-pit crusher and conveyor (IPCC) system for overburden removal is being investigated. The IPCCsystem would require nine fewer operational trucks, one less grader and less machine time for dozersand haul road watering. The number of trucks required to move coal would be the same, and thefootprint and final configuration of the dumps and pit would be basically the same.
The IPCC system is designed to operate at a maximum of 12 000 tonnes of waste rock per hour(average of 10 000 tonnes per hour). For the purposes of this assessment, the conveying system wasassumed to continuously operate at its maximum rate of 12 000 tonnes per hour.
Initially the waste rock spreader will be operating on the North West dump (Production Year 1 to 4).During Production Year 4 the overburden spreader will begin returning the waste rock to the pit forin-pit dumping and will move south at approximately 250 m per year following the mining path. TheSouth West waste dump will be constructed with dump trucks, as reported in the EIS.
MethodologyThe prediction and assessment of dust impacts utilises the same methodology as that in the EIS,relying on:
§ generation of required input meteorology for the ISC3 model using the TAPM model andCALMET models, as well as observational data;
§ estimation of emission rates based on accepted methods such as those developed byEnvironment Australia now the Department of the Environment and Heritage and the USEPA.Estimated emission rates are a required input for the ISC3 model;
§ use of the ISC3 dispersion model to predict pollutant ground level concentrations; and§ comparison of predicted levels against the criteria presented in the EIS.
3.2.1 Emissions EstimationAs in the EIS, estimation of particulate emissions from activities at the project involved the followinggeneral steps:
§ identification of key activities likely to generate airborne particulates;§ obtaining for each operation the best available emission estimation techniques - from various
sources, including the National Pollutant Inventory (NPI) Emission Estimation Technique Manualfor Mining (Environment Australia, 2003) and the USEPA’s AP-42 Compilation of Air PollutantEmission Factors (USEPA, 1998); and
§ calculation of airborne particulate emissions from the operations data for each activity and theemission factors. Where necessary, additional approximations were made based on bestavailable information. The emissions used in modelling are given below in Section 3.2.3.
3.2.2 Dust Emission Sources and ControlsThe main dust generating activities at the project were characterised to allow the estimation of dustemissions. A summary of particulate emissions from the main dust generating activities used as inputinto the ISC3 dispersion model for the IPCC option is presented in Appendix A.1 Table A-1. Aconservative assumption that dust emissions from the IPCC were uncontrolled was made.
The dust emission estimates include assumptions that dust emission controls are utilised on many ofthe dust emitting processes. The specific controls assumed to be utilised to reduce dust emissionsare presented in Appendix A.1 Table A-2.
PAGE 3-4 Clermont Coal Mine Project – Supplementary Report
3.2.3 Dispersion Modelling InputsThe identified dust emission sources were allocated to specific emission areas for input to the ISC3dispersion model. A description of how dust emission sources were allocated to modelling areas ispresented in Appendix A.1 Table A-3. The allocation of sources was made to decrease the amountof time required for the dispersion model to process the inputs. Each modelling area was defined intoan appropriate source type as outlined in Appendix A.1 Table A-4 and an average particle sizedistribution defined to allow the model to calculate dry depletion of the particulate plume.
3.3 Air – Potential ImpactsAs in the EIS, modelling of dust impacts was based on Production Years 1 and 8, which wereconsidered to represent the stages of the mine life with the greatest potential for air quality impacts.Production Year 1 is characterised by a high rate of overburden removal near the surface in the northof the mine, and Production Year 8 has a high rate of overall activity and with the South-Westout-of-pit dump active.
3.3.1 Sensitive LocationsThe predicted dust concentrations resulting from the inclusion of the IPCC system at the nearestsensitive locations to the Project are outlined in Table 3-3 for the Production Year 1 modellingscenario and Table 3-4 for Production Year 8. These predicted levels include the assumedbackground levels identified in the EIS. The number of days per annum that 24-hr PM10 is predicted toexceed 50 µg/m³ is also shown.
Table 3-3 Predicted Dust Concentrations and Deposition Rates at Nearby Sensitive Locations(including background levels) – Production Year 1
Residence Max. 24-hr PM10
(µg/m³)
[days > 50 µg/m³]
Annual PM10
(µg/m³)
Annual TSP
(µg/m³)
Annual DustDeposition
(mg/m²/day)
EPP(Air) Goal 150 50 90 120Araluen Residence 109.7 [5] 17.0 24.1 33.3
Homelea Downs Residence 1, 2 39.3 15.7 40.7 30.0
Fleurs Residence 1, 2 68.2 [1] 15.6 40.7 31.8
Crillee Residence 1 53.9 [1] 16.7 41.8 37.3
Airport Residence 57.1 [2] 17.2 21.3 33.6
Old Blair Athol Homestead 1, 2 44.7 17.7 42.5 38.8
New Blair Athol Homestead 1, 2 53.6 [1] 17.0 41.9 34.6
Glenmore Residence 125.2 [12] 20.5 50.8 48.8Notes:1 Sites with no baseline TSP data. Baseline TSP data for these sites were estimated as the mean of TSP concentrations atsites Airport, Glenmore and Araluen2 Sites with no baseline deposited dust data. Baseline dust for these sites was estimated as the mean of deposited dustconcentrations at sites Airport, Crillee, Glenmore and Fleurs.
Clermont Coal Mine Project – Supplementary Report PAGE 3-5
Table 3-4 Predicted Total Dust Concentrations and Deposition Rates at Nearby SensitiveLocations (including background levels) – Production Year 8
Residence Max. 24-hr PM10
(µg/m³)
[days > 50 µg/m³]
Annual PM10
(µg/m³)
Annual TSP
(µg/m³)
Annual DustDeposition
(mg/m²/day)
EPP(Air) Goal 150 50 90 120
Araluen Residence 81.5 [3] 16.6 23.6 31.2
Homelea Downs Residence 1, 2 49.2 15.8 40.9 31.8
Fleurs Residence 1, 2 58.2 [1] 15.8 40.8 31.5
Crillee Residence 1 61.8 [6] 17.8 43.3 52.3
Airport Residence 59.6 [1] 18.6 23.3 52.2
Old Blair Athol Homestead 1, 2 45.7 17.3 42.3 39.6
New Blair Athol Homestead 1, 2 40.8 16.5 41.5 35.4
Glenmore Residence 73.2 [6] 17.8 48.8 42.3Notes:1 Sites with no baseline TSP data. Baseline TSP data for these sites were estimated as the mean of TSP concentrations atsites Airport, Glenmore and Araluen2 Sites with no baseline deposited dust data. Baseline dust for these sites was estimated as the mean of deposited dustconcentrations at sites Airport, Crillee, Glenmore and Fleurs.
Predicted impacts under the IPCC system are compared to the truck and shovel base case results inAppendix A.2 Figures A-9 to A-16.
3.3.2 PM10
Annual average levels of PM10 at the nearest sensitive location (Araluen) during Production Year 1with the IPCC system (refer to Table 3-3) are predicted to be only 17 µg/m³ including the assumedbackground concentration of about 15 µg/m³. While Araluen is the closest residence to the Project,meteorological conditions in the area result in slightly higher concentrations being predicted atGlenmore (20 µg/m³). These levels are well below the relevant EPP(Air) annual average goal for PM10of 50 µg/m³.
Annual average levels of PM10 for the Project during Production Year 8 with the IPCC system(Table 3-4) also remain low with Araluen predicted to be 16.6 µg/m³ and the highest level predicted atthe Airport (18.6 µg/m³ with background). These levels are also well below the relevant EPP (Air) goalfor PM10 of 50 µg/m³.
Predicted 24-hour concentrations of PM10 are also within the relevant EPP (Air) goal of 150 µg/m³. Thehighest predicted 24-hour levels in Production Year 1 are at Glenmore with 125.2 µg/m³ and Araluenwith 109.7 µg/m³. It is predicted that a 24-hour level of 50 µg/m³ will be exceeded 12 times atGlenmore and 5 times at Araluen during Production Year 1. The highest predicted 24-hour levels inProduction Year 8 are at Glenmore with 73.2 µg/m³ and Araluen with 81.5 µg/m³. It is predicted that a24-hour level of 50 µg/m³ will be exceeded six times at Glenmore and 3 times at Araluen in ProductionYear 8.
The 24-hour PM10 level of 50 µg/m³ is equivalent to the National Environmental Protection Measure(NEPM) goal. The NEPM goals are not designed to be used as ‘beyond-the-boundary’ compliancecriteria for specific developments, unlike the EPP (Air). The NEPM goal includes five exceedancesper annum of the 50 µg/m³ criterion. The irrelevance of the NEPM goal for the Clermont situation isdiscussed in Section 3.1 above. The exceedances of the 24-hour PM10 level of 50 µg/m³ at Araluenand Glenmore do not constitute a health risk.
PAGE 3-6 Clermont Coal Mine Project – Supplementary Report
3.3.3 TSPThe maximum predicted annual average concentrations of TSP are at Glenmore in Production Years1 and 8 (50.8 µg/m³ and 48.8 µg/m³ respectively). These concentrations are well below the relevantEPP (Air) goal of 90 µg/m³.
3.3.4 Dust DepositionAs with the predicted concentrations of suspended particles, the predicted levels of deposited dust arealso well below the relevant EPP(Air) goal of 120 mg/m²/day as an annual average. The highestpredicted levels due to the Project are 48.8 mg/m²/day (Glenmore) in Production Year 1 and 52.3mg/m²/day (Crillee) in Production Year 8.
3.3.5 Discussion of IPCC ResultsA comparison of the model results at Production Years 1 and 8 with and without an IPCC system arepresented graphically in Appendix A.2 Figures A-9 to A-16.
The predicted dust levels associated with the IPCC system show that, relative to the base case(without the IPCC system), the annual PM10, TSP and deposited dust levels show little change inProduction Year 1 and 8. The maximum 24-hour PM10 level in Production Year 1 increases from 83.5to 125.2 µg/m³ at Glenmore and decreases from 129.2 to 109.7 µg/m³ at Araluen. In ProductionYear 8 there are slight increases in the maximum 24-hour PM10 level at all sensitive receptors. Modelresults indicate that with or without an IPCC system, predicted particulate levels will be below therelevant EPP (Air) goals.
The emissions modelled for the IPCC system were conservatively high, as it was assumed that therewere no dust controls in place. The IPCC system in an uncontrolled state represents the secondhighest dust emission source, after ‘wheel generated dust’ (refer Appendix A.1 Table A-1).
Clermont Coal Mine Project – Supplementary Report PAGE 4-1
4. Noise and Vibration
4.1 Noise and Vibration Assessment - In Pit Crushing and ConveyingThe noise and vibration assessment for the Project in the EIS was based on all waste rock beingremoved from the pit via haul trucks. As part of the feasibility study for the Project, the option ofinstalling a mobile in-pit crusher and conveyor (IPCC) system for overburden removal is beinginvestigated. The IPCC system would require nine fewer operational trucks, one less grader and lessmachine time for dozers and haul road watering. The number of trucks required to move coal would bethe same, and the footprint and final configuration of the dumps and pit would be basically the same.
The IPCC system is designed to operate at a maximum of 12 000 tonnes of waste rock per hour(average of 10 000 tonnes per hour). For the purposes of this assessment, the IPCC conveyingsystem is assumed to continuously operate at its maximum rate of 12 000 tonnes per hour.
Initially the waste rock spreader will be operating on the North West dump (Production Years 1 to 4).During Production Year 4 the overburden spreader will begin returning the waste rock to the pit forin-pit dumping and will move forward at approximately 250 m per year following the mining path. TheSouth West waste dump will be constructed with dump trucks, not the spreader, as in the EIS.
4.1.1 Noise ModellingIn order to determine the extent of noise emission from the site, a 3D computer noise model has beendeveloped. This model was developed using SoundPLAN 6.1 in conjunction with topographicinformation from the EIS provided by the Proponent (refer EIS Section 7.3.1). SoundPLAN is amodelling package that is accepted and endorsed by numerous agencies Australia-wide, including theEPA. The model is also widely accepted worldwide. The CONCAWE prediction method was used.The accuracy of this method is discussed in Appendix M4 of the EIS.
The number of units of mobile equipment working at any particular time with the IPCC option in placewas provided by the Proponent and is presented in Table 4-1. The sound power levels of equipmentand location of the equipment in the noise model are shown in Appendix B.1 and Appendix B.2.
As in the EIS, the modelling of noise impacts was based on Production Years 1 and 8, which wereconsidered to represent the stages of the mine life with the greatest potential for noise impacts.Production Year 1 is characterised by a high rate of overburden removal near the surface in the northof the mine, and Production Year 8 has a high rate of overall activity and with the South-Westout-of-pit dump active.
PAGE 4-2 Clermont Coal Mine Project – Supplementary Report
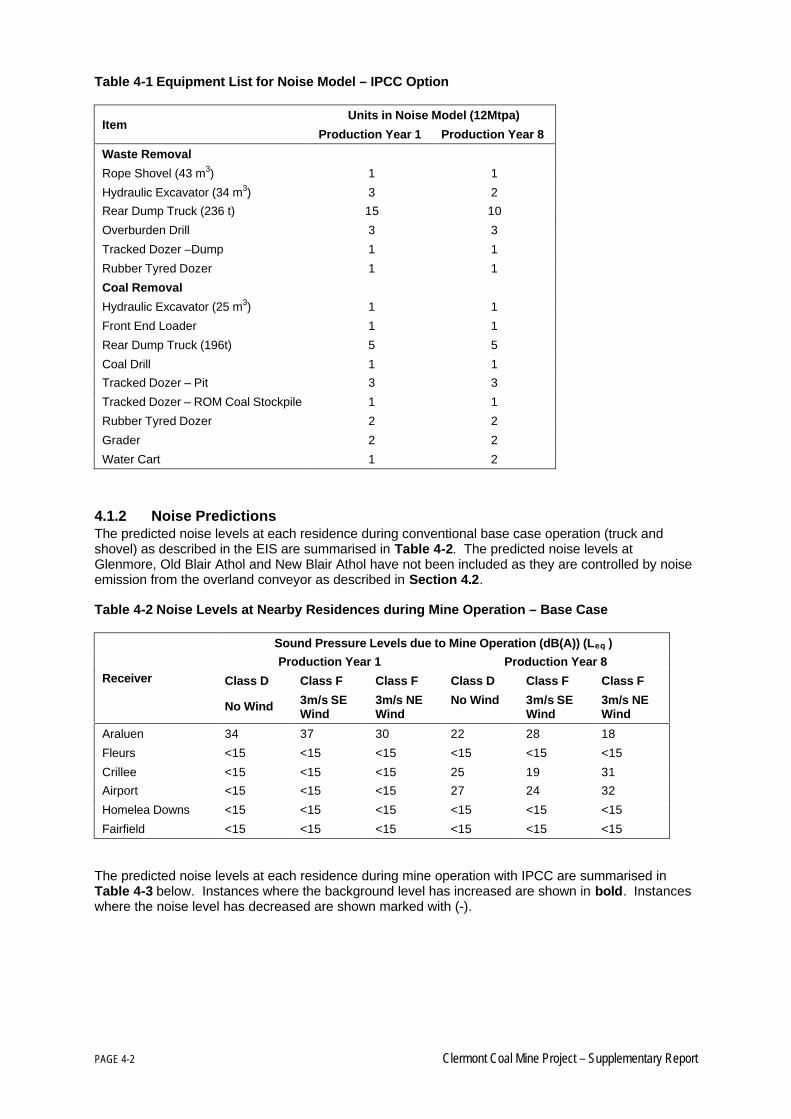
Table 4-1 Equipment List for Noise Model – IPCC Option
Units in Noise Model (12Mtpa)Item
Production Year 1 Production Year 8
Waste Removal
Rope Shovel (43 m3) 1 1
Hydraulic Excavator (34 m3) 3 2
Rear Dump Truck (236 t) 15 10
Overburden Drill 3 3
Tracked Dozer –Dump 1 1
Rubber Tyred Dozer 1 1
Coal Removal
Hydraulic Excavator (25 m3) 1 1
Front End Loader 1 1
Rear Dump Truck (196t) 5 5
Coal Drill 1 1
Tracked Dozer – Pit 3 3
Tracked Dozer – ROM Coal Stockpile 1 1
Rubber Tyred Dozer 2 2
Grader 2 2
Water Cart 1 2
4.1.2 Noise PredictionsThe predicted noise levels at each residence during conventional base case operation (truck andshovel) as described in the EIS are summarised in Table 4-2. The predicted noise levels atGlenmore, Old Blair Athol and New Blair Athol have not been included as they are controlled by noiseemission from the overland conveyor as described in Section 4.2.
Table 4-2 Noise Levels at Nearby Residences during Mine Operation – Base Case
Sound Pressure Levels due to Mine Operation (dB(A)) (Leq )
Production Year 1 Production Year 8
Class D Class F Class F Class D Class F Class FReceiver
No Wind 3m/s SEWind
3m/s NEWind
No Wind 3m/s SEWind
3m/s NEWind
Araluen 34 37 30 22 28 18
Fleurs <15 <15 <15 <15 <15 <15
Crillee <15 <15 <15 25 19 31
Airport <15 <15 <15 27 24 32
Homelea Downs <15 <15 <15 <15 <15 <15
Fairfield <15 <15 <15 <15 <15 <15
The predicted noise levels at each residence during mine operation with IPCC are summarised inTable 4-3 below. Instances where the background level has increased are shown in bold. Instanceswhere the noise level has decreased are shown marked with (-).
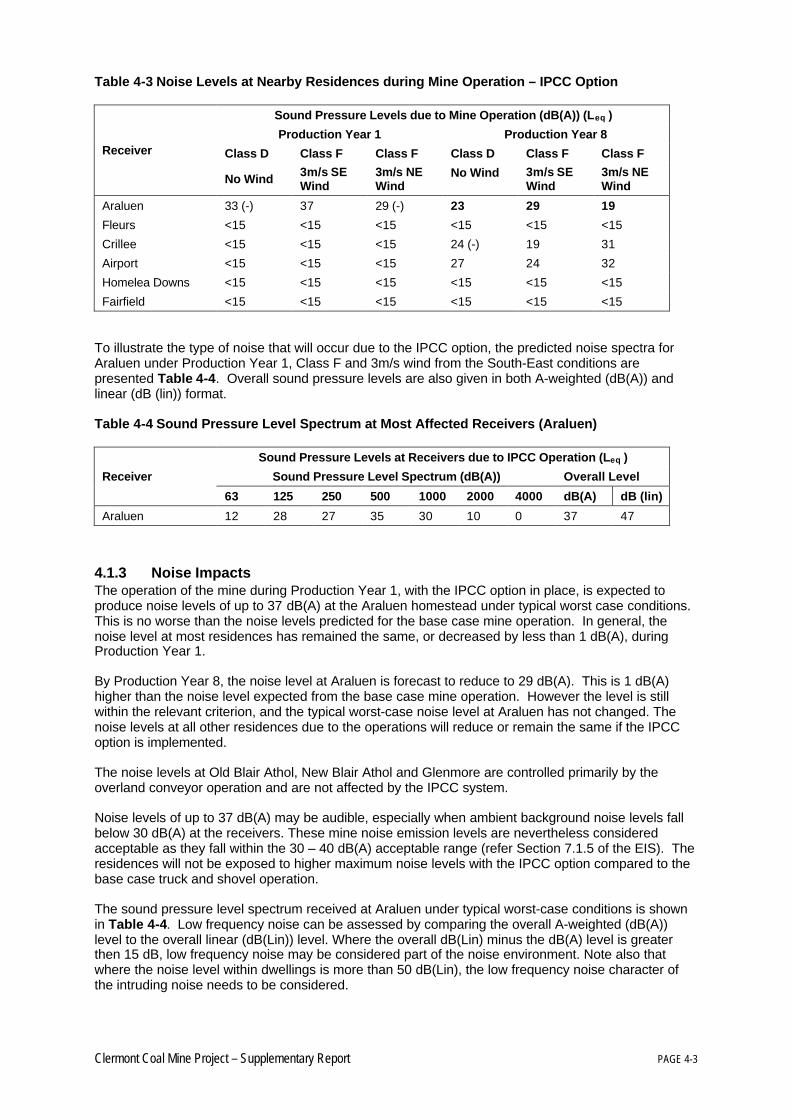
Clermont Coal Mine Project – Supplementary Report PAGE 4-3
Table 4-3 Noise Levels at Nearby Residences during Mine Operation – IPCC Option
Sound Pressure Levels due to Mine Operation (dB(A)) (Leq )
Production Year 1 Production Year 8
Class D Class F Class F Class D Class F Class FReceiver
No Wind 3m/s SEWind
3m/s NEWind
No Wind 3m/s SEWind
3m/s NEWind
Araluen 33 (-) 37 29 (-) 23 29 19
Fleurs <15 <15 <15 <15 <15 <15
Crillee <15 <15 <15 24 (-) 19 31
Airport <15 <15 <15 27 24 32
Homelea Downs <15 <15 <15 <15 <15 <15
Fairfield <15 <15 <15 <15 <15 <15
To illustrate the type of noise that will occur due to the IPCC option, the predicted noise spectra forAraluen under Production Year 1, Class F and 3m/s wind from the South-East conditions arepresented Table 4-4. Overall sound pressure levels are also given in both A-weighted (dB(A)) andlinear (dB (lin)) format.
Table 4-4 Sound Pressure Level Spectrum at Most Affected Receivers (Araluen)
Sound Pressure Levels at Receivers due to IPCC Operation (Leq )
Sound Pressure Level Spectrum (dB(A)) Overall LevelReceiver
63 125 250 500 1000 2000 4000 dB(A) dB (lin)
Araluen 12 28 27 35 30 10 0 37 47
4.1.3 Noise ImpactsThe operation of the mine during Production Year 1, with the IPCC option in place, is expected toproduce noise levels of up to 37 dB(A) at the Araluen homestead under typical worst case conditions.This is no worse than the noise levels predicted for the base case mine operation. In general, thenoise level at most residences has remained the same, or decreased by less than 1 dB(A), duringProduction Year 1.
By Production Year 8, the noise level at Araluen is forecast to reduce to 29 dB(A). This is 1 dB(A)higher than the noise level expected from the base case mine operation. However the level is stillwithin the relevant criterion, and the typical worst-case noise level at Araluen has not changed. Thenoise levels at all other residences due to the operations will reduce or remain the same if the IPCCoption is implemented.
The noise levels at Old Blair Athol, New Blair Athol and Glenmore are controlled primarily by theoverland conveyor operation and are not affected by the IPCC system.
Noise levels of up to 37 dB(A) may be audible, especially when ambient background noise levels fallbelow 30 dB(A) at the receivers. These mine noise emission levels are nevertheless consideredacceptable as they fall within the 30 – 40 dB(A) acceptable range (refer Section 7.1.5 of the EIS). Theresidences will not be exposed to higher maximum noise levels with the IPCC option compared to thebase case truck and shovel operation.
The sound pressure level spectrum received at Araluen under typical worst-case conditions is shownin Table 4-4. Low frequency noise can be assessed by comparing the overall A-weighted (dB(A))level to the overall linear (dB(Lin)) level. Where the overall dB(Lin) minus the dB(A) level is greaterthen 15 dB, low frequency noise may be considered part of the noise environment. Note also thatwhere the noise level within dwellings is more than 50 dB(Lin), the low frequency noise character ofthe intruding noise needs to be considered.
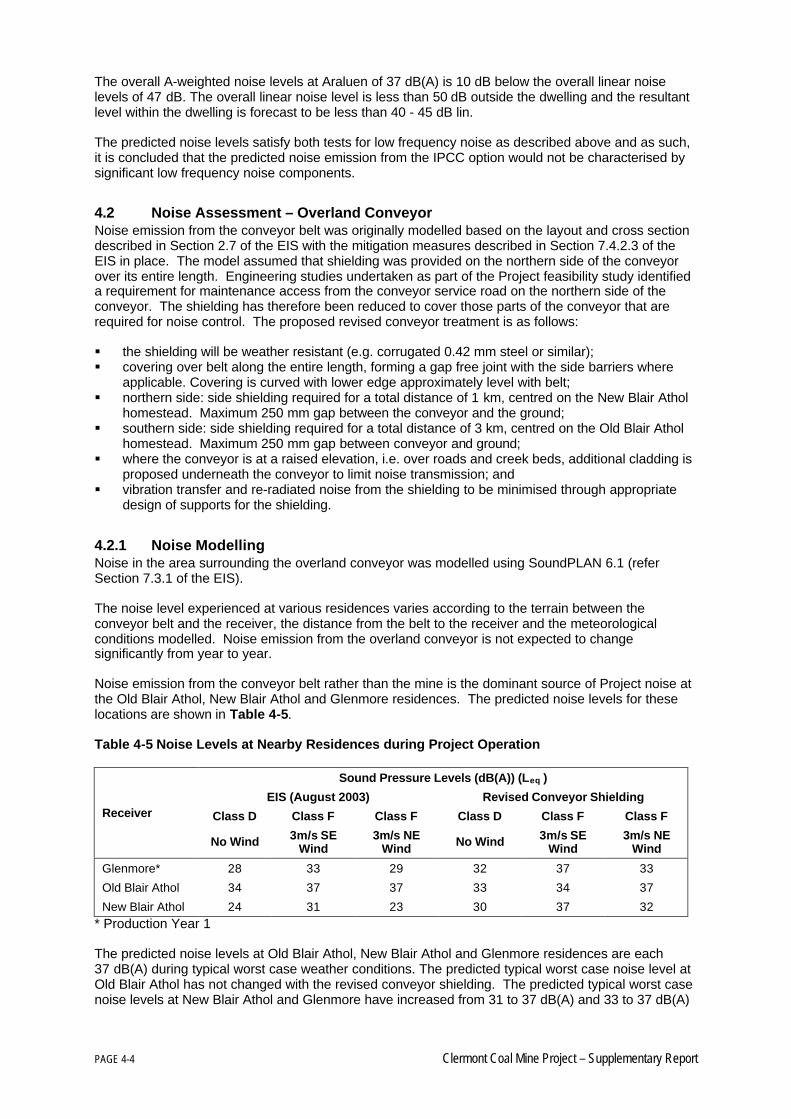
PAGE 4-4 Clermont Coal Mine Project – Supplementary Report
The overall A-weighted noise levels at Araluen of 37 dB(A) is 10 dB below the overall linear noiselevels of 47 dB. The overall linear noise level is less than 50 dB outside the dwelling and the resultantlevel within the dwelling is forecast to be less than 40 - 45 dB lin.
The predicted noise levels satisfy both tests for low frequency noise as described above and as such,it is concluded that the predicted noise emission from the IPCC option would not be characterised bysignificant low frequency noise components.
4.2 Noise Assessment – Overland ConveyorNoise emission from the conveyor belt was originally modelled based on the layout and cross sectiondescribed in Section 2.7 of the EIS with the mitigation measures described in Section 7.4.2.3 of theEIS in place. The model assumed that shielding was provided on the northern side of the conveyorover its entire length. Engineering studies undertaken as part of the Project feasibility study identifieda requirement for maintenance access from the conveyor service road on the northern side of theconveyor. The shielding has therefore been reduced to cover those parts of the conveyor that arerequired for noise control. The proposed revised conveyor treatment is as follows:
§ the shielding will be weather resistant (e.g. corrugated 0.42 mm steel or similar);§ covering over belt along the entire length, forming a gap free joint with the side barriers where
applicable. Covering is curved with lower edge approximately level with belt;§ northern side: side shielding required for a total distance of 1 km, centred on the New Blair Athol
homestead. Maximum 250 mm gap between the conveyor and the ground;§ southern side: side shielding required for a total distance of 3 km, centred on the Old Blair Athol
homestead. Maximum 250 mm gap between conveyor and ground;§ where the conveyor is at a raised elevation, i.e. over roads and creek beds, additional cladding is
proposed underneath the conveyor to limit noise transmission; and§ vibration transfer and re-radiated noise from the shielding to be minimised through appropriate
design of supports for the shielding.
4.2.1 Noise ModellingNoise in the area surrounding the overland conveyor was modelled using SoundPLAN 6.1 (referSection 7.3.1 of the EIS).
The noise level experienced at various residences varies according to the terrain between theconveyor belt and the receiver, the distance from the belt to the receiver and the meteorologicalconditions modelled. Noise emission from the overland conveyor is not expected to changesignificantly from year to year.
Noise emission from the conveyor belt rather than the mine is the dominant source of Project noise atthe Old Blair Athol, New Blair Athol and Glenmore residences. The predicted noise levels for theselocations are shown in Table 4-5.
Table 4-5 Noise Levels at Nearby Residences during Project Operation
Sound Pressure Levels (dB(A)) (Leq )
EIS (August 2003) Revised Conveyor Shielding
Class D Class F Class F Class D Class F Class FReceiver
No Wind 3m/s SEWind
3m/s NEWind No Wind 3m/s SE
Wind3m/s NE
Wind
Glenmore* 28 33 29 32 37 33
Old Blair Athol 34 37 37 33 34 37
New Blair Athol 24 31 23 30 37 32* Production Year 1
The predicted noise levels at Old Blair Athol, New Blair Athol and Glenmore residences are each37 dB(A) during typical worst case weather conditions. The predicted typical worst case noise level atOld Blair Athol has not changed with the revised conveyor shielding. The predicted typical worst casenoise levels at New Blair Athol and Glenmore have increased from 31 to 37 dB(A) and 33 to 37 dB(A)
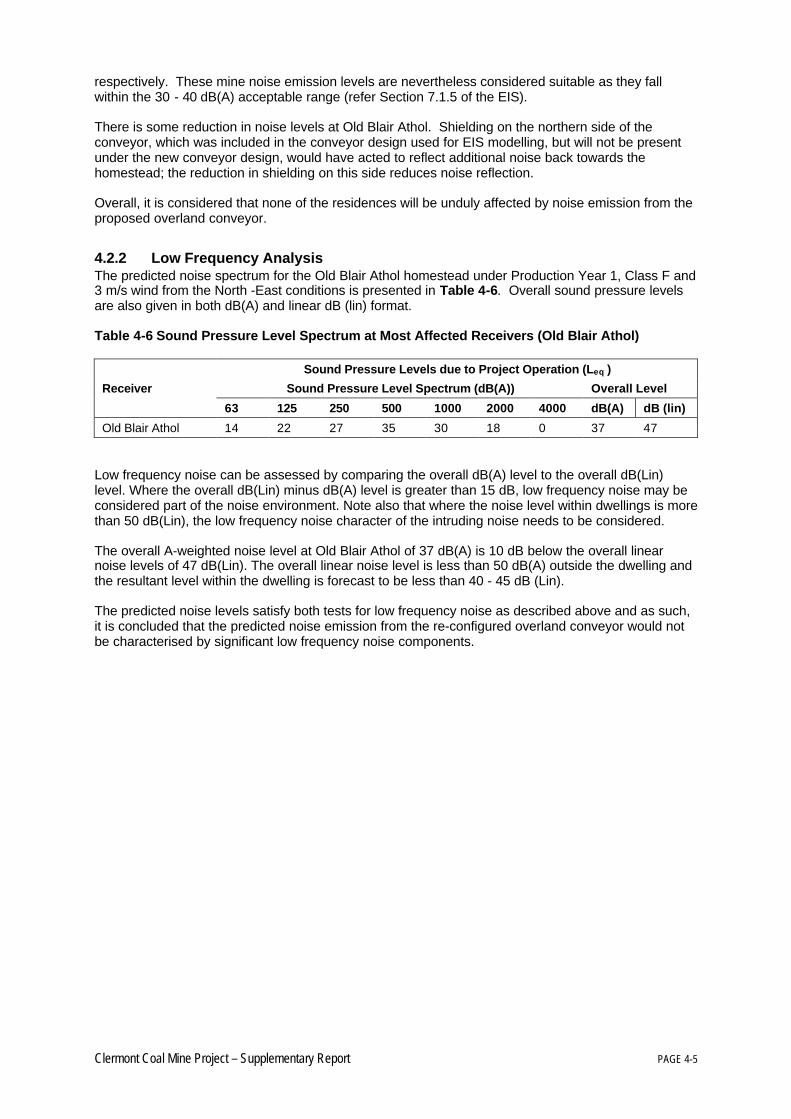
Clermont Coal Mine Project – Supplementary Report PAGE 4-5
respectively. These mine noise emission levels are nevertheless considered suitable as they fallwithin the 30 - 40 dB(A) acceptable range (refer Section 7.1.5 of the EIS).
There is some reduction in noise levels at Old Blair Athol. Shielding on the northern side of theconveyor, which was included in the conveyor design used for EIS modelling, but will not be presentunder the new conveyor design, would have acted to reflect additional noise back towards thehomestead; the reduction in shielding on this side reduces noise reflection.
Overall, it is considered that none of the residences will be unduly affected by noise emission from theproposed overland conveyor.
4.2.2 Low Frequency AnalysisThe predicted noise spectrum for the Old Blair Athol homestead under Production Year 1, Class F and3 m/s wind from the North -East conditions is presented in Table 4-6. Overall sound pressure levelsare also given in both dB(A) and linear dB (lin) format.
Table 4-6 Sound Pressure Level Spectrum at Most Affected Receivers (Old Blair Athol)
Sound Pressure Levels due to Project Operation (Leq )
Sound Pressure Level Spectrum (dB(A)) Overall LevelReceiver
63 125 250 500 1000 2000 4000 dB(A) dB (lin)
Old Blair Athol 14 22 27 35 30 18 0 37 47
Low frequency noise can be assessed by comparing the overall dB(A) level to the overall dB(Lin)level. Where the overall dB(Lin) minus dB(A) level is greater than 15 dB, low frequency noise may beconsidered part of the noise environment. Note also that where the noise level within dwellings is morethan 50 dB(Lin), the low frequency noise character of the intruding noise needs to be considered.
The overall A-weighted noise level at Old Blair Athol of 37 dB(A) is 10 dB below the overall linearnoise levels of 47 dB(Lin). The overall linear noise level is less than 50 dB(A) outside the dwelling andthe resultant level within the dwelling is forecast to be less than 40 - 45 dB (Lin).
The predicted noise levels satisfy both tests for low frequency noise as described above and as such,it is concluded that the predicted noise emission from the re-configured overland conveyor would notbe characterised by significant low frequency noise components.


Clermont Coal Mine Project – Supplementary Report PAGE 5-1
5. Cultural Heritage Management PlanThe EIS discussed the status of the development of a Cultural Heritage Management Plan as thesituation stood in August 2004 (Sections 8.2 and 8.3 of the EIS). RTCA has continued working withthe Wangan and Jagalingou Peoples native title claimants, the endorsed Aboriginal Parties, to developan approved Cultural Heritage Management Plan (CHMP) for the Project. In addition to both RTCA’sand the Aboriginal Parties’ desire to have an agreed cultural heritage management process for theProject, an approved CHMP is required under Section 3.12 of the EIS Terms of Reference and s.87 ofthe Aboriginal Cultural Heritage Act 2003 (ACHA).
Notification letters were sent out in accordance with Part 7, Division 3, s.91 of the ACHA to identifyand subsequently endorse Aboriginal Parties for the purpose of developing the CHMP. The endorsedAboriginal Parties are the Wangan and Jagalingou Peoples Native Title Claimants (National NativeTitle Tribunal file number QC04/06) and their authorised nominees (as defined in s102 (2) of theACHA).
RTCA and the endorsed Aboriginal Parties held meetings specifically for the purpose of developingthe CHMP. A draft CHMP was then provided to the Cultural Heritage Coordination Unit (CHCU) of theDNRM, under cover letters from both parties to the agreement, seeking comment and confirmationthat it met requirements of both the CHCU and the ACHA. RTCA and the Aboriginal Partiessubsequently received written advice from the CHCU that the draft CHMP met the requirements of theACHA.
RTCA and the endorsed Aboriginal Parties finalised and signed the CHMP developed specifically forthe Project in October 2004 and received formal DNRM approval on 2nd December 2004.


Clermont Coal Mine Project – Supplementary Report PAGE 6-1
6. Supplementary Report Response Table


Clermont Coal Mine Project – Supplementary Report PAGE 7-1
7. Draft EMOS

Clermont Coal Mine Project – Supplementary Report PAGE 8-1
8. ReferencesACARP 2001, Report C9068 - Monitoring Geomorphic Processes in Bowen Basin River DiversionsJanuary 2001.
ACARP 2004, Report C12045 Development of Rehabilitation Completion Criteria for NativeEcosystem Establishment in the Bowen Basin May 2004.
ANZECC / ARMCANZ 2000, Australian and New Zealand Guidelines for Fresh and Marine WaterQuality, National Water Quality Management Strategy, Australian and New Zealand Environment andConservation Council & Agriculture and Resource Management Council of Australia and NewZealand.
Bicknell, D 1998 Trees in Agriculture. Department of Agriculture, Western Australia.
Carroll, C., Halpin, M., Burger, P., Bell, K., Salloway, M. and Yule, D. 1997, The effect of crop type,crop rotation and tillage on runoff and soil loss on a Vertisol in Central Queensland, Aust-J-soilres. 35,925-39.
Council of Australian Governments, October 2004. Ammonium Nitrate Guidance Note No. 4, Siting ofNew Facilities.
CRC Coastal Zone 2003 Central Queensland Information Paper. CRC for Coastal Zone, Estuary &Waterway Management, Indooroopilly.
Department of Minerals and Energy (Qld) 1995a, Geology of the Southern Part of the Anakie Inlier.Published by the Department of Minerals and Energy, QLD.
Department of Minerals and Energy (Qld) 1995b, Technical Guidelines for the EnvironmentalManagement of Exploration and Mining in Queensland, Brisbane.
Department of Primary Industries 1990 (Qld) , Guidelines for Agricultural Land Evaluation inQueensland, Land Resources Branch, QDPI, QI90005, ISSN 0727-6273.
Doley, D. 2003 Effects of mineral dust on vegetation: a review of literature and model calculations.Report to Sinclair Knight Merz, August 2003.
Environment Australia 1997 Managing Sulphidic Mine Wastes and Acid Drainage Best PracticeEnvironmental Management in Mining.
Environment Australia 2001 NPI Emission Estimation Technique Manual for Mining.
Environment Australia 2003 NPI Emission Estimation Technique Manual for Combustion Engines,Version 2.3 Environment Australia, Canberra, Australia.
Environment Australia 2003 NPI Emission Estimation Technique Manual for Combustion Engines,Version 2.3 Environment Australia, Canberra, Australia.
Environment Protection Agency (C’wealth) 1995 Best Practice Environmental Management in Mining.
Environmental Protection Agency (Qld) 1997a Environmental Protection (Air) Policy.
Environmental Protection Agency (Qld) 1997b Environmental Protection (Noise) Policy.
Environmental Protection Agency (Qld) 1998 Environmental Protection Regulation.
Environmental Protection Agency (Qld) 2000a Noise Measurement Manual.
Environmental Protection Agency (Qld) 2000b Environmental Protection (Waste Management) Policy.
Environmental Protection Agency (Qld) 2001 Preparing an Environmental management OverviewStrategy (EMOS) for Non-Standard Mining Projects.
PAGE 8-2 Clermont Coal Mine Project – Supplementary Report
Hanna S.R., Egan B.A., Purdum J. and Wagler J. 1999, Evaluation of ISC3, AERMOD, and ADMSDispersion Models with Observations from Five Field Sites. HC Report P020, API, 1220 L St. NW,Washington, DC 20005-4070, 1999.
Hatte, E. 1994, A Preliminary Cultural Heritage Assessment, Wolfang Station, Clermont, CentralQueensland. Report prepared by Elizabeth Hatte, Northern Archaeological consultancies Pty Ltd, forArco Coal Australia Inc and Pacific Coal Pty Ltd.
Hill, L. W. 1982, An Archaeological Report on Wolfang Coal Project. Report to Peter Hollingsworthand Associated Consultants on behalf of White Industries Pty Ltd.
Hollingsworth Dames and Moore, 1991, Clermont Coal Project Environmental Monitoring Review,prepared for Clermont Coal Mines Limited.
Institute of Engineers, Australia. Queensland Division 1996, Soil Erosion and Sediment Control;Engineering Guidelines for Queensland Construction Sites.
New South Wales Minerals Council 2000 Particulate Matter and Mining - A NSW Minerals CouncilTechnical Paper – Prepared by Holmes Air Sciences, May 2000.
Rio Tinto Coal Australia 2004 Clermont Coal Mine Project Environmental Impact Statement Vols 1and 2, August 2004.
Shields, P and Williams, B, 1991 Land Resource Survey and evaluation of the Kilcummin areaQueensland, QDPI, Brisbane, QV91001.
USEPA 1994 Acid Mine Drainage Prediction, Technical Document.
USEPA 1998 Compilation of Air Pollutant Emission Factors, AP-42, Fifth Edition, United StatesEnvironmental Protection Agency, Office of Air and Radiation Office of Air Quality Planning andStandards, Research Triangle Park, North Carolina. 27711. http://www.epa.gov/ttn/chief/ap42/
World Health Organisation 1999, Guidelines for Community Noise.

Appendix A Air Quality Appendices
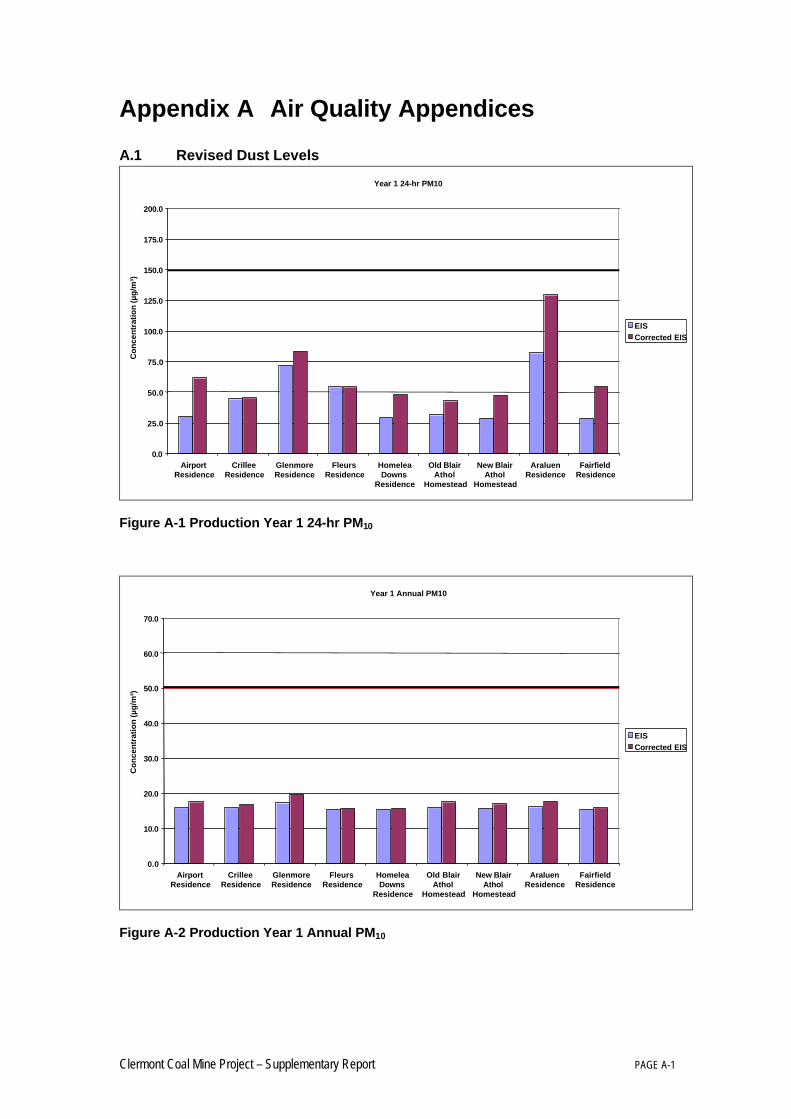
Clermont Coal Mine Project – Supplementary Report PAGE A-1
Appendix A Air Quality Appendices
A.1 Revised Dust Levels
Year 1 24-hr PM10
0.0
25.0
50.0
75.0
100.0
125.0
150.0
175.0
200.0
AirportResidence
CrilleeResidence
GlenmoreResidence
FleursResidence
HomeleaDowns
Residence
Old BlairAthol
Homestead
New BlairAthol
Homestead
AraluenResidence
FairfieldResidence
Co
nce
ntr
atio
n (µ
g/m
³)
EISCorrected EIS
Figure A-1 Production Year 1 24-hr PM10
Year 1 Annual PM10
0.0
10.0
20.0
30.0
40.0
50.0
60.0
70.0
AirportResidence
CrilleeResidence
GlenmoreResidence
FleursResidence
HomeleaDowns
Residence
Old BlairAthol
Homestead
New BlairAthol
Homestead
AraluenResidence
FairfieldResidence
Co
nce
ntr
atio
n (µ
g/m
³)
EISCorrected EIS
Figure A-2 Production Year 1 Annual PM10
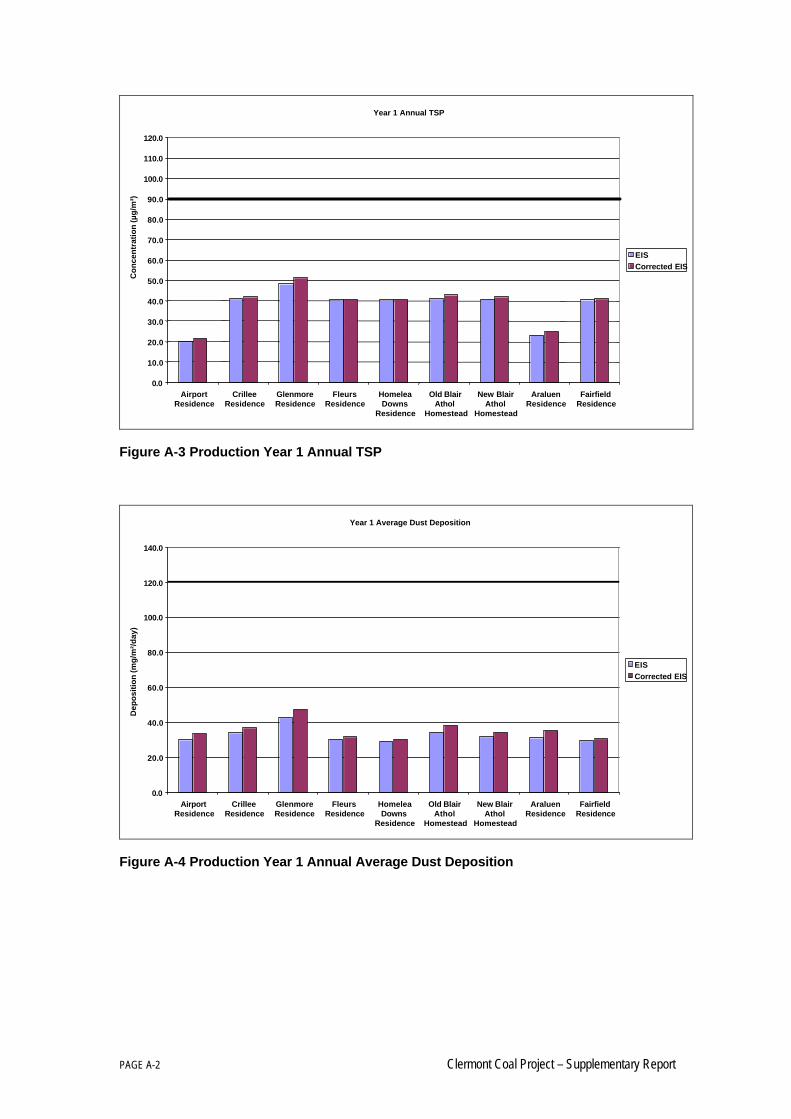
PAGE A-2 Clermont Coal Project – Supplementary Report
Year 1 Annual TSP
0.0
10.0
20.0
30.0
40.0
50.0
60.0
70.0
80.0
90.0
100.0
110.0
120.0
AirportResidence
CrilleeResidence
GlenmoreResidence
FleursResidence
HomeleaDowns
Residence
Old BlairAthol
Homestead
New BlairAthol
Homestead
AraluenResidence
FairfieldResidence
Co
nce
ntr
atio
n (µ
g/m
³)
EISCorrected EIS
Figure A-3 Production Year 1 Annual TSP
Year 1 Average Dust Deposition
0.0
20.0
40.0
60.0
80.0
100.0
120.0
140.0
AirportResidence
CrilleeResidence
GlenmoreResidence
FleursResidence
HomeleaDowns
Residence
Old BlairAthol
Homestead
New BlairAthol
Homestead
AraluenResidence
FairfieldResidence
Dep
osi
tio
n (m
g/m
²/d
ay)
EISCorrected EIS
Figure A-4 Production Year 1 Annual Average Dust Deposition
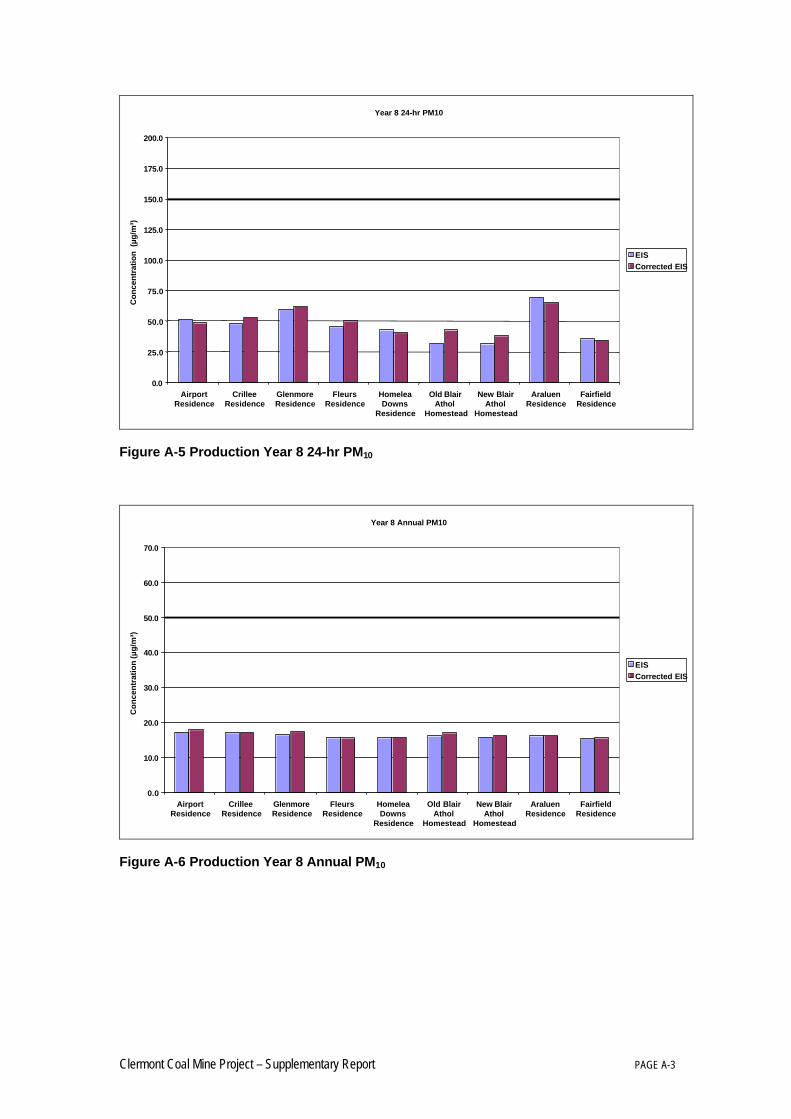
Clermont Coal Mine Project – Supplementary Report PAGE A-3
Year 8 24-hr PM10
0.0
25.0
50.0
75.0
100.0
125.0
150.0
175.0
200.0
AirportResidence
CrilleeResidence
GlenmoreResidence
FleursResidence
HomeleaDowns
Residence
Old BlairAthol
Homestead
New BlairAthol
Homestead
AraluenResidence
FairfieldResidence
Co
nce
ntr
atio
n (
µg/m
³)
EISCorrected EIS
Figure A-5 Production Year 8 24-hr PM10
Year 8 Annual PM10
0.0
10.0
20.0
30.0
40.0
50.0
60.0
70.0
AirportResidence
CrilleeResidence
GlenmoreResidence
FleursResidence
HomeleaDowns
Residence
Old BlairAthol
Homestead
New BlairAthol
Homestead
AraluenResidence
FairfieldResidence
Co
nce
ntr
atio
n (µ
g/m
³)
EISCorrected EIS
Figure A-6 Production Year 8 Annual PM10
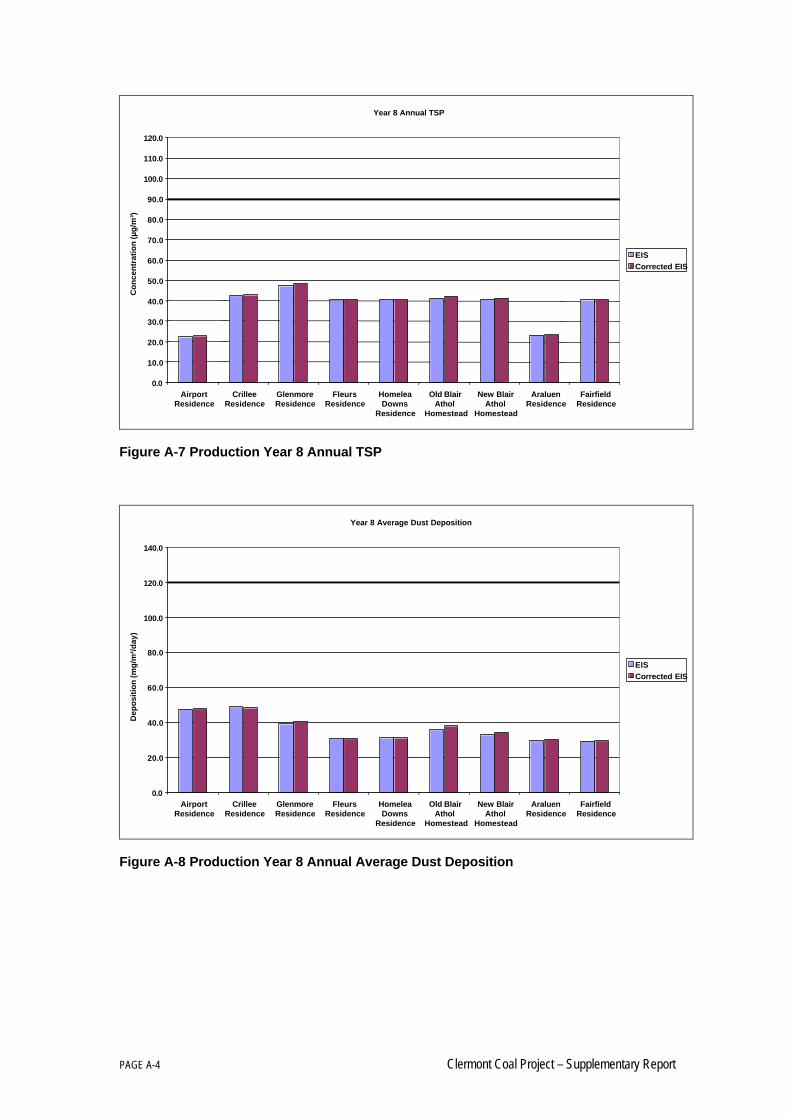
PAGE A-4 Clermont Coal Project – Supplementary Report
Year 8 Annual TSP
0.0
10.0
20.0
30.0
40.0
50.0
60.0
70.0
80.0
90.0
100.0
110.0
120.0
AirportResidence
CrilleeResidence
GlenmoreResidence
FleursResidence
HomeleaDowns
Residence
Old BlairAthol
Homestead
New BlairAthol
Homestead
AraluenResidence
FairfieldResidence
Co
nce
ntr
atio
n (µ
g/m
³)
EISCorrected EIS
Figure A-7 Production Year 8 Annual TSP
Year 8 Average Dust Deposition
0.0
20.0
40.0
60.0
80.0
100.0
120.0
140.0
AirportResidence
CrilleeResidence
GlenmoreResidence
FleursResidence
HomeleaDowns
Residence
Old BlairAthol
Homestead
New BlairAthol
Homestead
AraluenResidence
FairfieldResidence
Dep
osi
tio
n (m
g/m
²/d
ay)
EISCorrected EIS
Figure A-8 Production Year 8 Annual Average Dust Deposition
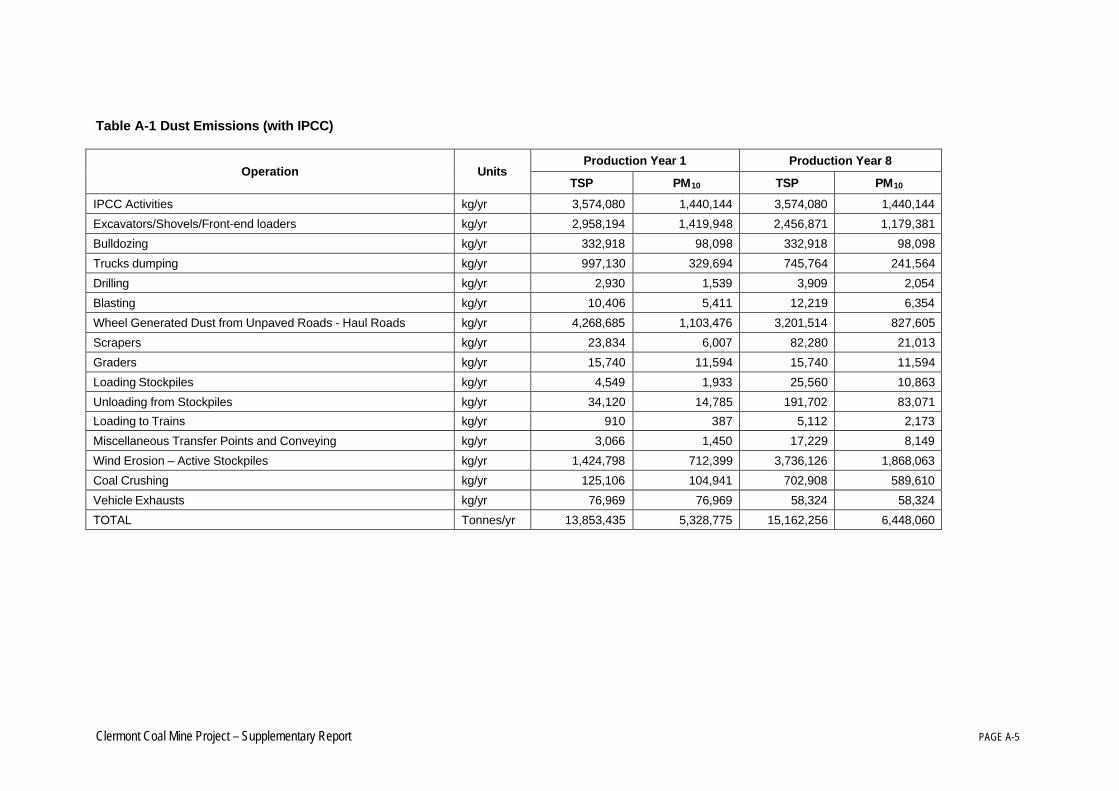
Clermont Coal Mine Project – Supplementary Report PAGE A-5
Table A-1 Dust Emissions (with IPCC)
Production Year 1 Production Year 8Operation Units
TSP PM10 TSP PM10
IPCC Activities kg/yr 3,574,080 1,440,144 3,574,080 1,440,144
Excavators/Shovels/Front-end loaders kg/yr 2,958,194 1,419,948 2,456,871 1,179,381
Bulldozing kg/yr 332,918 98,098 332,918 98,098
Trucks dumping kg/yr 997,130 329,694 745,764 241,564
Drilling kg/yr 2,930 1,539 3,909 2,054
Blasting kg/yr 10,406 5,411 12,219 6,354
Wheel Generated Dust from Unpaved Roads - Haul Roads kg/yr 4,268,685 1,103,476 3,201,514 827,605
Scrapers kg/yr 23,834 6,007 82,280 21,013
Graders kg/yr 15,740 11,594 15,740 11,594
Loading Stockpiles kg/yr 4,549 1,933 25,560 10,863
Unloading from Stockpiles kg/yr 34,120 14,785 191,702 83,071
Loading to Trains kg/yr 910 387 5,112 2,173
Miscellaneous Transfer Points and Conveying kg/yr 3,066 1,450 17,229 8,149
Wind Erosion – Active Stockpiles kg/yr 1,424,798 712,399 3,736,126 1,868,063
Coal Crushing kg/yr 125,106 104,941 702,908 589,610
Vehicle Exhausts kg/yr 76,969 76,969 58,324 58,324
TOTAL Tonnes/yr 13,853,435 5,328,775 15,162,256 6,448,060
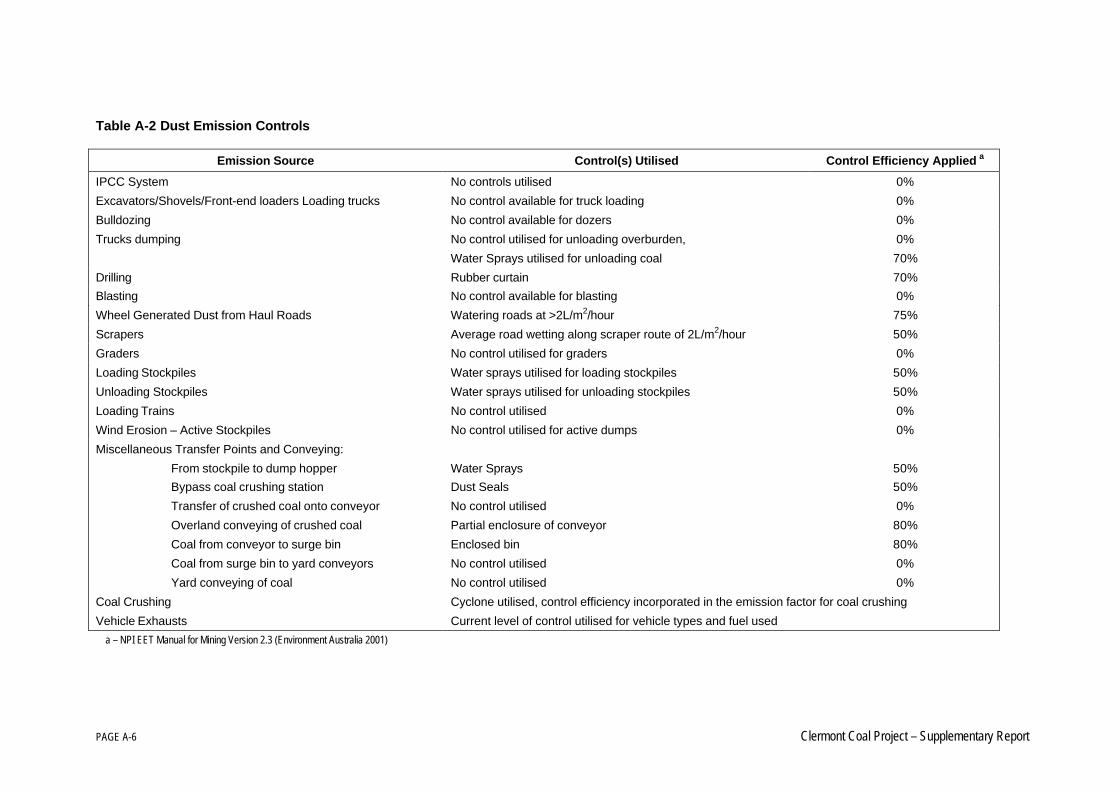
PAGE A-6 Clermont Coal Project – Supplementary Report
Table A-2 Dust Emission Controls
Emission Source Control(s) Utilised Control Efficiency Applied a
IPCC System No controls utilised 0%
Excavators/Shovels/Front-end loaders Loading trucks No control available for truck loading 0%
Bulldozing No control available for dozers 0%
Trucks dumping No control utilised for unloading overburden,
Water Sprays utilised for unloading coal
0%
70%
Drilling Rubber curtain 70%
Blasting No control available for blasting 0%
Wheel Generated Dust from Haul Roads Watering roads at >2L/m2/hour 75%
Scrapers Average road wetting along scraper route of 2L/m2/hour 50%
Graders No control utilised for graders 0%
Loading Stockpiles Water sprays utilised for loading stockpiles 50%
Unloading Stockpiles Water sprays utilised for unloading stockpiles 50%
Loading Trains No control utilised 0%
Wind Erosion – Active Stockpiles No control utilised for active dumps 0%
Miscellaneous Transfer Points and Conveying:
From stockpile to dump hopper
Bypass coal crushing station
Transfer of crushed coal onto conveyor
Overland conveying of crushed coal
Coal from conveyor to surge bin
Coal from surge bin to yard conveyors
Yard conveying of coal
Water Sprays
Dust Seals
No control utilised
Partial enclosure of conveyor
Enclosed bin
No control utilised
No control utilised
50%
50%
0%
80%
80%
0%
0%
Coal Crushing Cyclone utilised, control efficiency incorporated in the emission factor for coal crushing
Vehicle Exhausts Current level of control utilised for vehicle types and fuel used
a – NPI EET Manual for Mining Version 2.3 (Environment Australia 2001)
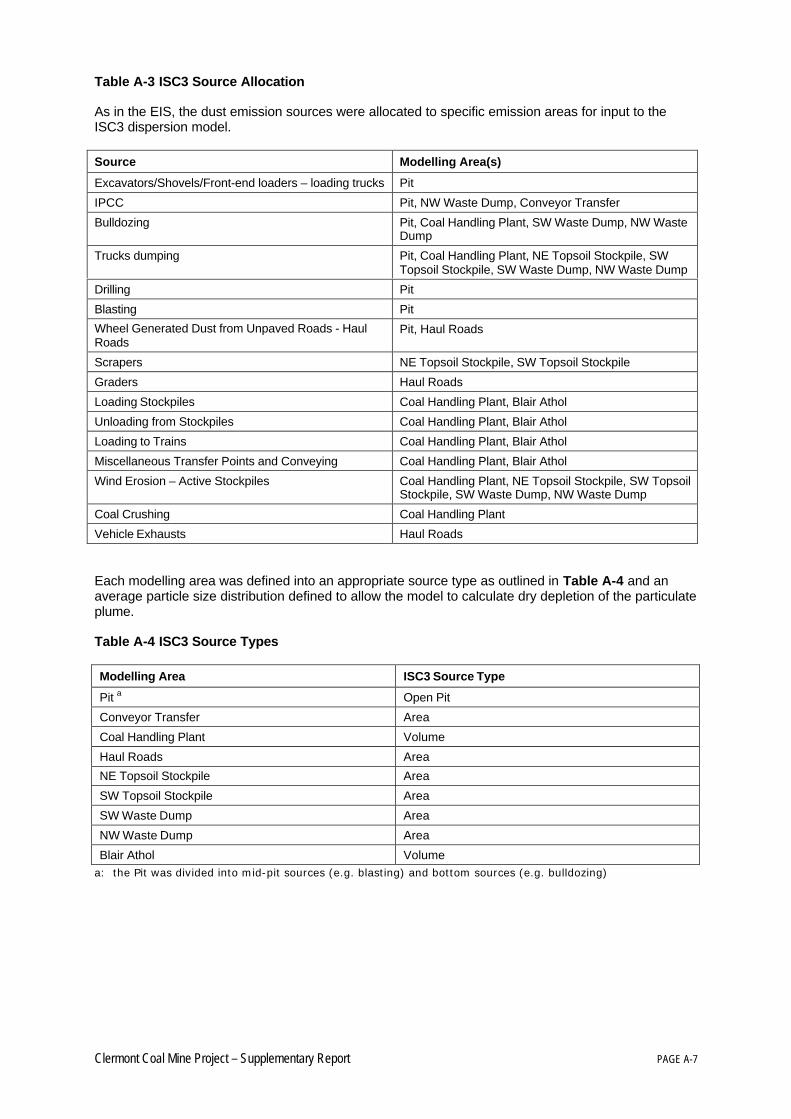
Clermont Coal Mine Project – Supplementary Report PAGE A-7
Table A-3 ISC3 Source Allocation
As in the EIS, the dust emission sources were allocated to specific emission areas for input to theISC3 dispersion model.
Source Modelling Area(s)
Excavators/Shovels/Front-end loaders – loading trucks Pit
IPCC Pit, NW Waste Dump, Conveyor Transfer
Bulldozing Pit, Coal Handling Plant, SW Waste Dump, NW WasteDump
Trucks dumping Pit, Coal Handling Plant, NE Topsoil Stockpile, SWTopsoil Stockpile, SW Waste Dump, NW Waste Dump
Drilling Pit
Blasting Pit
Wheel Generated Dust from Unpaved Roads - HaulRoads
Pit, Haul Roads
Scrapers NE Topsoil Stockpile, SW Topsoil Stockpile
Graders Haul Roads
Loading Stockpiles Coal Handling Plant, Blair Athol
Unloading from Stockpiles Coal Handling Plant, Blair Athol
Loading to Trains Coal Handling Plant, Blair Athol
Miscellaneous Transfer Points and Conveying Coal Handling Plant, Blair Athol
Wind Erosion – Active Stockpiles Coal Handling Plant, NE Topsoil Stockpile, SW TopsoilStockpile, SW Waste Dump, NW Waste Dump
Coal Crushing Coal Handling Plant
Vehicle Exhausts Haul Roads
Each modelling area was defined into an appropriate source type as outlined in Table A-4 and anaverage particle size distribution defined to allow the model to calculate dry depletion of the particulateplume.
Table A-4 ISC3 Source Types
Modelling Area ISC3 Source Type
Pit a Open Pit
Conveyor Transfer Area
Coal Handling Plant Volume
Haul Roads Area
NE Topsoil Stockpile Area
SW Topsoil Stockpile Area
SW Waste Dump Area
NW Waste Dump Area
Blair Athol Volumea: the Pit was divided into mid-pit sources (e.g. blasting) and bottom sources (e.g. bulldozing)
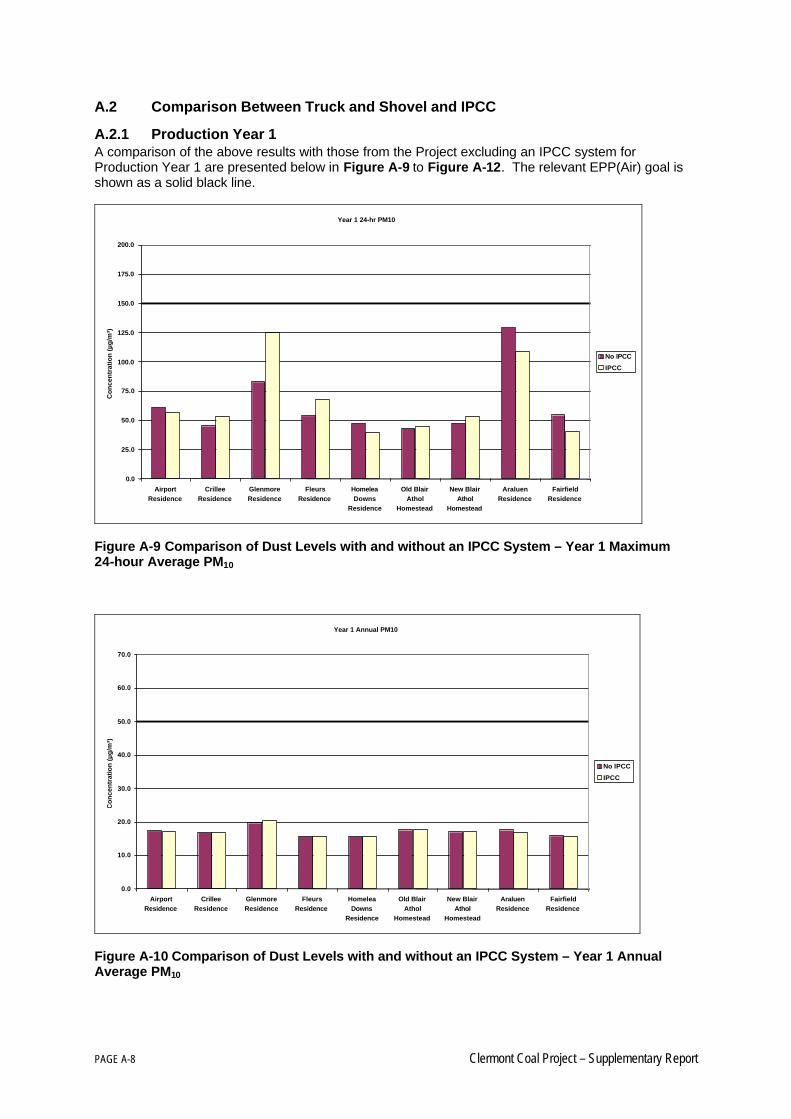
PAGE A-8 Clermont Coal Project – Supplementary Report
A.2 Comparison Between Truck and Shovel and IPCC
A.2.1 Production Year 1A comparison of the above results with those from the Project excluding an IPCC system forProduction Year 1 are presented below in Figure A-9 to Figure A-12. The relevant EPP(Air) goal isshown as a solid black line.
Year 1 24-hr PM10
0.0
25.0
50.0
75.0
100.0
125.0
150.0
175.0
200.0
AirportResidence
CrilleeResidence
GlenmoreResidence
FleursResidence
HomeleaDowns
Residence
Old BlairAthol
Homestead
New BlairAthol
Homestead
AraluenResidence
FairfieldResidence
Co
nce
ntr
atio
n (
µg/m
³)
No IPCC
IPCC
Figure A-9 Comparison of Dust Levels with and without an IPCC System – Year 1 Maximum24-hour Average PM10
Year 1 Annual PM10
0.0
10.0
20.0
30.0
40.0
50.0
60.0
70.0
AirportResidence
CrilleeResidence
GlenmoreResidence
FleursResidence
HomeleaDowns
Residence
Old BlairAthol
Homestead
New BlairAthol
Homestead
AraluenResidence
FairfieldResidence
Co
nce
ntr
atio
n (
µg/m
³)
No IPCC
IPCC
Figure A-10 Comparison of Dust Levels with and without an IPCC System – Year 1 AnnualAverage PM10
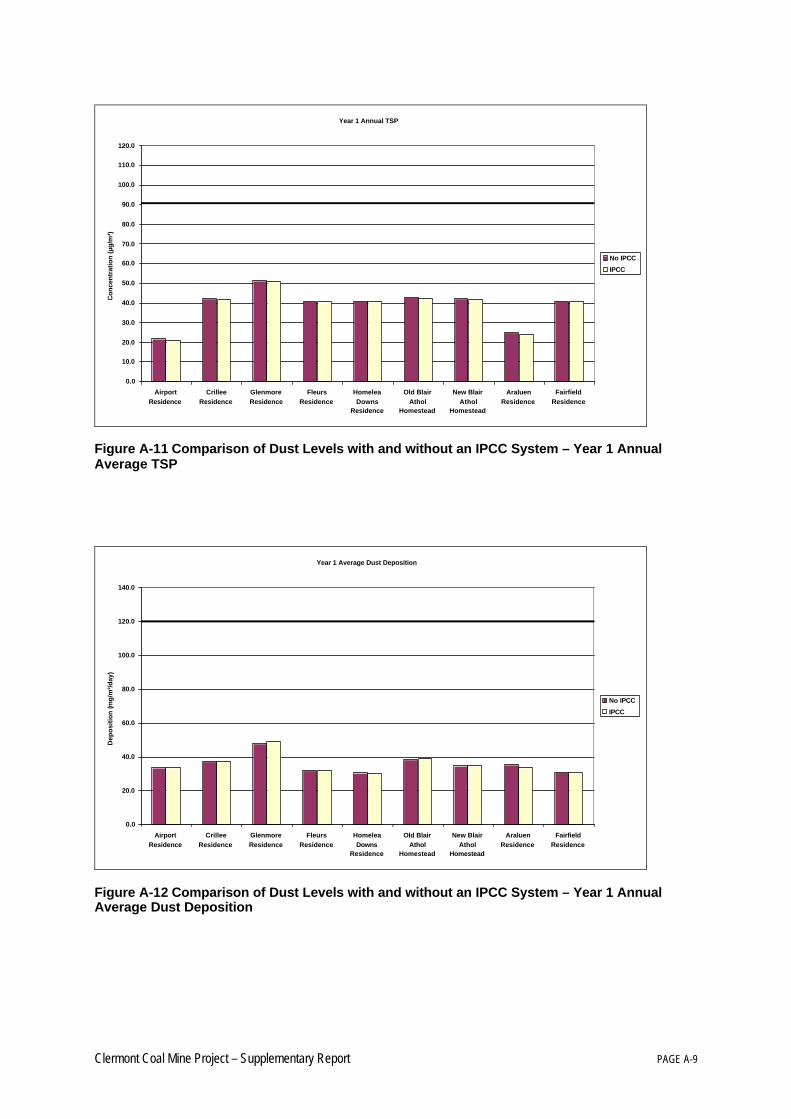
Clermont Coal Mine Project – Supplementary Report PAGE A-9
Year 1 Annual TSP
0.0
10.0
20.0
30.0
40.0
50.0
60.0
70.0
80.0
90.0
100.0
110.0
120.0
AirportResidence
CrilleeResidence
GlenmoreResidence
FleursResidence
HomeleaDowns
Residence
Old BlairAthol
Homestead
New BlairAthol
Homestead
AraluenResidence
FairfieldResidence
Con
cent
ratio
n (µ
g/m
³)
No IPCC
IPCC
Figure A-11 Comparison of Dust Levels with and without an IPCC System – Year 1 AnnualAverage TSP
Year 1 Average Dust Deposition
0.0
20.0
40.0
60.0
80.0
100.0
120.0
140.0
AirportResidence
CrilleeResidence
GlenmoreResidence
FleursResidence
HomeleaDowns
Residence
Old BlairAthol
Homestead
New BlairAthol
Homestead
AraluenResidence
FairfieldResidence
Dep
osi
tio
n (m
g/m
²/day
)
No IPCC
IPCC
Figure A-12 Comparison of Dust Levels with and without an IPCC System – Year 1 AnnualAverage Dust Deposition
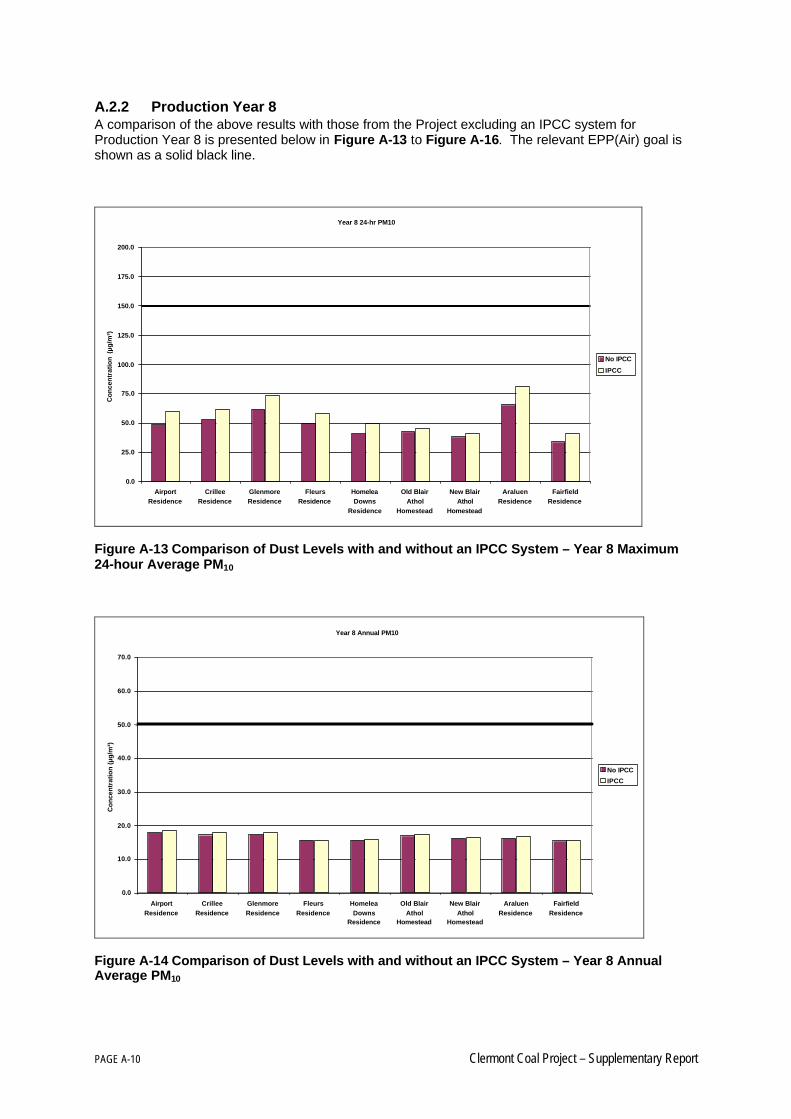
PAGE A-10 Clermont Coal Project – Supplementary Report
A.2.2 Production Year 8A comparison of the above results with those from the Project excluding an IPCC system forProduction Year 8 is presented below in Figure A-13 to Figure A-16. The relevant EPP(Air) goal isshown as a solid black line.
Year 8 24-hr PM10
0.0
25.0
50.0
75.0
100.0
125.0
150.0
175.0
200.0
AirportResidence
CrilleeResidence
GlenmoreResidence
FleursResidence
HomeleaDowns
Residence
Old BlairAthol
Homestead
New BlairAthol
Homestead
AraluenResidence
FairfieldResidence
Co
nce
ntr
atio
n (
µg/m
³)
No IPCC
IPCC
Figure A-13 Comparison of Dust Levels with and without an IPCC System – Year 8 Maximum24-hour Average PM10
Year 8 Annual PM10
0.0
10.0
20.0
30.0
40.0
50.0
60.0
70.0
AirportResidence
CrilleeResidence
GlenmoreResidence
FleursResidence
HomeleaDowns
Residence
Old BlairAthol
Homestead
New BlairAthol
Homestead
AraluenResidence
FairfieldResidence
Co
nce
ntr
atio
n (
µg/m
³)
No IPCC
IPCC
Figure A-14 Comparison of Dust Levels with and without an IPCC System – Year 8 AnnualAverage PM10

Clermont Coal Mine Project – Supplementary Report PAGE A-11
Year 8 Annual TSP
0.0
10.0
20.0
30.0
40.0
50.0
60.0
70.0
80.0
90.0
100.0
110.0
120.0
AirportResidence
CrilleeResidence
GlenmoreResidence
FleursResidence
HomeleaDowns
Residence
Old BlairAthol
Homestead
New BlairAthol
Homestead
AraluenResidence
FairfieldResidence
Co
nce
ntr
atio
n (
µg/m
³)
No IPCC
IPCC
Figure A-15 Comparison of Dust Levels with and without an IPCC System – Year 8 AnnualAverage TSP
Year 8 Average Dust Deposition
0.0
20.0
40.0
60.0
80.0
100.0
120.0
140.0
AirportResidence
CrilleeResidence
GlenmoreResidence
FleursResidence
HomeleaDowns
Residence
Old BlairAthol
Homestead
New BlairAthol
Homestead
AraluenResidence
FairfieldResidence
Dep
osi
tio
n (m
g/m
²/day
)
No IPCC
IPCC
Figure A-16 Comparison of Dust Levels with and without an IPCC System – Year 8 AnnualAverage Dust Deposition
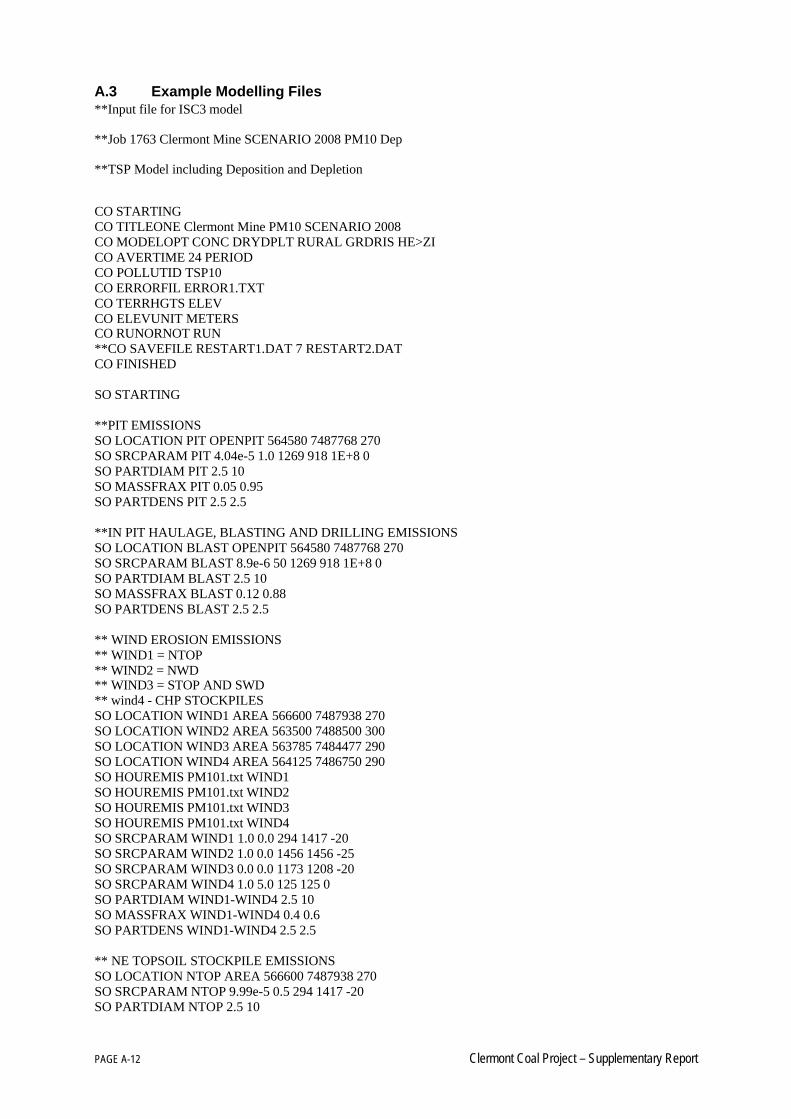
PAGE A-12 Clermont Coal Project – Supplementary Report
A.3 Example Modelling Files**Input file for ISC3 model
**Job 1763 Clermont Mine SCENARIO 2008 PM10 Dep
**TSP Model including Deposition and Depletion
CO STARTINGCO TITLEONE Clermont Mine PM10 SCENARIO 2008CO MODELOPT CONC DRYDPLT RURAL GRDRIS HE>ZICO AVERTIME 24 PERIODCO POLLUTID TSP10CO ERRORFIL ERROR1.TXTCO TERRHGTS ELEVCO ELEVUNIT METERSCO RUNORNOT RUN**CO SAVEFILE RESTART1.DAT 7 RESTART2.DATCO FINISHED
SO STARTING
**PIT EMISSIONSSO LOCATION PIT OPENPIT 564580 7487768 270SO SRCPARAM PIT 4.04e-5 1.0 1269 918 1E+8 0SO PARTDIAM PIT 2.5 10SO MASSFRAX PIT 0.05 0.95SO PARTDENS PIT 2.5 2.5
**IN PIT HAULAGE, BLASTING AND DRILLING EMISSIONSSO LOCATION BLAST OPENPIT 564580 7487768 270SO SRCPARAM BLAST 8.9e-6 50 1269 918 1E+8 0SO PARTDIAM BLAST 2.5 10SO MASSFRAX BLAST 0.12 0.88SO PARTDENS BLAST 2.5 2.5
** WIND EROSION EMISSIONS** WIND1 = NTOP** WIND2 = NWD** WIND3 = STOP AND SWD** wind4 - CHP STOCKPILESSO LOCATION WIND1 AREA 566600 7487938 270SO LOCATION WIND2 AREA 563500 7488500 300SO LOCATION WIND3 AREA 563785 7484477 290SO LOCATION WIND4 AREA 564125 7486750 290SO HOUREMIS PM101.txt WIND1SO HOUREMIS PM101.txt WIND2SO HOUREMIS PM101.txt WIND3SO HOUREMIS PM101.txt WIND4SO SRCPARAM WIND1 1.0 0.0 294 1417 -20SO SRCPARAM WIND2 1.0 0.0 1456 1456 -25SO SRCPARAM WIND3 0.0 0.0 1173 1208 -20SO SRCPARAM WIND4 1.0 5.0 125 125 0SO PARTDIAM WIND1-WIND4 2.5 10SO MASSFRAX WIND1-WIND4 0.4 0.6SO PARTDENS WIND1-WIND4 2.5 2.5
** NE TOPSOIL STOCKPILE EMISSIONSSO LOCATION NTOP AREA 566600 7487938 270SO SRCPARAM NTOP 9.99e-5 0.5 294 1417 -20SO PARTDIAM NTOP 2.5 10
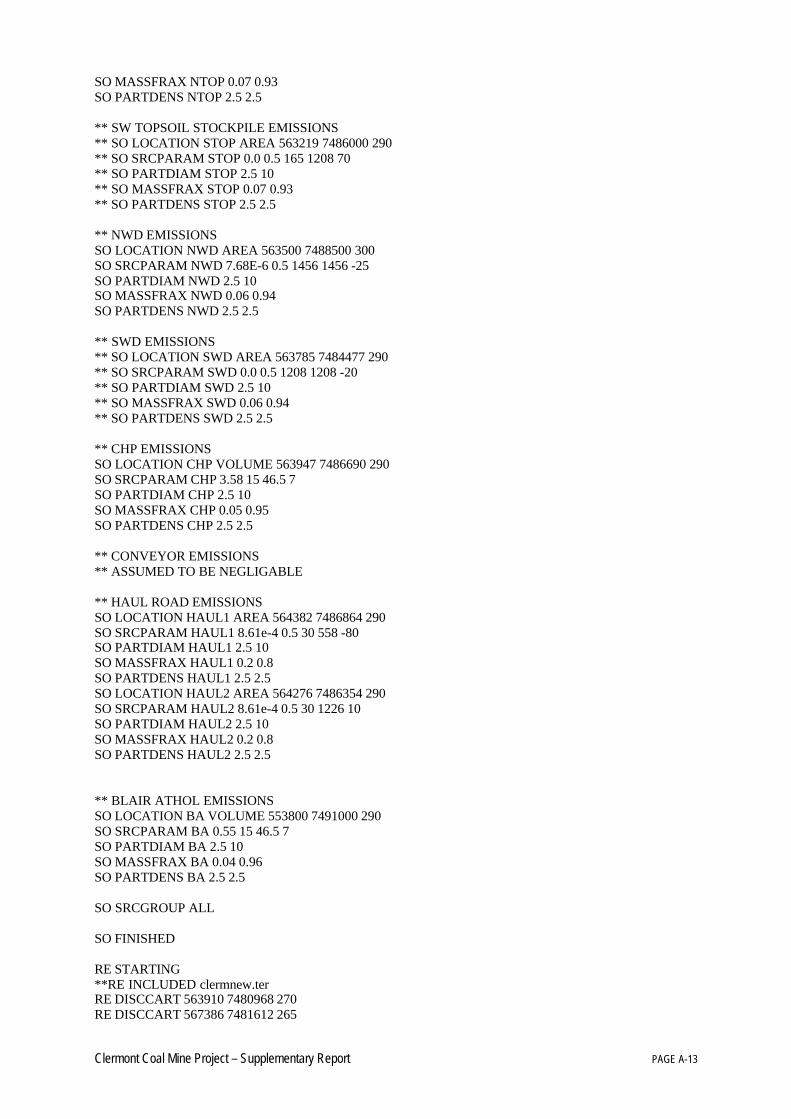
Clermont Coal Mine Project – Supplementary Report PAGE A-13
SO MASSFRAX NTOP 0.07 0.93SO PARTDENS NTOP 2.5 2.5
** SW TOPSOIL STOCKPILE EMISSIONS** SO LOCATION STOP AREA 563219 7486000 290** SO SRCPARAM STOP 0.0 0.5 165 1208 70** SO PARTDIAM STOP 2.5 10** SO MASSFRAX STOP 0.07 0.93** SO PARTDENS STOP 2.5 2.5
** NWD EMISSIONSSO LOCATION NWD AREA 563500 7488500 300SO SRCPARAM NWD 7.68E-6 0.5 1456 1456 -25SO PARTDIAM NWD 2.5 10SO MASSFRAX NWD 0.06 0.94SO PARTDENS NWD 2.5 2.5
** SWD EMISSIONS** SO LOCATION SWD AREA 563785 7484477 290** SO SRCPARAM SWD 0.0 0.5 1208 1208 -20** SO PARTDIAM SWD 2.5 10** SO MASSFRAX SWD 0.06 0.94** SO PARTDENS SWD 2.5 2.5
** CHP EMISSIONSSO LOCATION CHP VOLUME 563947 7486690 290SO SRCPARAM CHP 3.58 15 46.5 7SO PARTDIAM CHP 2.5 10SO MASSFRAX CHP 0.05 0.95SO PARTDENS CHP 2.5 2.5
** CONVEYOR EMISSIONS** ASSUMED TO BE NEGLIGABLE
** HAUL ROAD EMISSIONSSO LOCATION HAUL1 AREA 564382 7486864 290SO SRCPARAM HAUL1 8.61e-4 0.5 30 558 -80SO PARTDIAM HAUL1 2.5 10SO MASSFRAX HAUL1 0.2 0.8SO PARTDENS HAUL1 2.5 2.5SO LOCATION HAUL2 AREA 564276 7486354 290SO SRCPARAM HAUL2 8.61e-4 0.5 30 1226 10SO PARTDIAM HAUL2 2.5 10SO MASSFRAX HAUL2 0.2 0.8SO PARTDENS HAUL2 2.5 2.5
** BLAIR ATHOL EMISSIONSSO LOCATION BA VOLUME 553800 7491000 290SO SRCPARAM BA 0.55 15 46.5 7SO PARTDIAM BA 2.5 10SO MASSFRAX BA 0.04 0.96SO PARTDENS BA 2.5 2.5
SO SRCGROUP ALL
SO FINISHED
RE STARTING**RE INCLUDED clermnew.terRE DISCCART 563910 7480968 270RE DISCCART 567386 7481612 265
PAGE A-14 Clermont Coal Project – Supplementary Report
RE DISCCART 561657 7492759 310RE DISCCART 570080 7483299 280RE DISCCART 570370 7489713 275RE DISCCART 557610 7491419 325RE DISCCART 557345 7494386 335RE DISCCART 568315 7490457 284RE DISCCART 569899 7492868 275RE FINISHED
ME STARTINGME ANEMHGHT 10ME WDROTATE 180ME SURFDATA 99999 2003ME UAIRDATA 99999 2003ME INPUTFIL CLERMONT.ISCME FINISHED
OU STARTINGOU RECTABLE ALLAVE FIRST** OU MAXTABLE ALLAVE 10OU PLOTFILE PERIOD ALL 1-PM10ANN.datOU PLOTFILE 24 ALL FIRST 1-PM1024.datOU FINISHED
Hourly Varying Wind Erosion Sample.SO HOUREMIS 03 01 24 01 WIND1 0SO HOUREMIS 03 01 24 01 WIND2 0SO HOUREMIS 03 01 24 01 WIND3 0SO HOUREMIS 03 01 24 01 WIND4 0SO HOUREMIS 03 01 24 02 WIND1 0SO HOUREMIS 03 01 24 02 WIND2 0SO HOUREMIS 03 01 24 02 WIND3 0SO HOUREMIS 03 01 24 02 WIND4 0SO HOUREMIS 03 01 24 03 WIND1 0SO HOUREMIS 03 01 24 03 WIND2 0SO HOUREMIS 03 01 24 03 WIND3 0SO HOUREMIS 03 01 24 03 WIND4 0SO HOUREMIS 03 01 24 04 WIND1 0SO HOUREMIS 03 01 24 04 WIND2 0SO HOUREMIS 03 01 24 04 WIND3 0SO HOUREMIS 03 01 24 04 WIND4 0SO HOUREMIS 03 01 24 05 WIND1 0SO HOUREMIS 03 01 24 05 WIND2 0SO HOUREMIS 03 01 24 05 WIND3 0SO HOUREMIS 03 01 24 05 WIND4 0SO HOUREMIS 03 01 24 06 WIND1 0SO HOUREMIS 03 01 24 06 WIND2 0SO HOUREMIS 03 01 24 06 WIND3 0SO HOUREMIS 03 01 24 06 WIND4 0SO HOUREMIS 03 01 24 07 WIND1 0SO HOUREMIS 03 01 24 07 WIND2 0SO HOUREMIS 03 01 24 07 WIND3 0SO HOUREMIS 03 01 24 07 WIND4 0SO HOUREMIS 03 01 24 08 WIND1 0SO HOUREMIS 03 01 24 08 WIND2 0SO HOUREMIS 03 01 24 08 WIND3 0SO HOUREMIS 03 01 24 08 WIND4 0SO HOUREMIS 03 01 24 09 WIND1 0SO HOUREMIS 03 01 24 09 WIND2 0SO HOUREMIS 03 01 24 09 WIND3 0SO HOUREMIS 03 01 24 09 WIND4 0
Clermont Coal Mine Project – Supplementary Report PAGE A-15
SO HOUREMIS 03 01 24 10 WIND1 0SO HOUREMIS 03 01 24 10 WIND2 0SO HOUREMIS 03 01 24 10 WIND3 0SO HOUREMIS 03 01 24 10 WIND4 0SO HOUREMIS 03 01 24 11 WIND1 1.71263E-05SO HOUREMIS 03 01 24 11 WIND2 7.59041E-05SO HOUREMIS 03 01 24 11 WIND3 0SO HOUREMIS 03 01 24 11 WIND4 3.11859E-05SO HOUREMIS 03 01 24 12 WIND1 1.71263E-05SO HOUREMIS 03 01 24 12 WIND2 7.59041E-05SO HOUREMIS 03 01 24 12 WIND3 0SO HOUREMIS 03 01 24 12 WIND4 3.11859E-05SO HOUREMIS 03 01 24 13 WIND1 1.71263E-05SO HOUREMIS 03 01 24 13 WIND2 7.59041E-05SO HOUREMIS 03 01 24 13 WIND3 0SO HOUREMIS 03 01 24 13 WIND4 3.11859E-05SO HOUREMIS 03 01 24 14 WIND1 1.71263E-05SO HOUREMIS 03 01 24 14 WIND2 7.59041E-05SO HOUREMIS 03 01 24 14 WIND3 0SO HOUREMIS 03 01 24 14 WIND4 3.11859E-05SO HOUREMIS 03 01 24 15 WIND1 1.71263E-05SO HOUREMIS 03 01 24 15 WIND2 7.59041E-05SO HOUREMIS 03 01 24 15 WIND3 0SO HOUREMIS 03 01 24 15 WIND4 3.11859E-05SO HOUREMIS 03 01 24 16 WIND1 1.71263E-05SO HOUREMIS 03 01 24 16 WIND2 7.59041E-05SO HOUREMIS 03 01 24 16 WIND3 0SO HOUREMIS 03 01 24 16 WIND4 3.11859E-05SO HOUREMIS 03 01 24 17 WIND1 1.71263E-05SO HOUREMIS 03 01 24 17 WIND2 7.59041E-05SO HOUREMIS 03 01 24 17 WIND3 0SO HOUREMIS 03 01 24 17 WIND4 3.11859E-05SO HOUREMIS 03 01 24 18 WIND1 0SO HOUREMIS 03 01 24 18 WIND2 0SO HOUREMIS 03 01 24 18 WIND3 0SO HOUREMIS 03 01 24 18 WIND4 0SO HOUREMIS 03 01 24 19 WIND1 0SO HOUREMIS 03 01 24 19 WIND2 0SO HOUREMIS 03 01 24 19 WIND3 0SO HOUREMIS 03 01 24 19 WIND4 0SO HOUREMIS 03 01 24 20 WIND1 0SO HOUREMIS 03 01 24 20 WIND2 0SO HOUREMIS 03 01 24 20 WIND3 0SO HOUREMIS 03 01 24 20 WIND4 0SO HOUREMIS 03 01 24 21 WIND1 0SO HOUREMIS 03 01 24 21 WIND2 0SO HOUREMIS 03 01 24 21 WIND3 0SO HOUREMIS 03 01 24 21 WIND4 0SO HOUREMIS 03 01 24 22 WIND1 0SO HOUREMIS 03 01 24 22 WIND2 0SO HOUREMIS 03 01 24 22 WIND3 0SO HOUREMIS 03 01 24 22 WIND4 0SO HOUREMIS 03 01 24 23 WIND1 0SO HOUREMIS 03 01 24 23 WIND2 0SO HOUREMIS 03 01 24 23 WIND3 0SO HOUREMIS 03 01 24 23 WIND4 0SO HOUREMIS 03 01 24 24 WIND1 0SO HOUREMIS 03 01 24 24 WIND2 0SO HOUREMIS 03 01 24 24 WIND3 0SO HOUREMIS 03 01 24 24 WIND4 0
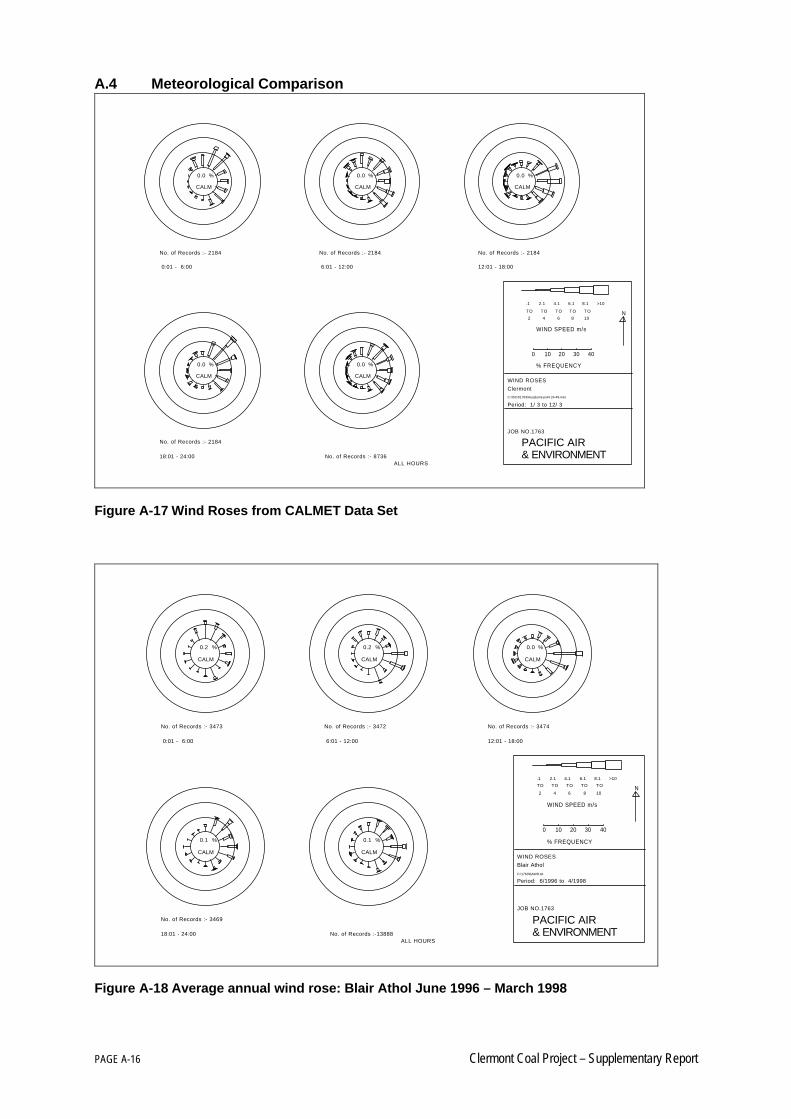
PAGE A-16 Clermont Coal Project – Supplementary Report
A.4 Meteorological Comparison
0.0 %
CALM
No. of Records :- 2184
0:01 - 6:00
0.0 %
CALM
No. of Records :- 2184
6:01 - 12:00
0.0 %
CALM
No. of Records :- 2184
12:01 - 18:00
0.0 %
CALM
No. of Records :- 2184
18:01 - 24:00
0.0 %
CALM
No. of Records :- 8736ALL HOURS
.1
TO
2
2.1
TO
4
4.1
TO
6
6.1
TO
8
8.1
TO
10
>10
WIND SPEED m/s
0 10 20 30 40
% FREQUENCY
N
WIND ROSES
ClermontC:\ISC3\1763\Ausplume point 24-49.met
Period: 1/ 3 to 12/ 3
PACIFIC AIR& ENVIRONMENT
JOB NO.1763
Figure A-17 Wind Roses from CALMET Data Set
0.2 %
CALM
No. of Records :- 3473
0:01 - 6:00
0.2 %
CALM
No. of Records :- 3472
6:01 - 12:00
0.0 %
CALM
No. of Records :- 3474
12:01 - 18:00
0.1 %
CALM
No. of Records :- 3469
18:01 - 24:00
0.1 %
CALM
No. of Records :-13888ALL HOURS
.1
TO
2
2.1
TO
4
4.1
TO
6
6.1
TO
8
8.1
TO
10
>10
WIND SPEED m/s
0 10 20 30 40
% FREQUENCY
N
WIND ROSESBlair AtholC:\1763\BAWR.txt
Period: 6/1996 to 4/1998
PACIFIC AIR& ENVIRONMENT
JOB NO.1763
Figure A-18 Average annual wind rose: Blair Athol June 1996 – March 1998

Appendix B Noise and Vibration Appendices
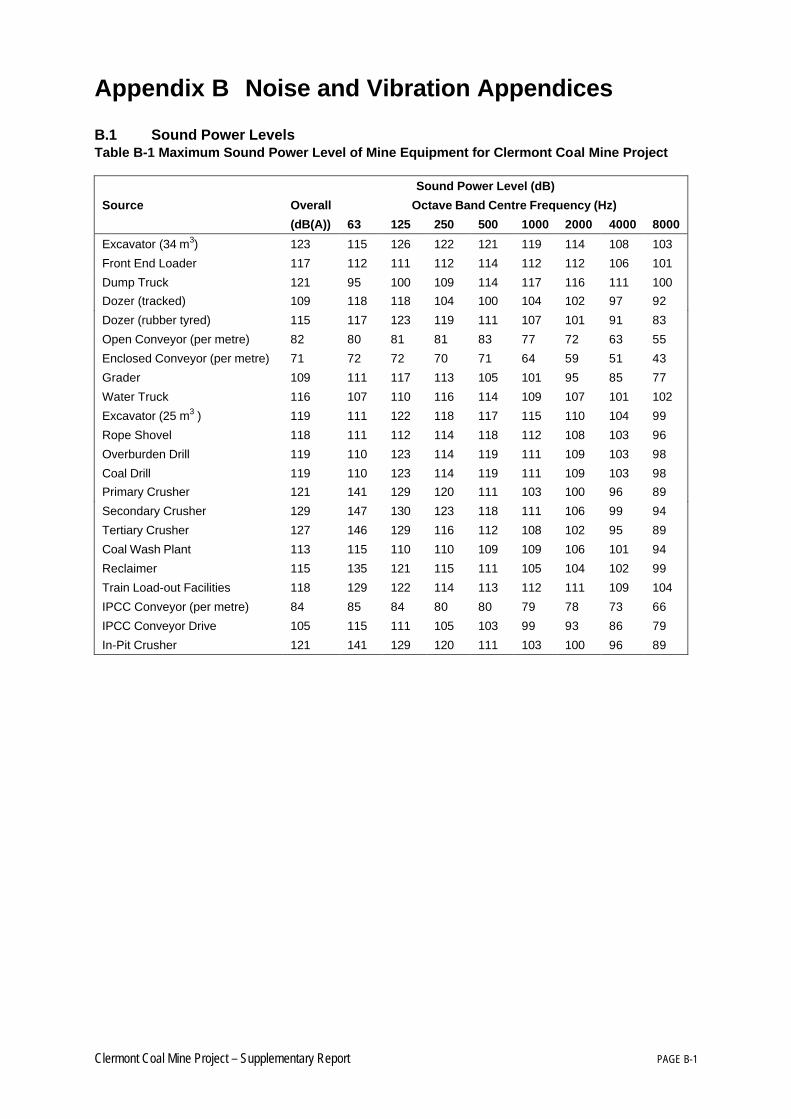
Clermont Coal Mine Project – Supplementary Report PAGE B-1
Appendix B Noise and Vibration Appendices
B.1 Sound Power LevelsTable B-1 Maximum Sound Power Level of Mine Equipment for Clermont Coal Mine Project
Sound Power Level (dB)
Octave Band Centre Frequency (Hz)Source Overall
(dB(A)) 63 125 250 500 1000 2000 4000 8000
Excavator (34 m3) 123 115 126 122 121 119 114 108 103
Front End Loader 117 112 111 112 114 112 112 106 101
Dump Truck 121 95 100 109 114 117 116 111 100
Dozer (tracked) 109 118 118 104 100 104 102 97 92
Dozer (rubber tyred) 115 117 123 119 111 107 101 91 83
Open Conveyor (per metre) 82 80 81 81 83 77 72 63 55
Enclosed Conveyor (per metre) 71 72 72 70 71 64 59 51 43
Grader 109 111 117 113 105 101 95 85 77
Water Truck 116 107 110 116 114 109 107 101 102
Excavator (25 m3 ) 119 111 122 118 117 115 110 104 99
Rope Shovel 118 111 112 114 118 112 108 103 96
Overburden Drill 119 110 123 114 119 111 109 103 98
Coal Drill 119 110 123 114 119 111 109 103 98
Primary Crusher 121 141 129 120 111 103 100 96 89
Secondary Crusher 129 147 130 123 118 111 106 99 94
Tertiary Crusher 127 146 129 116 112 108 102 95 89
Coal Wash Plant 113 115 110 110 109 109 106 101 94
Reclaimer 115 135 121 115 111 105 104 102 99
Train Load-out Facilities 118 129 122 114 113 112 111 109 104
IPCC Conveyor (per metre) 84 85 84 80 80 79 78 73 66
IPCC Conveyor Drive 105 115 111 105 103 99 93 86 79
In-Pit Crusher 121 141 129 120 111 103 100 96 89
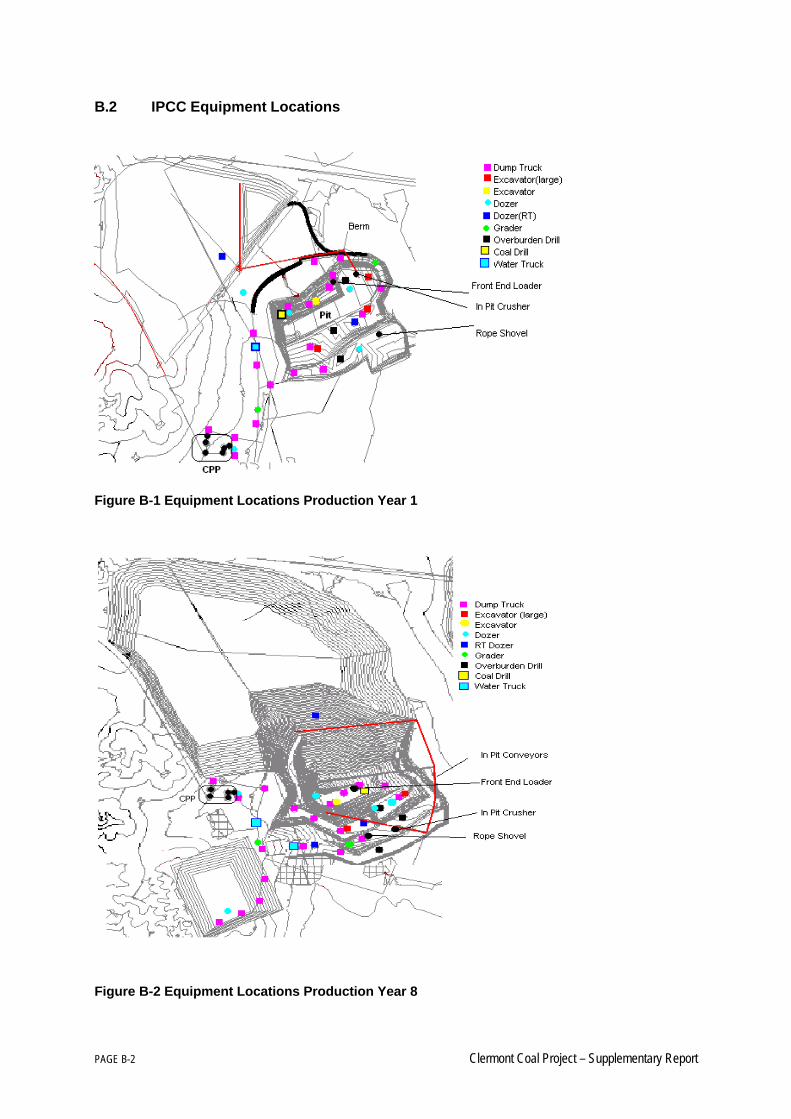
PAGE B-2 Clermont Coal Project – Supplementary Report
B.2 IPCC Equipment Locations
Figure B-1 Equipment Locations Production Year 1
Figure B-2 Equipment Locations Production Year 8

Appendix C Additional Geochemistry Results
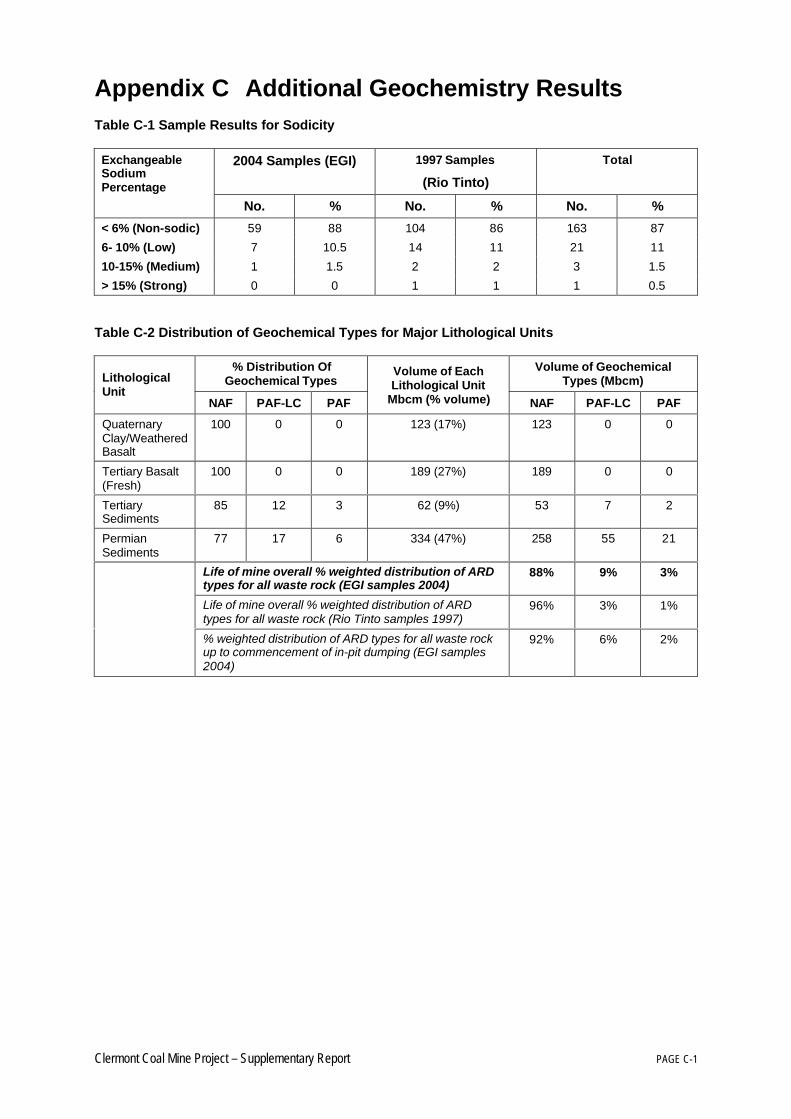
Clermont Coal Mine Project – Supplementary Report PAGE C-1
Appendix C Additional Geochemistry ResultsTable C-1 Sample Results for Sodicity
2004 Samples (EGI) 1997 Samples
(Rio Tinto)
TotalExchangeableSodiumPercentage
No. % No. % No. %
< 6% (Non-sodic) 59 88 104 86 163 87
6- 10% (Low) 7 10.5 14 11 21 11
10-15% (Medium) 1 1.5 2 2 3 1.5
> 15% (Strong) 0 0 1 1 1 0.5
Table C-2 Distribution of Geochemical Types for Major Lithological Units
% Distribution OfGeochemical Types
Volume of GeochemicalTypes (Mbcm)Lithological
UnitNAF PAF-LC PAF
Volume of EachLithological Unit
Mbcm (% volume) NAF PAF-LC PAF
QuaternaryClay/WeatheredBasalt
100 0 0 123 (17%) 123 0 0
Tertiary Basalt(Fresh)
100 0 0 189 (27%) 189 0 0
TertiarySediments
85 12 3 62 (9%) 53 7 2
PermianSediments
77 17 6 334 (47%) 258 55 21
Life of mine overall % weighted distribution of ARDtypes for all waste rock (EGI samples 2004)
88% 9% 3%
Life of mine overall % weighted distribution of ARDtypes for all waste rock (Rio Tinto samples 1997)
96% 3% 1%
% weighted distribution of ARD types for all waste rockup to commencement of in-pit dumping (EGI samples2004)
92% 6% 2%
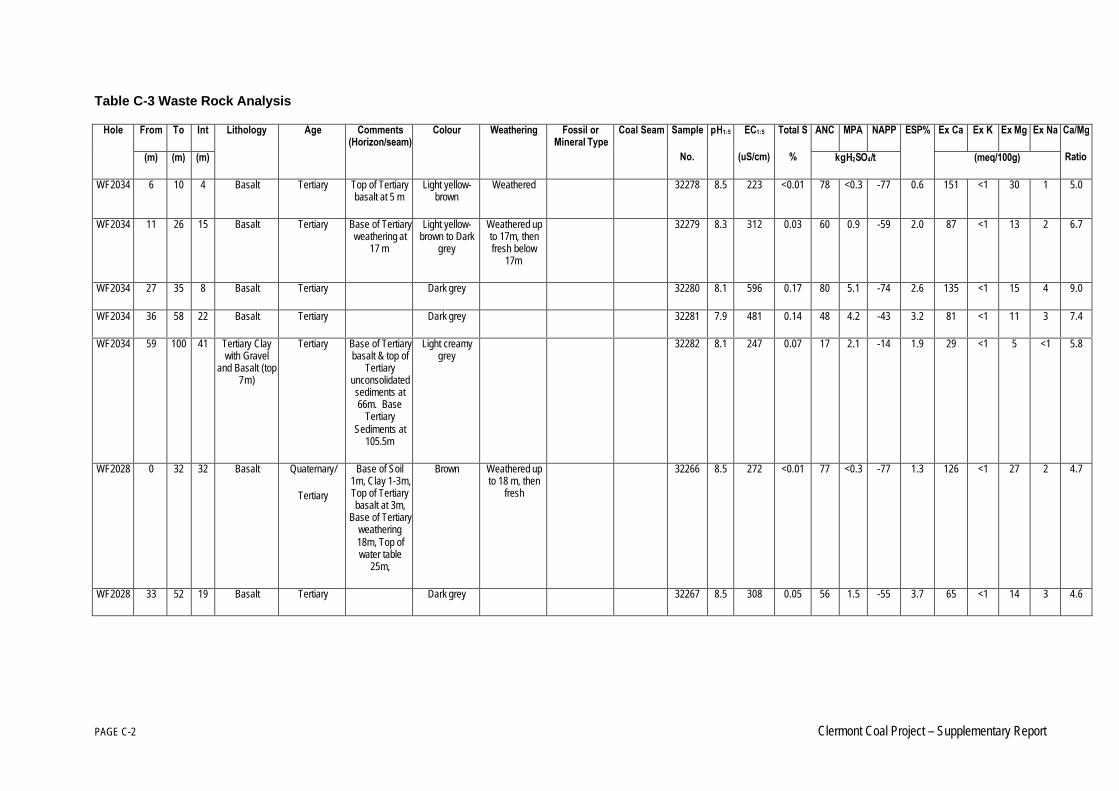
PAGE C-2 Clermont Coal Project – Supplementary Report
Table C-3 Waste Rock Analysis
From To Int ANC MPA NAPP Ex Ca Ex K Ex Mg Ex NaHole
(m) (m) (m)
Lithology Age Comments(Horizon/seam)
Colour Weathering Fossil orMineral Type
Coal Seam Sample
No.
pH1:5 EC1:5
(uS/cm)
Total S
% kgH2SO4/t
ESP%
(meq/100g)
Ca/Mg
Ratio
WF2034 6 10 4 Basalt Tertiary Top of Tertiarybasalt at 5 m
Light yellow-brown
Weathered 32278 8.5 223 <0.01 78 <0.3 -77 0.6 151 <1 30 1 5.0
WF2034 11 26 15 Basalt Tertiary Base of Tertiaryweathering at
17 m
Light yellow-brown to Dark
grey
Weathered upto 17m, thenfresh below
17m
32279 8.3 312 0.03 60 0.9 -59 2.0 87 <1 13 2 6.7
WF2034 27 35 8 Basalt Tertiary Dark grey 32280 8.1 596 0.17 80 5.1 -74 2.6 135 <1 15 4 9.0
WF2034 36 58 22 Basalt Tertiary Dark grey 32281 7.9 481 0.14 48 4.2 -43 3.2 81 <1 11 3 7.4
WF2034 59 100 41 Tertiary Claywith Gravel
and Basalt (top7m)
Tertiary Base of Tertiarybasalt & top of
Tertiaryunconsolidatedsediments at66m. Base
TertiarySediments at
105.5m
Light creamygrey
32282 8.1 247 0.07 17 2.1 -14 1.9 29 <1 5 <1 5.8
WF2028 0 32 32 Basalt Quaternary/
Tertiary
Base of Soil1m, Clay 1-3m,Top of Tertiarybasalt at 3m,
Base of Tertiaryweathering18m, Top ofwater table
25m,
Brown Weathered upto 18 m, then
fresh
32266 8.5 272 <0.01 77 <0.3 -77 1.3 126 <1 27 2 4.7
WF2028 33 52 19 Basalt Tertiary Dark grey 32267 8.5 308 0.05 56 1.5 -55 3.7 65 <1 14 3 4.6
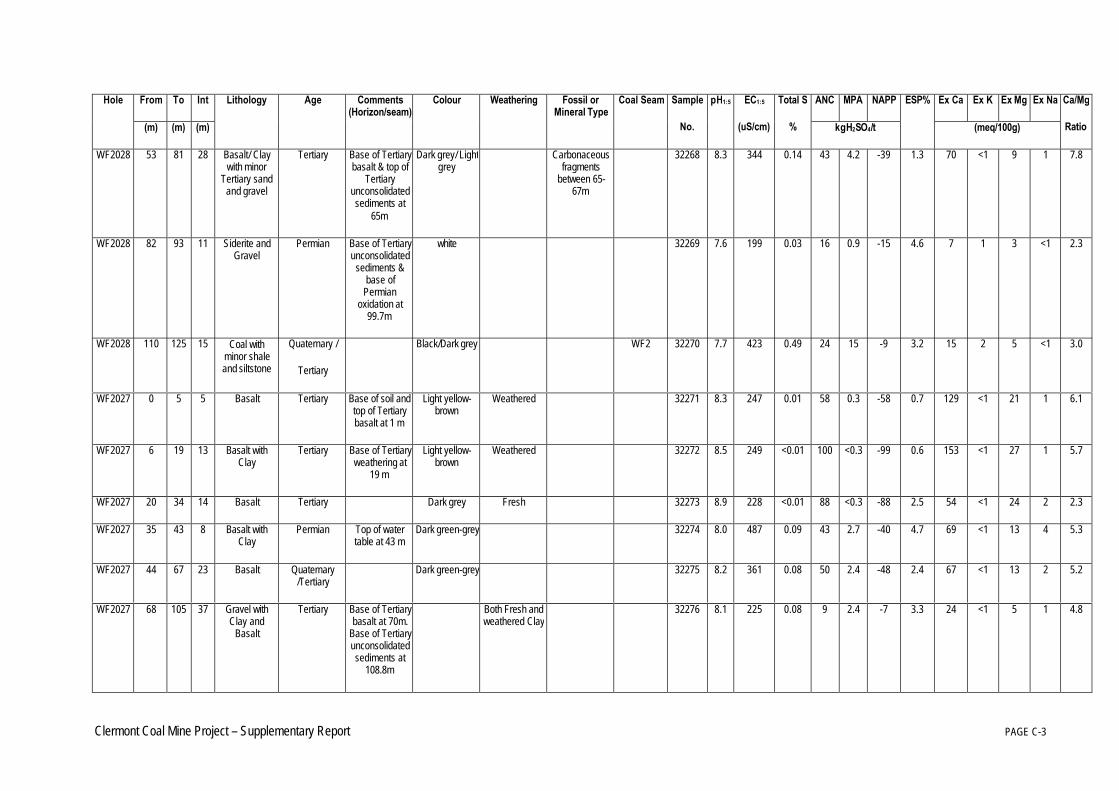
Clermont Coal Mine Project – Supplementary Report PAGE C-3
From To Int ANC MPA NAPP Ex Ca Ex K Ex Mg Ex NaHole
(m) (m) (m)
Lithology Age Comments(Horizon/seam)
Colour Weathering Fossil orMineral Type
Coal Seam Sample
No.
pH1:5 EC1:5
(uS/cm)
Total S
% kgH2SO4/t
ESP%
(meq/100g)
Ca/Mg
Ratio
WF2028 53 81 28 Basalt/ Claywith minor
Tertiary sandand gravel
Tertiary Base of Tertiarybasalt & top of
Tertiaryunconsolidatedsediments at
65m
Dark grey/ Lightgrey
Carbonaceousfragments
between 65-67m
32268 8.3 344 0.14 43 4.2 -39 1.3 70 <1 9 1 7.8
WF2028 82 93 11 Siderite andGravel
Permian Base of Tertiaryunconsolidated
sediments &base of
Permianoxidation at
99.7m
white 32269 7.6 199 0.03 16 0.9 -15 4.6 7 1 3 <1 2.3
WF2028 110 125 15 Coal withminor shaleand siltstone
Quaternary /
Tertiary
Black/Dark grey WF2 32270 7.7 423 0.49 24 15 -9 3.2 15 2 5 <1 3.0
WF2027 0 5 5 Basalt Tertiary Base of soil andtop of Tertiarybasalt at 1 m
Light yellow-brown
Weathered 32271 8.3 247 0.01 58 0.3 -58 0.7 129 <1 21 1 6.1
WF2027 6 19 13 Basalt withClay
Tertiary Base of Tertiaryweathering at
19 m
Light yellow-brown
Weathered 32272 8.5 249 <0.01 100 <0.3 -99 0.6 153 <1 27 1 5.7
WF2027 20 34 14 Basalt Tertiary Dark grey Fresh 32273 8.9 228 <0.01 88 <0.3 -88 2.5 54 <1 24 2 2.3
WF2027 35 43 8 Basalt withClay
Permian Top of watertable at 43 m
Dark green-grey 32274 8.0 487 0.09 43 2.7 -40 4.7 69 <1 13 4 5.3
WF2027 44 67 23 Basalt Quaternary/Tertiary
Dark green-grey 32275 8.2 361 0.08 50 2.4 -48 2.4 67 <1 13 2 5.2
WF2027 68 105 37 Gravel withClay and
Basalt
Tertiary Base of Tertiarybasalt at 70m.
Base of Tertiaryunconsolidatedsediments at
108.8m
Both Fresh andweathered Clay
32276 8.1 225 0.08 9 2.4 -7 3.3 24 <1 5 1 4.8
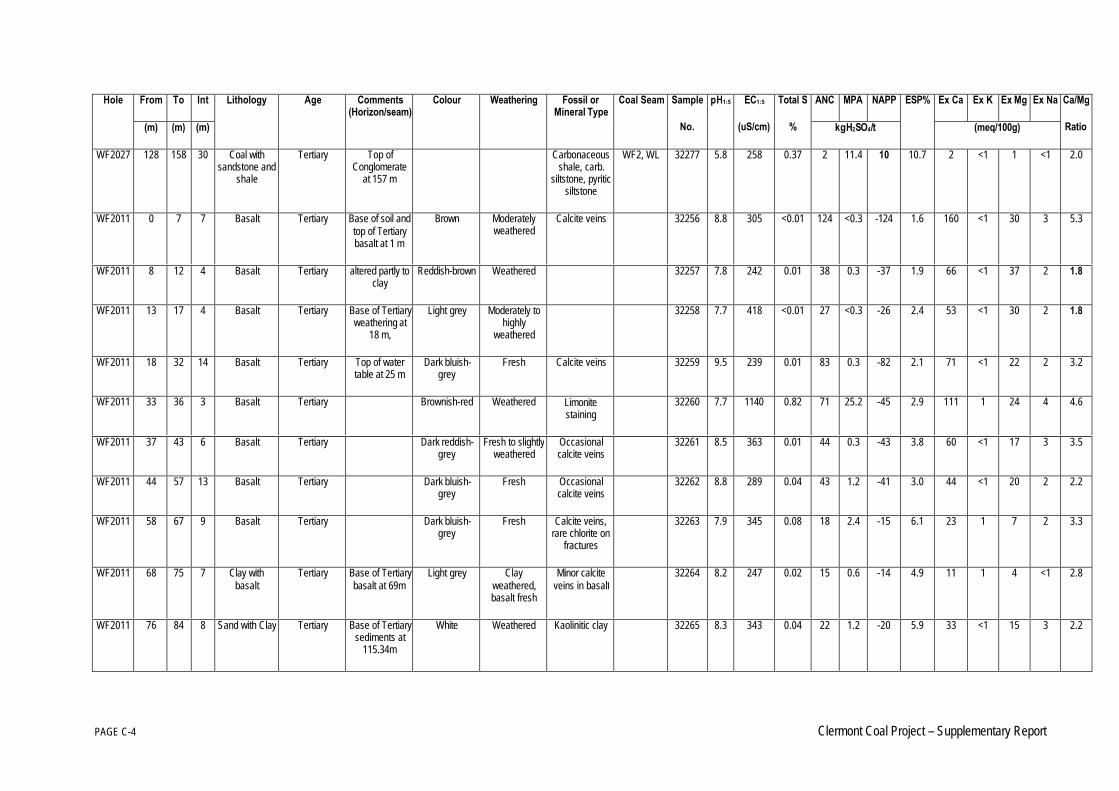
PAGE C-4 Clermont Coal Project – Supplementary Report
From To Int ANC MPA NAPP Ex Ca Ex K Ex Mg Ex NaHole
(m) (m) (m)
Lithology Age Comments(Horizon/seam)
Colour Weathering Fossil orMineral Type
Coal Seam Sample
No.
pH1:5 EC1:5
(uS/cm)
Total S
% kgH2SO4/t
ESP%
(meq/100g)
Ca/Mg
Ratio
WF2027 128 158 30 Coal withsandstone and
shale
Tertiary Top ofConglomerate
at 157 m
Carbonaceousshale, carb.
siltstone, pyriticsiltstone
WF2, WL 32277 5.8 258 0.37 2 11.4 10 10.7 2 <1 1 <1 2.0
WF2011 0 7 7 Basalt Tertiary Base of soil andtop of Tertiarybasalt at 1 m
Brown Moderatelyweathered
Calcite veins 32256 8.8 305 <0.01 124 <0.3 -124 1.6 160 <1 30 3 5.3
WF2011 8 12 4 Basalt Tertiary altered partly toclay
Reddish-brown Weathered 32257 7.8 242 0.01 38 0.3 -37 1.9 66 <1 37 2 1.8
WF2011 13 17 4 Basalt Tertiary Base of Tertiaryweathering at
18 m,
Light grey Moderately tohighly
weathered
32258 7.7 418 <0.01 27 <0.3 -26 2.4 53 <1 30 2 1.8
WF2011 18 32 14 Basalt Tertiary Top of watertable at 25 m
Dark bluish-grey
Fresh Calcite veins 32259 9.5 239 0.01 83 0.3 -82 2.1 71 <1 22 2 3.2
WF2011 33 36 3 Basalt Tertiary Brownish-red Weathered Limonitestaining
32260 7.7 1140 0.82 71 25.2 -45 2.9 111 1 24 4 4.6
WF2011 37 43 6 Basalt Tertiary Dark reddish-grey
Fresh to slightlyweathered
Occasionalcalcite veins
32261 8.5 363 0.01 44 0.3 -43 3.8 60 <1 17 3 3.5
WF2011 44 57 13 Basalt Tertiary Dark bluish-grey
Fresh Occasionalcalcite veins
32262 8.8 289 0.04 43 1.2 -41 3.0 44 <1 20 2 2.2
WF2011 58 67 9 Basalt Tertiary Dark bluish-grey
Fresh Calcite veins,rare chlorite on
fractures
32263 7.9 345 0.08 18 2.4 -15 6.1 23 1 7 2 3.3
WF2011 68 75 7 Clay withbasalt
Tertiary Base of Tertiarybasalt at 69m
Light grey Clayweathered,basalt fresh
Minor calciteveins in basalt
32264 8.2 247 0.02 15 0.6 -14 4.9 11 1 4 <1 2.8
WF2011 76 84 8 Sand with Clay Tertiary Base of Tertiarysediments at
115.34m
White Weathered Kaolinitic clay 32265 8.3 343 0.04 22 1.2 -20 5.9 33 <1 15 3 2.2
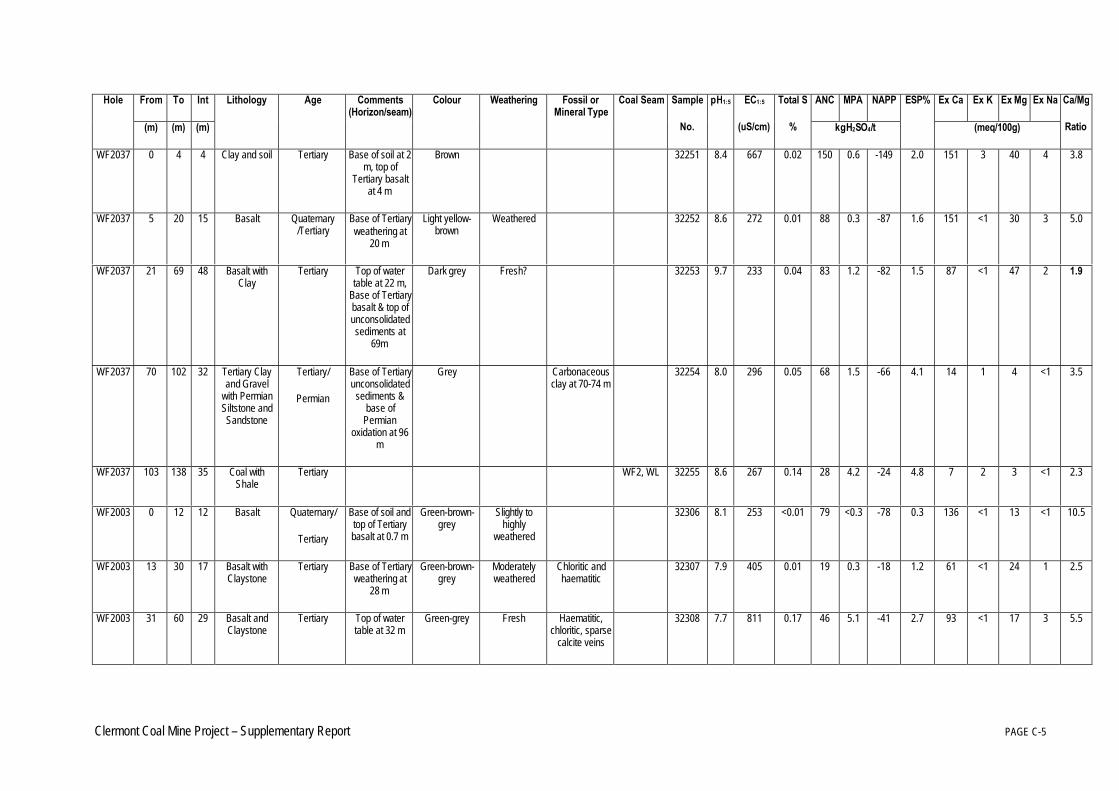
Clermont Coal Mine Project – Supplementary Report PAGE C-5
From To Int ANC MPA NAPP Ex Ca Ex K Ex Mg Ex NaHole
(m) (m) (m)
Lithology Age Comments(Horizon/seam)
Colour Weathering Fossil orMineral Type
Coal Seam Sample
No.
pH1:5 EC1:5
(uS/cm)
Total S
% kgH2SO4/t
ESP%
(meq/100g)
Ca/Mg
Ratio
WF2037 0 4 4 Clay and soil Tertiary Base of soil at 2m, top of
Tertiary basaltat 4 m
Brown 32251 8.4 667 0.02 150 0.6 -149 2.0 151 3 40 4 3.8
WF2037 5 20 15 Basalt Quaternary/Tertiary
Base of Tertiaryweathering at
20 m
Light yellow-brown
Weathered 32252 8.6 272 0.01 88 0.3 -87 1.6 151 <1 30 3 5.0
WF2037 21 69 48 Basalt withClay
Tertiary Top of watertable at 22 m,
Base of Tertiarybasalt & top ofunconsolidatedsediments at
69m
Dark grey Fresh? 32253 9.7 233 0.04 83 1.2 -82 1.5 87 <1 47 2 1.9
WF2037 70 102 32 Tertiary Clayand Gravel
with PermianSiltstone andSandstone
Tertiary/
Permian
Base of Tertiaryunconsolidated
sediments &base of
Permianoxidation at 96
m
Grey Carbonaceousclay at 70-74 m
32254 8.0 296 0.05 68 1.5 -66 4.1 14 1 4 <1 3.5
WF2037 103 138 35 Coal withShale
Tertiary WF2, WL 32255 8.6 267 0.14 28 4.2 -24 4.8 7 2 3 <1 2.3
WF2003 0 12 12 Basalt Quaternary/
Tertiary
Base of soil andtop of Tertiarybasalt at 0.7 m
Green-brown-grey
Slightly tohighly
weathered
32306 8.1 253 <0.01 79 <0.3 -78 0.3 136 <1 13 <1 10.5
WF2003 13 30 17 Basalt withClaystone
Tertiary Base of Tertiaryweathering at
28 m
Green-brown-grey
Moderatelyweathered
Chloritic andhaematitic
32307 7.9 405 0.01 19 0.3 -18 1.2 61 <1 24 1 2.5
WF2003 31 60 29 Basalt andClaystone
Tertiary Top of watertable at 32 m
Green-grey Fresh Haematitic,chloritic, sparse
calcite veins
32308 7.7 811 0.17 46 5.1 -41 2.7 93 <1 17 3 5.5
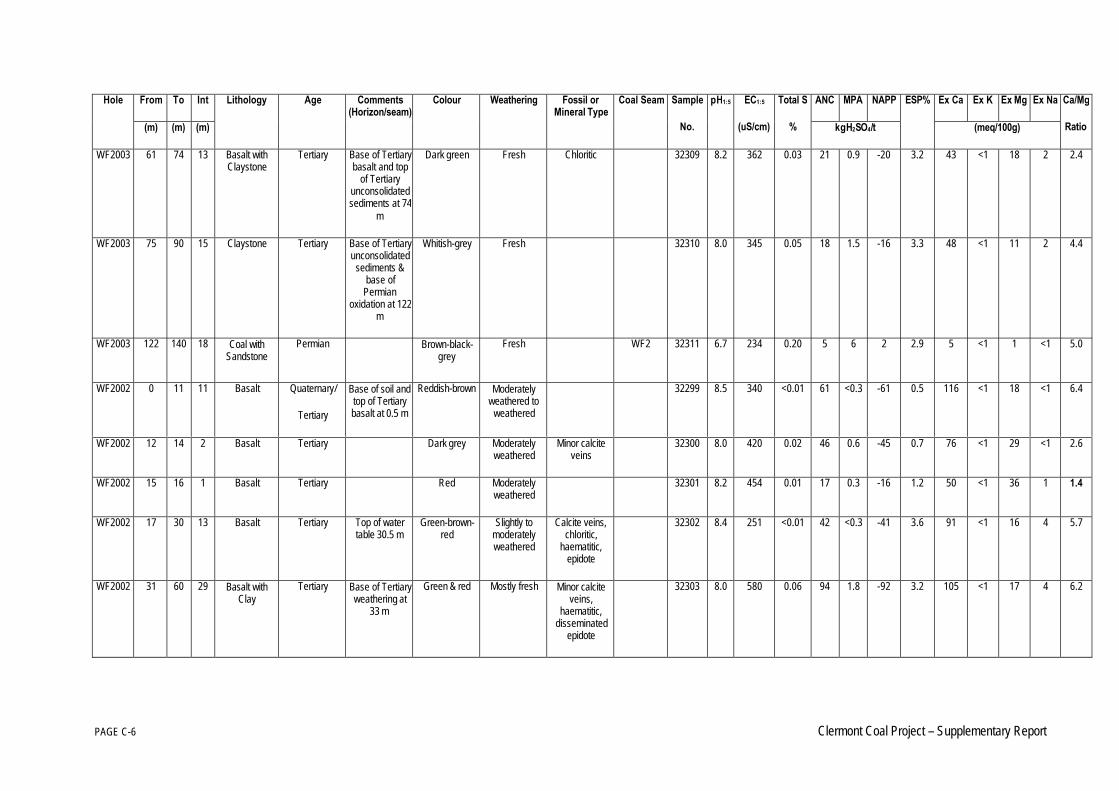
PAGE C-6 Clermont Coal Project – Supplementary Report
From To Int ANC MPA NAPP Ex Ca Ex K Ex Mg Ex NaHole
(m) (m) (m)
Lithology Age Comments(Horizon/seam)
Colour Weathering Fossil orMineral Type
Coal Seam Sample
No.
pH1:5 EC1:5
(uS/cm)
Total S
% kgH2SO4/t
ESP%
(meq/100g)
Ca/Mg
Ratio
WF2003 61 74 13 Basalt withClaystone
Tertiary Base of Tertiarybasalt and top
of Tertiaryunconsolidatedsediments at 74
m
Dark green Fresh Chloritic 32309 8.2 362 0.03 21 0.9 -20 3.2 43 <1 18 2 2.4
WF2003 75 90 15 Claystone Tertiary Base of Tertiaryunconsolidated
sediments &base of
Permianoxidation at 122
m
Whitish-grey Fresh 32310 8.0 345 0.05 18 1.5 -16 3.3 48 <1 11 2 4.4
WF2003 122 140 18 Coal withSandstone
Permian Brown-black-grey
Fresh WF2 32311 6.7 234 0.20 5 6 2 2.9 5 <1 1 <1 5.0
WF2002 0 11 11 Basalt Quaternary/
Tertiary
Base of soil andtop of Tertiarybasalt at 0.5 m
Reddish-brown Moderatelyweathered to
weathered
32299 8.5 340 <0.01 61 <0.3 -61 0.5 116 <1 18 <1 6.4
WF2002 12 14 2 Basalt Tertiary Dark grey Moderatelyweathered
Minor calciteveins
32300 8.0 420 0.02 46 0.6 -45 0.7 76 <1 29 <1 2.6
WF2002 15 16 1 Basalt Tertiary Red Moderatelyweathered
32301 8.2 454 0.01 17 0.3 -16 1.2 50 <1 36 1 1.4
WF2002 17 30 13 Basalt Tertiary Top of watertable 30.5 m
Green-brown-red
Slightly tomoderatelyweathered
Calcite veins,chloritic,
haematitic,epidote
32302 8.4 251 <0.01 42 <0.3 -41 3.6 91 <1 16 4 5.7
WF2002 31 60 29 Basalt withClay
Tertiary Base of Tertiaryweathering at
33 m
Green & red Mostly fresh Minor calciteveins,
haematitic,disseminated
epidote
32303 8.0 580 0.06 94 1.8 -92 3.2 105 <1 17 4 6.2
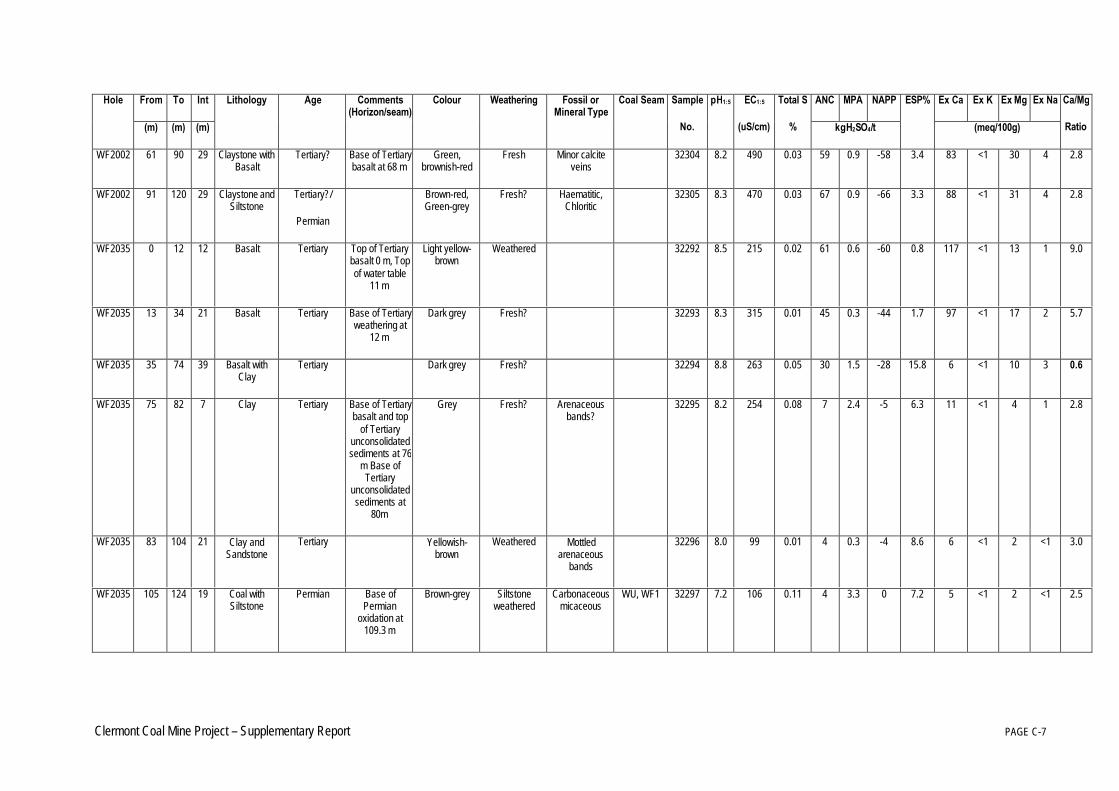
Clermont Coal Mine Project – Supplementary Report PAGE C-7
From To Int ANC MPA NAPP Ex Ca Ex K Ex Mg Ex NaHole
(m) (m) (m)
Lithology Age Comments(Horizon/seam)
Colour Weathering Fossil orMineral Type
Coal Seam Sample
No.
pH1:5 EC1:5
(uS/cm)
Total S
% kgH2SO4/t
ESP%
(meq/100g)
Ca/Mg
Ratio
WF2002 61 90 29 Claystone withBasalt
Tertiary? Base of Tertiarybasalt at 68 m
Green,brownish-red
Fresh Minor calciteveins
32304 8.2 490 0.03 59 0.9 -58 3.4 83 <1 30 4 2.8
WF2002 91 120 29 Claystone andSiltstone
Tertiary?/
Permian
Brown-red,Green-grey
Fresh? Haematitic,Chloritic
32305 8.3 470 0.03 67 0.9 -66 3.3 88 <1 31 4 2.8
WF2035 0 12 12 Basalt Tertiary Top of Tertiarybasalt 0 m, Topof water table
11 m
Light yellow-brown
Weathered 32292 8.5 215 0.02 61 0.6 -60 0.8 117 <1 13 1 9.0
WF2035 13 34 21 Basalt Tertiary Base of Tertiaryweathering at
12 m
Dark grey Fresh? 32293 8.3 315 0.01 45 0.3 -44 1.7 97 <1 17 2 5.7
WF2035 35 74 39 Basalt withClay
Tertiary Dark grey Fresh? 32294 8.8 263 0.05 30 1.5 -28 15.8 6 <1 10 3 0.6
WF2035 75 82 7 Clay Tertiary Base of Tertiarybasalt and top
of Tertiaryunconsolidatedsediments at 76
m Base ofTertiary
unconsolidatedsediments at
80m
Grey Fresh? Arenaceousbands?
32295 8.2 254 0.08 7 2.4 -5 6.3 11 <1 4 1 2.8
WF2035 83 104 21 Clay andSandstone
Tertiary Yellowish-brown
Weathered Mottledarenaceous
bands
32296 8.0 99 0.01 4 0.3 -4 8.6 6 <1 2 <1 3.0
WF2035 105 124 19 Coal withSiltstone
Permian Base ofPermian
oxidation at109.3 m
Brown-grey Siltstoneweathered
Carbonaceousmicaceous
WU, WF1 32297 7.2 106 0.11 4 3.3 0 7.2 5 <1 2 <1 2.5
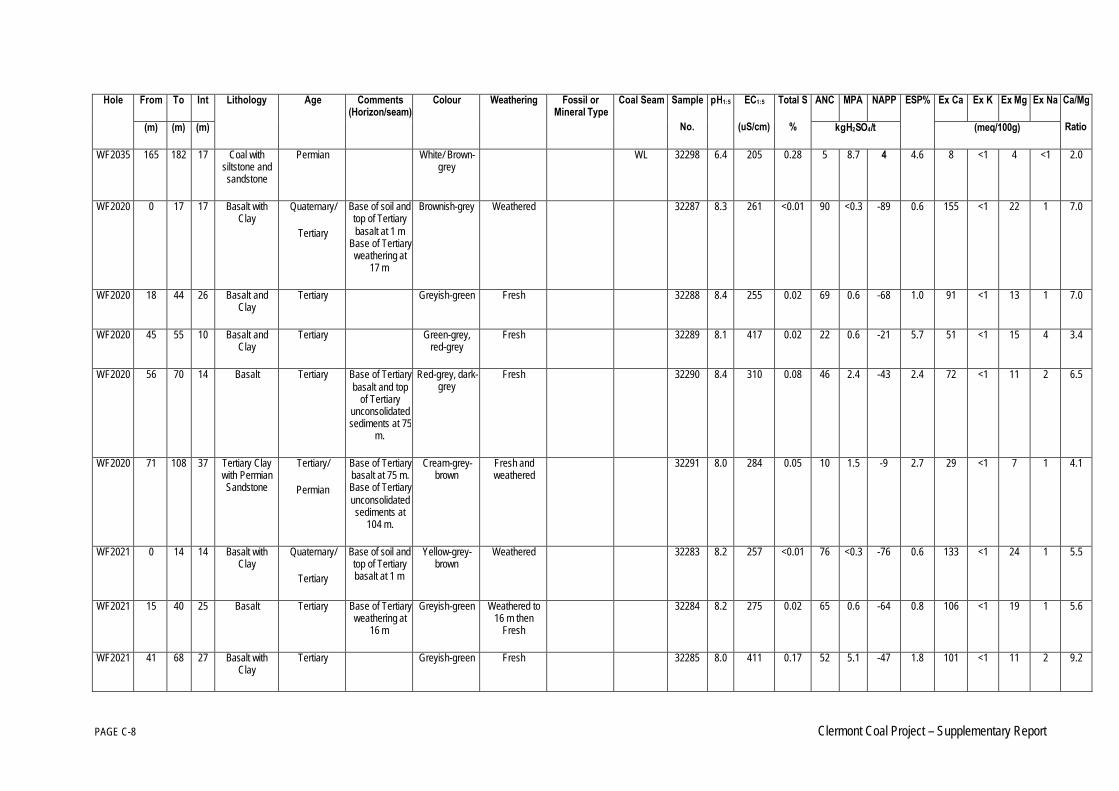
PAGE C-8 Clermont Coal Project – Supplementary Report
From To Int ANC MPA NAPP Ex Ca Ex K Ex Mg Ex NaHole
(m) (m) (m)
Lithology Age Comments(Horizon/seam)
Colour Weathering Fossil orMineral Type
Coal Seam Sample
No.
pH1:5 EC1:5
(uS/cm)
Total S
% kgH2SO4/t
ESP%
(meq/100g)
Ca/Mg
Ratio
WF2035 165 182 17 Coal withsiltstone andsandstone
Permian White/ Brown-grey
WL 32298 6.4 205 0.28 5 8.7 4 4.6 8 <1 4 <1 2.0
WF2020 0 17 17 Basalt withClay
Quaternary/
Tertiary
Base of soil andtop of Tertiarybasalt at 1 m
Base of Tertiaryweathering at
17 m
Brownish-grey Weathered 32287 8.3 261 <0.01 90 <0.3 -89 0.6 155 <1 22 1 7.0
WF2020 18 44 26 Basalt andClay
Tertiary Greyish-green Fresh 32288 8.4 255 0.02 69 0.6 -68 1.0 91 <1 13 1 7.0
WF2020 45 55 10 Basalt andClay
Tertiary Green-grey,red-grey
Fresh 32289 8.1 417 0.02 22 0.6 -21 5.7 51 <1 15 4 3.4
WF2020 56 70 14 Basalt Tertiary Base of Tertiarybasalt and top
of Tertiaryunconsolidatedsediments at 75
m.
Red-grey, dark-grey
Fresh 32290 8.4 310 0.08 46 2.4 -43 2.4 72 <1 11 2 6.5
WF2020 71 108 37 Tertiary Claywith PermianSandstone
Tertiary/
Permian
Base of Tertiarybasalt at 75 m.Base of Tertiaryunconsolidatedsediments at
104 m.
Cream-grey-brown
Fresh andweathered
32291 8.0 284 0.05 10 1.5 -9 2.7 29 <1 7 1 4.1
WF2021 0 14 14 Basalt withClay
Quaternary/
Tertiary
Base of soil andtop of Tertiarybasalt at 1 m
Yellow-grey-brown
Weathered 32283 8.2 257 <0.01 76 <0.3 -76 0.6 133 <1 24 1 5.5
WF2021 15 40 25 Basalt Tertiary Base of Tertiaryweathering at
16 m
Greyish-green Weathered to16 m then
Fresh
32284 8.2 275 0.02 65 0.6 -64 0.8 106 <1 19 1 5.6
WF2021 41 68 27 Basalt withClay
Tertiary Greyish-green Fresh 32285 8.0 411 0.17 52 5.1 -47 1.8 101 <1 11 2 9.2
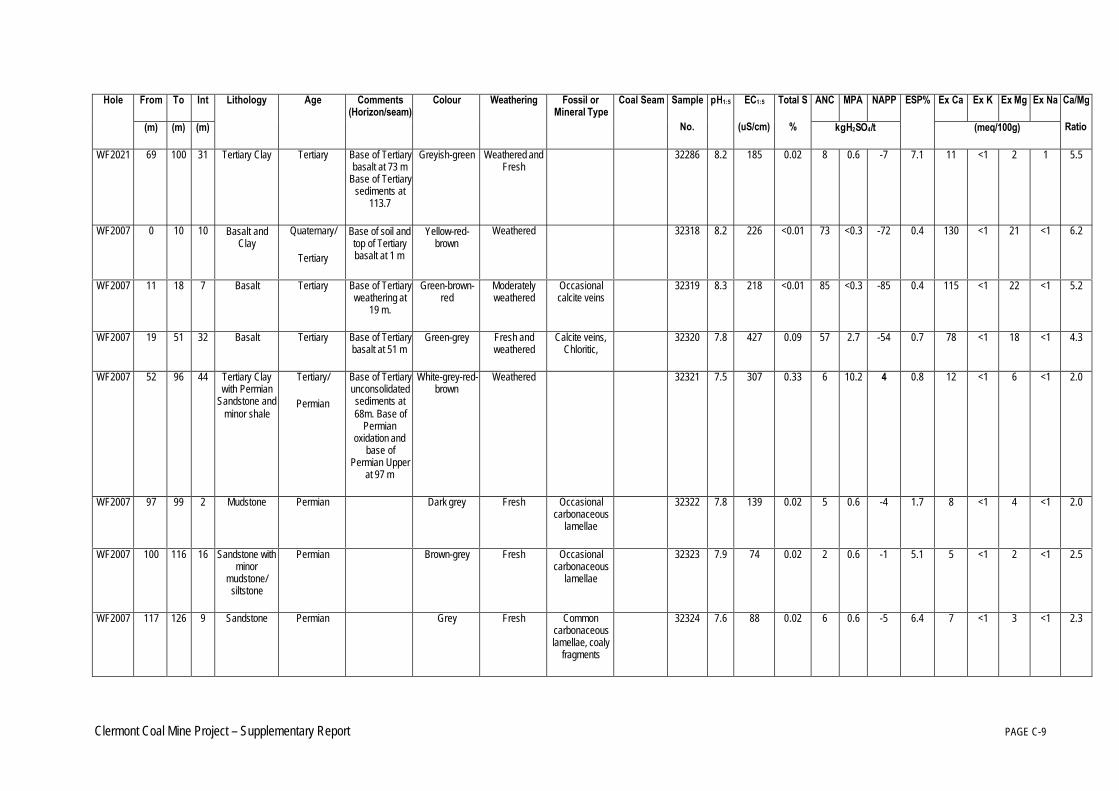
Clermont Coal Mine Project – Supplementary Report PAGE C-9
From To Int ANC MPA NAPP Ex Ca Ex K Ex Mg Ex NaHole
(m) (m) (m)
Lithology Age Comments(Horizon/seam)
Colour Weathering Fossil orMineral Type
Coal Seam Sample
No.
pH1:5 EC1:5
(uS/cm)
Total S
% kgH2SO4/t
ESP%
(meq/100g)
Ca/Mg
Ratio
WF2021 69 100 31 Tertiary Clay Tertiary Base of Tertiarybasalt at 73 m
Base of Tertiarysediments at
113.7
Greyish-green Weathered andFresh
32286 8.2 185 0.02 8 0.6 -7 7.1 11 <1 2 1 5.5
WF2007 0 10 10 Basalt andClay
Quaternary/
Tertiary
Base of soil andtop of Tertiarybasalt at 1 m
Yellow-red-brown
Weathered 32318 8.2 226 <0.01 73 <0.3 -72 0.4 130 <1 21 <1 6.2
WF2007 11 18 7 Basalt Tertiary Base of Tertiaryweathering at
19 m.
Green-brown-red
Moderatelyweathered
Occasionalcalcite veins
32319 8.3 218 <0.01 85 <0.3 -85 0.4 115 <1 22 <1 5.2
WF2007 19 51 32 Basalt Tertiary Base of Tertiarybasalt at 51 m
Green-grey Fresh andweathered
Calcite veins,Chloritic,
32320 7.8 427 0.09 57 2.7 -54 0.7 78 <1 18 <1 4.3
WF2007 52 96 44 Tertiary Claywith Permian
Sandstone andminor shale
Tertiary/
Permian
Base of Tertiaryunconsolidatedsediments at68m. Base of
Permianoxidation and
base ofPermian Upper
at 97 m
White-grey-red-brown
Weathered 32321 7.5 307 0.33 6 10.2 4 0.8 12 <1 6 <1 2.0
WF2007 97 99 2 Mudstone Permian Dark grey Fresh Occasionalcarbonaceous
lamellae
32322 7.8 139 0.02 5 0.6 -4 1.7 8 <1 4 <1 2.0
WF2007 100 116 16 Sandstone withminor
mudstone/siltstone
Permian Brown-grey Fresh Occasionalcarbonaceous
lamellae
32323 7.9 74 0.02 2 0.6 -1 5.1 5 <1 2 <1 2.5
WF2007 117 126 9 Sandstone Permian Grey Fresh Commoncarbonaceouslamellae, coaly
fragments
32324 7.6 88 0.02 6 0.6 -5 6.4 7 <1 3 <1 2.3
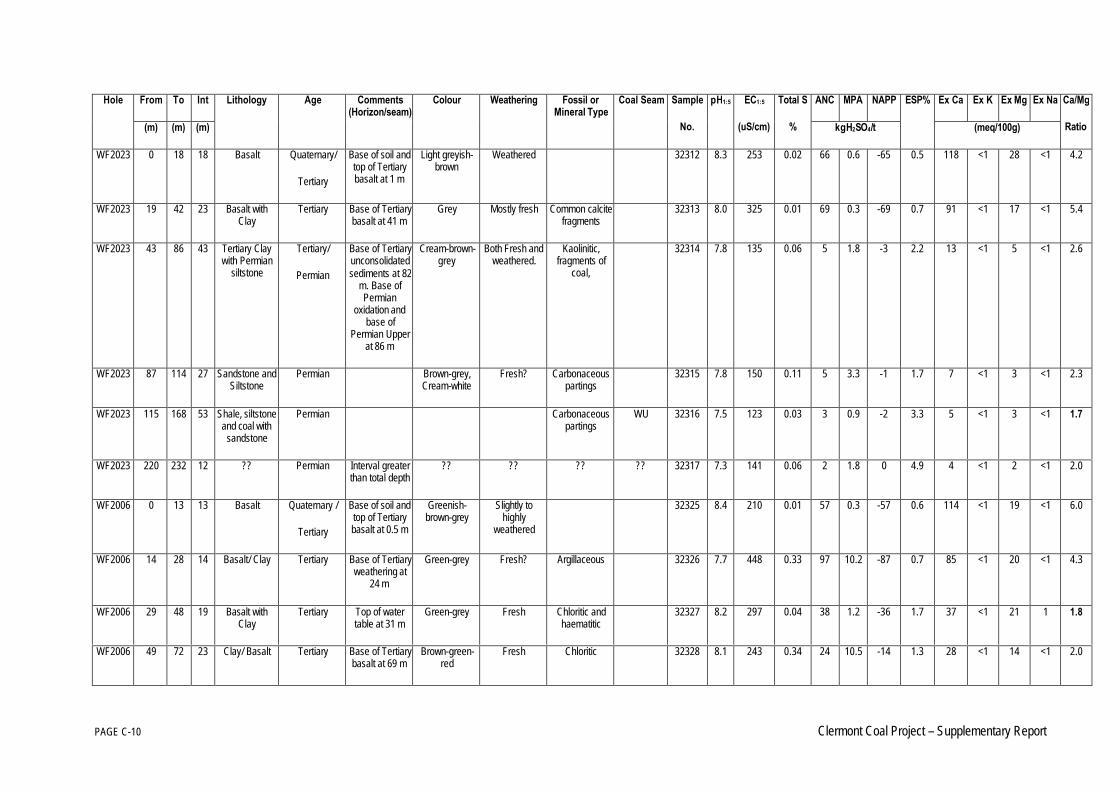
PAGE C-10 Clermont Coal Project – Supplementary Report
From To Int ANC MPA NAPP Ex Ca Ex K Ex Mg Ex NaHole
(m) (m) (m)
Lithology Age Comments(Horizon/seam)
Colour Weathering Fossil orMineral Type
Coal Seam Sample
No.
pH1:5 EC1:5
(uS/cm)
Total S
% kgH2SO4/t
ESP%
(meq/100g)
Ca/Mg
Ratio
WF2023 0 18 18 Basalt Quaternary/
Tertiary
Base of soil andtop of Tertiarybasalt at 1 m
Light greyish-brown
Weathered 32312 8.3 253 0.02 66 0.6 -65 0.5 118 <1 28 <1 4.2
WF2023 19 42 23 Basalt withClay
Tertiary Base of Tertiarybasalt at 41 m
Grey Mostly fresh Common calcitefragments
32313 8.0 325 0.01 69 0.3 -69 0.7 91 <1 17 <1 5.4
WF2023 43 86 43 Tertiary Claywith Permian
siltstone
Tertiary/
Permian
Base of Tertiaryunconsolidatedsediments at 82
m. Base ofPermian
oxidation andbase of
Permian Upperat 86 m
Cream-brown-grey
Both Fresh andweathered.
Kaolinitic,fragments of
coal,
32314 7.8 135 0.06 5 1.8 -3 2.2 13 <1 5 <1 2.6
WF2023 87 114 27 Sandstone andSiltstone
Permian Brown-grey,Cream-white
Fresh? Carbonaceouspartings
32315 7.8 150 0.11 5 3.3 -1 1.7 7 <1 3 <1 2.3
WF2023 115 168 53 Shale, siltstoneand coal with
sandstone
Permian Carbonaceouspartings
WU 32316 7.5 123 0.03 3 0.9 -2 3.3 5 <1 3 <1 1.7
WF2023 220 232 12 ?? Permian Interval greaterthan total depth
?? ?? ?? ?? 32317 7.3 141 0.06 2 1.8 0 4.9 4 <1 2 <1 2.0
WF2006 0 13 13 Basalt Quaternary /
Tertiary
Base of soil andtop of Tertiarybasalt at 0.5 m
Greenish-brown-grey
Slightly tohighly
weathered
32325 8.4 210 0.01 57 0.3 -57 0.6 114 <1 19 <1 6.0
WF2006 14 28 14 Basalt/ Clay Tertiary Base of Tertiaryweathering at
24 m
Green-grey Fresh? Argillaceous 32326 7.7 448 0.33 97 10.2 -87 0.7 85 <1 20 <1 4.3
WF2006 29 48 19 Basalt withClay
Tertiary Top of watertable at 31 m
Green-grey Fresh Chloritic andhaematitic
32327 8.2 297 0.04 38 1.2 -36 1.7 37 <1 21 1 1.8
WF2006 49 72 23 Clay/ Basalt Tertiary Base of Tertiarybasalt at 69 m
Brown-green-red
Fresh Chloritic 32328 8.1 243 0.34 24 10.5 -14 1.3 28 <1 14 <1 2.0
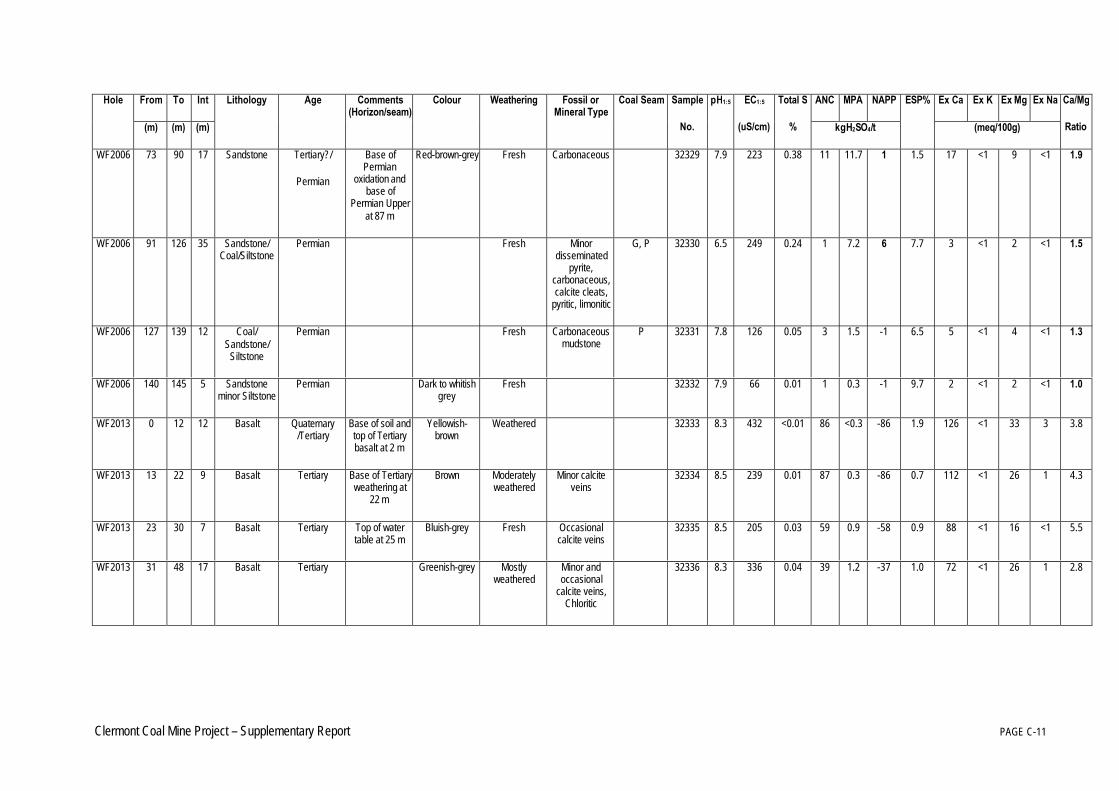
Clermont Coal Mine Project – Supplementary Report PAGE C-11
From To Int ANC MPA NAPP Ex Ca Ex K Ex Mg Ex NaHole
(m) (m) (m)
Lithology Age Comments(Horizon/seam)
Colour Weathering Fossil orMineral Type
Coal Seam Sample
No.
pH1:5 EC1:5
(uS/cm)
Total S
% kgH2SO4/t
ESP%
(meq/100g)
Ca/Mg
Ratio
WF2006 73 90 17 Sandstone Tertiary?/
Permian
Base ofPermian
oxidation andbase of
Permian Upperat 87 m
Red-brown-grey Fresh Carbonaceous 32329 7.9 223 0.38 11 11.7 1 1.5 17 <1 9 <1 1.9
WF2006 91 126 35 Sandstone/Coal/Siltstone
Permian Fresh Minordisseminated
pyrite,carbonaceous,calcite cleats,
pyritic, limonitic
G, P 32330 6.5 249 0.24 1 7.2 6 7.7 3 <1 2 <1 1.5
WF2006 127 139 12 Coal/Sandstone/
Siltstone
Permian Fresh Carbonaceousmudstone
P 32331 7.8 126 0.05 3 1.5 -1 6.5 5 <1 4 <1 1.3
WF2006 140 145 5 Sandstoneminor Siltstone
Permian Dark to whitishgrey
Fresh 32332 7.9 66 0.01 1 0.3 -1 9.7 2 <1 2 <1 1.0
WF2013 0 12 12 Basalt Quaternary/Tertiary
Base of soil andtop of Tertiarybasalt at 2 m
Yellowish-brown
Weathered 32333 8.3 432 <0.01 86 <0.3 -86 1.9 126 <1 33 3 3.8
WF2013 13 22 9 Basalt Tertiary Base of Tertiaryweathering at
22 m
Brown Moderatelyweathered
Minor calciteveins
32334 8.5 239 0.01 87 0.3 -86 0.7 112 <1 26 1 4.3
WF2013 23 30 7 Basalt Tertiary Top of watertable at 25 m
Bluish-grey Fresh Occasionalcalcite veins
32335 8.5 205 0.03 59 0.9 -58 0.9 88 <1 16 <1 5.5
WF2013 31 48 17 Basalt Tertiary Greenish-grey Mostlyweathered
Minor andoccasional
calcite veins,Chloritic
32336 8.3 336 0.04 39 1.2 -37 1.0 72 <1 26 1 2.8
PAGE C-12 Clermont Coal Project – Supplementary Report
From To Int ANC MPA NAPP Ex Ca Ex K Ex Mg Ex NaHole
(m) (m) (m)
Lithology Age Comments(Horizon/seam)
Colour Weathering Fossil orMineral Type
Coal Seam Sample
No.
pH1:5 EC1:5
(uS/cm)
Total S
% kgH2SO4/t
ESP%
(meq/100g)
Ca/Mg
Ratio
WF2013 49 60 11 Basalt Tertiary/
Permian
Base of Tertiarybasalt & top of
Tertiaryunconsolidatedsediments at 60
m
Dark grey Mostly fresh Minor andoccasional
calcite veins
32337 7.9 557 0.29 38 9 -29 2.4 65 <1 18 2 3.6
WF2013 61 90 29 Tertiary Sandand PermianSandstone
Permian Base of Tertiaryunconsolidatedsediments at 66
m
32338 8.4 311 0.08 46 2.4 -44 0.9 95 <1 18 1 5.3
WF2013 91 97 6 Sandstone Permian Base ofPermian
oxidation andbase of
Permian Upperat 92 m
Light grey Above 92 mweathered,below fresh
32339 8.2 259 0.02 24 0.6 -23 1.2 68 <1 12 1 5.7
WF2013 98 137 39 Sandstone/Siltstone
Permian Brown-grey Fresh Carbonaceousremains on
bedding, rarecoaly lenses
32340 8.7 150 0.03 9 0.9 -8 2.4 17 <1 4 <1 4.3
WF2013 138 157 19 Sandstone/Siltstone
Permian Grey Fresh Rare pyrite andcarbonaceous
remains onbeddingsurfaces
32341 8.4 153 0.03 6 0.9 -5 5.1 11 <1 4 <1 2.8
WF2013 202 210 8 Sandstone/Siltstone
Permian Brown-grey Fresh Minorcarbonaceous
lamellae
32342 8.6 121 0.04 3 1.2 -1 8.7 6 <1 2 <1 3.0
WF2043 0 2 2 Soil Quaternary Base of soil at 2m
32349 8.6 431 0.01 52 0.3 -51 2.1 101 2 36 3 2.8
WF2043 3 10 7 Clay Tertiary Top of Tertiarybasalt at 9 m
Yellowish-brown
Weathered 32350 8.8 541 0.01 118 0.3 -118 5.1 121 1 44 9 2.8
Clermont Coal Mine Project – Supplementary Report PAGE C-13
From To Int ANC MPA NAPP Ex Ca Ex K Ex Mg Ex NaHole
(m) (m) (m)
Lithology Age Comments(Horizon/seam)
Colour Weathering Fossil orMineral Type
Coal Seam Sample
No.
pH1:5 EC1:5
(uS/cm)
Total S
% kgH2SO4/t
ESP%
(meq/100g)
Ca/Mg
Ratio
WF2043 11 50 39 Basalt Tertiary Base of Tertiaryweathering at
21 m
Dark grey Mostly fresh Vesicularcommon calcite
fragments
32501 8.3 334 0.07 56 2.1 -54 2.2 70 <1 19 2 3.7
WF2043 51 96 45 Basalt, Clay,Gravel and
Silcrete
Tertiary Base of Tertiarybasalt & top of
Tertiaryunconsolidatedsediments at 60
m
Grey Vesicularcommon calcite
fragmentsabove 60 m
32502 8.5 475 0.06 79 1.8 -77 2.0 113 <1 35 3 3.2
WF2043 97 136 39 Tertiary Graveland Permian
Coal andShale/Siltstone
Tertiary/
Permian
Base of Tertiaryunconsolidated
sediments &base of
Permianoxidation at103.23 m
W, WL 32503 8.5 131 0.27 4 8.4 4 5.4 6 <1 3 <1 2.0
WF2043 137 142 5 Siltstone Permian Dark grey Fresh 32504 8.3 223 0.18 15 5.4 -9 1.2 29 <1 8 <1 3.6
WF2017 0 1 1 Soil Tertiary Base of soil at1.5 m
32505 7.9 409 <0.01 48 <0.3 -48 0.5 104 1 27 <1 3.9
WF2017 2 4 2 Clay Tertiary Yellowish-brown
Highlyweathered
32506 8.2 348 0.02 94 0.6 -93 0.6 138 <1 29 1 4.8
WF2017 5 13 8 Basalt Tertiary Top of Tertiarybasalt at 6 m
Orangey-brown Moderatelyweathered
Calcite veins 32507 8.3 262 0.01 70 0.3 -70 1.3 118 <1 34 2 3.5
WF2017 14 18 4 Basalt Tertiary Top of watertable at 18 m
Brownish-orange
Slightlyweathered
Occasionalcalcite veins
32508 8.5 478 0.03 50 0.9 -49 2.0 61 <1 38 2 1.6
WF2017 19 47 28 Basalt Tertiary Base of Tertiaryweathering at
24 m
Blue-green-brown-grey
Slightlyweathered
above 24m,fresh below
Minor andoccasional
calcite veins,Chloritic
32509 8.3 295 0.06 46 1.8 -44 2.4 66 <1 17 2 3.9
PAGE C-14 Clermont Coal Project – Supplementary Report
From To Int ANC MPA NAPP Ex Ca Ex K Ex Mg Ex NaHole
(m) (m) (m)
Lithology Age Comments(Horizon/seam)
Colour Weathering Fossil orMineral Type
Coal Seam Sample
No.
pH1:5 EC1:5
(uS/cm)
Total S
% kgH2SO4/t
ESP%
(meq/100g)
Ca/Mg
Ratio
WF2017 48 71 23 Basalt/ Clay/Gravel
Tertiary Base of Tertiarybasalt at 53 m
Grey/ White Basalt fresh,gravels & clays
slightlyweathered
Minor andoccasional
calcite veins inbasalt
32510 8.4 346 0.21 23 6.3 -16 3.3 33 <1 26 2 1.3
WF2017 72 97 25 TertiaryClay/Graveland PermianSandstone/
Conglomerate/shale
Tertiary/
Permian
Base of Tertiaryunconsolidatedsediments at 77
m. Base ofPermian
oxidation andbase of
Permian Upperat 86 m
Brownish-grey Slightlyweathered
Carbonaceousremains on
beddingsurfaces, minordisseminated
pyrite
32511 8.5 311 0.25 18 7.8 -10 3.5 29 <1 27 2 1.1
WF2017 127 135 8 Coal/Sandstone
Permian Slightlycarbonaceous
W 32512 8.2 190 0.11 9 3.3 -5 2.7 13 <1 3 <1 4.3
WF2016 0 2 2 Soil Quaternary Base of soil andtop of Tertiarybasalt at 2 m
Black 32343 8.1 298 0.01 52 0.3 -51 0.5 118 <1 34 <1 3.5
WF2016 3 19 16 Basalt Tertiary Base of Tertiaryweathering at
19 m
Light brown Weathered Minor calciteveins between
18 & 19 m
32344 8.5 229 <0.01 111 <0.3 -111 1.1 143 <1 31 2 4.6
WF2016 20 52 32 Basalt Tertiary Top of watertable at 24 m.
Base of Tertiarybasalt at 52 m
Greyish-green Fresh andweathered
Occasionalcalcite veins,
Chloritic
32345 8.4 319 0.06 44 1.8 -42 2.2 64 <1 24 2 2.7
WF2016 53 73 20 Clay Tertiary Base of Tertiaryunconsolidatedsediments at 73
m
White/ Brown Weathered Minor limonitestaining
32346 8.2 394 0.62 43 18.9 -24 0.9 80 <1 14 <1 5.7
Clermont Coal Mine Project – Supplementary Report PAGE C-15
From To Int ANC MPA NAPP Ex Ca Ex K Ex Mg Ex NaHole
(m) (m) (m)
Lithology Age Comments(Horizon/seam)
Colour Weathering Fossil orMineral Type
Coal Seam Sample
No.
pH1:5 EC1:5
(uS/cm)
Total S
% kgH2SO4/t
ESP%
(meq/100g)
Ca/Mg
Ratio
WF2016 74 85 11 Conglomerate/Sandstone
Permian Base ofPermian
oxidation andbase of
Permian Upperat 85 m
White/ Brown-grey
Weathered 32347 8.6 157 0.04 6 1.2 -5 3.7 10 <1 3 <1 3.3
WF2016 86 131 45 Sandstone withcoal
Permian Coal bandbetween 130and 130.15 m
Grey Fresh Carbonaceousremains on
beddingsurfaces
WU 32348 8.4 601 5.13 3 157 154 2.2 7 <1 3 <1 2.3
WF2018 0 2 2 Soil Quaternary Base of soil at 2m
Black 32513 8.6 481 0.02 42 0.6 -41 4.7 84 <1 37 6 2.3
WF2018 3 5 2 Clay Tertiary Top of Tertiarybasalt at 5 m
Brown Weathered 32514 8.9 468 0.01 80 0.3 -79 3.2 121 <1 30 5 4.0
WF2018 6 17 11 Basalt Tertiary Base of Tertiarybasalt at 16.5 m
Yellow-red-brown
Slightly tomoderatelyweathered
Minor calciteveins
32515 8.7 233 0.01 80 0.3 -79 1.6 95 <1 32 2 3.0
WF2018 18 41 23 Claystone/Sandstone
Tertiary Top of watertable at 39 m.
Base of Tertiaryunconsolidatedsediments at 41
m
White, Brown-grey
Moderatelyweathered
Limestonebetween 16.5
and 18 m(weathered)
32516 8.7 109 0.77 15 23.7 9 7.1 4 <1 1 <1 4.0
WF2018 42 50 8 Claystone/Sandstone
Permian Grey/ Brownish-grey
Slightlyweathered
32517 8.4 111 0.11 8 3.3 -4 7.2 4 <1 3 <1 1.3
WF2018 51 52 1 Conglomerate Permian Light reddish-brown, white
Slightlyweathered
32518 8.4 88 0.06 3 1.8 -1 13.9 2 <1 1 <1 2.0
WF2018 53 62 9 Siltstone/Shale
Permian Medium to darkgrey
Slightlyweathered
Carbonaceous 32519 8.5 231 0.13 3 3.9 1 8.1 4 <1 4 <1 1.0
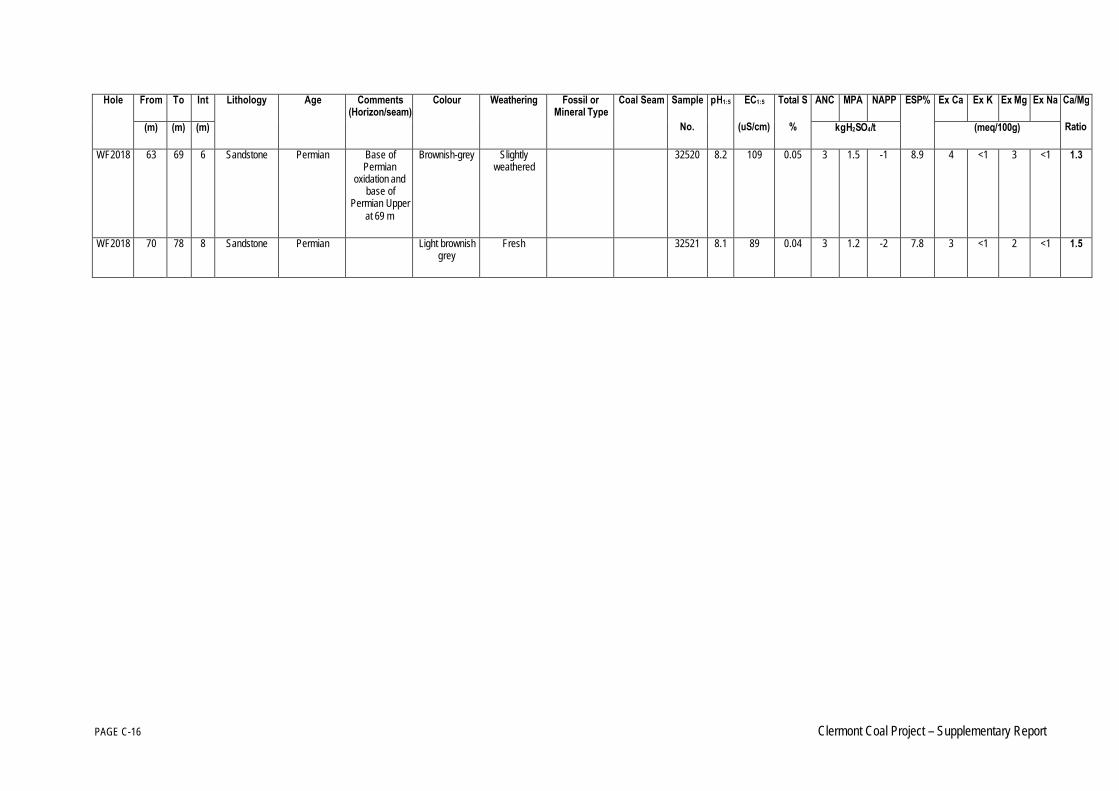
PAGE C-16 Clermont Coal Project – Supplementary Report
From To Int ANC MPA NAPP Ex Ca Ex K Ex Mg Ex NaHole
(m) (m) (m)
Lithology Age Comments(Horizon/seam)
Colour Weathering Fossil orMineral Type
Coal Seam Sample
No.
pH1:5 EC1:5
(uS/cm)
Total S
% kgH2SO4/t
ESP%
(meq/100g)
Ca/Mg
Ratio
WF2018 63 69 6 Sandstone Permian Base ofPermian
oxidation andbase of
Permian Upperat 69 m
Brownish-grey Slightlyweathered
32520 8.2 109 0.05 3 1.5 -1 8.9 4 <1 3 <1 1.3
WF2018 70 78 8 Sandstone Permian Light brownishgrey
Fresh 32521 8.1 89 0.04 3 1.2 -2 7.8 3 <1 2 <1 1.5

Clermont Coal Mine Project – Supplementary Report PAGE D-1
Appendix D Revised Figures
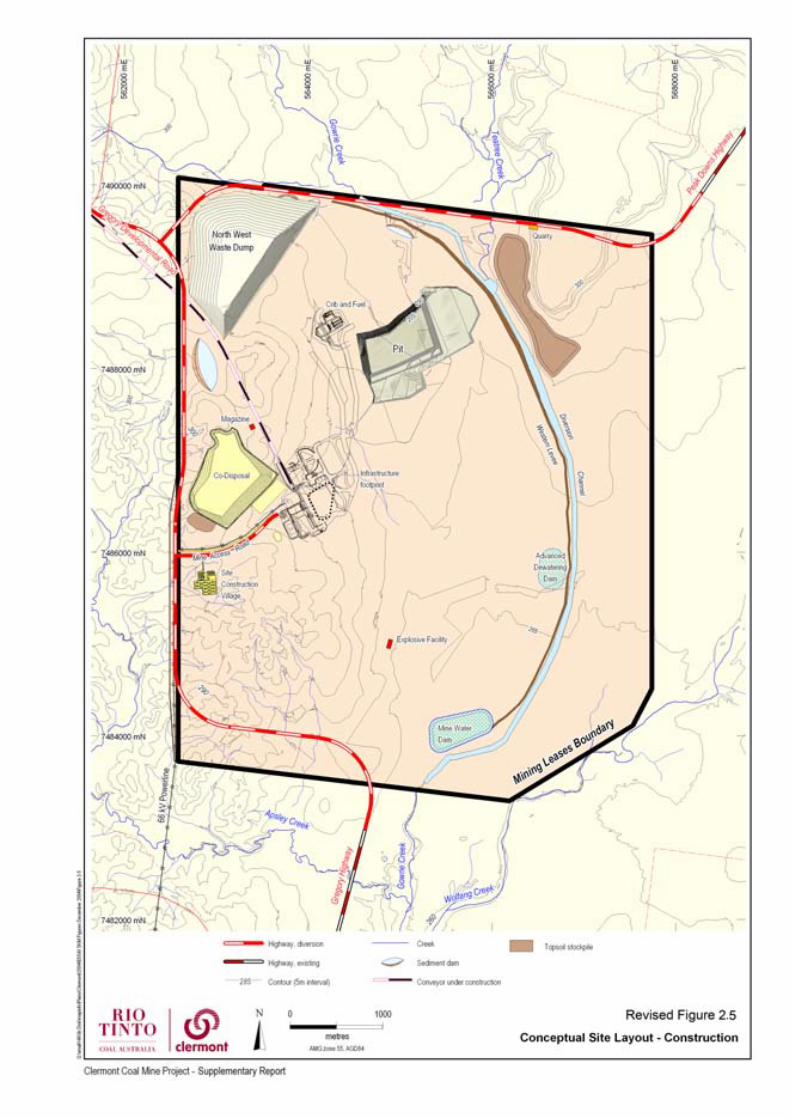
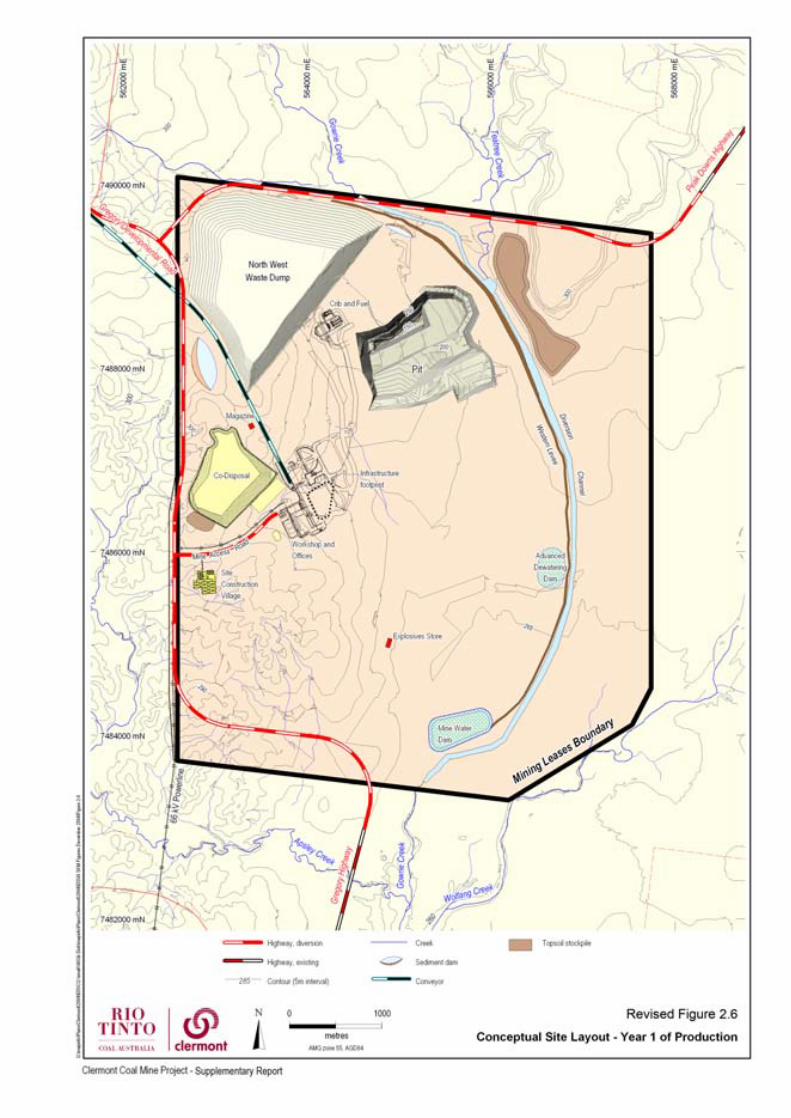
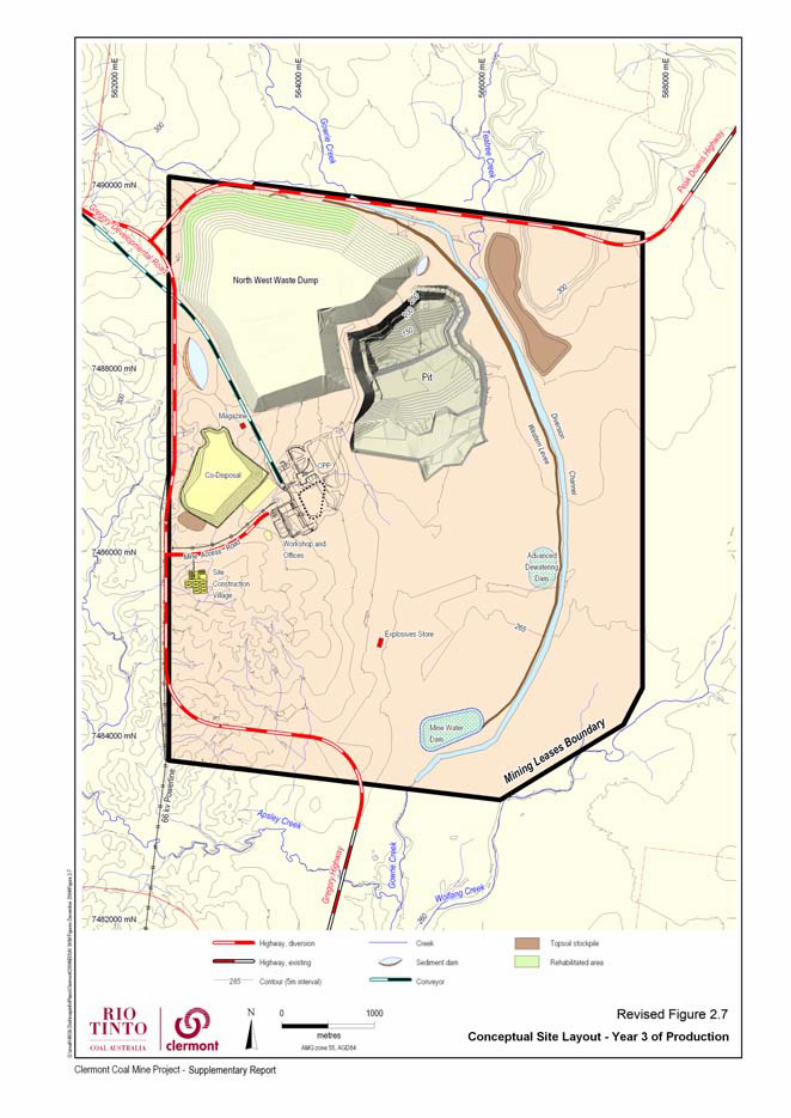
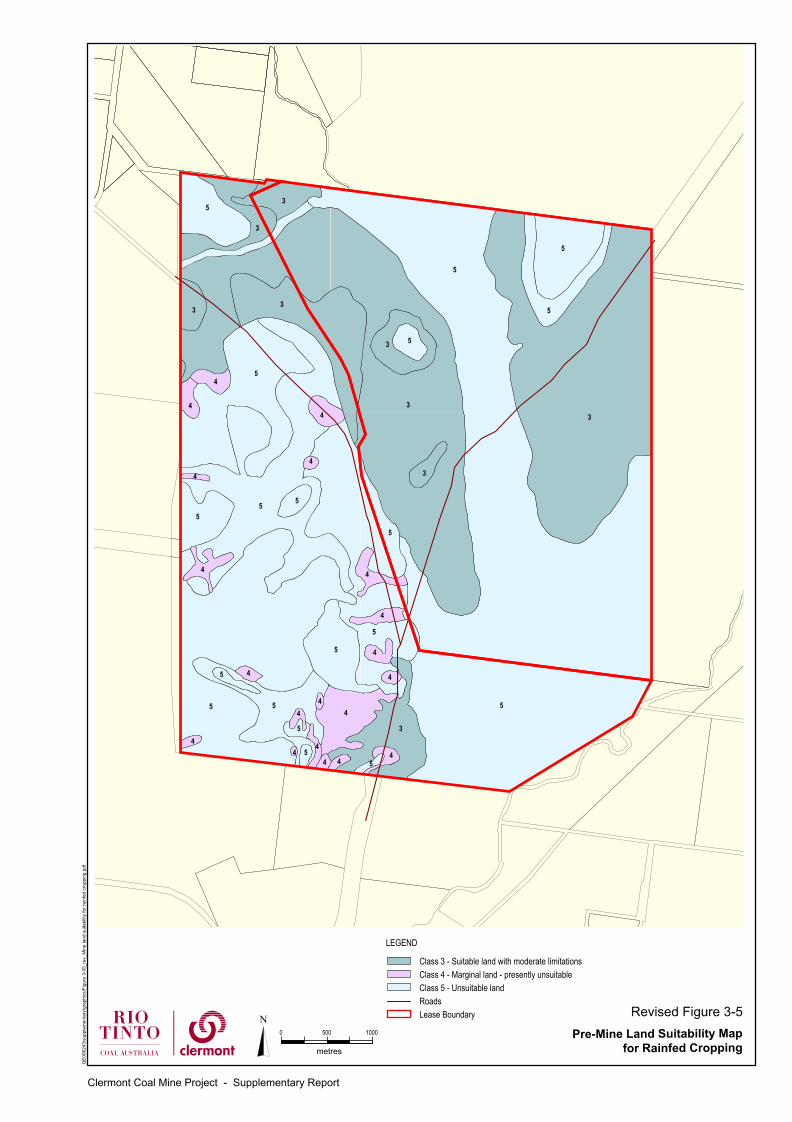
4
4
3
3
3
3
3
33
3
3
5
5
5
5
5
5
5
5
5
5
5
5
5
5
5
5
5
5
4
4
4
4 4
4
4
4
4
44
44
4
4
4
44
5
NPre-Mine Land Suitability Map
for Rainfed Cropping
Revised Figure 3-5
QE0
0624
3/su
pple
men
tary
/gra
phic
s/Fi
gure
3-0
5_re
v_M
ine
land
sui
tabi
lity
for r
ainf
ed c
ropp
ing.
10005000
metres
Class 3 - Suitable land with moderate limitationsClass 4 - Marginal land - presently unsuitableClass 5 - Unsuitable landRoadsLease Boundary
LEGEND
Clermont Coal Mine Project - Supplementary Report
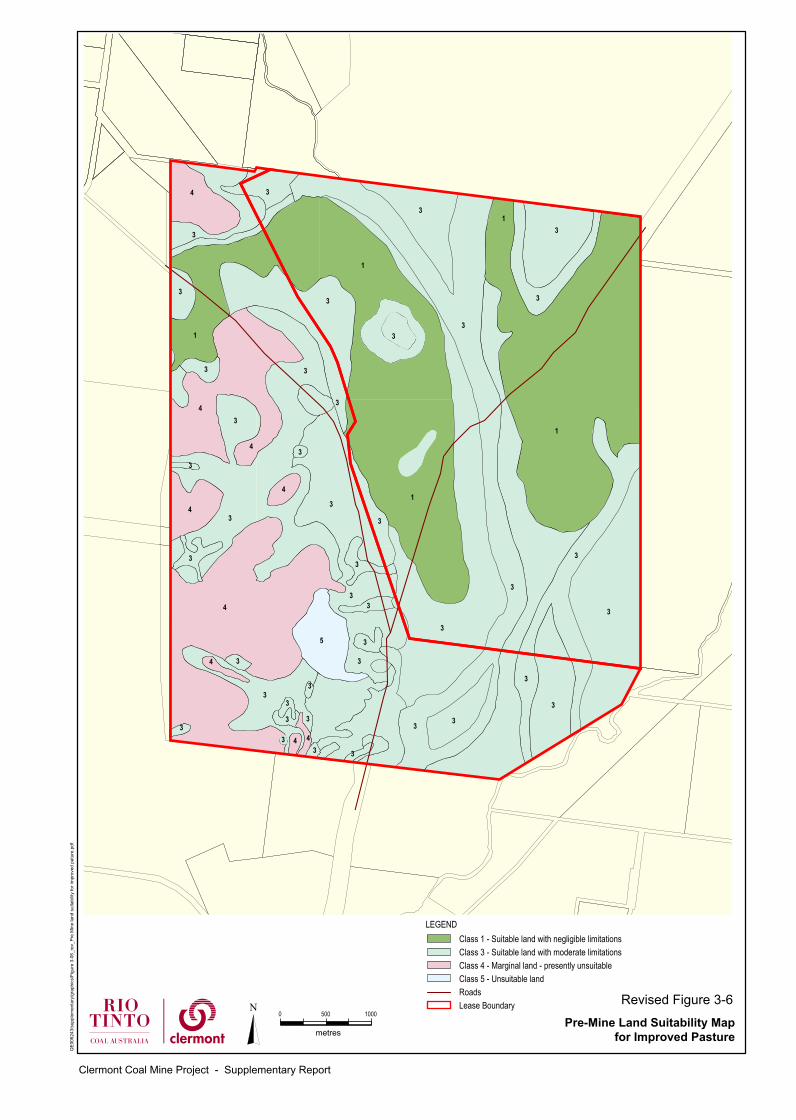
4
4
4
3
3
3
3
3
3
3
4
3
3
3
3
4
443
3
3
3
1
4
3
3
3
3
3
3
3
3
3 3
3
3
3
3
3
3
3
3
33
3
5
3
31
3
1
1
1
3
4
3
3
NPre-Mine Land Suitability Map
for Improved Pasture
Revised Figure 3-6
QE0
0624
3/su
pple
men
tary
/gra
phic
s/Fi
gure
3-0
6_re
v_Pr
e M
ine
land
sui
tabi
lity
for i
mpr
oved
pat
ure.
Class 1 - Suitable land with negligible limitationsClass 3 - Suitable land with moderate limitationsClass 4 - Marginal land - presently unsuitableClass 5 - Unsuitable landRoadsLease Boundary
LEGEND
10005000
metres
Clermont Coal Mine Project - Supplementary Report
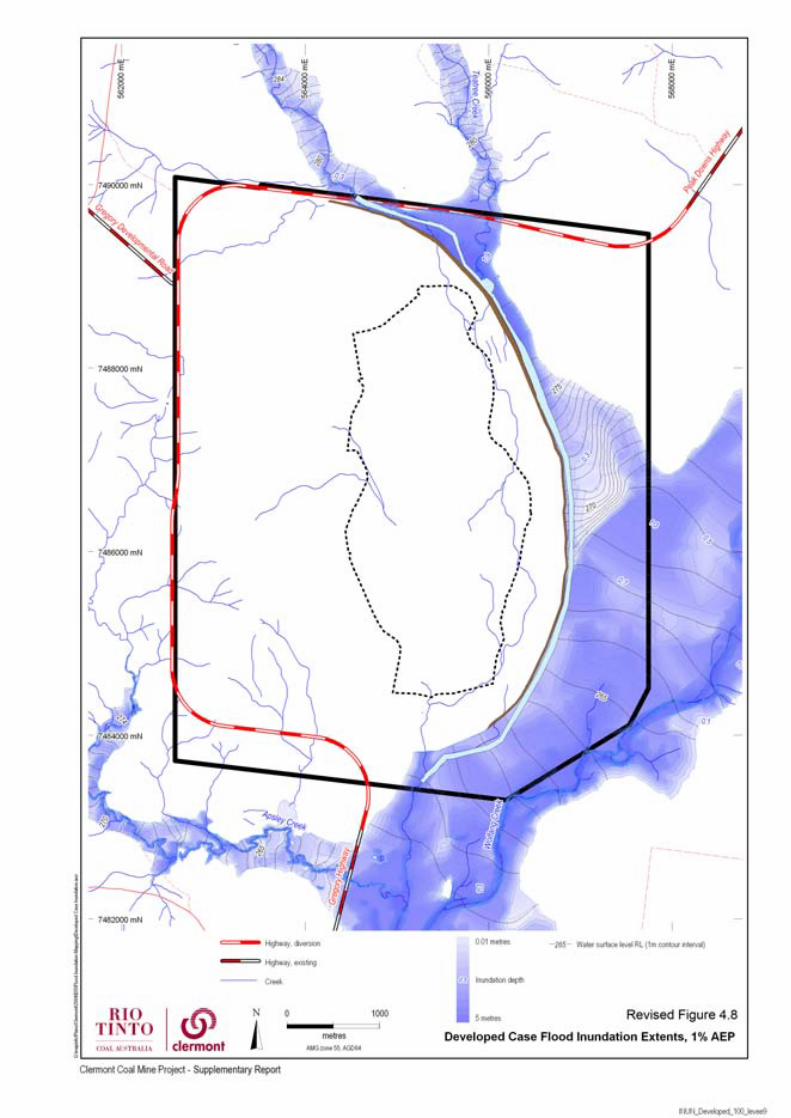
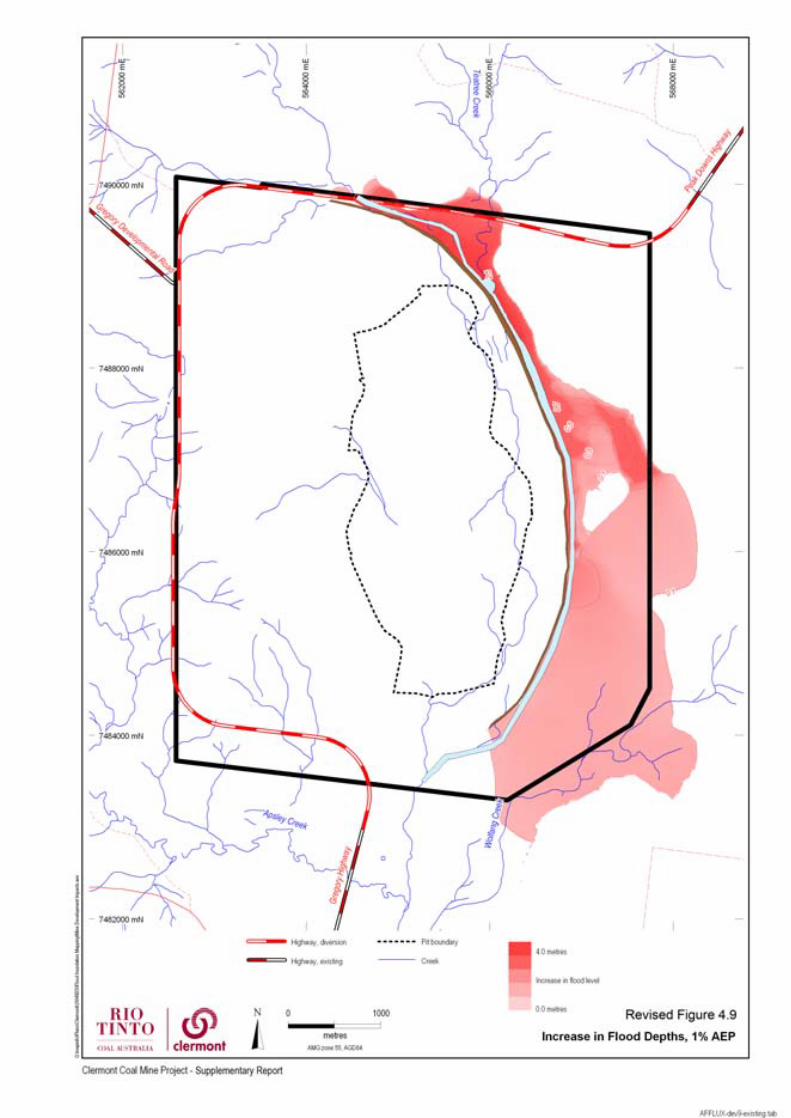
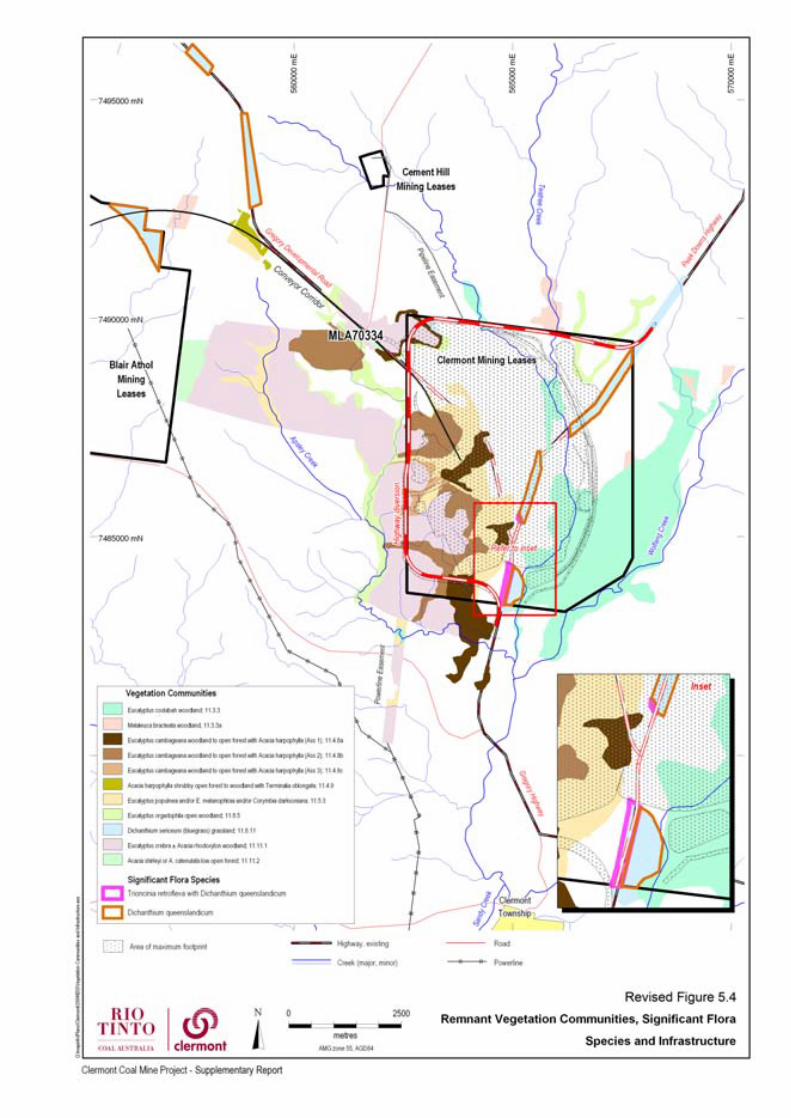
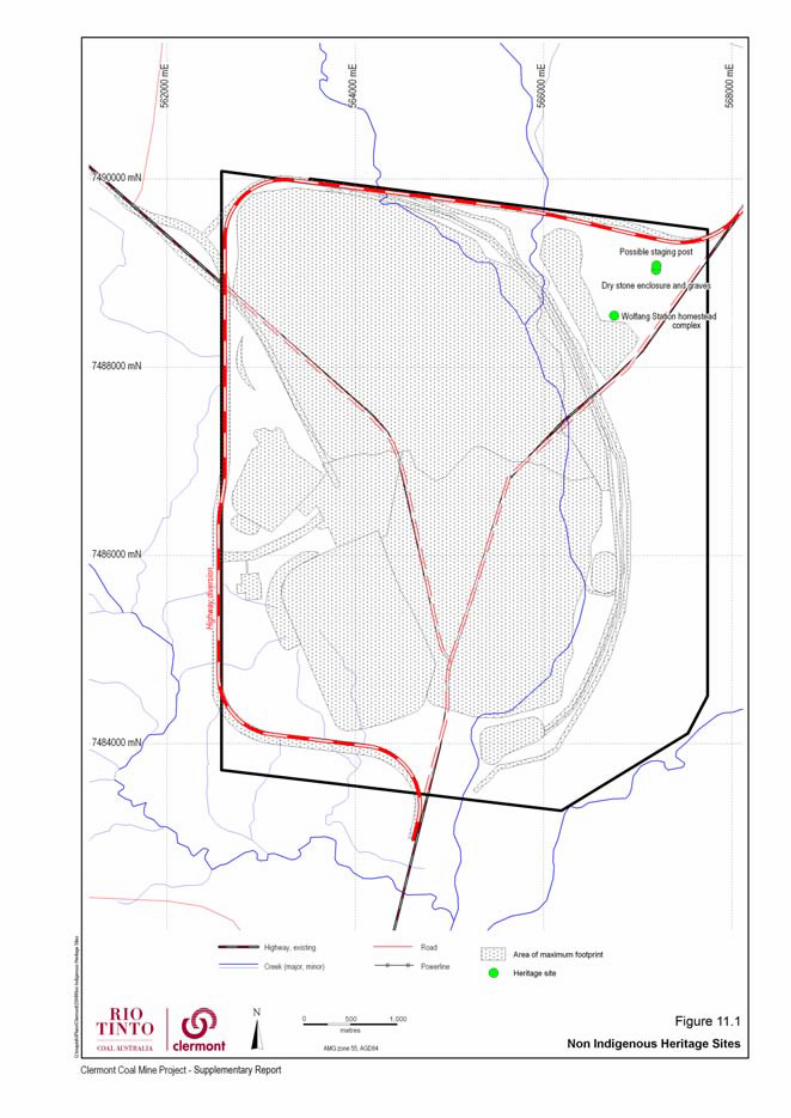

Clermont Coal Mine Project – Supplementary Report
Appendix E Final Dump Landform
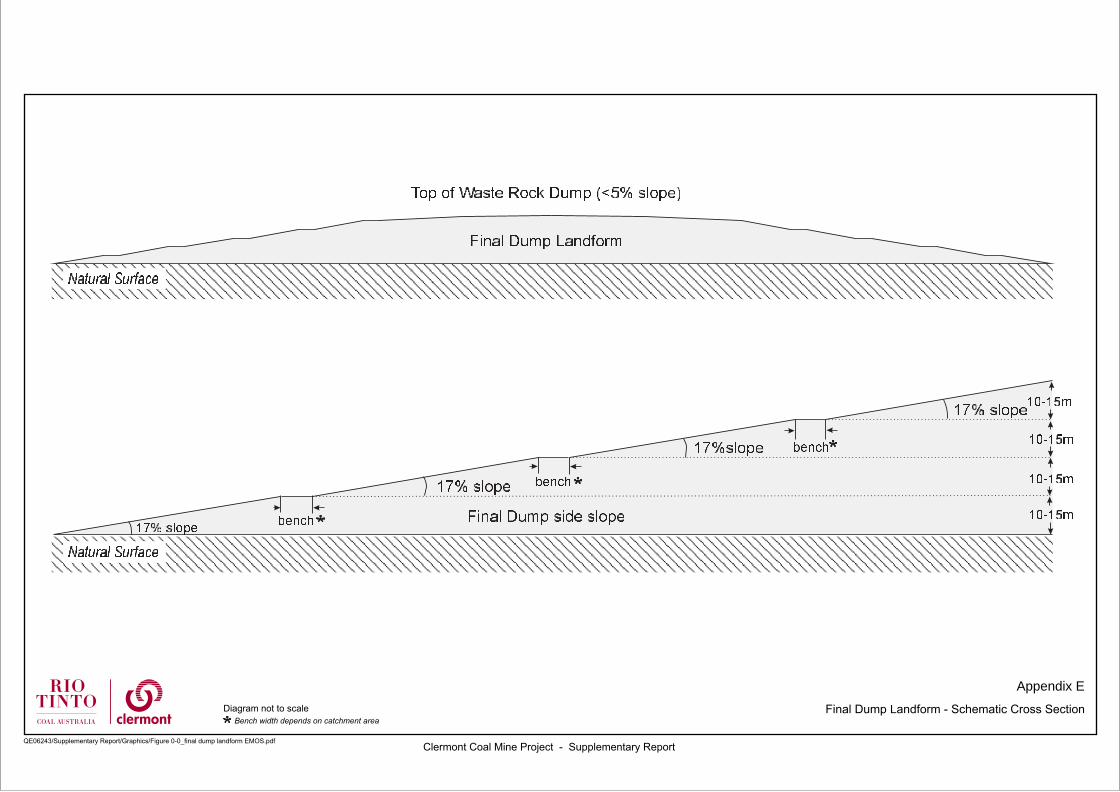
Appendix E
Final Dump Landform - Schematic Cross Section
Clermont Coal Mine Project - Supplementary ReportQE06243/Supplementary Report/Graphics/Figure 0-0_final dump landform EMOS.pdf
Diagram not to scale Bench width depends on catchment area

Appendix F Final Void
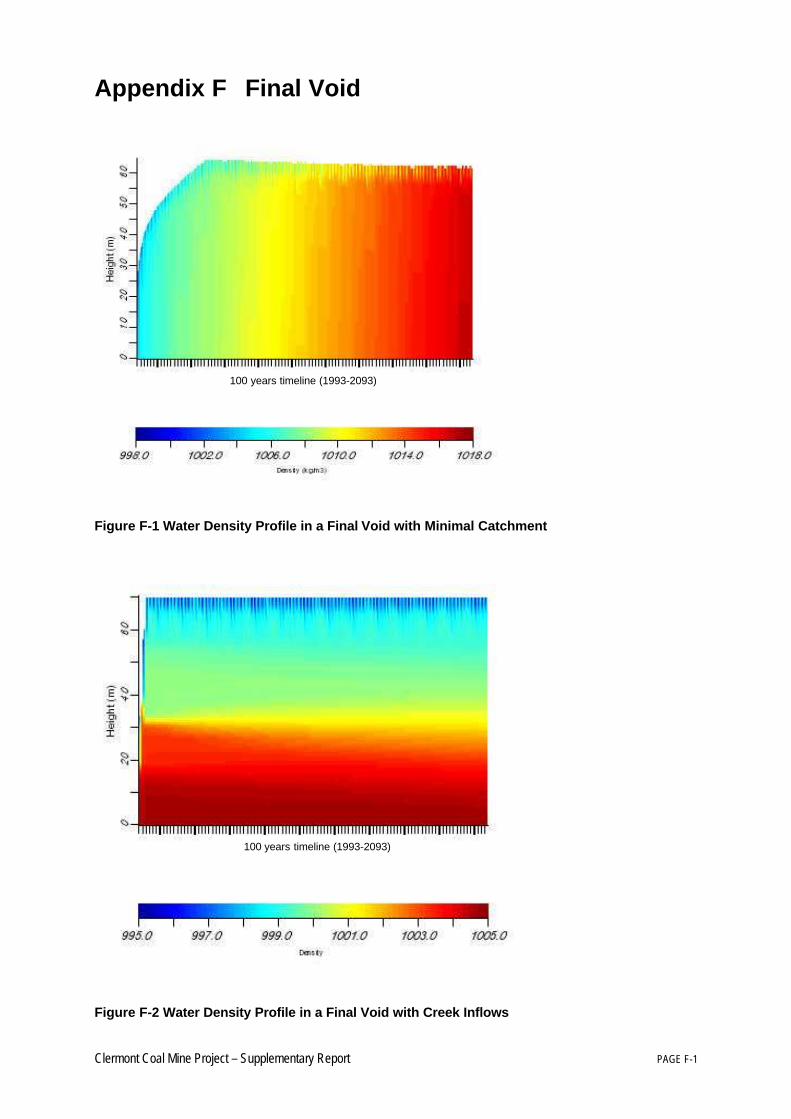
Clermont Coal Mine Project – Supplementary Report PAGE F-1
Appendix F Final Void
100 years timeline (1993-2093)
Figure F-1 Water Density Profile in a Final Void with Minimal Catchment
100 years timeline (1993-2093)
Figure F-2 Water Density Profile in a Final Void with Creek Inflows

Appendix G Revised Traffic Volumes
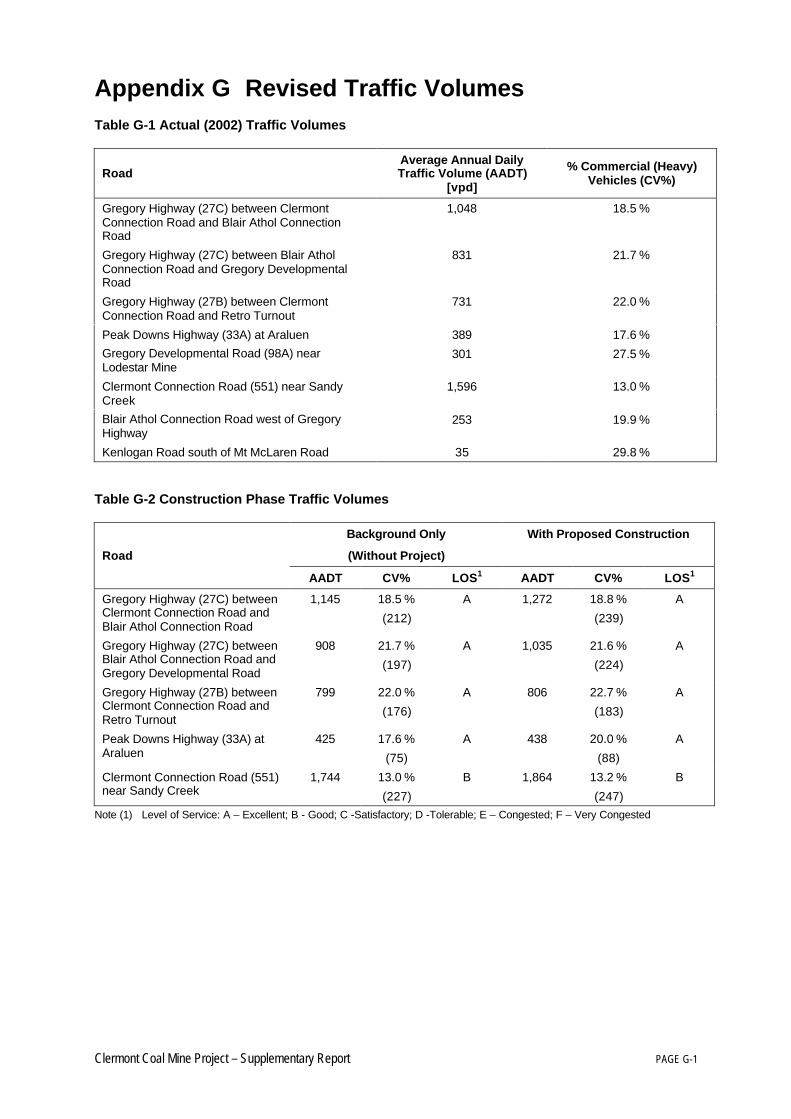
Clermont Coal Mine Project – Supplementary Report PAGE G-1
Appendix G Revised Traffic VolumesTable G-1 Actual (2002) Traffic Volumes
RoadAverage Annual DailyTraffic Volume (AADT)
[vpd]
% Commercial (Heavy)Vehicles (CV%)
Gregory Highway (27C) between ClermontConnection Road and Blair Athol ConnectionRoad
1,048 18.5 %
Gregory Highway (27C) between Blair AtholConnection Road and Gregory DevelopmentalRoad
831 21.7 %
Gregory Highway (27B) between ClermontConnection Road and Retro Turnout
731 22.0 %
Peak Downs Highway (33A) at Araluen 389 17.6 %
Gregory Developmental Road (98A) nearLodestar Mine
301 27.5 %
Clermont Connection Road (551) near SandyCreek
1,596 13.0 %
Blair Athol Connection Road west of GregoryHighway
253 19.9 %
Kenlogan Road south of Mt McLaren Road 35 29.8 %
Table G-2 Construction Phase Traffic Volumes
Background Only
(Without Project)
With Proposed Construction
Road
AADT CV% LOS1 AADT CV% LOS1
Gregory Highway (27C) betweenClermont Connection Road andBlair Athol Connection Road
1,145 18.5 %
(212)
A 1,272 18.8 %
(239)
A
Gregory Highway (27C) betweenBlair Athol Connection Road andGregory Developmental Road
908 21.7 %
(197)
A 1,035 21.6 %
(224)
A
Gregory Highway (27B) betweenClermont Connection Road andRetro Turnout
799 22.0 %
(176)
A 806 22.7 %
(183)
A
Peak Downs Highway (33A) atAraluen
425 17.6 %
(75)
A 438 20.0 %
(88)
A
Clermont Connection Road (551)near Sandy Creek
1,744 13.0 %
(227)
B 1,864 13.2 %
(247)
B
Note (1) Level of Service: A – Excellent; B - Good; C -Satisfactory; D -Tolerable; E – Congested; F – Very Congested
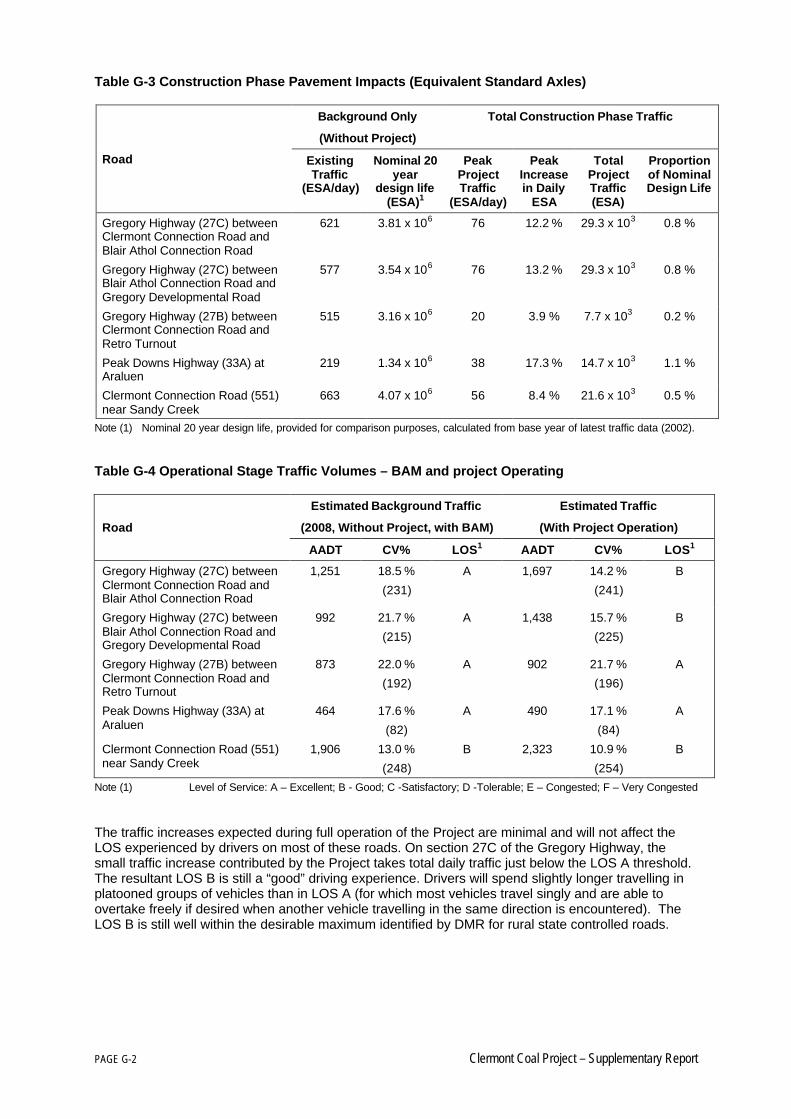
PAGE G-2 Clermont Coal Project – Supplementary Report
Table G-3 Construction Phase Pavement Impacts (Equivalent Standard Axles)
Background Only
(Without Project)
Total Construction Phase Traffic
Road ExistingTraffic
(ESA/day)
Nominal 20year
design life(ESA)1
PeakProjectTraffic
(ESA/day)
PeakIncreasein Daily
ESA
TotalProjectTraffic(ESA)
Proportionof NominalDesign Life
Gregory Highway (27C) betweenClermont Connection Road andBlair Athol Connection Road
621 3.81 x 10⁶ 76 12.2 % 29.3 x 10³ 0.8 %
Gregory Highway (27C) betweenBlair Athol Connection Road andGregory Developmental Road
577 3.54 x 10⁶ 76 13.2 % 29.3 x 10³ 0.8 %
Gregory Highway (27B) betweenClermont Connection Road andRetro Turnout
515 3.16 x 10⁶ 20 3.9 % 7.7 x 10³ 0.2 %
Peak Downs Highway (33A) atAraluen
219 1.34 x 10⁶ 38 17.3 % 14.7 x 10³ 1.1 %
Clermont Connection Road (551)near Sandy Creek
663 4.07 x 10⁶ 56 8.4 % 21.6 x 10³ 0.5 %
Note (1) Nominal 20 year design life, provided for comparison purposes, calculated from base year of latest traffic data (2002).
Table G-4 Operational Stage Traffic Volumes – BAM and project Operating
Estimated Background Traffic
(2008, Without Project, with BAM)
Estimated Traffic
(With Project Operation)Road
AADT CV% LOS1 AADT CV% LOS1
Gregory Highway (27C) betweenClermont Connection Road andBlair Athol Connection Road
1,251 18.5 %
(231)
A 1,697 14.2 %
(241)
B
Gregory Highway (27C) betweenBlair Athol Connection Road andGregory Developmental Road
992 21.7 %
(215)
A 1,438 15.7 %
(225)
B
Gregory Highway (27B) betweenClermont Connection Road andRetro Turnout
873 22.0 %
(192)
A 902 21.7 %
(196)
A
Peak Downs Highway (33A) atAraluen
464 17.6 %
(82)
A 490 17.1 %
(84)
A
Clermont Connection Road (551)near Sandy Creek
1,906 13.0 %
(248)
B 2,323 10.9 %
(254)
B
Note (1) Level of Service: A – Excellent; B - Good; C -Satisfactory; D -Tolerable; E – Congested; F – Very Congested
The traffic increases expected during full operation of the Project are minimal and will not affect theLOS experienced by drivers on most of these roads. On section 27C of the Gregory Highway, thesmall traffic increase contributed by the Project takes total daily traffic just below the LOS A threshold.The resultant LOS B is still a “good” driving experience. Drivers will spend slightly longer travelling inplatooned groups of vehicles than in LOS A (for which most vehicles travel singly and are able toovertake freely if desired when another vehicle travelling in the same direction is encountered). TheLOS B is still well within the desirable maximum identified by DMR for rural state controlled roads.
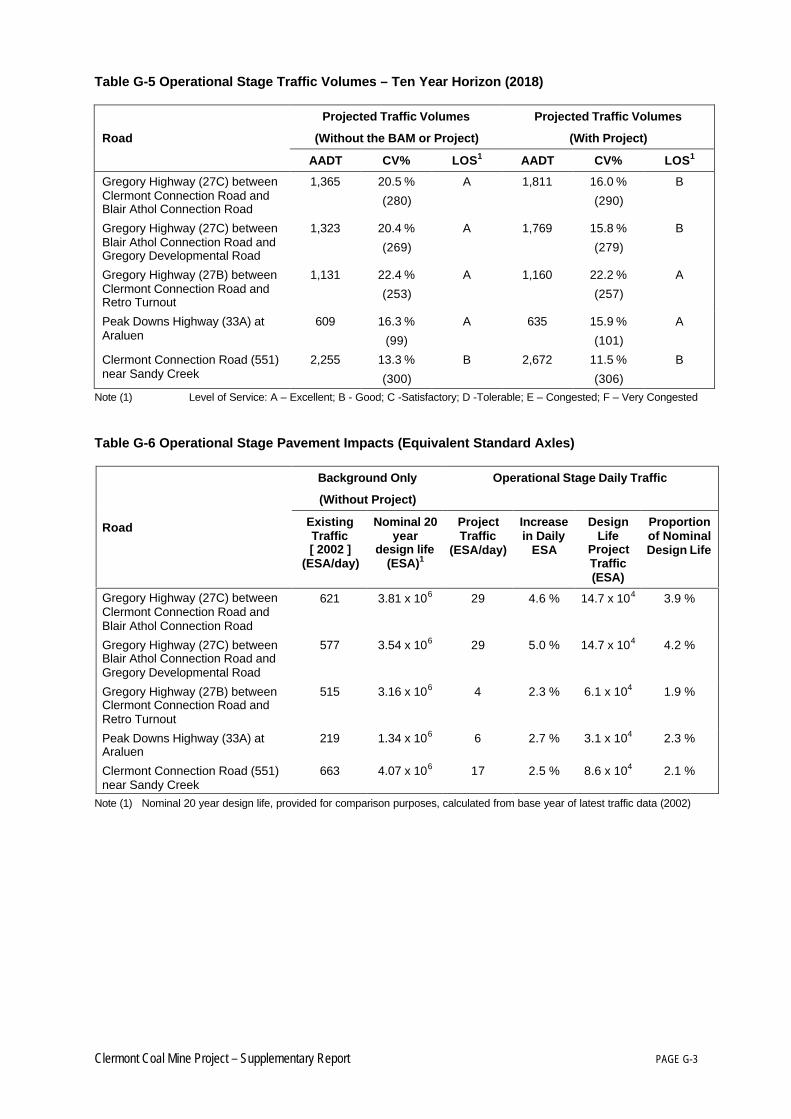
Clermont Coal Mine Project – Supplementary Report PAGE G-3
Table G-5 Operational Stage Traffic Volumes – Ten Year Horizon (2018)
Projected Traffic Volumes
(Without the BAM or Project)
Projected Traffic Volumes
(With Project)Road
AADT CV% LOS1 AADT CV% LOS1
Gregory Highway (27C) betweenClermont Connection Road andBlair Athol Connection Road
1,365 20.5 %
(280)
A 1,811 16.0 %
(290)
B
Gregory Highway (27C) betweenBlair Athol Connection Road andGregory Developmental Road
1,323 20.4 %
(269)
A 1,769 15.8 %
(279)
B
Gregory Highway (27B) betweenClermont Connection Road andRetro Turnout
1,131 22.4 %
(253)
A 1,160 22.2 %
(257)
A
Peak Downs Highway (33A) atAraluen
609 16.3 %
(99)
A 635 15.9 %
(101)
A
Clermont Connection Road (551)near Sandy Creek
2,255 13.3 %
(300)
B 2,672 11.5 %
(306)
B
Note (1) Level of Service: A – Excellent; B - Good; C -Satisfactory; D -Tolerable; E – Congested; F – Very Congested
Table G-6 Operational Stage Pavement Impacts (Equivalent Standard Axles)
Background Only
(Without Project)
Operational Stage Daily Traffic
Road ExistingTraffic[ 2002 ]
(ESA/day)
Nominal 20year
design life(ESA)1
ProjectTraffic
(ESA/day)
Increasein Daily
ESA
DesignLife
ProjectTraffic(ESA)
Proportionof NominalDesign Life
Gregory Highway (27C) betweenClermont Connection Road andBlair Athol Connection Road
621 3.81 x 10⁶ 29 4.6 % 14.7 x 10⁴ 3.9 %
Gregory Highway (27C) betweenBlair Athol Connection Road andGregory Developmental Road
577 3.54 x 10⁶ 29 5.0 % 14.7 x 10⁴ 4.2 %
Gregory Highway (27B) betweenClermont Connection Road andRetro Turnout
515 3.16 x 10⁶ 4 2.3 % 6.1 x 10⁴ 1.9 %
Peak Downs Highway (33A) atAraluen
219 1.34 x 10⁶ 6 2.7 % 3.1 x 10⁴ 2.3 %
Clermont Connection Road (551)near Sandy Creek
663 4.07 x 10⁶ 17 2.5 % 8.6 x 10⁴ 2.1 %
Note (1) Nominal 20 year design life, provided for comparison purposes, calculated from base year of latest traffic data (2002)


Appendix H Project Commitments
Clermont Coal Mine Project – Supplementary Report PAGE H-1
Appendix H Project Commitments
General1. 1 The Project will operate in accordance with an Environmental Management System.1. 2 An Environmental Monitoring Manual (EMM) will be developed as part of the Project
Environmental Management System. The EMM will outline the Project’s environmentalmonitoring program (including monitoring sites, parameters and their frequency ofmeasurement and make reference to monitoring procedures and records).
1. 3 Annual Returns will be prepared as required under the Environmental Protection Act 1994.1. 4 A Register of Environmental Incidents will be maintained. Incidents that may potentially
compromise compliance with the conditions of the Environmental Authority will be reportedimmediately to operations management.
1. 5 Environmental monitoring will be implemented, including rehabilitation success, surface waterquality, groundwater quality and level, the stability of the Gowrie Creek diversion, aquaticecology, dust deposition and noise.
1. 6 The Proponent will obtain the necessary landholder consent for approvals associated with theProject.
1. 7 The Proponent will obtain all necessary approvals required for the diversion of Gowrie Creek.1. 8 The Proponent will obtain all necessary approvals required for the construction and operation
of the overland coal conveyor.1. 9 The Proponent will ensure all relevant registrations and licences under the Food Act 1981 are
obtained by the provider of food services within the construction village.
Section 2 – Project Description2. 1 In relation to the overland coal conveyor, The Proponent will make necessary arrangements
with Queensland Rail for the staging and timing of construction, interruptions to other railinfrastructure and any other matters that are relevant to the Proponent and QR.
Section 3 – Land Resources3. 1 The Proponent commits to developing processes whereby matters surrounding the question of
Native Title can be effectively negotiated. It is accepted that some resources will need to beprovided by the Proponent to enable the relevant group to negotiate with the Proponent in anequitable fashion, and the proponent commits to providing such resources within reasonablelimits.
3. 2 Stable landforms will be established following mining, using soils capable of supportingvegetation communities adapted to the local environment. The disturbed land will berehabilitated to a condition that is self-sustaining, or to a condition where the maintenancerequirements are consistent with the post-mining land use.
3. 3 Progressive rehabilitation will occur, and the post-mine land use for areas disturbed by miningat the Project will be a self sustaining vegetation community using appropriate native tree,shrub and grass species based on site-specific trials.
3. 4 On-site field trials will be conducted with a range of native tree and shrub species and grassesto optimise regeneration on major soil types.
3. 5 On-site trials will be conducted to establish native bluegrass on former grazing and croppingland.
3. 6 Vegetation clearing will be restricted to that necessary for the works and vegetation will not beburnt without a permit.
3. 7 Topsoil will be salvaged from all disturbed areas, unless they are unsuitable for use in therehabilitation program.
3. 8 Topsoil stockpiles will be located away from drainage lines and the final surface will be rippedto promote natural vegetation.
PAGE H-2 Clermont Coal Project – Supplementary Report
3. 9 Soil types with significantly different properties will be stockpiled separately.
3. 10 Erosion and sediment control measures will be employed, consistent with the practicesdescribed in the 'Technical Guidelines for Environmental Management for Exploration andMining in Queensland'.
3. 11 In the management of topsoil, the Engineering Guidelines for Queensland for Soil Erosion andSediment Control (IEAust 1996) will be followed, where appropriate.
3. 12 Rehabilitated areas will be monitored to identify any areas in need of maintenance at an earlystage. Rehabilitated areas that have not reached a sufficient density of vegetation will bereseeded. Supplementary plantings or seeding may be used to increase species diversity.Maintenance work will be performed to repair any areas exhibiting excessive soil erosion.
3. 13 Rehabilitated areas will be monitored using the selected parameters and trends tracked todemonstrate progress towards achievement of a self-sustaining vegetation community.
3. 14 Trials will be conducted to vary the slope angle used on final landforms. The use ofcompetent waste rock and soil will be trailed on slopes steeper than 17%.
3. 15 Additional sampling and analyses will be carried out before mining commences to allowdevelopment of an ARD block model of geochemical rock types. The outcomes from thismodel will inform the detailed waste placement strategies in the Plan of Operations.
3. 16 A Waste Rock Management Plan will be developed which aims to minimise ARD processes.This plan will provide for the on-going analysis and identification of waste to ensure theirappropriate placement.
3. 17 The management of any potentially acid forming (PAF) materials will be achieved by theselective placement and burial of PAF waste rock and the construction of an earth materialcover over the final Coal Washery Waste Disposal Area.
3. 18 Once run-of-mine waste materials are available, investigations of appropriate waste rockdump design and optimal depth of burial of PAF waste rock will be undertaken.
3. 19 Once run-of-mine waste materials and coal washery waste are available, investigations ofcover strategies to minimise the release of oxidation products in leachate, and salt rise into thegrowth horizon, will be undertaken.
3. 20 While the design of final covers is being finalised, the Proponent will operate under thefollowing interim controls:
§ no placement of PAF materials within 10m vertically and horizontally of final waste rockdump surfaces;
§ no placement of PAF-LC materials within 10m vertically or horizontally of final waste rockdump surfaces unless blended with NAF material containing excess ANC (neutralisingcapacity > 10 kg H2SO4/t);
§ treatment of PAF and PAF-LC materials on dump surfaces with limestone to inhibitoxidisation where necessary; and
§ selective placement of PAF material such that any runoff reports to the pit or to acontainment dam (separated from the sediment dam control system).
3. 21 On the completion of mining, infrastructure will be treated as follows:
§ mine roads will be left behind for use as farm roads (or rehabilitated);§ water dams and levee banks will remain if required by the subsequent landowner and
approved by regulators; otherwise, they will be breached;§ buildings, plant and equipment will be removed and the surface rehabilitated. This will
include the CPP, workshop, offices, storage tanks and coal handling facilities; and§ concrete pads will be covered with benign waste rock, topsoiled and revegetated.
Clermont Coal Mine Project – Supplementary Report PAGE H-3
3. 22 A contaminated site assessment will be carried out prior to surrender of the mining lease, andreported as part of the Final Rehabilitation Report.
3. 23 A bund and fence will be constructed around the crest of the pit to prevent access to the finalvoid remaining at the end of the mine life.
Section 4 – Water Resources4. 1 The Project will have a site water management system comprised of a series of storages and
sediment dams. Stored water will be preferentially reused in the CPP or for dust suppression.Design of all storages and dams will be in accordance to the design criteria specified for thisproject to mitigate the potentially adverse environmental impacts identified in the EIS.
4. 2 Routine monitoring of key water storages within the Project site will be undertaken to provideinformation on the operation of the mine water management system. Locations andparameters to be monitored regularly are described in Table 4-21 of the EIS.
4. 3 The impacts of the mining operation on downstream water quality will be minimised by:
§ releasing from the Mine Water Dam only during times of flow in Wolfang or GowrieCreeks;
§ releasing from the Mine Water Dam only if the resultant EC in Wolfang Creek does notexceed 1 800 µS/cm, and the resultant pH in Wolfang Creek is maintained in the range6.0 – 8.5; and
§ ensuring all runoff from disturbed areas passes through sediment dams before enteringlocal creeks.
4. 4 During a release event from the Mine Water Dam, the quality of the release water and thequality of the receiving waters (Wolfang creek) will be monitored. The range of parametersshall be reviewed after four years.
4. 5 All water quality sampling will be undertaken in accordance with the Water Quality SamplingManual, Third edition (EPA, 1999). The frequency of monitoring and range of parametersanalysed during flow and routine monitoring as described in the EIS will be reviewed after thefirst two years of mine operation.
4. 6 Upon completion of the construction phase of the proposed diversion a quantitative monitoringand evaluation program will be put in place to ensure that the diversion is working as intended.The program will follow the principals and procedures outlined in the Australian CoalAssociation Research Program (ACARP) Project “Monitoring and Evaluation Program forBowen Basin River Diversions” (Project Number C9068). Specifically, a combination of pre-determined frequency and event based monitoring would be implemented.
4. 7 A program of adaptive waterway management (i.e. intervention management) within theGowrie Creek diversion would be undertaken. Adaptive waterway management will beundertaken as a result of a diversion monitoring program which will be part of theenvironmental monitoring program for the site.
4. 8 The Proponent will develop a program of monitoring of the diversion levees associated withGowrie Creek, to ensure their integrity and their ongoing operation as designed.
4. 9 The Proponent will model the final void water quality once kinetic testwork is complete andwater quality data are available from the mine pit.
4. 10 The Proponent will undertake further hydrogeological evaluations to assess the potentialavailability of alternative groundwater supplies that would be unaffected by the minedewatering program. Based on the results of these assessments and discussions with relevantlandholders, options to ensure access to adequate alternative water supplies will bedeveloped and discussed with the affected parties.
PAGE H-4 Clermont Coal Project – Supplementary Report
4. 11 The Proponent will continue discussions with landholders affected by groundwater draw-down,with a view to reaching mutually agreeable arrangements for the provision of alternativesupplies throughout the mine life, and after mine closure.
4. 12 The Proponent will cover costs associated with changes to landholder extraction ofgroundwater from bores on affected land. This will include (where necessary) the deepeningand/or replacement of existing bores; and/or replacement of pumps; and/or other alternativesif the dewatering process renders existing bores inefficient. Proposed changes will be agreedwith individual landholders.
4. 13 A groundwater monitoring program will be undertaken during the operation of the dewateringborefield and during the operational phase of the Project. Groundwater level fluctuation andwater chemistry monitoring will be undertaken of groundwater bores within major aquiferssurrounding the Mining Leases. Monitoring results (water level and chemistry) will be enteredinto the existing RTCA groundwater database which will be regularly updated.
4. 14 The Proponent will conduct a stygofauna survey to establish if stygofauna are present withinthe Project area and if so, the range of taxa present. This survey is planned to occur once theregional monitoring bore network is installed. Selected bores both within and outside theanticipated zone of groundwater drawdown will be sampled.
4. 15 Prior to relinquishment of the mining leases, the Proponent will undertake predictivegroundwater modelling to accurately predict the long term behaviour of the aquifer.
Section 5 – Nature Conservation5. 1 The Proponent will implement off-set strategies for the unavoidable loss of 44 ha of the
bluegrass community by compensatory establishment of 44 ha of bluegrass on in-situ blacksoil in the north-east of ML 1884.
5. 2 Areas to be cleared will have boundaries clearly marked by tape, pegs or other means, meansand will conform to the limits of design drawings. Particular attention will be paid to definingthe boundaries of clearing where endangered and of concern regional ecosystems arepresent.
5. 3 Key dominant and understorey species from RE 11.3.3, RE 11.4.8, RE 11.5.3 and RE 11.11.1will be included in the rehabilitation seed mix for areas where suitable soil types have beenreplaced. The revegetation success of these species will be monitored and the seed mixmodified if required to remove unsuitable species.
5. 4 All vegetation clearance will be restricted to that necessary for the works.
5. 5 Small areas of Belyando cobblers pegs will be disturbed by the Project, however, theProponent is committed to managing the remaining community for long-term survival. TheProponent will fence off remaining communities of Belyando cobblers pegs to exclude stock,machinery and people.
5. 6 The Proponent will obtain all necessary approvals for the disturbance to Belyando cobblerspegs.
5. 7 Rehabilitation strategies for the flood plain of the Gowrie Creek diversion will include theestablishment of Coolibah open woodland with a grassy understorey.
5. 8 The Proponent will consider strategies such as a nature conservation agreement or landcovenant for the long-term protection and management of the proposed bluegrass off-setplanted areas before the remnant community is disturbed.
5. 9 A Weed Management Plan will be prepared for the Project. It will be consistent with theBelyando Shire Weed Management Strategy. The Weed Management Plan will includeprovision for the installation of wash down points for vehicles and plant used on the Projectduring the construction phase of the mine.

Clermont Coal Mine Project – Supplementary Report PAGE H-5
5. 10 Once development of the Project commences, a routine ecological monitoring program wouldbe undertaken. To ensure consistency with baseline data collected for the EIS, monitoringwould be scheduled to follow significant regional rainfall (ideally in the early part of the ‘wetseason’). Monitoring would comprise habitat assessment, water quality monitoring, and thecomponents of biological monitoring used to establish the baseline data set for the EIS.Annual monitoring during the operational life of the mine, and for a period of three years postcessation of groundwater discharge is considered appropriate. Frequency of monitoring maybe reduced if there is little change between years.
5. 11 Monitoring of the four plots established for the riparian vegetation assessment for the EIS willbe undertaken. Monitoring will include assessment against baseline floristics and structuralinformation to determine whether the abundance of weeds are increasing downstream of theProject or whether there is a major change to riparian communities downstream of the Project.
5. 12 Monitoring for weed species at random locations above and below the Project will beundertaken to ascertain whether new weed species are spreading downstream of theproposed low-flow discharge point.
5. 13 If monitoring of aquatic biota identifies significant changes downstream of the Project, theProponent is committed to investigating appropriate mitigation measures.
Section 6 – Air Quality6. 1 Dust control measures will be implemented through best management practice and as far as it
is practicable to reduce dust impact and nuisance in the engineering design and during theconstruction and operation of the mine
6. 2 Dust deposition monitoring will be carried out at Araluen, Crillee, the Airport and Glenmoreresidences for five years, following the commencement of construction, to confirm themodelling prediction that operations shall not result in a significant increase in dust levels.
6. 3 Any dust complaint will be investigated expeditiously and the complainant will be respondedto.
6. 4 The Proponent will maintain an inventory of greenhouse gas emissions for the Project onceconstruction starts; publicly report greenhouse emissions and progress on greenhousemitigation measures; and maintain membership of the Commonwealth GovernmentGreenhouse Challenge Program.
Section 7 – Noise and Vibration7. 1 Noise at the nearest residences shall not exceed 37 dB(A) under typical adverse night time
weather conditions.
7. 2 The following measures will be adopted where required to meet the noise criteria described inthe Environmental Authority, at the nearest sensitive receptors:
§ installation of 5m noise control berms adjacent to major haul roads;§ adoption of proper maintenance and operation procedures to minimise nuisance noise
emissions from equipment;§ provision of a cover over the conveyor and side barriers where necessary. The conveyor
is required to have weather resistant corrugated steel shielding for a distance of 1km onthe northern side and 3 km on the southern side centring on the Old Blair Atholhomestead; and
§ best management practices where reasonable and feasible to limit the amount of noiseemission and annoyance during the construction and operation of the mine.
7. 3 Noise monitoring will be conducted at least annually at Araluen, Homelea Downs, Glenmore,New Blair Athol and Old Blair Athol for the first five years of mining and thereafter if requestedby the residents. For Crillee, Fleurs and Clermont Airport, noise monitoring will be conductedin Year 7-11. Occupants will be informed of mine progress and any changes to mineoperations that have the potential to cause a significant change to noise emissions.

PAGE H-6 Clermont Coal Project – Supplementary Report
7. 4 Noise monitoring is required to assess noise generated by new equipment, or equipment,which has undergone major maintenance procedures.
7. 5 A site contact number will be provided to neighbours to allow a timely response to anycomplaint about nuisance noise. Complaints will be investigated to determine the source of thenuisance noise and, where appropriate, noise monitoring will be conducted at the affectedresidence. Should monitoring indicate that the noise level is persistently over 35 dB(A) and iscausing a continuing nuisance, Clermont Coal Mine shall seek to reach an agreement with theoccupier of the residence to provide noise reduction treatment of the dwelling to minimise thenuisance. Measurement and reporting of noise levels will be in accordance with the EPA’sNoise Measurement Manual.
7. 6 Airblast will be managed by environmental blast design and accurate implementation toachieve the 115 dBL limit at the nearby residences.
7. 7 A predictive airblast model will be calibrated based on field observation and used to determineblast specifications (such a stemming, hole spacing and charge factor) such that blasts aremanaged within Environmental Protection Regulation 1998 limits.
7. 8 Ground vibration due to blasting shall not exceed 10 mm/s at the nearest residences.
7. 9 Blasting will be restricted to daylight hours and measurement and reporting of blast noise andvibration at the mine will comply with the EPA Guideline ‘Noise and Vibration from Blasting’.
Section 8 – Cultural Heritage8. 1 The Proponent will implement the Cultural Heritage Management Plan (CHMP) and meet duty
of care standards set by the Aboriginal Cultural Heritage Act 2003.
8. 2 The Proponent will engage with the endorsed Aboriginal parties to compile a comprehensiveschedule of the cultural heritage places and values of the study area, and then to negotiating astrategy to manage those places and values in a culturally appropriate fashion in the contextof the proposed development.
8. 3 In order to minimise the risk of accidental damage to cultural heritage features, the Proponentwill incorporate cultural heritage awareness into worker induction sessions and training; andimplement a procedure requiring a permit to be obtained from the relevant site person(s) priorto undertaking any clearing or excavations.
Section 9 – Scenic Values9. 1 Vegetation will be retained and progressive rehabilitation will occur to reduce visual impacts.
9. 2 The Proponent will retain/establish a buffer of vegetation between the North West WasteDump and the realigned section of the Peak Downs Highway and Gregory Highway.
9. 3 The Proponent will vegetate the Gowrie Creek diversion progressively to replace woodlandpresently acting as a mid-field screen for views from the east.
9. 4 The Proponent will consult with the occupiers of the Homelea Downs residence in order todetermine if the impact requires mitigation, and if so, discuss what form of mitigation isacceptable.
9. 5 The Proponent will locate night lights as required for safety and security, but ensure lights arefocussed on the areas required, with shields around the globes to limit extraneous light wherenecessary.
Section 10 – Waste Management10. 1 The Proponent will estimate and report Project emissions to the NPI annually once mining
commences.
Clermont Coal Mine Project – Supplementary Report PAGE H-7
10. 2 The Project will comply with the state waste management policies, the EP Act and associatedregulatory requirements as a minimum.
10. 3 The Project will manage wastes in accordance with the Waste Management Hierarchy listed inthe EPP (Waste Management).
10. 4 Separate skips will be provided to maintain waste segregation and maximise economic reuseand recycling, in preference to disposal to landfill.
10. 5 Transportation of wastes off-site will be by a licensed waste contractor.
10. 6 Any hazardous materials used on site will be recorded in a Hazardous Materials Register.
10. 7 A Waste Management Procedure will be developed and will include an approved wastetracking system for those wastes that require tracking.
10. 8 Spill response procedures will be developed for potentially hazardous waste materials.
10. 9 The project will require contractors to adopt best practise waste minimisation procedures.
10. 10 Sites that become contaminated will be investigated, managed and remediated in accordancewith the requirements of the contaminated land provisions of the Environmental Protection Act1994.
10. 11 Waste monitoring and auditing will be undertaken at the Project.
Section 11 – Traffic and Infrastructure11. 1 The new road sections and intersections will all be designed in accordance with the
appropriate safety and geometric standards to the satisfaction of Department of Main Roads.
11. 2 As required by Department of Main Roads, the effect of heavy vehicle traffic generated by thedevelopment on pavement life and maintenance needs will be assessed in detail inaccordance with the DMR (2000) Guidelines, and the Proponent will consult with DMR aboutmitigation of any effects identified.
11. 3 The single landholder affected by the conveyor has been fully consulted and suitable accessover the conveyor will be provided in two locations.
11. 4 RTCA has agreed with a DNRM request that:
§ the road reserve be widened from minimum 60m to minimum 90m width along westernboundary south from intersection with Peak Downs Highway;
§ the stock route be selectively cleared and stick-raked along the western boundary wherethe timber is quite thick and there is a lot of fallen timber;
§ additional fencing be provided so that stock move in a laneway separated from roadtraffic by a fence, and a post and rail fence (or stock yard fencing) be provided toseparate stock from road traffic where the stock will cross under the conveyor (the needand scope of these fences will be confirmed with the stock inspector once roadconstruction and conveyor overpass are complete); and
§ additional stock watering be provided (tank and trough or small dam in one of the gullies)at a point midway down western side.
11. 5 RTCA will continue to consult with DMR and DNRME and negotiate the approvals for therealignment of the Peak Downs Highway and the Gregory Highway and associated stockroutes. RTCA also proposes to work closely with the Belyando Shire Council throughout theProject to ensure that benefits to the Shire are maximised and potentially adverse impacts areminimised.
11. 6 A new school bus stop will be provided on the Peak Downs Highway near the GregoryDevelopmental Road intersection to replace the existing stop. The location and design of thebus stop will conform with the relevant geometric and safety standards.
PAGE H-8 Clermont Coal Project – Supplementary Report
11. 7 Coal will be transported to product stockpiles at the BAM by conveyor. The Proponent doesnot propose to tranport coal to the BAM via road when the conveyor is shut down (e.g. formaintenance).
11. 8 The part closure and realignment of affected state-controlled roads will be dealt with in aCompensation Agreement and Infrastructure Agreement that will be signed between theProponent and Main Roads.
11. 9 The Proponent has commenced negotiations with DMR on issues associated with the Projectand will continue to work with DMR on mine access matters.
Section 13 – Social Impact13. 1 During the approval phase of the Project, the Proponent will continue ongoing communication
with the Clermont community and existing BAM employees about the Project approvalprocess and timeline, and key Project milestones.
13. 2 The Site Construction Village is temporary and will be decommissioned and removed at theend of the construction phase.
13. 3 The Proponent would cater for the employees who choose to maintain their home baseoutside of Clermont during the operational phase by providing accommodation in theTownship Village. The proponent would restrict the distance employees travel on a daily basisto and from the mine to minimise the exposure to fatigue.
13. 4 The Project will provide employees with financial assistance towards the cost of purchase orrental of a principal place of residence.
13. 5 RTCA will continue to inform the existing BAM workforce, accommodation services providers,and other relevant stakeholders on the progress of the Project, including proposed plans foraccommodating the workforce.
13. 6 The Proponent would monitor the demand for accommodation and consider options to ensurethat demand for workforce accommodation is met and impacts on the Clermont housingmarket are minimised.
13. 7 After Project approval, the Proponent will provide to Belyando Shire Council a layout for a 100lot housing subdivision in Clermont as a contingency in case of excessive demand for newhousing.
13. 8 The Proponent would provide training to all employees. The Proponent would also workclosely with the BACJV to ensure that all BAM employees are:
§ aware of the employment opportunities available at the Project;§ understand the recruitment and selection process and criteria that will be used to assess
their applications; and§ aware of the timeframe for decisions relating to employment at the Project.
13. 9 RTCA will provide opportunities for people to be trained under traineeships andapprenticeships. Initiatives in this area will include:
§ encouraging contractors working on construction, developing the box-cut or providingservices to site to provide traineeships for young people;
§ seeking to work with engineering companies in the region to support additionalapprenticeships, including opportunities for females and indigenous applicants throughthe provision of financial support and site placements to gain experience. An example ofthis type of initiative is the partnership between RTCA's Hail Creek Mine and the MackayArea Industry Network (MAIN); and
§ providing opportunities, either directly or through external providers for traineeships andapprenticeships. Initiatives similar to those developed through the Blair Athol MineCommunity Development Fund, would be continued during the Project.

Clermont Coal Mine Project – Supplementary Report PAGE H-9
13. 10 A relationship with Central Queensland TAFE and other training organisations would bedeveloped to ensure that these agencies are aware of Project requirements and build theminto long-term training and upskilling plans. Partnerships with the community and agencies,that help to develop skills within the community, would also be considered by the Proponent.
13. 11 The Proponent will continue to support certain local community enterprises through programssimilar to the Blair Athol Mine Community Development Fund. An objective of such support isthat the enterprises must be self-sustaining.
13. 12 Counselling services would be provided for employees during the construction and operationalphases of the Project by phone and regular Project site or town visits by a counsellor. Duringthe operational phase counselling services would also be extended to families of allemployees, including those who do not reside in Clermont.
13. 13 The construction and operational phase workforce would be governed by the policies andcodes of conduct devised and implemented by RTCA and its contractors. RTCA’s policiesfrom “The Way We Work” and the “RTCA Code of Good Conduct” would be implemented.
Section 15 – Health and Safety15. 1 The Proponent will implement the RTCA Safety Standards and Occupational Health
Standards that are currently in use at all RTCA operations and provide the basis for effectivemanagement of employee and public health and safety.
15. 2 The Rio Tinto Occupational Health Standard for Hearing Conservation will apply to all phasesof the Project. The Project will implement hearing conservation standards and proceduresduring construction and operation to ensure that employees and contractors will not sufferadverse health effects from noise generated in the workplace.
15. 3 The Proponent would provide first aid and emergency rescue facilities and equipment duringall phases of the Project. The Proponent would ensure that appropriately trained personnelwould be on site throughout the life of the Project to provide first aid and respond to on-siteemergencies as required.
15. 4 MSDS information will be obtained and communicated to all site personnel involved in thestorage, handling use and disposal of hazardous substances and materials.
15. 5 Designated first aid and emergency rescue facilities and equipment will be available during theconstruction and operation phases.
15. 6 The site will have a fire brigade approved fire response/fighting system.
15. 7 The Proponent will liase with local State Emergency Services and local ambulance andhospital services with respect to planning for Emergency Response.
15. 8 An Emergency Response Plan will be prepared and implemented.
Section 16 EMOS16. 1 RTCA will ensure that employees, contractors and visitors receive appropriate environmental
awareness training. Environmental awareness training will occur at induction, and will be aregular feature of site-wide training. Records of training content and attendance will also bemaintained.
16. 2 Employees and contractors required to undertake work at the site must undergo anenvironment, health and safety induction.
16. 3 The Proponent will develop and implement a complaints procedure. Any complaints will berecorded on a register. Complaints will be investigated and where appropriate, correctiveaction will be implemented.


Appendix I Surplus Groundwater and Sandy CreekAlluvial Aquifer Water Quality
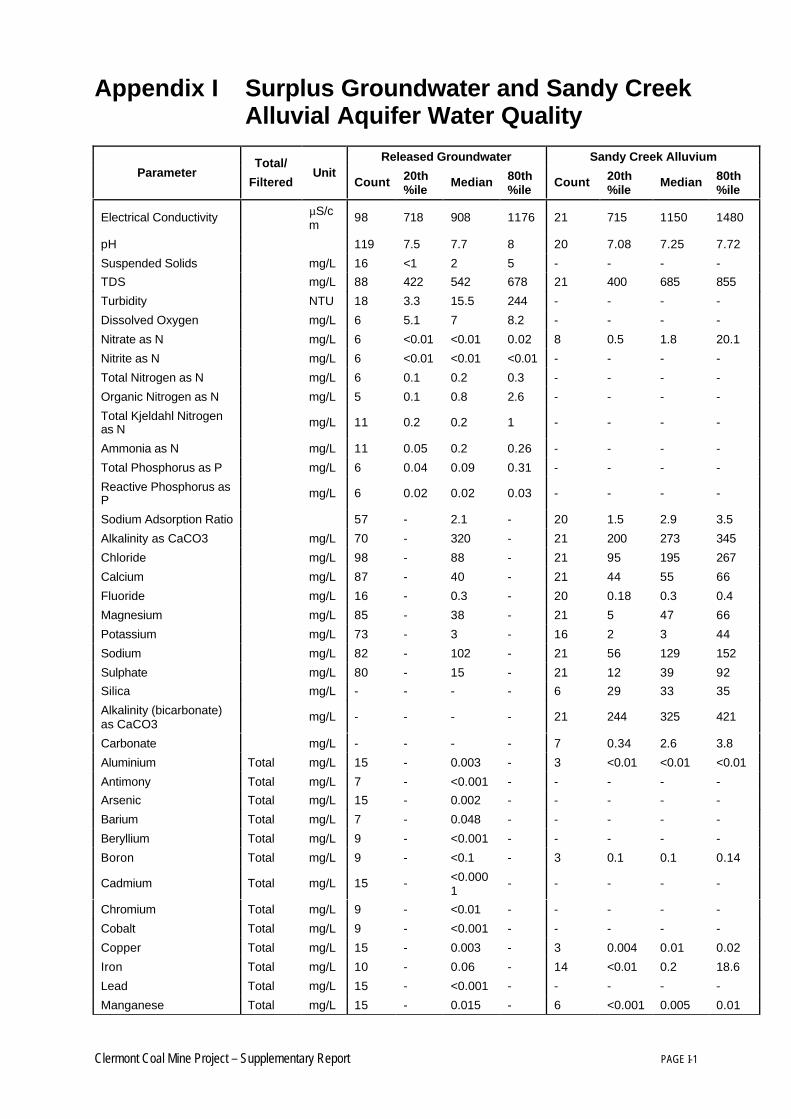
Clermont Coal Mine Project – Supplementary Report PAGE I-1
Appendix I Surplus Groundwater and Sandy CreekAlluvial Aquifer Water Quality
Released Groundwater Sandy Creek AlluviumParameter
Total/
FilteredUnit
Count 20th%ile
Median 80th%ile
Count 20th%ile
Median 80th%ile
Electrical Conductivity µS/cm
98 718 908 1176 21 715 1150 1480
pH 119 7.5 7.7 8 20 7.08 7.25 7.72
Suspended Solids mg/L 16 <1 2 5 - - - -
TDS mg/L 88 422 542 678 21 400 685 855
Turbidity NTU 18 3.3 15.5 244 - - - -
Dissolved Oxygen mg/L 6 5.1 7 8.2 - - - -
Nitrate as N mg/L 6 <0.01 <0.01 0.02 8 0.5 1.8 20.1
Nitrite as N mg/L 6 <0.01 <0.01 <0.01 - - - -
Total Nitrogen as N mg/L 6 0.1 0.2 0.3 - - - -
Organic Nitrogen as N mg/L 5 0.1 0.8 2.6 - - - -
Total Kjeldahl Nitrogenas N mg/L 11 0.2 0.2 1 - - - -
Ammonia as N mg/L 11 0.05 0.2 0.26 - - - -
Total Phosphorus as P mg/L 6 0.04 0.09 0.31 - - - -
Reactive Phosphorus asP mg/L 6 0.02 0.02 0.03 - - - -
Sodium Adsorption Ratio 57 - 2.1 - 20 1.5 2.9 3.5
Alkalinity as CaCO3 mg/L 70 - 320 - 21 200 273 345
Chloride mg/L 98 - 88 - 21 95 195 267
Calcium mg/L 87 - 40 - 21 44 55 66
Fluoride mg/L 16 - 0.3 - 20 0.18 0.3 0.4
Magnesium mg/L 85 - 38 - 21 5 47 66
Potassium mg/L 73 - 3 - 16 2 3 44
Sodium mg/L 82 - 102 - 21 56 129 152
Sulphate mg/L 80 - 15 - 21 12 39 92
Silica mg/L - - - - 6 29 33 35
Alkalinity (bicarbonate)as CaCO3
mg/L - - - - 21 244 325 421
Carbonate mg/L - - - - 7 0.34 2.6 3.8
Aluminium Total mg/L 15 - 0.003 - 3 <0.01 <0.01 <0.01
Antimony Total mg/L 7 - <0.001 - - - - -
Arsenic Total mg/L 15 - 0.002 - - - - -
Barium Total mg/L 7 - 0.048 - - - - -
Beryllium Total mg/L 9 - <0.001 - - - - -
Boron Total mg/L 9 - <0.1 - 3 0.1 0.1 0.14
Cadmium Total mg/L 15 - <0.0001
- - - - -
Chromium Total mg/L 9 - <0.01 - - - - -
Cobalt Total mg/L 9 - <0.001 - - - - -
Copper Total mg/L 15 - 0.003 - 3 0.004 0.01 0.02
Iron Total mg/L 10 - 0.06 - 14 <0.01 0.2 18.6
Lead Total mg/L 15 - <0.001 - - - - -
Manganese Total mg/L 15 - 0.015 - 6 <0.001 0.005 0.01
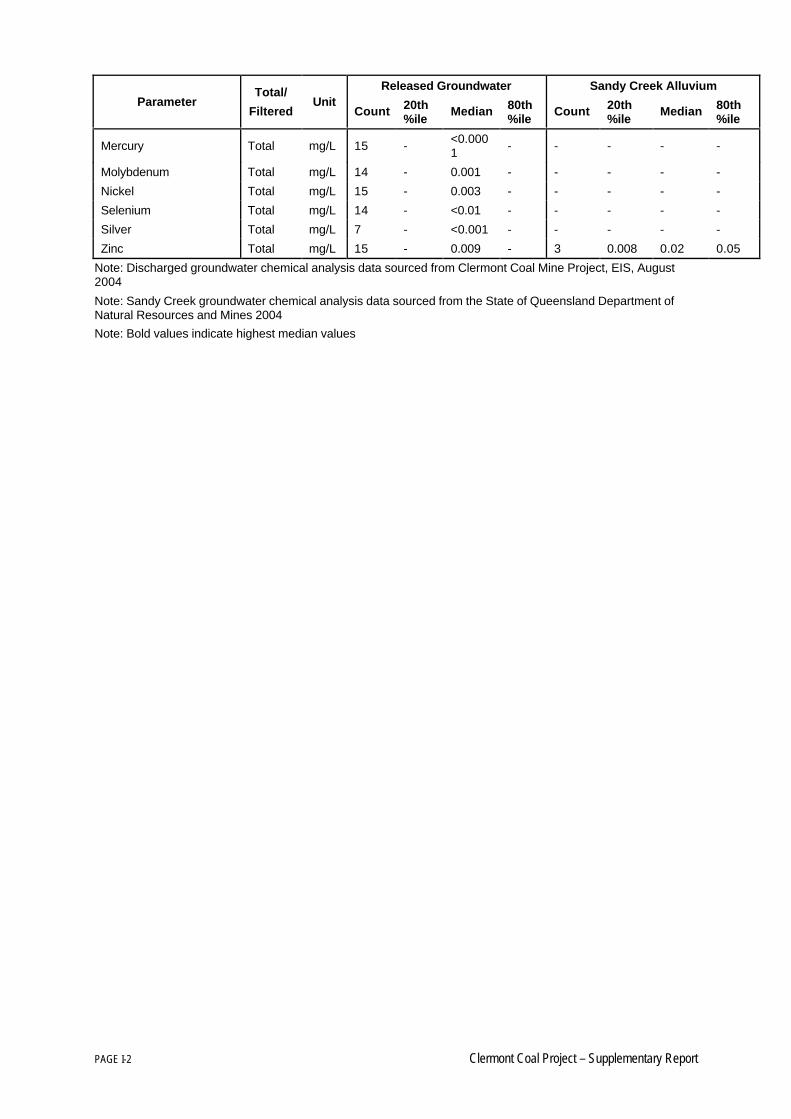
PAGE I-2 Clermont Coal Project – Supplementary Report
Released Groundwater Sandy Creek AlluviumParameter
Total/
FilteredUnit
Count 20th%ile
Median 80th%ile
Count 20th%ile
Median 80th%ile
Mercury Total mg/L 15 - <0.0001 - - - - -
Molybdenum Total mg/L 14 - 0.001 - - - - -
Nickel Total mg/L 15 - 0.003 - - - - -
Selenium Total mg/L 14 - <0.01 - - - - -
Silver Total mg/L 7 - <0.001 - - - - -
Zinc Total mg/L 15 - 0.009 - 3 0.008 0.02 0.05
Note: Discharged groundwater chemical analysis data sourced from Clermont Coal Mine Project, EIS, August2004
Note: Sandy Creek groundwater chemical analysis data sourced from the State of Queensland Department ofNatural Resources and Mines 2004
Note: Bold values indicate highest median values

Appendix J Summary of Surface Water Quality
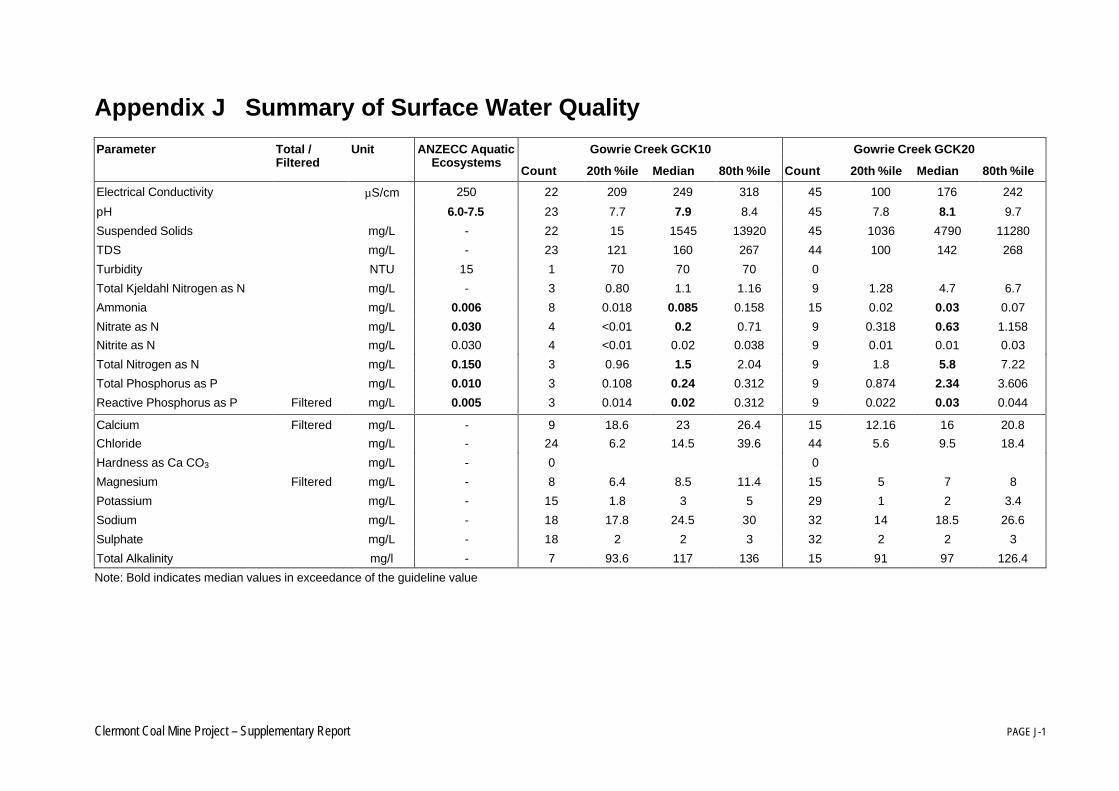
Clermont Coal Mine Project – Supplementary Report PAGE J-1
Appendix J Summary of Surface Water Quality
Gowrie Creek GCK10 Gowrie Creek GCK20Parameter Total /Filtered
Unit ANZECC AquaticEcosystems
Count 20th %ile Median 80th %ile Count 20th %ile Median 80th %ile
Electrical Conductivity µS/cm 250 22 209 249 318 45 100 176 242
pH 6.0-7.5 23 7.7 7.9 8.4 45 7.8 8.1 9.7
Suspended Solids mg/L - 22 15 1545 13920 45 1036 4790 11280
TDS mg/L - 23 121 160 267 44 100 142 268
Turbidity NTU 15 1 70 70 70 0
Total Kjeldahl Nitrogen as N mg/L - 3 0.80 1.1 1.16 9 1.28 4.7 6.7
Ammonia mg/L 0.006 8 0.018 0.085 0.158 15 0.02 0.03 0.07
Nitrate as N mg/L 0.030 4 <0.01 0.2 0.71 9 0.318 0.63 1.158
Nitrite as N mg/L 0.030 4 <0.01 0.02 0.038 9 0.01 0.01 0.03
Total Nitrogen as N mg/L 0.150 3 0.96 1.5 2.04 9 1.8 5.8 7.22
Total Phosphorus as P mg/L 0.010 3 0.108 0.24 0.312 9 0.874 2.34 3.606
Reactive Phosphorus as P Filtered mg/L 0.005 3 0.014 0.02 0.312 9 0.022 0.03 0.044
Calcium Filtered mg/L - 9 18.6 23 26.4 15 12.16 16 20.8
Chloride mg/L - 24 6.2 14.5 39.6 44 5.6 9.5 18.4
Hardness as Ca CO3 mg/L - 0 0
Magnesium Filtered mg/L - 8 6.4 8.5 11.4 15 5 7 8
Potassium mg/L - 15 1.8 3 5 29 1 2 3.4
Sodium mg/L - 18 17.8 24.5 30 32 14 18.5 26.6
Sulphate mg/L - 18 2 2 3 32 2 2 3
Total Alkalinity mg/l - 7 93.6 117 136 15 91 97 126.4
Note: Bold indicates median values in exceedance of the guideline value
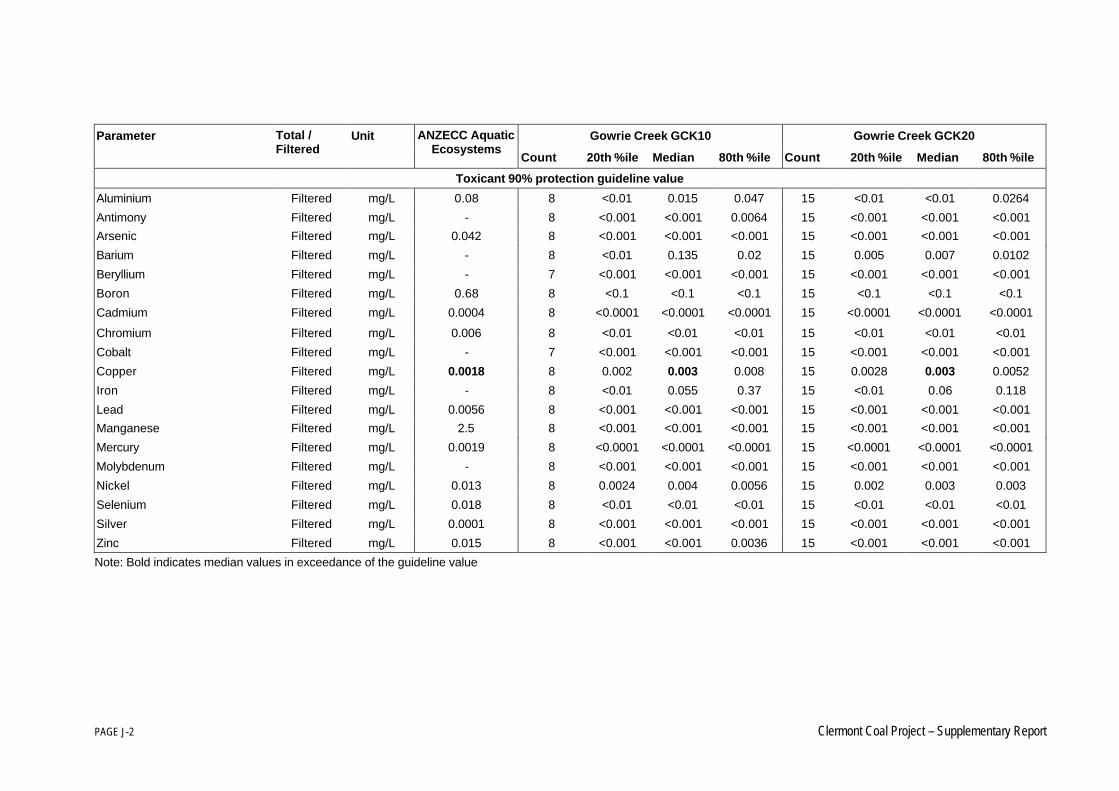
PAGE J-2 Clermont Coal Project – Supplementary Report
Gowrie Creek GCK10 Gowrie Creek GCK20Parameter Total /Filtered
Unit ANZECC AquaticEcosystems
Count 20th %ile Median 80th %ile Count 20th %ile Median 80th %ile
Toxicant 90% protection guideline value
Aluminium Filtered mg/L 0.08 8 <0.01 0.015 0.047 15 <0.01 <0.01 0.0264
Antimony Filtered mg/L - 8 <0.001 <0.001 0.0064 15 <0.001 <0.001 <0.001
Arsenic Filtered mg/L 0.042 8 <0.001 <0.001 <0.001 15 <0.001 <0.001 <0.001
Barium Filtered mg/L - 8 <0.01 0.135 0.02 15 0.005 0.007 0.0102
Beryllium Filtered mg/L - 7 <0.001 <0.001 <0.001 15 <0.001 <0.001 <0.001
Boron Filtered mg/L 0.68 8 <0.1 <0.1 <0.1 15 <0.1 <0.1 <0.1
Cadmium Filtered mg/L 0.0004 8 <0.0001 <0.0001 <0.0001 15 <0.0001 <0.0001 <0.0001
Chromium Filtered mg/L 0.006 8 <0.01 <0.01 <0.01 15 <0.01 <0.01 <0.01
Cobalt Filtered mg/L - 7 <0.001 <0.001 <0.001 15 <0.001 <0.001 <0.001
Copper Filtered mg/L 0.0018 8 0.002 0.003 0.008 15 0.0028 0.003 0.0052
Iron Filtered mg/L - 8 <0.01 0.055 0.37 15 <0.01 0.06 0.118
Lead Filtered mg/L 0.0056 8 <0.001 <0.001 <0.001 15 <0.001 <0.001 <0.001
Manganese Filtered mg/L 2.5 8 <0.001 <0.001 <0.001 15 <0.001 <0.001 <0.001
Mercury Filtered mg/L 0.0019 8 <0.0001 <0.0001 <0.0001 15 <0.0001 <0.0001 <0.0001
Molybdenum Filtered mg/L - 8 <0.001 <0.001 <0.001 15 <0.001 <0.001 <0.001
Nickel Filtered mg/L 0.013 8 0.0024 0.004 0.0056 15 0.002 0.003 0.003
Selenium Filtered mg/L 0.018 8 <0.01 <0.01 <0.01 15 <0.01 <0.01 <0.01
Silver Filtered mg/L 0.0001 8 <0.001 <0.001 <0.001 15 <0.001 <0.001 <0.001
Zinc Filtered mg/L 0.015 8 <0.001 <0.001 0.0036 15 <0.001 <0.001 <0.001
Note: Bold indicates median values in exceedance of the guideline value
Clermont Coal Mine Project – Supplementary Report PAGE J-3
Tea Tree Creek TTCK10 Wolfang Creek DNRM 130211 (A,B)Parameter Total /Filtered
Unit ANZECC AquaticEcosystems
Count 20th %ile Median 80th %ile Count 20th %ile Median 80th %ile
Electrical Conductivity µS/cm 250 34 173 288 357 19 321 1600 2052
pH 6.0-7.5 34 7.8 7.88 8.2 19 7.8 8.1 8.4
Suspended Solids mg/L - 34 4516 15250 32540 15 20 145 296
TDS mg/L - 33 113 240 377 19 190 856 1068
Turbidity NTU 15 0 1 100 100 100
Total Kjeldahl Nitrogen as N mg/L - 2 1.36 1.6 1.84 0
Ammonia mg/L 0.006 13 0.034 0.11 0.42 0
Nitrate as N mg/L 0.030 1 0.41 0.41 0.41 11 0.16 1 2.5
Nitrite as N mg/L 0.030 3 <0.01 0.01 0.028 0
Total Nitrogen as N mg/L 0.150 3 0.842 1.4 2.12 0
Total Phosphorus as P mg/L 0.010 2 0.436 0.55 0.664 0
Reactive Phosphorus as P Filtered mg/L 0.005 2 0.032 0.065 0.098 0
Calcium Filtered mg/L - 12 19.8 24 33 19 16.4 23 45.6
Chloride mg/L - 34 3 7.5 23.2 19 29.6 286 433.6
Hardness as Ca CO3 mg/L - 1 72 72 72 19 80.6 306 456.2
Magnesium Filtered mg/L - 12 8 9 13.8 19 8.66 57 87
Potassium mg/L - 21 1 2 4 18 1.88 2.5 4.62
Sodium mg/L - 25 14.8 24 26.8 19 38.8 182 252.8
Sulphate mg/L - 25 1 2 3.2 14 7.66 28 41.2
Total Alkalinity mg/l - 13 127.4 143 195.6 19 117.2 239 362.6
Note: Bold indicates median values in exceedance of the guideline value
PAGE J-4 Clermont Coal Project – Supplementary Report
Tea Tree Creek TTCK10 Wolfang Creek DNRM 130211 (A,B)Parameter Total /Filtered
Unit ANZECC AquaticEcosystems
Count 20th %ile Median 80th %ile Count 20th %ile Median 80th %ile
Toxicant 90% protection guideline value
Aluminium Filtered mg/L 0.08 13 <0.01 <0.01 0.052 0
Antimony Filtered mg/L - 12 <0.001 <0.001 <0.001 0
Arsenic Filtered mg/L 0.042 12 <0.001 <0.001 <0.001 0
Barium Filtered mg/L - 12 0.0092 0.0115 0.018 0
Beryllium Filtered mg/L - 12 <0.001 <0.001 <0.001 0
Boron Filtered mg/L 0.68 12 <0.1 <0.1 <0.1 2 0.132 0.18 0.228
Cadmium Filtered mg/L 0.0004 12 <0.0001 <0.0001 <0.0001 0
Chromium Filtered mg/L 0.006 12 <0.01 <0.01 <0.01 0
Cobalt Filtered mg/L - 12 <0.001 <0.001 <0.001 0
Copper Filtered mg/L 0.0018 12 0.0022 0.003 0.0038 0
Iron Filtered mg/L - 12 <0.01 <0.01 0.018 1 0.13 0.13 0.13
Lead Filtered mg/L 0.0056 12 <0.001 0.001 0.001 0
Manganese Filtered mg/L 2.5 12 <0.001 <0.001 <0.001 1 <0.01 <0.01 <0.01
Mercury Filtered mg/L 0.0019 12 <0.0001 <0.0001 <0.0001 0
Molybdenum Filtered mg/L - 12 <0.001 <0.001 <0.001 0
Nickel Filtered mg/L 0.013 12 0.0022 0.004 0.0048 0
Selenium Filtered mg/L 0.018 12 <0.01 <0.01 <0.001 0
Silver Filtered mg/L 0.0001 12 <0.001 <0.001 <0.001 0
Zinc Filtered mg/L 0.015 12 <0.001 <0.001 <0.001 0
Note: Bold indicates median values in exceedance of the guideline value

Appendix K Summary of Accommodation Providers
Clermont Coal Mine Project – Supplementary Report PAGE K-1
Appendix K Summary of Accommodation Providers(Peak and off peak based on 2002 occupancy rates)
Provider Rooms Available Peak Times
90 – 100% occupancy
Average trading
60 – 70%
occupancy
Off Peak
Less than 40%
Rates Type of guests
Grand Hotel 13 Mine shuts down for repair
2002
June/July/August
Feb – May
Sept – Christmas
Christmas – Feb Single $50
Double $61
Every extra $6
Commercial
Tourists
Peppercorn Motel 16 June/July/August
November
Feb – May
Sept - Oct
Christmas – Feb Single $81
Double twin $96
Commercial
Local graziers
staying overnight forspecial events
Tourists
Clermont MotorInn
25 May - Show
June/July/ August
Feb – April
Sept - Oct
Christmas – Feb Single $68
Double $75
Twin room $78
ClermontHotel/Motel
Total: 21
12 rooms in hotel and 9 inseparate building across road.The rooms are suitable for shiftworkers
Seeking to supply catering tomine site
June/July/ August Feb – May
Sept – Oct
Christmas – Feb Single $39.50
Twin room $55
Commercial
45% associated withmine
45%
Main Roads, Railway
Telstra
5% - tourists
Leo Hotel 13 motel rooms and five havepotential to be refurbished inthe Hotel
June/July/August Sept – Nov Dec/Jan Single $38
Double $45
Mainly commercialtrade
PAGE K-2 Clermont Coal Project – Supplementary Report
Provider Rooms Available Peak Times
90 – 100% occupancy
Average trading
60 – 70%
occupancy
Off Peak
Less than 40%
Rates Type of guests
Commercial Hotel 18 rooms + 2 bedroomresidence
Land next to hotel available formodular accommodation – hasapproached Council forapproval to develop
Can accommodate 16 – 20rooms
May – Show
June/July/August
Feb – April
Sept – Nov
Christmas – Feb Single $25
Double $30
Farmers, farm workers,railway workers
Clermont CaravanPark
Total of 95 caravan sitesavailable.
Park owns 14 vans on site and4 cabins.
(Park owned accommodationtakes up to 50 people on ashared basis if required). Spaceis available for about 20 morecabin-style buildings. A showerblock is also available but mayhave to be supplemented.
April – August is peak timefor tourists
No averagetrading time
Oct, Nov, Dec Janand Feb
$25 - $40 a night forcaravans
$45 - $55 a night forcabins (allairconditioned).
Tourists mainly

For further information:
Rio Tinto Coal AustraliaGPO Box 391
Brisbane QLD 4001
Ph: 07 3361 4200Fax: 07 3229 5087
Email: [email protected]: www.riotintocoalaustralia.com