clic 2016: data visualization for the rest of us: a beginners guide
TRANSCRIPT

Data Visualization for the Rest of Us: A Beginner’s GuideLinda Hofschire
Library Research Service, Colorado State Library
www.lrs.org | @LRS_CO | @lindahofschire

SCHOOL LIBRARY IMPACT STUDIES


Stories are how numbers talk to people.-Thomas Davenport
By visualizing information, we turn it into a landscape that you can explore with your eyes, a sort of information map. And when you’re lost in information, an information map is kind of useful.―David McCandless
Numbers have an important story to tell. They rely on you to give them a clear and convincing voice.―Stephen Few
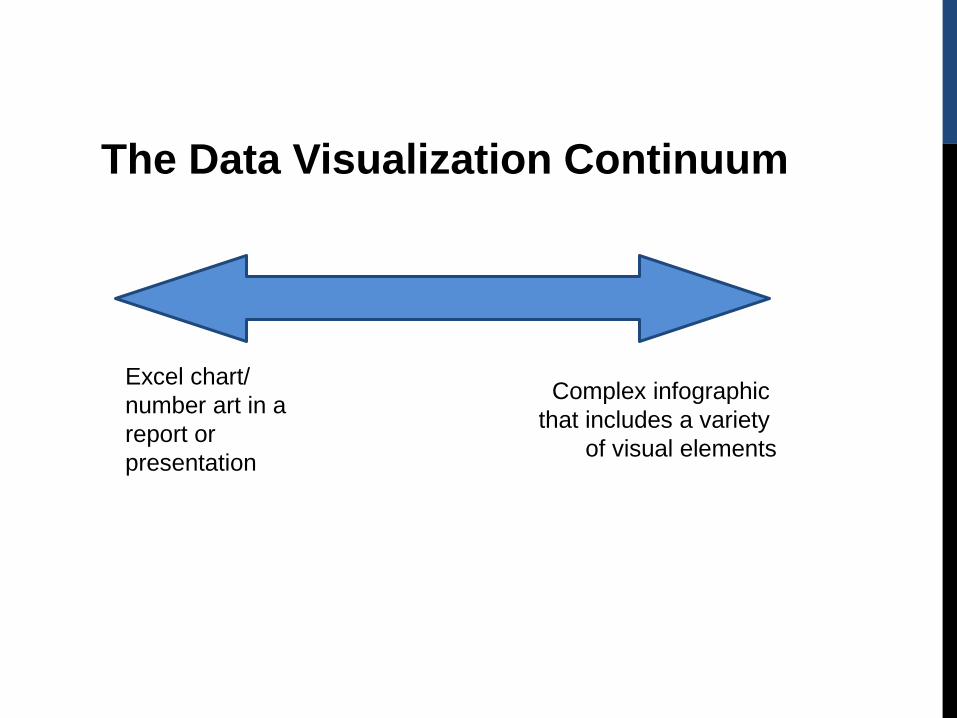
The Data Visualization Continuum
Excel chart/
number art in a
report or
presentation
Complex infographic
that includes a variety
of visual elements


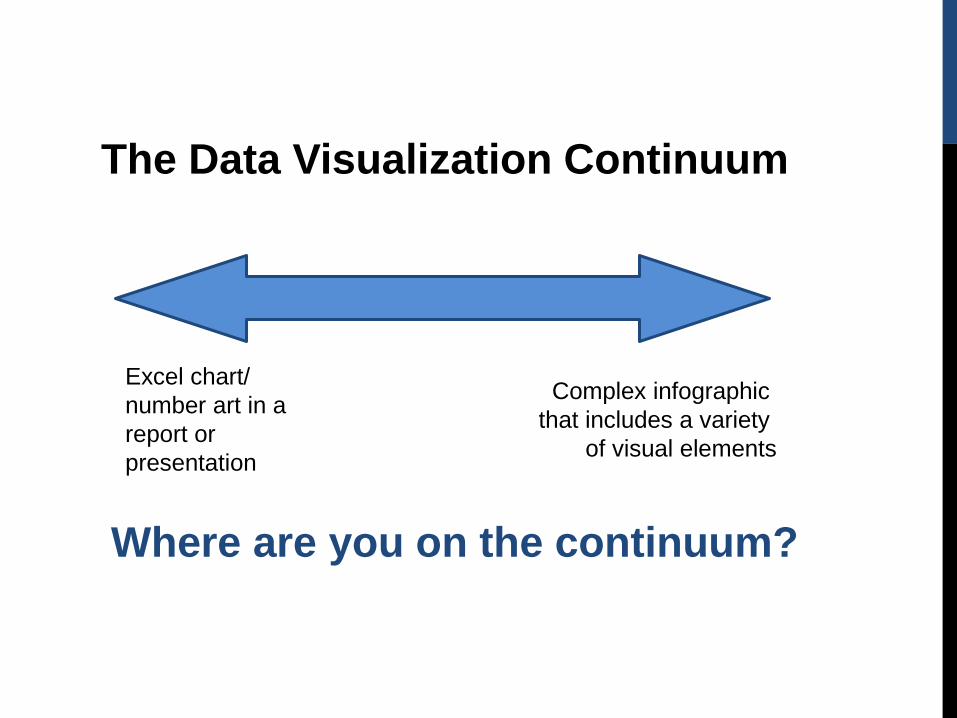
The Data Visualization Continuum
Excel chart/
number art in a
report or
presentation
Complex infographic
that includes a variety
of visual elements
Where are you on the continuum?

4 simple tweaks to make numbers
and charts more accessible

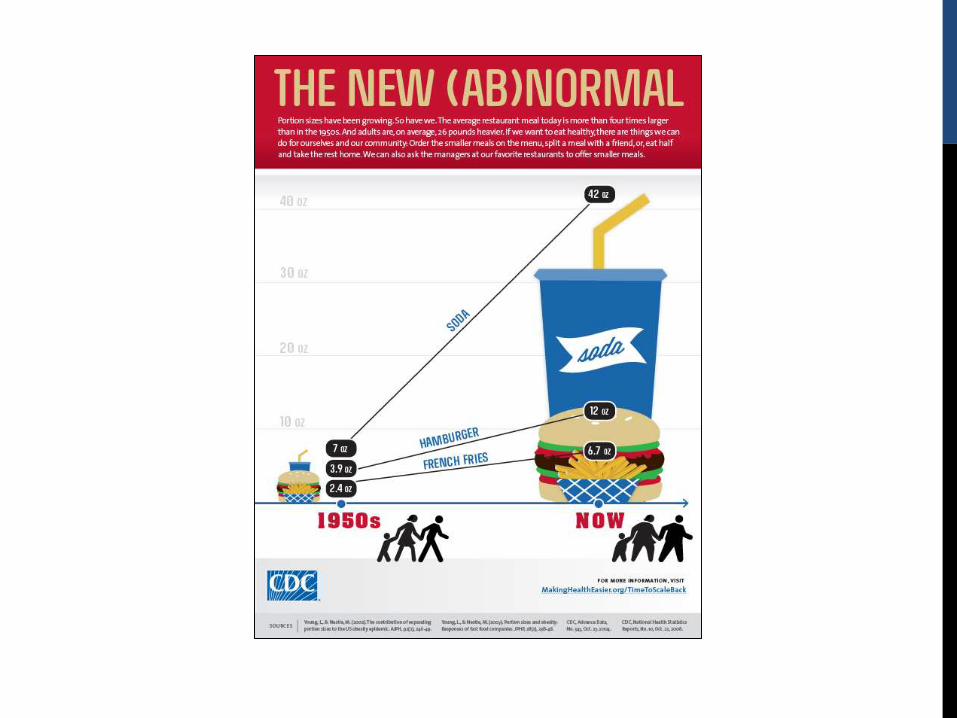
1. PUT NUMBERS IN CONTEXT
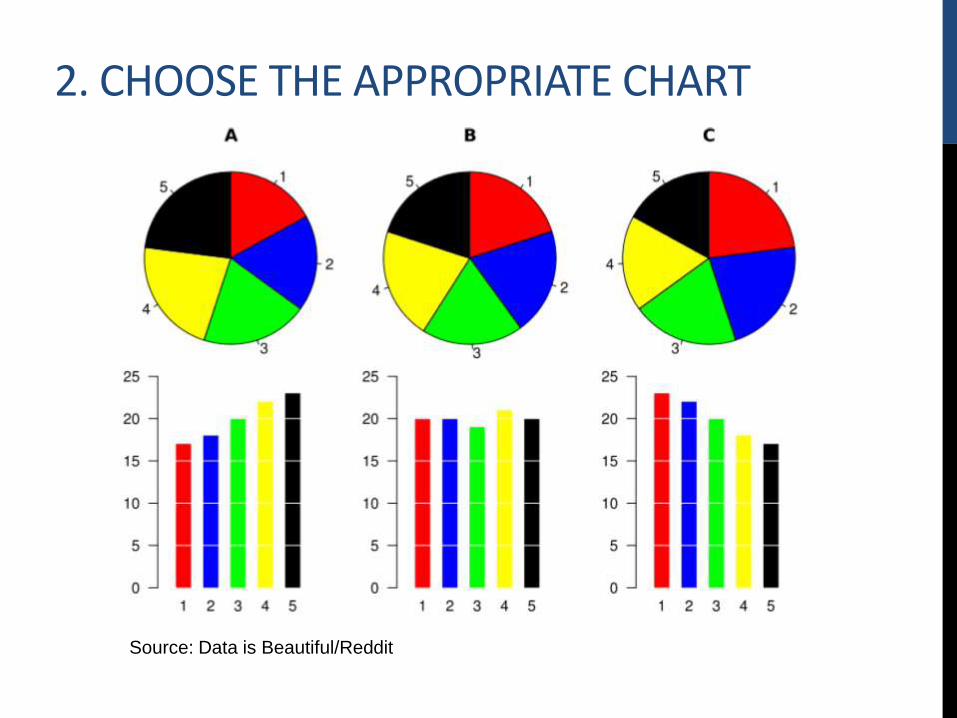
Source: Data is Beautiful/Reddit
2. CHOOSE THE APPROPRIATE CHART
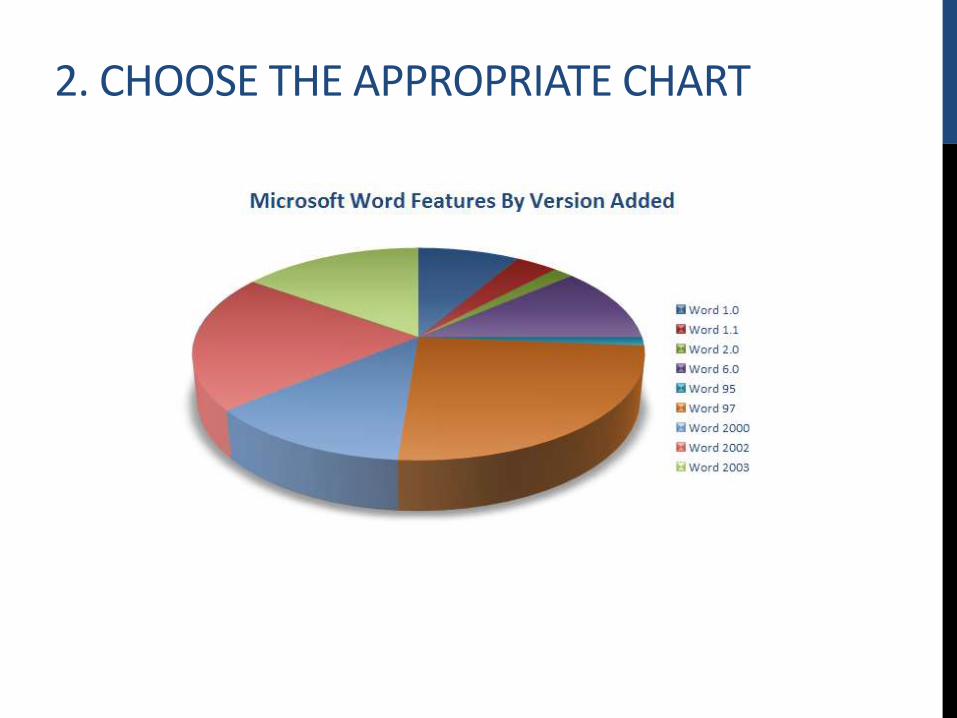
2. CHOOSE THE APPROPRIATE CHART

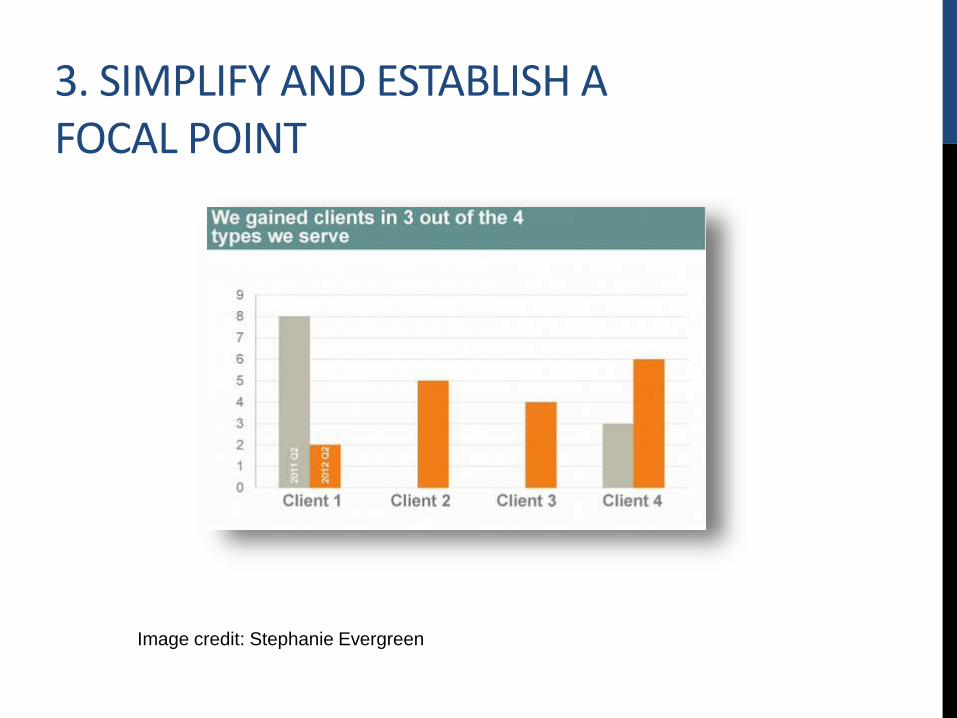
3. SIMPLIFY AND ESTABLISH A FOCAL POINT

3. SIMPLIFY AND ESTABLISH A FOCAL POINT
Image credit: Stephanie Evergreen
3. SIMPLIFY AND ESTABLISH A FOCAL POINT
Image credit: Stephanie Evergreen

4. DON’T MAKE PEOPLE WORK TOO HARD TO FIND INFORMATION
0%
10%
20%
30%
40%
50%
60%
70%
80%
90%
100%
<10k 10k-24,999 25k-99,999 100k-499,999 500k+
Pe
rce
nta
ge
of
Lib
rari
es
Population Group
Percentage of U.S. Public Libraries with Text, Chat, and Email Reference, 2014
Text Chat Email

4. DON’T MAKE PEOPLE WORK TOO HARD TO FIND INFORMATION
2%
11% 14%
21%
67%
9%
26% 28%
43%
100%
25% 26%
48%
75%
100%
0%
10%
20%
30%
40%
50%
60%
70%
80%
90%
100%
<10k 10k-24,999 25k-99,999 100k-499,999 500k+
Pe
rce
nta
ge
of
Lib
rari
es
Population Group
Percentage of U.S. Public Libraries with Text, Chat, and Email Reference, 2014
Text Chat Email

CHART DISSECTION

49.32% 49.13%54.05%
59.28% 57.71%60.39%61.22%
59.01%61.86%
0%
10%
20%
30%
40%
50%
60%
70%
My child's enjoyment of readingincreased
My child's reading skillsincreased
My child's reading by choiceincreased
Chart 3Percentages of Survey Respondents Indicating Their Child's
Enjoyment of Reading, Reading Skills, and Reading by Choice Increased after Participating in Summer Reading
All survey respondents
Parents of children ages 4-6
Families participating in summer reading for the first time
*

49.32% 49.13%54.05%
59.28% 57.71%60.39%61.22%
59.01%61.86%
0.00%
10.00%
20.00%
30.00%
40.00%
50.00%
60.00%
70.00%
My child's enjoyment of readingincreased
My child's reading skillsincreased
My child's reading by choiceincreased
Chart 3Percentages of Survey Respondents Indicating Their Child's
Enjoyment of Reading, Reading Skills, and Reading by Choice Increased after Participating in Summer Reading
All survey respondents
Parents of children ages 4-6
Families participating in summer reading for the first time
*

49.32% 49.13%54.05%
59.28% 57.71%60.39%61.22%
59.01%61.86%
0.00%
10.00%
20.00%
30.00%
40.00%
50.00%
60.00%
70.00%
My child's enjoyment of readingincreased
My child's reading skillsincreased
My child's reading by choiceincreased
Chart 3Percentages of Survey Respondents Indicating Their Child's
Enjoyment of Reading, Reading Skills, and Reading by Choice Increased after Participating in Summer Reading
All survey respondents
Parents of children ages 4-6
Families participating in summer reading for the first time

49.32% 49.13%54.05%
59.28% 57.71%60.39%61.22%
59.01%61.86%
0.00%
10.00%
20.00%
30.00%
40.00%
50.00%
60.00%
70.00%
My child's enjoyment of readingincreased
My child's reading skillsincreased
My child's reading by choiceincreased
Chart 3Percentages of Survey Respondents Indicating Their Child's
Enjoyment of Reading, Reading Skills, and Reading by Choice Increased after Participating in Summer Reading
All survey respondents
Parents of children ages 4-6
Families participating in summer reading for the first time
Color

49% 49%
54%
59%58%
60%61%59%
62%
0%
10%
20%
30%
40%
50%
60%
70%
My child's enjoyment ofreading increased
My child's reading skillsincreased
My child's reading bychoice increased
The impact of summer reading was particularly pronounced for families
participating in the program for the first time and children ages 4-6:
All survey respondents Parents of children ages 4-6 Families participating in summer
reading for the first time

49.32% 49.13%54.05%
59.28% 57.71%60.39%61.22%
59.01%61.86%
0%
10%
20%
30%
40%
50%
60%
70%
My child's enjoyment of readingincreased
My child's reading skillsincreased
My child's reading by choiceincreased
Chart 3Percentages of Survey Respondents Indicating Their Child's
Enjoyment of Reading, Reading Skills, and Reading by Choice Increased after Participating in Summer Reading
All survey respondents
Parents of children ages 4-6
Families participating in summer reading for the first time

Activity: Chart Critique


10%
25%
27%
29%
30%
32%
34%
51%
0% 10% 20% 30% 40% 50% 60%
Entrepreneurship
Employment
Education
eGovernment
Health & wellness
eCommerce
Civic engagement
Social networking
Using technology to stay in touch with family and friends and maintain
social networks was the most popular activity on Rock Creek Public
Library computers.

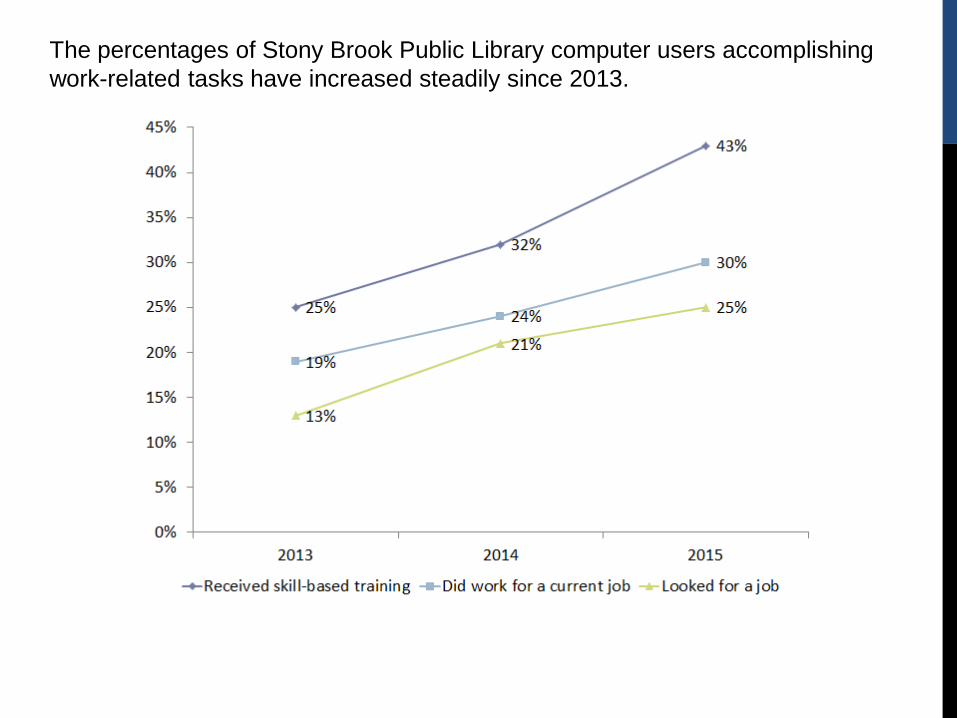
The percentages of Stony Brook Public Library computer users accomplishing
work-related tasks have increased steadily since 2013.


About half of Boulder Bay Public Library computer users are white,
and more than 1 in 4 are Hispanic or Latino.

48%
27%
11%
10%
4%
White
Hispanic or Latino
Black or African-American
American Indian and AlaskaNative
Asian
More than 1 in 4 Boulder Bay Public Library computer users are
Hispanic or Latino.

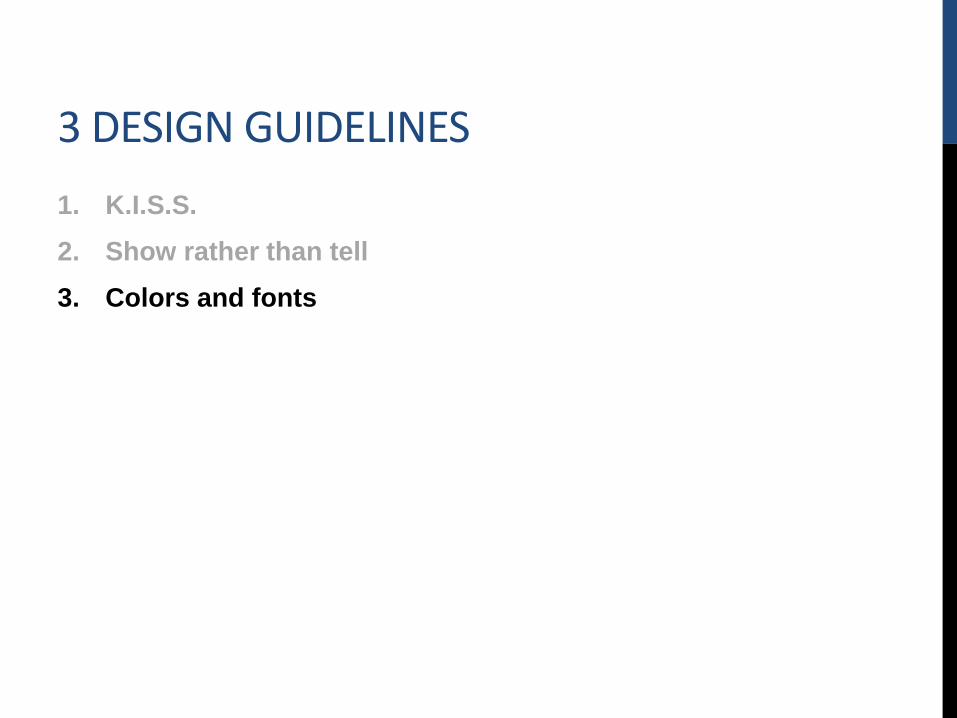
3 DESIGN GUIDELINES
1. K.I.S.S.
2. Show rather than tell
3. Colors and fonts


3 DESIGN GUIDELINES
1. K.I.S.S.
2. Show rather than tell
3. Colors and fonts

3 DESIGN GUIDELINES
1. K.I.S.S.
2. Show rather than tell
3. Colors and fonts


INFOGRAPHIC CREATION SOFTWARE
PowerPointAdobe
Illustrator
Piktochart


INFOGRAPHIC CREATION SOFTWARE
PowerPointAdobe
Illustrator
Piktochart

PIKTOCHART
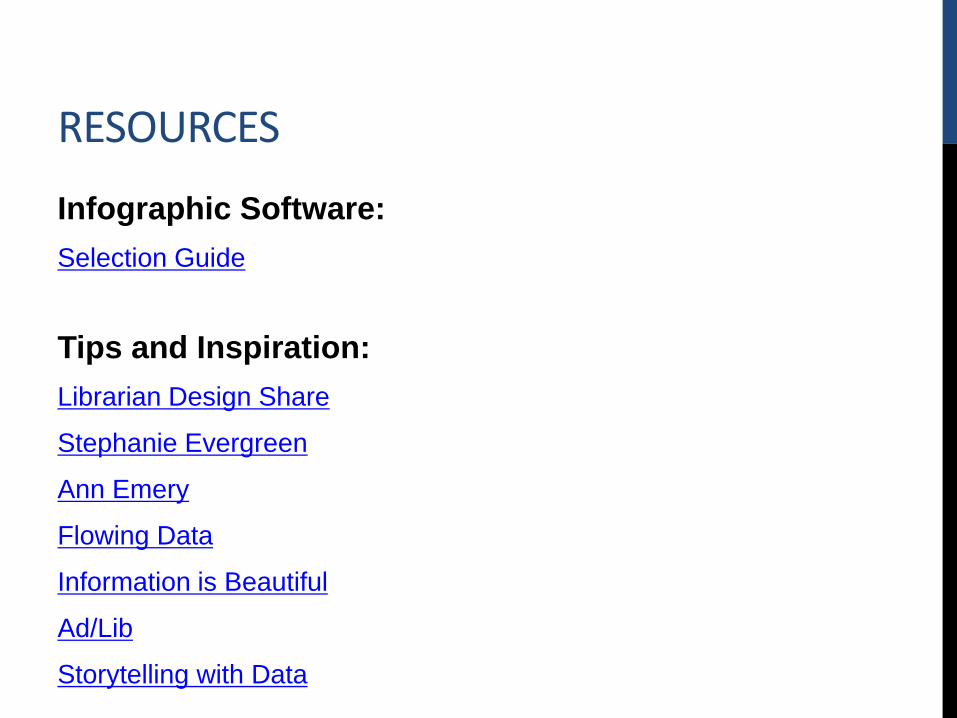
RESOURCES
Infographic Software:
Selection Guide
Tips and Inspiration:
Librarian Design Share
Stephanie Evergreen
Ann Emery
Flowing Data
Information is Beautiful
Ad/Lib
Storytelling with Data

RESOURCES
Software Tutorials:
Lynda
Creative Live
Icon/Image Sources:
IconArchive
openclipart
morgueFile
Pexels
Pixabay

RESOURCES
Symbol Font Sources:
Modern Pictograms
StateFace
Cittadino
WebHostingHub Glyphs
The Top 15 Free Symbol Fonts
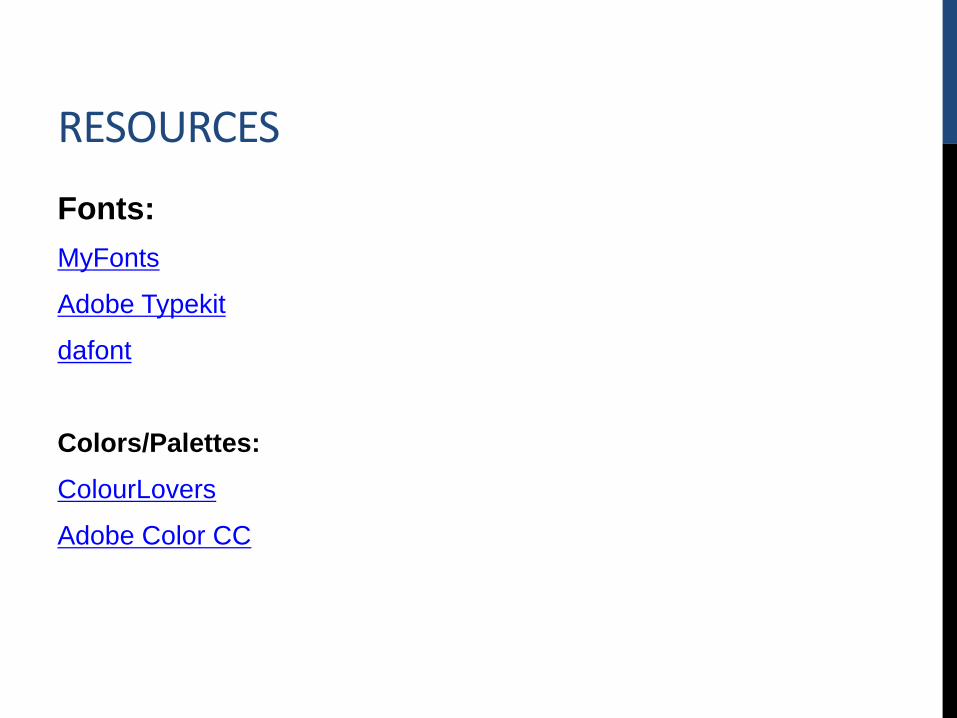
RESOURCES
Fonts:
MyFonts
Adobe Typekit
dafont
Colors/Palettes:
ColourLovers
Adobe Color CC

RESOURCES
Color Blindness:
Compliant Color Use
Chart Selection Guide:
Tableau Whitepaper: Which Chart or Graph is Right for You?

ACTION ITEMS
1. Perform a chart dissection
2. Take a data inventory
3. Think about the stories you want to
tell about your library. Do you have
the data to tell those stories?

QUESTIONS?

THANK YOU!
Linda Hofschire:
lrs.org
Slides and resources are at
bit.ly/clic2016_dataviz