click here full article plot scale effects on runoff and
TRANSCRIPT
ClickHere
for
FullArticle
Plot‐scale effects on runoff and erosion along a slopedegradation gradient
Mariano Moreno‐de las Heras,1,2 José M. Nicolau,3 Luis Merino‐Martín,3
and Bradford P. Wilcox4
Received 17 February 2009; revised 31 October 2009; accepted 16 November 2009; published 6 April 2010.
[1] In Earth and ecological sciences, an important, crosscutting issue is the relationshipbetween scale and the processes of runoff and erosion. In drylands, understanding thisrelationship is critical for understanding ecosystem functionality and degradationprocesses. Recent work has suggested that the effects of scale may differ depending on theextent of degradation. To test this hypothesis, runoff and sediment yield were monitoredduring a hydrological year on 20 plots of various lengths (1–15 m). These plots werelocated on a series of five reclaimed mining slopes in a Mediterranean‐dry environment.The five slopes exhibited various degrees of vegetative cover and surface erosion. Ageneral decrease of unit area runoff was observed with increasing plot scale for all slopes.Nevertheless, the amount of reinfiltrated runoff along each slope varied with the extent ofdegradation, being highest at the least degraded slope and vice versa. In other words,unit area runoff decreased the least on the most disturbed site as plot length increased.Unit area sediment yield declined with increasing plot length for the undisturbed andmoderately disturbed sites, but it actually increased for the highly disturbed sites. Thedifferent scaling behavior of the most degraded slopes was especially clear underhigh‐intensity rainfall conditions, when flow concentration favored rill erosion. Our resultsconfirm that in drylands, the effects of scale on runoff and erosion change with theextent of degradation, resulting in a substantial loss of soil and water from disturbedsystems, which could reinforce the degradation process through feedback mechanismswith vegetation.
Citation: Moreno‐de las Heras, M., J. M. Nicolau, L. Merino‐Martín, and B. P. Wilcox (2010), Plot‐scale effects on runoff anderosion along a slope degradation gradient, Water Resour. Res., 46, W04503, doi:10.1029/2009WR007875.
1. Introduction
[2] Understanding the influence of scale on hydrologicaland ecological processes has been an active area of researchfor at least the last several decades, but remains a significantchallenge [Cammeraat, 2002; Yair and Raz‐Yassif, 2004;Newman et al., 2006]. In particular, the analysis of varia-tions in runoff and sediment yield in plots of different sizeshas been recognized as a vital task for modeling hillslopehydrology [Boardman, 2006; Bracken and Croke, 2007]. Inaddition, the redistribution of water and sediment fluxes hasbeen stressed as a fundamental process for the comprehen-sion of ecosystem organization and land degradation inwater‐restricted environments, where ecological and hydro-logical processes are tightly coupled [Wilcox and Newman,2005; Okin et al., 2009].
[3] Hydrological studies that focus on the scale issue havedocumented that runoff per unit area generally decreases asplot size increases, as a result of reinfiltration in the down-slope areas [Yair and Lavee, 1985; Kirkby, 2002;Gomi et al.,2008]. Runoff reinfiltration has been linked primarily withthe spatial variability of infiltration [Yair and Kossovsky,2002; Cerdan et al., 2004]. Furthermore, variations in thetiming of rainfall and surface runoff play a significant roleaffecting active reinfiltration processes, even in the absenceof spatial variability [Wainwright and Parsons, 2002; van deGiesen et al., 2005; Reaney et al., 2007].[4] Soil erosion also depends on scale. Polynomial tech-
niques have been used to describe and predict overallincreases in soil erosion with slope length [Wischmeier andSmith, 1978], but there is evidence that no single relation-ship exists [Morgan, 1995]. Several studies have evenindicated reductions in soil erosion with length [Evans,1995; Wilcox et al., 2003; Parsons et al., 2006]. Parsonset al. [2004] suggest that the role played by scale willdepend on the degree of sheet and rill erosion.[5] The way in which scale affects slope runoff and soil
erosion is a major ecological issue in water‐restrictedenvironments, because it governs the spatial redistribution ofthe main limiting resources for vegetation (e.g., water,nutrients) [Puigdefábregas and Sánchez, 1996]. For example,vegetation cover in drylands is usually sparse and spatially
1Forest Research Centre, National Institute for Agriculture, FoodResearch and Technology, Madrid, Spain.
2Now at Faculty of Engineering and Built Environment, Universityof Newcastle, Callaghan, New South Wales, Australia.
3Department of Ecology, University of Alcalá, Alcalá de Henares,Spain.
4Department of Ecosystem Science and Management, Texas A&MUniversity, College Station, Texas, USA.
Copyright 2010 by the American Geophysical Union.0043‐1397/10/2009WR007875
WATER RESOURCES RESEARCH, VOL. 46, W04503, doi:10.1029/2009WR007875, 2010
W04503 1 of 12

heterogeneous due to both climatic and edaphic limitations[Deblauwe et al., 2008]; and the maintenance of vegetationcover depends on favorable redistribution of water andsediments [Saco et al., 2007]. At the same time, vegetationdistribution (i.e., the amount and spatial organization ofvegetation cover) strongly influences the pattern and extent ofwater and sediment redistribution [Puigdefábregas, 2005]. Inother words, resources in these systems are efficiently con-trolled by positive feedback mechanisms between water andvegetation [Ludwig et al., 2005].[6] If the distribution of vegetation is altered by distur-
bance and degradation, the effects of scale on hydrologicalprocesses will be altered and, thereby, ecosystem functionwill be affected [Turnbull et al., 2008]. For this reason,Wilcox et al. [2003] hypothesized that the effects of scale onrunoff and erosion will differ greatly depending on the de-gree of disturbance. In undisturbed hillslope systems, onewould expect strong and nonlinear decreases in unit arearunoff and erosion as slope length increases, owing to thespatial redistribution of water and sediments; whereas indisturbed systems, one would expect less pronouncedreductions (or even increases in sediment yield when rillerosion occurs). The loss of soil and water from highlydisturbed systems could enhance the degradation process,limiting vegetation growth and, consequently, increasingwater runoff and soil erosion from the hillslope system[Zehe and Sivapalan, 2009].[7] The objective of this work is to document how the in-
teraction between degradation and scale (plot length) affectsrunoff and sediment yield. We state as a fundamental as-
sumption the above hypothesis ofWilcox et al. [2003], whichposits very different scale effects depending on degradationextent. Our assessment was based on a multiple‐scale runoffand sediment yield data set (field plots measuring 1–15 m inlength) covering a 12 month period. This data set was ob-tained from reclaimed mining slopes of varying degrees ofdegradation in Mediterranean‐dry Spain.
2. Materials and Methods
2.1. Site Description
[8] This work was carried out in the Utrillas field site(Figure 1a), an experimental station located in El Moral, areclaimed coal mine in central eastern Spain (40°47′24″ N,0°49′48″ W, 1100 m). The climate is Mediterranean‐continental, with a mean annual air temperature of 11°C(6.8°C in December and 23.5°C in July); the air frost periodruns from October to April. The local moisture regime canbe classified as Mediterranean‐dry [Papadakis, 1966]. Meanpotential evapotranspiration is 758 mm and annual precipi-tation, most of which occurs in spring and autumn, is466 mm. Especially remarkable in the area is the erosionpotential of some events (late spring and summer rainstormsin particular), the intensities of which occasionally reach100 mm in 24 h [Peña et al., 2002].[9] For this study, five 30 m wide slopes in the reclaimed
mining area were monitored (Figure 1b). These slopes areall north facing and have a rectilinear shape with a slopegradient of 20°. They were restored during 1988–1989 bythe Minas y Ferrocarril de Utrillas S.A. company, through a
Figure 1. Site diagram: (a) regional location, (b) situation of the five experimental slopes in El Moralspoil bank, (c) schematic representation of the experimental layout in a representative slope, (d) Gerlachplots located on slope 5, and (e) microcatchment plot located on slope 1. Abbreviations: G1, 1 m longplot; G2, 2 m long plot; G3, 3 m long plot; MC, 15 m long microcatchment plot; P, pluviometer.
MORENO‐DE LAS HERAS ET AL.: HYDROLOGY OF DEGRADED SLOPES W04503W04503
2 of 12

series of procedures: first, a 100 cm thick layer of over-burden, from the Utrillas cretacic formation of Albian age,was spread over the spoil bank; this overburden has a clay‐loam texture (kaolinitic‐illitic mineralogy) with a basic pH(Table 1) that can be classified as nonsaline and nondis-persive according to Rengasamy et al. [1984]. Next, the soilwas prepared for revegetation by cross‐slope plowing, tocreate a transversal pattern of surface roughness that wouldinhibit rapid overland flow and facilitate water storage.Finally, the slope was sown with a mixture of perennialgrasses and leguminous herbs (Festuca rubra, Festucaarundinacea, Poa pratensis, Lolium perenne, Medicagosativa and Onobrychis viciifolia, nomenclature followingTutin et al. [1964–1980]).[10] In the years following the restoration of these slopes,
degradation has taken place (cover, surface, and soil fea-tures), to varying degrees of intensity. Rill erosion hasaccelerated, mainly because a flawed geomorphologicaldesign has enabled excessive amounts of overland flow to begenerated from upslope water contributing areas of differentlength [Moreno‐de las Heras et al., 2009]. A previous studycarried out on this experimental site [Espigares et al., 2010]found that reduced amounts of plant‐available water (attrib-utable in large part to accelerated drainage via the denselydeveloped rill networks) was mainly responsible for the dif-ferences among the experimental slopes with respect tovegetation development and associated surface conditions.
2.2. Hydrological Measurements
[11] From October 2005 to October 2006, runoff andsediment yield were monitored on the five experimental
slopes. A number of plots, delimited by 20 cm high metallicsheets inserted 10 cm into the soil, were established on eachslope (Figure 1c). In the interrill areas of the slope, three smallGerlach plots were established, each measuring 0.5 m wide:one plot 1 m long (G1), one 2 m long (G2), and one 3 m long(G3). At the downslope end of each plot was a trough,connected to a 50 L drum for storage of runoff (Figure 1d). Inaddition, a microcatchment plot (MC), 15 m long by 3 mwide, was established on each slope to encompass a repre-sentative rill network. At the foot of each microcatchmentplot, two 1.5 m wide metallic collectors were installed; acemented central outlet directly connected to the principal rillfed into these collectors. From the collectors, runoff wasguided through a pipe into two 200 L storage tanks connectedby a ten‐slot runoff divider (Figure 1e).[12] Runoff collected from the plots was manually mea-
sured within a day after each runoff event (runoff‐producingevents occurring within a 24 h period were considered thesame event). During the study, no runoff event exceeded thestorage capacity of the tanks and drums, nor were there anysignificant losses from the tanks attributable to evaporation.The stored runoff was stirred and 1 L samples were taken.Sediment concentrations were estimated by first oven drying(at 105°C) the collected runoff samples and then weighingthe sediment. Precipitation amounts and characteristics weredirectly measured by an automatic recording rain gauge(GroWeather, Davis®) located about 400 m from theexperimental slopes. Total precipitation was also recordedfrom five pluviometers, one located on each experimentalslope (Figure 1c). According to the pluviometer data, spatial
Table 1. Basic Characteristics of the Five Experimental Slopesa
Number ofSamples Slope 1 Slope 2 Slope 3 Slope 4 Slope 5
Date of reclamation 1989 1989 1988 1988 1988Topography
Slope length (m) 55 50 75 75 60Slope width (m) 30 30 30 30 30Slope gradient (°) 20 20 20 20 20Length of water‐contributing area (m) 8.0 8.0 6.5 4.0 0.0Aspect north north north north north
Soil traitsStoninessb (%) 25 22.2 ± 2.2 24.7 ± 3.5 26.2 ± 4.1 25.2 ± 2.6 24.5 ± 3.3Sandb (%) 25 33.6 ± 3.6 33.5 ± 3.7 33.8 ± 3.0 39.9 ± 1.8 36.3 ± 2.7Siltb (%) 25 26.9 ± 2.8 33.8 ± 1.6 30.8 ± 1.8 26.4 ± 2.9 26.6 ± 4.5Clayb (%) 25 39.5 ± 2.2 32.8 ± 2.9 35.4 ± 2.1 33.8 ± 2.1 37.1 ± 2.9Textureb 25 clay loam clay loam clay loam clay loam clay loampH‐H2O; w/v 1/2b 25 8.0 ± 0.1 8.0 ± 0.1 8.0 ± 0.1 8.0 ± 0.1 7.9 ± 0.1EC; w/v 1/2b (dS m−1) 25 0.24 ± 0.13 0.26 ± 0.14 0.20 ± 0.10 0.19 ± 0.03 0.23 ± 0.03CECb (cmol kg−1) 25 29.5 ± 0.9 23.3 ± 3.3 28.3 ± 1.0 26.0 ± 0.5 22.1 ± 3.5ESPb (%) 25 0.68 ± 0.46 0.27 ± 0.11 0.13 ± 0.01 0.12 ± 0.01 0.18 ± 0.03Bulk density (g cm−3) 75 1.51 (a) ± 0.14 1.49 (a) ± 0.12 1.39 (a) ± 0.17 1.39 (a) ± 0.12 1.23 (b) ± 0.17Organic matterb (%) 25 0.58 (a) ± 0.20 0.56 (a) ± 0.23 1.27 (a, b) ± 0.35 1.46 (a, b) ± 0.83 2.00 (b) ± 0.74fcc (mm h−1) 75 11.5 (a, b) ± 6.3 10.1 (a) ± 5.7 20.5 (a, b) ± 7.6 22.7 (b) ± 9.3 36.7 (c) ± 6.9
Surface traitsRoughness indexd 60 1.04 (a) ± 0.01 1.05 (a) ± 0.01 1.10 (a, b) ± 0.01 1.15 (b, c) ± 0.03 1.23 (c) ± 0.01Vegetation cover (%) 150 1.1 (a) ± 2.0 8.2 (a, b) ± 5.5 27.8 (b) ± 9.9 44.3 (b, c) ± 16.2 59.4 (c) ± 20.8
Erosion featuresRill densitye (m m−2) 0.95 0.78 0.58 0.30 0.00
aBasic characteristics include topography, soil, surface traits, and erosion features. Mean ± standard deviation values are shown. Abbreviations: EC,electrical conductivity; w/v, relation weight (soil)/volume (water); CEC, cation exchange capacity; ESP, exchangeable sodium percentage. Values withthe same letters (a, b, or c) within rows do not differ significantly at a = 0.05. Analyzed with Kruskal‐Wallis ANOVA and post hoc Mann‐Whitney U tests.
bData from Moreno‐de las Heras [2009].cFinal infiltration rate from rainfall simulations. Data from Moreno‐de las Heras et al. [2009].dRoughness tortuosity index; following Kamphorst et al. [2000].eLinear rill length (m) per surface area (m2).
MORENO‐DE LAS HERAS ET AL.: HYDROLOGY OF DEGRADED SLOPES W04503W04503
3 of 12

variations in precipitation during the study period werenegligible.
2.3. Soil and Surface Characteristics
[13] For each experimental slope, vegetation cover wasvisually estimated on twenty 0.25 m2 quadrats distributedover the runoff plots (one on the G1 plot; two on the G2plot; three on the G3 plot; and 14 on the MC plot). Vege-tation cover was also measured in ten additional 0.25 m2
quadrats randomly located outside the runoff plots.[14] Soil surface roughness was characterized for each
experimental slope by delineating twelve 1 m long lineartransects in each plot (one for each G1 plot, two for each G2plot, three for each G3 plot, and six for each MC plot). A 1m long pin frame having 50 aligned, mobile needles wasused to transfer the soil microtopography in two dimensionsonto paper, following the methodology of Bochet et al.[2000]. The ratio of the surface profile length of eachtransect to the length of the straight line formed by itsprojection was then used to calculate a simple surfaceroughness tortuosity index [Kamphorst et al., 2000]. Thisindex ranges from a minimum value of 1 for ideal smoothsurfaces to 1.5 for extremely rough soil surfaces.[15] Soil bulk density was determined from fifteen
undisturbed soil cores (3 cm long by 5 cm in diameter)collected from each slope at random. In addition, the totallength of the rills on each slope was measured, by stretchinga tape along the entire rill network. Rill density was sub-sequently calculated as the ratio of the total linear length ofthe network to the surface area of the slope.[16] Two publications were used as sources of additional
information on soil physicochemical characteristics and soilinfiltration capacity [Moreno‐de las Heras, 2009; Moreno‐de las Heras et al., 2009]. Physicochemical soil traitswere determined for each slope from five composite samples(each consisting of six subsamples from the top 10 cm of thesoil profile). The soil sampling procedure was designed toobtain the best possible picture of the soil spatial variabilityon each slope [Moreno‐de las Heras, 2009]. The soilanalyses followed standardized procedures described byMinisterio de Agricultura, Pesca y Alimentación [1994].Finally, soil infiltration capacity was depicted as the finalinfiltration rates (fc) from rainfall simulation experimentscarried out on the five experimental slopes (75 experiments,each at least 30 min long, on 0.24 m2 plots at 63 mm h−1)[Moreno‐de las Heras et al., 2009]. Final infiltration rateswere calculated by fitting the instantaneous infiltration ratesof the rainfall simulations to the Horton‐type functiondescribed by Borselli et al. [1996].
2.4. Statistics
[17] We explored the differences in general surfaceconditions among the five slopes through nonparametricstatistical tests (Kruskal‐Wallis ANOVA and post hocMann‐Whitney U tests). To identify which precipitation eventscaused erosion, cluster analysis was used to group rainfallevents according to their characteristics (depth, I1, I30 andduration). Data from the larger (MC) plots of all experi-mental slopes were averaged to obtain a mean hydrologicalresponse for the study site.[18] Scale effects on runoff and erosion in natural hill-
slopes generally involve changes in slope steepness and
aspect and hence become a two‐dimensional process[Kirkby et al., 2005]. Nevertheless, our experimental layout(field plots in artificial slopes of uniform gradient and as-pect) allows a simplified one‐dimensional analysis based onflow length within the plot scale. Thus, to analyze how plot‐scale influences annual cumulative runoff and sedimentyield for each of the five slopes, the best fitting regressionfunctions for plot length were determined. In addition, dif-ferences in both runoff and sediment yield between plots ofdifferent lengths were analyzed for each experimental slopeby applying Kruskal‐Wallis and Mann‐Whitney U tests. Weused rainfall events grouped as different precipitations types(those previously identified via cluster analysis) as replicates[Lal, 1997].[19] Finally, to analyze how the varying surface condi-
tions of experimental slopes may modify the effects of scale,we carried out a two‐step analysis. First, the spatial con-nectivity of both runoff and sediment flow was determinedas the runoff and sediment yield ratios for pairs of plots withconsecutive sizes: one plot of a certain length versus theconsecutive smaller plot (G2/G1, G3/G2 and MC/G3).These ratios can mean decreasing (values < 1), no scalingeffect (values = 1) or increasing (values > 1) of runoff andsediment yield as plot length increases. Further, we obtainedSpearman’s rank correlation coefficients between runoff andsediment yield ratios and surface characteristics (vegetationcover, surface roughness and rill density). Thus, positiveSpearman’s coefficients identify the surface characteristicswhich could contribute to increase spatial connectivity,while negative values identify those surface characteristicswhich could contribute to reduce the spatial connectivity ofthe flow. Rainfall events were also grouped as differentprecipitation types for this two‐step analysis, in order todetect variations caused by the type of rainfall event.
3. Results
3.1. Surface Conditions
[20] The five experimental slopes represent a gradient ofdegradation associated with the degree of development ofrill networks (Table 1). Two of the slopes (1 and 2) exhibitdense, well‐developed rill networks (rill density > 60 mm−2).On these slopes the soil surface is bare or sparsely covered(total cover < 10%) and has lost most of its original rough-ness. The soils of these highly degraded slopes have a mas-sive and very dense (approximately 1.50 g cm−3) structureand very low organic matter content (approximately 0.50%),making their infiltration capacity rather low (fc < 15 mm h−1).In contrast, slope 4 has a discontinuous and poorly developedrill network (0.30 m m−2), and slope 5 is devoid of rills.Slopes 4 and 5 also have more cover (45–60% total cover,although spatially heterogeneous), and retain their originalsurface roughness. The soils of slopes 4 and 5 have a lowerbulk density (1.23–1.39 g cm−3) and higher infiltrationcapacity (fc: 23–37 mm h−1), influenced by the presenceof herbaceous roots and higher amounts of organic matter(1.5–2.0%). Considering the conditions represented by thehighly eroded versus the most vegetated slopes (slopes 1 and2 versus slopes 4 and 5), slope 3 represents a transitionalposition in the degradation gradient.
MORENO‐DE LAS HERAS ET AL.: HYDROLOGY OF DEGRADED SLOPES W04503W04503
4 of 12

3.2. Categories of Precipitation Events
[21] Total rainfall during the 2005–2006 hydrologic yearwas 615 mm, about 32% above the annual average. About30% of rainfall events produced runoff, but most of therunoff and erosion was generated by relatively few events(Table 2). Three categories of runoff‐producing rainfallevents were identified: (1) low‐intensity rains occasioned bynonactive Atlantic fronts, beginning in the autumn andlasting until the early spring (these rains were the mostcommon); (2) more intense events caused by active Atlanticfronts, occurring during the same period (these rainfallevents were an important source of runoff, responsible forabout 38% of the annual total); and (3) high‐intensity con-vective thunderstorms, occurring during late spring andsummer (these events produced 58% of the runoff and 76%of the erosion).
3.3. Runoff
[22] Runoff displayed great variability, both among andwithin the five experimental slopes (Table 3). Variabilityamong the slopes was related to the extent of degradation,and these differences increased with scale (plot length): forthe G1 plot on the most densely rilled slope (slope 1), runoffwas 1.4 times higher than that of the G1 plot on the mostvegetated slope (slope 5); for the G2, G3 and MC plots,runoff amounts from slope 1 were 3.2, 3.8 and 4.9 timeshigher than those from slope 5, respectively.[23] The relationship between plot length and runoff
variability among the slopes reveals a pronounced effect ofscale within each slope: unit area runoff declined as plotlength increased (Table 3). Nevertheless, the magnitude ofthis decline varied greatly depending on slope conditions(Figure 2a). Indeed, the decline in runoff was more sensitive
Table 2. Summary of the Different Categories of Precipitation and Average Runoff and Sediment Yield Responses at the Utrillas FieldSite for the 2005–2006 Hydrologic Yeara
Number ofEvents
Precipitation (mm) I30 (mm h−1) Duration (h) Runoff (mm) Sediment Yield (g m−2)
Mean SD CA Percent Mean SD Mean SD Mean SD CA Percent Mean SD CA Percent
Nonerosive 56 0.5 0.5 26 4 0.6 0.5 0.5 0.5 0.0 0.0 0 0 0 0 0 0Nonactive Atlantic fronts 11 9.8 5.3 108 18 2.6 1.3 5.3 3.8 0.4 0.6 4 4 4 10 43 1Active Atlantic fronts 8 34.7 27.2 277 45 9.5 2.6 14.3 16.6 4.2 6.8 34 38 144 420 1157 23Convective thunderstorms 4 50.9 15.5 204 33 30.2 16.4 15.8 8.5 12.8 10.3 51 58 947 1227 3786 76Total 79 615 100 89 100 4986 100
aAveraged from MC plots: 3 × 15 m microcatchments on all slopes for each event. Abbreviations: SD, standard deviation; CA, cumulative amount;Percent, relative percentage amount.
Table 3. Annual Cumulative Amounts of Runoff, Sediment Yield and Runoff Coefficient for the 2005–2006 Hydrologic Yeara
Cumulated Runoff (mm) Annual Runoff Coefficient (%) Cumulated Sediment Yield (g/m2)
Slope 1G1 181 30 5218G2 159 26 5219G3 138 22 6207MC 132 21 12161Mean ± SD 153 ± 22 25 ± 4 7201 ± 3339
Slope 2G1 161 26 5264G2 143 23 5127G3 128 21 6495MC 129 21 8061Mean ± SD 140 ± 16 23 ± 3 6237 ± 1363
Slope 3G1 144 23 2824G2 117 19 2654G3 102 17 2762MC 98 16 3270Mean ± SD 115 ± 21 19 ± 3 2653 ± 201
Slope 4G1 128 21 2018G2 65 11 1515G3 59 10 1162MC 57 9 1217Mean ± SD 77 ± 34 13 ± 6 1478 ± 392
Slope 5G1 132 22 1261G2 50 8 427G3 37 6 279MC 27 4 228Mean ± SD 62 ± 48 10 ± 8 549 ± 482
aAbbreviations: G1, 1 m long plot; G2, 2 m long plot; G3, 3 m long plot; MC, 15 m long microcatchment plot; SD, standard deviation.
MORENO‐DE LAS HERAS ET AL.: HYDROLOGY OF DEGRADED SLOPES W04503W04503
5 of 12

to plot length at the most vegetated slopes (a reduction of55–79% for slopes 4 and 5) than at the most degraded ones(a reduction of 20–32% for slopes 1, 2, and 3).[24] The effect of scale on runoff also varied with pre-
cipitation category (Figure 3). In the case of low‐intensity,nonactive Atlantic front events, unit area runoff differedsignificantly with plot length (Figure 3a). In contrast, theeffect of plot length on runoff was less pronounced underboth active Atlantic front events and convective thunder-storms (Figures 3b and 3c). For these two categories, theeffect was significant only in the case of slope 5, the non-rilled and most vegetated slope.[25] The analysis of the spatial connectivity of runoff
showed that the influence of surface conditions on scale ef-fects varied depending on the category of precipitation event(Table 4). For both nonactive and active Atlantic events, thedifferences in the degree of degradation of surface featuresamong the experimental slopes played a significant role onlyat the smallest scales (the transition between G1 and G2plots), at which increased vegetation cover and surfaceroughness correlated with decreased runoff connectivity. Forhigh‐intensity convective storms, this correlation was alsoobserved, and, in general, was even more pronounced, at thelarger scales. For example, increased vegetation cover andsurface roughness were correlated with decreased runoffconnectivity at the transition between the G3 andMC plots. Itis noteworthy that at this large scale, increased rill densitystrongly correlated with increased runoff connectivity underhigh‐intensity storms.
3.4. Erosion
[26] Erosion was also highly variable among and withinslopes (Table 3). Annual sediment yield from the most de-graded slope (slope 1) was 4 to 53 times higher than fromthe most vegetated slope (slope 5), a difference that becomeslarger with increasing scale from the G1 to the MC plots(Table 3). Indeed, the degree to which plot length affectedsediment yield varied depending on the extent of degrada-tion (Figure 2b). For highly degraded slopes (slopes 1 and 2)sediment yield increased substantially with plot length; thelargest amounts came from the longest plots (15 m long MC
plots), directly influenced by continuous rill networks (rilldensity > 0.60 m m−2). In the case of the most severelydegraded slope (slope 1), sediment yield from the MC plotwas 133% greater than that from the G1 plot. The oppositerelationship was found for the less degraded slopes (slopes 4and 5), where rill networks are discontinuous or even absent(rill density: 0.00–0.30 m m−2), and sediment is depositedbetween rills and in microtopographical depressions (gener-ated by cross‐slope plowing) in which vegetation is denselydeveloped. On these two slopes, sediment yield from the MCplots was 39% to 81% lower than that from the G1 plots.[27] The effect of scale on erosion varied with category of
precipitation event depending on the degree of degradation(Figure 4). For the least degraded slope (slope 5), sedimentyield declined as plot length increased, irrespective of thecategory of precipitation. Conversely, for the most degradedslope (slope 1), sediment yield did not show clear trendswith respect to plot length for both nonactive and activeAtlantic events, but it increased significantly with plotlength under high‐intensity convective storms.[28] The influence of surface conditions on the connec-
tivity of the sediment fluxes also varied with category ofprecipitation event (Table 4). For nonactive Atlantic events,a decline in the continuity of sediment yield was correlatedwith increasing vegetation cover and soil roughness at thesmallest scales (the transition between G1 and G2 plots). Forthe other types of precipitations (active Atlantic and con-vective events), the influence of these two factors (vegeta-tion cover and surface roughness) on the connectivity ofsediment fluxes was stronger and also relevant at largerscales. In fact, for active Atlantic events, increased vegeta-tion cover and surface roughness were correlated withdecreased continuity of sediment yield at both small andintermediate scales (the transitions between G1 and G2 plotsand between G2 and G3 plots). For convective precipitationevents these relationships were observed even at the largestscales (the transition between G3 and MC plots). In addi-tion, for these high‐intensity convective precipitations therill density strongly affected the connectivity of sedimentfluxes: increased rill density was strongly correlated with
Figure 2. Relationship between scale (plot length) and annual cumulative amounts of (a) runoff and(b) sediment yield.
MORENO‐DE LAS HERAS ET AL.: HYDROLOGY OF DEGRADED SLOPES W04503W04503
6 of 12

increased continuity of sediment yield at the largest scales(the transition between G3 and MC plots).
4. Discussion
4.1. Runoff
[29] As was hypothesized by Wilcox et al. [2003], our re-sults showed that unit area runoff is much less sensitive to plotlength under degraded conditions: for the most degradedslopes (1, 2, and 3), unit area runoff from the 15 m long plots(MC) showed a 20–32% decrease compared with the 1 mlong plots (G1), whereas for the less degraded slopes (4 and
5), the corresponding decrease was 55–79% (Table 3). Thesefindings are consistent with previous results obtained in thisMediterranean‐dry study area: under bare and rilled condi-tions, unit area runoff from 35m long plots showed a 26–35%decrease compared with 1.5–3.0 m long plots, whereas undervegetated conditions the corresponding decrease was 66%[Nicolau, 2002]. Similar trends (less sensitivity to scale underdegraded conditions) were reported in subhumid regions ofWest Africa: under bare and crusted conditions, unit arearunoff showed a 40% decrease in 12 m long plots, comparedwith 1.25 m long plots, whereas an 80% decrease wasobserved under vegetated conditions [van de Giesen et al.,2000].[30] Reductions in unit area runoff can be attributed to
both spatial variability of soil infiltration and temporal
Figure 3. Mean runoff generated from the different plots by runoff‐producing events of the various pre-cipitation categories: (a) nonactive Atlantic front, 11 events; (b) active Atlantic front, 8 events; and(c) convective thunderstorm, 4 events. For comparison, corresponding mean precipitation amounts areshown on the left‐hand side. Bars with the same letters (a or b) within slopes do not differ significantlyat a = 0.05. Runoff was analyzed using nonparametric Kruskal‐Wallis and post hocMann‐Whitney U tests.Detailed information on the three most typical runoff events for each precipitation category is available inthe auxiliary material.1
1Auxiliary materials are available at ftp://ftp.agu.org/apend/wr/2009wr007875.
MORENO‐DE LAS HERAS ET AL.: HYDROLOGY OF DEGRADED SLOPES W04503W04503
7 of 12
runoff dynamics [Wainwright and Parsons, 2002; Yair andRaz‐Yassif, 2004; Boix‐Fayos et al., 2007]. The residencetime of overland flow on each slope (time required formovement from top to bottom) plays a central role in theefficiency of the process, controlling the time that surfacerunoff has to recharge soil water stores as it moves down theslope [Tongway and Ludwig, 2001; Joel et al., 2002; van deGiesen et al., 2005]. The extent of degradation of the veg-etation strongly influences the capacity of slope systems toslow, retain, and store overland flow. In fact, in the case ofthe most degraded slopes in our study (1, 2, and 3), thescarce vegetation cover (less than 30%) meant that surfacecrusts were well developed, limiting soil infiltration capacityand hence point infiltration [Moreno‐de las Heras et al.,2009]. Even more interestingly, the residence time ofoverland flow on slopes like these is much shorter (owing tothe inability of the scant vegetation to intercept and slowdown the flow), which greatly reduces the efficiency ofrunoff reinfiltration as the flow moves down the slope.[31] Microtopographical alterations caused by accelerated
erosion (the development of rill networks and reduction ofsurface roughness) also play an important role in runoffreinfiltration processes, by limiting the residence time offlow on the slope. Those experimental slopes that had well‐developed rill networks and rather limited surface roughness(slopes 1, 2 and 3) showed a low reinfiltration efficiency. Alack of surface roughness offers little resistance to flow, thusseverely restricting surface storage [Stomph et al., 2002]. Inaddition, the presence of dense rill networks increases runoffconnectivity; the rills route the flow throughout the slopevery efficiently [Nicolau, 2002; Bracken and Croke, 2007].[32] The low efficiency of runoff reinfiltration processes
under degraded conditions was particularly noticeable forthose categories of precipitation producing the most runoff(Figure 3). For low‐intensity precipitation events (nonactive
Atlantic front events), unit area runoff was scale‐dependentfor all five experimental slopes. For these small precipitationevents, reinfiltration processes on the most degraded slopesare probably linked to spatial variations in soil infiltrationcapacity, governed by the presence of cracks or macroporeson the soil surface and differences in soil physical proper-ties. These spatial variations could provide some opportu-nities for the infiltration of runoff in areas with unsatisfiedinfiltration demand, especially as the spatial scale of theslope increases. In contrast, for those precipitation catego-ries that are the most important sources of runoff (activeAtlantic front events and convective storms), scale depen-dency was observed only at the most vegetated slope (slope5). In fact, higher vegetation cover and soil roughness bothcontributed to reduce the spatial connectivity of runoffproduced by these more intense events between the differentscales monitored (Table 4). Similarly, other studies havehighlighted a prevailing role of vegetation cover and surfaceroughness, which actively increase the residence time ofrunoff on the slope, for the reductions in unit area runoffwith increasing scale under long and/or intense rainfalls[van de Giesen et al., 2000, 2005]. The degraded slopesshowed a remarkable inability to store and delay runoffwhen convective thunderstorms produced large amounts ofoverland flow. Under these high‐intensity precipitationevents, rill networks were the dominant modifiers of theeffects of scale, increasing the spatial connectivity of runoffat large scales (Table 4).
4.2. Erosion
[33] The effects of scale (plot length) on erosion varieddramatically with degradation level (Figure 2b). For thehighly degraded slopes (slopes 1 and 2), annual sedimentyield increased noticeably with plot length, showing an in-
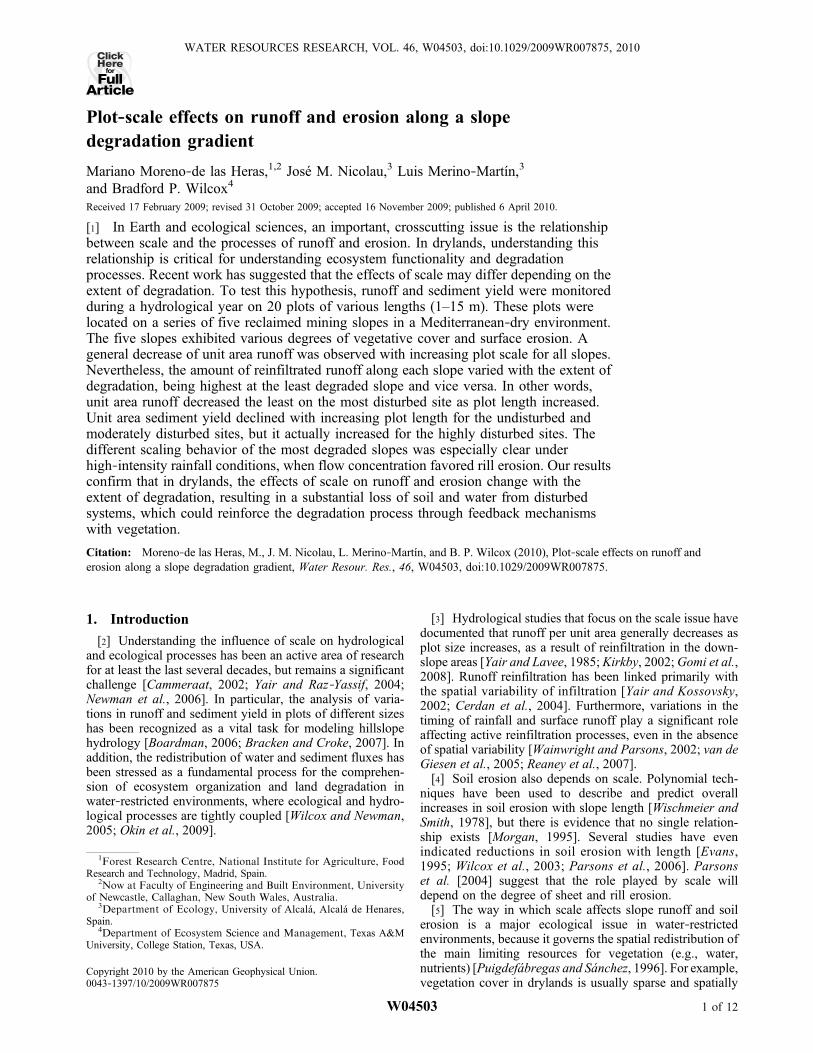
Table 4. Spearman’s Rank Correlation Coefficient Between the Spatial Connectivity of Both Runoff and Sediment Flow and SurfaceTraits for Runoff Events Produced Under the Three Precipitation Categoriesa
Vegetation Cover Roughness Index Rill Density
Nonactive Atlantic Front Event (N = 11)G2/G1 runoff ratio −0.38** −0.33* NAG3/G2 runoff ratio −0.22 −0.22 NAMC/G3 runoff ratio 0.03 0.24 −0.05G2/G1 sediment yield ratio −0.48** −0.47** NAG3/G2 sediment yield ratio −0.27* −0.24 NAMC/G3 sediment yield ratio 0.07 −0.01 −0.08
Active Atlantic Front Event (N = 8)G2/G1 runoff ratio −0.73** −0.72** NAG3/G2 runoff ratio −0.25 −0.22 NAMC/G3 runoff ratio 0.06 0.21 −0.03G2/G1 sediment yield ratio −0.69** −0.68** NAG3/G2 sediment yield ratio −0.41** −0.40** NAMC/G3 sediment yield ratio −0.20 −0.14 0.18
Convective Thunderstorm (N = 4)G2/G1 runoff ratio −0.92** −0.93** NAG3/G2 runoff ratio −0.37 −0.38 NAMC/G3 runoff ratio −0.58** −0.50* 0.64**G2/G1 sediment yield ratio −0.60** −0.63** NAG3/G2 sediment yield ratio −0.62** −0.61** NAMC/G3 sediment yield ratio −0.68** −0.60** 0.73**
aThe spatial connectivity of both runoff and sediment yield is depicted as the runoff and sediment yield ratios for pairs of plots with consecutive sizes.Surface traits include vegetation cover, surface roughness, and rill density. Abbreviations: N, number of events; G1, 1 m long plot; G2, 2 m long plot;G3, 3 m long plot; MC, 15 m long microcatchment plot; NA, not applicable. Significance: *, significant at a = 0.05; **, significant at a = 0.01.
MORENO‐DE LAS HERAS ET AL.: HYDROLOGY OF DEGRADED SLOPES W04503W04503
8 of 12

crease of 130% from the 15 m long plot (MC) comparedwith the 1 m long plot (G1) in the most severe case. Theseincreases were due mainly to erosion caused by concentra-tion of runoff in rill networks. Conversely, for the mostvegetated slopes (4 and 5), sediment yield decreased withplot length. The main process involved in sediment deliveryalong these vegetated slopes was sheet erosion, as therewere no rills (slope 5) or only poorly developed and dis-continuous rills (slope 4), allowing sediments to be retainedwithin the slope.[34] Such positive effects of scale on erosion rates have
generally been attributed to rill erosion processes [Fosteret al., 1977; Loch, 1996; Parsons et al., 2004]. In the ab-sence of rill erosion, sediment yield frequently shows no scaledependency; occasionally, it may even show a decrease withincreasing scale [Parsons et al., 1993; Wilcox et al., 2003;
Parsons et al., 2006]. This kind of scale‐dependent sedimentredistribution process has been commonly observed in lowgradient (usually < 12°) undisturbed hillslopes, where the lossof overland flow by downslope runoff reinfiltration limits theentrainment and travel distances of eroded particles. Ourresults provide empirical evidence that such scale‐dependentsediment and runoff redistribution processes can also be quiteactive on steeper slopes (20° gradient) under sheet flowconditions.[35] Precipitation category dramatically affected the scale
relationships of erosion as well. For all five slopes therelationships observed between annual cumulative sedimentyield and plot length reflected, in general, the pattern observedfor the most intense precipitation events, especially thesummer thunderstorms. Nevertheless, in the case of themost degraded slope (slope 1), the observed trend under these
Figure 4. Mean sediment yield generated from the different plots by runoff‐producing events of the var-ious precipitation categories: (a) nonactive Atlantic front, 11 events; (b) active Atlantic front, 8 events;and (c) convective thunderstorm, 4 events. Bars with the same letters (a or b) within slopes do not differsignificantly at a = 0.05. Sediment yield was analyzed using nonparametric Kruskal‐Wallis and post hocMann‐Whitney U tests. Detailed information on the three most typical runoff events for each precipitationcategory is available in the auxiliary material.
MORENO‐DE LAS HERAS ET AL.: HYDROLOGY OF DEGRADED SLOPES W04503W04503
9 of 12
high‐intensity storms (a general increase of soil erosion rateswith plot length) disappeared under the low‐intensity non-active Atlantic front events. In addition, the trend found fornonactive Atlantic events in slope 3 (a general decrease oferosion rates with increasing plot length) disappeared undermore intense precipitations. These trends are coherent withprevious evidences which suggested that the influence of plotlength on erosion rates could depend on rainfall character-istics [Kinnell, 2009].[36] The variable scaling behavior of the most degraded
slopes under different precipitation categories can be ex-plained by a transition from interrill to rill dominated pro-cesses with increasing rainfall intensity. In fact, rills stronglyruled the routing of overland flow by increasing the spatialconnectivity of water runoff under high‐intensity convectiveprecipitations. Flow concentration in these situations led toan enhanced contribution and spatial continuity of sedimentyield at large scales (Table 4), and consequently, to highererosion rates with increasing plot length (Figure 4c). Con-versely, the negative influence of vegetation and surfaceroughness on runoff connectivity under high‐intensity pre-cipitations (Table 4), inhibited flow concentration and theresulting transition from sheet flow conditions to rill dom-inated processes in the most vegetated slope (slope 5). Thisallowed the preservation of active sediment redistributionprocesses (i.e., a reduction in sediment yield with increasingplot length) in this slope even under high‐intensity stormconditions (Figure 4c). Liu et al. [2000] reported that therelative contribution of rill processes to total erosion ishighly dependent on rainfall intensity, with important con-sequences in scaling outcomes; which also supports ourfinding that the influence of plot length on soil erosionvaries greatly with precipitation characteristics.
4.3. Overall Influence of Degradation
[37] The overall results of this study are consistent with theconclusions reached by Wilcox et al. [2003] regarding theinfluence of degradation on the scale dependency of runoffand erosion processes. Indeed, under degraded conditionssurface runoff reinfiltration in the downslope direction wasseverely constrained. The effect of plot scale on unit arearunoff was particularly limited when the amount of surfacerunoff generated was large (produced by active Atlanticevents and convective storms, Figure 3). At the same time,soil erosion rates under degraded conditions tended to in-crease with increasing plot scale under degraded conditions(Figure 4), as a consequence of rill erosion processes beinginitiated by high‐intensity convective storms (these eventsproduced over 70% of annual cumulative soil erosion). Thesetrends were particularly marked in highly degraded slopes(slopes 1 and 2), where hydrological responses were condi-tioned by dense rill networks (rill density > 0.60 m m−2).[38] On the whole, degraded conditions led to a sub-
stantial loss of resources (water and soil) from the slopesystem. These results contribute to our understanding ofdegradation processes in drylands, as similar mechanismsmay operate in disturbed, water‐restricted hillslope systems.In fact, there is now ample evidence that the drastic alter-ation of vegetation cover and distribution prompted bysevere disturbance (e.g., overgrazing, fire, extreme drought)is associated with the loss of soil and water resources fromhillslope systems, owing to a decrease in the efficiency ofsurface runoff reinfiltration and the active contribution of
rill and gully erosion [Wilcox et al., 1996; Puigdefábregas,1998]. These losses (specifically, the net loss of waterresources from hillslope systems) could play an important rolein ecosystem function, reinforcing the degradation processthrough feedback mechanisms with vegetation [Davenportet al., 1998; Sarah, 2004; Turnbull et al., 2008]. Indeed,water losses caused by the degradation of vegetation and theacceleration of soil erosion processes could greatly reducewater availability for plant growth, lowering plant productionand cover further and thereby increasing overland flow runoffand erosion [Wilcox et al., 2003; Zehe and Sivapalan, 2009;Espigares et al., 2010].
5. Conclusions
[39] Through this study, we have obtained empiricalevidence supporting the hypothesis of Wilcox et al. [2003],that effects of scale on hillslope runoff and erosion aresubstantially altered by degradation processes. In fact, wefound that the efficiency of surface runoff reinfiltration inthe downslope direction decreases as degradation increases,leading to more continuous flows along the hillslope. Sim-ilarly, the effects of scale on erosion (sediment yield), areconsiderably modified by degradation processes: for highlydegraded (densely rilled) slopes, the tendency of erosiondecreasing with plot length is reversed (unit area sedimentyield actually increases with plot length). In addition, thisreversal of scale effects for the most degraded slopes isespecially pronounced under high‐intensity precipitationconditions. Active rilling processes that result from largeamounts of runoff on poorly vegetated slopes impede theability of the slopes to slow, retain, and store water andsediments. The overall effect of degradation processes onrelationships between scale and runoff and erosion is asubstantial loss of water and soil resources from the slope.The results of this study contribute to our understanding ofdegradation processes in water‐restricted environments,showing that the loss of water resources due to degradationof vegetation (both extent and distribution of coverage)could have important repercussions on ecosystem function,probably even reinforcing the degradation process.
[40] Acknowledgments. The authors would like to thank Núria Sauand Carlos Ontiveros for field assistance and the Utrillas Council for logis-tic cooperation. An earlier version of this manuscript benefited from thehelpful comments of Graham Sander and three anonymous referees. Thisresearch was supported by CICYT projects REAM (CGL2004‐00355/BOS) and INTERBOS03 (CGL2008‐04503‐C03‐03/BOS) from the Span-ish government, as well as the REMEDINAL research network.
ReferencesBoardman, J. (2006), Soil erosion science: Reflections on the limitationsof current approaches, Catena, 68, 73–86, doi:10.1016/j.catena.2006.03.007.
Bochet, E., J. Poesen, and J. L. Rubio (2000), Mound development as aninteraction of individual plants with soil, water erosion and sedimenta-tion processes on slopes, Earth Surf. Processes Landforms, 25, 847–867, doi:10.1002/1096-9837(200008)25:8<847::AID-ESP103>3.0.CO;2-Q.
Boix‐Fayos, C., M. Martínez‐Mena, A. Calvo‐Cases, E. Arnau‐Rosalén,J. Alvadalejo, and V. Castillo (2007), Causes and underlying processesof measurement variability in field erosion plots in Mediterranean con-ditions, Earth Surf. Processes Landforms, 32, 85–101, doi:10.1002/esp.1382.
Borselli, L., S. Carnicelli, G. A. Ferrari, M. Pagliai, and G. Lucamante(1996), Effects of gypsum on hydrological, mechanical and porosity
MORENO‐DE LAS HERAS ET AL.: HYDROLOGY OF DEGRADED SLOPES W04503W04503
10 of 12

properties of a kaolinitic crusting soil, Soil Technol., 9, 39–54,doi:10.1016/0933-3630(95)00034-8.
Bracken, L. J., and J. Croke (2007), The concept of hydrological connec-tivity and its contribution to understanding runoff‐dominated geomor-phic systems, Hydrol. Processes, 21, 1749–1763, doi:10.1002/hyp.6313.
Cammeraat, L. H. (2002), A review of two strongly contrasting geomor-phological systems within the context of scale, Earth Surf. ProcessesLandforms, 27, 1201–1222, doi:10.1002/esp.421.
Cerdan, O., Y. Le Bissonnais, G. Govers, V. Lecomte, K. van Oost,A. Couturier, C. King, and N. Dubreuil (2004), Scale effect on runofffrom experimental plots to catchments in agricultural areas in Normandy,J. Hydrol., 299, 4–14, doi:10.1016/j.jhydrol.2004.02.017.
Davenport, D. W., D. D. Breshears, B. P. Wilcox, and C. D. Allen (1998),Viewpoint: Sustainability of piñon‐juniper ecosystems—A unifying per-spective of soil erosion thresholds, J. Range Manage., 51, 231–240,doi:10.2307/4003212.
Deblauwe, V., N. Barbier, P. Couteron, O. Lejeune, and J. Bogaert (2008),The global biogeography of semi‐arid periodic vegetation patterns,Global Ecol. Biogeogr., 17, 715–723, doi:10.1111/j.1466-8238.2008.00413.x.
Espigares, T., M. Moreno‐de las Heras, and J. M. Nicolau (2010), Perfor-mance of vegetation in reclaimed slopes affected by soil erosion, Restor.Ecol., doi:10.1111/j.1526-100X.2009.00546.x, in press.
Evans, R. (1995), Some methods of directly assessing water erosion of cul-tivated land: A comparison of measurements made on plots and in fields,Prog. Phys. Geogr., 19, 115–129, doi:10.1177/030913339501900106.
Foster, G. R., L. D. Meyer, and C. A. Onstad (1977), A runoff erosivityfactor and variable slope length exponents for soil loss estimates, Trans.ASAE, 20, 683–687.
Gomi, T., R. C. Sidle, S. Miyata, K. Kosugi, and Y. Onda (2008), Dynamicrunoff connectivity of overland flow on steep forested hillslopes: Scaleeffects and runoff transfer, Water Resour. Res., 44 , W08411,doi:10.1029/2007WR005894.
Joel, A., I. Messing, O. Seguel, and M. Casanova (2002), Measurement ofsurface water runoff from plots of two different sizes, Hydrol. Processes,16, 1467–1478, doi:10.1002/hyp.356.
Kamphorst, E. C., V. Jetten, J. Guerif, J. Pitkanen, B. V. Iversen, J. T. Douglas,and A. Paz (2000), Predicting depressional storage from soil surface rough-ness, Soil Sci. Soc. Am. J., 64, 1749–1758.
Kinnell, P. I. A. (2009), The impact of slope length on the discharge of sed-iment by rain impact induced saltation and suspension, Earth Surf. Pro-cesses Landforms, 34, 1393–1407, doi:10.1002/esp.1828.
Kirkby, M. J. (2002), Modelling the interactions between soil surfaceproperties and water erosion, Catena, 46, 89–102, doi:10.1016/S0341-8162(01)00160-6.
Kirkby, M. J., L. J. Bracken, and J. Shannon (2005), The influence ofrainfall distribution and morphological factors on runoff delivery fromdryland catchments in SE Spain, Catena, 62, 136–159, doi:10.1016/j.catena.2005.05.002.
Lal, R. (1997), Soil degradative effects of slope length and tillage methodson alfisols in western Nigeria. I. Runoff, erosion and crop response, LandDegrad. Dev., 8, 201–219.
Liu, B. Y., M. A. Nearing, P. J. Shi, and Z. W. Jia (2000), Slope lengtheffects on soil loss for steep slopes, Soil Sci. Soc. Am. J., 64, 1759–1763.
Loch, R. (1996), Using rill/interrill comparisons to infer likely responses oferosion to slope length: Implications for land management, Aust. J. SoilRes., 34, 489–502, doi:10.1071/SR9960489.
Ludwig, J. A., B. P. Wilcox, D. D. Breshears, D. J. Tongway, and A. I.Imeson (2005), Vegetation patches and runoff‐erosion as interacting eco-hydrological processes in semiarid landscapes, Ecology, 86, 288–297,doi:10.1890/03-0569.
Ministerio de Agricultura, Pesca y Alimentación (1994), Métodos Oficialesde Análisis, Tomo III, Secr. General de Alimentacion, Dir. General dePolit. Aliment., Minist. de Agric., Pesca y Aliment., Madrid.
Moreno‐de las Heras, M. (2009), Development of soil physical structureand biological functionality in mining spoils affected by soil erosion ina Mediterranean‐continental environment, Geoderma, 149, 249–256,doi:10.1016/j.geoderma.2008.12.003.
Moreno‐de las Heras, M., L. Merino‐Martín, and J. M. Nicolau (2009),Effect of vegetation cover on the hydrology of reclaimed mining soilsunder Mediterranean‐continental climate, Catena , 77 , 39–47,doi:10.1016/j.catena.2008.12.005.
Morgan, R. P. C. (1995), Factors influencing erosion, in Soil Erosion andConservation, edited by R. P. C. Morgan, pp. 26–39, Longman, Essex,U. K.
Newman, B. D., B. P. Wilcox, S. R. Archer, D. D. Breshears, C. N. Dahm,C. J. Duffy, N. G. McDowell, F. M. Phillips, B. R. Scanlon, and E. R.Vivoni (2006), Ecohydrology of water‐limited environments: A scientificvision, Water Resour. Res., 42, W06302, doi:10.1029/2005WR004141.
Nicolau, J. M. (2002), Runoff generation and routing on artificial slopes ina Mediterranean‐continental environment: The Teruel coalfield, Spain,Hydrol. Processes, 16, 631–647, doi:10.1002/hyp.308.
Okin, G. S., A. J. Parsons, J. Wainwright, J. E. Herrick, B. T. Bestelmeyer,D. C. Petaers, and E. L. Fredrickson (2009), Do changes in connectivityexplain desertification?, BioScience, 59, 237–244, doi:10.1525/bio.2009.59.3.8.
Papadakis, J. (1966), Climates of the World and Their Agricultural Poten-tialities, published by the author, Buenos Aires.
Parsons, A. J., J. Wainwright, and A. D. Abrahams (1993), Tracingsediment movement in interrill overland flow on a semi‐arid grasslandhillslope using magnetic susceptibility, Earth Surf. Processes Landforms,18, 721–732, doi:10.1002/esp.3290180806.
Parsons, A. J., J. Wainwright, D. M. Powell, J. Kaduk, and R. E. Brazier(2004), A conceptual model for determining soil erosion by water, EarthSurf. Processes Landforms, 29, 1293–1302, doi:10.1002/esp.1096.
Parsons, A. J., R. E. Brazier, J. Wainwright, and D. M. Powell (2006),Scale relationships in hillslope runoff and erosion, Earth Surf. ProcessesLandforms, 31, 1384–1393, doi:10.1002/esp.1345.
Peña, J. L., J. M. Cuadrat, and M. Sánchez (2002), El Clima de la Provin-cia de Teruel, Inst. de Estud. Turolenses, Diputacion Prov. de Teruel,Teruel, Spain.
Puigdefábregas, J. (1998), Ecological impacts of global change on drylandsand their implications for desertification, Land Degrad. Dev., 9, 393–406, doi:10.1002/(SICI)1099-145X(199809/10)9:5<393::AID-LDR301>3.0.CO;2-F.
Puigdefábregas, J. (2005), The role of vegetation patterns in structuringrunoff and sediment fluxes in drylands, Earth Surf. Processes Land-forms, 30, 133–147, doi:10.1002/esp.1181.
Puigdefábregas, J., and G. Sánchez (1996), Geomorphological implicationsof vegetation patchiness on semi‐arid slopes, in Advances in HillslopeProcesses, edited by M. G. Anderson and S. M. Brooks, pp. 1027–1059, John Wiley, Chichester, U. K.
Reaney, S. M., L. J. Bracken, and M. J. Kirkby (2007), Use of the connec-tivity of runoff model (CRUM) to investigate the influence of stormcharacteristics on runoff generation and connectivity in semi‐arid areas,Hydrol. Processes, 21, 894–906, doi:10.1002/hyp.6281.
Rengasamy, P., R. S. B. Greene, and G. W. Ford (1984), Identification ofdispersive behaviour and the management of red‐brown earths, Aust. J.Soil Res., 22, 413–431, doi:10.1071/SR9840413.
Saco, P. M., G. R. Willgoose, and G. R. Hancock (2007), Eco‐geomorphol-ogy of banded vegetation patterns in arid and semi‐arid regions, Hydrol.Earth Syst. Sci., 11, 1717–1730.
Sarah, P. (2004), Nonlinearity of ecogeomorphic processes alongMediterranean‐arid transect, Geomorphology, 60, 303–317, doi:10.1016/j.geomorph.2003.09.019.
Stomph, T. J., N. de Ridder, T. S. Steenhuis, and N. C. van de Giesen(2002), Scale effects of Hortonian overland flow and rainfall‐runoffdynamics: Laboratory validation of a process‐based model, Earth Surf.Processes Landforms, 27, 847–855, doi:10.1002/esp.356.
Tongway, D. J., and J. A. Ludwig (2001), Theories on the origins, mainte-nance, dynamics and functioning of banded landscapes, in BandedVegetation Pattering in Arid and Semiarid Environments: EcologicalProcesses and Consequences for Management, edited by D. J. Tongway,C. Valentin, and J. Segheri, pp. 20–31, Springer, New York.
Turnbull, L., J. Wainwright, and R. E. Brazier (2008), A conceptual frame-work for understanding semi‐arid land degradation: Ecohydrologicalinteractions across multiple‐space and time scales, Ecohydrology, 1,23–34.
Tutin, T. G., V. H. Heywood, S. M. Walters, and D. A. Webb (1964–1980),Flora Europaea, 5 vols., Cambridge Univ. Press, Cambridge, U. K.
van de Giesen, N. C., T. J. Stomph, and N. de Ridder (2000), Scale effectsof Hortonian overland and rainfall‐runoff dynamics in a West Africancatena landscape, Hydrol. Processes, 14, 165–175, doi:10.1002/(SICI)1099-1085(200001)14:1<165::AID-HYP920>3.0.CO;2-1.
van de Giesen, N. C., T. J. Stomph, and N. de Ridder (2005), Surface run-off scale effects in West African watersheds: Modelling and managementoptions, Agric. Water Manage., 72, 109–130, doi:10.1016/j.agwat.2004.09.007.
Wainwright, J., and A. J. Parsons (2002), The effect of temporal variationsin rainfall on scale dependency in runoff coefficients, Water Resour.Res., 38(12), 1271, doi:10.1029/2000WR000188.
MORENO‐DE LAS HERAS ET AL.: HYDROLOGY OF DEGRADED SLOPES W04503W04503
11 of 12

Wilcox, B. P., and B. D. Newman (2005), Ecohydrology of semiarid land-scapes, Ecology, 86, 275–276, doi:10.1890/04-0631.
Wilcox, B. P., J. Pitlick, C. D. Allen, and D. W. Davenport (1996), Runoffand erosion from a rapidly eroding pinyon‐juniper hillslope, in Advancesin Hillslope Processes, edited by M. G. Anderson and S. M. Brooks,pp. 61–77, John Wiley, Chichester, U. K.
Wilcox, B. P., D. D. Breshears, and C. D. Allen (2003), Ecohydrologyof a resource‐conserving semiarid woodland: Effects of scale and dis-turbance, Ecol. Monogr., 73, 223–239, doi:10.1890/0012-9615(2003)073[0223:EOARSW]2.0.CO;2.
Wischmeier, W. H., and D. D. Smith (1978), Predicting rainfall erosionlosses: A guide to conservation planning, Agric. Handbk., 537, U.S.Dep. of Agric., Sci. and Educ. Admin., Washington, D. C.
Yair, A., and A. Kossovsky (2002), Climate and surface properties: Hydro-logical response of small arid and semi‐arid watersheds, Geomorphology,42, 43–57, doi:10.1016/S0169-555X(01)00072-1.
Yair, A., and H. Lavee (1985), Runoff generation in arid and semi‐aridareas, in Hydrological Forecasting, edited by M. G. Anderson andT. P. Burt, pp. 183–220, John Wiley, Chichester, U. K.
Yair, A., and N. Raz‐Yassif (2004), Hydrological processes in a small aridcatchment: Scale effects of rainfall and slope length, Geomorphology,61, 155–169, doi:10.1016/j.geomorph.2003.12.003.
Zehe, E., and M. Sivapalan (2009), Threshold behaviour in hydrologicalsystems as (human) geo‐ecosystems: Manifestations, controls, implica-tions, Hydrol. Earth Syst. Sci., 13, 1273–1297.
L. Merino‐Martín and J. M. Nicolau, Department of Ecology, Universityof Alcalá, Alcalá de Henares, E‐28871, Spain.M. Moreno‐de las Heras, Faculty of Engineering and Built Environment,
University of Newcastle, Callaghan, NSW 2308, Australia. ([email protected])B. P. Wilcox, Department of Ecosystem Science and Management, Texas
A&M University, College Station, TX 77843‐2126, USA.
MORENO‐DE LAS HERAS ET AL.: HYDROLOGY OF DEGRADED SLOPES W04503W04503
12 of 12