click it to check it: an instructional design module to ... system for student ... attendance, and...
TRANSCRIPT

Click it to check it: An instructional design module to assist university
faculty in using Socrative as a smart student response system for
student assessment.
Youssef Hadiri
Learning Design and Technology Department
University of Hawaii at Manoa
Honolulu, Hawaii, USA
http://socrative-for-higher-education.weebly.com/
Abstract: Instructors in higher education are more challenged than ever
before to keep up with the rapid growth of technology that is transforming
the educational environment. The new era of technological advancement
has brought new possibilities to enhance teaching and learning in ways that
never existed a decade ago. Faculty face various time-consuming demands
such as developing lesson plans, maintaining research agendas, creating
student assessment materials, and learning new technologies to expand their
teaching horizons. Receiving immediate feedback about instruction and
providing instant feedback to students can be challenging tasks. Thus, the
purpose of this instructional design project was to evaluate the effectiveness
of a learning module in instructing university faculty on how to use
Socrative as a smart student response system for student assessment. The
module was developed using Weebly website creator, and was based on the
ADDIE system approach, Vygotsky’s social-constructivist theoretical
framework, and self-directed learning theory. Professors and teaching
assistants completed an online module that included a pre-survey, post-test,
and post-survey. The study findings revealed a slight change in participants’
attitudes and comfort regarding the use of new technologies for student
assessment particularly Socrative. The learning module was created to
support faculty in implementing new technologies for student assessment to
facilitate student learning and instructor feedback. This research project not
only aimed to equip university faculty with the necessary skills to use a 21st
century technology tool such as Socrative, but also to meet the needs of
digital natives.
Introduction
The integration of technology in teaching and learning is no longer an option to meet the
needs of digital natives, it is a necessity. The twenty first century’s technological era has
brought new creative ways to assist educators in transitioning from the traditional
approach to teaching and learning to an enhanced technologically based learning
environment. This increasing demand to integrate new technologies in education has led
many instructors in secondary and higher education to implement new technological

applications to support their teaching practices including the student response systems
(SRS) also known as clickers ( see figure 1 below).
Figure 1: Student response systems (SRS)/ Clickers.
Teaching in higher education, in particular, requires managing various time-consuming
demands including instant feedback. Not only does immediate feedback support
instructors in improving their instruction, but it also supports students’ overall learning.
Through instant feedback, faculty can adjust instruction and improve teaching. However,
considering the time consuming demands faculty faces daily, receiving immediate
feedback about instruction as well as providing instant feedback to students might be
challenging tasks considering the number of students enrolled, the instructor’s busy
schedule, and the number of classes being taught by the instructor. Instant feedback is a
critical component in the learning process as it supports the learner’s progress and
provides feedback to instructors as well (Bartsch & Murphy 2011).
To accommodate this increasing need to provide and receive immediate feedback, faculty
in higher education is implementing student response systems (see figure 2 below).
Figure 2: Clickers being used in a college amphitheater.
Student response systems (SRS) are an evolving in-class student polling technology that
consists of wireless handheld devices and a receiver. This technology is designed to

assess students, provide instant feedback, and create an engaging and inviting learning
environment that is meant to maximize active learning within the classroom, especially in
large enrollment lectures. The student response systems provide faculty with the
opportunity to receive immediate feedback from students so that they can appropriately
adjust instructions. The Center for Instructional Support (CIS) at UH Manoa provides
SRS equipment to faculty. However, these devices have gone mostly unused by the
faculty in the recent years. It is believed that instructor’s lack of familiarity with this
technology, busy schedules, lack of training, the cost of the clickers, technical issues, and
the functionality of physical clickers might be factors for those systems not being
implemented.
According to Kay, Lesage and Knaack’s (2010) research study, challenges of using
clickers included the dependence on technology when students didn’t bring their clicker
device, decreased learning performance when response systems were used in summative
assessment, and technology malfunction when the system didn’t function properly
Besides the challenges of the implementation of clickers, faculty often has little time to
attend face-to-face training sessions to familiarize themselves with implementing new
technologies in teaching. Online training not only provides the opportunity for faculty to
learn about new technologies independently, but also accommodates their busy schedule.
The online module might be an effective alternative to face-to-face training and a
convenient tool to support faculty in broadening their teaching abilities. Therefore, the
purpose of this instructional design project was to develop and evaluate a web-based
learning module for university faculty on how to learn to use Socrative as a smart student
response system for student assessment at UH Manoa.
With the emergence of new technologies, new possibilities arise. Socrative, for instance,
is a new revolutionary approach to student response systems. Unlike physical clickers,
Socrative is a web-based response system that requires no software to load and no set up
to be done. All that is needed is a device with a web browser and an internet connection.
Socrative supports bring your own device (BYOD) theory, allows instructors to adjust
their instruction based on student feedback, and provides instant feedback to students as
well (Bingham, 2012). (See figure 3 below).
Figure 3: Socrative mobile app being used by a college student in class.

Faculty and students alike can use their own web-browsing devices (e.g. smartphones,
iPods, iPads) to use the software. Socrative is seen as an effective replacement to physical
response systems as it provides feedback in real time, both, in and out of the classroom.
Literature Review
Physical response systems are believed to improve students’ learning through increasing
engagement and instructor feedback. In Bartsch & Murphy’s 2011 research study, data
were collected from quizzes during different 10-minute lectures, with and without the use
of student response systems, to measure the effects of using clickers on students’
engagement and performance. Participants who were given student response systems
scored significantly higher than students who didn’t use student response systems in a
surprise quiz during lecture. Moreover, Patterson, Kilpatrick & Woebkenberg’s 2010
study concluded that the immediate feedback of student response systems increased
students’ in-class involvement, engagement, and participation. The students identified the
benefits of anonymity of responses and immediate feedback as facilitators to
understanding complex concepts. Kenwright’s 2009 article suggests that one of the best
applications of using clickers appears to be the immediate feedback provided to the
instructor and the students (Kenwright 2009).
Further research studies support SRS positive impacts on learning. Bachman and
Bachman’s 2011 study found student response systems to increase students’
participation, attentiveness, performance, and the learning experience. Data were
collected from students test scores, grades and surveys in an architecture class to measure
the effects of SRS on students’ learning. SRS were found to increase class participation,
students’ involvement, attendance, and eventually students’ performance. Participants felt
that student response systems were helpful in keeping them feeling mentally engaged,
academically responsible and accountable.
While student response systems are believed to have positive impacts on learning,
previous studies reported challenges that come with the implementation of this innovative
technology. According to Kay, Lesage and Knaack’s 2010 research study, challenges of
using clickers included the dependence on technology when students didn’t bring their
clicker device, decreased learning performance when response systems were used in
summative assessment, and technology malfunction when the system didn’t function
properly (Kay, Lesage & Knaack 2010). In another research study conducted to examine
the effects of student response systems on students’ engagement and performance, reports
included students’ frustration when technological problems arose with the use of student
response systems (Patterson, Kilpatrick & Woebkenberg 2010).
Despite the challenges that may come with the implementation of SRS, other research
studies reviewed have reported no impact on learning, engagement or performance as a
result of using student response systems (SRS). For instance, Blood’s 2012 study, which
was conducted to investigate the effects of student response system use on short-term,
intermediate, and long-term retention of facts during lecture style instruction in an
undergraduate teacher preparation course, showed no association between student

response systems and improved engagement in class sessions (Blood 2012). Student
response systems did not improve learning outcomes as measured by objective testing in
Patterson, Kilpatrick & Woebkenberg’s 2010 research study. While these latter two
studies may call into question the positive impact of student response systems on
teaching and learning, the majority of recent studies have reported an increase in
students’ engagement, performance and learning outcomes with the use of student
response systems.
Project Design
To support the university faculty members in implementing new technologies to assess
students, a comprehensive asynchronous online learning module was developed using
theories and suggestions from literature. The learning module was created by Weebly and
based on the ADDIE systems approach (Branch 2009). An instructional analysis was
conducted and instructional goals and performance objectives were developed (table 1).
Table 1: Instructional goals and performance objectives.
The instructional goals Performance objectives
1. University faculty will be able to use
a 2.0 web tool to assess students’
performance.
2. University faculty will be able to use
Socrative platform to provide & receive
immediate feedback.
3. University faculty will be able to
integrate technology in teaching and
learning.
1. Register, Create, and log in to Socrative
account.
2. Create and edit quizzes using Socrative
web tool.
3. Perform data analysis through viewing live
results spreadsheet and analyzing student
responses.
4. Perform data transfer via google drive,
email, and download.
5. Perform other Socrative tasks such as
managing quizzes and performing exit ticket
and space race activities.
6. Provide students with instant feedback via
live results report.
The learning module was developed using Vygotsky’s social-constructivist theoretical
framework to support building knowledge and skills through social interaction within a
supportive group or community (Lefoe, Olney, Wright, & Herrington 2009). (See figure
4 below).

Figure 4: Vygotsky’s social constructivist theory/ Zone of proximal development.
The second lesson in the module incorporates Vygotsky’s theory as participants practiced
with a partner implementing the Socrative quiz they created. Faculty took the role of an
instructor or a student when practicing the Socrative quizzes. The learning module
included three lessons to assist faculty in using Socrative for student assessment as shown
in (figure 5 below). The first lesson provided information on how to register, create, and
log in to the Socrative teacher account. The second lesson included information on how
to create and edit quizzes. The third lesson included information on how to analyze data,
generate reports and transfer results online.
Figure 5: The learning module lessons.
The self-directed learning theory was taken into account when developing the learning
module to enable adult learners to take control of their own learning. The learning
module was also designed to include space repetition theory to allow enough time for the
information acquired to move from short-term to long-term memory (Forni & Holcombe
2013). Faculty were given a one week period to complete the learning module.

To create effective e-learning modules that are fully accessible to all users, the
instructional learning module accommodated the needs of people with disabilities
(Thompson 2013). For instance, one strategy was to describe videos by creating a script
that included brief descriptions of important visual content for people unable to see the
videos. Moreover, the instructional learning module accommodated different learning
styles by including multiple means of representation including text, images and videos as
well as including small chunks of information in three lessons rather than big training
modules (Horton 2012) as noted in (figure 6 below).
Figure 6: The use of multiple means of representation.
Light color background theme with dark text colors was used for instructional
effectiveness (Khlaisang 2010). These suggestions from the literature were considered
when developing the Socrative learning module. To incorporate these theories into the
learning module, different software were used as design tools in the development of the
instructional module. As stated above, the learning module was created using Weebly, a
website creator. Photofiltre software, for instance, was used to adjust the module
screenshots and produce new images while Imovie software was used to design some of
the video tutorials used in the learning module. Other video tutorials were linked to the
learning module via Youtube. The learning module surveys and tests were initially
designed in the first design phase via Google docs, however, they were later excluded due
to Weebly limited free pack options. The Weebly platform was used to design and embed
the learning module tests and surveys.
Methodology
The recruitment process involved reaching out to the participants in person and online.
The online recruitment included identifying the university faculty through searching the
UH online database. The faculty was contacted via email with the recruitment flyer
attached (See Appendix A) that contained the link to the online module. In-person
recruitment included posting the recruitment flyer on the announcement boards and
answering questions about the project to prospective participants. Key benefits of this
research study were explained to interested faculty and an overview of the study was
provided. The initial recruitment targeted the English Department faculty at UH Manoa

and was later extended to other departments within the UH Manoa community. A total
number of eighteen participants participated in this research study, yet, only twelve of
them completed the learning module surveys and tests. The participants included
professors, lecturers, and teaching assistants who teach at undergraduate and graduate
levels in various departments at UH Manoa. Participants ranged in professional ranking
from newly hired to tenured faculty, varied in age from 26 to 70 years, and included both
males and females. Participants also varied in terms of familiarity with technology and its
use in the classroom.
Interested faculty completed the learning module asynchronously and independently.
Minimal assistance was provided in-person to two participants who experienced technical
issues. Participation in this study involved four tasks; completing a pre-survey, reviewing
a web-based instructional module, and completing a post-test and a post-survey. After
accessing the online module and indicating consent (See Appendix B), participants
completed the pre-survey that included fourteen questions regarding demographics,
technology use, comfort, attitudes and present teaching practices (See Appendix C).
Participants then reviewed the learning module (website) that consisted of three lessons.
The first lesson provided information on how to register, create, and log in to the
Socrative teacher account. The second lesson included information on how to create and
edit quizzes. The third lesson included information on how to analyze data, generate
reports and transfer results online. Finally, participants completed a post-test that
included sixteen questions about post knowledge (See Appendix D) and a post survey
that included eighteen questions to gather information regarding satisfaction, comfort,
attitudes, and feedback about module design (See Appendix E).
A fake name was used for matching the participants’ pre- and post-information.
Participants were instructed to use the same fake name on each pre- and post-survey and
tests completed for data matching purposes. Participants were not identified directly or
indirectly and didn’t use any identifying personal information in the surveys or test
responses. No one, not even the researcher, had access to identify the participants’
personal information. The surveys and tests were completely anonymous. Participants
only needed a fake username to complete the surveys and tests as shown in figure 7.
Instructions on how to create a fake username were provided in the online consent form.
Figure 7: The pre- and post-surveys fake name.

Pre- and post-data were collected via online surveys and tests. After the participants
completed the module, pre- and post-data were received via email. Data from surveys and
tests were analyzed and compared using the Microsoft excel. The initial data analysis
included decoding the participants responses based on the type of scale used in each
question using Microsoft Excel. For instance, Likert agreement scale was coded five for
strongly agree to one for strongly disagree. Each participant’s response was initiated a
code from 5 to 1 (See Appendix F). An overall mean average score was developed based
on pre- and post-responses for each construct. Pre- and post-data were later compared
based on participant comfort, likelihood, and age range. Graphic charts and other visuals
were used to display results.
Participants took approximately one to two hours to go through the module and complete
the surveys and tests. However, participants were given a one-week period to complete
the study based on the space repetition theory. The questions in the module included
multiple choice, yes and no, open ended, and various Likert-type questions. The Likert-
type responses were based on agreement, likelihood, and comfort scales. Data from pre-
and post-survey responses regarding comfort and attitudes were compared to measure
faculty’s overall comfort using technology and their attitudes towards using new
technologies for student assessment particularly Socrative 2.0. Data from pre- and post-
survey responses were also used to analyze faculty’ comfort using technology and
likelihood to use Socrative based on the participants’ age range. Data regarding
preference in learning new information were also assessed (See Appendix G).
The purpose of comparing pre- and post-attitude responses was to measure faculty’s
willingness to implement new technologies in teaching and learning after completing the
module and their attitudes towards the current assessment tools used. Data were
compared and analyzed to evaluate the effectiveness of the learning module in changing
faculty’s attitudes towards using new technologies in teaching. The pre- and post-surveys
and tests were based on the performance objectives and what learners needed to know to
successfully implement Socrative. Data from post survey responses regarding
satisfaction, quality of information, engagement and module ease of use and design were
analyzed to examine the faculty overall satisfaction regarding the module. Other items in
the pre- and post-surveys such as demographic information, teaching practices and
faculty learning preferences were analyzed and added to the results and discussion
sections.
Results
A total number of eighteen participants reviewed the instructional learning module
content and completed the pre-survey, yet, only twelve of them completed the study
including the post-test and post-survey. Only the data from the twelve who completed the
module are included in the analysis. The participants included professors, lecturers, and
teaching assistants who teach at undergraduate and graduate levels in various
departments at UH Manoa. Participants ranged in professional ranking from newly hired
to tenured faculty, varied in age from 26 to 70 years, and included both males and
females. Participants also varied in terms of familiarity with technology and its use in the

classroom. Table 2 shows the age range of the participants, their educational level,
computer literacy and gender.
Table 2: Participants age, gender, educational level, and computer literacy.
Characteristic Number Percentage
Age
25-35 2 16.67%
36-46 1 8.33%
47-57 6 50%
58+ 3 25%
Gender
Male 7 58.34%
Female 5 41.66%
Educational Level
Bachelor’s degree
Master’s degree
1
3
8.34%
25%
PhD 8 66.66%
Computer Literacy
Average 9 75%
Expert 3 25%
As noted above, a total of twelve participants completed the research study. Seven of
them were males (58.3%) and five were females (41.6%). Half of the participants (50%)
were in the 47 to 57 age range with (25%) of senior faculty over the age of 58 years old.
The other (25%) of the participating faculty were in the 25 to 46 years old age range.
Regarding the participants race, four participants were White, three native Hawaiians,
three Asians, and two of the participants preferred not to answer (See Appendix H).
The participants’ computer literacy was within the average range. The majority of the
participants (75%) reported an average use of computers that included sending emails,
using software programs and creating Word/PowerPoint documents. The rest of the
participants (25%) reported that they possessed advanced computer skills and considered
themselves computer experts. The type of mobile devices used by faculty were diverse.
Three participants only used laptops and smartphones, three other participants used both
laptop and desktop, two participants only used a laptop, while two other participants used
a laptop, desktop, and smartphone. Only one participant reported a current use of
smartphone and desktop, while another participant used a combination of mobile devices
including laptop, smartphone, tablet and desktop for various purposes (See Appendix I).
All of the participants (100%) held college degrees, which was expected based on the
nature of this research study. An overwhelming percent (66.6%) of the participating
faculty possessed PhD degrees with only (25%) of them holding Masters’ degrees, and
only (8.3%) a Bachelor’s degree.
In regards to the current technology tools used by faculty, Laulima is the most used
technology tool at UH Manoa to create assessment materials to assess students as stated
in (figure 8 below). (58.3%) of the participants reported that they use Laulima to create
tests and surveys for student assessment. Faculty can create online tests, quizzes and

surveys for their students through Laulima; which is also used to provide feedback to
students through grades and additional comments. About 25% of the participants reported
that they don’t use any technologies for student assessment and that they prefer the paper
based assessment, whereas, a few (16.7%) participants used other assessment tools such
as clickers and ProctorU.
Figure 8: Current assessment tools used by faculty.
When participants were asked how long they have been teaching in college, six of them
reported that they have been teaching in college more than 10 years, five participants
have been teaching in college between 1 to 5 years and only one participant reported that
their college teaching experience raged from 6 to 9 years (See Appendix J). Most of the
participants used technology often in teaching. When participants were asked to rate their
level of experience using student response systems, they reported that they had heard of
clickers before but they don’t actually use it. Data from pre- and post-survey responses
were compared to measure faculty’s overall comfort using technology and their attitudes
towards using new technologies for student’s assessment particularly Socrative 2.0. Data
from pre- and post-survey responses were also analyzed based on the participants’ age
range. Figure 9 below shows a comparison of faculty’s comfort level based on age rage
with their overall comfort level in using technology in pre- and post- surveys.
Figure 9: Faculty’s overall comfort level compared to their age range.
Other 16.67%
Paper based Assessment 25%
Laulima 58.33%

The participants were asked to rate their comfort level using technology in teaching using
the 4 point Likert scale in pre-and post-surveys. Whereas the 5 point Likert scale was
used to measure faculty likelihood to use Socrative for students’ assessment. The initial
results reported a slight increase in mean scores (3.3 to 3.5) in faculty comfort in using
technology in teaching as shown above in figure 9. However, when pre- and post-data
were analyzed based on the participants age range, the findings showed no significant
improvement in older faculty’s comfort level, which remained the same throughout the
study (mean=3.4) compared to younger faculty comfort level that improved after
completing the study. Younger faculty provided a rating of comfortable (mean=3) in pre-
survey to very comfortable (mean=3.6) in post-survey as noted in figure 9 above.
As stated above, data from pre- and post-survey responses were analyzed to assess the
faculty’s overall likelihood to use Socrative for student assessment. The pre- and post-
survey responses were also analyzed based on the participants’ age range in regards to
their likelihood to use Socrative. Figure 10 below shows the faculty’s overall likelihood
to use Socrative for student assessment compared to their likelihood level to use
Socrative based on their age range.
Figure 10: Faculty’s overall likelihood to use Socrative compared to their age range.
The participants were asked to rate their likelihood to use Socrative for students’
assessment using the 5 point Likert scale in pre- and post-surveys questions. The initial
results reported a slight increase from neutral (3.2) to likely (3.7) in regards to overall
faculty’ likelihood to use Socrative for students’ assessment as shown above in figure 10.
However, when pre- and post-data were analyzed based on the participants age range, the
findings showed a significant difference in faculty likelihood and attitudes towards using
Socrative as a new technology for student assessment. The findings revealed that younger
faculty was more willing to use Socrative (mean of 4) compared to older faculty with a
neutral rating (3) in the beginning of the study. Nevertheless, there was a slight
improvement in older faculty likelihood to use Socrative after completing the study from

neutral (3) to likely (3.5). The younger faculty likelihood to use Socrative slightly
improved (from 4 to 4.3) after completing the study as noted in (figure 10 above).
Figure 11 shows the post test scores of each individual participant. The overall average
participants score in the post-test was (89.8% out of 100%).The initial findings revealed
that all participants answered 9 questions correctly out of 16 questions total in the post
test. Yet, more than half of the participants answered question 13 incorrectly with low
average score of 49%.
Figure 11: Individual participants’ post-test responses.
The initial post-test mean scores showed that the participants received high post-test
scores overall; however, when post-test data were analyzed based on the participants’ age
range, the findings showed a difference in faculty’s post-test responses. Younger faculty
scored higher with an average test score of (96% out of 100%) compared to older faculty’
scores that averaged (87.8% out of 100%) as shown in (figure 12 below).
Figure 12: The percentages of faculty’s post-test responses based on age range.
88
75
100
88
81
88
100
88
81
100
94
94
0 10 20 30 40 50 60 70 80 90 100
Participant 1
Participant 2
Participant 3
Participant 4
Participant 5
Participant 6
Participant 7
Participant 8
Participant 9
Participant 10
Participant 11
Participant 12
PERCENTAGE OF INDIVIDUAL PARTICIPANTS CORRECT POST TEST RESPONSES %

The initial results regarding the module constructs show that most of the participants
agreed that the learning module was easy to use, informative, and engaging as noted in
table 3 below. The learning quality construct rating was higher with an average of (4.2)
agree compared to the ease of use construct mean (4.1). The participants reported that the
learning module provided quality information that helped them learn about Socrative.
Even though more than half of the participants 66.6% reported that the learning module
was engaging, the engagement construct was rated lower than the other constructs with
an average rating of (3.7).
Table 3: The participants overall rating of the module constructs.
Overall, most of the participants were satisfied with the learning module as shown on
figure 13 below. Half of the participants 50% reported that the learning module was very
good, 25% indicated that it was excellent, 16.6% reported that it was good, and only
8.3% of the participants rated the learning module as fair.
Figure 13: The learning module rating.

Discussion
Based on this research study’s findings, younger faculty scored higher, were more
comfortable and more willing to use new technologies for assessment compared to older
faculty. Younger faculty high post-test scores and overall performance throughout this
research study supports these findings. It is believed that younger faculty openness to use
new technologies, their comfort using technology, and their familiarity with online
learning might have had a positive impact on their performance.
Although the older faculty technology comfort didn’t change throughout the research
project as shown in pre- and post-data comparison, some of the older faculty members
were willing to incorporate and integrate Socrative in student assessment.
It is believed that older faculty comfort using technology and willingness to use Socrative
might have been influenced by the training delivery mode and faculty learning styles. It
was apparent that older faculty had different learning preferences. Some older faculty
preferred face-to-face training and suggested setting up a workshop to learn about
Socrative; other older faculty, however, reported an interest in synchronous online
learning. It is possible that the asynchronous delivery method of this research project
might have affected the older faculty comfort and attitudes since the learning module was
completely asynchronous. Some of the comments received from older faculty support this
argument.
Conclusion
Overall, the project was primarily geared towards introducing new assessment
technologies to faculty to enhance teaching and learning through immediate feedback.
This project was also sought to support faculty in transitioning their teaching approach to
a 21st century technologically based learning environment. Based on the research
findings, the learning module was not only effective in improving faculty comfort using
technology and willingness to use new technologies for assessment, but also effective in
instructing faculty on how to use Socrative based on test scores. Yet, future research
studies are needed to examine the impacts of training delivery modes/types on faculty
comfort, attitudes, and likelihood to implement new technologies in teaching and
learning. This project was meant to provide training to all faculty members within the UH
community on how to integrate emerging technologies in teaching. This learning module
provided faculty with a convenient learning opportunity to not only embrace a new era of
technologies to enhance teaching and learning, but also to broaden their horizons to meet
the needs of digital natives.

References
Bachman, L., & Bachman, C. (2011). A study of classroom response system clickers:
Increasing student engagement and performance in a large undergraduate lecture
class on architectural research. Journal of Interactive Learning Research 22 (1),
5-21.
Bartsch, R., & Murphy, W. (2011). Examining the effect of an electronic classroom
response system on student engagement and performance. J. Educational
Computing Research, 44 (1), 25-33.
Bingham, L. (2012). Get clicker feedback from students without buying clickers.
Nebraska Educational Technology Association Newsletter. Retrieved from
http://www.netasite.org.
Blood, E. (2012). Student response systems in the college classroom: An investigation of
short-term, intermediate, and long-term recall of facts. Journal of Technology and
Teacher Education 20 (1), 5-20.
Branch, R., M. (2009). Instructional design: The ADDIE approach. New York, NY:
Springer.
Horton, W. (2012). E-learning by design (2nd ed.). San Francisco, CA: Pfeiffer.
Forni, K., & Holcombe, C. (2013). 62 Tips on effective e-learning instructional design.
Santa Rosa, CA: The eLearning Guild.
Kay, R., Lesage, A., & Knaack, L. (2010).Examining the use of audience response
systems in secondary school classrooms: A formative analysis. Jl. of Interactive
Learning Research 21 (3), 343-365.
Kenwright, K. (2009).Clickers in the classroom.Tech Trends. 53(1), 74-77.
Khlaisang, J. M. (2010). Proposed models of appropriate website and courseware for e-
learning in higher education: Research based design models. Paper presented at
E-learn 2010-World Conference. October 2010. Florida, USA. Retrieved from:
http://web.b.ebscohost.com.eres.library.manoa.hawaii.edu
Lefoe, G., Olney, I., Wright, R. & Herrington, A., (2009). Faculty development for new
technologies: Putting mobile learning in the hands of the teachers. In J.
Herrington, A. Herrington, J. Mantei, I. Olney, & B. Ferry (Eds.), New
technologies, new pedagogies: Mobile learning in higher education (pp. 15-27).
Retrieved from http://ro.uow.edu.au/

Patterson, B., Kilpatrick, J., & Woebkenberg, E. (2010). Evidence for teaching practice:
The impact of clickers in a large classroom environment. Nurse Education Today
603-607.
Thompson. T (2013). 30 Web Accessibility Tips. Access Computing. 206-685.doi:3648.

Appendix A
Recruitment Flyer

Appendix B
Consent to Participate in the Research Study


Appendix C
Research Study Instruments/Pre-survey

Appendix D
Research Study Instruments/Post-test

Appendix E
Research Study Instruments/Post-survey

Appendix F
Decoding participants responses using Microsoft Excel

Appendix G
Faculty learning preferences
63.6%
36.4%
Faculty preferences learning new information
Face-to-face Online

Appendix H
Participants Ethnicity
33.33%
25% 25%
16.67
0
1
2
3
4
White Native Hawaiian Asian Prefer not to say
Participants' Ethnicity
White Native Hawaiian Asian
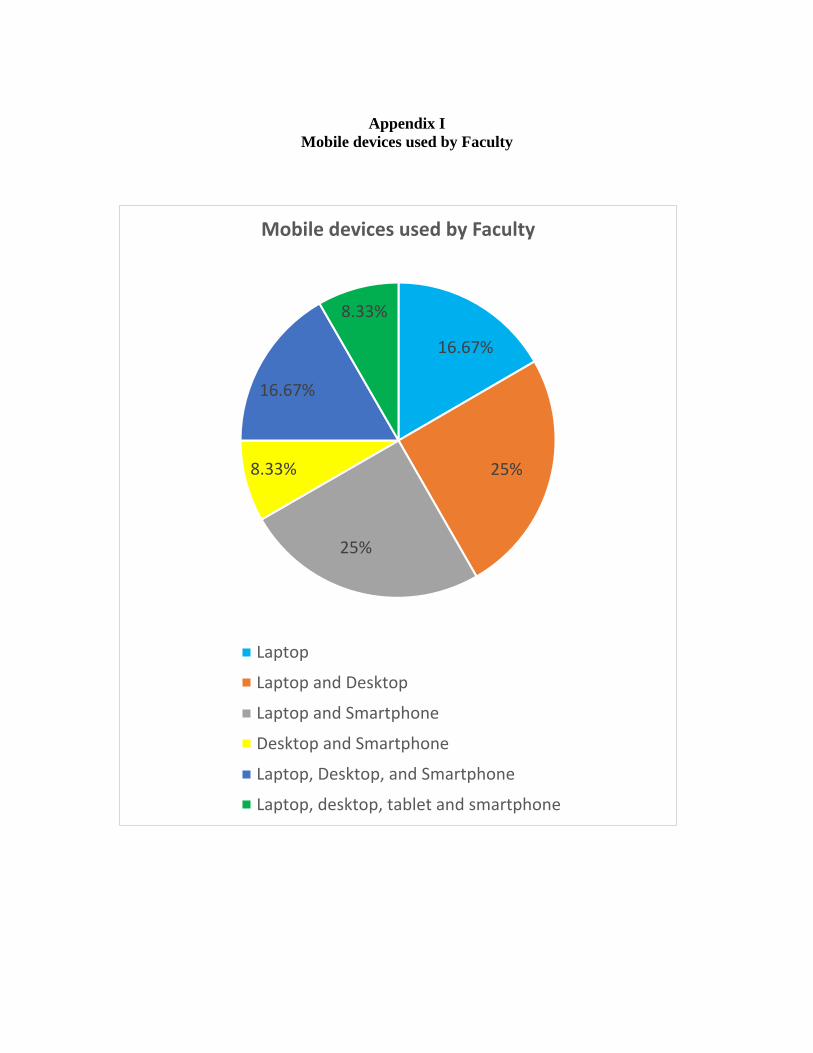
Appendix I
Mobile devices used by Faculty
16.67%
25%
25%
8.33%
16.67%
8.33%
Mobile devices used by Faculty
Laptop
Laptop and Desktop
Laptop and Smartphone
Desktop and Smartphone
Laptop, Desktop, and Smartphone
Laptop, desktop, tablet and smartphone

Appendix J
Faculty total years of teaching experience
41.67%
8.33%
50%
1 to 5 years 6 to 9 years More than 10 years
Faculty total years of Teaching experience
1 to 5 years 6 to 9 years More than 10 years