click mouse to advance slides - weeblylauramaewilliams.weebly.com/uploads/2/5/3/8/25384528… ·...
TRANSCRIPT

CLICK MOUSE
TO ADVANCE
SLIDES
Introduction to
Introduction to Statistical Quality Control, 6th Edition by
Douglas C. Montgomery. Copyright (c) 2009 John Wiley & Sons, Inc.
1. Understand why applying several univariate control charts simultaneously to a set of related quality characteristics may be an unsatisfactory monitoring procedure.
2. How the multivariate normal distribution is used as a model for multivariate process data.
3. Know how to estimate the mean vector and covariance matrix from a sample of multivariate observations.
4. Know how to set up and use a chi-square control chart.
5. Know how to set up and use the Hotelling T control chart.
6. Know how to set up and use the multivariate exponentially weighted moving average (MEWMA) control chart.
7. Know how to use multivariate control charts for individual observations.
8. Know how to find the phase I and phase II limits for multivariate control charts.
9. Use control charts for monitoring multivariate variability.
10. Understand the basis of the regression adjustment procedure and know how to apply regression adjustment in process monitoring.
11. Understand the basis of principal components and know how to apply principal components in process monitoring.
Introduction to Statistical Quality Control, 6th Edition by Douglas C. Montgomery. Copyright (c) 2009 John Wiley & Sons, Inc.
2
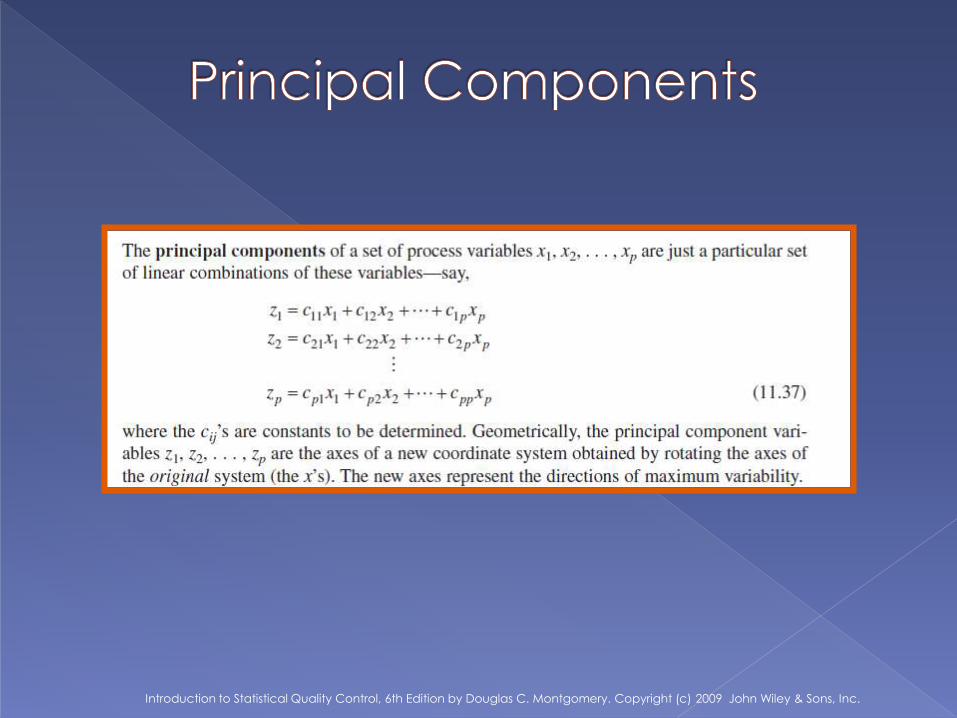
This chapter will present control charts that can be regarded as the multivariate extensions of some univariate charts in previous chapters.
These multivariate control charts work well when the number of process variables is not too large—say, 10 or fewer.
As the number of variables grows; however, traditional multivariate control charts lose efficiency with regard to shift detection.
A popular approach in these situations is to reduce the dimensionality of the problem using principal components.
Introduction to Statistical Quality Control, 6th Edition by Douglas C. Montgomery. Copyright (c) 2009 John Wiley & Sons, Inc.
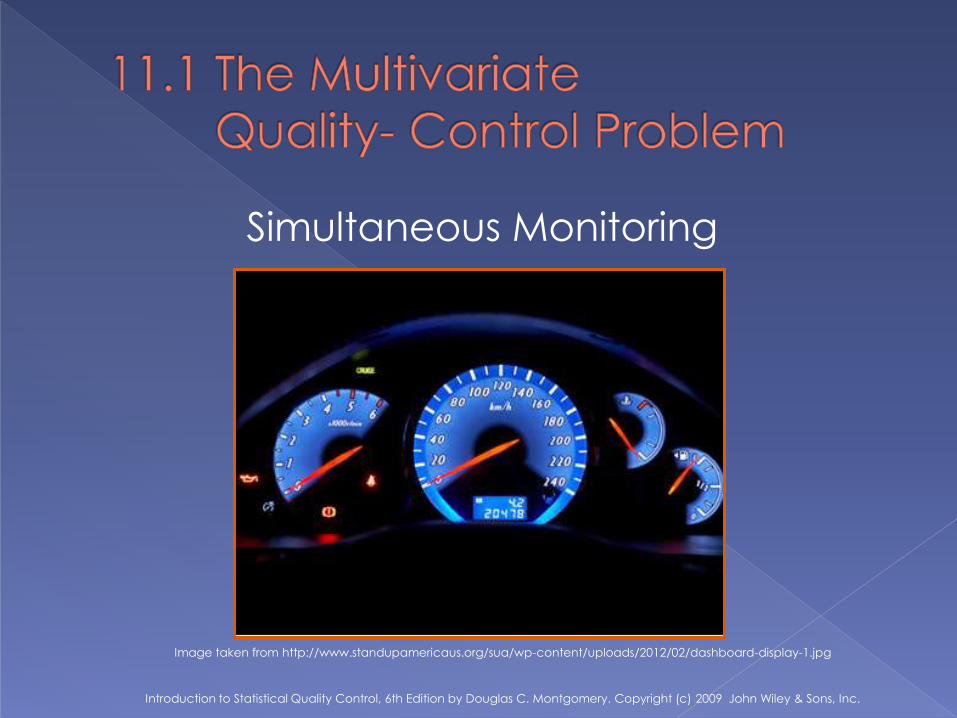
Simultaneous Monitoring
Introduction to Statistical Quality Control, 6th Edition by Douglas C. Montgomery. Copyright (c) 2009 John Wiley & Sons, Inc.
Image taken from http://www.standupamericaus.org/sua/wp-content/uploads/2012/02/dashboard-display-1.jpg
Use of multiple independent control
charts distorts the simultaneous
monitoring of the averages
Introduction to Statistical Quality Control, 6th Edition by Douglas C. Montgomery. Copyright (c) 2009 John Wiley & Sons, Inc.
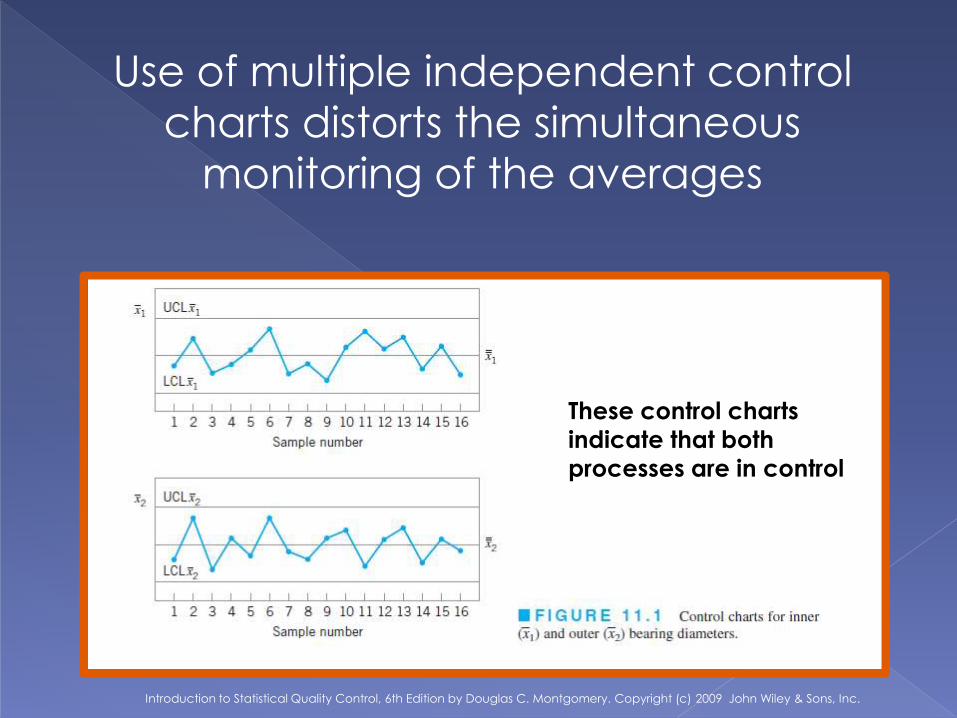
These control charts
indicate that both
processes are in control
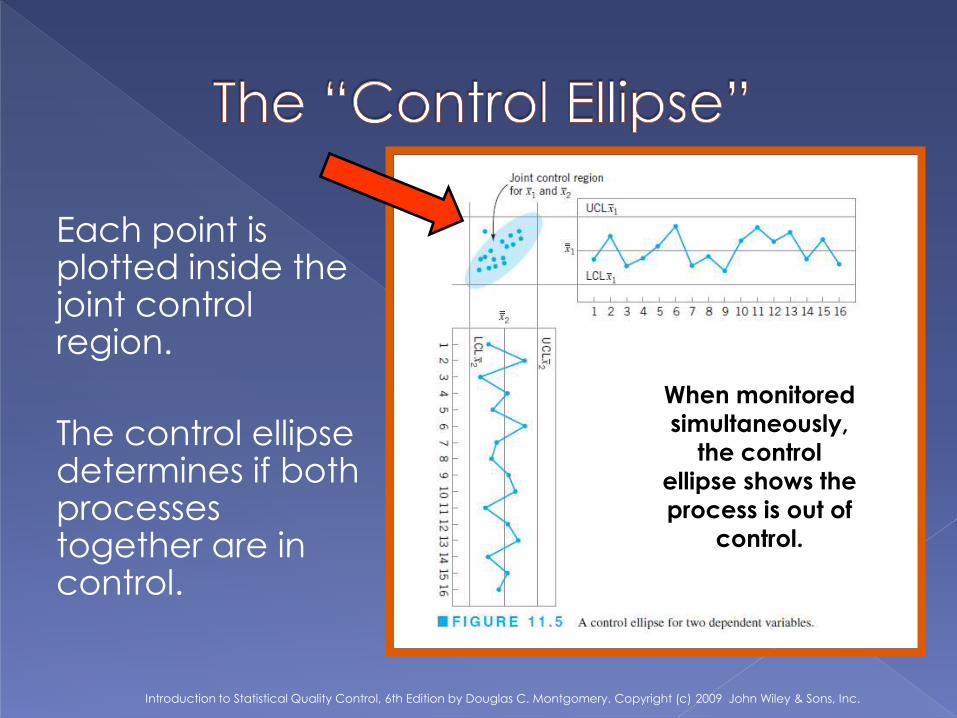
Each point is plotted inside the joint control region.
The control ellipse determines if both processes together are in control.
When monitored
simultaneously,
the control
ellipse shows the
process is out of
control.
Introduction to Statistical Quality Control, 6th Edition by Douglas C. Montgomery. Copyright (c) 2009 John Wiley & Sons, Inc.
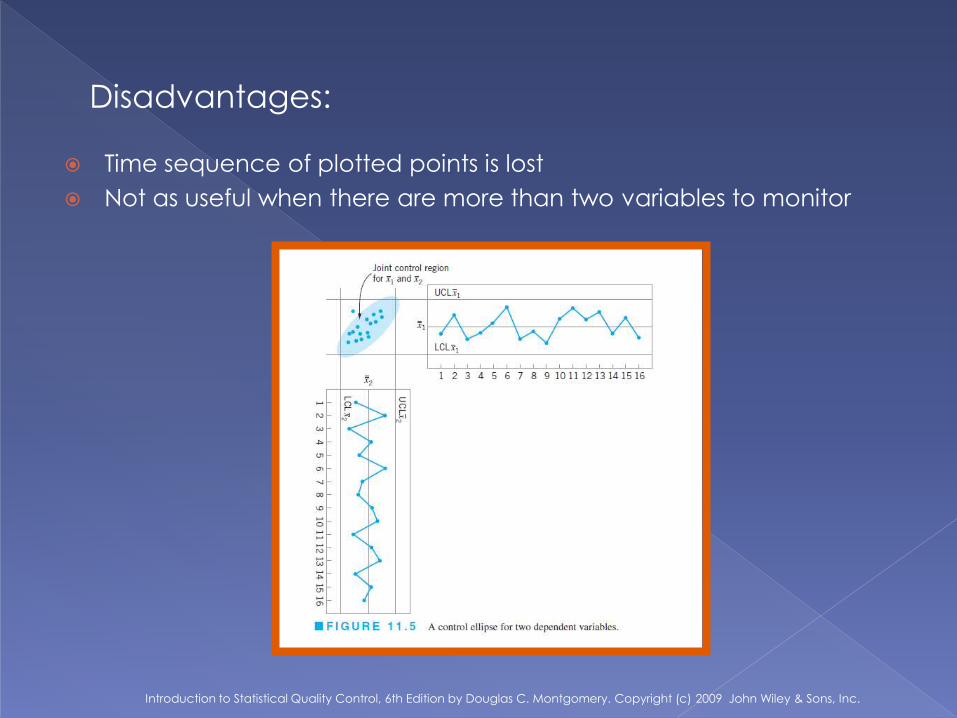
Disadvantages:
Introduction to Statistical Quality Control, 6th Edition by Douglas C. Montgomery. Copyright (c) 2009 John Wiley & Sons, Inc.
Time sequence of plotted points is lost
Not as useful when there are more than two variables to monitor
Normal Distribution
Sample Mean Vector
Covariance Matrix
Introduction to Statistical Quality Control, 6th Edition by Douglas C. Montgomery. Copyright (c) 2009 John Wiley & Sons, Inc.
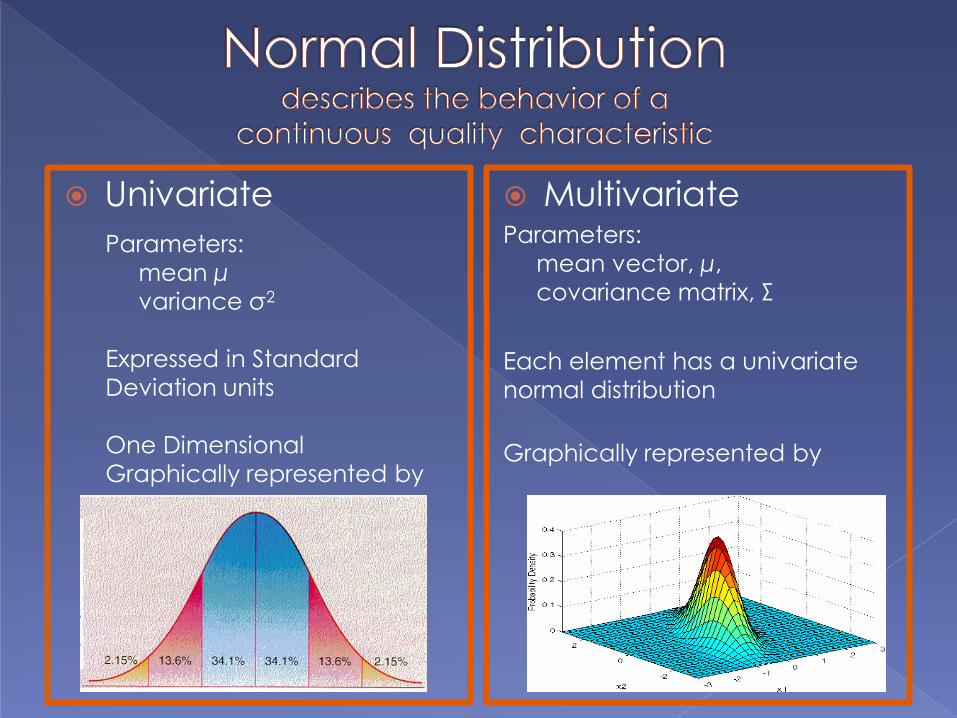
Univariate Multivariate Parameters:
mean vector, μ,
covariance matrix, Σ
Each element has a univariate
normal distribution
Graphically represented by
Parameters:
mean μ
variance σ2
Expressed in Standard
Deviation units
One Dimensional
Graphically represented by
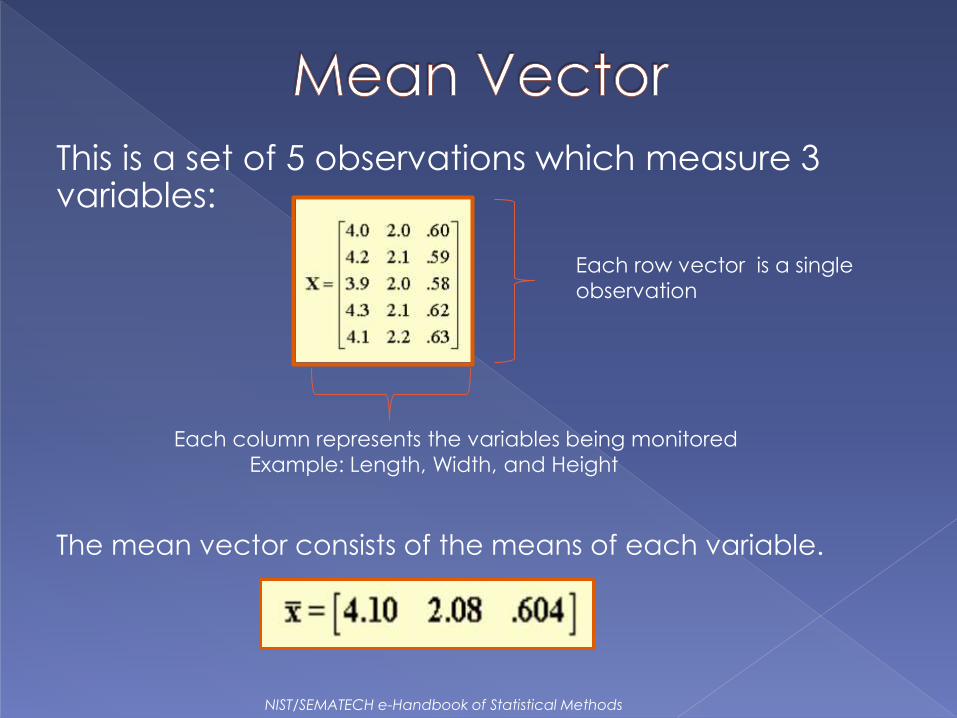
This is a set of 5 observations which measure 3 variables:
The mean vector consists of the means of each variable.
Each row vector is a single
observation
Each column represents the variables being monitored
Example: Length, Width, and Height
NIST/SEMATECH e-Handbook of Statistical Methods
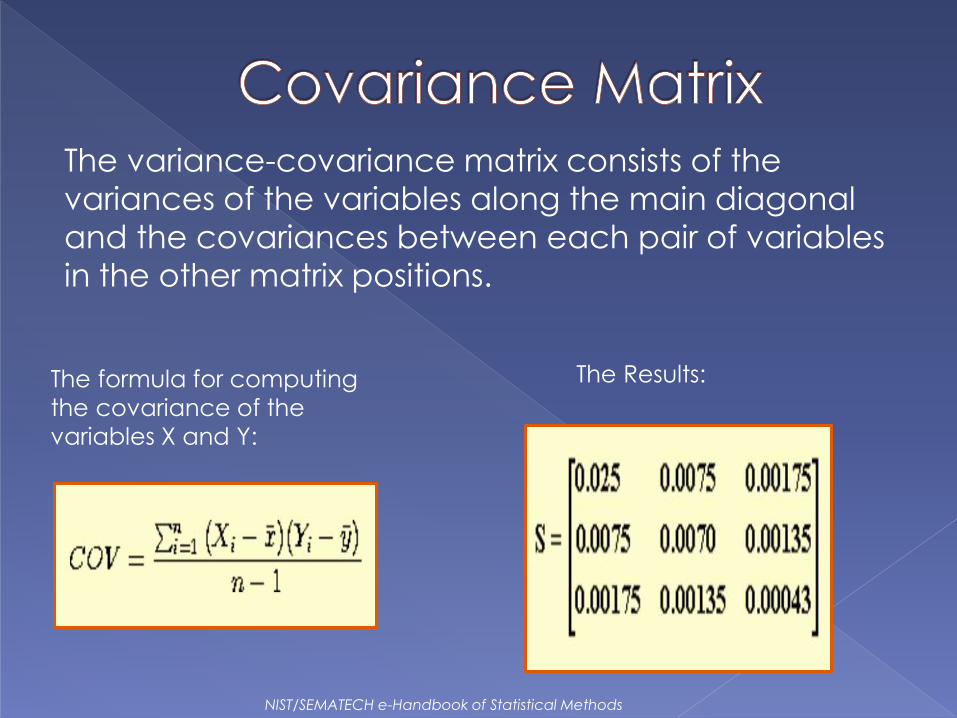
The variance-covariance matrix consists of the
variances of the variables along the main diagonal
and the covariances between each pair of variables
in the other matrix positions.
The formula for computing
the covariance of the
variables X and Y:
The Results:
NIST/SEMATECH e-Handbook of Statistical Methods
In practice, it is usually necessary to
estimate μ and Σ from the analysis of
preliminary samples of size n, taken when
the process is assumed to be in control.
The average of the sample covariance
matrices S is an unbiased estimate of Σ
when the process is in control.
Introduction to Statistical Quality Control, 6th Edition by Douglas C. Montgomery. Copyright (c) 2009 John Wiley & Sons, Inc.
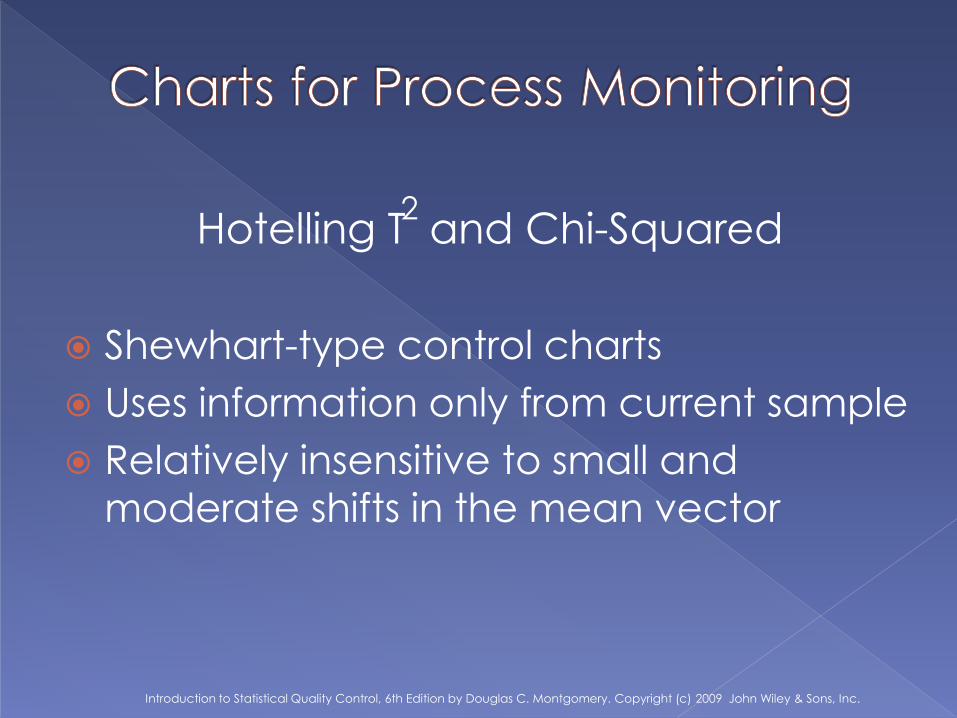
Hotelling T and Chi-Squared
Shewhart-type control charts
Uses information only from current sample
Relatively insensitive to small and
moderate shifts in the mean vector
Introduction to Statistical Quality Control, 6th Edition by Douglas C. Montgomery. Copyright (c) 2009 John Wiley & Sons, Inc.
2
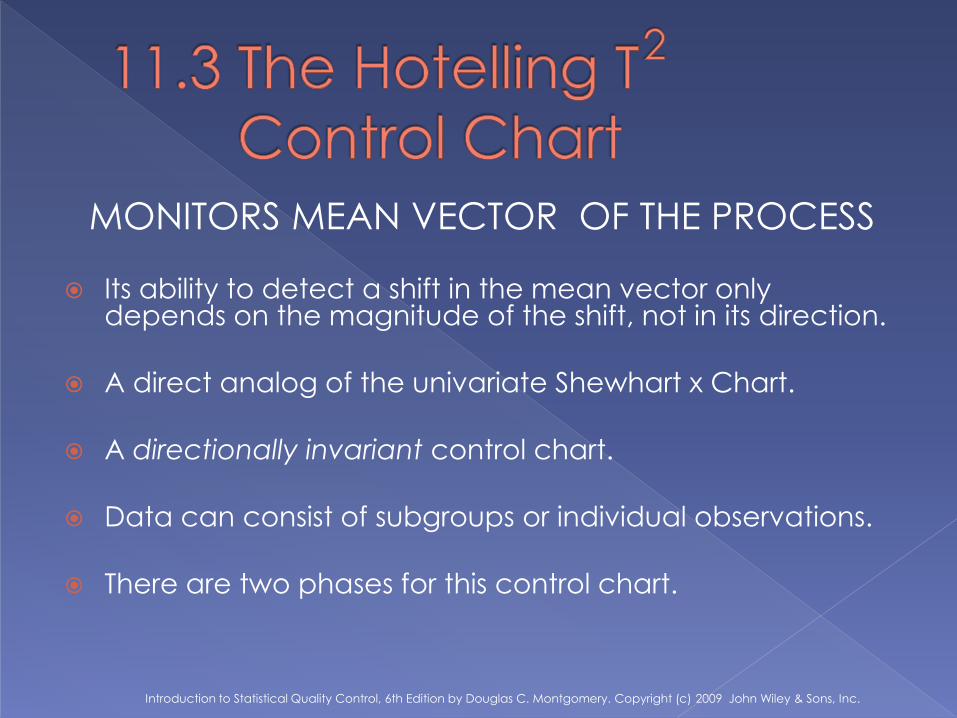
MONITORS MEAN VECTOR OF THE PROCESS
Its ability to detect a shift in the mean vector only depends on the magnitude of the shift, not in its direction.
A direct analog of the univariate Shewhart x Chart.
A directionally invariant control chart.
Data can consist of subgroups or individual observations.
There are two phases for this control chart.
Introduction to Statistical Quality Control, 6th Edition by Douglas C. Montgomery. Copyright (c) 2009 John Wiley & Sons, Inc.
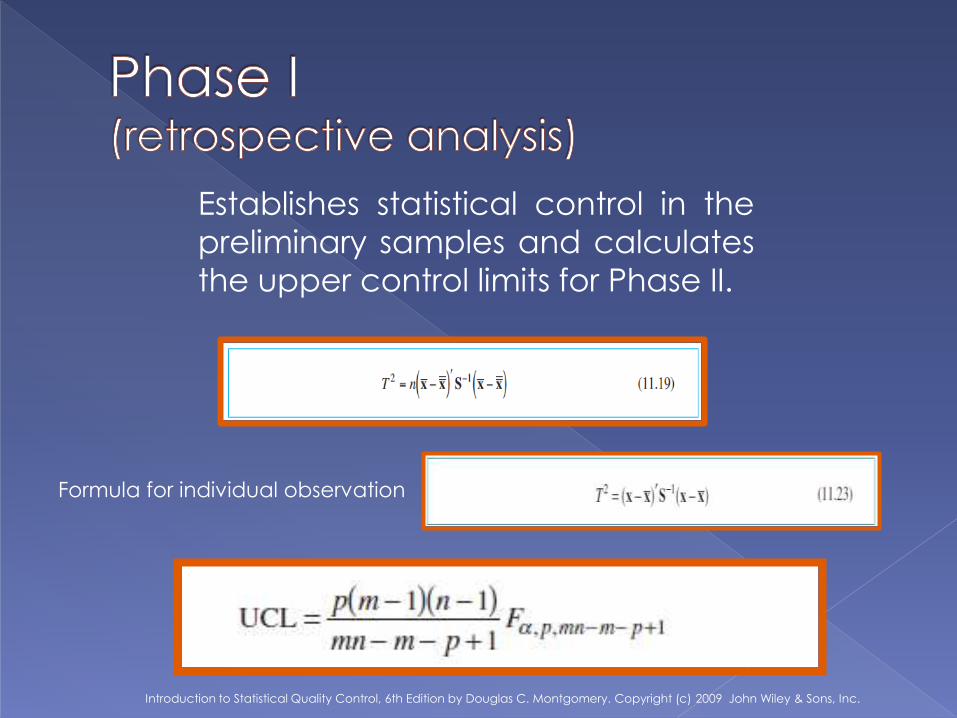
Establishes statistical control in the
preliminary samples and calculates
the upper control limits for Phase II.
Introduction to Statistical Quality Control, 6th Edition by Douglas C. Montgomery. Copyright (c) 2009 John Wiley & Sons, Inc.
Formula for individual observation
Introduction to Statistical Quality Control, 6th Edition by Douglas C. Montgomery. Copyright (c) 2009 John Wiley & Sons, Inc.
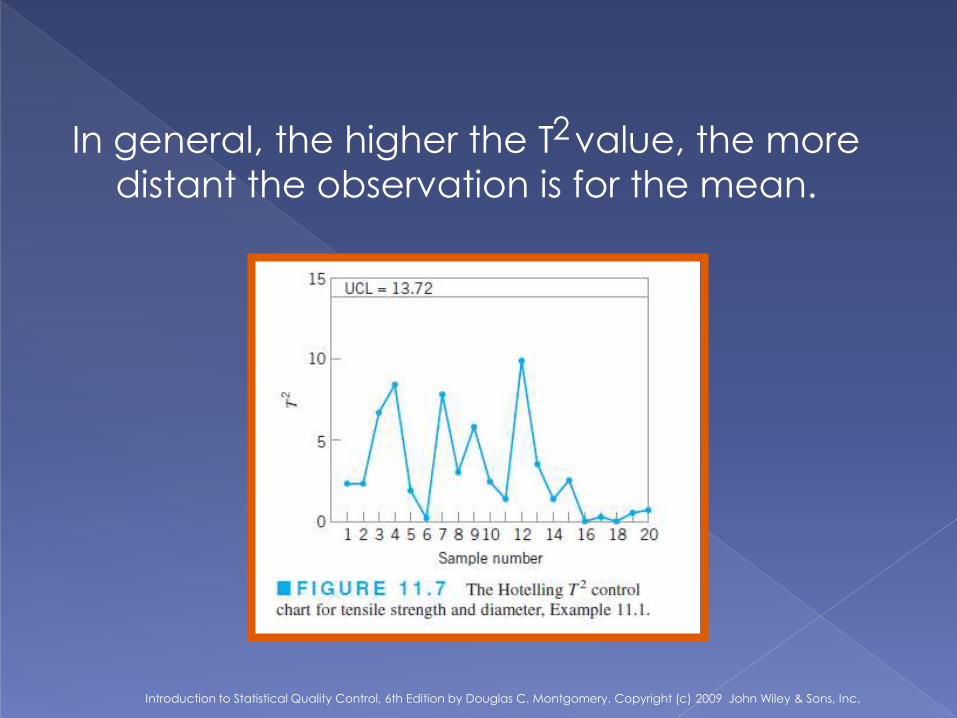
In general, the higher the T value, the more
distant the observation is for the mean.
Introduction to Statistical Quality Control, 6th Edition by Douglas C. Montgomery. Copyright (c) 2009 John Wiley & Sons, Inc.
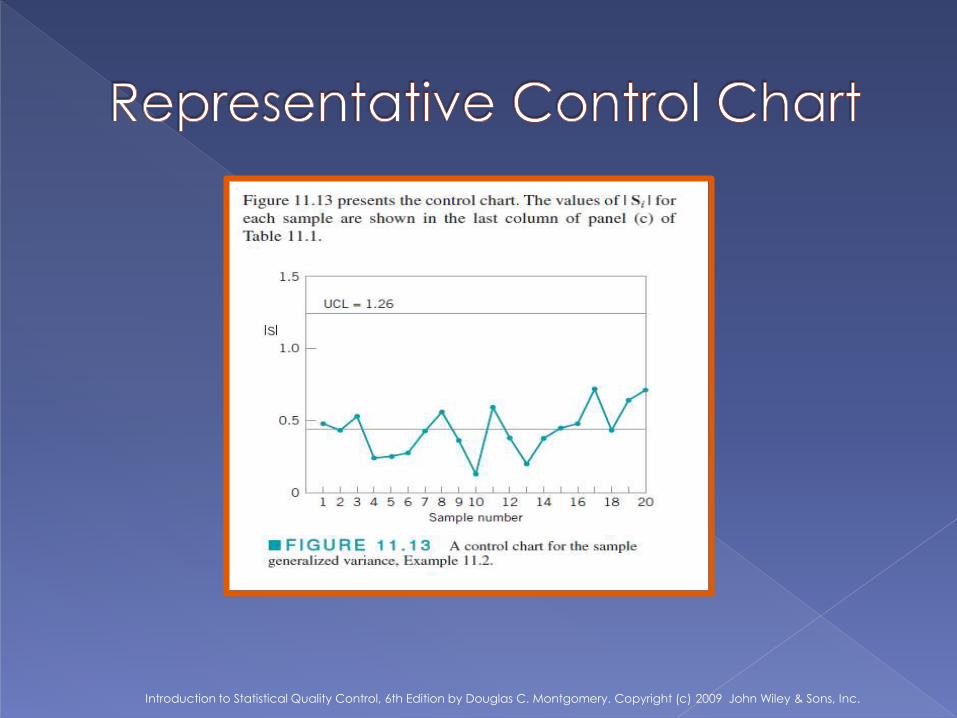
2
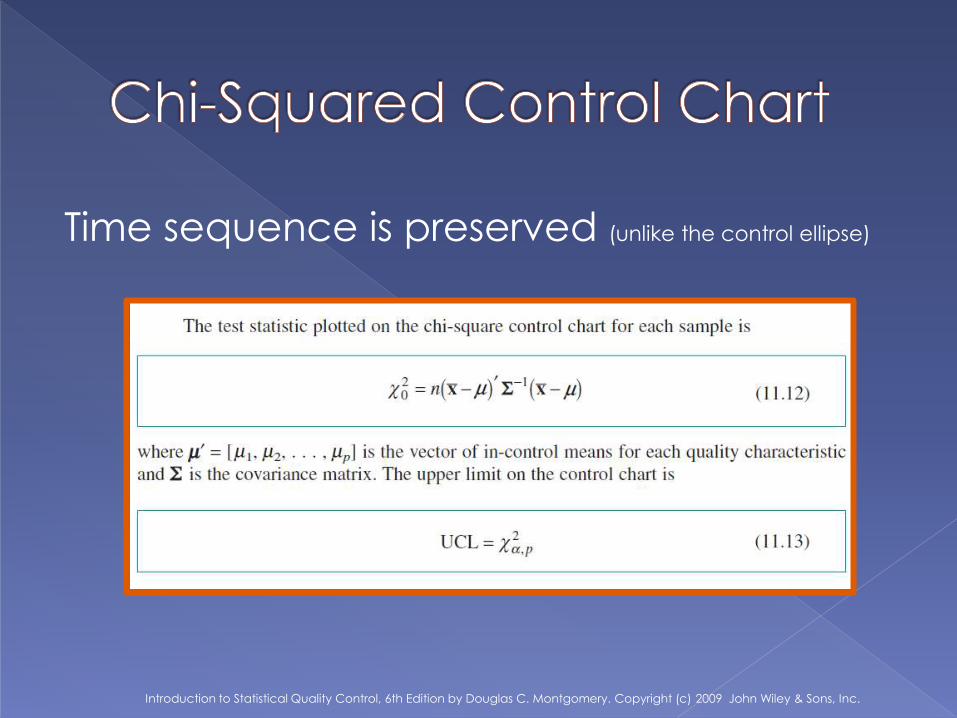
Time sequence is preserved (unlike the control ellipse)
Introduction to Statistical Quality Control, 6th Edition by Douglas C. Montgomery. Copyright (c) 2009 John Wiley & Sons, Inc.
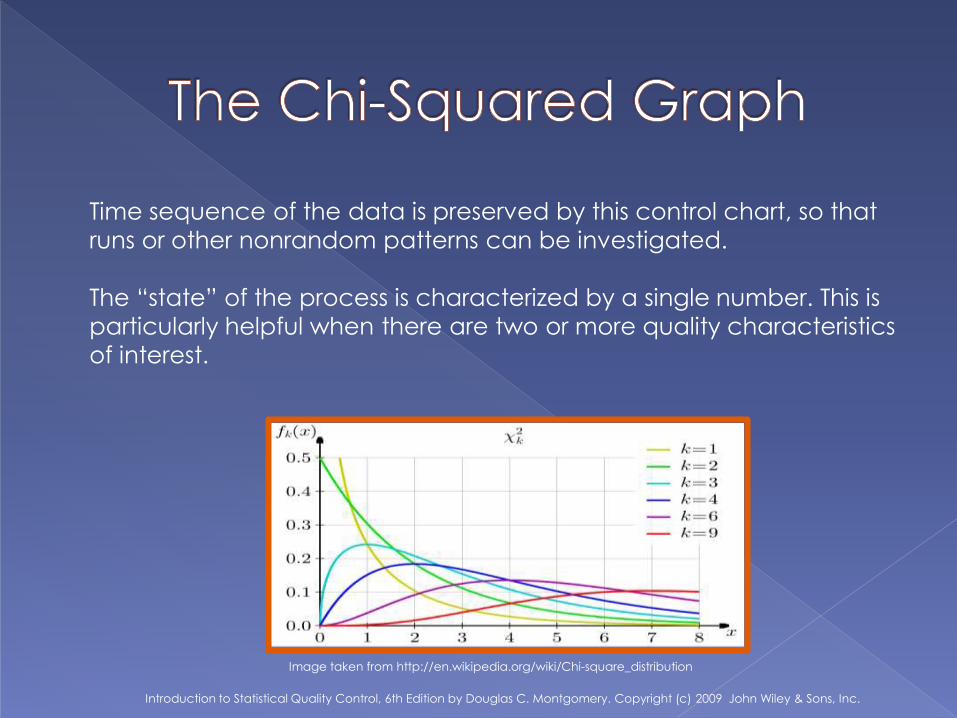
Image taken from http://en.wikipedia.org/wiki/Chi-square_distribution
Time sequence of the data is preserved by this control chart, so that
runs or other nonrandom patterns can be investigated.
The “state” of the process is characterized by a single number. This is
particularly helpful when there are two or more quality characteristics
of interest.
Introduction to Statistical Quality Control, 6th Edition by Douglas C. Montgomery. Copyright (c) 2009 John Wiley & Sons, Inc.
Introduction to Statistical Quality Control, 6th Edition by Douglas C. Montgomery. Copyright (c) 2009 John Wiley & Sons, Inc.
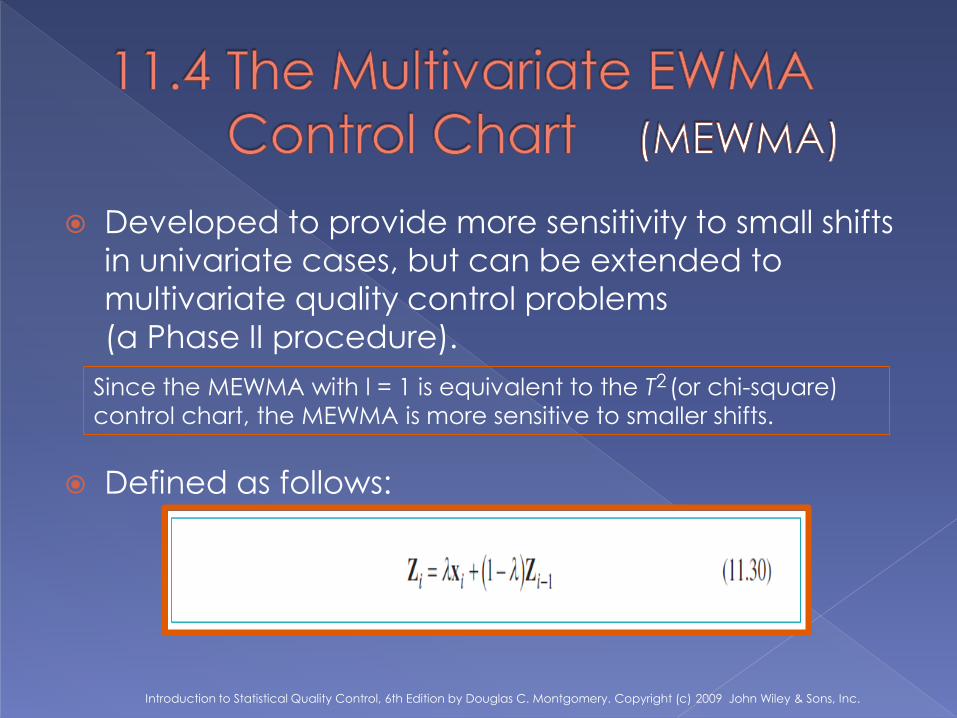
Developed to provide more sensitivity to small shifts
in univariate cases, but can be extended to
multivariate quality control problems
(a Phase II procedure).
Defined as follows:
Since the MEWMA with l = 1 is equivalent to the T (or chi-square)
control chart, the MEWMA is more sensitive to smaller shifts.
2
Introduction to Statistical Quality Control, 6th Edition by Douglas C. Montgomery. Copyright (c) 2009 John Wiley & Sons, Inc.
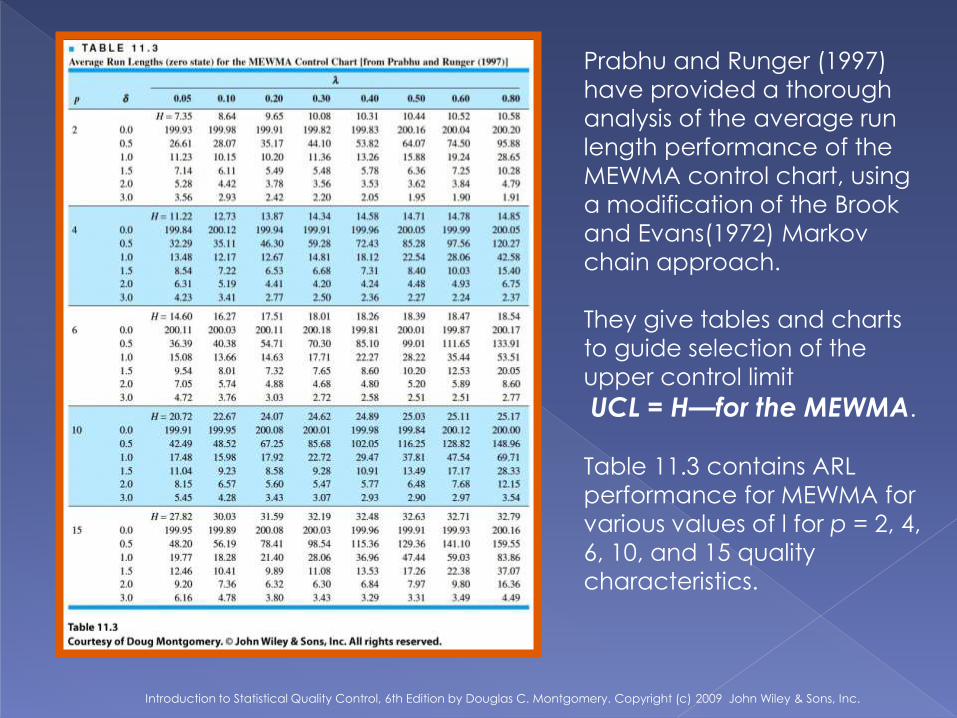
Prabhu and Runger (1997)
have provided a thorough
analysis of the average run
length performance of the
MEWMA control chart, using
a modification of the Brook
and Evans(1972) Markov
chain approach.
They give tables and charts
to guide selection of the
upper control limit
UCL = H—for the MEWMA.
Table 11.3 contains ARL
performance for MEWMA for
various values of l for p = 2, 4,
6, 10, and 15 quality
characteristics.
Regression adjustments are often made to experimental data.
Since randomization does not justify the models, almost anything
can happen.
Each subject has two potential responses, one if treated and the
other if untreated. Only one of the two responses is observed.
Regression estimates are generally biased, but the bias is small with
large samples.
Adjustment may improve precision, or make precision worse;
standard errors computed according to usual procedures may overstate the precision, or understate, by quite large factors. Asymptotic expansions make these ideas more precise.
David A Freedman. Statistics Department, University of California, Berkeley CA
Introduction to Statistical Quality Control, 6th Edition by Douglas C. Montgomery. Copyright (c) 2009 John Wiley & Sons, Inc.
Process variability is summarized by the p x p covariance matrix Σ.
The main diagonal elements of this matrix are the variances of the
individual process variables, and the off-diagonal elements are the covariances.
Monitoring multivariate processes requires attention on two levels:
process mean vector m and process variability
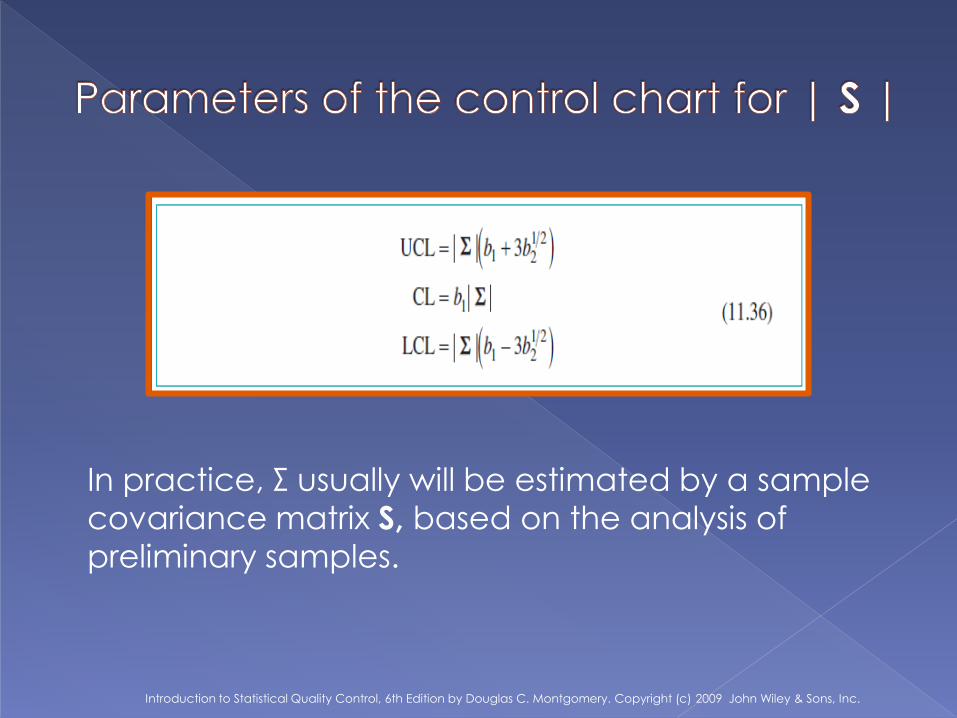
In practice, Σ usually will be estimated by a sample
covariance matrix S, based on the analysis of
preliminary samples.
Introduction to Statistical Quality Control, 6th Edition by Douglas C. Montgomery. Copyright (c) 2009 John Wiley & Sons, Inc.
Introduction to Statistical Quality Control, 6th Edition by Douglas C. Montgomery. Copyright (c) 2009 John Wiley & Sons, Inc.
Methods for discovering the subdimensions
in which the process moves about
Principal Components
Partial Least Squares
Introduction to Statistical Quality Control, 6th Edition by Douglas C. Montgomery. Copyright (c) 2009 John Wiley & Sons, Inc.
Introduction to Statistical Quality Control, 6th Edition by Douglas C. Montgomery. Copyright (c) 2009 John Wiley & Sons, Inc.
Introduction to Statistical Quality Control, 6th Edition by Douglas C. Montgomery. Copyright (c) 2009 John Wiley & Sons, Inc.
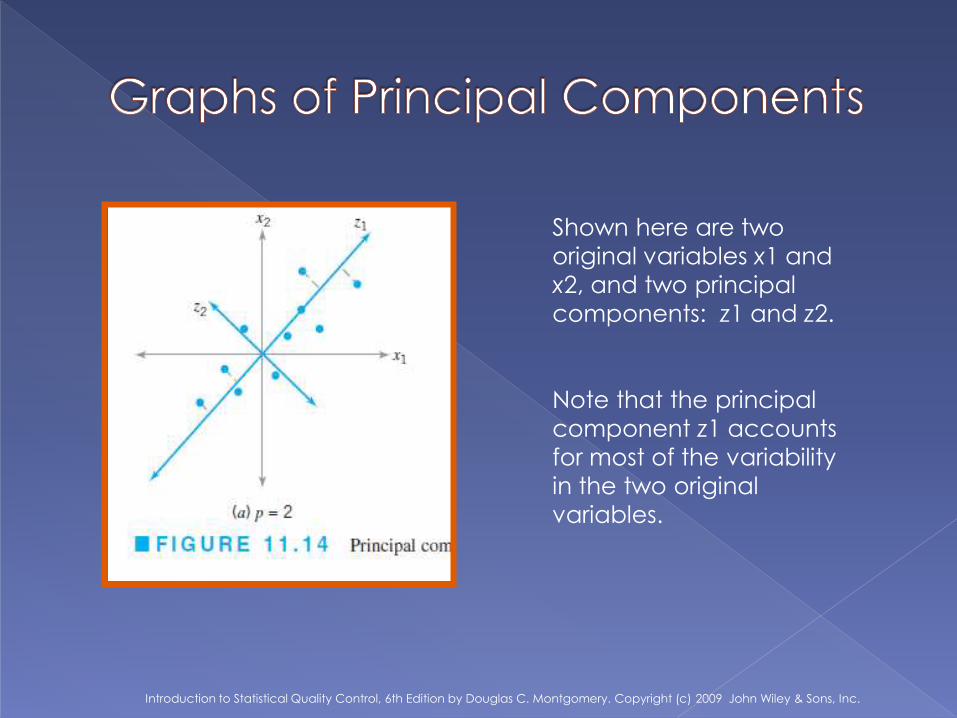
Shown here are two
original variables x1 and
x2, and two principal
components: z1 and z2.
Note that the principal
component z1 accounts
for most of the variability
in the two original
variables.
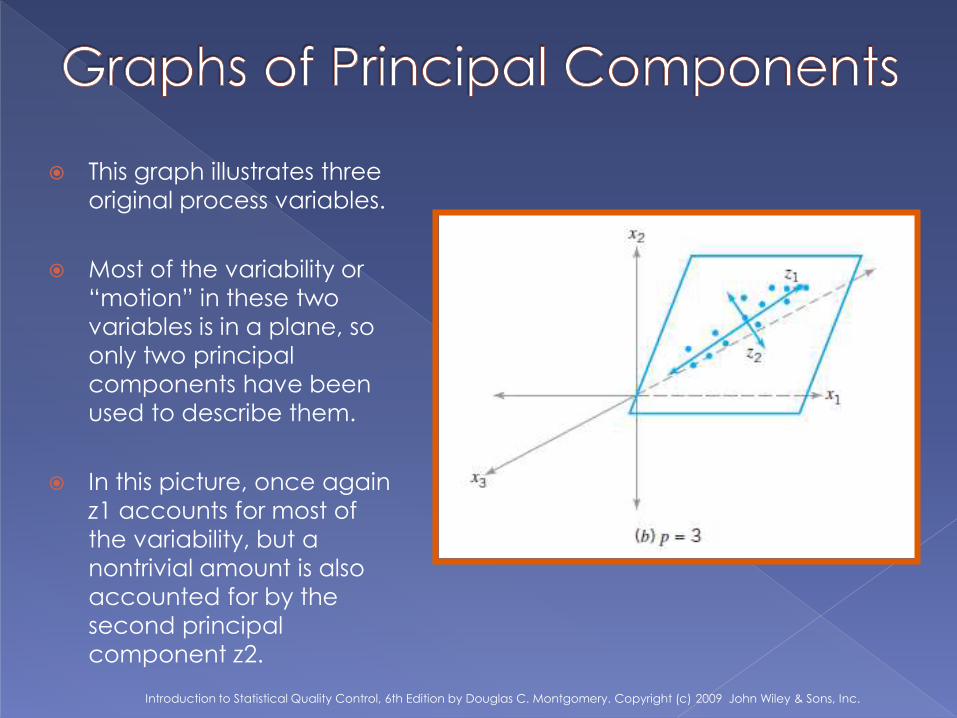
This graph illustrates three
original process variables.
Most of the variability or
“motion” in these two
variables is in a plane, so
only two principal
components have been
used to describe them.
In this picture, once again
z1 accounts for most of
the variability, but a
nontrivial amount is also
accounted for by the
second principal
component z2.
Introduction to Statistical Quality Control, 6th Edition by Douglas C. Montgomery. Copyright (c) 2009 John Wiley & Sons, Inc.
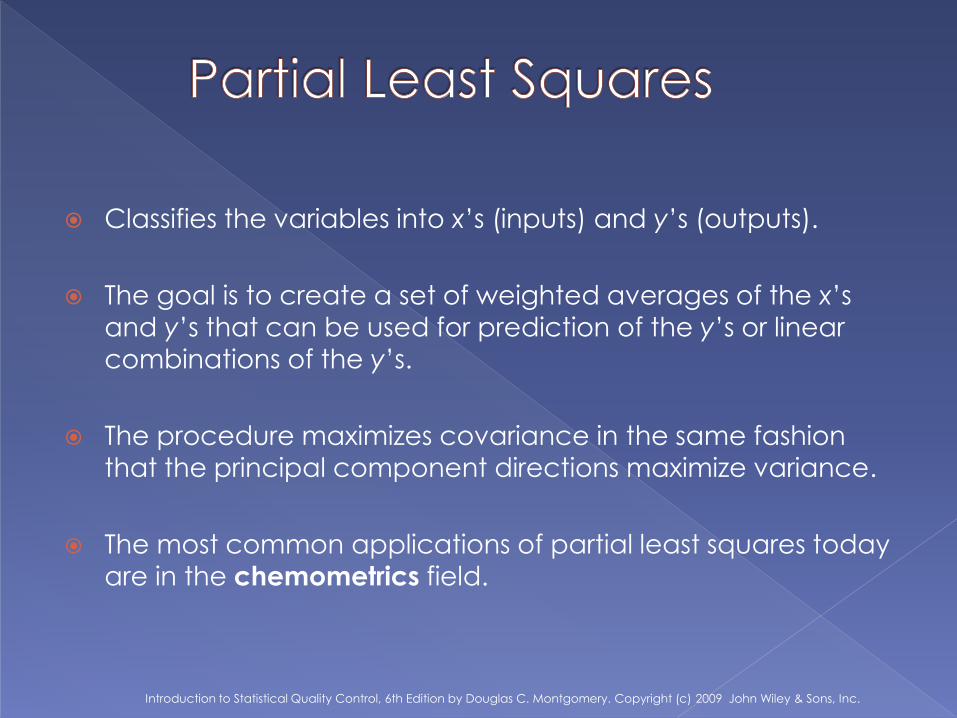
Classifies the variables into x’s (inputs) and y’s (outputs).
The goal is to create a set of weighted averages of the x’s
and y’s that can be used for prediction of the y’s or linear
combinations of the y’s.
The procedure maximizes covariance in the same fashion
that the principal component directions maximize variance.
The most common applications of partial least squares today
are in the chemometrics field.
Introduction to Statistical Quality Control, 6th Edition by Douglas C. Montgomery. Copyright (c) 2009 John Wiley & Sons, Inc.
In practice, many if not most, process monitoring and control scenarios involve several related variables.
Although applying univariate control charts to each individual variable is a possible solution, this is inefficient and can lead to erroneous conclusions.
Multivariate methods that consider the variables jointly are required.
Introduction to Statistical Quality Control, 6th Edition by Douglas C. Montgomery. Copyright (c) 2009 John Wiley & Sons, Inc.
Chi-Squared graph. Retrieved 15 February 2014 from http://en.wikipedia.org/wiki/Chi-
square_distribution Freedman, D. A. 2008. On regression adjustments to experimental data. Advances in
Applied Mathematics vol. 40 (2008) pp. 180–93. Statistics Department, University of California, Berkeley CA Retrieved 15 February 2014 from http://www.stat.berkeley.edu/~census/neyregr.pdf
Montgomery, D.C. (2009). Introduction to Statistical Quality Control, 6th ed. John Wiley &
Sons, Inc. Multivariate Normal Distribution graph. Retrieved 15 February 2014 from
http://www.mathworks.com/help/stats/multivariate-normal-distribution.html
NIST/SEMATECH e-Handbook of Statistical Methods, retrieved 15 February 2014 from
http://www.itl.nist.gov/div898/handbook
Normal Distribution graph. Retrieved 15 February 2014 from http://imagehost.vendio.com/preview/cc/ccmautomotive/NormalDistributionSP500.gif