client satisfaction and quality of family planning
TRANSCRIPT

UNILAG Journal of Medicine, Science and Technology
1
CLIENT SATISFACTION AND QUALITY OF FAMILY PLANNING
SERVICES: A COMPARATIVE STUDY OF PUBLIC AND PRIVATE
FACILITIES IN LAGOS, NIGERIA
Udom CF1, *Okafor IP
1, Abiola AO
1
1Department of Community Health & Primary Care, College of Medicine, University of
Lagos, Nigeria.
*Corresponding Author:[email protected]
ABSTRACT
Client satisfaction and quality of care of family planning services affect contraceptive
uptake and continued usage of method. The study aimed to determine and compare client
satisfaction with quality of family planning services between public and private health
facilities in an urban area of Lagos, Nigeria.
A cross sectional study was carried out among consecutively recruited 240 women
accessing family planning services in July 2013 at public and private health facilities
(120 per facility). Data collection was done with exit interview, client-provider
interaction and facility audit questionnaires from measure evaluation. Data was analyzed
with epi-info and level of significance was set at 5% (p<0.05).
Major findings include: (public vs private) mean age was 35.5±5.5 years vs 37.9±7.5
years; mean waiting time (minutes), 24.8±11.7 vs 48.7±17.8 (p<0.001). Statistically
significant differences were observed in perceived long waiting time, (12.5%, 15/120) vs
(30%, 36/120) (p<0.001); active participation, (95.8%, 115/120) vs (100%, 120/120)
(p=0.020); client received method of choice, (66.3%, 56/80) vs (72.3, 60/83) (p=0.010).
Overall, private provider clients were better satisfied with services (93%, 112/120) than
clients in the public facility (88%, 105/120) (p <0.001).
The private provider clients were better satisfied with services. Training of public
providers on interpersonal relationship, counseling and communication skills is
recommended. Private providers should implement strategies to reduce waiting time.
KEY WORDS: Client satisfaction, Quality of care, Family Planning, Nigeria
INTRODUCTION
Client satisfaction is the differences between the expected service and the experience of
the service from the point of view of the client. Across the globe, understanding and
measuring client satisfaction has become a vital part of hospital/clinic management
strategies. Moreover, in most countries quality assurance and accreditation process
requires a regular measurement of client satisfaction (Matthew et al, 2001).
A study done to assess the interpersonal and organization dimension of client satisfaction
revealed that satisfaction influences whether a person seeks medical advice, complies

UNILAG Journal of Medicine, Science and Technology
2
with treatment and maintains a continuing relationship with practitioners (Westaway et al,
2003). A leading theorist in the area of quality assurance has emphasized that client
satisfaction is of fundamental importance as a measure of the quality of care because it
gives information on the provider’s success at meeting those client values and
expectations, which are matters on which the client is the ultimate authority (Donabedian,
1988).
Quality of care is a key component of health care delivery and therefore has an important
bearing on client satisfaction. Client satisfaction is a major factor that will determine
whether a client will seek medical care and also adhere to a prescribed treatment.
Dissatisfaction with health services may result in patients/clients not adhering to
treatment regimens and follow up appointments. They may even spread negative
information based on their perception to discourage people from using a health service
(Andaleeb et al, 2007).
Several factors such as low level of knowledge, low quality of services including non-
availability of contraceptive commodities, poor attitude of service providers, and low
status of women are reported responsible for low utilization of family planning services
in Nigeria (NPC, 2000). Hence, the need for continuous monitoring of quality of care
should be based on clients’ satisfaction and perception of quality of care (FMOH, 2004).
The total fertility rate in Nigeria is 5.7 and the contraceptive prevalence is still low with a
high unmet need for FP (NPC, 2009). The quality of care and level of satisfaction may
thus help women who want to prevent pregnancy but are uncertain about the use of
contraceptives (Jain, 1989).
Studies have shown that one principal determinant of uptake and continued utilization of
family planning services is overall client satisfaction with those services (Jain, 1989,
Mensch et al, 1996, Mariko, 2003, Williams et al, 2000). Studies of contraceptive
discontinuation rates have indicated that - with the exception of the desire to become
pregnant, the principal reason for discontinuation is dissatisfaction with the quality of
services (Blanc et al, 2002). Clients of private facilities are usually better satisfied than
clients in public facilities (Jitta et al, 2008, Hutchinson et al, 2011, Agha et al, 2009) even
when the technical quality of care provided are the same (Hutchinson et al, 2011, Agha et
al, 2009).
Higher levels of quality are likely to result in higher levels of client satisfaction but it is
important to determine any possible difference in quality of care between private and
public health facilities and which of these aspects of quality are more vital for achieving
higher client satisfaction. Thus the aim of this study, which was to determine and
compare client satisfaction and quality of family planning services between a public and
private health facility with large clientele base in Lagos, Nigeria.
UNILAG Journal of Medicine, Science and Technology
3
MATERIALS AND METHODS
STUDY SITES AND SETTING
The study was conducted in Oshodi-Isolo LGA, Lagos State, Nigeria. At the 2006 Census
it had a population of 621,509 people, and an area of 45 square kilometres (Osodi-Isolo
LGA, 2013). Existing public health facilities in the LGA include a general hospital, i.e.
the Isolo General Hospital and 12 Primary Health care Centers (HEFAMAA, 2013). In
addition, some Non-Governmental Organizations, agencies, and charity groups also
established health facilities providing varying degrees of health services. The two health
facilities studied were Isolo General Hospital which is a public facility and Planned
Parenthood Federation of Nigeria (PPFN) which is a private facility. PPFN is a not-for-
profit organization established over 25 years ago. It is one of the country’s most
experienced Sexual and Reproductive health (SRH) organization. Nationally, it delivers
around 10% of all family planning services. At Isolo-Oshodi LGA, where their main
office is situated, it offers family planning services to about 450 clients monthly. Isolo
General Hospital provides family planning services to about 350 clients monthly. Both
were purposively chosen because they serve majority of the family planning clients in
Oshodi-Isolo LGA, thereby serving as a large pool of desired respondents. A
comparative, cross-sectional study was carried out among women accessing family
planning services in July 2013 at these two centres. Only women who came solely for
family planning services were included, those who came for other maternity services like
ante natal care were excluded.
Using the formula for comparing two independent groups, an initial minimum sample
size of 94 respondents was calculated using the following parameters; statistical power
(80%); 95% confidence interval; satisfaction rates of 46.9%(public) and 63.6%(private)
(Hutchinson et al, 2011). However, 120 women were subsequently interviewed in each
facility to allow for 10 % non-response rate, hence giving a total sample size of 240.The
respondents were interviewed consecutively until the sample size was achieved.
DATA COLLECTION TOOLS AND PROCEDURE A structured interviewer-administered exit client questionnaire, facility Audit and client-
provider interaction observation tools adapted from MEASURE Evaluation QIQ were
used for data collection (MEASURE Evaluation, 2001).The Facility Audit was used to
determine the readiness of a facility to deliver services; the observation of the Client-
Provider Interaction (CPI) provided information about the exchange between the client
and the provider from the perspective of a clinician; and the Client Exit Interview
provided information about the quality of services received from the clients’ perspective
ie the clients’ experiences. Four research assistants collected data using the facility survey
and client exit interview. One hundred and twenty client exit interviews were conducted
for each facility, making a total of two hundred and forty respondents. The interviews
were conducted privately and not within ear shot of service providers so as to ensure un-

UNILAG Journal of Medicine, Science and Technology
4
biased responses. The principal researcher conducted the Facility Audit and an external
nurse with training on providing family planning services conducted the non-participant
client – provider interaction observation on 20 clients at each center.
The research instruments were pretested at similar public and private facilities both in an
urban area of Lagos. Ten client exit interviews and one client-provider observations were
conducted at each facility. Slight adjustments were made before actual study.
DATA MANAGEMENT
Data analysis was done with Epi-Info 3.5.1 version software package. Frequencies,
percentages and means were calculated. Inferential statistics using chi square and t-tests
were done and a significance level of 5 % was set (p< 0.05).
ETHICAL CONSIDERATIONS
Ethical approval was obtained from the Health Research and Ethics Committee of the
Lagos University Teaching Hospital. Permission was also obtained from medical
directors of the two selected centers. Respondents gave informed written consent before
interview and client confidentiality was ensured as the questionnaires were anonymous.
RESULTS
SOCIO-DEMOGRAPHIC CHARACTERISTICS OF RESPONDENTS A total of 240 respondents were interviewed for the study, one hundred and twenty from
each health facility. Respondents in private facility were older than respondent in public
facility with mean age of 35.5(5.5) years (public) and 37.9(7.5) years (private). The
difference was statistically significant (p<0.001). Respondents in public center were
better educated than respondents at private center with 96.7% (116/120) of them with
post primary educated compared with 89.2% (107/120) in private center. Almost all the
respondents 99% (119/120) in public center were married compared to 93% (112/120) in
private center. Respondents at both centers have same median number of living children
as 3. The difference observed was statistically significant (p=0.010). Although about one
third of respondents, 29.2% (35/120) desired to have another child in the future at both
centers, however, more respondents 41% (23/56) at public center will like to wait for
more than 2 years before having another child compared to 18.4 % (7/38) of the
respondents at private center. (Table 1)
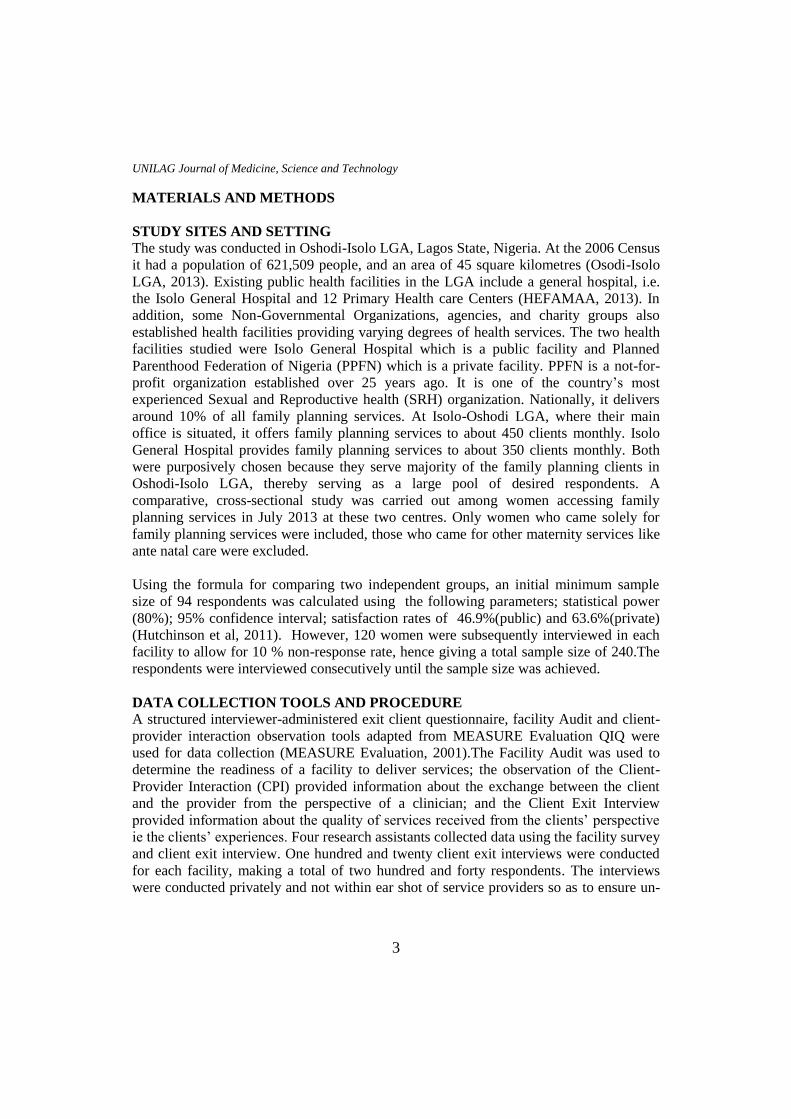
CONTRACEPTIVE METHODS RECEIVED BY RESPONDENTS
At the public center, 65.8%, 79/120 received their method of choice and at the private
center, 70%, 84/120 received their method of choice. The rest were either told their
method of choice was in-appropriate for them or they just came for counseling and
education on the various methods. At the public center, the most common methods
amongst new clients were implant (41.2%, 14/79) and intra uterine device (IUD) (29.4%,
10/34) while at the private center, they were IUD (34.6%, 9/26) and injectables (26.9%,

UNILAG Journal of Medicine, Science and Technology
5
7/26). For the re-visit clients, common methods were injectables and pills at both centers.
(Table 2)
WAITING TIME IN FACILITIES
The mean waiting time ie time taken from client presentation at the registration point
until consultation (minutes) in private center 48.7(17.8) was significantly longer than the
waiting time in public center 24.8(11.7). Waiting time for 56.7% (68/120) of the
respondents in the public center was less than 30 minutes as against only 7.5% (9) in the
private center. (Table 3)
CLIENT SATISFACTION AND QUALITY OF FAMILY PLANNING
RENDERED
More respondents 87.5% (105/120) at public center reported satisfaction with the waiting
time than respondents 70% (84/120) in private center. The private facility was rated
better in maintenance of privacy and treatment by other staff than the public facility.
(Table 4)
Perceived clients’ rating of the indicators of quality of family planning services showed
that private center was rated better than public center in various aspects like provider
discussing STI/AIDS (p=0.020), good treatment of client by other staff (p=0.020) and
active participation of clients in discussion p=0.020 and clients receiving their method of
choice (p=0.010). Public centre was rated significantly better in asking clients about
reproductive intentions (p<0.001) and having an acceptable waiting time (p<0.001)
(Table 5)
The indicators observed during client-provider interaction showed that providers in both
centers did not differ significantly in communication skills, information discussed and
following clinical procedures for injectables, pelvic examination and IUD insertion.
(Table 6)
With regards to facility readiness to offer quality FP services, the public facility did not
have mechanisms to make programmatic changes based on client feedback, had not
received a supervisory visit in the past six months prior to study and did not have clinical
guidelines. The private facility did not have acceptable waiting time ie less than 30
minutes. (Table 7)
Table 1: Social demographic and reproductive characteristics of respondents Variable Public
n=120
Freq (%)
Private
n=120
Freq (%)
Statistic p-value

UNILAG Journal of Medicine, Science and Technology
6
Age(years)
20-29
30-39
40-49
50-59
Mean no± SD
13(10.8)
81(67.5)
26(21.7)
0(0)
35.5(5.5)
20(16.6)
47(39.2)
45(37.5)
8(6.7)
37.9(7.5)
t-stat=0.86
p<0.001*
Marital status
Married
Single
119(99.2)
1(0.8)
112(93.3)
8(6.7)
χ2=5.66
p=0.020*
Educational Status
Primary
Secondary
Higher
4(3.3)
64(53.4)
52(43.3)
13(10.8)
54(45.0)
53(44.2)
χ2=5.62
p=0.060
No of children
0-4
>5
Median
109(90.8)
11(9.2)
3
95(79.2)
25(20.8)
3
t-stat=1.64
p=0.010*
Desire For More
Children
Yes
No
Don’t know
35(29.2)
64(53.3)
21(17.5)
35(29.2)
82(68.3)
3(2.5)
χ2=15.72
p<0.001*
Spacing for next
child
≤2years
>2years
Don’t know
n=56
23(41.1)
23(41.1)
10(17.8)
n=38
12(31.6)
7(18.4)
19(50.0)
χ2=11.77
p=0.003*
*Statistically significant
UNILAG Journal of Medicine, Science and Technology
7
Table 2: Contraceptive methods received by respondent Methods received Public
n=79
Freq (%)
Private
n=84
Freq (%)
New Clients
Pills
IUD
Injectable
Norplant
Condom
n=34
3(8.8)
10(29.4)
6(17.6)
14(41.2)
1(3)
n=26
5(19.2)
9(34.6)
7(27.0)
5(19.2)
0(0)
Re-Visit Clients
Pills
IUD
Injectable
Norplant
Condom
n=45
7(15.6)
4(8.9)
28(62.2)
4(8.9)
2(4.4)
n=58
14(24.1)
2(3.5)
39(67.2)
3(5.2)
0(0)
Table 3: Waiting time in facilities Variable Public
n=120
Freq (%)
Private
n=120
Freq (%)
Statistic p-value
Waiting
time(minutes)
<30
30-60
61-90
>90
Mean waiting time
68(56.7)
50(41.7)
2(1.6)
0(0)
24.8(11.7)
9(7.5)
69(57.5)
33(27.5)
9(7.5)
48.6(17.8)
t-stat=3.29
p<0.001*
Table 4: Respondent’s rating of the clinics Variables Public
n=120
Freq (%)
Private
n=120
Freq (%)
Statistics
p-value
Perception of waiting time
Short
Moderate
Long
10(8.3)
95(79.2)
15(12.5)
1(0.8)
83(69.2)
36(30.0)
χ2=16.82
p<0.001*
Privacy maintained
Yes
No
115(95.8)
5(4.2)
117(97.5)
3(2.5)
χ2=0.52
p=0.470
Treatment by other Staff
Very well
Well
Not well
4(3.3)
73(60.8)
43(35.8)
9(7.5)
111(92.5)
0(0)
χ2=52.77
p<0.001*
*statistically significant

UNILAG Journal of Medicine, Science and Technology
8
Table 5: Summary of indicators of quality of family planning services as perceived
by respondents Variables Public
n=120
Freq (%)
Private
n=120
Freq (%)
χ2 p-value
Provider
Asked client about reproductive
intensions
110(91.7)
84(70.0) 18.57 p<0.001*
Mentioned STI/AIDS (initiates or
responds)
29(24.2)
51(42.5)
12.46
p=0.020*
Discussed Dual method use
20(16.7)
15(12.5)
2.56 p=0.460
Gave instruction on how the method
accepted works
75(94.9)
81(97.6) 3.46
p=0.180
Gave instruction on when to return
118(98.3)
118(98.3)
Asked clients if she has any problems
(re-visit clients)
(n=76)
72(94.7) (n=93)
81(87.1)
2.85
p=0.091
Other staff
Treated client with dignity and respect 77(64.1) 120(100) 52.77
p<0.010*
Client
Participated actively in discussion &
selection of method (is empowered)
115(95.8)
120(100) 5.106
p=0.020*
Believed the provider will keep her
information confidential
116(96.7)
119(99.2)
1.838
p=0.180
Received her method of choice
(n=80)
56(66.3) (n=83)
60(72.3)
9.91
p=0.010*
Facility
Offers Privacy for clients 115(95.8) 117(97.5) 0.517 p=0.470
Has acceptable waiting time 105(87.5) 84(70) 16.82 p<0.001*
*Statistically significant

UNILAG Journal of Medicine, Science and Technology
9
Table 6: Summary of indicators of quality of family planning services as observed
during client- provider interaction Aspect of client provider interaction Public
n=20
freq(%)
Private
n=20
freq(%)
χ2 Fisher’s
p value
Counseling and communication skills 18 (90) 19 (95) 0.36 1.000
Information discussed 18 (90) 19 (95) 0.36 1.000
Performed clinical procedures according to guidelines for
Injectable
19 (95) 20 (100) 1.03 1.000
Performed clinical procedures according to guidelines for
pelvic examination
18 (90) 19 (95) 0.36 1.000
Performed clinical procedures according to guidelines for
IUD insertion n=10
9 (90) n=10
10 (100)
1.05 1.000
Table 7: Facility readiness to offer quality FP services Variables PUBLIC PRIVATE
Had all approved methods; no stock outs* YES YES
Had basic items needed for delivery of methods available YES YES
Offered privacy for pelvic exam/IUD insertion YES YES
Had mechanisms to make programmatic changes based on
client feedback
NO YES
Had received a supervisory visit in the past six months NO YES
Had adequate storage of contraceptives and medicines
(away from water, heat, direct sunlight) is on premise
YES YES
Had clinical guidelines NO YES
Had acceptable waiting time (less than 30 minutes) YES NO
*Methods the facilities can perform especially non surgical methods
DISCUSSION
From this study, clients’ rating at private center was better than those at public center in
most of the perceived measurable indicators such as client participation in selection of
method, treatment by other clinic staff, and provider mentioning STI/AIDS during
counseling. However, the public center was better with waiting time than private center.
Private respondents were older than public respondents with mean age of 37.9(7.5) years
(private) and 35.5(5.5) years (public). Most women would have been married at this age
and thus uptake of FP is expected to be higher. The current marital status of respondents
in both facilities was in keeping with the reports of 2008 NDHS in which about 70% of
women were either formally married or are living together (NPC, 2004).
Choice and continuous usage of contraceptives may be influenced by clients’ family size
and fertility intentions. The median number of children reported was 3 for both centers,

UNILAG Journal of Medicine, Science and Technology
10
however one third of the respondent in both centers 29.2% (35/120) desired to have more
children in future. This is in keeping with a study conducted in urban health facility
where 29% of the FP clients desired to have more children in future (Kuyinu, 2005). This
could infer that they came primarily for spacing.
In line with previous studies, about a quarter of FP clients were new (Williams, 2000).
However, the contraceptive methods that clients received differed between new and re-
visit clients in both centers. The most frequently used methods were Implants and IUD
(for new clients in the public centre) while it was injectables and IUD for new clients in
the private centre. The most common for re-visit clients in both centres were injectables
and pills. Use of pills and injectables require more frequent clinic visits for refill and
shots of injections unlike the more long lasting methods like IUD and implant. It is a
general belief that the long usage of injectables can cause delay in conception (Lacey,
1997), hence its popularity with re-visit clients who may have completed their family
size. This finding however, differs from an earlier study carried out in Bangladesh which
reported pills as the most commonly used method, followed by IUD and injectables
(Hanifi et al, 2001). The pill was not popular among our respondents.
One of the important factors related to client perceptions is the waiting time for services.
In most developing countries, a minimum package of health services has been developed
for all levels of health care for both the private and the public sector. The average waiting
time is recommended to be one hour but a larger study covering 3 African countries
found that there is a significantly longer waiting time in public health facilities than
private ones (Hutchinson et al, 2011).Contrary to this, our respondents in the public
facility had significantly shorter waiting time than those in the private facility. This delay
in the private facility resulted in dissatisfaction among their clients. It has been shown
that reduction of waiting time to 30 minutes was more important to clients than
prolongation of consultation times (Creel et al, 2002, Aldana et al, 2001). Higher stock-
out rates have also been reported in public facilities (Hutchinson et al, 2011) but in this
study, a significantly higher proportion of respondents in the private facility did not
receive their methods of choice. It may be that the desired methods were considered not
suitable for them.
An important indicator for continuity of care is whether provider has methods to
determine client opinion/feedback and gives instruction for follow–up (MEASURE
Evaluation, 2001). Only the private centre had a method to determine client opinion and
feedback through the use of Clients’ suggestion box but providers at both centers equally
discussed return visits. This will most likely increase subsequent utilization of service.
An important indicator for technical competence is provider counseling and
communication skills, where the information exchanged between clients and providers is
important. Private providers were perceived to have better client-provider interaction and

UNILAG Journal of Medicine, Science and Technology
11
personal relations. This is in keeping with findings in a comparative study measuring
client satisfaction and quality of FP services in public and private health facilities in
Tanzania, Kenya and Ghana (Hutchinson et al, 2011). All respondents in the private
facility testified that the staff treated them with respect and dignity and they felt very
involved in discussions and decisions concerning their visit. Providers and other staff in
the public facility should perhaps go an extra mile to be courteous to their clients at the
possible expense of shorter waiting time. On technical and procedural terms, these two
centres from observations, seemed to provide quality services equally for the procedures
observed. Just like in Kenya, technical quality of care provided in both public and private
facilities were similar and private providers were also better at managing interpersonal
aspects of care. The authors noted that higher level of client satisfaction at private
facilities could not be explained by differences between public and private facilities in
structural and process aspects of care (Agha et al, 2009). It is then obvious that the
clients’ perception of what is quality and their satisfaction certainly has a personal
undertone.
Indicators of “facility readiness” are used to determine the basic capacity of the facility to
provide reproductive health services (MEASURE Evaluation, 2001). Private center
having guidelines and supervisory monitoring demonstrate that accepted standards are in
place more than the public centre but in another study, the public facilities had better
management systems in place (Agha et, 2009). Acceptable procedures and practices are
more likely to occur if clinic personnel are able to easily refer to the guidelines while
supervisory visits remind staff of the need to maintain certain standards.
CONCLUSION
Overall, client satisfaction in the private facility was significantly higher but the technical
qualities in both centres were similar and good. The level of satisfaction with FP services
offered in both health centres and perceived quality of care based on availability of
commodity, observed physical condition of the facilities and providers' behaviors were
high. Providers in private centre were rated better than their public counterparts in
maintenance of privacy, treatment by other staff, confidentiality and active participation.
These are important aspects of quality of care that increase uptake of family planning
methods and continued usage of methods.
These facilities need to appropriate standards so as to include all basic elements of family
planning service provision. Improved quality will increase uptake of FP methods which
will benefit the health and well-being of women, families and the nation.
Effort to improve staff attitude in the public facility is recommended. Establishment of
more family planning clinics by private organizations can help reduce work load, thereby
reducing waiting time.
UNILAG Journal of Medicine, Science and Technology
12
STRENGTHS AND WEAKNESSES
This study adds to the body of knowledge on the subject matter especially in developing
countries where there is dearth of data. Validated tools were used for data collection and
centers which cater to the family planning needs of a large proportion of women in the
study area were used. The results cannot be generalized to the State.
ACKNOWLEDGEMENTS
We wish to thank the healthcare workers at the study sites for their co-operation and
assistance during the period of the study.
REFERENCES
Agha S, Do M.(2009). The quality of family planning services and client satisfaction in
the public and private sectors in Kenya. Int J Qual Health Care, 21:87-96
Aldana JM, Piechulek H, Ahmed A (2001). Client satisfaction and quality of health care
in rural Bangladesh. Bull of the World Health Organ, 79:512-517.
Andaleeb S, Siddiqui N, Khandakar S (2007). Patient satisfaction with health services in
Bangladesh. Health Policy Plan, 22:263-273.
Blanc AK, Curtis SL, Croft TN (2002).Monitoring contraceptive continuation: links to
fertility outcomes and quality of care. Stud FamPlann ; 33:127-140.
Creel LC, Sass JV, Yinger NV (2002). Client-Centered Quality: Clients’ Perspectives and
Barriers to Receiving Care. New Perspectives on Quality of Care. New York.
Population Council, 2
Donabedian A (1988).The quality of care. How can it be assessed? J Am Med Assoc,
260:1743-48.
Federal Ministry of Health [FMOH] (2004).National Family Planning/Reproductive
Health, Policy Guidelines and standard of Practice, Abuja, FMOH 2004.
Hanifi SM, Bhuiya A (2001). Family planning services in a low performing areas of
Bangladesh. Insights from field observations. J. Health PopulNutr, 19:209-214.
Healthcare Facilities Monitoring and Accreditation Agency (HEFAMAA) 2013, Lagos
State Ministry of Health, Alausa, Ikeja.
Hutchinson P, Do M, Agha S (2011).Client Satisfaction and the Quality of Family
Planning Services: A Comparative Analysis of Public and Private Health
Facilities in Ghana, Kenya, and Tanzania. BMC Health Serv Res,
11:203 doi:10.1186/1472-6963-11-203
Jain AK. (1989). Fertility reduction and the quality of family planning services. Stud
FamPlann, 20(1):1-16.
Jitta J, Arube-Wani J, Muyiinda H (2008) Study of client satisfaction with health services
in Uganda.Int J Equity Health, 9:109-115.
Kuyinu YA (2005).Clients’ perception of quality of family planning services in urban and
rural health facilities in Lagos State. Journal of Community Medicine and
Primary Health Care, 221:1-2.

UNILAG Journal of Medicine, Science and Technology
13
Lacey L, Adeyemi V, Adewuyi A (1997). A tool for monitoring the performance of
family planning programs in the public and private sectors: An application in
Nigeria. IntPerspect Sex Reprod Health, 32:162-167.
Mathew S, Beth E (2001).Guide to Assessing Client Satisfaction. Health system Trust
January 2001; 4:12-19.
Mariko M (2003). Quality of care and the demand for health services in Bamako, Mali:
the specific roles of structural, process, and outcome components. SocSci Med,
56(6):1183-1196.
MEASURE Evaluation Project, Monitoring and Evaluation Subcommittee of the
Maximizing Access and Quality Initiative 2001. Quick Investigation of Quality
(QIQ). A user’s Guide for Monitoring Quality of Care in Family Planning.
Measure Evaluation Manual Series, No. 2. MEASURE Evaluation, Carolina
Population Center, University of North Carolina Chapel Hill, 2001.
Mensch B, Arends K M, Jain A (1996).The impact of the quality of family planning
services on contraceptive use in Peru. Stud Fam Plan, 27(2):59-75.
National Population Commission (NPC) [Nigeria] and ICF Macro 2009. Nigeria
Demographic and Health Survey 2008.Abuja, Nigeria National Population
commission and ICF Macro.
National Population Commission (NPC) [Nigeria] and ORC Macro 2000. Nigeria
Demographic and Health survey 1999. Calverton, Maryland: National Population
commission and ORC/Macro.
National Population Commission (NPC) [Nigeria] and ORC Macro 2004. Nigeria
Demographic and Health Survey 2003. Calverton, Maryland: National Population
Commission and ORC/Macro.
Oshodi-Isolo Local Government directory. Available at
http://en.wikipedia.org/wiki/oshodi-Isolo.
Westaway M S, Rheeder P, Vanzyl D G, Seager J. R. (2003). Interpersonal and
organisational dimensions of patient satisfaction. Int J Qual Health Care, 15:337-
44.
Williams T, Schutt AJ, Cuca Y (2000). Measuring family planning service quality
through client satisfaction exit interviews. IntFam Plan Perspec, 26:57-73

UNILAG Journal of Medicine, Science and Technology
14
DEFORMATION BEHAVIOUR OF LED AND HILED CURED DENTAL
RESIN MICROHYBRID AND NANOFILLED COMPOSITES
Adeleye O.Aa, Fakinlede O.A.
a, Ajiboye J.S.
b, Adegbulugbe I.C.
c
aDepartment of Systems Engineering, University of Lagos, Lagos, Nigeria
bDepartment of Mechanical Engineering, University of Lagos, Lagos, Nigeria
cDepartment of Restorative Dentistry, College of Medicine of the University of Lagos, Idiaraba,
Lagos, Nigeria
ABSTRACT
The deformation behavior of commercial microhybridresin based composite (20/20
composite) and nanofilled composite (Light Cured Universal Composite) cured with the
conventional Light Emitting Diode (LED) and exponential Light Emitting Diode (HiLED)
under various loading condition have been investigated. Deformation of restorations
such as shrinkage and shearing from curing and mastication have been a major concern
for clinicians because of void and crack formations in restored tooth structure which
affects the mechanical properties of the resin composites. Samples of microhybridresin
based composite (20/20 composite) and nanofilled composite (Light Cured Universal
Composite) were molded with copper foil molds with standard dimension 2 x 2.5 x 8mm,
photo-cured by both conventional Light Emitting Diode (LED) and exponential Light
Emitting Diode (HiLED) and then tested on the Electro Force 3200 for their deformation
behavior and mechanical properties. Effects of variation of strain rate and curing time
were also investigated. The results showed that, out of the four groups of samples studied,
microhybridresin based composite (20/20 composite) cured with exponential Light
Emitting Diode (HiLED) exhibited highest tensile strength of 28 MPa. The loading and
unloading of the samples exhibited hysteresis responses and path dependence nonlinear
behavior. At stress values less than 4 MPa, rate dependent recoverable (viscoelasticity)
deformation was observed in all the four groups of samples but at stress values beyond 4
MPa rate dependent irrecoverable (viscoplasticity) deformation was observed. Finally, it
was observed that increasing curing time leads to increasing tensile strength for
materials cured by both methods.
Key words: Deformation, Dental-resin, Microhybrid, Nanofilled, Viscoelastic-
viscoplastic
1. Introduction
Dental Resin Composites were developed in the late 1950s (Ferreira et al., 2008).They
represent a class of materials widely used in restorative dentistry and have found
increasing application in modern preventive and conservative dentistry (Jandt and
Sigusch, 2009). These materials are also increasingly used for cosmetic purposes such as
reconstruction of anterior teeth, correction of stains and erosion, and alignment of teeth.
Gold was the first dental restoration material reported in the late fourteen hundreds

UNILAG Journal of Medicine, Science and Technology
15
(Sakaguchi et al., 2005, Powers and Sakaguchi, 2006). Many of the materials include
noble and base metals and their alloys, amalgam, resin composites, glass ionomers,
ceramics, cements, dental waxes, etc. Although chemistry, physics, and other engineering
sciences were the fundamental building blocks for developing restorative science,
systematic improvement in the mechanical properties were achieved only after principles
of mechanics were applied to biological restorative dentistry in the late nineteenth and
early twentieth centuries (Powers and Sakaguchi, 2006).
Mechanical testing plays an important role in evaluating fundamental properties of
engineering materials as well as in developing new materials and in controlling the
quality of materials for use in design and construction. If a material is to be used as part
of an engineering structure that will be subjected to a load, it is important to know that the
material is strong enough and rigid enough to withstand the loads that it will experience
in service. As a result engineers have developed a number of experimental techniques for
mechanical testing of engineering materials subjected to tension, compression, bending or
torsion loading. The utilization of the dental resin composites in conservative, preventive
or restorative dentistry has progressed significantly over several decades. However, in
spite of the superior properties of these materials, polymerization shrinkage and
deformation due to mastication are considered to be the major drawbacks of resin-
composite applications.
The necessary constitutive model for describing the deformation of dental resin
composites is not readily available in literature. Hence, there is need to investigate the
deformation behaviour in the response of these materials to various loading conditions.
Deformation behaviour of a human dentin under uniaxial compression including size and
rate effects has been studied by He and Swain, (2008), Zaytsev et al., (2011). The study
showed that the dentin is mechanically isotropic high elastic and strong hard tissue, which
demonstrates considerable plasticity and ability to suppress a crack growth.
In a study carried out by Shah et al., (2009), on Mechanistic aspects of fatigue crack
growth behavior in resin based dental restorative composites, the nanofilled composite
(Light Cured Universal Composite) showed lower fatigue threshold than the microhybrid
resin based composite (20/20 composite). The study only focused on the crack growth
behavior and not on the deformation behavior under compression or diametral tensile
loading condition. Other studies such as Luana et al., (2013) have investigated the
mechanical properties of nanofilled and microhybrid composites cured with conventional
Quartz Tungsten Halogen (QTH) for 40s, convention Light Emitting Diodes (LED) for
20sand exponential Light Emitting Diodes (HiLED) for 15s.A lot of research on dental
resin composites has shown that the deformation of the material to only curing shrinkage
is nonlinear and rate dependent but the deformation of this material due to mastication is
still unknown.
UNILAG Journal of Medicine, Science and Technology
16
Few of these study include the following: Laughlin, (2003) developed a viscoplastic
model for the shrinkage of dental resin composites due to curing and simulated the
nonlinear behaviour by using FEM program. Patham, (2009) implemented a viscoelastic
model with cure – temperature – time superposition principle into the COMSOL
Multiphysics software. The base equations in the software were modified for the
implementation. High stresses were also observed in the model results. Dauvillier et al.,
(2000) and Gambin, (2010) proposed a viscohypoelastic model for the estimation of
shrinkage stress in the photo-cured dental restorations. His proposition is based on the
Maxwell model, in which the Young’s modulus and viscosity were continuous functions
of time. An incremental analysis of the process which was carried out enables the
formulation of an integral model with an explicit rule for the shrinkage stress for 1D and
3D cases. However, the results gave too high stress values which did not agree with the
experimental data and plastic deformation was not considered in his analysis.
Various constitutive models have been developed for rate dependent nonlinear
deformation behaviour of polymeric materials. Although a few studies have been done on
identifying material deformation behavior and constitutive models for shrinkage of resin
based restorative composites, its deformation behavior under uniaxial tensile or repeated
loading has not been properly characterized. Hence, the aim of this study is to investigate
the mechanical properties and deformation behaviour of the Microhybridresin based
20/20 composite and Nanofilled Light Cured Universal Composite which are cured with
the conventional Light Emitting Diodes for 20 seconds and exponential Light Emitting
Diodes for 5 seconds. The effect of in curing times on the mechanical properties of the
resin composites was also investigated.
The stress relaxation test is a popular way for studying the changes in properties of
polymeric material during ageing. Stress relaxation is the behaviour of polymeric
materials wherein if a constant strain is applied to this material, the force needed to
maintain that strain is not constant, but decreases with time. The process responsible for
stress relaxation may be chemical or physical in nature, and under all normal conditions
both types of process will occur simultaneously. However at low or normal temperatures,
and/or over a short time, stress relaxation is dominated by physical processes while over
long time periods or high temperatures chemical processes are dominant. The key factor
in achieving good reproducibility and repeatability while conducting the stress relaxation
test is to keep the temperature and compression force constant during all measurements.
Polymers are nonlinear and non-Hookean in behaviour because they are viscoelastic. The
nonlinearity in polymers can best be described by stress relaxation and a phenomenon
known as creep, which describes how polymers strain under constant stress. The cause of
Stress Relaxation is that viscous flow in the polymeric material’s internal structure occurs
by; (a) the polymer chains slowly sliding by each other, (b) by the breaking and
reforming of secondary bonds between the chains, and (c) by mechanical untangling and
recoiling of the chains.

UNILAG Journal of Medicine, Science and Technology
17
2. Materials and Methods
2.1 Materials
Two commercially available particle reinforced resin based dental restorative composites,
Filtek Z250 A3 Compules, a Universal Microhybrid Restorative, 20 - .20 Gm. Compules
which contains 60 vol% zirconia/ silica fillers with particle size ranging from 0.01 to
3.5_m (average 0.6_m) and matrix composition which is made up of Bisphenol A-
Glycidyl Dimethacrylate (Bis-GMA), Bisphenol A-Ethoxylate Dimethacrylate (Bis-
EMA), Urethane Dimethacrylate (UDMA) and Triethyleneglycoldimethacrylate
(TEGDMA), and the other restorative composite; Nanofilled Light Cured Universal Fine
Hybrid Nano Composite 4g, VITA A1which contains inorganic fillers; barium glass,
silicon dioxide and mixed oxide with the fillers’ particle size between 40 nm and 3 μm
were used in this study. The total content of fillers is 79 wt% or 61 vol% while its’ matrix
composition includes Bis-GMA, Urethane Dimethacrylate with 18.8% total monomer
content of TEGDMA. It should be noted that both microstructures have a mixture of large
and small filler particles, but in the case of the nanofilled the large particles are actually
clusters of smaller nanoparticles rather than solid particles.
2.2 Specimen Preparation
The specimens of the two resin based dental restorative composites; microhybrid and
nanofilled composites were prepared for testing using an aluminum split molds of
dimensions 2 x 2.5 x 8mm as specified by manufacturer’s instruction. (Loguercio et al.,
2004, Casselli et al., 2006, Juthatip et al., 2006, Luana et al., 2013). The molds were
filled with uncured composite and both the top and bottom surfaces were covered with
polyester strips that were pressed flat against each side of the mold to remove excess
material and provide uniform sample thickness. The aluminum molds filled with uncured
composites were then illuminated for polymerization with the light curing units’ one after
the other at the specified curing times. Two light curing units were used separately for
the polymerization of the dental restorative composites, Flash max2, cms, Dental Aps,
Copenhagen, Denmark, which emits light with an intensity of through its
diodes exponentially (Exponential Light Emitting DiodeHiLED) and Flashlite 2.0,
denmat which emits light with an intensity of conventionally (Light
Emitting Diode LED). The Flash max2 cures for five (5) seconds while the Flashlite 2.0
cures for twenty (20) seconds. The curing was done by placing the tip of the light guide
over the center of the mold and the light was activated for curing the specimens. Sixty
(60) samples were prepared for all the required tests. The rectangular bar shaped
specimens were then taken for the various experiments. The specimens were placed into
four groups as specified by different curing modes as Microhybrid cured with
Conventional Light Emitting Diodes (LED) continuous exposure to for
20s, Microhybrid cured with Exponential Light Emitting Diodes (HiLED) exposure to
for 5s, Nanofilled cured with Conventional Light Emitting Diodes (LED)

UNILAG Journal of Medicine, Science and Technology
18
continuous exposure to for 20s, Nanofilled cured with Exponential Light
Emitting Diodes (HiLED) exposure to for 5s.
2.3 Testing for Mechanical Properties and Deformation Behaviour
The BOSE® Electro Force (ELF) 3200 testing machine in conjunction with the
WinTest® control software located in the Material Testing Laboratory of Systems
Engineering Department of University of Lagos was used to conduct the various
experiments in uniaxial cyclic loading, uniaxial tension and stepwise loading to determine
the mechanical properties and investigate deformation behavior of the dental resin
composites. The tensile test on the dental resin composites are carried out in accordance
with ASTM standard D7205M – 06(2011) for polymeric materials at (270C) temperature.
The tip-ends of the specimens were glued to the micro-grips in vertical positions on the
testing machine. The specimens were subjected to a tensile force (using displacement
control of the ELF 3200 Instrument) at a crosshead speed of 0.5 until fracture.
maximum tensile strength was obtained from the test. Some samples of Microhybrid
dental resin composite were cured with the Conventional Light Emitting Diodes (LED) at
different set of times of 20, 30, 40, and 50 secs and were tested for tensile strength in
accordance with the ASTM standard aforementioned. As it was done in the earlier test,
the tensile tests were carried out at ambient (room) temperature (270C) in a temperature
controlled room. The effect of curing times on the stress-strain behaviour and tensile
strength was investigated. The effect of strain rates on the tensile strength of the dental
resin composites was also investigated. The tensile tests were done at the following strain
rates or crosshead speeds of , , , and until fracture.
Fatigue cyclic tests were done at the same ambient (room) temperature (270C) using the
displacement control tool on the ELF 3200 mechanical testing machine (BOSE® Electro
Force (ELF) 3200, 450 KN)between a minimum and maximum load in tension for a
prescribed test frequency of 2 Hz. This was chosen because it matches the upper range of
the typical human chewing frequency (Shah et al., 2009) and it is also considered
clinically relevant. Due to the viscoelastic properties of the resin matrix, higher test
frequencies may affect fatigue results. For example, it has been suggested that high test
frequencies could lead to internal heating during fatigue testing (Loughran et al., 2005).
The fatigue test were done in accordance with ASTMD3479M - 12 for testing for fatigue
strength in polymeric materials.
Rate dependent recoverable and irrecoverable deformation of the dental resin composites
were determined by the Multiple Stress Creep Recovery (MSCR) tests which were done
in accordance with (ASTM D7405 - 08). The Multiple Stress Creep Recovery (MSCR)
Tests are temperature dependent, hence they were carried out in a controlled room at
ambient temperature (300C) using the ELF 3200 mechanical testing machine. The
Multiple Stress Creep Recovery (MSCR) test involves applying loads in steps and each
loading step is followed by recovery period, where no load is applied. Ten loading –

UNILAG Journal of Medicine, Science and Technology
19
unloading cycles were applied in the test with the stress level between 5 - 50 MPa. The
test applies step loading where one load cycle is comprised of 1.0 second of loading
followed by 9.0 seconds of unloading or recovery within each cycle. The MSCR test
provides valuable data regarding the rate dependency of the composites. Stress relaxation
tests were also done to ASTM standards (ASTM F1276 – 99 (2009)). The stress
relaxation tests were carried out at ambient temperature using displacement control of the
ELF 3200 Instrument at a crosshead speed of 0.5 to a certain displacement
value and then put on hold at that displaced value. At constant displacement (strain), there
was progressive decrease in the stress values. This test describes how polymers relieve
stress under constant strain.
3. Results and Discussion
3.1 Tensile Strength
The maximum tensile stress before fracture of the four groups of specimens shown in
Figure 3.1 (a), (b) are plotted as functions of time and strain respectively. The data were
obtained through the Wintest software installed on the ElectroForce test instrument.
Several samples fractured inadvertently prior to successful tests and data collection. It
was observed from the results of the tensile tests presented in Figure 3.1 for the four
samples of resin composites, that the deformation of the composites to axial loading is
geometrically nonlinear and time dependent since it has delayed response to axial
loading. The microhybrid cured with the exponential light emitting diode (HiLED)
exhibited the maximum tensile stress of , the microhybrid cured with LED
exhibited a maximum tensile stress of 27 , the nanofilled cured with HiLED
exhibited 23 , while the nanofilled cured with LED exhibited the lowest tensile
stress of .
Figure 3.1: (a) Variation of Stress against time for groups of material (b) Stress-Strain behaviour of
the tested samples of resin composites
In addition, the test revealed that both materials (microhybrid and nanofilled) cured with
exponential light emitting diodes (HiLED) exhibit higher tensile strength than when they
UNILAG Journal of Medicine, Science and Technology
20
cured with conventional light emitting diodes (LED). This suggests that the light intensity
increases the tensile strength. The result obtained in this study corroborates other works
(Luana et al., 2013).
The canonical probe of mechanical properties is the tensile test, whereby a standard
specimen is pulled apart in uniaxial tension. The force and displacement are recorded
during the test and usually normalized by the specimen geometry to provide a plot of
stress versus strain. From this, valuable information about the mechanical behaviour and
the engineering performance of the materials can be obtained. Tensile strength test is a
common and acceptable test for dental composites (Giannini 2004, Juthatip et al., 2006,
Luanaet al., 2013). It provides an important indication of the ability of the restorative
material to withstand tensile stress generated during mastication. High tensile strength
values are important for greater efficiency in supporting occlusal forces.
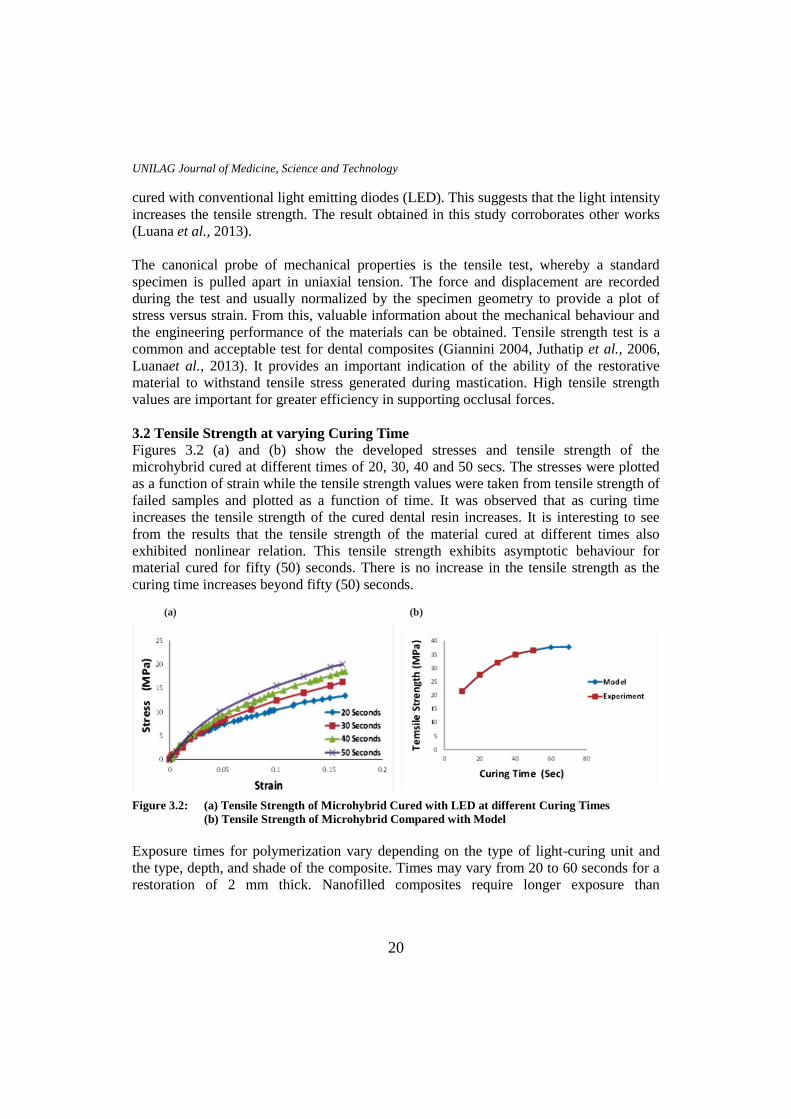
3.2 Tensile Strength at varying Curing Time
Figures 3.2 (a) and (b) show the developed stresses and tensile strength of the
microhybrid cured at different times of 20, 30, 40 and 50 secs. The stresses were plotted
as a function of strain while the tensile strength values were taken from tensile strength of
failed samples and plotted as a function of time. It was observed that as curing time
increases the tensile strength of the cured dental resin increases. It is interesting to see
from the results that the tensile strength of the material cured at different times also
exhibited nonlinear relation. This tensile strength exhibits asymptotic behaviour for
material cured for fifty (50) seconds. There is no increase in the tensile strength as the
curing time increases beyond fifty (50) seconds.
(a) (b)
Figure 3.2: (a) Tensile Strength of Microhybrid Cured with LED at different Curing Times
(b) Tensile Strength of Microhybrid Compared with Model
Exposure times for polymerization vary depending on the type of light-curing unit and
the type, depth, and shade of the composite. Times may vary from 20 to 60 seconds for a
restoration of 2 mm thick. Nanofilled composites require longer exposure than

UNILAG Journal of Medicine, Science and Technology
21
microhybrid composites because the small filler particles scatter the light more than the
larger filler particles. Longer exposure times are needed to obtain adequate depth of cure
of nanofilled composites and consequently higher strength. The light intensity at the resin
surface is a critical factor in completeness of cure at the surface and within the material.
A standard exposure time using most visible lights is 20 seconds (Luana et al.,2013). In
general, this is sufficient to cure a light shade of resin to a depth of 2 or 2.5 mm. A 40-
second exposure improves the degree of cure at all depths, but it is required to obtain
sufficient cure with the darker shades. And as the exposure time increases beyond this
point, the ultimate strength becomes asymptotic and at 60- seconds, the increase in
ultimate strength becomes insignificant.
3.3 Tensile Strength at varying Strain rates
The results of the tensile test at varying strain rate is presented in Figures 3.3 (a) and (b)
The result showed the behaviour of microhybrid cured with LED tested at different strain
rates of , , , and The maximum stresses increased by 6.97,
27.36 and 28.8% respectively as the strain rates increases by a factor of five (5). It is
observed from the test that as the strain rate increases, the tensile strength increased. This
suggests that the strength of the material is significantly affected by the increase strain
rates. It can be observed in Figure 3.3 (b) that as the strain rate increases, there is a
corresponding increase in the strains and stresses.
(a) (b)
Figure 3.3: (a)Effect of strain rate on microhybrid cured with LED
(b) Effect of strain rate on stress-strain behaviour
Some materials yield different tensile strengths when tested at different rates of loading
and are described as being strain-rate sensitive.
3.4 Fatigue of Microhybrid Cured with LED and HiLED: The results of fatigue cyclic loading for microhybrid cured with both curing lights shown
in Figures 3.4 (a-d) are plots of stresses as functions of strains. These results show that
the response of the materials when subjected to repeated uniaxial loading and unloading
is path dependent (viscoelasticity). The hysteresis loop shows the amount of energy lost
in a loading and unloading circle.As observed in the fatigue cyclic result, hysteresis loop

UNILAG Journal of Medicine, Science and Technology
22
is obtained in the stress–strain curve, with the area of the loop being equal to the energy
lost during the loading cycle. The hysteresis shows the path dependence of the
deformation behavior. This is a characteristic of a viscous material. Since viscosity is the
resistance to thermally activated plastic deformation, a viscous material will lose energy
through a loading cycle. Plastic deformation results in lost energy, which is
uncharacteristic of a purely elastic material's reaction to a loading cycle.
(a) (b)
(d)
Figure 3.4: (a) One cycle of uniaxial loading and unloading of Microhybrid cured with LED
(b) Several cycles of uniaxial loading and unloading of Microhybrid cured with LED
(c) One cycle of uniaxial loading and unloading of Microhybrid cured with HiLED
(d) Several cycles of uniaxial loading and unloading of Microhybrid cured with HiLED
3.5 Rate Dependent Recoverable and Irrecoverable Deformation From
Multiple Stress Creep Recovery (MSCR)
The results of the Multiple Stress Creep Recovery (MSCR) tests for the
microhybrid cured with HiLED and LED are presented in Figures 3.5(a) and (b).
These results showed that, every step load is followed by an unloading or
recovery period. A closer observation revealed that, the unloading period returned
to zero (0) strains within the first eighteen (18) to twenty (20) seconds of the tests
which showed material rate dependent elasticity (viscoelasticity). After this period
(i.e. twenty (20) seconds), the strains did not return fully to zero (0) strains which
showed that some irrecoverable or permanent deformation had set in. At twentieth
(20th) second, the value of strain obtained was 0.02. At this 20th
second, the yield
point is specified and the yield stress can be obtained from the set of result. As the

UNILAG Journal of Medicine, Science and Technology
23
tests progressed, the graphs showed an accumulation and gradual exponential
growth in the irrecoverable deformation (strains). This exponential growth
suggests a progressive and irrecoverable failure of material after yield point. The
exponential growth will continue until the material fractures. The total strain is the
sum of the recoverable and irrecoverable strains detected in the deformed
material.
(a) (b)
Figure 3.5: MSCR Test Result for Total Strain versus experimental time for MicroHybrid cured with
(a) LED and (b) HiLED
The stress values obtained in the Multiple Stress Creep Recovery tests for microhybrid
are shown in Figures 3.6 (a) and (b), viscoplastic strains were detected in the tests after
eighteen (18) to twenty (20) seconds. Consequently, it can therefore be shown, from
Figures 3.6 (a) and (b), that the stress value at the time (eighteen (18) to twenty (20)
seconds) the viscoplastic strains were detected was .
(a) (b)
Figure 3.6: MSCR Test Result for Stress versus experimental time for Microhybrid Cured with
(a) LED and (b) HiLED
In the case of nanofilled cured with both LED and HiLED, the result as shown in Figures
3.7 (a) and (b), also shows that the unloading period returns to zero (0) strains within the
first seven (7) seconds of the tests, after which irrecoverable strains were also detected.

UNILAG Journal of Medicine, Science and Technology
24
Similarly, a strain of 0.015 was obtained in the nanofilled material shortly before the
irrecoverable strains set in.
(a) (b)
Figure 3.7: MSCR Test Result for Total Strain versus experimental time for Nanofilled cured with
(a) LED and (b) HiLED
Similarly, the stress values obtained in the Multiple Stress Creep Recovery tests for
nanofilled are presented in Figures 3.8 (a) and (b). From Figures 3.7 (a) and (b), the stress
value at the time the viscoplastic strains were detected was MPa. (See Figures 3.8 (a)
and (b).
(a) (b)
Figure 3.8: MSCR Test Result for Stress versus experimental time for Nanofilled Cured with
(a) LED and (b) HiLED
The Multiple Stress Creep Recovery (MSCR) tests clearly demonstrated that at stress
level lower than 4 MPa, recoverable time dependent (viscoelastic) strains are only present
in the material while at higher stress values than 4 MPa, irrecoverable time dependent
(viscoplastic) strains begins to accumulate in the material.
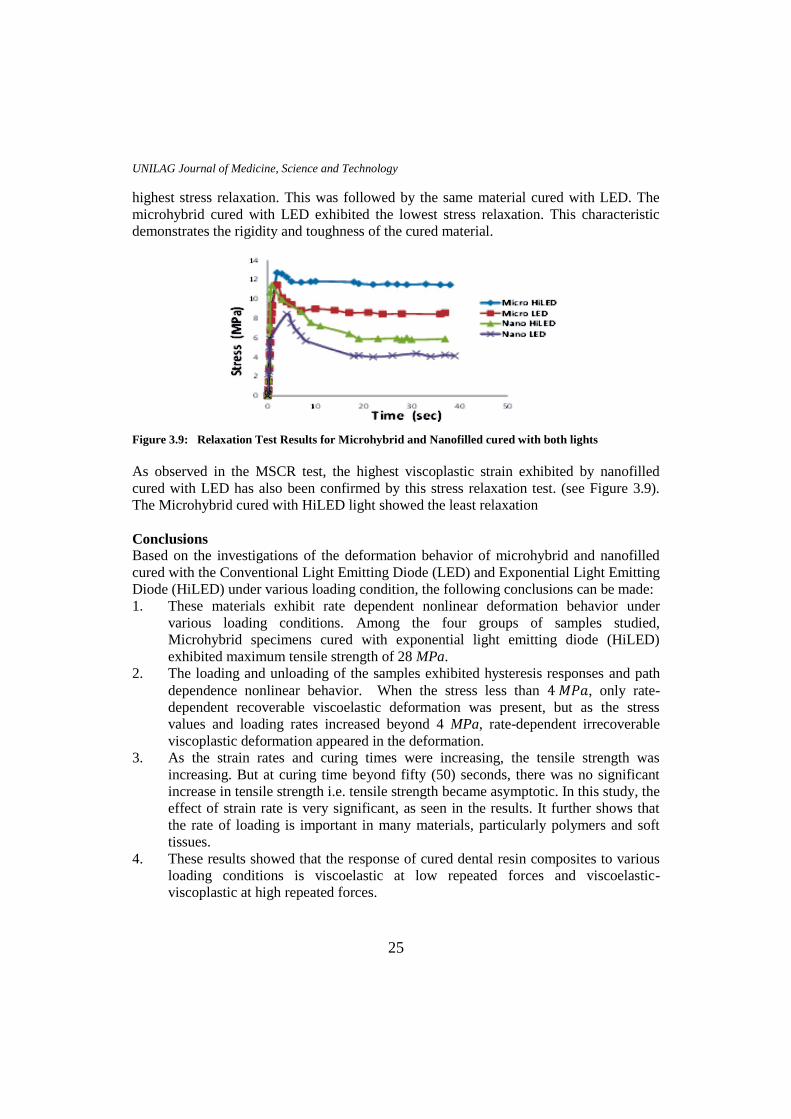
3.6 Relaxation Test
The result of the stress relaxation test for the four materials tested is presented in Figure
3.9. From this result, the nanofilled resin composites cured with HiLED lights exhibited
UNILAG Journal of Medicine, Science and Technology
25
highest stress relaxation. This was followed by the same material cured with LED. The
microhybrid cured with LED exhibited the lowest stress relaxation. This characteristic
demonstrates the rigidity and toughness of the cured material.
Figure 3.9: Relaxation Test Results for Microhybrid and Nanofilled cured with both lights
As observed in the MSCR test, the highest viscoplastic strain exhibited by nanofilled
cured with LED has also been confirmed by this stress relaxation test. (see Figure 3.9).
The Microhybrid cured with HiLED light showed the least relaxation
Conclusions
Based on the investigations of the deformation behavior of microhybrid and nanofilled
cured with the Conventional Light Emitting Diode (LED) and Exponential Light Emitting
Diode (HiLED) under various loading condition, the following conclusions can be made:
1. These materials exhibit rate dependent nonlinear deformation behavior under
various loading conditions. Among the four groups of samples studied,
Microhybrid specimens cured with exponential light emitting diode (HiLED)
exhibited maximum tensile strength of 28 MPa.
2. The loading and unloading of the samples exhibited hysteresis responses and path
dependence nonlinear behavior. When the stress less than , only rate-
dependent recoverable viscoelastic deformation was present, but as the stress
values and loading rates increased beyond 4 MPa, rate-dependent irrecoverable
viscoplastic deformation appeared in the deformation.
3. As the strain rates and curing times were increasing, the tensile strength was
increasing. But at curing time beyond fifty (50) seconds, there was no significant
increase in tensile strength i.e. tensile strength became asymptotic. In this study, the
effect of strain rate is very significant, as seen in the results. It further shows that
the rate of loading is important in many materials, particularly polymers and soft
tissues.
4. These results showed that the response of cured dental resin composites to various
loading conditions is viscoelastic at low repeated forces and viscoelastic-
viscoplastic at high repeated forces.

UNILAG Journal of Medicine, Science and Technology
26
Recommendation
Further experimental study should be conducted to investigate the effects of temperature
on the deformation behaviour of dental resin composites.
Acknowledgement
The Lagos State Research and Development Council (UNILAG/LRDC NO. 2014/06) is
gratefully acknowledged for their support of this research.
References
Aguiar, F.H.B., Braceiro, A.T.B., Ambrosano G.M.B., Lovadino, JR. (2005), “Hardness
and diametral tensile strength of a hybrid composite resin polymerized with
different modes and immersed in ethanol or distilled water media”. Journal of
Dental Material; Vol.21, (10), pp. 98-103.
Baran G., Boberick, K. McCool, J. (2001) “Fatigue of restorative materials”. Crit Rev
Oral Biol Med; 4(12): 350–360.
Bernardo, M., Luis, H., Martin, M., Leroux, B., Rue, T., Leitão, J, (2007).”Survival and
reasons for failure of amalgam versus composite posterior restorations placed in a
randomized clinical trial”. Journal of Dent Assoc Vol. 138: pp. 775–783.
Casselli, D.S.M., Worschech, C.C., Paulillo, L.A.M., Dias, C.T., (2006), “Diametral
tensile strength of composite resins submitted to different activation techniques”
Braz. Oral Res., Restorative Dentistry, Vol.20 (3), pp. 214-218.
Ferracane, J.L., (2006), “Hygroscopic and hydrolytic effects in dental polymer networks.
Dent Mater, Vol. 3 (22): pp.211–222.
Gambin W., (2010), “Visco-hypoelastic model of photo-polymerization process for small
changes of temperature” Archives of Mechanics, Vol.62, 5, pp. 379 – 403.
Garoushi, S., Lassila, L.V.J., Tezvergil, A., Vallittu, P.K. (2007) “Static and fatigue
compression test for particulate filler composite resin with fiber-reinforced
composite substructure”. Dent Mater; Vol.23: pp.17–23.
Kalra S., Singh A., Gupta M., and Chadha V. (2012), “Ormocer: An aesthetic direct
restorative material” Contemporary Clinical Dentistry Vol.3, 1, pp 48 – 53.
Karthick K., Kailasam S., Priya G., Shankar S., (2011), “Polymerization Shrinkage of
Composites – A Review” JIAD Vol. 2, Issue 2, pp 32 – 36.
Kowalczyk P., Gambin W., (2008), “Techniques of shrinkage stress reduction in dental
restorations” International Journal of Material Forming, Vol 1, pp. 755 – 758.
Kramer N., Lohbauer U., Garcia-Godoy F., Frankenberger R., (2008), “Light curing of
resin-based composites in the LED era” Review Article. American Journal of
Dentistry, Vol. 21, 3, pp.135–142.
Lohbauer, U., Frankenberger, R., Kramer, N., (2006). “Strength and fatigue performance
versus filler fraction of different types of direct dental restoratives”. Journal of
Biomed Mater Res B ApplBiomater Vol. 1 (76): pp.114–120.

UNILAG Journal of Medicine, Science and Technology
27
Lopes L.G., Franco E.D., Pereira J.C., Mondelli R.F., (2008), “Effect of Light curing
units and activation mode on polymerization shrinkage and shrinkage stress of
composite resins” Journal of applied oral sciences. Vol 16. 1. Pp. 35 – 42.
Luana, F.P., Eliane, B.A., Bruno, P.A., Rafael, Y.B., Carmen, G.B., Cecy, M.S., (2013),
“Mechanical properties of nanofilled and microhybrid composites cured by
different light polymerization modes” Dental Materials, Academy of General
Dentistry. pp.30-33.
Manhart, J, Chen, H.Y., Hickel R. (2001) “The suitability of packable resin-based
composites for posterior restorations”. Journal of Dental Association, Vol.132,
(5), pp. 639-645.
Shar, M.B., Ferracane, J.L., Kruzic, J.J., (2009) “Mechanistic aspects of fatigue crack
growth behavior in resin based dental restorative composites” Dental materials,
25, 909 – 916
Soares, C.J., Celiberto L., Dechichi P., Fonseca R.B., Martins L.R.M., (2005), “Marginal
integrity andmicroleakage of Direct and Indirect Composite Inlays: SEM and
stereomicroscopic evaluation”. Brazilian Oral Restoration; Vol.19(4): pp.295-
301.
Soares, C.J., Pizi E.C., Fonseca, R.B., Martins, L.R.M., (2005) “Mechanical properties of
light-cured composites polymerized with several additional post-curing
methods”.Oper Dent. Vol. 30 (3): pp. 389-394.
Tolosa, M.C.C.G., Paulillo, L.A.M.S., Giannini, M., Santos, A.J.S., Dias C.T.S., (2005)
“Influence of composite restorative materials and light-curing units on
diametrical tensile strength”.Braz Oral Res; Vol.19(2): pp.123-126.
Wakabayashi N., Ona M., Suzuki T., Igarachi Y., (2008) “Nonlinear finite element
analyses: Advances and challenges in dental application” Journal of Dentistry.
Vol. 36, pp. 463 – 471.
Zandinejad, A.A., Atai, M., Pahlevan A., (2006), “The effect of ceramic and porous
fillers on the mechanical properties of experimental dental composites”. Dent
Mater. Vol.22 (4): pp. 382-387.
Zhu S., Fan J., Wang C., (2009), “A 3D finite element analysis of stress in the interphase
of restoration – tooth structure due to polymerization shrinkage” Int. Chinese
Journal of Dentistry, Vol.9, pp. 1 – 8.