climate change adaptation in dayton, ohgraham.umich.edu/media/files/climate change adaptation in...
TRANSCRIPT

CLIMATE CHANGE ADAPT ATION IN DAYTON, OH
PAMELA BARCLAY • CAR A BASTONI • DAVID EI SENHAUER • MASOOMA H ASSAN •
MELODY LOPEZ • LEILA MEKIAS • SUNDEEP RAM ACHANDRAN • RYAN STOCK
JUNE 2013
2
EXECUTIVE SUMMARY
he city of Dayton is likely to experience multiple impacts due to a changing climate, such as increased
temperature, severe heat events, flooding, changes in disease vectors, and the introduction of invasive
species. Dayton possesses unique capacities and constraints that both enable and inhibit actions
needed to prepare for these anticipated changes. In our analysis, dedicated leadership emerged as one key
capacity that will likely help Dayton address historical and projected future changes in climate. While strong
leadership is key, our research also showed that access to sufficient information regarding climate change and
the financial and human resources needed to implement solutions are required to galvanize action.
Additionally, our research found that stakeholders find scientific information pertaining to climate change to
often be inaccessible and non-usable.
For the city of Dayton, decision-makers view climate change as a threat to existing plans aimed at increasing
the economic and social vibrancy of the city. The city government is highly focused making a Dayton a “city
of choice’ and consequently, attracting new and retaining existing residents and businesses. Adapting to
climate change dovetails with this broader city goal. Interviewees frequently framed environmental and social
policies as ways to brand Dayton as a place possessing a high quality of life. Adaptation would aid in creating
this identity. Climate change will also challenge social and economic goals. As demonstrated through
vulnerability mapping, substantial regions of the city remain at risk to climate change impacts, which have the
potential to constrain Dayton’s economic growth and vibrancy. Developing adaptation strategies which
protect Dayton’s waterfront, support vulnerable populations, and capitalize on the water resources of the
region can help the City to overcome some of the potential challenges which climate change may bring.
During the June 5, 2013 Climate Change Adaptation and Resiliency Workshop a SWOT analysis, vulnerability
maps, and an Adaptive Capacity Wheel were presented as tools for Dayton to use to more fully identify key
community vulnerabilities, inherent adaptive capacities and ultimately identify strategies to build resilience
towards climate change. During this workshop, important strategies for building the resiliency of Dayton
were suggested, including the creation of knowledge networks to gather information on adaptation projects
taking place in other cities and using regional networks to gather resources for adaptation. Incorporating
adaptation into the operations of key city departments, ensuring City infrastructure is updated and climate
resilient, and updating codes and ordinances to allow for green infrastructure were also recommended actions.
Dayton was one of four cities studied as part of this project. And while research showed that each study city
faces unique challenges there are, nevertheless, capacities within each city to mitigate existing and projected
future impacts, so long as each city begins to systematically plan for adaptation. If leaders are able to
capitalize on their strengths in order to create long-term and flexible plans, the four study cities of Dayton,
Elyria, Toledo, and Avon Lake will make important strides in becoming more resilient to climate change.
T

3
TABLE OF CONTENTS
Executive Summary ............................................................................................................................................................ 2
Project Background ............................................................................................................................................................ 4
Climate Change Adaptation .............................................................................................................................................. 5
Adaptive Capacity ........................................................................................................................................................... 5
Climate Change Impacts ............................................................................................................................................... 6
Dayton Capacities & Constraints ..................................................................................................................................... 7
Capacities ......................................................................................................................................................................... 7
Constraints....................................................................................................................................................................... 8
Assessment Tools ............................................................................................................................................................. 10
SWOT Analysis ............................................................................................................................................................ 10
Adaptive Capacity Wheel ............................................................................................................................................ 11
Applying the Adaptive Capacity Wheel .................................................................................................................... 13
Dayton Preliminary Vulnerability Analysis .............................................................................................................. 14
Best Practices & Recommendations .............................................................................................................................. 17
Knowledge Networks & Regional Partnerships...................................................................................................... 18
Identifying and Retaining Adaptation Funding ....................................................................................................... 18
Climate Adaptation Planning Strategies.................................................................................................................... 19
Project Cities Comparison ............................................................................................................................................... 20
Acknowledgements ........................................................................................................................................................... 23
References .......................................................................................................................................................................... 23
Appendices ......................................................................................................................................................................... 26
Glossary of Terms ........................................................................................................................................................ 26
Sustainability Projects and Programs ........................................................................................................................ 29
Dayton Preliminary Vulnerability Analysis (Maps & Methods)............................................................................ 31
Best Practices for Climate Adaptation ...................................................................................................................... 36
4
PROJECT BACKGROUND
n the summer of 2012, the city of Dayton accepted an invitation to participate in an interdisciplinary
research project conducted by Master’s degree students in the University of Michigan School of Natural
Resources and Environment. This project was a continuation of research on climate adaptation in Great
Lakes cities supported by the Great Lakes Adaptation
Assessment for Cities (GLAA-C) project through the
Graham Environmental Sustainability Institute. To better
understand how the Great Lakes region can adapt to climatic
impacts, an Integrated Assessment (IA) of the adaptive
capacity of four cities in Ohio (Avon Lake, Dayton, Elyria,
and Toledo) was conducted. This assessment included an
analysis of the various capitals, capacities and constraints in
these four cities to respond to climatic impacts.
To support the IA, a total of sixty-two interviews with city
decision-makers were conducted between August and
November 2012. In interviews, participants were asked
scripted questions, designed to elicit responses elucidating
each city’s ability to cope and adapt to climate change.
Broadly, the questions asked centered on the following:
What are opportunities and challenges for Great
Lakes cities to respond to climate change?
What are the main drivers building adaptive capacity
across the four research sites?
What has each community done to build adaptive
capacity?
What policies and projects are being implemented in
each community to adapt to climate change?
Using qualitative data coding software, the data from
interviews was organized and analyzed to identify leverage
points, synergistic projects, and partnerships. The adaptive
capacity wheel (Gupta et al., 2010) was utilized to identify
current institutional strengths and weaknesses constraining
potential adaptation activities. Additionally, preliminary
Global Information System (GIS) maps displaying the spatial
distribution of climate change exposure and sensitivity in
each city were created. By bringing together mixed methods
and analytical frames, the assessment sought to provide
decision-makers and stakeholders in participating cities with
information and tools necessary to better adapt to climate
change while also recognizing the current successes and
strengths of each city.
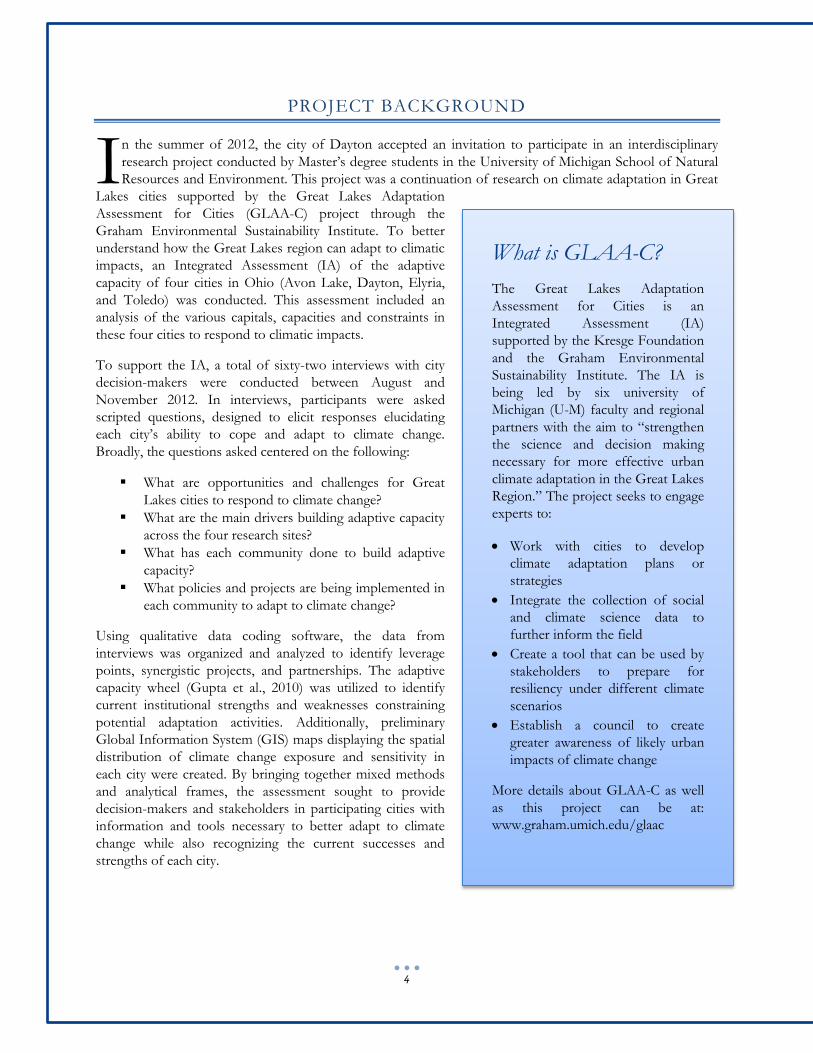
I What is GLAA-C?
The Great Lakes Adaptation
Assessment for Cities is an
Integrated Assessment (IA)
supported by the Kresge Foundation
and the Graham Environmental
Sustainability Institute. The IA is
being led by six university of
Michigan (U-M) faculty and regional
partners with the aim to “strengthen
the science and decision making
necessary for more effective urban
climate adaptation in the Great Lakes
Region.” The project seeks to engage
experts to:
Work with cities to develop
climate adaptation plans or
strategies
Integrate the collection of social
and climate science data to
further inform the field
Create a tool that can be used by
stakeholders to prepare for
resiliency under different climate
scenarios
Establish a council to create
greater awareness of likely urban
impacts of climate change
More details about GLAA-C as well
as this project can be at:
www.graham.umich.edu/glaac
5
CLIMATE CHANGE ADAPTATION
ADAPTIVE CAPACITY
Adaptive capacity refers to the ability of a system to respond
to an outside perturbation. Often, there are three steps to
adaptive capacity research:
1. Identifying a set of factors or determinants of adaptive capacity
2. Conducting an evaluation of the relative adaptive capacity of countries, regions, or municipalities, and
3. Identifying areas with the greatest vulnerability or least adaptive capacity.
This type of study assumes that decision-makers will apply this
information to improve response to the impacts of climate
change (Smit & Wandel, 2006). In their review of how
adaptive capacity relates to efforts to respond to climate
impacts and reduce system vulnerability, Nelson et al. (2007)
argue that adaptive capacity describes the preconditions for a
system to adapt to outside disturbances. Ideally, these preconditions reflect the goals of managers and
stakeholders.
Assessing adaptive capacity is difficult. Most scholars argue that adaptive capacity is a latent quality of a
system and observable only when individuals call upon it to actually adapt to a stress (Engle, 2011). Because
of this, researchers have identified determinants of adaptive capacity, which describe the assumed
preconditions likely to increase the potential of any system to adapt to climate change. Broadly defined, these
determinants include: social capital; human capital; financial capital; political capital; institutions and
entitlements; and technology and communication (Table 1).
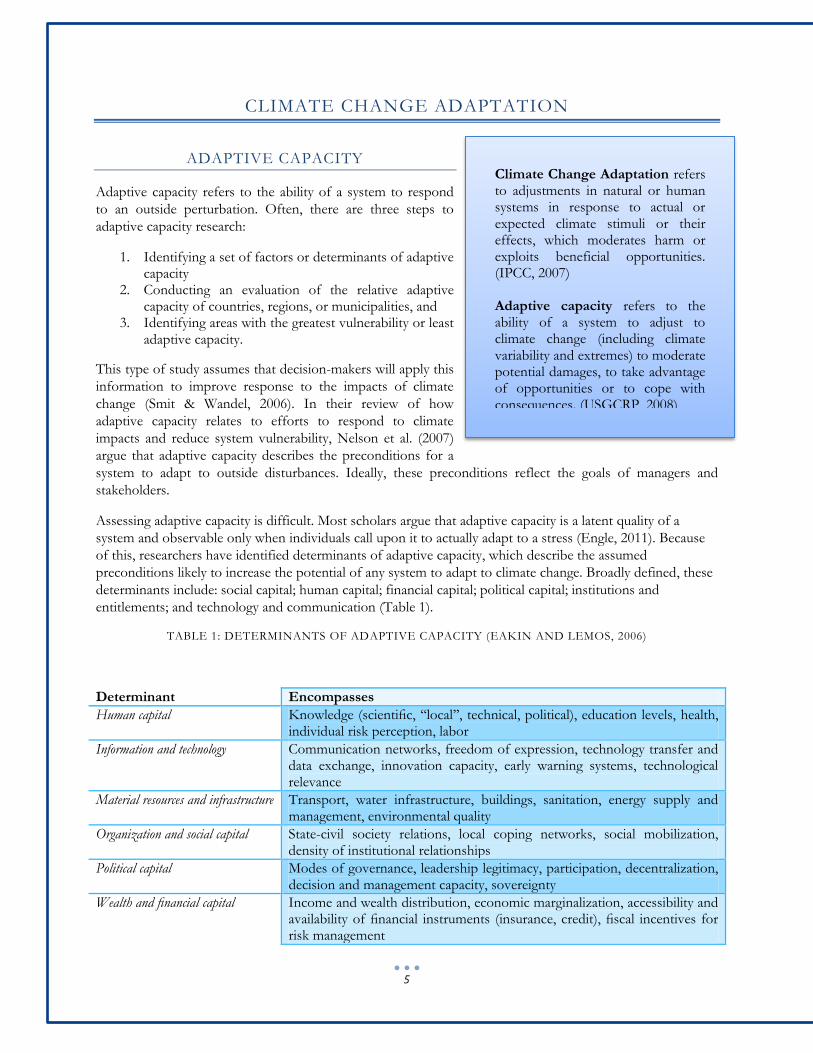
TABLE 1: DETERMINANTS OF ADAPTIVE CAPACITY (EAKIN AND LEMOS, 2006)
Determinant Encompasses
Human capital Knowledge (scientific, ‘‘local’’, technical, political), education levels, health, individual risk perception, labor
Information and technology Communication networks, freedom of expression, technology transfer and data exchange, innovation capacity, early warning systems, technological relevance
Material resources and infrastructure Transport, water infrastructure, buildings, sanitation, energy supply and management, environmental quality
Organization and social capital State-civil society relations, local coping networks, social mobilization, density of institutional relationships
Political capital Modes of governance, leadership legitimacy, participation, decentralization, decision and management capacity, sovereignty
Wealth and financial capital Income and wealth distribution, economic marginalization, accessibility and availability of financial instruments (insurance, credit), fiscal incentives for risk management
Climate Change Adaptation refers to adjustments in natural or human systems in response to actual or expected climate stimuli or their effects, which moderates harm or exploits beneficial opportunities. (IPCC, 2007) Adaptive capacity refers to the ability of a system to adjust to climate change (including climate variability and extremes) to moderate potential damages, to take advantage of opportunities or to cope with consequences. (USGCRP, 2008)
6
Institutions and entitlements Informal and formal rules for resource conservation, risk management, regional planning, participation, information dissemination, technological innovation, property rights and risk sharing mechanisms
CLIMATE CHANGE IMPACTS
The IPCC Fourth Assessment Report predicts that, depending on the quantities of greenhouse gas emissions,
the temperature will increase 3-5°C in the Great Lakes region by the end of the 21st century compared to the
1961-1990 mean (Pryor, 2013). The Canadian Regional Climate Model projects increasing temperatures in the
winter and summer, with variability around the mean remaining relatively constant (Pryor, 2013). Moreover,
these projected changes will not likely be uniform over space or time. The CRUTEM3 dataset shows that
while the average mean temperature has increased by roughly 0.067°C per decade from 1900 to 2010, decadal
increase for 1950-2010 is roughly 0.12°C, increasing to 0.23°C per decade for 1979-2010 (Pryor, 2013). Jones
et al (1999) show that the Midwest region has also experienced reduced diurnal temperature range, that is, the
minimum temperature at night has increased more than daytime maximum temperatures (Pryor, 2013).
Climate change and its effects on the environment will present particular challenges to the urban areas of the
Great Lakes Region. Higher temperatures may lead to dangerous conditions in cities due to the heat island
effect, during which residents will face health risks from heat stress and air quality deterioration (Bulkeley et al,
2012). In the US, extreme heat events are one of the largest causes of weather related mortality, responsible
for over 3,442 deaths between 1999 and 2003 (Luber and McGeehin, 2008; Pryor, 2013). On July 20, 2011,
the majority of the Midwest experienced temperatures over 100°F (Pryor, 2013) and several studies (Meehl
and Tebaldi, 2004, Tebaldi et al, 2006, Battisti and Naylor, 2009; cited in Pryor, 2013) project that there will
likely be future increases in heat wave occurrence and intensity in the region. Higher temperatures will also
affect the generation and transmission of energy through efficiency losses and damage to transmission
infrastructure, a crucial process when air conditioners must function to protect human health (IJC, 2003).
Extreme precipitation events may lead to damage from flooding and water contamination from sewer
overflows (IJC, 2003). More information about historic and projected climate change impacts for the Dayton
area can be found in the Climate Resources – City of Dayton file.
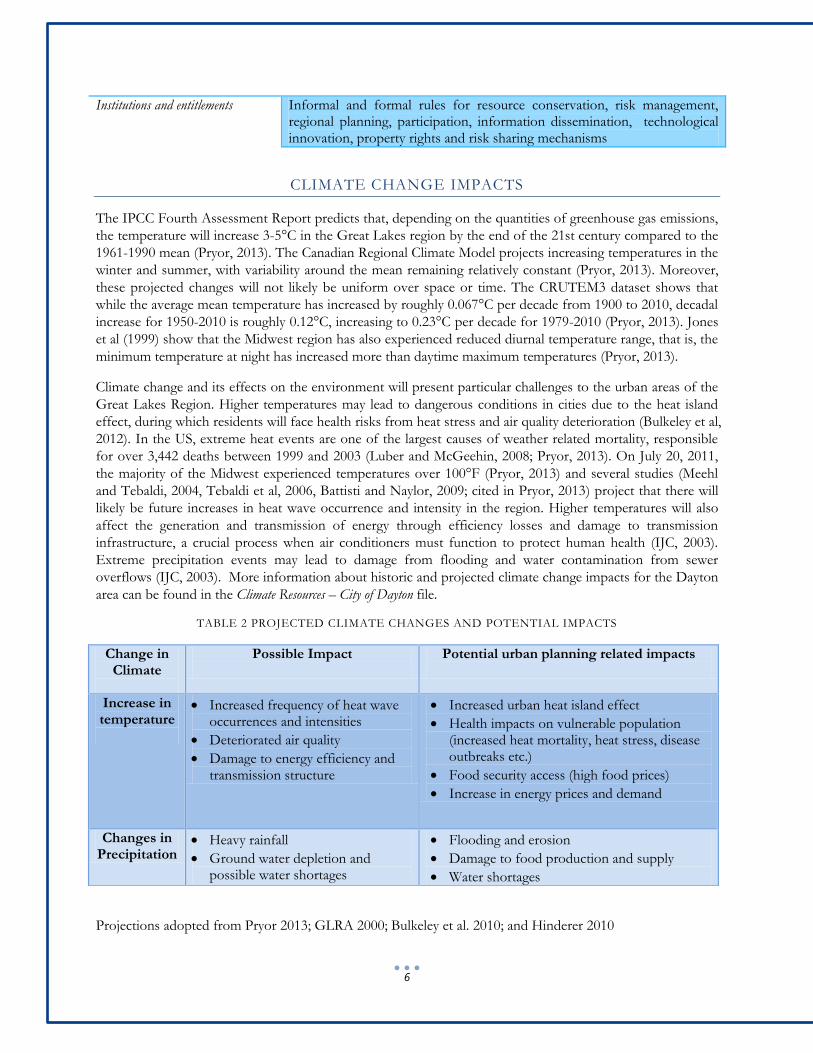
TABLE 2 PROJECTED CLIMATE CHANGES AND POTENTIAL IMPACTS
Projections adopted from Pryor 2013; GLRA 2000; Bulkeley et al. 2010; and Hinderer 2010
Change in Climate
Possible Impact
Potential urban planning related impacts
Increase in temperature
Increased frequency of heat wave occurrences and intensities
Deteriorated air quality
Damage to energy efficiency and transmission structure
Increased urban heat island effect
Health impacts on vulnerable population (increased heat mortality, heat stress, disease outbreaks etc.)
Food security access (high food prices)
Increase in energy prices and demand
Changes in Precipitation
Heavy rainfall
Ground water depletion and possible water shortages
Flooding and erosion
Damage to food production and supply
Water shortages
7
DAYTON CAPACITIES & CONSTRAINTS
he City of Dayton, located in Montgomery County, Ohio, is positioned along the Miami River and has
approximately 141,500 residents. Dayton has developed a significant service economy with legal,
insurance and healthcare sectors after the regional decline in manufacturing. As the location of
Wright-Patterson Air Force Base, the city also hosts numerous institutions involved in research into
astronautical, aeronautical, and advanced materials technology. The city is considering environmental issues
by pursing sustainability through its adoption of the Sustainable Practices Policy and incorporating
sustainability into its plan for the revitalization of downtown Dayton.
Through a series of stakeholder interviews, a number of concerns relevant to the anticipated impacts of
climate change were identified in Dayton:
Flooding -Dayton has historically faced flood threats due to its location. After the Great Dayton
Flood of 1913, flood infrastructure was significantly improved but concerns are still present
Invasive species such as the emerald ash borer
Vulnerability of population living in poverty
CAPACITIES
In terms of capacities, Dayton possesses a variety of assets and capitals that should aid in adapting to climate
change. City employees, decision makers, and elected officials often use the frame of economic and social
vibrancy to discuss sustainability and, to a lesser extent, adaptation. Many city employees consider being a
‘sustainable city’ as a way to distinguish Dayton from other Midwest localities and attract young professionals,
small businesses, and even immigrant communities.
Leaders are able to connect environmental and climate policy to
the identity of their city. In these cases, leaders argue that taking
action on climate mitigation and adaptation makes sense as an
extension of the sense of place the city possesses. Respondents
often stated that high-level decision-makers in their city
supported their efforts to address sustainability concerns. A city
employee reported that “the idea of environmentalism has now
mainstreamed [within the city government].” However, this
employee also mentioned the need to apply appropriate
“political pressure” to gain interest from decision makers. This
demonstrates that leaders often are acting as policy
entrepreneurs, in that they are utilizing their political and social
capital to connect policy solutions to problems. While so far this
ability has not been applied to adaptation, the potential to do so
is there.
Beyond individual leadership, there are also examples of collective leadership. City officials referenced the
sustainability task force, an organization composed of volunteers that span city departments and brings
together officials who care about sustainability in Dayton, as one of the places where leadership lies.
Moreover, various individuals from across the city government have collaborated to collectively enact change
that moves beyond their job descriptions. In many ways, these groups are acting as collective entrepreneurs in
that they make use of their shared and combined social capital—namely the connections they have formed
through the city government—to push for changes as a group.
T
“We think that that’s a way to
differentiate ourselves from other
Midwest cities. I don’t like using the
‘green’ term but a sustainable city; all
those things combine to make it—at
least we think, it elevates us to a place
of an even playing field, if not an
elevated playing field.”
-Dayton Public Official
8
Dayton has a long record of incorporating community and county input into city governance. For example,
priority boards, though falling out of use recently, have historically offered a medium for neighborhoods to
directly express their concerns. Seven priority boards have historically acted as a link between local citizens
and the city government. In theory, each priority board consists of representatives from a defined region. City
government employees and officials then seek input from these boards on how to best conduct government
business. Multiple interviewees stated that the city is working to reorganize these boards to increase their
efficacy.
Interviewees in Dayton reported participation in many partnerships of mutual benefit. These partnerships are
often driven by initiatives for sustainability and economic
development. They also may aid in increasing adaptive capacity by
building social capital among city staff, the public, and partners.
While sustainability and adaptation are not the same things, as
processes, they have many overlapping aspects and can build off
one another. Interestingly, many interviewees referenced
partnerships and outreach efforts of other departments and entities,
often referring to them as being integral to the city’s plan for
moving forward. This level of buy-in and integration can aid in the
transfer of information and facilitates institutionalization of these
undertakings.
At times, these linkages also span political levels and jurisdictions.
For example, the city works with the regional Miami Conservancy District, which preserves the watershed on
which Dayton and other nearby municipalities rely. Interviewees reported strategizing with the Conservancy
District on efforts to protect the watershed from the potential impacts hydraulic fracturing fluid disposal
might have on water quality. By coordinating with the Conservancy District, the city has been able to protect
its interests in the region—including areas outside its jurisdiction—without attracting controversy or conflict
with other local governments. Dayton also collaborates with the Miami Valley Regional Planning Commission
to develop large transportation, environmental, and economic projects—including an air pollution reduction
campaign. These networks demonstrate institutional arrangements and civic relations that can aid in
adaptation.
Some infrastructure in Dayton also increases the city’s ability to make steady progress towards resiliency and
building adaptive capacity, such as green infrastructure. City officials are taking steps to plan geothermal
infrastructure that will serve as an economic development tool, along with innovative low-interest financing
for buildings and homeowners for energy improvements that reduce energy consumption. Another effort
towards green energy has been the installation of the largest solar facility in southwest Ohio by the Dayton
Power & Light Company. The city is looking into building energy efficiency and has entered into a 10-year
performance contract with Honeywell for city-owned buildings. Additionally Dayton has invested in
equipment to capture methane gas from the wastewater treatment plant to sell and to use as a fuel source.
The ability to leverage existing physical resources for adaptation is a strength for Dayton.
CONSTRAINTS
A major factor constraining adaptation in Dayton is the low rate of inclusion/consideration of climate change
issues in the everyday functioning of the city. Officials noted that Dayton is in the early stages of considering
adaptation and reaching out for more information from credible sources on tying adaptation in with
sustainability plans. Therefore, while it is likely that adaptation may eventually become a focus of the city
government, current lack of widespread support in the city government hinders building and utilizing
adaptive capacity.
“If it's something that we can do some
cross-collaborations on, not just
internal to the city, we partner with
folks outside of the city as well to get
grants.”
-Dayton Public Official
9
Another critical constraint working against Dayton adapting to climate change is a lack of financial resources
and competition from many different needs. Budgets are likely to continue to decrease during the next few
years as federal stimulus funding phases out. One effect of current financial constraints is that Dayton has
been unable to properly staff its departments. For two decades now, staff numbers have fallen substantially,
though this is largely due to hiring freezes once people quit or retire. With less staff covering basic city
services and functions, more people are wearing more hats, straining this crucial resource. As a result, less
human capital is available to mobilize adaptive initiatives.
Additionally, Dayton has limited access to usable climate knowledge, especially concerning potential impacts
on the city. Often, city employees described being unsure where to find credible and usable climate
information. Other interviewees expressed a need for information in the short term from sources that can be
trusted. This limitation in terms of access to technical knowledge hinders the city’s ability to plan for long-
term climate impacts.
Distributing information and gaining public support were also
pointed out as challenges. Some respondents questioned the types of
communication methods the city has typically used, based on actual
readership and the challenges associated with having constant
contact through social media and the internet. The amount of time
required to continuously release information that is useful, relevant,
and timely through social media as opposed to traditional press
releases was identified as a challenge. The majority of interviewees
reported being very confident in their existing plans and processes,
however there were references to gaining new momentum being
difficult at times. Integrating new information into a set system, such
as is present in Dayton, may prove to be a challenge.
“In a city such as Dayton, an urban
city, funding is a big issue right now
because there’s a battle between
protecting the environment, managing
climate initiatives—which is
important—and sustaining city
services.”
-Dayton Public Official
10
ASSESSMENT TOOLS
SWOT ANALYSIS
Strengths, Weaknesses, Opportunities, and Threats (SWOT) analysis is a tool used to identify both internal
and external forces that may impact proposed actions. SWOT is used to encourage awareness of factors,
positive and negative, that may affect planning and decision-making (Goodrich, 2013). Strengths are internal
characteristics of the institution that put it in an advantageous position for adaptation. Weaknesses are those
internal characteristics that place the institution at a relatively disadvantageous position for adaptation.
Opportunities are external elements that the institution can exploit for its advantage towards adaptation.
Threats are external elements that can provide obstacles to the institution in its efforts toward adaptation.
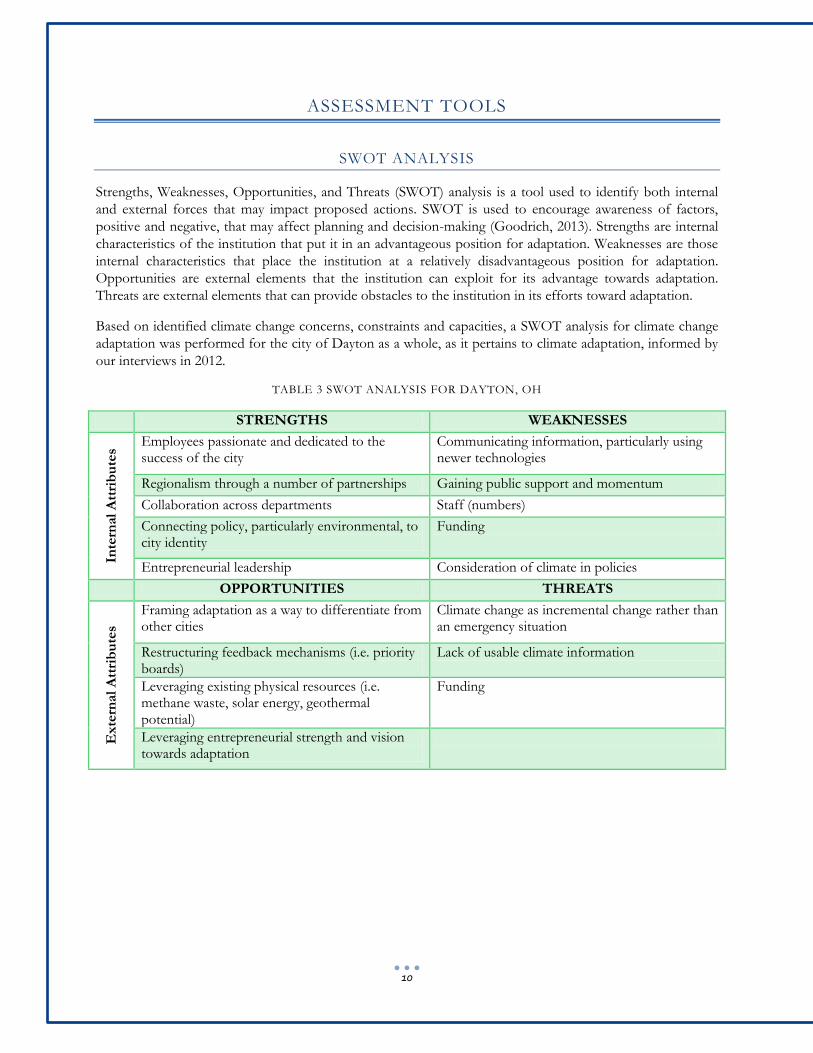
Based on identified climate change concerns, constraints and capacities, a SWOT analysis for climate change
adaptation was performed for the city of Dayton as a whole, as it pertains to climate adaptation, informed by
our interviews in 2012.
TABLE 3 SWOT ANALYSIS FOR DAYTON, OH
STRENGTHS WEAKNESSES
Inte
rnal
Att
rib
ute
s
Employees passionate and dedicated to the success of the city
Communicating information, particularly using newer technologies
Regionalism through a number of partnerships Gaining public support and momentum
Collaboration across departments Staff (numbers)
Connecting policy, particularly environmental, to city identity
Funding
Entrepreneurial leadership Consideration of climate in policies
OPPORTUNITIES THREATS
Ex
tern
al
Att
rib
ute
s
Framing adaptation as a way to differentiate from other cities
Climate change as incremental change rather than an emergency situation
Restructuring feedback mechanisms (i.e. priority boards)
Lack of usable climate information
Leveraging existing physical resources (i.e. methane waste, solar energy, geothermal potential)
Funding
Leveraging entrepreneurial strength and vision towards adaptation

11
ADAPTIVE CAPACITY WHEEL
To further assess the city’s adaptive capacity, an analytical framework was developed and applied in Dayton
that builds upon and synthesizes institutional adaptive capacity determinants and urban adaptation planning
research. The adaptive capacity wheel (Gupta et al., 2010) constitutes the heart of the research framework.
The wheel serves as a heuristic analytical tool to assess the capacity of institutions to adapt to climate change
(Gupta et al., 2010). Researchers rate institutions according to the wheel dimensions using a five-point scale
ranging from ‘very negative’ (-2/dark red) to ‘very positive’ (+2/dark green) (see figure 1). The outputs of the
adaptive capacity wheel are achieved through interpretation and judgment— and rather than being objective,
the wheel reflects the knowledge, experience, values, and beliefs of whoever is doing the evaluation (Gupta et
al., 2010).
For each city in the study, the adaptive capacity wheel was adapted to reflect both the specific variables
relevant to each city and the data collected. Because evaluations are based on the experience and knowledge
of different actors, cities can use the wheel to self-assess adaptive capacity. Thus, cities can use the framework
both to modify/enhance this assessment, creating a more detailed picture of adaptive capacity or as a tool to
reassess capacity over time.
Specific elements of the wheel and their definitions are summarized in Table 4.
FIGURE 1 ADAPTIVE CAPACITY WHEEL (GUPTA ET AL, 2010)
12
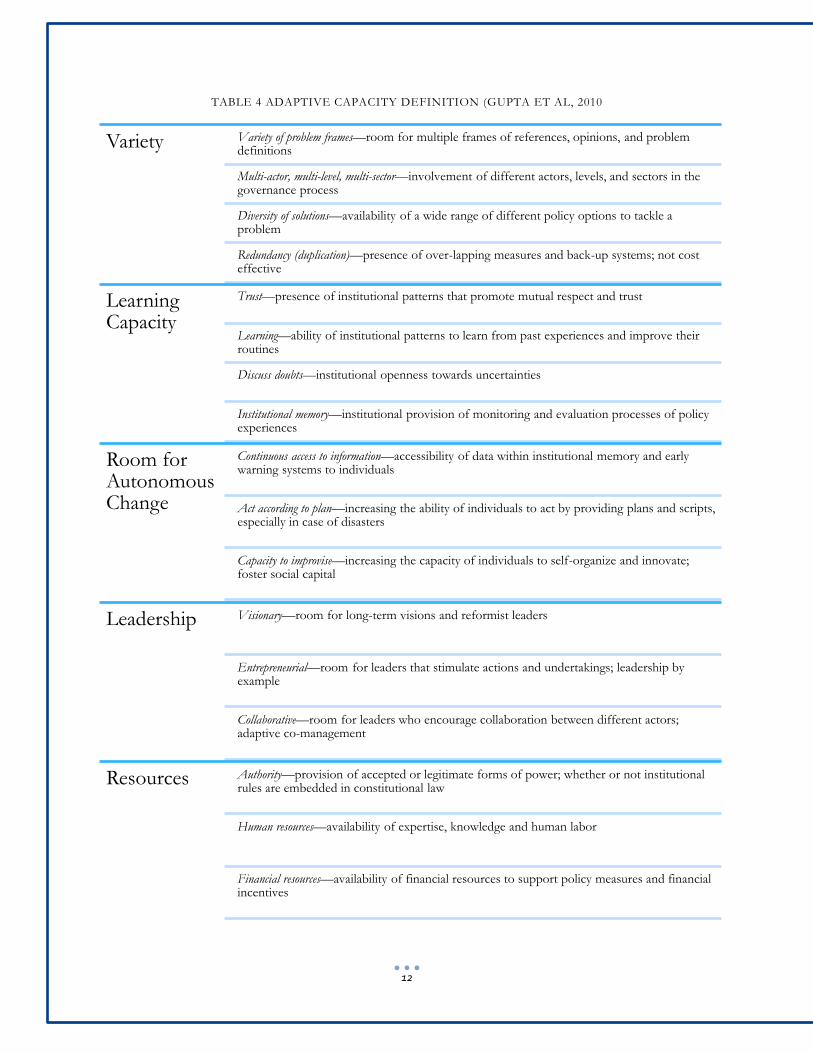
TABLE 4 ADAPTIVE CAPACITY DEFINITION (GUPTA ET AL, 2010
Variety Variety of problem frames—room for multiple frames of references, opinions, and problem definitions
Multi-actor, multi-level, multi-sector—involvement of different actors, levels, and sectors in the governance process
Diversity of solutions—availability of a wide range of different policy options to tackle a problem
Redundancy (duplication)—presence of over-lapping measures and back-up systems; not cost effective
Learning Capacity
Trust—presence of institutional patterns that promote mutual respect and trust
Learning—ability of institutional patterns to learn from past experiences and improve their routines
Discuss doubts—institutional openness towards uncertainties
Institutional memory—institutional provision of monitoring and evaluation processes of policy experiences
Room for Autonomous Change
Continuous access to information—accessibility of data within institutional memory and early warning systems to individuals
Act according to plan—increasing the ability of individuals to act by providing plans and scripts, especially in case of disasters
Capacity to improvise—increasing the capacity of individuals to self-organize and innovate; foster social capital
Leadership Visionary—room for long-term visions and reformist leaders
Entrepreneurial—room for leaders that stimulate actions and undertakings; leadership by example
Collaborative—room for leaders who encourage collaboration between different actors; adaptive co-management
Resources Authority—provision of accepted or legitimate forms of power; whether or not institutional rules are embedded in constitutional law
Human resources—availability of expertise, knowledge and human labor
Financial resources—availability of financial resources to support policy measures and financial incentives
13
While these criteria are organized in discrete categories, in a real life context, they overlap and complement
each other. Although these criteria were kept separate for analytical and heuristic purposes, in practice they
are intrinsically connected—both regarding who city officials are and what they do. Evaluations of capacities
(positively or negatively) were based on the peer-reviewed literature as well as what was observed in the cities
and on what the existing literature suggests and/or shows are important. A number of key findings in the
literature were used to add weight to evaluation criteria.
Both the urban planning and adaptive capacity literature highlight the critical role of policy entrepreneurs,
social learning, and incorporating adaptation in facilitating adaptation to climate change. Therefore, we gave
weight to the criterion of entrepreneurial and visionary leadership and learning.
The literature demonstrates that even well-intentioned adaptation efforts can lead to negative outcomes—
either by inadvertently increasing vulnerability or by conflicting with other policy objectives. Accordingly, the
criterions listed under “Variety,” as well as the ability to discuss doubts, are important for avoiding mal-
adaptations and maximizing synergies between adaptation and other policy goals.
APPLYING THE ADAPTIVE CAPACITY WHEEL
We find Dayton to possess both strong political leadership and policy entrepreneurship. The urban
adaptation literature describes the ability of entrepreneurial leaders to connect policy solutions to problems
and politics as being a key attribute for facilitating adaptation. Various leaders both identified themselves and
were identified by others as taking initiative to push for sustainability and, to a lesser extent, adaptation
policies in city governance. These efforts have helped integrate these concerns into the broader discourse of
vibrancy that permeates city decisions. Further, the city has exhibited a history of collaboration—particularly
around environmental protection, such as the Miami Valley Conservancy District and the city ‘Green Team’.
This ability to collaborate is particularly important in light of human resource constraints.
Collaboration is likely facilitated by, and facilitates the city’s strengths in trust, multi-level governance
networks, and bringing together multiple problem frames. The city works to integrate both community and
regional stakeholders into governance by collaborating with community priority boards and regional partners.
These efforts have contributed to trust building, as stakeholders are likely to feel governance that
incorporates their input is more legitimate.
Dayton’s visionary leadership was rated as neutral—at least in regards to climate change adaptation.
Adaptation remains largely a short-term, reactive consideration, as it is not fully integrated into the long-term
thinking of the city. On the other hand, the city has shown the ability to think in creative and long-term ways
about development in general, which prevents the rating of this criterion as negative. If the city is able to
harness its visionary leadership and apply it to the realm of climate change adaptation,, Dayton would greatly
increase its overall adaptive capacity.
However, to accomplish this task, Dayton must increase its access to resources. Financial resources were the
most significant constraint the city was facing in regards to climate adaptation—and likely in nearly every
other major effort. The city did not have enough financial capital to invest in adaptation efforts. Additionally,
the lack of financial resources influenced Dayton’s deficit of human capital. Though the city has many
dedicated, talented employees, it does not have enough of them.
Finally, lack of access to usable climate information (as well as other kinds of information necessary to inform
adaptation decisions) represents a limitation to the integration of adaptation into everyday governance. This is
partially due to the lack of participation in formalized information-sharing networks. Interviewees with high
social capital reported being able to navigate informal networks to access information regarding city
14
operations, but without more formalized information sharing, Dayton’s efforts to address the impacts of
climate change will likely be constrained. Perhaps more significant is the reported difficulty many interviewees
expressed regarding accessing credible and locally relevant climate change information. Though many
interviewees showed detailed knowledge of past and current changes in weather and climate patterns, they
consistently lamented they did not sufficiently know about likely future impacts.
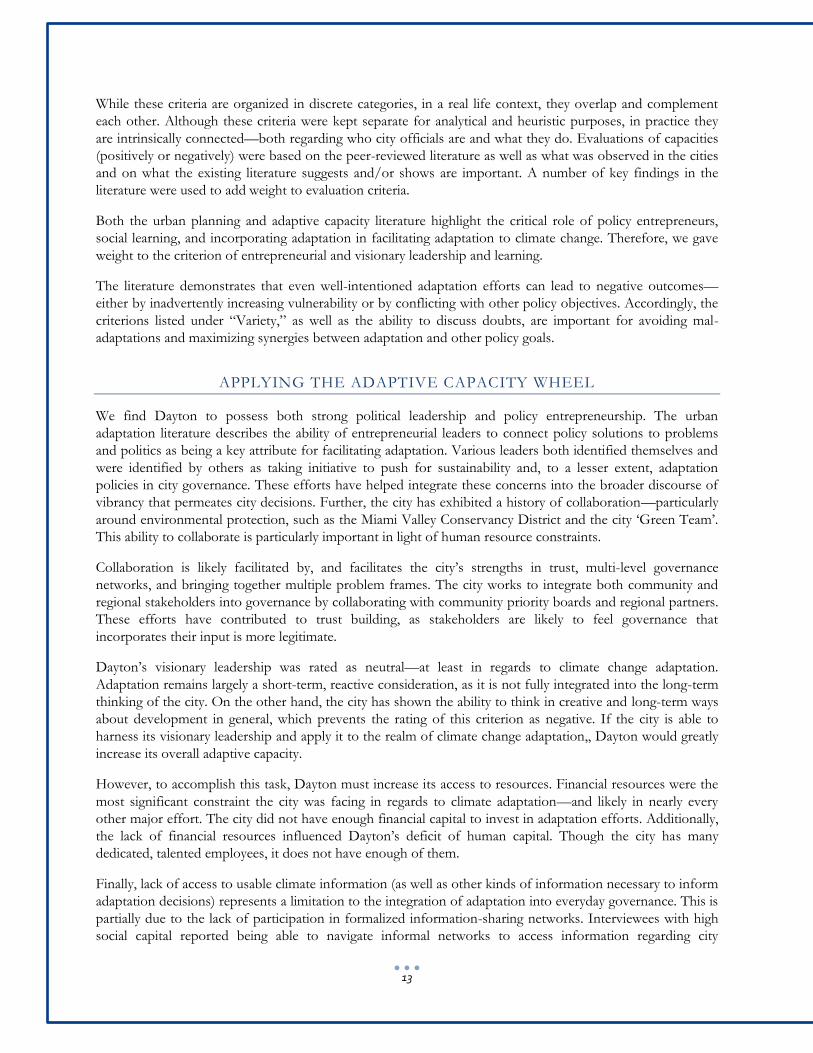
The assessment done through the adaptive capacity wheel is based on one interpretation of the information
given by interviewees and can be modified according to city priorities. Its greatest use is as a tool for Dayton
and other cities to begin discussions related to capacities needed to adapt to climate change.
DAYTON PRELIMINARY VULNERABILITY ANALYSIS
Note: These maps should serve as a tool, or starting point, for the city. They do not indicate definite patterns and they are not
predictions.
Risk index (vulnerability) maps were created for Dayton and the other three research cities using geographic
information system (GIS). GIS is a tool that enables data to be visualized and analyzed for the purposes of
examining spatial relationships, patterns and trends (ESRI, n.d.). In this study, GIS was used to augment the
city interview analysis by delving into data to identify areas within the city where populations may be more
FIGURE 2: DAYTON ADAPTIVE CAPACITY WHEEL
15
vulnerable to anticipated climate change impacts and could be targeted for program and policy intervention.
The maps can serve as a starting point for expanding decision-maker knowledge and streamlining resource
allocation to areas that may be most at risk.
Data used for this analysis included:
Block group demographic information from the 2010 U.S. Census and 2006-2010 American
Community Survey
100-year flood hazard data from FEMA
A variety of city specific data including boundaries, roadways, rivers, and land use
The demographic data included percentage of the population below 2010 poverty level, percentage under 5
years of age, percentage over 65 years of age, and percentage minority. These demographics were of particular
interest as research has shown these groups may be most vulnerable to climate change impacts, particularly
heat events (USGCRP, 2008). Localized flooding due to increased storm intensity, access to green space, and
proximity to high concentrations of vacant land, were expressed as concerns by interviewees. Green spaces
help mitigate urban heat island effect, a projected climate impact on urban areas that will likely affect
vulnerable populations (Altman, 2012). Citizens living near 100-year flood plains will likely be affected by a
greater incidence of flooding events (NOAA, 2012). Distance to areas with high vacancy was included in
these risk indices because a few public officials in Dayton expressed concern about the spread of disease
vectors due to waste dumping on vacant property. Block groups and neighborhood boundaries were overlaid
to allow for visual reference.
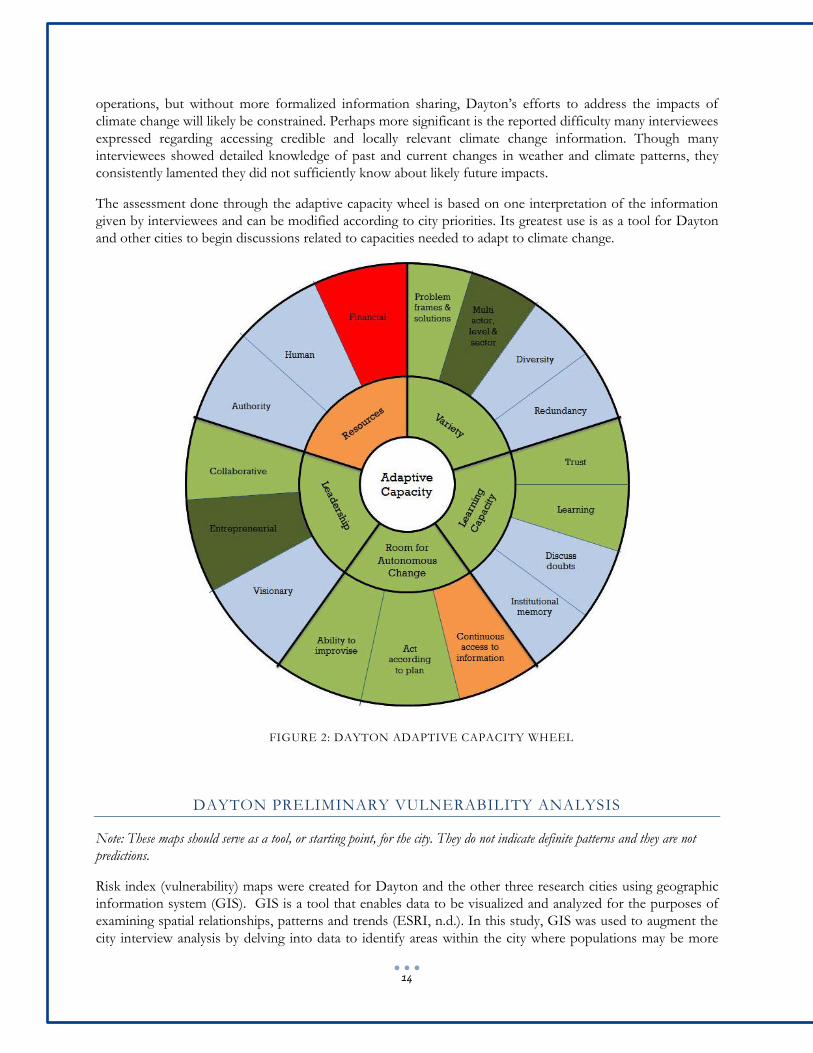
FIGURE 3 REPRESENTATION OF INPUTS INTO GIS WEIGHTED CALCULATION
These data were combined in a weighted calculation to identify areas where the combination of these
variables may increase risk relative to the rest of the city. The weights of individual variables can be adjusted,
depending on the primary concern of the city or department using the information.
While no neighborhood in Dayton was considered at highest risk in all five weighted calculations, two were
considered at highest risk in four and another was considered high risk in three.
Southern Dayton View: Considered high risk in Equal Weight and calculations weighted for
proximity to flood plain, proximity to green space, and population demographics.

16
Riverdale: Considered high risk in Equal Weight and calculations weighted for proximity to flood
plain, proximity to green space, and population demographics.
Miami Chapel: Considered high risk in Equal Weight and calculations weighted for proximity to
vacancy and population demographics.
While these areas possess a number of risk factors that have been associated with climate change impacts,
their actual vulnerability needs to be further examined. As described throughout this report, opportunities for
taking advantage of neighborhood adaptive capacities can be explored. For example, as Dayton looks to
implement and expand their urban forestry and street tree replacement program in an effort to counter recent
losses due to pest infestation and increase community engagement, targeting areas potentially most vulnerable
due to heat and distance from green space may make sense. Interestingly, one of the two neighborhoods
where this program is being piloted, Five Oaks, was considered to be at high risk due to distance from
recreation space.
FIGURE 4 POTENTIAL CLIMATE RISK FOR DAYTON, OH
17
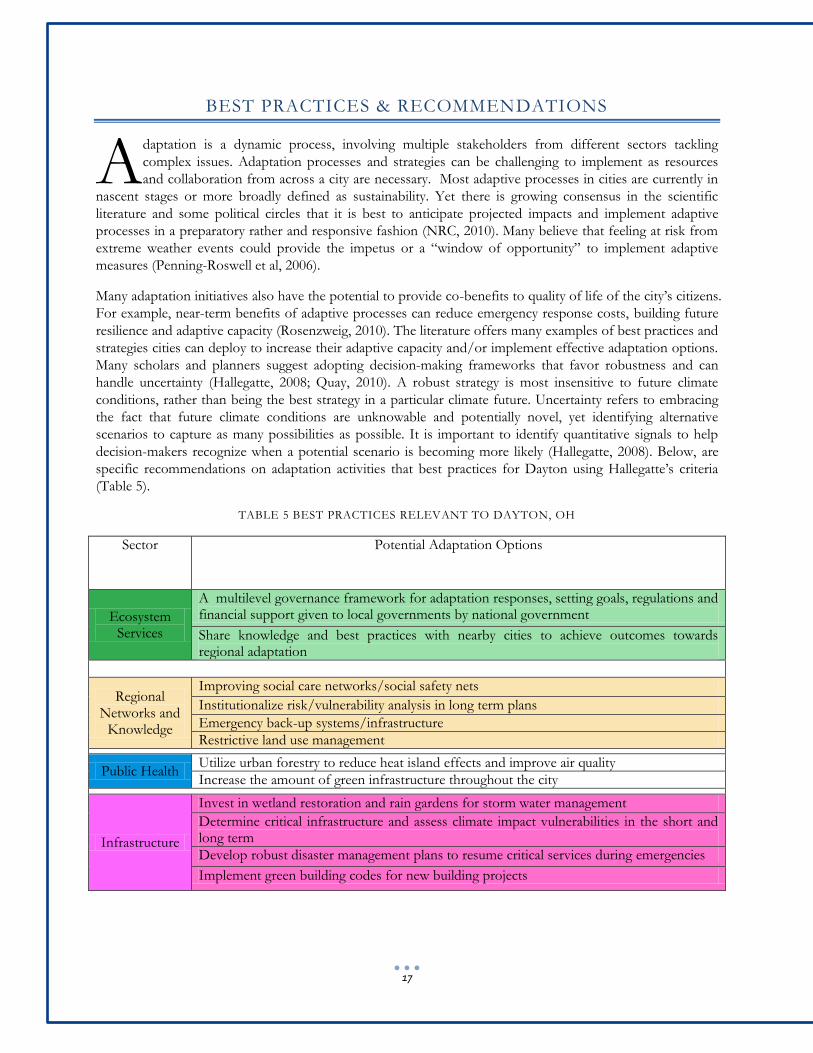
BEST PRACTICES & RECOMMENDATIONS
daptation is a dynamic process, involving multiple stakeholders from different sectors tackling
complex issues. Adaptation processes and strategies can be challenging to implement as resources
and collaboration from across a city are necessary. Most adaptive processes in cities are currently in
nascent stages or more broadly defined as sustainability. Yet there is growing consensus in the scientific
literature and some political circles that it is best to anticipate projected impacts and implement adaptive
processes in a preparatory rather and responsive fashion (NRC, 2010). Many believe that feeling at risk from
extreme weather events could provide the impetus or a “window of opportunity” to implement adaptive
measures (Penning-Roswell et al, 2006).
Many adaptation initiatives also have the potential to provide co-benefits to quality of life of the city’s citizens.
For example, near-term benefits of adaptive processes can reduce emergency response costs, building future
resilience and adaptive capacity (Rosenzweig, 2010). The literature offers many examples of best practices and
strategies cities can deploy to increase their adaptive capacity and/or implement effective adaptation options.
Many scholars and planners suggest adopting decision-making frameworks that favor robustness and can
handle uncertainty (Hallegatte, 2008; Quay, 2010). A robust strategy is most insensitive to future climate
conditions, rather than being the best strategy in a particular climate future. Uncertainty refers to embracing
the fact that future climate conditions are unknowable and potentially novel, yet identifying alternative
scenarios to capture as many possibilities as possible. It is important to identify quantitative signals to help
decision-makers recognize when a potential scenario is becoming more likely (Hallegatte, 2008). Below, are
specific recommendations on adaptation activities that best practices for Dayton using Hallegatte’s criteria
(Table 5).
TABLE 5 BEST PRACTICES RELEVANT TO DAYTON, OH
Sector Potential Adaptation Options
Ecosystem Services
A multilevel governance framework for adaptation responses, setting goals, regulations and financial support given to local governments by national government
Share knowledge and best practices with nearby cities to achieve outcomes towards regional adaptation
Regional Networks and
Knowledge
Improving social care networks/social safety nets
Institutionalize risk/vulnerability analysis in long term plans
Emergency back-up systems/infrastructure
Restrictive land use management
Public Health Utilize urban forestry to reduce heat island effects and improve air quality
Increase the amount of green infrastructure throughout the city
Infrastructure
Invest in wetland restoration and rain gardens for storm water management
Determine critical infrastructure and assess climate impact vulnerabilities in the short and long term
Develop robust disaster management plans to resume critical services during emergencies
Implement green building codes for new building projects
A
18
KNOWLEDGE NETWORKS & REGIONAL PARTNERSHIPS
Networks and partnerships are tools that can aid in enhancing the tangible and intangible resources available
to a city. Associations of existing knowledge are crucial to promote networks of knowledge across cities that
can translate to actionable outcomes within geographic regions. These networks of knowledge ideally
amalgamate different kinds of knowledge (i.e. scientific, local and indigenous knowledge, practical and
experiential knowledge) that inform action and build resilience of socio-ecological systems (Adger et al, 2005).
They may also encourage participation and buy-in from stakeholders (Lemos, Kirchhoff and Ramprasad,
2012). Additionally, formalized partnerships enable action on climate knowledge through the sharing of
resources and expertise. Several resources for beginning or strengthening networking and partnership
formation are detailed below.
Great Lakes Adaptation Assessment for Cities works with cities in the Great Lakes region to develop
and implement climate adaptation. After development, adaptation reports will be available on
GLAA-C’s website. http://graham.umich.edu/glaac/)
Climate Adaptation Knowledge Exchange (CAKE) aims to build a shared knowledge base for
managing natural and built systems in the face of rapid climate change. Case studies, a library of tools,
and community forums are available for knowledge and strategy sharing. (http://www.cakex.org/)
ICLEI-Local Governments for Sustainability is a national and international network of local
governments working on issues pertaining to climate change and sustainable development
(www.icleiusa.org)
Great Lakes Integrated Sciences & Assessments (GLISA) works to bridge the gap between the
produces and users of climate science information. A number of resources including educational
events, research, grants, and decision tools are available on the GLISA web site.
(http://glisa.msu.edu/index.php)
The Southeast Florida Regional Climate Change Compact is a multi-county effort to mitigate the
causes and adapt to the challenges of climate change. The compact was officially executed in January
2010. (http://southeastfloridaclimatecompact.org/)
The Georgetown Climate Center is a resource for state and federal policy. As a part of its mission,
the Center shares best practices and success stories.
(http://www.georgetownclimate.org/adaptation/state-and-local-plans)
IDENTIFYING AND RETAINING ADAPTATION FUNDING
As Eakin and Lemos (2006) propose, building adaptive capacity relies upon governments having both
administrative and policy capacities, which depend upon having access to required resources. Financial
resources are particularly significant for cities’ ability to adapt. Possessing a sufficient amount of financial
capital allows cities to move beyond short-term ‘core’ functions, such as police, fire, water, and so on, to
incorporating long-term considerations—such as built infrastructure, sustainability and adaptation. Further,
human resources depend upon being able to hire and retain talented individuals within city government.
Similarly, infrastructure and technology monitoring and maintenance require significant capital investment.
Included below are a number of funding resources for climate change adaptation.
ICLEI-Local Governments for Sustainability has created a fact sheet regarding financing climate
change adaption. (http://www.icleiusa.org/action-center/financing-
staffing/ICLEI_Adaptation%20Financing%20Fact%20Sheet.pdf)
19
The U.S. Department of Housing and Urban Development (HUD) has a series of sustainability
focused grants that can be applied to advance local adaptation efforts
(http://portal.hud.gov/hudportal/HUD?src=/program_offices/sustainable_housing_communities)
CLIMATE ADAPTATION PLANNING STRATEGIES
As the built environment is a primary contributor to greenhouse gas emissions and land use decisions play an
important role in how and where the impacts of climate change will be felt, there are great opportunities to
implement adaptation strategies through the planning process (American Planning Association, 2011). While
some cities elect to draft a separate climate action plan, while others choose to integrate considerations of
climate change into already existing policies, practices, and plans. With either option, understanding the cross-
cutting impacts of climate change is important to understanding potential trade-offs and opportunities.
The American Planning Association has developed a policy guide for planning and climate change.
The guide includes information on the role of planning in climate action as well as policy
recommendations for a number of sectors, including land use, natural resources, economic
development, and public health. (http://www.planning.org/policy/guides/pdf/climatechange.pdf )
California developed a Climate Adaptation Planning Guide that was made available to the public in
April 2012. The guide discusses vulnerability assessment, strategy development, climate change
impacts and adaptation strategies.
(http://resources.ca.gov/climate_adaptation/local_government/adaptation_policy_guide.html )
EPA has compiled links to information clearinghouses, sector and region specific tools, and
guidebooks. (http://www.epa.gov/climatechange/impacts-adaptation/adapt-tools.html)
Through the ICLEI web site, there are a number of trainings, educational resources, and tools for
climate adaptation available.
(http://www.icleiusa.org/climate_and_energy/Climate_Adaptation_Guidance)
20
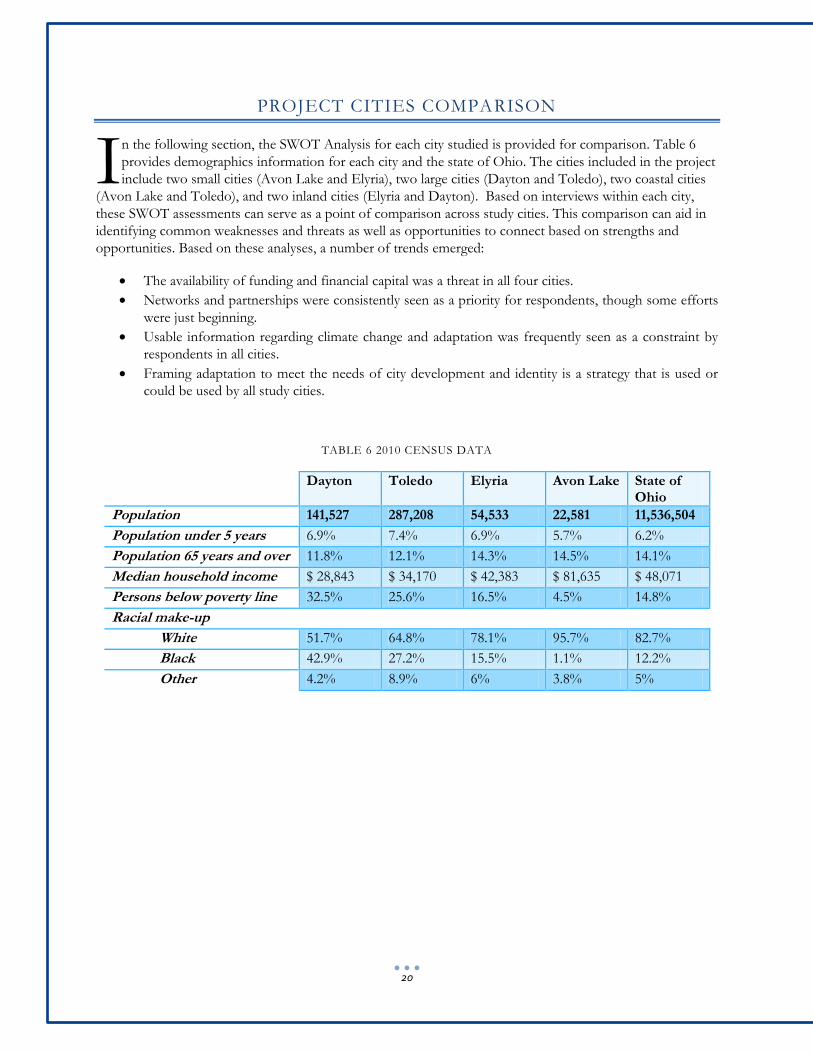
PROJECT CITIES COMPARISON
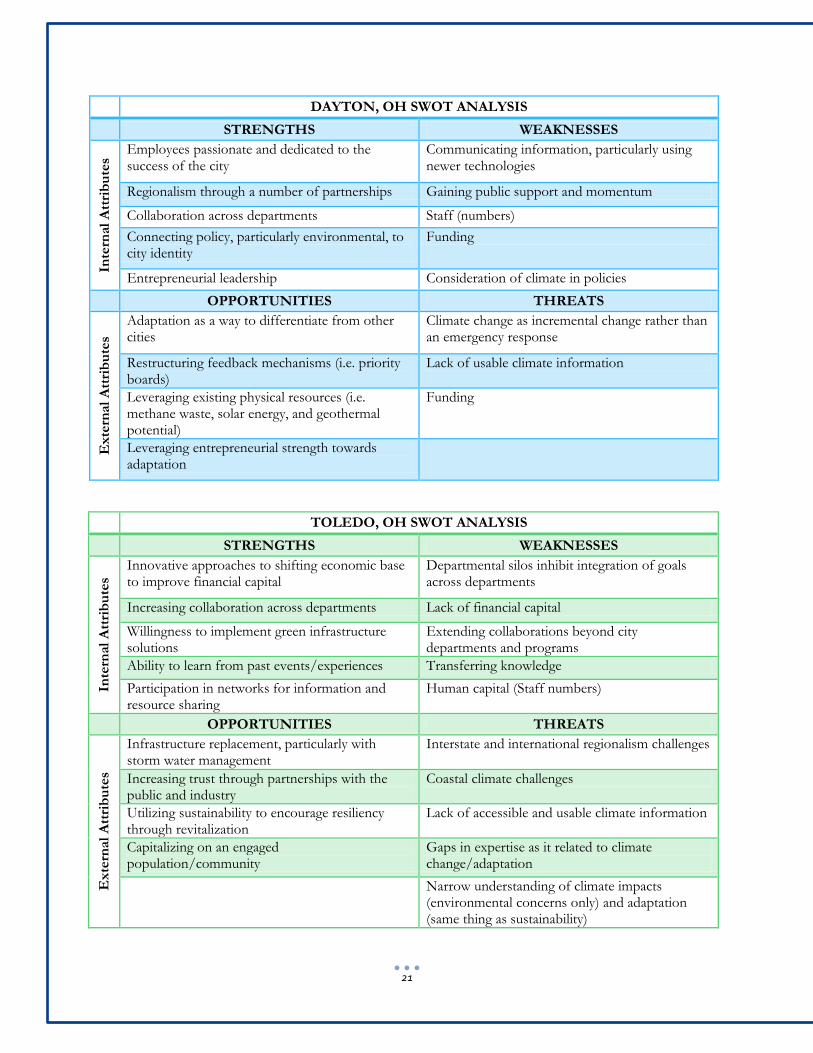
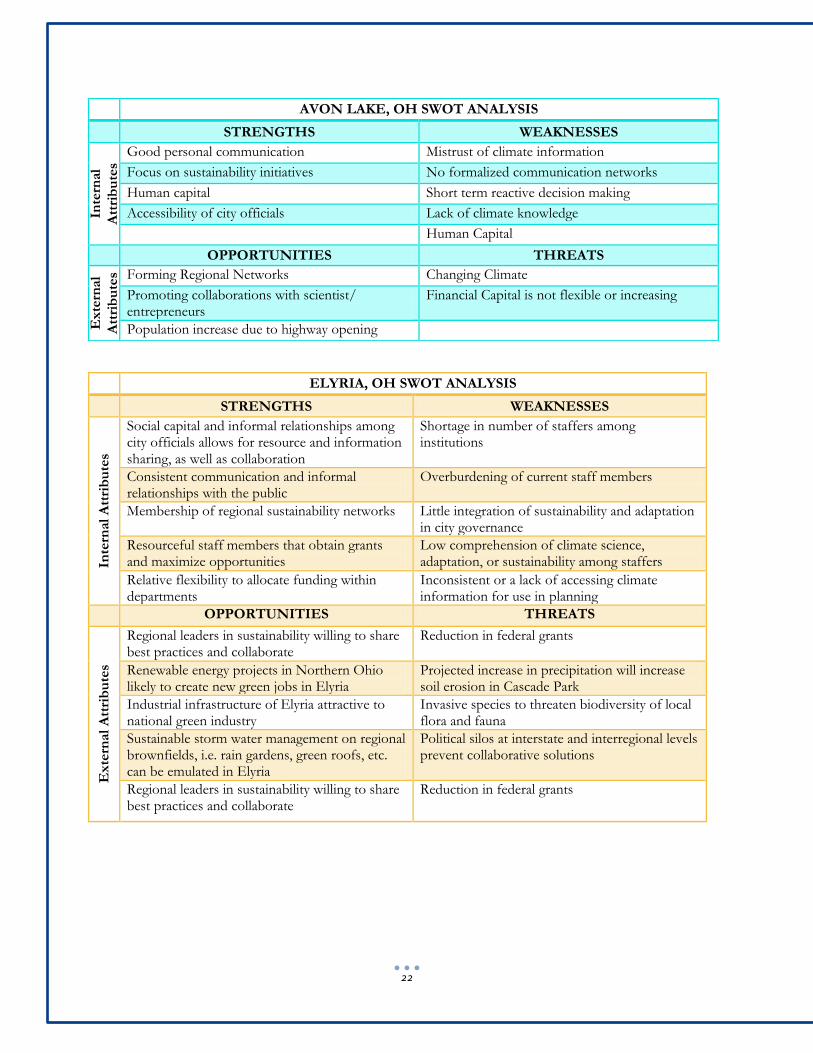
n the following section, the SWOT Analysis for each city studied is provided for comparison. Table 6
provides demographics information for each city and the state of Ohio. The cities included in the project
include two small cities (Avon Lake and Elyria), two large cities (Dayton and Toledo), two coastal cities
(Avon Lake and Toledo), and two inland cities (Elyria and Dayton). Based on interviews within each city,
these SWOT assessments can serve as a point of comparison across study cities. This comparison can aid in
identifying common weaknesses and threats as well as opportunities to connect based on strengths and
opportunities. Based on these analyses, a number of trends emerged:
The availability of funding and financial capital was a threat in all four cities.
Networks and partnerships were consistently seen as a priority for respondents, though some efforts
were just beginning.
Usable information regarding climate change and adaptation was frequently seen as a constraint by
respondents in all cities.
Framing adaptation to meet the needs of city development and identity is a strategy that is used or
could be used by all study cities.
TABLE 6 2010 CENSUS DATA
Dayton Toledo Elyria Avon Lake State of Ohio
Population 141,527 287,208 54,533 22,581 11,536,504
Population under 5 years 6.9% 7.4% 6.9% 5.7% 6.2%
Population 65 years and over 11.8% 12.1% 14.3% 14.5% 14.1%
Median household income $ 28,843 $ 34,170 $ 42,383 $ 81,635 $ 48,071
Persons below poverty line 32.5% 25.6% 16.5% 4.5% 14.8%
Racial make-up
White 51.7% 64.8% 78.1% 95.7% 82.7%
Black 42.9% 27.2% 15.5% 1.1% 12.2%
Other 4.2% 8.9% 6% 3.8% 5%
I
21
DAYTON, OH SWOT ANALYSIS
STRENGTHS WEAKNESSES
Inte
rnal
Att
rib
ute
s
Employees passionate and dedicated to the success of the city
Communicating information, particularly using newer technologies
Regionalism through a number of partnerships Gaining public support and momentum
Collaboration across departments Staff (numbers)
Connecting policy, particularly environmental, to city identity
Funding
Entrepreneurial leadership Consideration of climate in policies
OPPORTUNITIES THREATS
Exte
rnal
Att
rib
ute
s
Adaptation as a way to differentiate from other cities
Climate change as incremental change rather than an emergency response
Restructuring feedback mechanisms (i.e. priority boards)
Lack of usable climate information
Leveraging existing physical resources (i.e. methane waste, solar energy, and geothermal potential)
Funding
Leveraging entrepreneurial strength towards adaptation
TOLEDO, OH SWOT ANALYSIS
STRENGTHS WEAKNESSES
Inte
rnal
Att
rib
ute
s
Innovative approaches to shifting economic base to improve financial capital
Departmental silos inhibit integration of goals across departments
Increasing collaboration across departments Lack of financial capital
Willingness to implement green infrastructure solutions
Extending collaborations beyond city departments and programs
Ability to learn from past events/experiences Transferring knowledge
Participation in networks for information and resource sharing
Human capital (Staff numbers)
OPPORTUNITIES THREATS
Ex
tern
al
Att
rib
ute
s
Infrastructure replacement, particularly with storm water management
Interstate and international regionalism challenges
Increasing trust through partnerships with the public and industry
Coastal climate challenges
Utilizing sustainability to encourage resiliency through revitalization
Lack of accessible and usable climate information
Capitalizing on an engaged population/community
Gaps in expertise as it related to climate change/adaptation
Narrow understanding of climate impacts (environmental concerns only) and adaptation (same thing as sustainability)
22
ELYRIA, OH SWOT ANALYSIS
STRENGTHS WEAKNESSES
Inte
rnal
Att
rib
ute
s
Social capital and informal relationships among city officials allows for resource and information sharing, as well as collaboration
Shortage in number of staffers among institutions
Consistent communication and informal relationships with the public
Overburdening of current staff members
Membership of regional sustainability networks Little integration of sustainability and adaptation in city governance
Resourceful staff members that obtain grants and maximize opportunities
Low comprehension of climate science, adaptation, or sustainability among staffers
Relative flexibility to allocate funding within departments
Inconsistent or a lack of accessing climate information for use in planning
OPPORTUNITIES THREATS
Ex
tern
al
Att
rib
ute
s
Regional leaders in sustainability willing to share best practices and collaborate
Reduction in federal grants
Renewable energy projects in Northern Ohio likely to create new green jobs in Elyria
Projected increase in precipitation will increase soil erosion in Cascade Park
Industrial infrastructure of Elyria attractive to national green industry
Invasive species to threaten biodiversity of local flora and fauna
Sustainable storm water management on regional brownfields, i.e. rain gardens, green roofs, etc. can be emulated in Elyria
Political silos at interstate and interregional levels prevent collaborative solutions
Regional leaders in sustainability willing to share best practices and collaborate
Reduction in federal grants
AVON LAKE, OH SWOT ANALYSIS
STRENGTHS WEAKNESSES
Inte
rnal
Att
rib
ute
s
Good personal communication Mistrust of climate information
Focus on sustainability initiatives No formalized communication networks
Human capital Short term reactive decision making
Accessibility of city officials Lack of climate knowledge
Human Capital
OPPORTUNITIES THREATS
Ex
tern
al
Att
rib
ute
s Forming Regional Networks Changing Climate
Promoting collaborations with scientist/ entrepreneurs
Financial Capital is not flexible or increasing
Population increase due to highway opening
23
ACKNOWLEDGEMENTS
irst and foremost, we would like to thank our advisor, Dr. Maria Carmen Lemos. We would like to
thank all who agreed to be interviewed, for giving us their insights and providing crucial information
for our research. We sincerely hope that this research was well worth your time! Thank you to the
GLAA-C team for providing us a wealth of information, methods and networks to utilize throughout these
last fifteen months. We would like to extend our sincere appreciation for the financial support from the
Graham Environmental Sustainability Institute, the Kresge Foundation, and the School of Natural Resources
and Environment’s Master’s Project Fund. Finally, we would like to extend our sincerest gratitude to
partners, family members, children, friends, colleagues and professors who encouraged and supported us
throughout these exciting fifteen months.
REFERENCES
Altman, P. (2012). Killer Summer Heat: Projected Death Toll from Rising Temperatures in America Due to
Climate Change NRDC Issue Brief: Natural Resources Defense Council.
Austin, J. A., & Colman, S. M. (2007). Lake Superior summer water temperatures are increasing more rapidly
than regional air temperatures: A positive ice-albedo feedback. Geophysical Research Letters, 34(6), L06604.
doi: 10.1029/2006gl029021
Bulkeley, H., Heike Schroeder, Katy Janda, Jimin Zhao, Andrea Armstrong, Shu Yi Chu, & Ghosh, S. (2010).
Cities and Climate Change: The role of institutions, governance and urban planning. United Kingdom: World
Bank Urban Symposium on Climate Change.
Byer, P., Cestti, R., Croal, P., Fisher, W., Hazell, S., Kolhoff, A., & Kornov, L. (2012). Climate Change in
Impact Assessment: International Best Practice Principles Special Publication Series No. 8. Fargo, USA:
International Association for Impact Assessment (IAIA).
Eakin, H., & Lemos, M. C. (2006). Adaptation and the state: Latin America and the challenge of capacity-
building under globalization. Global Environmental Change, 16(1), 7-18. doi:
http://dx.doi.org/10.1016/j.gloenvcha.2005.10.004
Engle, N. L. (2011). Adaptive capacity and its assessment. Global Environmental Change, 21(2), 647-656. doi:
http://dx.doi.org/10.1016/j.gloenvcha.2011.01.019
ESRI. (Ed.) (n.d.) GIS Dictionary.
GLRA. (2000). Preparing for a Changing Climate: The Potential Consequences of Climate Variability and
Change. In P. J. Sousounis & M. Bisanz (Eds.), Great Lakes Overview: A Report of the the Great Lakes
Regional Assessment Group: U.S Global Change Research Program.
Goodrich, R. (2013). SWOT Analysis: Examples, Templates & Definition. Business News Daily. Accessed
May 1, 2013 from http://www.businessnewsdaily.com/4245-swot-analysis.html.
Graham Environmental Sustainability Institute report name: Climate Change in the Great Lakes Region:
Navigating an Uncertain Future Edited by Thomas Dietz, April 2012
Gupta, J., Termeer, C., Klostermann, J., Meijerink, S., van den Brink, M., Jong, P., Bergsma, E. (2010). The
Adaptive Capacity Wheel: a method to assess the inherent characteristics of institutions to enable the adaptive
F

24
capacity of society. Environmental Science & Policy, 13(6), 459-471. doi:
http://dx.doi.org/10.1016/j.envsci.2010.05.006
Hallegatte, S. (2009). Strategies to adapt to an uncertain climate change. Global Environmental Change, 19(2),
240-247. doi: http://dx.doi.org/10.1016/j.gloenvcha.2008.12.003
Hinderer, J., Haven, C., & Koslow, M. (2010). Climate Change in the Great Lakes: Advancing the Regional
Discussion: CGLI, Great Lakes Commission, National Wildlife Federation.
IJC. (2003). Climate Change and Water Quality in the Great Lakes Basin Report of the Great Lakes Water
Quality Board to the International Joint Commission: International Joint Commission.
Jones, P.D., M. New, D.E. Parker, S. Martin, and I.G. Rigor. 1999. Surface air temperature and its changes
over the past 150 years. Reviews of Geophysics 37:173-199.
Leiserowitz, A., Smith, N., & Marlon, J. R. (2010). Americans’ Knowledge of Climate Change: Yale University.
New Haven, CT: Yale Project on Climate Change Communication.
Lemos, M. C., C. J. Kirchhoff, et al. (2012). "Narrowing the climate information usability gap." Nature Clim.
Change 2(11): 789-794.Lemos, M. C., & Rood, R. B. (2010). Climate projections and their impact on policy
and practice. Wiley Interdisciplinary Reviews: Climate Change, 1(5), 670-682. doi: 10.1002/wcc.71
Luber,G.,McGeehin,M.(2008) Climate Change and Extreme Heat Events, American Journal of Preventive
Medicine, Volume 35, Issue 5, November 2008, Pages 429-435, ISSN 0749-3797,
10.1016/j.amepre.2008.08.021.
Meehl and Tebaldi, 2004, Tebaldi et al, 2006, Battisti and Naylor, 2009; cited in Pryor, 2012
Neil Adger, W., Arnell, N. W., & Tompkins, E. L. (2005). Successful adaptation to climate change across
scales. Global Environmental Change, 15(2), 77-86. doi:
http://dx.doi.org/10.1016/j.gloenvcha.2004.12.005USGCRP.
Nelson, D. R., Adger, W. N., & Brown, K. (2007). Adaptation to Environmental Change: Contributions of a
Resilience Framework. Annual Review of Environment and Resources, 32(1), 395-419. doi:
doi:10.1146/annurev.energy.32.051807.090348
NOAA. (2013). Climate: U.S. Population in the Coastal Floodplain Retrieved 4/2013, 2013, from
http://stateofthecoast.noaa.gov/pop100yr/
Penning-Rowsell, E., Johnson, C., & Tunstall, S. (2006). ‘Signals’ from pre-crisis discourse: Lessons from UK
flooding for global environmental policy change? Global Environmental Change, 16(4), 323-339. doi:
http://dx.doi.org/10.1016/j.gloenvcha.2006.01.006
Pryor, S. C. (2012). Climate Change in the Midwest Impacts, Risks, Vulnerability, and Adaptation.
Bloomington, IN: Indiana University Press.
Quay, R. (2010). Anticipatory Governance. Journal of the American Planning Association, 76(4), 496-511. doi:
10.1080/01944363.2010.508428
Rosenzweig, C., & Solecki, W. (2010). Chapter 1: New York City adaptation in context. Annals of the New
York Academy of Sciences, 1196(1), 19-28. doi: 10.1111/j.1749-6632.2009.05308.x

25
Smit, B., & Wandel, J. (2006). Adaptation, adaptive capacity and vulnerability. Global Environmental Change,
16(3), 282-292. doi: http://dx.doi.org/10.1016/j.gloenvcha.2006.03.008
Syampungani, S., Chirwa, P. W., Akinnifesi, F. K., & Ajayi, O. C. (2010). The Potential of Using Agroforestry
as a Win-Win Solution to Climate Change Mitigation and Adaptation and Meeting Food Security Challenges
in Southern Africa. Agricultural Journal, 5(2), 80-88.
United States Global Change Research Program.
26
APPENDICES
GLOSSARY OF TERMS
The following list is based on definitions from the IPCC AR4, USGCRP 2012, Ontario Expert Panel on Climate Change
Adaptation (2009), whenever possible. Other references include NOAA, and US EPA as noted.
Climate Change
Climate change refers to a change in the state of the climate that can be identified (e.g. using statistical tests)
by changes in the mean and/ or the variability of its properties, and that persists for an extended period,
typically decades or longer. Climate change may be due to natural internal processes or external forcings, or to
persistent anthropogenic changes in the composition of the atmosphere or in land use. (IPCC Fourth
Assessment Report)
Adaptation
a) Initiatives and measures to reduce the vulnerability of natural and human systems against actual or
expected climate change effects. Various types of adaptation exist, e.g. anticipatory and reactive,
private and public, and autonomous and planned. Examples are raising river or coastal dikes, the
substitution of more temperature shock-resistant plants for sensitive ones, etc. (IPCC Fourth
Assessment Report)
b) Adjustment in natural or human systems to a new or changing environment that exploits beneficial
opportunities and moderates negative impacts. (USGCRP 2012)
Adaptive Capacity
a) The whole of capabilities, resources and institutions of a country or region to implement effective
adaptation measures. (IPCC Fourth Assessment Report)
b) The ability of a system to adjust to climate change (including climate variability and extremes) in
order to moderate potential damages, to take advantage of opportunities, or to cope with the
consequences. (Ontario Expert Panel on Climate Change Adaptation 2009)
Capacity building
In the context of climate change, capacity building is developing technical skills and institutional capabilities
in developing countries and economies in transition to enable their participation in all aspects of adaptation to,
mitigation of, and research on climate change, and in the implementation of the Kyoto Mechanisms, etc.
(IPCC Fourth Assessment Report)
Climate prediction
A climate prediction or climate forecast is the result of an attempt to produce an estimate of the actual
evolution of the climate – including weather variations – in the future, for example, at seasonal, interannual,
or long-term timescales. (USGCRP 2012)
Climate projection
A projection of the response of the climate system to emission or concentration scenarios of greenhouse
gases or aerosols, or radiative-forcing scenarios, often based upon simulations by climate models. Climate
projections are distinguished from climate predictions in order to emphasize that climate projections depend
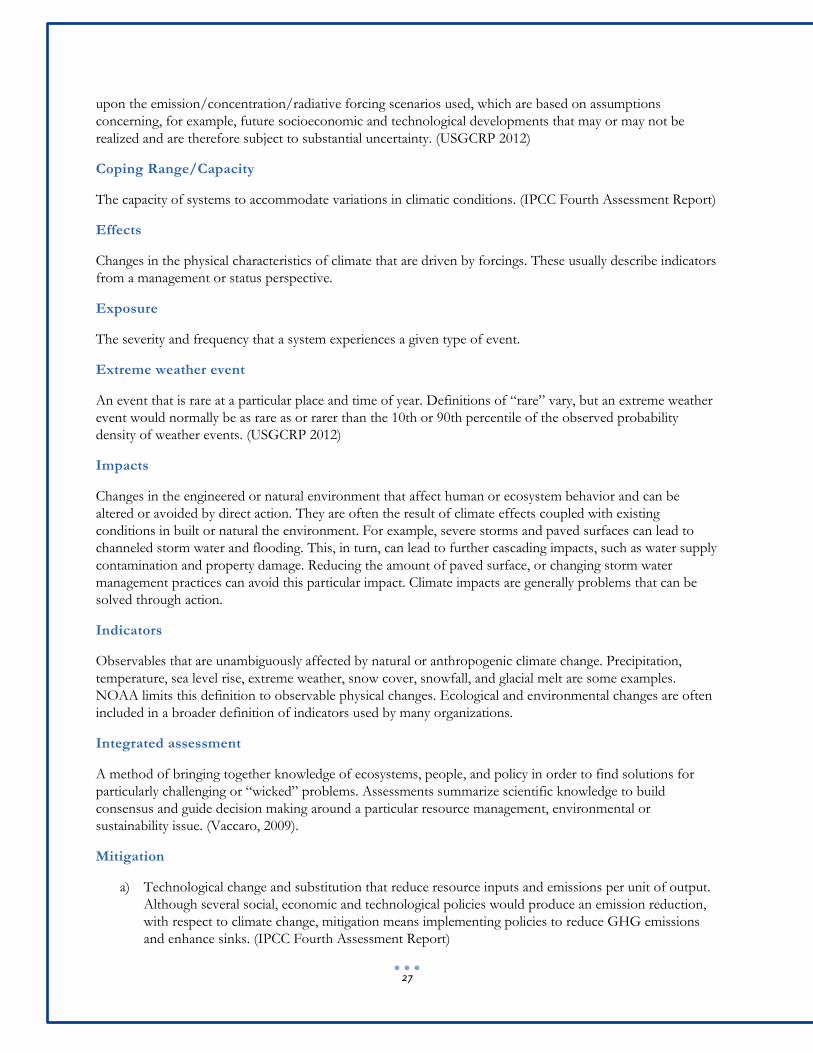
27
upon the emission/concentration/radiative forcing scenarios used, which are based on assumptions
concerning, for example, future socioeconomic and technological developments that may or may not be
realized and are therefore subject to substantial uncertainty. (USGCRP 2012)
Coping Range/Capacity
The capacity of systems to accommodate variations in climatic conditions. (IPCC Fourth Assessment Report)
Effects
Changes in the physical characteristics of climate that are driven by forcings. These usually describe indicators
from a management or status perspective.
Exposure
The severity and frequency that a system experiences a given type of event.
Extreme weather event
An event that is rare at a particular place and time of year. Definitions of “rare” vary, but an extreme weather
event would normally be as rare as or rarer than the 10th or 90th percentile of the observed probability
density of weather events. (USGCRP 2012)
Impacts
Changes in the engineered or natural environment that affect human or ecosystem behavior and can be
altered or avoided by direct action. They are often the result of climate effects coupled with existing
conditions in built or natural the environment. For example, severe storms and paved surfaces can lead to
channeled storm water and flooding. This, in turn, can lead to further cascading impacts, such as water supply
contamination and property damage. Reducing the amount of paved surface, or changing storm water
management practices can avoid this particular impact. Climate impacts are generally problems that can be
solved through action.
Indicators
Observables that are unambiguously affected by natural or anthropogenic climate change. Precipitation,
temperature, sea level rise, extreme weather, snow cover, snowfall, and glacial melt are some examples.
NOAA limits this definition to observable physical changes. Ecological and environmental changes are often
included in a broader definition of indicators used by many organizations.
Integrated assessment
A method of bringing together knowledge of ecosystems, people, and policy in order to find solutions for
particularly challenging or “wicked” problems. Assessments summarize scientific knowledge to build
consensus and guide decision making around a particular resource management, environmental or
sustainability issue. (Vaccaro, 2009).
Mitigation
a) Technological change and substitution that reduce resource inputs and emissions per unit of output.
Although several social, economic and technological policies would produce an emission reduction,
with respect to climate change, mitigation means implementing policies to reduce GHG emissions
and enhance sinks. (IPCC Fourth Assessment Report)
28
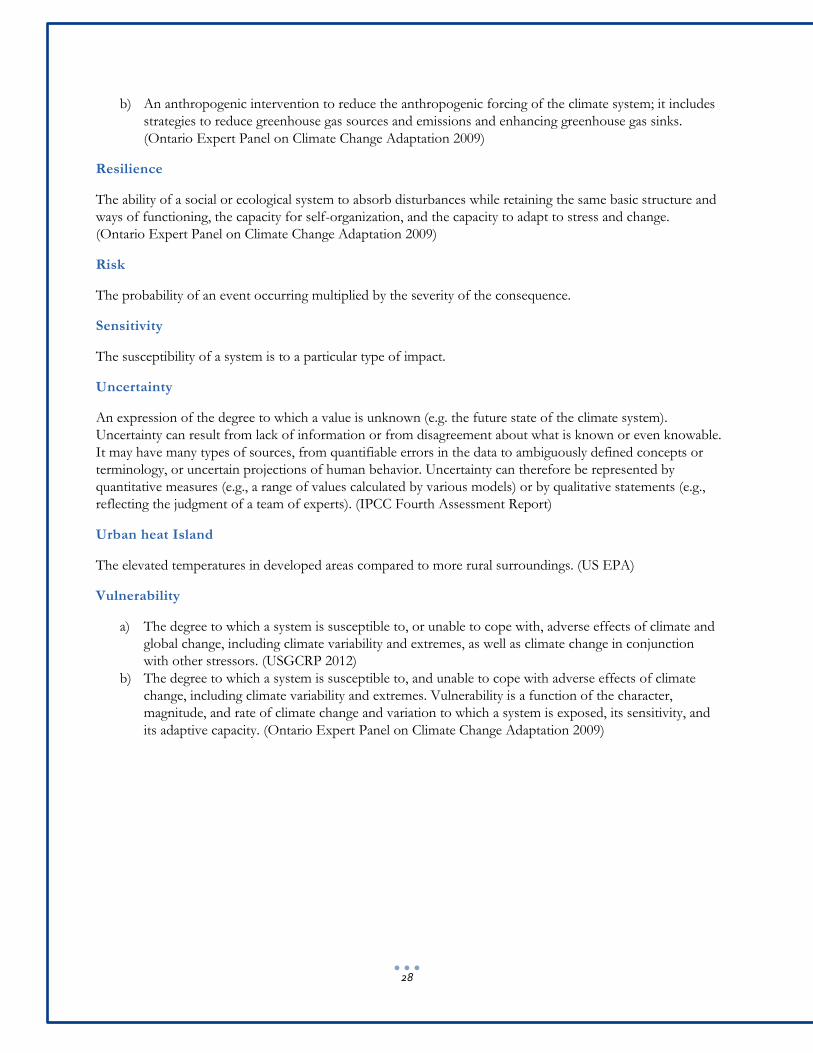
b) An anthropogenic intervention to reduce the anthropogenic forcing of the climate system; it includes
strategies to reduce greenhouse gas sources and emissions and enhancing greenhouse gas sinks.
(Ontario Expert Panel on Climate Change Adaptation 2009)
Resilience
The ability of a social or ecological system to absorb disturbances while retaining the same basic structure and
ways of functioning, the capacity for self-organization, and the capacity to adapt to stress and change.
(Ontario Expert Panel on Climate Change Adaptation 2009)
Risk
The probability of an event occurring multiplied by the severity of the consequence.
Sensitivity
The susceptibility of a system is to a particular type of impact.
Uncertainty
An expression of the degree to which a value is unknown (e.g. the future state of the climate system).
Uncertainty can result from lack of information or from disagreement about what is known or even knowable.
It may have many types of sources, from quantifiable errors in the data to ambiguously defined concepts or
terminology, or uncertain projections of human behavior. Uncertainty can therefore be represented by
quantitative measures (e.g., a range of values calculated by various models) or by qualitative statements (e.g.,
reflecting the judgment of a team of experts). (IPCC Fourth Assessment Report)
Urban heat Island
The elevated temperatures in developed areas compared to more rural surroundings. (US EPA)
Vulnerability
a) The degree to which a system is susceptible to, or unable to cope with, adverse effects of climate and
global change, including climate variability and extremes, as well as climate change in conjunction
with other stressors. (USGCRP 2012)
b) The degree to which a system is susceptible to, and unable to cope with adverse effects of climate
change, including climate variability and extremes. Vulnerability is a function of the character,
magnitude, and rate of climate change and variation to which a system is exposed, its sensitivity, and
its adaptive capacity. (Ontario Expert Panel on Climate Change Adaptation 2009)
29
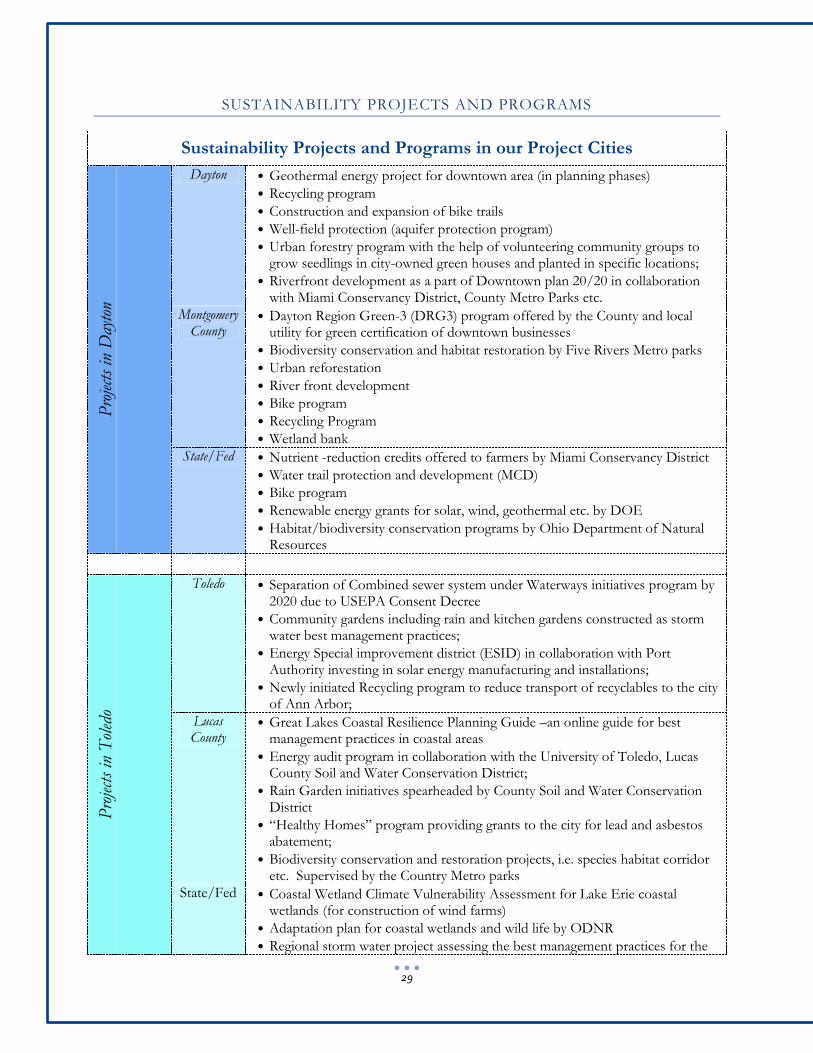
SUSTAINABILITY PROJECTS AND PROGRAMS
Sustainability Projects and Programs in our Project Cities
Pro
ject
s in
Day
ton
Dayton • Geothermal energy project for downtown area (in planning phases)
• Recycling program
• Construction and expansion of bike trails
• Well-field protection (aquifer protection program)
• Urban forestry program with the help of volunteering community groups to grow seedlings in city-owned green houses and planted in specific locations;
• Riverfront development as a part of Downtown plan 20/20 in collaboration with Miami Conservancy District, County Metro Parks etc.
Montgomery County
• Dayton Region Green-3 (DRG3) program offered by the County and local utility for green certification of downtown businesses
• Biodiversity conservation and habitat restoration by Five Rivers Metro parks
• Urban reforestation
• River front development
• Bike program
• Recycling Program
• Wetland bank
State/Fed • Nutrient -reduction credits offered to farmers by Miami Conservancy District
• Water trail protection and development (MCD)
• Bike program
• Renewable energy grants for solar, wind, geothermal etc. by DOE
• Habitat/biodiversity conservation programs by Ohio Department of Natural Resources
Pro
ject
s in
Tol
edo
Toledo • Separation of Combined sewer system under Waterways initiatives program by 2020 due to USEPA Consent Decree
• Community gardens including rain and kitchen gardens constructed as storm water best management practices;
• Energy Special improvement district (ESID) in collaboration with Port Authority investing in solar energy manufacturing and installations;
• Newly initiated Recycling program to reduce transport of recyclables to the city of Ann Arbor;
Lucas County
• Great Lakes Coastal Resilience Planning Guide –an online guide for best management practices in coastal areas
• Energy audit program in collaboration with the University of Toledo, Lucas County Soil and Water Conservation District;
• Rain Garden initiatives spearheaded by County Soil and Water Conservation District
• “Healthy Homes” program providing grants to the city for lead and asbestos abatement;
• Biodiversity conservation and restoration projects, i.e. species habitat corridor etc. Supervised by the Country Metro parks
State/Fed • Coastal Wetland Climate Vulnerability Assessment for Lake Erie coastal wetlands (for construction of wind farms)
• Adaptation plan for coastal wetlands and wild life by ODNR
• Regional storm water project assessing the best management practices for the
30
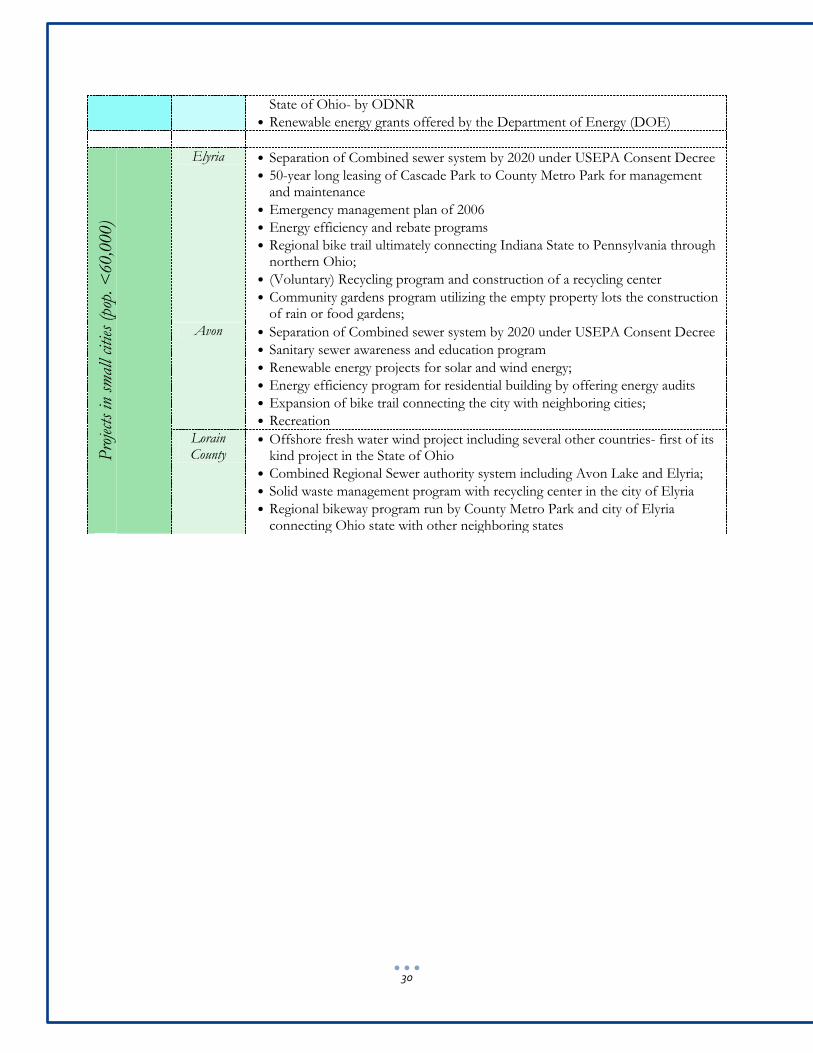
State of Ohio- by ODNR
• Renewable energy grants offered by the Department of Energy (DOE)
Pro
ject
s in
sm
all cities
(po
p. <
60,0
00)
Elyria • Separation of Combined sewer system by 2020 under USEPA Consent Decree
• 50-year long leasing of Cascade Park to County Metro Park for management and maintenance
• Emergency management plan of 2006
• Energy efficiency and rebate programs
• Regional bike trail ultimately connecting Indiana State to Pennsylvania through northern Ohio;
• (Voluntary) Recycling program and construction of a recycling center
• Community gardens program utilizing the empty property lots the construction of rain or food gardens;
Avon • Separation of Combined sewer system by 2020 under USEPA Consent Decree
• Sanitary sewer awareness and education program
• Renewable energy projects for solar and wind energy;
• Energy efficiency program for residential building by offering energy audits
• Expansion of bike trail connecting the city with neighboring cities;
• Recreation
Lorain County
• Offshore fresh water wind project including several other countries- first of its kind project in the State of Ohio
• Combined Regional Sewer authority system including Avon Lake and Elyria;
• Solid waste management program with recycling center in the city of Elyria
• Regional bikeway program run by County Metro Park and city of Elyria connecting Ohio state with other neighboring states

31
DAYTON PRELIMINARY VULNERABILITY ANALYSIS (MAPS & METHODS)
The GIS maps were created by combining data from a number of sources using a series of steps designed to
allow users to prioritize issues of concern for their city.
Identify data of interest
For each city in the study, a number of types of information were of interest including city boundaries, land
use, particularly green space, areas prone to flooding, and demographic information (age, race, and wealth).
Based on research, these characteristics are indicative of areas that are more vulnerable to the impacts of
climate change. Additionally, as expressed in several Dayton interviews, areas of high vacancy were also
included. Data found was publicly available online or via request.
City Boundaries: digitized from priority board maps provided by the city
Land Use: 2009 Adopted Land Use Plans, Miami Valley Regional Planning Commission
(http://www.arcgis.com/home/item.html?id=1e1baf29ac474901980083017eea22ca)
Flood Data: FEMA Flood Plain data, can be obtained by request from FEMA
Demographic Information and Vacancy: US Census and American Communities Survey (Social
Explorer and TIGER shapefiles)
Import Data Layers into ARCGIS programs
Ensure that the layers are all using the same projection to minimize distortion and allow for the data layers to
overlay.
Process Data Layers
Clip layers to appropriate spatial extent using city, regional, or county boundary layers of interest. Identify and
isolate variables of interest (i.e. green space, flood hazard areas) from data sets. Join demographic data tables
with corresponding shapefiles.
Perform Risk Analysis
To perform the combined risk analysis, the data layers of interest need to be converted from shapefiles to
raster. Demographic layers (% over 65, % under 5, % minority, and % under poverty line) were combined in
a weighted calculation to create a demographic risk index. The calculation for giving each demographic
variable equal weight is as follows:
(.25 * over_65 + .25 * under_5 + .25 * min_pop + .25 * pov_stat)
Euclidean distance can then be utilized to determine distance from features of interest (i.e. flood hazard, high
vacancy areas, green space). The values for these variables need to be stretched so they are on the same scale
(i.e. 0-100) so they can be combined. When Euclidean distance is calculated, it is assumed that closer to the
variable interest is better, so proximity to flood hazard and high vacancy were then inversed so that closer
proximity indicated higher risk. Proximity to high vacancy areas, the demographic risk index, proximity to
flood plains, and proximity to green/recreation space were then combined in a weighted calculation. The
weights attributed to each variable can be adjusted depending on primary issue of concern of the city. This
calculation is as follows:
Equally weighted: (.25 * vacancy + .25 * demographics + .25 * flood + .25 * green_space)
Vacancy Weighted: (.55 * vacancy + .15 * demographics + .15 * flood + .15 * green_space)
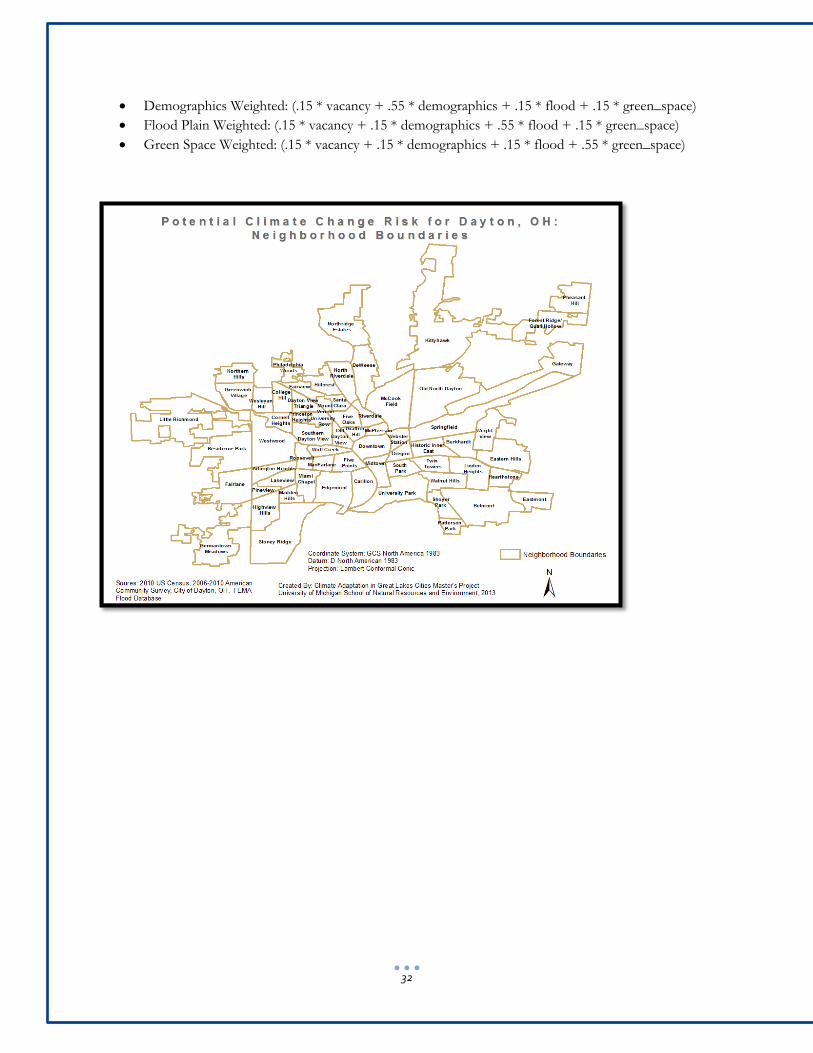
32
Demographics Weighted: (.15 * vacancy + .55 * demographics + .15 * flood + .15 * green_space)
Flood Plain Weighted: (.15 * vacancy + .15 * demographics + .55 * flood + .15 * green_space)
Green Space Weighted: (.15 * vacancy + .15 * demographics + .15 * flood + .55 * green_space)
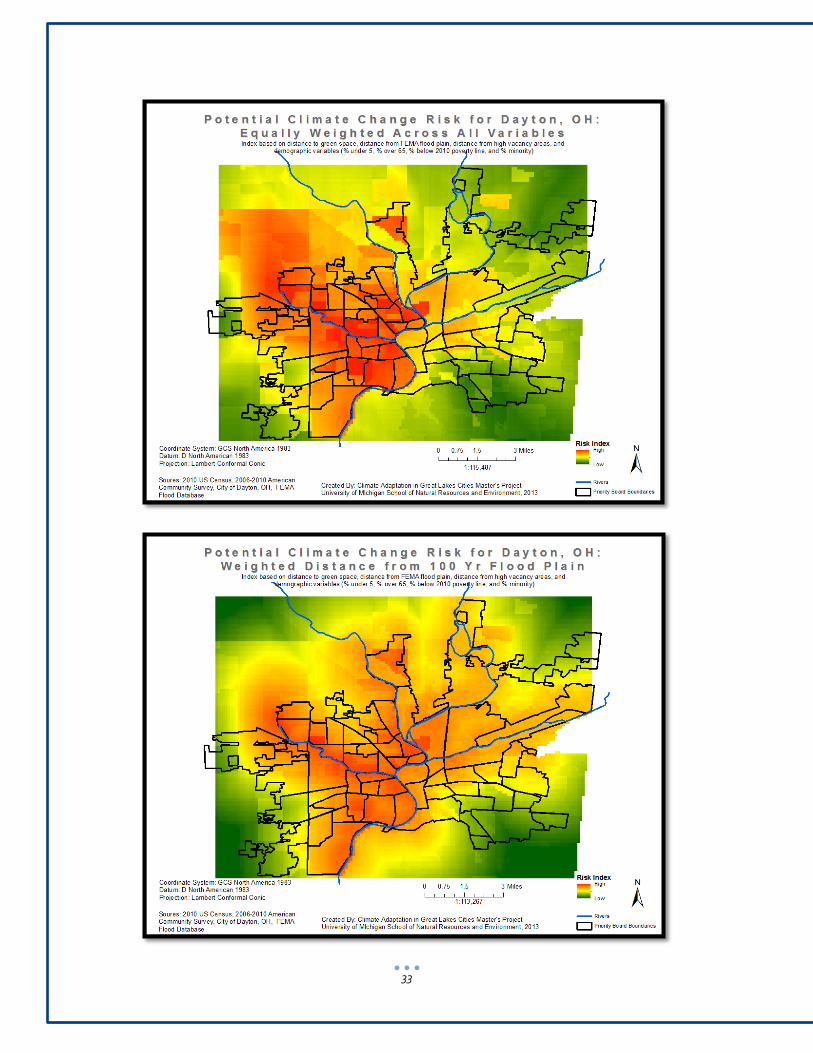
33
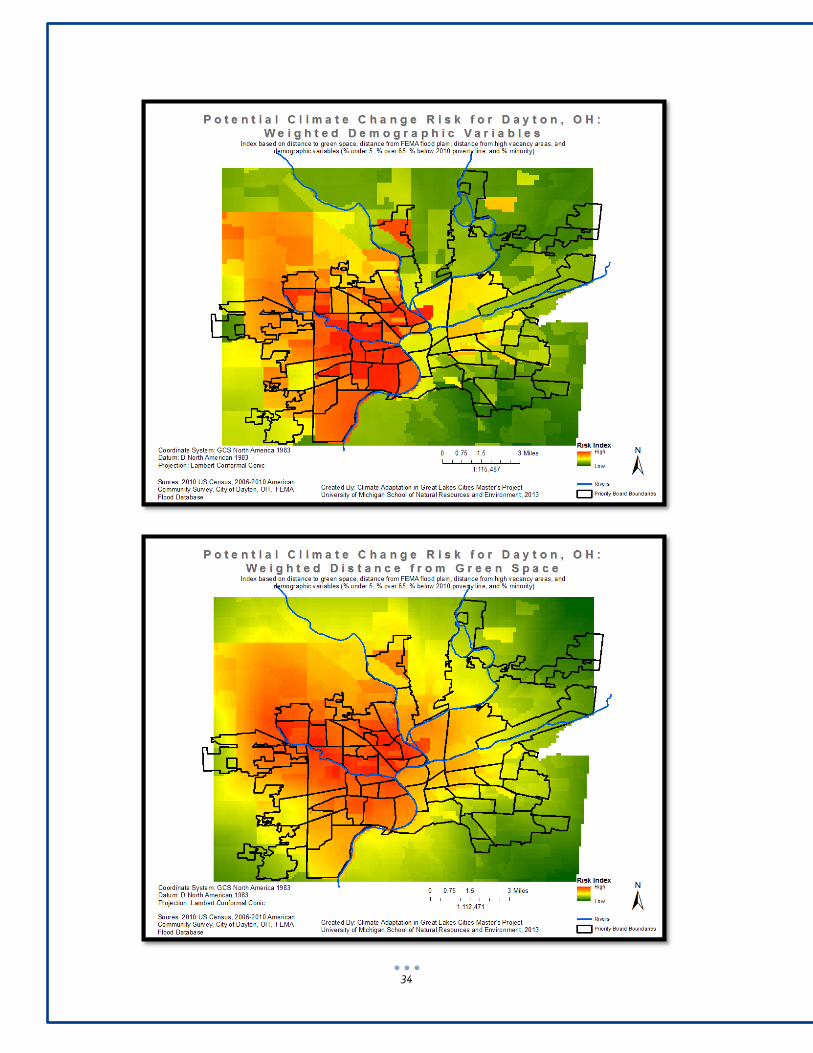
34
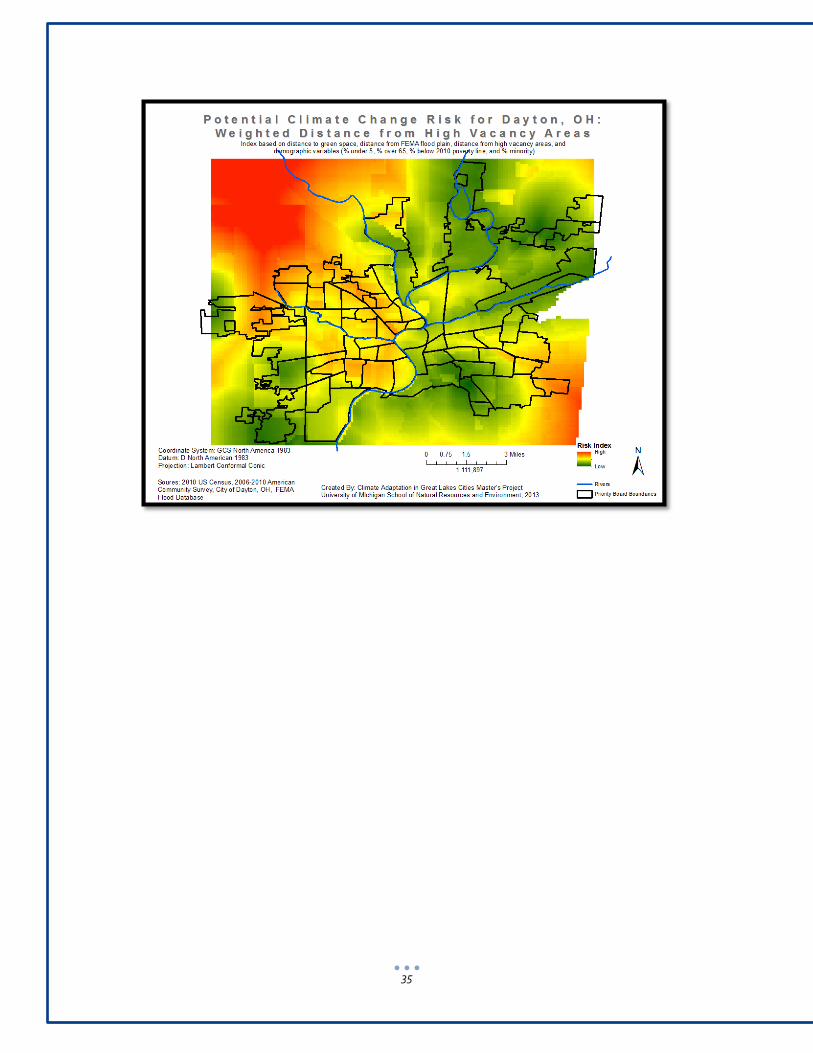
35

36
BEST PRACTICES FOR CLIMATE ADAPTATION Sec
tor
Examples of adaptation options/Best practices
‘No
regr
et’ st
rate
gy
Rev
ersi
ble/
Fle
xib
le
Exis
tenc
e of
che
ap s
afet
y
mar
gins
Sof
t st
rate
gies
Red
uced
dec
isio
n ho
rizo
ns
Syn
ergi
es w
ith
mitig
atio
n
Eco
syst
em s
ervi
ces
Strategic wetland restoration ++ +
+
Create and manage buffer zones around ecological reserves ++ -
+
+
Mitigate air, water, and soil pollution ++
+
Intensive management of climate-sensitive species + +
+
Promote landscape connectivity to facilitate species adaptation + -
+
Reg
iona
l ne
twor
ks
& k
now
ledg
e
Facilitating scientist-stakeholder information sharing
addressing adaptation needs and uncertainties ++ +
++
A multilevel governance framework for adaptation responses,
setting goals, regulations and financial support given to local
governments by national government
++ +
+
Inter-agency, regional coordination to protect ecosystems and
vulnerable species ++
+
+
Share knowledge and best practices with nearby cities to
achieve outcomes towards regional adaptation ++ ++
+
Em
erge
ncy
prep
ared
ness
Insurance, early warning and evacuation schemes ++ + + +
Improving social care networks/social safety nets ++ ++
Institutionalize risk/vulnerability analysis in long term plans + +
+
Emergency back-up systems/infrastructure + - +
Restrictive land use management + + + +
Adopt portfolio of actions to reduce and transfer risk + + + +
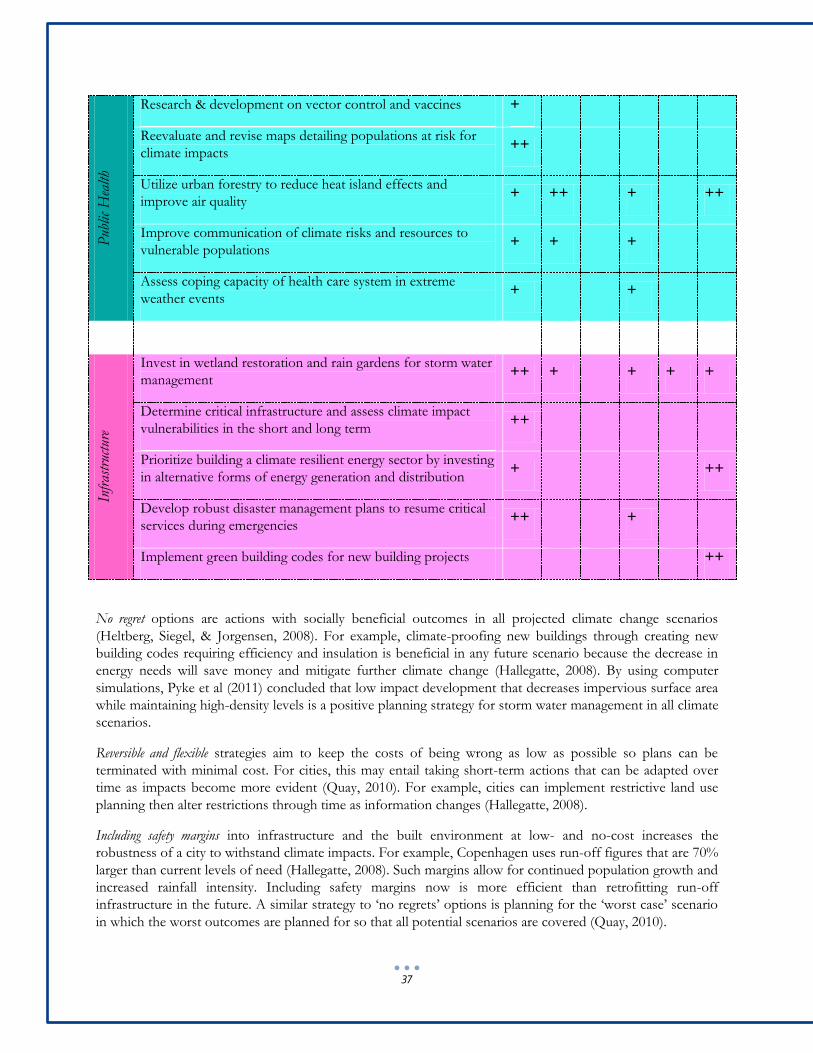
37
Pub
lic H
ealth
Research & development on vector control and vaccines +
Reevaluate and revise maps detailing populations at risk for
climate impacts ++
Utilize urban forestry to reduce heat island effects and
improve air quality + ++
+
++
Improve communication of climate risks and resources to
vulnerable populations + +
+
Assess coping capacity of health care system in extreme
weather events +
+
Infr
astr
uctu
re
Invest in wetland restoration and rain gardens for storm water
management ++ +
+ + +
Determine critical infrastructure and assess climate impact
vulnerabilities in the short and long term ++
Prioritize building a climate resilient energy sector by investing
in alternative forms of energy generation and distribution +
++
Develop robust disaster management plans to resume critical
services during emergencies ++
+
Implement green building codes for new building projects
++
No regret options are actions with socially beneficial outcomes in all projected climate change scenarios
(Heltberg, Siegel, & Jorgensen, 2008). For example, climate-proofing new buildings through creating new
building codes requiring efficiency and insulation is beneficial in any future scenario because the decrease in
energy needs will save money and mitigate further climate change (Hallegatte, 2008). By using computer
simulations, Pyke et al (2011) concluded that low impact development that decreases impervious surface area
while maintaining high-density levels is a positive planning strategy for storm water management in all climate
scenarios.
Reversible and flexible strategies aim to keep the costs of being wrong as low as possible so plans can be
terminated with minimal cost. For cities, this may entail taking short-term actions that can be adapted over
time as impacts become more evident (Quay, 2010). For example, cities can implement restrictive land use
planning then alter restrictions through time as information changes (Hallegatte, 2008).
Including safety margins into infrastructure and the built environment at low- and no-cost increases the
robustness of a city to withstand climate impacts. For example, Copenhagen uses run-off figures that are 70%
larger than current levels of need (Hallegatte, 2008). Such margins allow for continued population growth and
increased rainfall intensity. Including safety margins now is more efficient than retrofitting run-off
infrastructure in the future. A similar strategy to ‘no regrets’ options is planning for the ‘worst case’ scenario
in which the worst outcomes are planned for so that all potential scenarios are covered (Quay, 2010).
38
Soft strategies refers to institutional and financial tools for addressing climate impacts. Forcing planners to think
ahead several decades or creating suitable insurance policies to extreme weather events can increase the
flexibility and robustness of urban areas to climate change (Hallegatte, 2008). Creating formal, dedicated
climate units in city governments that monitor implementation and effectiveness of climate adaptation plans
can increase the legitimacy, coordination, and support for such policies (Anguelovski & Carmin, 2011). To
mitigate the effects of urban heat effects, Katzschner (2011) argues that planners must incorporate building
design and open spaces that create diverse microclimates and cooling effects, while ventilation should be
considered at the city level. Similarly, Mathey et al (2011) found that a ‘richly structured system of many
parcels of interconnected green spaces, supported by unrestricted cold air corridors from outlying areas, can
positively influence the entire urban micro-climate” (p. 434). Creating the institutional tools for implementing
such strategies requires altering the scale at which such considerations take place and increasing coordination
between regional and levels of governance.
Reducing the time horizon for decision-making means that some planning decisions may be best served if long-term
commitments are avoided. For example, if there is a great deal of uncertainty regarding climate conditions in
fifty to one hundred years, it might be most efficient to build cheaper buildings with shorter lifespans
(Hallegatte, 2008). Though this may seem to contradict taking a long view in climate adaptation planning,
these types of decisions can make the most sense when the long-term outcomes are uncertain.