climate change, agricultural income and food security issues in
TRANSCRIPT

1
Climate Change, Agricultural Income and Food Security Issues in
Malaysia: Farm Level Assessment
Md. Mahmudul Alam *
Institute for Environment and Development (LESTARI)
National University of Malaysia (UKM), Malaysia;
and
Integrated Education and Research Foundation, Dhaka, Bangladesh
E-mail: [email protected]
Chamhuri Siwar
Institute for Environment and Development (LESTARI)
National University of Malaysia (UKM), Malaysia
E-mail: [email protected]
Md. Wahid Murad
Business School, Faculty of the Professions
The University of Adelaide, Australia
E-mail: [email protected]
Mohd Ekhwan bin Toriman
School of Social, Development & Environmental Studies
Faculty of Social Sciences and Humanities (FSSK)
National University of Malaysia (UKM), Malaysia
E-mail: [email protected]
* Corresponding Author

2
Climate Change, Agricultural Income and Food Security Issues in
Malaysia: Farm Level Assessment
ABSTRACT
Climate change is proven to have had impacted the agricultural productivity, crop choice, and
food security everywhere in the world. The nature, scale, frequency, and outcome of such
impact differ significantly among countries, regions and areas within a country. This study is
an effort to empirically investigate theses issues for Malaysia using both primary and
secondary data collected from and relevant to the Integrated Agriculture Development Areas
in the Northwest Selangor. The results reveal that climate change phenomenon such as
natural disaster, drought, flood, pest attack, plant disease, and changing the time of crop cycle
have adversely been impacting Malaysian agriculture and its productivity as well as
profitability. Despite continuous increases of government subsidy as well as permission only
for paddy production, the paddy planting area is decreasing as the agricultural farmers often
experience adverse impacts of climatic variation. The current subsidy policy is also widening
the income gap among the rich and poor farmers. So, climate change phenomenon is also
depressingly impacting the income and state of food security among the farmers. As climate
change is universal and its existence is indefinite, the farmers need to adapt to and find ways
to mitigate the damages of climatic variation in order for them to sustain agricultural
productivity and attain food security.
Key words: Climate Change, Agricultural Productivity, Crop Choice, Food Security, Paddy
Farming, Farm Profitability, Agricultural Sustainability, Malaysia.
INTRODUCTION
Agriculture is primarily and heavily dependent on climate. The uncontrollable natures of
climate factors, such as temperature, rainfall, soil moisture, flood, drought, other natural
disaster etc., are changing over the time affecting agricultural, economic, social, and
environmental sustainability. Due to the climate change, several agricultural factors, such as
yield, cultivated area, and value of crops, are changing that influences the sustainability of
agriculture. Changes in climate affect the productivity of different crops differently.
Therefore, changes in outputs and economic returns from different crops differ significantly

3
affecting the decision of crop selection. Climate change also affects the state of food security
at both household and national levels.
In fact, climate change has mixed impacts on agriculture. The global impacts of
climate change on agricultural production vary from slight to moderate, while the regional
impacts are observed to be significant in many areas. Regional variations in gains and losses
result in a slight overall changes in world food productivity. Several studies suggest that
climate change will slow or reverse the rural poverty increasing the negative impacts on
agriculture. Warren et al. mentioned that some 600 million additional people are at risk of
hunger if temperature increases by over 3°C.[1]
Climate change may slow the rates of
improvement in food security. Projection by a study reveals that in 2080 around 1300 million
people could be at risk of hunger under the most extreme scenarios, that is around 600
million more than that in 1999.[2]
The Food and Agriculture Organization (FAO) reports that
over 860 million people in the world are suffering from severe food insecurity and chronic
malnourishment, and about 95 percent of them are in developing countries.[3]
The Intergovernmental Panel on Climate Change (IPCC) mentioned Africa as one of
the most vulnerable continents to climate change.[4]
Very few parts of Africa will be
benefited from a rising temperature, unlike some parts of the northern hemisphere. The
United Nations Framework Convention on Climate Change (UNFCCC) identifies a list of 49
Least Developed Countries (LDCs), which are at high risk from climate change and 33 of
these countries are located in Africa. A study revealed that due to climate change, Southern
Africa will lose more than 30% of its main crop, maize, by 2030, and Asia, especially South
Asia and South East Asia will lose top 10% of many regional staples, such as rice, millet and
maize.[5]
Studies also have linked the climate change impacts to the yield variation of cash
crops, such as rice, wheat, and tobacco, in South and Southeast Asian regions.[6-7]
Climatic
impacts on agriculture span a wide range of attributes and outcomes depending on the
specific climate scenario, geographical location, and nature of study. For example, while
major climate changes were predicted for China, to a certain extent warming would be
beneficial for yield increasing in the country due to diversification of cropping systems. In
case of Japan, the positive effects of CO2 on rice yields would generally more than offset any
negative climatic effects.[8]
But in case of Malaysia, under current climate change scenario,

4
temperature above 25oC may decline grain mass of 4.4% per 1
oC rise
[9], and grain yield may
decline as much as 9.6%-10.0% per 1oC rise
[10], whereas an average temperature in rice
growing areas in Malaysia is about 26oC. Singh et al. revealed that the actual farm yields of
rice in Malaysia vary from 3-5 tons per hectare, where potential yield is 7.2 tons.[11]
The
study also revealed that there is a decline in rice yield between 4.6%-6.1% per 1oC
temperature increase and that doubling of CO2 concentration (from present level 340ppm to
680ppm) may offset the detrimental effect of 4oC temperature increase on rice production in
Malaysia. Overall, based on the analysis of minimum and maximum yield of last 28 years,
the macro cases of the national data from 1980 to 2008 of Malaysia shows the yield of paddy
would be decreased between 43% and 61% if 1oC temperature and 1 millimeter (mm) rainfall
increased.[12]
In a recent study, based on the micro data on paddy field of Integrated
Agricultural Development Area (IADA), North-West Selangor, it has been found that a 1%
increase in temperature will lead to 3.44% decrease in current paddy yield and 0.03%
decrease in paddy yield in next season. Also a 1% increase in rainfall will lead to 0.12%
decrease in current paddy yield and 0.21% decrease of paddy yield in next season.[13]
However, the climatic factors are changing very rapidly in Malaysia. According to the
United Nations Development Report, carbon dioxide (CO2) emissions in Malaysia increased
by 221% during the period from 1990 to 2004 and the country has been placed in the list of
30 biggest greenhouse gas emitters in the world.[14]
Liebman also revealed that rapid growth
in CO2 emissions has been occurred even though Malaysia ratified the Kyoto Protocol and
has taken several initiatives to use renewable energy as well as ways to cut emissions.[15]
Currently Malaysia ranks as the 26th largest greenhouse gas emitter in the world with a
population of about 27 million, and it appears likely to move up the list quickly due to the
growth rate of emissions. Due to high greenhouse gas emissions, the average temperature is
projected to rise by 0.3oC to 4.5
oC and the warmer temperature will cause a rise in sea level
about 95cm over hundred periods. The changes in rainfall may fluctuate from about -30% to
+30%. This change will reduce crop yield and is prone to drought in many areas so that
cultivation of some crops such as rubber, oil palm and cocoa will not be possible.[8]
Moreover, the recent projection shows maximum monthly precipitation, which will
increase up to 51% over Pahang, Kelantan and Terengganu, while minimum precipitation
decreases between 32% and 61% for all over Peninsular Malaysia. Consequently, annual
rainfall will increase up to 10% in Kelantan, Terengganu, Pahang and North West Coast, and

5
decrease up to 5% in Selangor and Johor.[16]
Tisdell found that rainfall variability increases
the level of environmental stress that affects the capability of the system to maintain
productivity.[17]
Projection reveals that any changes, both positive and negative, more than
only 0.4% will cause to fall the yield of paddy production in Malaysia.[8]
Alam et al. found
that total yearly rainfall in Malaysia is increasing but its monthly variation is too high. In
Malaysia, the effect of lower rainfall is almost possible to check through proper irrigation
system, but the opposite phenomenon of over rainfall for any particular time, especially at the
end of the crop cycle or at the maturity period, causes serious damages of crops, which is
absolutely uncontrollable for now.[18]
In order to sustain the self-sufficiency level and food security of the nation through
increasing food productivity, income, and the provision of improved irrigation and drainage
facilities and other complementary inputs, such as fertilizers, pesticides, and weedicides etc,
and other agricultural services such as extension, credit, marketing and subsidies, the
Integrated Agricultural Development Projects (IADPs) were adopted since 1971 in Malaysia.
When initiated, however, there were eight IADPs in Malaysia and they have then been
renamed as IADAs.
Contribution of Agriculture to National Economy and Food Security
In the path of economic development from agriculture to industrial movement, the
agricultural sector of Malaysia has been declining its share of GDP since 1975. In 1970, the
contribution of agriculture to GDP was 30.8% which is the highest among all sectoral
contribution. The contribution of the agriculture to the GDP accounted 22.7% in 1975, 22.9%
in 1980 and 20.8% in 1985, but it was still the major contributor in GDP. In 1990, agriculture
became the second largest sector contributing 18.7% to the national GDP. In 1995, the
contribution of agriculture to the national GDP further declined to 13.6%, but it remained as
the second largest sector in the economy. The contribution of the sector continued to decline
to 8.9% in 2000 and 8.2% in 2005. While the agriculture sector was loosing its importance to
the national economy, services and manufacturing sectors have taken the first and second
highest contributing roles respectively, placing the agriculture as the third engine of
economic growth in the country (Table 1).
Table 1: Sectoral Contribution to GDP (in %) in Malaysia.[19-23]

6
Industry Year
1970 1975 1980 1985 1990 1995 2000 2005
Agriculture, livestock, forestry & fishery
30.8 22.7 22.9 20.8 18.7 13.6 8.9 8.2
Mining & quarry 6.3 4.6 10.1 9.7 5.7 7.4 7.3 6.7
Manufacturing 13.4 16.4 19.6 19.7 27.0 33.1 31.9 31.4
Construction 3.9 3.8 4.6 4.8 3.5 4.4 3.3 2.7
Services (total) 41.9 45.1 40.1 43.6 42.3 44.1 53.9 58.1
Electric, gas & water 1.9 2.1 1.4 1.7 1.9 2.3 3.9 4.1
Transportation, storage &
communication 4.7 6.2 5.7 6.4 6.9 7.3 8.0 8.8
Wholesale, trade, retail 13.4 12.8 12.8 12.1 11.0 12.1 14.8 14.7
Finance, insurance &
properties 8.4 8.5 8.5 8.9 9.7 10.7 12.7 15.1
Government services 11.1 12.7 12.7 12.2 10.7 9.7 6.8 7.6
Other services 2.5 2.8 2.8 2.3 2.1 2.0 7.6 7.8
Use of land by Malaysia’s agriculture also continues to decrease due to the country’s
rapid economic development, which occupies more agricultural land mainly for housing,
business, and industrial purposes. Since 1960 until 2005, the land use for industrial crops is
increasing while it is decreasing for food crops (Table 2). It just means that the major part of
agricultural land is being used for growing industrial crops and that importance of growing
food crops continues to decrease. In 1960, for example, land use for food crops accounted for
31.5% of the total agricultural land in Malaysia while it has decreased to 16.3% in 2005.
Among the industrial crops, palm oil sector accounted for the largest share of the total land
utilization in the country. Agricultural land use by the palm oil sector has significantly
increased over the last five decades with only 2.1% in 1960 to 63.4% in 2005. This just
reveals the facts that palm oil production has been getting more importance and contributing
significantly to the national economy.
Table 2: Distribution of Agricultural Land Utilization (in %) in Malaysia.[19-23]
Crop Year
1960 1965 1970 1975 1980 1985 1990 1995 2000 2005
Industrial crops(Total) 68.5 71.7 68.0 69.3 71.7 76.1 81.3 77 80.2 83.7
Rubber 65.7 66.9 58.6 51.2 45.1 39.3 44 30.6 26.1 19.6
Palm Oil 2.1 4.0 8.4 16.5 23 29.9 30.4 37.9 48.8 63.4
Cocoa 0.0 0.1 0.2 0.7 2.8 6.1 6.3 7.9 4.7 0.5
Pineapple 0.6 0.6 0.6 0.5 0.3 0.2 0.1 0.2 0.3 0.1
Tobacco 0.1 0.1 0.1 0.3 0.3 0.3 0.2 0.2 0.2 0.2
Food Crops (Total) 31.5 28.3 32.0 30.7 26.8 22.6 17.9 21.7 18.8 16.3
Paddy 17.5 16.8 20.8 19.5 16.5 13.1 10 11.3 7.5 7.1
Coconut 9.2 8.1 8.7 7.4 7.9 6.7 4.7 5.7 4.1 2.8
Vegetables 1.3 0.7 0.5 0.3 0.3 0.3 0.5 0.3 0.8 1
Fruits 1.5 1.6 1.6 1.7 2.1 2.4 2.7 4.3 6.4 5.2
Others 1.9 1.1 0.4 1.9 1.5 1.4 0.9 1.3 1 0.3
7
Total Land Area (Ha) 2667 3066 3445 3887 4446.6 4952.4 6636.3 5716.3 5368.3 6382
In Malaysia, there is no specific policy on food security, but it has been embedded
into the theme of self sufficiency level that referred to paddy or rice sector.[24]
Since rice is
the main staple food in Malaysia, self-sufficiency level has been focused on paddy and rice
production. However, the scope has been expanded to other food items including fruits,
vegetables, fish products, beef, mutton, pork, chicken, duck, eggs, and dairy products in the
First National Agriculture Plan in 1984. To ensure food security in Malaysia, however,
government follows two procedures, such as establishing self-sufficiency level and
maintaining rice stocks both domestically and internationally. Malaysia has had never met
food self-sufficiency level. About 10% to 35% of total required rice imported from
neighboring countries, such as Thailand, Vietnam, Myanmar, India, and Pakistan. The
highest food self-sufficiency level for the country was 95% and the lowest one was 65%,
which were recorded in 1975 and 1990, respectively. National Paddy and Rice Board (LPN-
later been privatized as Padiberas Nasional Berhad - BERNAS) is the authorized body to
manage the domestic rice stock.
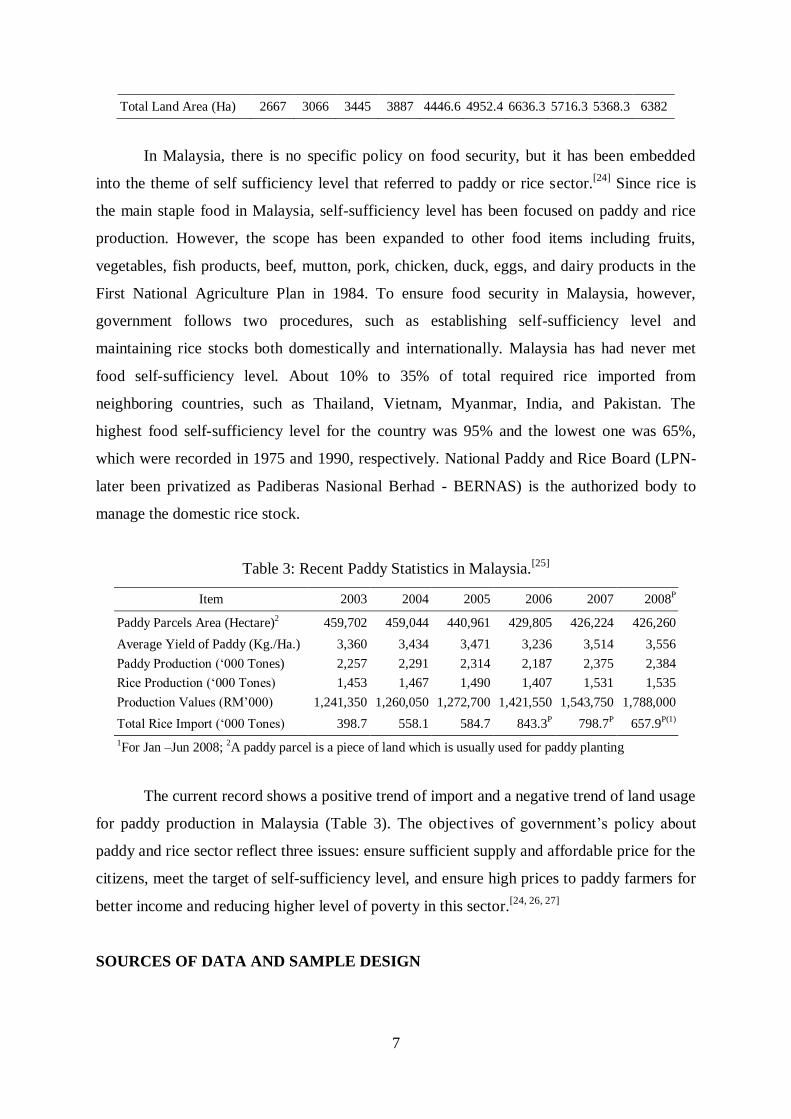
Table 3: Recent Paddy Statistics in Malaysia.[25]
Item 2003 2004 2005 2006 2007 2008P
Paddy Parcels Area (Hectare)2 459,702 459,044 440,961 429,805 426,224 426,260
Average Yield of Paddy (Kg./Ha.) 3,360 3,434 3,471 3,236 3,514 3,556
Paddy Production (‘000 Tones) 2,257 2,291 2,314 2,187 2,375 2,384
Rice Production (‘000 Tones) 1,453 1,467 1,490 1,407 1,531 1,535
Production Values (RM’000) 1,241,350 1,260,050 1,272,700 1,421,550 1,543,750 1,788,000
Total Rice Import (‘000 Tones) 398.7 558.1 584.7 843.3P 798.7P 657.9P(1)
1For Jan –Jun 2008; 2A paddy parcel is a piece of land which is usually used for paddy planting
The current record shows a positive trend of import and a negative trend of land usage
for paddy production in Malaysia (Table 3). The objectives of government’s policy about
paddy and rice sector reflect three issues: ensure sufficient supply and affordable price for the
citizens, meet the target of self-sufficiency level, and ensure high prices to paddy farmers for
better income and reducing higher level of poverty in this sector.[24, 26, 27]
SOURCES OF DATA AND SAMPLE DESIGN

8
In order to determine and analyze the impacts of climate change on agricultural productivity,
crop choice, and food security, primary data have been collected through an in depth survey
on farmers in the IADA area of North-West Selangor, Malaysia. The total agricultural land in
the above IADA area is 100,000 hectares, where 55,000 hectares are being cultivated for
palm oil, 20,000 hectares for coconut, 5,000 hectares for fruits and vegetable, and 20,000
hectares for paddy. The 20,000 hectares allocated for paddy also consist of river, drain, and
road. Within the 20,000 hectares allocated for paddy farming, the total paddy producible area
is actually 18,638 hectares, but paddy is currently being planted within 18,355 hectares and
the rest 283 hectares of land are currently unused. Moreover, total paddy irrigated area is
18,980 hectares, where an extra 625 hectares are being used for irrigation drainage. The
IADA area in Northwest Selangor further consists of eight areas where total reported paddy
farmers are about 10,300, other crop producing farmers are about 30,000, and the total size of
the agricultural community reported in the area is about 50,000.
Among the paddy producing farmers, a total of 198 farmers were interviewed using a
structured questionnaire under a research project entitled “The economics of climate change:
Economic dimensions of climate change, impacts and adaptation practices in agriculture
sector: Case of paddy sector in Malaysia”, conducted by the Institute for Environment and
Development (LESTARI) of the National University of Malaysia (UKM) funded by Ministry
of Science, Technology and Environment of the Government of Malaysia.[28]
Data for this
project were collected through a sample survey of paddy producing farmers in the eight
sections of the Integrated Agricultural Development Area (IADA) of North-West Selangor,
Malaysia. Trained enumerators were hired to interview the respondents in all IADA areas
using a stratified-quota random sampling technique. All the 198 agricultural farmers
interviewed in the study were reported to have been cultivating a total 577.53 hectares of land
for paddy production. Details socioeconomic profiles of the respondents are available at
Alam and others.[29-30]
Relevant secondary data have also been collected from several sources, such as IADA
publication, Ministry of Science Technology and the Environment (MOSTE) publication,
National Hydraulic Research Institute of Malaysia (NAHRIM) publication, Agriculture
Statistical Handbook, and Government of Malaysia various fifth-year plans.
RESULTS AND DISCUSSION

9
Impacts of Climatic Change on Crop Productivity
Available literatures have revealed earlier that climate change has an adverse impact on
agriculture in Malaysia. The projection of paddy yield in the country showed that any
positive or negative variation of above 0.4% in both rainfall and temperature will decrease
the yield of paddy production by 2020 (Table 4). When considering a positive or negative
variation of above 0.7% in both rainfall and temperature by 2040, paddy yield tends to
decline further and this negative trend of paddy yield is expected to continue by the year
2060, considering the variation (±) of above 1%. These clearly indicate a very high level of
vulnerability of paddy productivity to the climatic variation in the next couple of decades.
Table 4: Projection of Paddy Yield (Kg/Ha) with Different Variations of Temperature and
Rainfall at Certain Level of CO2.[8]
Year 2020* Year 2040^ Year 2060~
Variation
in
Rainfall
Variation in
Temperature ( 0C) Variation
in
Rainfall
Variation in
Temperature ( 0C) Variation
in
Rainfall
Variation in
Temperature ( 0C)
0.3 0.85 1.4 0.4 1.4 2.4 0.6 2 3.4
14% 6,156 5,806 5,586 23% 7,342 6,942 6,542 32% 8,619 8,059 7,499
7% 6,646 6,306 6,086 11% 8,200 7,800 7,400 15% 9,834 9,274 8,714
0.4% 7,202 6,862 6,642 0.7% 9,042 8,642 8,242 1% 10,962 10,402 9,842
0% 7,202 6,862 6,642 0% 9,042 8,642 8,242 0% 10,962 10,402 9,642
0.4% 7,202 6,862 6,642 -0.7% 9,042 8,642 8,242 -1% 10,962 10,402 9,642
-7% 6,698 6,382 6,177 -11% 8,047 7,691 7,335 -15% 9,318 8,842 8,366
-14% 6,194 5,901 5,712 -23% 6,962 6,654 6,346 -32% 7,454 7,073 6,693
*, ^, ~ indicates CO2(ppm) level at 400, 600, and 800 respectively
But the farmers have different views concerning the impacts of climate change on
agricultural output. While they were asked about the possible impacts of climate change on
paddy yield, 21.2% indicated that climate change causes productivity to decline (Table 5).
There were several reasons that farmers perceived as causing productivity decline in
agriculture. For example, 48% farmers indicated that natural disaster, drought, pest attack,
and plant disease negatively affect the crop productivity and hence changes the time of crop
cycle. On the other hand, 30.8% farmers indicated that increase in agricultural input cost does
indirectly affect the crop productivity. These farmers have further indicated that the higher
input cost results in lesser amount of input use, which eventually causes crop productivity to
decline.

10
Table 5: Farmers’ Perception toward the Effect of the Climate Change on Paddy Production.
Response No. of Respondent % of Total
Productivity Decline 42 21.20%
Increase Production Cost 61 30.80%
Natural Disaster 13 6.60%
Drought 10 5.10%
Pest Attack 23 11.60%
Plant Diseases 38 19.20%
Timing of Cultivation 11 5.60%
Total 198 100%
All the farmers interviewed were also asked whether or not climatic variation in the
IADA area affects their paddy production. A total of 64% farmers indicated that they have
had experienced reduced amount of paddy production due to climatic variation in the area.
When the same farmers were asked if climatic variation does also affect the yield of other
crops, a majority of those farmers (65.2%) responded positively by agreeing that yield of
other crops also decreases due to climate changes. Given the fact that climate change
negatively affects the yield of paddy and other crops, those farmers were then asked which
crop they want to select under such adverse situation. Their response, however, was not in
favor of paddy crop as only 23.7% farmers have chosen this crop followed by 19.7% farmers
who like to produce only short term or seasonal plants, which are not considerably affected
by the climatic variation in that particular area. Among those farmers who were asked which
crop to select under such adverse climatic situation, as many as 39.4% farmers have
responded that they prefer to cultivate long term plants such as mango, palm oil, coconut, and
banana in areas which were actually allocated by the IADA authorities for paddy farming.
Impacts of Climatic Change on Farms’ Profitability and Relevant Government Subsidy
The farmers are dependent on agriculture for their income. As a result, when the quantity of
agricultural production declines the income of the farmers also declines, resulting in a loss of
their profitability.[31-33]
The recent projection by the Ministry of Science, Technology, and the
Environment (MOSTE), Malaysia reveals that income earnings from paddy cultivation under
different variations of temperature and rainfall are different. For example, any positive or
negative variation of above 0.4% in rainfall will decrease farmers’ income earning as well as
profitability from paddy production in the next several decades (Table 6).

11
Table 6: Projection of Revenue Changes (RM/Ha) for Paddy Production with Variations of
Temperature and Rainfall at Certain Level of CO2.[8]
Year 2020* Year 2040^ Year 2060~
Variation
in
Rainfall
Variation in
Temperature ( 0C) Variation
in
Rainfall
Variation in Temperature
( 0C) Variation
in
Rainfall
Variation in Temperature
( 0C)
0.3 0.85 1.4 0.4 1.4 2.4 0.6 2 3.4
14% -554.2 -554.2 -554.2 23% -892.1 -892.1 -892.1 32% -1,229.5 -1,229.5 -1,229.5
7% -291.8 -291.8 -291.8 11% -441.9 -441.9 -441.9 15% -591.9 -591.9 -591.9
0.4% 0 0 0 0.7% 0 0 0 1% 0 0 0
0% 0 0 0 0% 0 0 0 0% 0 0 0
0.4% 0 0 0 -0.7% 0 0 0 -1% 0 0 0
-7% -264.5 -251.9 -224.0 -11% -522.1 -499.1 -476.0 -15% -862.7 -818.6 -774.5
-14% -529.0 -504.3 -488.0 -23% -1,091.5 -1,043.2 -994.9 -32% -1,840.8 -1,764.9 -1,652.4
*, ^, ~ indicates CO2(ppm) level at 400, 600, and 800 respectively
Note: Revenue calculated as paddy price per 100kg Super Grade= RM55.00 & Normal Grade= RM51.69
In fact, profitability is an important factor which affects farmers’ crop selection.
While selecting crops, 37.9% farmers’ decision criteria are based on the profit that includes
high return, government subsidy, and high turnover (Table 7). Also 38.4% farmers indicated
that they consider their skills and less requirement of effort to cultivate and manage the crops.
Data also reveal that 6.6% farmers select crops based on their fascination about the crop.
Table 7: Farmers’ Crop Selection by Free of Choice and Reasons for Selecting a Particular
Crop.
Crops
Choice
Reason of Choice Total
Respondent
% of total
Respondent High
Return
Government
Subsidy
High
Turnover
Skilled
Area
Easy to
Manage
High
Passionate NR
Paddy 9 3 7 13 5 10 47 23.70%
Seasonal
Fruits 4 1 3 1 9 4.50%
Vegetable 1 5 5 1 12 6.10%
Lemon
Grass 1 2 1 4 8 4.00%
Maize 2 2 3 7 3.50%
Flower 1 1 0.50%
Fishery 1 1 0.50% Lemon 1 1 0.50%
Palm Oil 5 20 2 20 47 23.70%
Banana 7 3 9 19 9.60%
Coconut 1 8 9 4.50%
Mango 2 2 1.00%
Wood Tree 1 1 0.50%
NR 34 34 17.20%
Total 30 3 42 16 60 13 34 198 100.00%
% of
Total 15.20% 1.50% 21.20% 8.10% 30.30% 6.60% 17.2% 100%

12
Worth noting to mention that government of Malaysia currently provides huge
amount of subsidy to the paddy producers to encourage paddy cultivation and to ensure more
production for increasing the country’s self-sufficiency level. However, the types and
contents of these subsidies have been summarized below:
Input subsidy: 12 beg (20 kg each) compound fertilizer and 4 beg (20kg each) urea
fertilizer per hectare – worth MYR 400 and pesticide incentive MYR 200 per hectare.
Price Subsidy: Provided at the selling price – MYR 248.1 per ton.
Rice Production Incentive: Land preparation/plowing incentive – MYR 100 per
hectare and organic fertilizer 100kg per hectare – worth MYR 140.
Yield Increase Incentive: Provided if producers (farmers) are able to produce 10 tons
or more per hectare – MYR 650 per ton.
Free Supports: Free supports for irrigation, infrastructure, and water supply.
Table 8: Government Subsidy (in MYR) for Paddy Sector in Malaysia.[25]
Items 2004 2005 2006 2007
Subsidy For Paddy Price 476,628,303 443,218,042 445,749,898 444,000,000 Paddy Fertilizers 186,744,867 178,072,073 396,393,001 261,677,743
Paddy Production Incentive NA NA NA 67,563,904
Yield Increase Incentive NA NA NA 85,434,620
Paddy Seed Help NA NA NA 17,000,000 Diesel Subsidy Scheme NA NA 989,727,418 1,099,000,723
Petrol NA NA 45,413,959 69,461,384
Total Subsidy and Incentive 663,373,170 621,290,115 1,877,284,276 2,044,138,374
Note: NA for data which were not found available.
In order to support the farmers and increase productivity as well as increase income of
farmers, government’s subsidy for agricultural sector is increasing each year (Table 8). The
subsidies for urea and compound fertilizer have been continuing since 1979. The incentive
for land preparation and using organic fertilizer has been continuing since 2007. Providing
urea and compound fertilizer and pesticide incentive was introduced in 2008 and these
supports are still continuing.[34-35]
However, unless the adverse effects of climatic change are
not reduced or removed and productivity is increased, government support and subsidy
cannot produce a sustainable and progressive paddy sector, in particular, and the agriculture
in general.
The current subsidy policy for busting up productivity also creates more income
inequality among the farmers. Most of the incentives are going to the favor of commercial big

13
farmers. Due to economics of scales and using heavy machineries, mostly the commercial
farms can meet the target of high productivity and able to receive the yield increase incentive.
Moreover, to make social balance, government allotted a certain amount of land only to the
Malay farmers, but the productivity of Malay farmers is far low than Chinese farmers. .[33}
It
is also a threat for achieving national self-sufficiency level of paddy production.
Impacts of Climatic Change on Crop Choice and Farmers’ Income
The government of Malaysia had allocated the IADA area only for paddy production, but
paddy production in the area currently provides 90.3% of agriculture related income to the
farmers. About one third of those farmers engaged in IADA area also have income from
permanent plant such as, mango, coconut, palm oil, cocoa, banana, etc. This is really
alarming because the IADA fields are no more being cultivated only for paddy production.
Even though the IADA officials have been checking and trying to remove these permanent
plants from the fields, but farmers’ tendency and attitude are not favorable. The cultivation of
these permanent plants, however, provides 7% of agricultural income to all surveyed farmers
as a whole, but a maximum of 63.7% of agricultural income is also found for an individual
case.
Beside producing paddy in the IADA fields, farmers also like to produce seasonal
crops, seasonal fruits, and seasonal vegetables. A total of 3% farmers produce these crops and
a maximum of 7.6% of agricultural income comes from such production of non-paddy crops.
Livestock production has also been found as a small source of total agricultural income of
paddy producing farmers. Only 6.6% farmers are engaged in livestock production, which
provides a maximum of 27.9% of total agricultural income to the IADA farmers (Table 9).
Agricultural wages are another important source of agricultural income as 14.6% farmers are
earning income by engaging themselves as labor in the IADA fields. Their wages, however,
account for 2.1% of total agricultural income of all the surveyed farmers while an individual
farmer’s income from wage was found to be a maximum of 35.7% of his or her total
agriculture related income.
Table 9: Farmers’ Income from Different Agriculture Related Sources.
Income Range Paddy
Production
Permanent
Plants for
Seasonal Crops,
Fruits and
Livestock
Production
Agricultural
Wage from

14
Long Term Vegetables Labor Selling
.01-10% 0 20 6 10 12
10-20% 0 17 0 2 11
20-30% 1 12 0 1 3
30-40% 1 10 0 0 3
40-50% 3 3 0 0 0
50-60% 4 2 0 0 0
60-70% 13 2 0 0 0
70-80% 17 0 0 0 0
80-90% 26 0 0 0 0
90-100% 133 0 0 0 0
Total 198 66 6 13 29
% of Total 100.0% 33.3% 3.0% 6.6% 14.6%
Maximum 100.0% 63.7% 7.6% 27.9% 35.7%
Minimum 23.5% 0.0% 0.0% 0.0% 0.0%
Proportion of Total Income 90.3% 7.0% 0.1% 0.5% 2.1%
Impacts of Climate Changes on Food Security
While the target of the IADA authorities is to ensure 7.5 tons of paddy production per
hectare, the actual average yield found by the survey is 6.85 tons per hectare. The survey also
found that among the people working in the IADA fields there were actually 67% farmers
and that 51.8% areas of the IADA fields are being cultivated for paddy production, which are
clearly below the government’s target level. Paddy yield in the IADA area of West Selangor
reported was 5.042 tons per hectare in 2007 while the yield decreased to 4.819 tons per
hectare in 2008.[28]
Under such variation in yield due to climatic change, it seems to be very
tough for the farmers to meet the yield target and the IADA authorities will also find it hard
to attract farmers to produce paddy. In fact, climate change is proven to have a negative
impact on food security, which coincides with the actual perception of agricultural farmers as
evident in the present study. As many as 64.1% of all the surveyed farmers reported that yield
of paddy production decreases due to climate change while a total of 65.2% of those farmers
further reported the same impact for the other crops (Table 10). So it appears that continuous
decreases in crop yield will negatively affect both the self-sufficiency and long-term food
security of the country.
Table 10: Farmers Perception of Yield Changes for Paddy and Other Crops Due to Climate
Change.
Types of
Supports
Observation Scale* Average Value of
Scale
S.D. Agreed (4 & 5)
Observation
Disagreed (1 & 2)
Observation 1 2 3 4 5

15
Yield of Paddy Production Decreases
10 5.1%
13 6.6%
48 24.2%
42 21.2%
85 42.9%
3.9 1.18 127
64.1% 23
11.6%
Yield of Other Crops
Production Decreases
12
6.1%
8
4%
49
24.7%
77
38.9%
52
26.3% 3.75 1.08
129
65.2%
20
10.1%
*Scale: 1 = Strongly Disagree, 2 = Disagree, 3 = No Comment, 4 = Agree, 5 = Strongly Agree.
The survey conducted by the study further reveals that farmers’ selection of crops also
depends on historical record of different crops. As a matter of fact, 72.2% of all the surveyed
farmers reported that they consider previous years’ price and productivity rate of alternative
crops to select one for planting (Table 11). The survey also reveals a remarkable finding that
7.1% of those farmers are not willing to produce paddy in next season. As a result, paddy
planting area in the IADA fields tends to decrease over the next seasons. However, the
average decrease of paddy land reported by the IADA Authorities for the last three years was
0.34% (Table 12). In spite of government’s regulation and constant subsidy in the agriculture
sector, every year the IADA’s paddy planting area decreases and this trend continues.
Table 11: Crop Selection Decision of Farmers.
Types of Supports Observation Scale* Average
Value of
Scale
S.D.
Agreed
(4 & 5)
Observation
Disagreed
(1 & 2)
Observation 1 2 3 4 5
Consider previous
years’ price and
productivity rate of
different crops to
select one for
planting
3
1.5%
6
3%
46
23.2%
76
38.4%
67
33.8% 4 0.91
143
72.2%
9
4.5%
Wish to produce
paddy in next
season
2
1%
1
0.5%
11
5.6%
59
29.8%
125
63.1% 4.54 0.72
184
92.9%
3
1.5%
*Scale: 1 = Strongly Disagree, 2 = Disagree, 3 = No Comment, 4 = Agree, 5 = Strongly Agree
Table 12: Changes in Paddy Planting Area in IADA, West Selangor.[36]
Year Paddy Planting Area
(In Hectares)
Changing Rate of Paddy
Planting Area
2005 18490
2006 18399 -0.49%
2007 18355 -0.24%
2008 18301 -0.29%
POLICY RECOMMENDATION AND CONCLUSIONS

16
As climate change is a continuous and long term process, its effects and solutions are
similarly time and effort consuming process. Most of the warming during the next 30 years
will be due to emissions that have already occurred. Over the longer term, the degree and
pace of warming mainly depend on current and near future emissions.[37]
To adopt with
climate change, conventionally, mitigation has received more attention than adaptation, both
from a scientific and policy perspective. Mitigation is the main way to prevent future impacts
of climate change, and it will reduce the cost of adaptation. So, any delay in mitigation
strategy to reduce emissions will increase the need and cost of adaptation, and increase the
risk of global climate change. On the other hand, though adaptation is not a substitute of
mitigation, there are arguments for adaptation to consider as a response measure. Mitigation
actions never stop a certain degree of climate change due to historical emissions and the
inertia of the climate system.[38]
Moreover, mitigation effects may take several decades to
manifest, where most adaptation activities take immediate effect. Adaptation reduces risks
associated with current climate variability as well as addressing the risks associated with
future climate changes, where mitigation only focuses on future risks. The measures of
adaptation can be applied to a local scale or root level with the involvement of large number of
stakeholders, where mitigation works in the decision making level. In the current world, climate
factors are exogenous variables that are immitigable in a quick manner and as a consequence
adaptation is the most appropriate way to cope the system properly. It is therefore important
to balance between measures against the causes of climate change and measures to cope with
its adverse effects.[37, 39]
In recent years, adaptation has gained prominence as an essential response measure,
especially for vulnerable countries due to the fact that some impacts are now unavoidable in
the short to medium term.[40]
Mitigation is necessary but adapting to future risk is more
important. Immediate and long term actions are essential for various actors including
government, development partners, research organizations, and community organizations. In
fact, adaptation is too broad to attribute its costs clearly, because it needs to be undertaken at
many levels, including at the household and community level, and many of these initiatives
are self-funded.[37]
Options for agricultural adaptation can be grouped as technological
developments, government programs, farm production practices, and farm financial
management.[41]
So, it has been suggested to prepare a planned and proactive adaptation
strategy to secure sound functioning of the economic, social and environmental system. For
the case of this study, however, relevant and specific policy recommendations have been

17
proposed below for appropriate stakeholders for better copping up with the impacts of
climate changes in the IADA area of Northwest Selangor, Malaysia. Depending on the degree
to which current climate change impacts in the above area are similar to those in other IADA
areas, states, regions, and countries the following policy recommendations will have wider
applicability.
Government as the policy and law making authority has to play most influential role
to ensure climatic mitigation and adaptation at all levels. It is the main responsibility of
government to give enough supports in order to enable farmers to adapt to different climatic
situations and to make them self-sufficient rather than subsidy dependent. Appropriate
authorities also need to carefully define government’s subsidy supports and incentive
programmes to influence farm-level production, practices, and financial management. Hence,
agricultural policies and investments need to be more strategic. But the government needs to
define and ensure the compensation, minimum income protection, and insurance facility for
the affected groups – individual farmer or farm. In the planning processes, policy makers
need to account the barriers of adaptation including ecological, financial, institutional, and
technological barriers, as well as information and cognitive hurdles.
Government currently provides chemical fertilizers to farmers to increase
productivity. Government policy should be environment friendly so that subsidy would be
provided more on organic fertilizers than chemical fertilizers. Other few important issues
need to be focused, such as stakeholders may not sufficiently inform about the needs and
possible strategies of climate change [42-43]
, farm level faces uncertain future and hinder the
development process causes to obstacle for implementation of adaptations policy [44-45]
, and
the policy deals with different conflicting interest groups. To avoid the negative impacts of
climate changes on agriculture and to control pollutions and emissions in the sector, however,
proper mitigation policies are urgently required for Malaysia. Further, Malaysian agriculture
sector also needs to include mitigation policies due to the emission of commercial farming.
The issues of mitigation and adaptation to climate change concern all sectors as well
as all levels of political, administrative, economic and everyday life. To better cope up,
cooperation is necessary across countries, sectors and administrative levels. Relevant actors
are needed to be aware of the benefits of cooperation to gain long-term benefits instead of
focusing only on short-term and individual interest. The production practices of farm and the

18
knowledge of individual farmer also need to be updated with the changes of climate factors.
The agricultural farmers should understand the crop rotation, crop portfolio, and crop
substitutions. They should also take all precautions and be aware about the uncertainty of low
rainfall and heavy rainfall. The financial management of agricultural farms must be efficient
and the farmers must secure for minimum two cropping seasons so that if crops damage in
one season they will have the seeds for next season. This will help them bear the cost of
another crop production and survive financially up to the time when new crops are collected.
But this will require the farmers take initiative for crop sharing, forward rating, hedging, and
insurance etc.
On the basis of several requirements of farmers, however, the IADA authorities in
Northwest Selangor also need to engage different new groups of stakeholders to ensure
necessary facilities for the farmers. They also need to engage financial institutions more
inclusively in order to provide supports of loan, insurance, saving schemes, hedging or future
option, and so on to the agricultural farmers. Technological adaptation to climate change is
also important to deal with the climatic problems in the long run. It is apparent that
development of technology is a boundless area, but it is possible in several ways. The highest
efficient way of technological advancement is being able to solve the problem, such as China
made an example of man-maid precipitation as well as protect precipitation. [46]
Until gaining
such a complete advancement, there should be few alternative options that will help to adapt
to climate change in the following different ways:
To solve the problem: controlling the pattern of rainfall, sunshine, and
moisture level.
To improve shielding resources: protecting crops from excessive rainfall or
sunshine and solving water login problems.
To develop defensive approach: development of verities of crops,
development of rainfall and temperature tolerant plants, and finding alternative
crops and hybrids.
To find alternative approach: changing crop cycle and reducing the timing of
crop cycle.
To provide information: providing weather forecast and early warning system
and ensuring delivery of proper information at the farm level.

19
The impacts of climate change on agricultural sustainability vary from country to
country, region to region and time to time. The yield and productivity of agricultural crops in
Malaysia are proven to have been heavily influenced by climatic variations. Malaysia is the
26th
largest greenhouse gas emitter which causes the expected rise of temperature by 0.3oC to
4.5oC, and rise in sea level is expected to be about 95cm over a hundred years. The changes
in the country’s rainfall fluctuate heavily from -30% to +30%. This change reduces crop yield
and is prone to drought in many areas so that cultivation of some crops such as rubber, oil
palm and cocoa becomes unfeasible. Current crop productivity is also affected by the climatic
variations throughout the country as the actual farm yields of rice in Malaysia vary from 3-5
tons per hectare while the potential yield is 7.2 tons per hectare. The projection of climate
change and its impacts on productivity and farmers’ profitability are thus considered as very
alarming.
ACKNOWLEDGEMENT
We are thankful to Ministry of Science, Technology and Environment of the Government of
Malaysia for generously funding the research, under the Research University Grant (UKM-
GUP-PI-08-34-081). We would also like to thank Prof. Dr. Rafiqul Islam Molla (Multimedia
University, Malaysia) and Dr. Basri Talib (National University of Malaysia) for their advices
and supports at various stages of the study.
REFERENCES
1. Warren, R., N. Arnell, R. Nicholls, P. Levy and J. Price, 2006. Understanding the
regional impacts of climate change. Research report prepared for the Stern Review,
Tyndall Centre Working Paper 90, Tyndall Centre, Norwich.
2. Parry, M.L., C. Rosenzweig, A. Iglesias, G. Fischer and M.T.J. Livermore, 2004.
Effects of climate change on global food production under SRES emissions and
socio-economic scenarios. Global Environmental Change, 14: 53-67.
3. FAO, 2008. High-Level Conference on World Food Security: The Challenges of
Climate Change and Bioenergy: Soaring Food Prices: Facts, Perspectives, Impacts
and Actions Required. Food and Agriculture Organization of the United Nations,
Rome.
4. Boko, M., I. Niang, A. Nyong, C. Vogel, A. Githeko, M. Medany, B. Osman-
Elasha, R. Tabo and P. Yanda, 2007. ‘Africa’ in climate change 2007: impacts,
adaptation and vulnerability. In Parry, M.L., O.F. Canziani, J.P. Palutikof, P.J. Van
der Linden and C.E. Hanson (eds.). Contribution of Working Group II to the
Fourth Assessment Report of the Intergovernmental Panel on Climate Change.
Cambridge University Press, Cambridge UK.

20
5. Lobell, D.B., M.B. Burke, C. Tebaldi, M.D. Mastrandrea, W.P. Falcon and R.L.
Naylor, 2008. Prioritizing climate change adaptation needs for food security in
2030. Science, 319(5863): 607-610.
6. Matthews, R.B., M.J. Kropff, D. Bachelet, H.H. van Laar, 1994a. Climate Change
and Rice Production in Asia. Entwicklung und Landlicherraum, 1: 16-19.
7. Matthews, R.B., M.J. Kropff, D. Bachelet, H.H. van Laar, 1994b. The Impact of
Global Climate Change on Rice Production in Asia: a Simulation Study. Report
No. ERL-COR-821. Corvallis, OR: U.S. Environmental Protection Agency,
Environmental Research Laboratory.
8. MOSTE, 2001. National Response Strategies to Climate Change. Ministry of
Science, Technology and the Environment, Putrajaya, Malaysia.
9. Tashiro, T. and I.F Wardlaw, 1989. A comparison of the effect of high temperature
on grain development in wheat and rice. Annals of Botany, 64: 59-65.
10. Baker, J.T. and Jr.L.H. Allen, 1993. Contrasting crop species responses to CO2 and
temperature: rice, soybean and citrus. Vegetatio, 104/105: 239-260.
11. Singh, S., R. Amartalingam, W.S. Wan Harun, and .T. Islam, 1996. Simulated
impact of climate change on rice production in Peninsular Malaysia. Proceeding of
National Conference on Climate Change. pp. 41-49, UPM, Malaysia.
12. Ali, R. and A.K. Ali, 2009. Estimating the Prospective Impacts of Global Warming
on Malaysian Agriculture. Proceeding of 2nd National Conference on Agro-
Environment 2009, MARDI, Malaysia, Mar 24-26.
13. Alam, M.M., B. Talib, C. Siwar and T. Mohd Ekhwan, 2010a. The Impacts of
Climate Change on Paddy Production in Malaysia: Case of Paddy Farming in
North-West Selangor. Proceedings of the international conference of the 4th
International Malaysia-Thailand Conference on South Asian Studies. National
University of Malaysia, Malaysia, Mar 25-26.
14. The Associated Press, 2007. Malaysian Growth of Carbon Emissions Highest in
the World, UN Says. The Irrawaddy. Nov 29. (Online)
http://www.irrawaddy.org/article.php?art_id=9454 (Oct 1 2009).
15. Liebman, B., 2007. Malaysia leads the world in greenhouse gas emission growth
rate. Curb Global Warming. Nov 29. (Online)
http://curbglobalwarmingblog.blogspot.com/2007/11/malaysia-leads-world-in-
greenhouse-gas.html (Oct 1 2010).
16. NAHRIM, 2006. Final Report: Study of the Impact of Climate Change on the
hydrologic Regime and Water Resources of Peninsular Malaysia, National
Hydraulic Research Institute of Malaysia (NAHRIM) and California Hydrologic
Research Laboratory (CHRL), Malaysia.
17. Tisdell, C., 1996. Economic indicators to assess the sustainability of conservation
farming projects: An evaluation. Agriculture, Ecosystems and Environment, 57(2):
117-131.
18. Alam, M.M., T. Mohd Ekhwan, C. Siwar and B. Talib, 2011a. Rainfall variation
and changing pattern of agricultural cycle. American Journal of Environmental
Science, 7: 82-89. DOI 10.3844/ajessp.2011.82.89 (Cited 05 Aug 2011)
19. Malaysia, 1986. Fifth Malaysia Plan, 1986-1990. Kuala Lumpur: National Printing
Malaysia Berhad.
20. Malaysia, 1991. Sixth Malaysia Plan, 1991-1995. Kuala Lumpur: National Printing
Malaysia Berhad.
21. Malaysia, 1996. Seventh Malaysia Plan, 1996-2000. Kuala Lumpur: National
Printing Malaysia Berhad.

21
22. Malaysia, 2001. Eighth Malaysia Plan, 2001-2005. Kuala Lumpur: National
Printing Malaysia Berhad.
23. Malaysia, 2006. Ninth Malaysia Plan, 2006-2010, Economic Planning Unit, Prime
Minister’s Department, Putrajaya.
24. Arshad, F.M., M.N. Shamsudin and R. Saleh, 1999. Food Security in Malaysia,
Presented at Seminar on International Trade and Food Security. Asian Productivity
Organisation, Tokyo, February.
25. Agriculture Statistical Handbook, 2008. Paddy. Ministry of agriculture. Malaysia.
26. Selvadurai, S., 1972. Padi Production in West Malaysia. Ministry of Agriculture,
Malaysia.
27. Arshad, F.M., 2007. Agriculture Development Path in Malaysia. In Arshad, F.M.,
N.M.R. Abdullah, B. Kaur, and A.M. Abdullah. 50 Years of Malaysian
Agriculture: Transformational Issues Challenges & Direction. 3-46. Universiti
Putra Malaysia, Serdang.
28. Alam, M.M., C. Siwar and T. Mohd Ekhwan, 2010b. Socioeconomic Study of
Climate Change: An Assessment of Agriculture and Livelihood Sustainability on
Paddy Farming in Malaysia. LAP Lambert Academic Publishing, Saarbrucken.
29. Alam, M.M., C. Siwar, R.I. Molla, T. Mohd Ekhwan and B. Talib, 2010c.
Socioeconomic Impacts of Climatic Change on Paddy Cultivation: An Empirical
Investigation in Malaysia. Journal of Knowledge Globalization, 3(2): 71-84.
(Online) http://journals.sfu.ca/jkg/index.php/journal/article/view/57/44 (Cited 05
Aug 2011).
30. Alam, M.M., C. Siwar, M.W. Murad, R.I. Molla and T. Mohd Ekhwan, 2010d.
Socioeconomic Profile of Farmer in Malaysia: Study on Integrated Agricultural
Development Area in North-West Selangor. Agricultural Economics and Rural
Development, 7(2): 249-26. (Online)
ftp://www.ipe.ro/RePEc/iag/iag_pdf/AERD1013_249-265.pdf (Cited 05 Aug
2011).
31. Siwar C, M.M. Alam, M.W. Murad and A.Q. Al-amin, 2009. A review of the
linkages between climate change, agricultural sustainability and poverty in
Malaysia. International Review of Business Research Papers, 5(6):309-321.
(Online) http://www.bizresearchpapers.com/23.%20Siwar.pdf. Cited 05 Aug 2011
32. Alam, M.M., C. Siwar and A.Q. Al-Amin, 2010e. Climate Change Adaptation
Policy Guidelines for Agricultural Sector in Malaysia. Asian Journal of
Environmental and Disaster Management, 2(4): 463-469. DOI
10.3850/S1793924011000873 (Cited 05 Aug 2011).
33. Alam, M.M., C. Siwar, B. Talib and T. Mohd Ekhwan, 2011b. An Empirical Study
on the Relationships between the Socioeconomic Profile of Farmers and Paddy
Productivity in North-West Selangor, Malaysia. Asia-Pacific Development Journal,
18(1). (Online) http://www.unescap.org/pdd/publications/index_apdj.asp (Cited 05
Aug 2011).
34. Alam, M.M., T. Mohd Ekhwan, C. Siwar, R.I. Molla and B. Talib, 2011c. The
Impacts of Agricultural Supports for Climate Change Adaptation: Farm Level
Assessment Study on Paddy Farmers. American Journal of Environmental
Sciences, 7(2): 178-182. DOI 10.3844/ajessp.2011.82.89 (Cited 05 Aug 2011).
35. Alam, M.M., C. Siwar, T. Mohd Ekhwan, R.I. Molla and B. Talib, 2011d. Climate
Change Induced Adaptation by Paddy Farmers in Malaysia, Mitigation and
Adaptation for Global Change, 16(7), DOI: 10.1007/s11027-011-9319-5 (Cited 05
Aug 2011).

22
36. IADA (Integrated Agricultural Development Area), 2009. Internal Unpublished
Data from the record of North West Selangor, Malaysia, March.
37. Stern, N., 2007. The Economics of Climate Change: The Stern Review. Cambridge
University Press, Cambridge.
38. IPCC (Intergovernmental Panel on Climate Change), 2001. Climate Change 2001:
Impacts, Adaptation and Vulnerability. IPCC Third Assessment Report, Cambridge
University Press, Cambridge, U.K.
39. Pielke, R., G. Prins, S. Rayner and D. Sarewitz, 2007. Lifting the taboo on
adaptation. Nature, 445(7128): 597-598.
40. Alam, M.M., C. Siwar, R.I. Molla, T. Mohd Ekhwan and B. Talib, 2011e. Climate
Change and Vulnerability of Paddy Cultivation in North-West Selangor, Malaysia:
A Survey of Farmers’ Assessment. Voice of Academia, 6(1):45-56.
41. Smit, B. and M.W. Skinner, 2002. Adaptation options in agriculture to climate
change: a typology. Mitigation and Adaptation Strategies for Global Change, 7: 85-
114.
42. Eisenack, K. and J. Kropp, 2006. Regional stakeholder perceptions of climate
change: Baltic case study screening, ASTRA document, Potsdam.
43. Eisenack, K., V. Tekken and J. Kropp, 2007. Stakeholder Perceptions of climate
change in the Baltic Sea Region. Coastline Reports, 8: 245-255.
44. Behringer, J., R. Buerki and J. Fuhrer, 2000. Participatory integrated assessment of
adaptation to climate change in Alpine tourism and mountain agriculture.
Integrated Assessment, 1: 331-338.
45. Brown, K., R. Few and E.L. Tompkins, 2007. Climate change and coastal
management decisions: insights from Christchurch Bay, Coastal Management,
35(2-3): 255-270.
46. MacLeod, C. 2006. China rolls out the big guns, aiming for a dry Olympics. USA
Today, Jun 29. Available at < http://www.usatoday.com/news/world/2006-06-29-
china-rain_x.htm> (Jun 25 2010).