climate change risk assessment: moragolla hydropower plant
TRANSCRIPT
Climate Change Risk Assessment: Moragolla Hydropower Plant
May 2014
Democratic Socialist Republic of Sri Lanka:
Green Power Development and Energy Efficiency
Improvement Investment Program
Prepared by Ceylon Electricity Board for the Asian Development Bank.
CURRENCY EQUIVALENTS (as of 29 May 2014)
Currency unit – Sri Lanka rupee/s (SLRe/SLRs)
SLRe1.00 = $0.00767
$1.00 = SLRs130.40
ABBREVIATIONS ADB – Asian Development Bank CEB – Ceylon Electricity Board EMP – environmental management plan EIRR – economic internal rate of return FIRR – financial internal rate of return GCM – global calculation model IM – inter monsoon MOPE – Ministry of Power and Energy NWM – North West monsoon SWM – South West monsoon
WEIGHTS AND MEASURES
km – kilometer kV – kilovolt GWh – gigawatthours MCM – million cubic meters MVA – megavolt-ampere MVAr – megavolt-ampere reactive MW – megawatt
NOTE
In this report, “$” refers to US dollars.
This climate change risk assessment is a document of the borrower. The views expressed herein do not necessarily represent those of ADB's Board of Directors, Management, or staff, and may be preliminary in nature. Your attention is directed to the “terms of use” section of this website. In preparing any country program or strategy, financing any project, or by making any designation of or reference to a particular territory or geographic area in this document, the Asian Development Bank does not intend to make any judgments as to the legal or other status of any territory or area.

Content List of Figures List of Tables A Project Climate Risk Assessment and Management Reporting 1. Introduction 1
2. Project Hydrology 1 3. Effects on Precipitation 4 4. Projection on temperature change scenario 5 5. Sea level rise 5 6. Concentration of CO2 level 5 7. Overall climatic change and its effects on hydropower generation
in Sri Lanka 5
8. Future climatic change impact on Moragolla Hydropower Project 6
9. Conclusion 10 10. References 11

List of Figures
Figure No 1 Project location Map
Figure No 2 Monthly average rainfall at Moragolla Dam Figure No 3 Flow duration curve at Moragolla dam
Figure No 4 Moragolla Dam site basin rainfall Figure No 5 Expected monthly average Energy generation and Plant Load factor Figure No 6 Forecasted flow duration curve at Moragolla Dam Figure No 7 Projection of monthly average Energy generation and Plant Load factor by 2025 Figure No 8 Projection of monthly average Energy generation and Plant Load factor by 2050 Figure No 9 Projection of monthly average Energy generation and Plant Load factor by 2100
List of Tables Table No 1 Future projections for Change in Annual Rainfall Table No 2 Future projections for change in mean annual temperature Table No 3 Projection of land loss and inundation due to sea level rise Table No 4 Climatic impacts and their impact on Hydropower Generation Table No 5 Forecasted reservoir inflow Table No 6 Forecasted reservoir inflow and Energy generation

A Project Climate Risk Assessment and Management Reporting
I. Basic Project Information
Project Title: Green Power Development and Energy Efficiency Improvement Investment Program
Project Budget: $ 440 million
Location: Sri Lanka - Central, Eastern, Northern, North Central, North Western and Western provinces
Sector: Energy – hydropower generation, electricity transmission and distribution, energy efficiency and conservation
Theme: Economic growth, environmental sustainability, capacity development
Brief Description:
The investment program includes:
(i) Hydropower generation developed. In Central Province, a 30-MW, run-of-river hydropower plant will be built
at Moragolla, including 0.5 km of 132 kV associated transmission infrastructure to connect the plant to the grid, which will increase clean, low cost, base-load power generation.
(ii) Transmission infrastructure enhanced. In Eastern, Northern, North Central, North Western, and Western
provinces, 220/132 kV, 220/132/33 kV, and 132/33 kV grid substations and associated lines will be constructed to absorb the increased power demand and ensure stable system operation with intermittent wind and solar generation.
(iii) Efficiency of medium-voltage network improved. In Eastern and North Western provinces, 33-kV lines and
reactive power management will be developed by installing switched capacitor banks in the medium-voltage network to address overloading of conductors, voltage drop in medium-voltage lines, and poor power factor.
(iv) Demand-side management for energy efficiency improved. Pilot demand-side management subprojects in
Colombo will (a) use smart grid and metering technologies, (b) retrofit buildings with smart energy-saving technology, and (c) install cold thermal storage in selected buildings to achieve energy savings.
(v) Capacity development support provided. Capacity development will reinforce the physical investments and
include (a) institutional capacity building for power system development, system operation and dispatching, and energy efficiency improvement; and (b) project management, including implementation supervision and preparation of new projects for the second tranche.
II. Summary of Climate Risk Screening and Assessment
A. Sensitivity of project component(s) to climate/weather conditions and sea level
The following components of the investment program could be affected by weather/climate conditions: 1. Moragolla hydropower plant
Sensitivity to climate/weather conditions: (i) Future Water Availability: Climate change is likely to have a negative impact on the future availability of water for power generation. A significant amount of rainfall in the upper catchment of Mahaweli Basin has been observed to have declined by 39.12% during the past century consequently the stream flow in the Mahaweli Basin is declining. Annual precipitation is projected to increase by about 100 mm within the watershed upstream of Moragolla by 2050s. Projected rise in annual mean temperature (1.8
0 Celsius) will cause
increased evapotranspiration (~6%). Overall, a reduction of about 5% in total runoff is projected and the net effect of climate change may not significantly affect the availability of water.
(ii) Sedimentation: The projected increase in annual precipitation is likely to caused exacerbated soil erosion within the watershed upstream of Moragolla. Increased sediment load entering the storage will not only result in reduced water storage and more frequent flushing but also abrasion of turbine cover, guide vanes, and blades.

2. Transmission and distribution
The main impact of climate change on electricity transmission and distribution is the rising temperatures. By 2050, annual mean temperature is projected to increase by 1.8
0 Celsius.
Higher temperatures cause: 1) thermal expansion of power lines which results in line sag; 2) increased resistance of transmission and decreased amount of power that can be securely transported, and 3) increased demand puts extra electricity flowing through the lines thereby generating extra heat.
B. Climate Risk Screening
Risk topic:
1. Temperature increase 2. Increased potential
evapotranspiration 3. Precipitation change 4. Increased soil erosion
rate
Description of the risk: 1. Higher temperatures cause increased power demand and lower transmission
efficiency. The effect of increased ambient temperature on power transmission lines is increased resistance. In addition, high ambient temperature can cause lines to sag. Higher temperatures also cause de-rating of transformers. However, projected increase in annual mean temperature is less than 2 degrees Celsius, and the effect of sagging could be negligible.
2. For mid-latitudes and some subtropical regions, the general increase in evaporation means that some areas that see an increase in precipitation will experience a reduction in river runoff.
3. Climate change may affect river flows not only through a change in the magnitude of rainfall but also through possible changes in the onset or duration of rainy seasons (such as those caused by monsoon). The 30 MW hydropower plant is of run-of-river type and the capacity is based on average flow of the stream therefore sensitive to changes in precipitation (both the amount and the temporal patterns). Increased intensity of precipitation might result in flooding that could inundate substations.
4. Increased erosion in the upstream areas due to climate change may imply increasing cost of sediment management. High sedimentation may cause abrasion of turbine cover, guide vanes, and blades.
Climate Risk Classification: Low
C. Climate risk assessment The climate change risk screening confirms that the investment program’s components have no major climate change risks. More detailed climate change risk assessment has been undertaken for the Moragolla hydropower plant during the processing and detailed engineering design.
III. Climate Risk Management Response within the Project
1. The detailed engineering design of the run-of-river Moragolla hydropower plant has been prepared.
1 The design
considers potential risks (e.g., precipitation change, temperature increase, and sedimentation), including equipping the dam of a small reservoir with adequate gate size which will allow efficient flushing of the sediments accumulated at the upstream end of the upper pool under normal operating conditions, etc. Planned substations will be designed to curb the risks of flooding.
2. The proposed hydropower plant generation will bring additional 97.7 gigawatt-hours to the grid per year, equivalent to avoiding about 72,272 tons of carbon dioxide emissions per year for the useful life of the plant. An average annual reduction of about 98,400 tons of carbon dioxide emissions may be achieved through technical loss reduction from the improved energy efficiency of the transmission and distribution infrastructure.
1 The detailed engineering design was completed under ADB. 2011. Report and Recommendation of the President to the Board
of Directors: Proposed Loans and Administration of Technical Assistance Grant to the Democratic Socialist Republic of Sri
Lanka for the Sustainable Power Sector Support Project. Manila.

1
1. Introduction 1. Mahaweli River is the largest river basin and the longest river in Sri Lanka. It has 10,327 km2 of catchment area and produces 5570MCM volume of water as average annual runoff. It originates from the wet zones in hilly area and travels to the sea through dry zones in north eastern region of the country. Water resource of this river basin has been largely developed through an accelerated Mahaweli Development Programme during two decades period from 1970 to 1990. Water from the river basin is mainly used for irrigation and generation of hydropower through many projects set up during this period. 2. Today there are 07 major hydropower stations developed in Mahaweli river basin having total installed capacity of 810MW. In addition to them there are many Mini Hydropower plants constructed along this river as a run of the river type power plants having installed capacity less than 10MW.
3. Harnessing of the hydropower potential in this island to the optimum possible level is considered important since it is a renewable source of energy which protect environment better than many other mode of power generations. Alternatively other forms of energy which are currently being utilized by the island are mostly based on fossil fuel. However they always impacted the national economy much negatively due to the volatility of prices in today’s energy context. In view of this, the Government is keen in developing remaining hydropower projects in the island and hence Moragolla Hydropower project has been identified for implementing in the present 10-year development plan of the Government.
4. Moragolla hydropower project is located close to the village of Ulapane in the Kandy district of Central Province. The Hydropower potential to be harnessed at this location is concentrated in the river reach of Mahaweli Ganga between the confluences with Kothmale Oya and Atabage Oya which are right bank tributaries. Gross head of about 75m is available within a reach length of about 3000m in the proposed project area. According to the present studies, the available Hydropower potential at this location is sufficient to develop 30MW run off river type Hydropower Plant having annual expected firm energy of nearly 100GWhs.
5. The project scale has been decided to accomplished sustainability among technical, environmental, social and economic aspects. Based on them the finalised project scale is capable to render EIRR of 17% and FIRR of 6.5% in present energy context. However to ensure the expected outcome and to rationalize the requisite investment for the Moragolla hydropower project it is prudent to evaluate the behaviour of the catchment area upstream to the project site based on the anticipated risk of climatic changes obtain by a climatic model projection in addition to the inferences obtain from past time series environmental parameters.
6. For the purposes of studying the anticipated risk of climate changes for the Moragolla Hydropower Project, it is supposed to focus on the time series analysis of past rain fall pattern at the Moragolla Dam location carried out by the hydrological studies of this project and recently published paper on “Mainstreaming Climate Change for Sustainable Development in Sri Lanka” by the Institute of Policy Studies of Sri Lanka based on model projection climatic parameters. 2. Project Hydrology 7. Mahaweli River originates from the central region of the country and flows toward north east direction through the project area. Mahaweli river confluences with Kothmale Oya, one of

2
the largest tributaries of upper Mahaweli basin, at about 3.5 km upstream to the proposed Moragolla dam site. 8. The Kothmale Oya has been regulated completely by creating a storage type reservoir nearly at 7km upstream to the confluence with Mahaweli River. Therefore larger portion of Mahaweli river catchment in Kotmale Oya basin will not be contributed to Moragolla Hydropower project. However the unregulated catchment area of 247km2 in Mahaweli proper will be available for Moragolla Hydropower project.
Figure No. 1: Project location Map
9. This unregulated catchment area of Mahaweli Ganga at Moragolla dam receives rain mainly from the South West Monsoon (SWM) from mid-April to late August and the Inter Monsoon (IM) from September to November. The mean annual rainfall at Moragolla dam is about 3852mm. The following chart shows the monthly average rainfall at Moragolla dam.
Moragolla dam site
kotmale dam sit

3
Figure No 2: Monthly average rainfall at Moragolla Dam
10. According to the hydrological studies the mean river flow at the Moragolla dam site is concluded to be 22.40m3/s. The flow duration curve at the Moragolla Dam is shown bellow.
Figure No. 3: Flow duration curve at Moragolla dam
0
50
100
150
200
250
300
350
400
450
500
Jan Feb Mar Apr May Jun Jul Aug Sep Oct Nov Dec
0
50
100
150
200
250
0% 20% 40% 60% 80% 100%
Disc
harg
e (m
3 /s)
Percent of Exceedance

4
3. Effects on Precipitation
11. The time series analysis of daily rainfall data at Moragolla dam over last 44 years has been examined statistically to see the long term trend and cyclical trend of the rainfall pattern. The following figure shows annual rainfall and its trend line at Moragolla Dam location.
Figure No. 4: Moragolla Dam site basin rainfall
12. According to them the inferences has been examined statistically and concluded that no such cyclical trend of rainfall pattern is found at Moragolla dam. However as shown in the above figure the areal rainfall at Moragolla dam site has slightly downward slope in trend line. The downward slope is not statistically significant according to the “Mann-Kendall” tests and hence it is concluded that there is no such long term trend of rainfall pattern at Moragolla Dam. Therefore there are no evident facts to explain why such slightly downward trend of annual rainfall exists. 13. However, it is a known fact that any climatic system is very complex and dynamic and hence projection of their behavior into the future is a difficult task. Analysis of past record can give us some indications about ongoing trends, but however the trend itself is not appropriate to deduce future climatic behavior.
14. Therefore recently a downscaling technique has been studied by environmental experts to generate projection of climatic parameters for Sri Lanka using Global Calculation Model (GCM). This study has used a model developed by the Hardly Center in UK known as HadCM3, under the A2 scenario storyline taking 1961-1990 climatic values as the baseline.
15. Accordingly this model projection has suggested that the annual precipitation in Sri Lanka will increase over the baseline by following amounts in future.
Year Increment over the baseline/(mm)
South west Monsoon (SWM) North East Monsoon (NEM)
2025 173 23
2050 402 54
2100 1061 143
Table No. 1: Future projections for Change in Annual Rainfall
16. These results have shown that an increase of an annual rainfall being predicted for both monsoons, in which the projected increase for SWM, is substantially high. Since the rainfalls in both monsoons are in positive trend with time, the rainfall in Inter Monsoon (IM) period, in between of them is also most likely to be increased accordingly. 17. However, this model projection result is not consistent with the overall drop and decreasing trend observed in the annual rainfall in many rainfall gauging stations in Sri Lanka during last few decades. According to them it has been concluded that the changes in rainfall

5
for South West Monsoon (SWM) and Inter Monsoon (IM) were negligible while 19% declining of rainfall was mainly reported for North East Monsoon (NEM).
4. Projection on temperature change scenarios 18. The climatic model projection has shown that the mean annual temperature of Sri Lanka will increase steadily throughout the century. The projected temperature values are given in the following table.
Year Change in temperature over the baseline/(ºC)
2025 0.4
2050 0.9
2075 1.6
2100 2.4
Table No. 2: Future projections for change in mean annual temperature
19. According to them the mean annual temperature of this country will rise by 2.4 ºC than the baseline of 1961-1990 in 2100. These results are consistent with the trend observed in the past data for last few decades.
5. Sea level rise 20. In the context of global climatic change scenario much effort has been taken to study the effect on sea level rise in recent years. Sri Lanka being an island with a heavily populated low-laying costal belt, the vulnerability to sea level rise is quite apparent. Recently few scientific efforts have been made to assess the level of treat imposed by this effect to Sri Lanka. According to them the sea level rise could result in significant land loss and inundation of costal water bodies /ecosystems as shown in the following table.
Sea level rise scenario/(m) Estimated land loss/(km2) Estimated area of inundation//(km
2)
0.30 6.0 41.00
1.00 11.5 91.25
Table No. 3: Projection of land loss and inundation due to sea level rise
21. However, assessing of the effects of sea level rise is needed regular and systematic monitoring over a significant number of years before making any conclusion.
6. Concentration of CO2 level 22. It is a known fact that the rising of CO2 concentration would be the main reason for global climatic change. Scientists have been estimated that the concentration of CO2 in the atmosphere has increased from 280ppm to 380ppm due to the industrialization of the society over last centuries. Besides its indirect impact through the climatic change (greenhouse effect), the rising of CO2 concentration directly impacts over life forms especially due to its vital role in photosynthetic process for biomass production.
7. Overall climatic change and its effects on hydropower generation in Sri Lanka
23. In view of the above facts, it is essential to discuss climatic change effects in Sri Lanka using analysis of past records, model projection and expert opinions. According to them all these sources are in consistent on the fact that air temperature is steadily rising all over the

6
country. However such definite opinion cannot be formed for the change of precipitation as past records and model projections do not consistent with each other. 24. Therefore experts’ opinions suggesting a condition in which rainfall would increase in areas where there is already high rainfall and rainfall would decrease progressively where there is less rainfall. This implies that the rainfall distribution in the country will become more alienated in future with excess rainfall in wet zone and further aggravate lack of rain in dry zone. Therefore it is logical to presume that the country would face more extreme events in future with such anticipated climatic changes.
25. Based on them, significant positive impact could be expected for hydropower generation in Sri Lanka as most of the hydropower generation facilities are located in upper watershed areas in wet zone, where substantial increase in rainfall is projected by the climatic model. As a result many hydro power generation facilities will have an overall gain from this effect. However rising atmospheric temperature can create slightly negative impact on hydropower generation as it increased evaporation and reduced discharge in streams.
26. The climatic effect and their impact on hydropower generation in Sri Lanka could be summarized in following manner.
Climate effect Physical impact Socio-economic impact
1.Change in precipitation Increased precipitation in upper watershed areas
Increase in hydropower generation potential.
2. Extreme events Droughts
Flood, cyclone and other disaster incidents
Reduction of hydropower generation potential. Damage to energy infrastructure.
3. Rise in atmospheric temperature
Reduced inflow into reservoirs Reduction of hydropower generation potential.
Table No. 4: Climatic impacts and their impact on Hydropower Generation
8. Future climatic change impact on Moragolla Hydropower Project 27. The Moragolla Hydropower Project is also proposed to locate in wet zone of Upper Mahaweli Catchment area which is considered to be a very high rainfall receiving region in the country. According to the HadCM3 climatic model projection and expert opinions the catchment area of Moragolla dam will receive more water in future due to the anticipated climatic change. 28. The average load factor of this power plant would be 37.2% according to the present climatic scenario. The following figure shows the expected monthly averaged energy generation and monthly average load factors as envisaged based on the present hydrological context.

7
Figure No. 5: Expected monthly average Energy generation and Plant Load factor
29. However, the climatic model projection has shown that the annual rainfall of the project area may increase by 5% in 2025 and will further increase by 6% in 2050 by the rainfall increase only during South West Monsoon (SWM). According to the project hydrological studies the average total flow volume, theoretically available at the basin would be 951.4MCM. However the average total flow volume expected from the basin at the dam is 706.4MCM. Therefore this implies that 74.25% of the flow in basin be available at the dam location. In view of this concept the annual expected flow volume will increase in following manner by the climatic model projection only by during SWM period.
Year Expected Volume/ (MCM)
% Increase of Energy
2013 706.4 Baseline
2025 735.7 4.1%
2050 777.5 10.1%
2100 898.7 27.2%
Table No. 6: Forecasted reservoir inflow
30. Therefore based on the above facts the flow duration curve will vary in following manner.
0
10
20
30
40
50
60
Jan Feb Mar Apr May Jun Jul Aug Sep Oct Nov Dec
Energy/(GWh) Load Factor/(%)

8
Figure No. 6: Forecasted flow duration curve at Moragolla Dam 31. By assuming that the flow gain by this forecasted phenomenon will be utilized effectively for the generation of power, the expected energy production by this project could be summarized as given the following table.
Year Expected Volume for power generation/
(MCM)
Energy / (GWh)
% Increase of Energy
2013 586.2 97.7 Baseline
2025 615.2 102.5 4.9%
2050 657.5 109.6 12.2%
2100 778.3 129.7 32.8%
Table No. 7: Forecasted reservoir inflow and Energy generation
32. The project catchment area receives SWM and IM rain in April, May, June, July, August September October and November months. Since there are no barriers for the flow of Mahaweli River upstream to the Moragolla dam, the river flow follows the rainfall pattern and hence the model projection rainfall could assumed to be proportionately increase the river flow during SWM and IM period. The following figure shows the behaviour of monthly average energy generation and monthly average load factor relevant to the climatic model projection rainfall.
0.00
20.00
40.00
60.00
80.00
100.00
120.00
140.00
0% 10% 20% 30% 40% 50% 60% 70% 80% 90% 100%
2013
2025
2050
2100
Percent of exceedance/(%)
Dis
char
ge/(
m3 /
s)

9
Figure No. 7: Projection of monthly average Energy generation and Plant Load factor by 2025
Figure No. 8: Projection of monthly average Energy generation and Plant Load factor by 2050
0
10
20
30
40
50
60
Energy/(GWh) Load Factor/(%)
0
10
20
30
40
50
60
70
1 2 3 4 5 6 7 8 9 10 11 12
Energy/(GWh) Load Factor/(%)
10
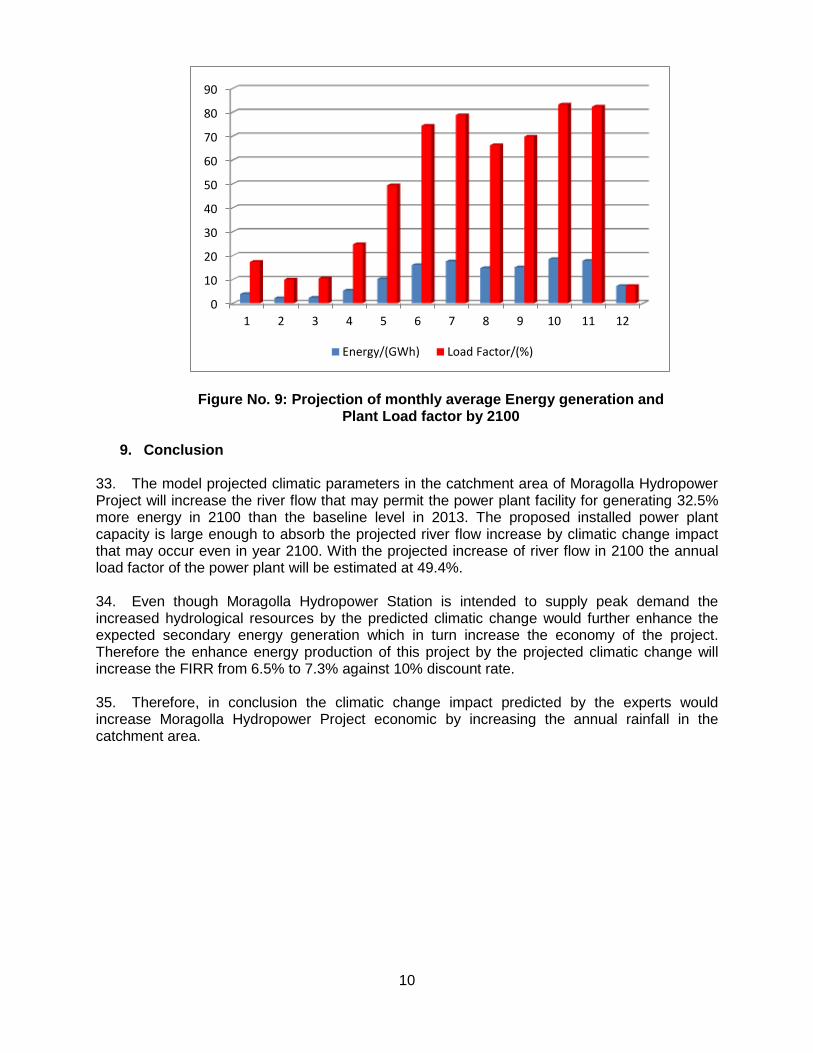
Figure No. 9: Projection of monthly average Energy generation and Plant Load factor by 2100
9. Conclusion
33. The model projected climatic parameters in the catchment area of Moragolla Hydropower Project will increase the river flow that may permit the power plant facility for generating 32.5% more energy in 2100 than the baseline level in 2013. The proposed installed power plant capacity is large enough to absorb the projected river flow increase by climatic change impact that may occur even in year 2100. With the projected increase of river flow in 2100 the annual load factor of the power plant will be estimated at 49.4%. 34. Even though Moragolla Hydropower Station is intended to supply peak demand the increased hydrological resources by the predicted climatic change would further enhance the expected secondary energy generation which in turn increase the economy of the project. Therefore the enhance energy production of this project by the projected climatic change will increase the FIRR from 6.5% to 7.3% against 10% discount rate.
35. Therefore, in conclusion the climatic change impact predicted by the experts would increase Moragolla Hydropower Project economic by increasing the annual rainfall in the catchment area.
0
10
20
30
40
50
60
70
80
90
1 2 3 4 5 6 7 8 9 10 11 12
Energy/(GWh) Load Factor/(%)

11
References
1. Climatic Change Risk Assessment, Dagachhu Hydropower Project, Green Power Development Project for Bhutan
2. Climatic Risk management in the Mahaweli River Basin, Sri Lanka
3. Estimating Global Climate change Impacts on hydropower Project, Policy research working paper 4344, Atsushi IIMI
4. Mainstreaming Climate Change for Sustainable Development in Sri Lanka: Towards a National Agenda for Action, Institute of policy Studies of Sri Lanka
5. Revised Feasibility Study Report, Moragolla Hydropower Project, and Nippon Koei in joint venture with Nippon Koei India Pvt. Ltd.