climate change vulnerability - pievc · building condition reporting will help ensure occupant and...
TRANSCRIPT


H O K A R C H I T E C T S
Climate Change VulnerabilityA Case Study of Public Buildings
Prepared forPublic Works and GovernmentServices Canada andEngineers Canada
June 5, 2008

Climate Change Vulnerability A Case Study of Public Buildings
June 5, 2008
Prepared for: Public Works and Government Services Canada and
Engineers Canada
Prepared By: HOK Canada

Engineering Vulnerability Assessment of the Main Statistics Canada Building to the Impacts of Climate Change
HOK Canada 2:128
Table of Contents
Executive Summary .......................................................................................................... 4�
Introduction....................................................................................................................... 9�
Project Background......................................................................................................... 9�
PIEVC Protocol .............................................................................................................. 9�
Study Scope and Time Frame....................................................................................... 10�
Project Team ................................................................................................................. 12�
Project Approach .......................................................................................................... 12�
Climate Change............................................................................................................... 14�
Current Climate............................................................................................................. 14�
Expected Changes......................................................................................................... 14�
Geography of the Study Area ....................................................................................... 15�
Climate Factors ............................................................................................................. 15�
Climate Change Assumptions....................................................................................... 15�
Summary of Climate Change Assumptions.................................................................. 19�
Buildings .......................................................................................................................... 21�
Rationale for Selecting Test Buildings ......................................................................... 21�
Overview of the Test Buildings and their Components................................................ 21�
Main Statistics Canada Building............................................................................... 22�
Jean Talon Building .................................................................................................. 23�
Brooke Claxton Building .......................................................................................... 25�
Applicable Jurisdictional Considerations, Codes and Standards.................................. 28�
Vulnerability Assessment ............................................................................................... 30�
Objectives and Methodology ........................................................................................ 30�
Findings ........................................................................................................................ 32�
Consultations and Building Tour Findings ............................................................... 32�
Main Statistics Canada Building............................................................................... 33�
Jean Talon Building .................................................................................................. 37�
Brooke Claxton Building .......................................................................................... 37�
Summary of Findings................................................................................................ 38�
Other Potential Changes............................................................................................ 38�
Data Sufficiency and Limitations ............................................................................. 39�
Conclusions & Recommendations ................................................................................. 41�
Applicability to other buildings .................................................................................... 44�
Recommendations to Improve the Protocol.................................................................. 45�
The Protocol.............................................................................................................. 45�
Climate Data/Scenarios............................................................................................. 47�
References........................................................................................................................ 49�
Acknowledgements ......................................................................................................... 51�
Appendix A – Climate Change in Canada, climate scenarios for the public
infrastructure vulnerability assessment: Ottawa Buildings case study ..................... 52�

Engineering Vulnerability Assessment of the Main Statistics Canada Building to the Impacts of Climate Change
HOK Canada 3:128
Appendix B – Completed Worksheets and Other Working Material ....................... 53�
Appendix C – Draft PIEVC Engineering Protocol for Climate Change
Infrastructure Vulnerability Assessment (Version 7.1) ............................................ 128�

Engineering Vulnerability Assessment of the Main Statistics Canada Building to the Impacts of Climate Change
HOK Canada 4:128
Executive Summary It is widely accepted that the emissions generated by human activity (e.g. the burning of
fossil fuels) are rapidly increasing the concentration of Greenhouse Gases (GHGs) in the
atmosphere. There is scientific consensus that these rising concentrations will increase
the average temperature of the Earth resulting in rising sea levels, shifts in climatic zones
and increased frequency and severity of weather extremes. To respond to these expected
changes, Engineers Canada established the Public Infrastructure Engineering
Vulnerability Committee (PIEVC) to oversee the planning and execution of a broad-
based National Engineering Assessment of the vulnerability of Canadian public
infrastructure to changing climatic conditions. The National Engineering Assessment will
evaluate the changes anticipated to the risks to Canadian public infrastructure posed by
climate change. Using a draft engineering protocol to assess the vulnerability of
infrastructure to potential future climatic changes, Engineers Canada has conducted a
pilot study and several case studies on different types of infrastructure, including roads,
stormwater and wastewater systems and water resource systems. This case study is the
last in this series and applies the draft protocol to assess the vulnerability of buildings to
climate change.
Public Works and Government Services Canada (PWGSC) is collaborating in this effort
and chairs the Buildings Experts Working Group (BEWG) that is part of PIEVC. To
complete the vulnerability assessment, PWGSC agreed to consider three public buildings
located on the Federal Government Campus of Tunney’s Pasture in Ottawa, Ontario.
Tunney’s Pasture is a 46-hectare Campus located approximately three kilometres west of
Downtown Ottawa and Parliament Hill. Within Tunney’s Pasture, the roads and servicing
infrastructure are owned and maintained by the federal government and connected to off-
site city owned services. The three test buildings selected for the case study are:
� Main Statistics Canada Building was built in 1952 and is 20 years into it’s 2nd
life
cycle phase and is of low rise masonry construction;
� Brooke Claxton Building was built in 1964 and is 10 years into it’s 2nd
life cycle
phase and is a high rise with first generation curtain wall construction; and
� Jean Talon Building was built in 1979 and is at the end of its 1st life cycle phase
and is a high rise of precast concrete panel construction.
All three test buildings are connected to the Campus’s Central Heating and Cooling Plant
that provides steam and chilled water for their heating and cooling. HOK Canada with
support from Nielsen Design Consulting Inc. conducted the vulnerability assessment of
the three test buildings according to the PIEVC Draft Engineering Protocol for Climate
Change Infrastructure Vulnerability Assessment. The project team received excellent
support from SNC-Lavalin-Profac, the building managers under contract with PWGSC.
SNC-Lavalin-Profac assisted in the assessment by providing building tours, review and
development of the vulnerability assessments and evidence of current and past building
performance and condition. In addition, detailed building condition reports were used to
understand the current state of repair and integrity of the key building components and
systems for all three buildings.

Engineering Vulnerability Assessment of the Main Statistics Canada Building to the Impacts of Climate Change
HOK Canada 5:128
The project team used climate change projections completed by Ouranos and other
research to determine the expected changes in the regional climate for two time horizons
of 2020 and 2050. The main expected changes in climate for these time horizons are:
� Increase in temperatures throughout the year;
� More precipitation in spring, winter and fall in the form of rain and snow;
� Less precipitation (rain) in June, July and August;
� Increase in rain on snow events;
� Increase in freeze-thaw events;
� Significantly shorter frost season where temperatures are below 0°C;
� Significantly less Heating Degree Days below 18°C; and
� Significantly more Cooling Degree Days above 18°C.
To understand the possible affects of these changes, the PIEVC Engineering Protocol was
used to identify and rank the vulnerability of building components and systems to climate
change. The assessment found that the highest priority considerations for the three
buildings due to climate change are:
• The walkways, parking areas, stairs and ramps are vulnerable due to increased
freeze-thaw cycles and higher temperatures. The accelerated deterioration of these
building components can pose potential risk to human health, safety, injury,
falling etc.
• Building envelops are vulnerable due to increased precipitation in fall, winter and
spring, increased temperatures in summer and increased freeze-thaw cycles.
Accelerated deterioration of the envelops will affect the structural integrity of the
buildings.
• The cooling systems may be vulnerable in terms of its adequacy of meeting
demand of increased spring, summer and fall temperatures. The chilled water
cooling system provided by the Central Heating and Cooling Plant and roof-top
units will see increased loads. Increased internal building temperatures can
directly affect occupant comfort and productivity while the increased cooling
loads could also pose significant cost increases to PWGSC.
• Finally, the reliability and provision of power (electricity) to the building may be
vulnerable due to increased temperatures in spring, summer and fall. These
increased temperatures will create increased electricity demand (for cooling)
throughout the region on Hydro Ottawa. The reliability and provision of
electricity is critical to the daily work and productivity of occupants and the
operation of the computer/LAN room.
This being said, the project team found that the current building management processes
can help ensure that many building components (e.g. stairs, walkways, ramps, windows,
doors) adversely affected by climate change (i.e. premature deterioration) will be
identified and subsequent remedial action taken to reduce or eliminate any specific
impacts. In other words, this management approach indirectly guards against climate
change vulnerabilities for several building components and systems. This is because

Engineering Vulnerability Assessment of the Main Statistics Canada Building to the Impacts of Climate Change
HOK Canada 6:128
Federal buildings are managed under a rigorous process that includes Asset Management
Plans, Building Condition Reports and Building Management Plans, to name a few.
From these high level findings, several recommendations were developed that address
these as well as the gaps in information and data identified during the project. These are
summarized below:
A. In the Main Statistics Canada building, the building envelop is high priority area
that warrants the research and application of a building envelop technology that
can mitigate freezing pipes in winter as well as manage the affects of increased
precipitation and potential moisture migration into the envelop due to climate
change.
B. The Brooke Claxton Building’s envelop will require the application of a
technology that will keep the interior warm and dry, without affecting its
structural integrity.
C. PWGSC should investigate and determine the optimum flat roof technology,
design options, mitigation strategies that will accommodate the potential effects
of increased freeze thaw and ice build-up.
D. A detailed engineering evaluation needs to be conducted on the anticipated
cooling loads due to climate change and the optimum solution for each building
on the Campus. Such an evaluation should assess the suitability of various
adaptive measures/technologies such as exterior shading devices, passive cooling
techniques, etc. It should also recognize potential changes/engineering options for
the building envelop to ensure systems are optimally sized for the existing and
projected loads.
E. A separate or integrated cooling load evaluation based on the “Campus as a
system of buildings” should be conducted for the Central Heating and Cooling
Plant. The evaluation/assessment should model and consider various
technologies/adaptive measures for the CHCP itself such as co-generation and
geothermal heating and cooling, the ability to meet or exceed the Government of
Canada’s objectives to reduce GHG emissions and Air Pollutants and potential
changes to the Ottawa River (used by the Plant for cooling) such as water
temperature, flow, height etc. that may be due to climate change.
F. PWGSC should begin working with the local electrical utility (e.g. Hydro Ottawa)
to study and plan for the cumulative effects on electricity loads, demand,
consumption, etc. during spring, summer and fall from all the buildings at the
Tunney’s Pasture Campus.
G. A detailed research study should be conducted that investigates the loads from
potential increases in precipitation on the site rain and storm water drains and
tunnels. This would address a data and information gap identified during the
assessment.
H. In conjunction to the above recommendation, PWGSC should consider and assess
how climate change will affect Federal Real Property that is in close proximity to
the Ottawa River, its watershed and flood plain.

Engineering Vulnerability Assessment of the Main Statistics Canada Building to the Impacts of Climate Change
HOK Canada 7:128
I. PWGSC should maintain current practices and budget for snow/ice clearing and
Building Condition Reporting will help ensure occupant and public safety for all
walkways, stairs, and parking areas.
While the Vulnerability Assessment focused on the three test buildings, the project team
believes that particular elements of the findings and recommendations can be applicable
to other buildings in the region, especially those of similar vintages and construction.
These are threefold:
• First, increased freeze-thaw cycles will likely have similar effects on buildings
and other types of infrastructure in the region. Landlords and owners would be
prudent to ensure close monitoring of site drainage, roof systems and building
envelops and components that may be affected by these expected changes.
• Second, increases in precipitation in the form of rain particularly in fall, winter
and spring will put increased loads on building envelops and flat roofs in the
region. Again, landlords and owners should pay particular attention to the state of
repair of these systems.
• Third – and perhaps most important from a climate change perspective – the
increases in spring, summer and fall temperatures in the region will put higher
demands on cooling systems and utilities during these seasons. The projet team
believes strategies will need to be implemented at various levels in order to
manage the demand and ensure that increases in electricity consumption do not
result in increased GHG emissions – resulting in further climate change.
Finally, the project team was asked by PIEVC and PWGSC to evaluate the overall
Protocol and the climate change data provided by Ouranos and their applicability to the
building sector. The Team found that improvements can be made to aid applicability and
ease of use of the Protocol and climate change data in future Assessments of buildings.
The following suggestions should be considered by PIEVC prior to undertaking the
broader National Engineering Assessment:
• The Project Team believes there is potential to align the terminology in the
Protocol to that used by climate and weather specialists as well as engineers and
architects (e.g. National Building Code, CSA, ISO and ASHRAE). For example,
the protocol uses such terms as “climate change factor” and “climate change
parameter” while Environment Canada and Ouranos refer to changes in “climatic
indices” (e.g. change in average annual maximum temperature) that is expected in
the future. The Project Team recognizes that for future assessments of buildings,
specific climatic indices that relate to such things moisture infiltration, freeze-
thaw cycles, temperature and humidity extremes could become important to
ensure consistency in application of the overall Assessment and Protocol.
• Readability and ease of use of the Protocol needs to be considered. For example,
repetition of terms and data fields in the Protocol and supporting Worksheets were
also found to create confusion. Elimination of repeated terms, including
illustrations, diagrams and examples, and consistency in terminology are other
areas that will ease of use and readability.

Engineering Vulnerability Assessment of the Main Statistics Canada Building to the Impacts of Climate Change
HOK Canada 8:128
• Finally, there is potential to improve the utility or presentation of the climate
change indices and scenarios. Engineers and architects could benefit from a
layperson’s indication of what climate would be like in 10, 20, 50 year time
horizon. This would allow research and comparison of building codes and best
design practices of these regions to understand what may or may not work in
terms of adaptation or mitigation techniques and technologies.

Engineering Vulnerability Assessment of the Main Statistics Canada Building to the Impacts of Climate Change
HOK Canada 9:128
Introduction
Project Background
It is widely accepted that the emissions generated by human activity (e.g. the burning of
fossil fuels) are rapidly increasing the concentration of Greenhouse Gases (GHGs) in the
atmosphere. There is scientific consensus that these rising concentrations will increase
the average temperature of the Earth resulting in rising sea levels, shifts in climatic zones
and increased frequency and severity of weather extremes.
Baseline historical climatic data is used in engineering and architecture professions to
design buildings and other infrastructure to suit their regional climate. However, under a
changing climate, this data may not be appropriate and could result in buildings that do
not have the “resiliency” to accommodate new climatic norms or weather extremes.
Furthermore, these factors may create vulnerabilities in existing buildings as well.
Engineers Canada established the Public Infrastructure Engineering Vulnerability
Committee (PIEVC) to oversee the planning and execution of a broad-based National
Engineering Assessment of the vulnerability of Canadian public infrastructure to
changing climatic conditions. This is a priority for the engineering profession since the
uncertainty caused by changing climatic conditions may be undermining the
meteorological data used to design infrastructure.
The National Engineering Assessment will evaluate the changes anticipated to the risks to
Canadian public infrastructure posed by climate change. In order to determine how best
to tackle this large and complex assessment, the PIEVC completed a pilot study using a
draft engineering protocol to assess the vulnerability of a water supply system to the
impacts of future potential climate changes. Following this pilot, several case studies
using the methodologies and protocols were conducted on other types of infrastructure,
including roads, stormwater and wastewater systems and water resource systems. This
case study is the last in this series and applies the draft engineering protocol to assess the
vulnerability of buildings to climate change.
Public Works and Government Services Canada (PWGSC) is collaborating in this effort
and chairs the Buildings Experts Working Group (BEWG) that is part of PIEVC. PIEVC
and the BEWG believe that there are likely common impacts of climate change on
buildings across Canada that will increase their vulnerability and will require remedial
action. In addition, members of the BEWG have been involved in developing the draft
PIEVC Engineering Protocol used in the pilot and case studies.
PIEVC Protocol
The PIEVC Engineering Protocol for Climate Change Infrastructure Vulnerability
Assessment (hereafter the Protocol) is a procedure to analyze specific climatic and
infrastructure information to understand the potential interactions between a changing
climate and the components of the infrastructure. The Protocol outlines a series of steps
for defining, analyzing, evaluating and prioritizing both infrastructure information and
climate information to understand the potential vulnerability of the infrastructure to

Engineering Vulnerability Assessment of the Main Statistics Canada Building to the Impacts of Climate Change
HOK Canada 10:128
climate change. The outcomes of applying the Protocol are intended to inform decision-
making about the infrastructure’s operation, maintenance, planning and development –
facilitating the effective management of a changing climate on the infrastructure.
The key steps of the protocol are:
1. Project Definition
2. Data Gathering and Sufficiency
3. Vulnerability Assessment (Qualitative Assessment)
4. Vulnerability Assessment (Quantitative Assessment)
5. Recommendations
A copy of the full draft Protocol as used in this case study is provided in Appendix C.
Study Scope and Time Frame
To complete the vulnerability assessment, PWGSC agreed to consider three buildings
located on the Tunney’s Pasture campus in Ottawa. Tunney’s Pasture is a 46-hectare
Federal Government Campus located in the City of Ottawa, Ontario. The Campus is
approximately three kilometres west of Downtown Ottawa and Parliament Hill. The
Campus is bounded by the Ottawa River Parkway (and the Ottawa River) to the north,
Parkdale Avenue to the east, Scott Street to the south and Northwestern Avenue on the
west. The buildings on the campus offer excellent views of the Ottawa River and
Gatineau Hills, as well as convenient access to the Ottawa River Parkway. Within
Tunney’s Pasture, the roads and servicing infrastructure are owned and maintained by the
federal government and connected to off-site city owned services. The figure below
provides an illustration of the overall Campus layout and indicates the location of the
three test buildings.
Figure 1 Site plan of Tunney's Pasture Campus.

Engineering Vulnerability Assessment of the Main Statistics Canada Building to the Impacts of Climate Change
HOK Canada 11:128
The three test buildings selected for the Project are:
� Main Statistics Canada Building, 150 Promenade Tunney's Pasture Driveway
� Jean Talon Building, 170 Promenade Tunney's Pasture Driveway
� Brooke Claxton Building, 70 Promenade Columbine Driveway
The boundary and scope delineation for this project was very important given that the
campus has a Central Heating and Cooling Plant (CHCP) to deliver steam and chilled
water. For this reason the project boundary is limited to the near vicinity of the building
and did not include the heating plant. The Project Team, however, recognizes that the
Central Heating and Cooling Plant is integral element in the daily operation of these
buildings and the findings in this assessment should be recognized in this context.

Engineering Vulnerability Assessment of the Main Statistics Canada Building to the Impacts of Climate Change
HOK Canada 12:128
The time frame selected for this study is 2020 and 2050 because they align with the
projected design life of the buildings in this study. Further future time horizons such as
2080 (as provided by Ouranos in the climate change assumptions) was considered outside
the expected life cycle of any of the buildings tested. Furthermore the uncertainty of the
use, overall long term plan and future investments for Tunney’s Pasture Campus by the
Federal Government did not warrant consideration of time horizons past 2050.
Project Team
This project is a joint initiative between Engineers Canada (through PIEVC) and Public
Works and Government Services Canada.
HOK Architects is the lead consultant with support from Nielsen Design Consulting Inc.
The project team acknowledges the excellent support of SNC-Lavalin-Profac staff who
participated in interviews, led tours and a workshop.
The Project Team is as follows:
Organization Role Individuals
PIEVC National Engineering Assessment Funding Partner
David Lapp
Public Works and Government Services Canada
Building Owner Funding Partner
Brian Kyle Ed Morofsky Ed Kutrowski
HOK Canada Prime Consultant Vince Catalli Greg Allen
Nielsen Design Consulting Sub-Consultant Ralf Nielsen
SNC-Lavalin-Profac Building Manager Susan Kehoe Shelly LeBlanc Peter Morris Michael Murawnik Brian Drier Brent Dagg
Ouranos Climate Change Data Caroline Larrivee Travis Logan Diane Chaumont
Project Approach
The overall approach of the Team to the project was as follows:
1. Determination of test buildings for assessment;
2. Building tours and facility management meetings;
3. Review of Building Condition Reports and Investment Plans;
4. Building infrastructure component identification;
5. Identification of relevant climate change factors;
Engineering Vulnerability Assessment of the Main Statistics Canada Building to the Impacts of Climate Change
HOK Canada 13:128
6. Vulnerability assessment using the PIEVC Engineering Protocol; and
7. Development of recommendations and report development.
The PIEVC Engineering Protocol for Climate Change Infrastructure Vulnerability
Assessment was applied by HOK on the three test buildings located on the Tunney’s
Pasture – Federal Government Campus in Ottawa and included: the Brooke Claxton, Jean
Talon and Main Statistics Canada Building. The Project Team applied the Protocol first
to the Main Statistics Canada Building as it was the oldest building of the representative
sample used for this case study. The protocol was then applied to the other two buildings,
Brooke Claxton and Jean Talon. However, during this process the project team found that
the majority of data and analysis required for Steps 1, 2 duplicated the work already done
for the Main Statistics Canada Building. It also found that the most critical step of the
Protocol was the climate change vulnerability assessment (Step 3) and the development
of recommendations (Step 5). Thus, for the Brooke Claxton and Jean Talon buildings, the
team used only the critical steps of the PIEVC process while avoiding duplication of
effort in other steps of the Protocol.
It is important to note that for all buildings the project approach included review of the
Building Condition Reports; interviewing the Property Managers and Maintenance Team
Leader; touring the facility; conducting the Vulnerability Assessment; analyzing the
assessment and developing conclusions and recommendations.

Engineering Vulnerability Assessment of the Main Statistics Canada Building to the Impacts of Climate Change
HOK Canada 14:128
Climate Change
Current Climate
Ottawa has a humid continental climate with a range of temperatures from a average
daily maximum of 26.3 °C in July to average daily minimums of -16.4 °C in January.
Snow and ice are dominant during the winter season. Ottawa receives on average 714
mm of rain and 208 mm (snow water equivalent) of snowfall annually. The winter and
snow season is quite variable; in an average winter, a lasting snow cover is on the ground
from mid-December until early April. Freeze-thaw cycles occur in the winter with some
days well above freezing followed by nights well below 0 °C. Freezing rain and high
wind chills are also common in the winter.
Summers are fairly warm and humid in Ottawa, although they are typically short in
length. The average July maximum temperature is 26.3 °C although temperatures of 30
°C or higher occur frequently. Cool northerly air can drop humidity levels. Ottawa
annually averages 41 days with humidex readings above 30 °C. Extreme summer weather
events such as tornadoes, major flash floods, extreme heat waves, severe hail and
remnant effects from hurricanes are rare, but all have occurred in the region.
Spring and fall are again variable with hot days above 30 °C occurring as early as March
or as late as October. Although unusual, snow has been seen into May and early in
October. There are about 2,060 hours of average sunshine annually (47% of possible).
Expected Changes
The Fourth Assessment Report on the Physical Science Basis of Climate Change released
by the Intergovernmental Panel on Climate Change (IPCC) in 2007 describes how
climate change is expected to evolve differently globally and regionally. The changes in
climate conditions in Canada are expected to be different across its regions. In general
however, the expected climatic changes in Canada are as follows1:
� Nearly all of Canada is expecting increases in temperature.
� More moisture from storm tracks in Northern regions.
� The coastal regions are expecting rising sea levels.
� The frequency and longevity of heat waves is expected to increase.
� The frequency and intensity of heavy precipitation events and thunderstorms is
expected to increase.
� Winter snowfalls will likely increase due to more atmospheric moisture
particularly in the lee of the Great Lakes.
� Permafrost will likely be severely impacted by climate change particularly in
southern portions of the semi-discontinuous and discontinuous permafrost zones
where permafrost might outright disappear.
1 Auld, H. and D. MacIver, Changing weather patterns, uncertainty and infrastructure risks: Emerging
adaptation requirements. 2007, Adaptation and Impacts Research Division, Environment Canada: Toronto.

Engineering Vulnerability Assessment of the Main Statistics Canada Building to the Impacts of Climate Change
HOK Canada 15:128
Variation in these changes across Canada’s regions is also expected and is primarily due
to such factors as proximity to oceans, topographical features and patterns of atmospheric
processes.
Geography of the Study Area
As mentioned above, Tunney’s Pasture is situated in the western sector of Ottawa
approximately 3km west-south-west of Downtown. The campus is bounded on the north
by the Ottawa River Parkway and the Ottawa River whose flow is largely dominated by
snowmelt and rainfall. The southern most point of the Gatineau Hills (100-450m above
sea level) are approximately 3km North of the Campus, across the Ottawa River. The
campus, and the City of Ottawa are situated in the Ottawa River Valley (75-100m above
sea level) that stretches to the northwest and east of the city, eventually flowing to meet
the St. Lawrence River just west of Montreal.
Climate Factors
Only the climate data that is relevant to the design, development and ongoing operation
of the buildings are considered in this study. Based on the consideration of the buildings
and the baseline climate data, the following climate factors were deemed relevant to the
study:
� Temperature – average monthly and annual max and min
� Rain – average total rain
� Rain - frequency of 6h and 1 day rain events
� Wetspell conditions
� Dryspell/drought conditions
� Snow – average total snow
� Rain on Snow events
� Frost Season Length
� Heating Degree Days
� Cooling Degree Days
� Wind speed
� Humidity
It is noted that this list includes both extreme weather events and climatic conditions.
Climate Change Assumptions
A data request was made to Ouranos in the early part of the study to determine the
baseline values and projected change in climate values for the time frames of the study.
Ouranos provided both historical norms from Environment Canada for the study area and
projections based on two climate change models. The modelling parameters and
conditions used by Ouranos are:
� Geographic area of 45 km around the study area was used to include 5
Environment Canada reporting stations (temp, rain, snow).
� Minimum data series length of 20 years to calculate baseline norms.

Engineering Vulnerability Assessment of the Main Statistics Canada Building to the Impacts of Climate Change
HOK Canada 16:128
� There was only one Environment Canada station that recorded wind over the 20
year period.
� Modelling included projections for the 2020, 2050, 2080 forecast horizons
The following table provides a summary of the projected changes in climatic values for
the area in which the three buildings in this study are located and the 2020 and 2050 time
horizons. The full Ouranos report with detailed seasonal data and projections for the 2080
time horizon as well is provided in Appendix A.
Table 1 Summary of expected change in climatic values for the study area.
Climate Factor and Baseline
Expected Change Comment and Summary
Temperature
Temperature – monthly avg. tmax Observed baseline (°C): See Apppendix A for detailed monthly baselines
2020: 0.5 to 3 degrees warmer 2050: 2.3 – 4.4 degrees warmer
Varies by month, but overall average monthly maximum temperatures expected to be higher.
Temperature – Monthly avg. tmin Observed baseline (°C): See Appendix A for detailed monthly baselines
2020: 1.0 – 3.7 degrees warmer 2050: 2.4 – 5.8 degrees warmer
Varies by month, but generally, average monthly minimum temperatures expected to be higher.
Temperature – annual max and min Observed baseline (°C): Annual max: 33.43 Annual min: -32.24
Annual Max: 2020: 1.67 – 2.33 degrees warmer 2050: 3.55 – 4.12 degrees warmer Annual Min: 2020: 2.14 - 2.30 degrees warmer 2050: 5.01 – 5.58 degrees warmer
Generally, annual minimum and maximums expected to be higher.
Rain
Rain – Avg. total rain Observed baseline (mm): 713.98
Annual: 2020: 6-9% increase 2050: 14-18% increase
Fall, winter and spring rain fall totals will increase. Summer (June, July, August) expected to be drier.
Rain – dry spells/wet spells Observed baseline (days): Avg. max dryspell: 8.19 Avg. max wetspell: 2.81
Avg. Max Dryspell: 2020: inconclusive 2050: 0.13 to 1.18 days shorter (2-15%) Avg. Max Wetspell 2020: 0.09 to 0.12 days shorter (3-4%) 2050: inconclusive
By 2050, dryspells will be shorter. Wetspells expected to be minimally shorter by 2020. Other time horizons are inconclusive.

Engineering Vulnerability Assessment of the Main Statistics Canada Building to the Impacts of Climate Change
HOK Canada 17:128
Climate Factor and Baseline
Expected Change Comment and Summary
Rain – Avg. Max rain Observed baseline (mm) 1 day period: 46.66
1 day period: 2020: 2-8% increase 2050: 3-14% increase
In general, there will be an increase in 1 day period rain amounts. Similar increases are expected for 2 and 5 day period amounts (See Appendix A).
Rain – 6h frequency Observed baseline (frequency): 5mm cutoff: 0.023
5mm cutoff: 2020: 6-10% increase 2050: 19-23% increase
Increases are expected in the frequency of 6h rain events, however the baseline frequency is very low and therefore any change will not be very noticeable.
Rain – 1 day frequency Observed baseline (frequency): 5mm cutoff: 0.12
5mm cutoff: 2020: 6-7% increase 2050: 15-16% increase 2080: 20-23% increase
Increases are expected in the frequency of 1 day rain events. Similar increases are seen for 10 and 20 mm cutoff values (see Appendix A).
Rain – Simple Daily intensity index Observed baseline (mm/day): 8.42
2020: 2-4% increase 2050: 6-9% increase
Increases are expected in rain intensity for both time horizons.

Engineering Vulnerability Assessment of the Main Statistics Canada Building to the Impacts of Climate Change
HOK Canada 18:128
Snow
Snow – average total snow Observed baseline (Snow-water-equivalent in mm): Annual: 208.69
Annual: 2020: 10-11% decrease 2050: 16-22% decrease
There are expected to be decreases in the overall amount of snow. Largest decreases will occur in the fall.
Snow – annual max snow Observed baseline (mm): 1 day period: 21.21
1 day period: 2020: inconclusive 2050: 0-2% increase
No noticeable changes are expected in annual maximum snow in 1 day periods.
Snow – 1 day frequency Observed frequency: 5mm SWE cutoff: 0.038
5mm SWE cutoff: 2020: 7-21% decrease 2050: 17-27% decrease
Decreases are expected in the frequency of 1-day snow events, however the baseline frequency is very low and therefore any change will not be very noticeable.
Snow – simple daily intensity index Observed baseline (mm/day): 5.39
2020: 0-1% decrease 2050: inconclusive
No noticeable changes are expected in daily intensity of snow.
Snow – Rain on Snow events Observed baseline (frequency): 5mm cutoff: 0.015
5mm rain cutoff: 2020: 8% increase 2050: 11-23% increase
Increases are expected in rain on snow events. However the baseline frequency low and therefore any change may not be noticeable. Similar increases are seen for 10 mm cutoff values (see Appendix A).
Wind
Wind – Monthly avg wind6h Observed baseline: see Appendix A
Generally projected change varies between a decrease of 9% to an increase of 11% in observed wind speed in km/h for avg. 6h period. See Appendix A for details
Varies by month and time horizon. Generally windier winters, calmer summers. However, this is inconclusive as the models are based on only one station’s historical wind data.
Wind – Avg. annual max wind6h Observed baseline: 48.03 km/h
2020: inconclusive 2050: 1-2% decrease
Small decreases in average annual maximum 6h wind events speeds.

Engineering Vulnerability Assessment of the Main Statistics Canada Building to the Impacts of Climate Change
HOK Canada 19:128
Frost, Freeze-thaw
Frost Season Length – days Observed baseline: 125.14 days
2020: 16-24 days less 2050: 28-38 days less
Significant decreases in the frost season length.
Freeze Thaw Events – frequency Observed baseline: 0.21 frequency
2020: 2-6 % decrease 2050: 5-8% decrease Historical trend indicates increase in freeze-thaw events between December and March.
2
The models and historical trend contradict each other. To err on the side of caution, an increase in the number of freeze-thaw events was assumed in the assessment.
Heating, Cooling and Humidity
Heating Degree Days – Observed baseline: 4376.73 HDD
2020: 567-810 days less 2050: 1178-1287 days less
Significant decreases in heating degree days. This corresponds with frost season length decreases.
Cooling Degree Days: Observed baseline: 234 CDD
2020: 95-121 days more 2050: 216 days more
Significant increases in cooling degree days. This corresponds with frost season length decreases.
Humidity: Observed baseline: see Appendix A
2020: 0-7% increase during fall, winter and spring, 0-1% decrease in summer 2050: 0-7% increase in fall, winter, spring and 0-2% decrease in summer
Slightly more humid in fall, winter and spring and slightly drier conditions in summer. This corresponds to the general increases expected in precipitation.
Summary of Climate Change Assumptions
Based on the climate change projections completed by Ouranos and other research for
this project, the main regional affects in the Ottawa region are likely to be as follows:
� Increase in temperatures throughout the year.
� More precipitation in spring, winter and fall in the form of rain and snow.
� Less precipitation (rain) in June, July and August.
� Increase in rain on snow events.
� Increase in freeze-thaw events.
� Significantly shorter frost season where temperatures are below 0°C.
� Significantly less Heating Degree Days below 18°C.
� Significantly more Cooling Degree Days above 18°C
2 Heather Auld, personal communication with Vince Catalli and Environmental Canada historical data for
Ottawa, CDA, Number of Days in Dec-Mar with Max >0ºC and Min<0ºC (1940-2004).

Engineering Vulnerability Assessment of the Main Statistics Canada Building to the Impacts of Climate Change
HOK Canada 20:128
The above assumptions, detailed climate change information and expected changes in
specific climate factors were used by the Project Team throughout the Vulnerability
Assessment of the three test buildings.

Engineering Vulnerability Assessment of the Main Statistics Canada Building to the Impacts of Climate Change
HOK Canada 21:128
Buildings
Rationale for Selecting Test Buildings
As mentioned above, three buildings in the Tunney’s Pasture Campus have been selected
for Assessment using the PIVEC Engineering Protocol for Climate Change Infrastructure
Vulnerability Assessment. The project team selected these test buildings (over the other
possible buildings on the Campus) together with PWGSC and based on information
provided by SNC-Lavalin Profac. The following provides the general rationale for
selecting these buildings:
� They comprise a range of building years, for example:
o Main Statistics Canada Building was built in 1952 and is 20 years into it’s
2nd
life cycle phase;
o Brooke Claxton Building was built in 1964 and is 10 years into it’s 2nd
life
cycle phase; and
o Jean Talon Building was built in 1979 and is at the end of its 1st life cycle
phase.
� They exhibit varying types of construction that includes both low rise and high
rise office towers. Specifically, the buildings exhibit the following:
o Main Statistics Canada Building uses low rise masonry construction;
o Brooke Claxton Building uses high rise first generation curtain wall
construction; and
o Jean Talon Building uses high rise precast concrete panel construction
� They exhibit a range of occupant populations:
o 814 occupants for Brooke Claxton; and
o 1700 each for Jean Talon and Main Statistics Canada Building.
� There are “as built” construction drawings currently available for the Jean Talon
and Main Statistics Canada Building and drawings related to subsequent
renovations for all buildings.
� They exhibit a mix of general building form and site positioning. The Main
Statistics and Jean Talon have a campus/cluster type layout generally oriented
North-South, while the Brooke Claxton Building is an isolated tower at the
northern edge of the Campus.
Overview of the Test Buildings and their Components
This section of the case study provides a general overview of the current state of each of
the buildings tested. The insights and understanding of the buildings was obtained by the
project team through several building tours and meetings with the SNC-Lavalin Profac
managers. A desktop review of the latest Building Condition Reports and Investment
Plans followed by discussions with SNC-Lavalin Profac and PWGSC experts assisted the
team in identifying an initial set of building components that may be vulnerable to
climate change. This section also provide a general indication of key inputs the team used
in the first steps of applying the PIEVC Engineering Protocol.

Engineering Vulnerability Assessment of the Main Statistics Canada Building to the Impacts of Climate Change
HOK Canada 22:128
Main Statistics Canada Building
The Main Stats Building comprises 39,445.9 m2 useable floor area and was built in 1952.
In 2005 the Federal Heritage Buildings Review Office designated the building as a
heritage building. It is a two-storey building with a full basement and partial third and
fourth floors. Overall it is considered to be in “average” condition and is reasonably
functional. It has received periodic upgrades and refurbishments over the years and in
recent years various tenant and common areas have been upgraded to meet current
accommodation standards.
The building is occupied primarily by Statistics Canada and is part of a larger node for
that tenant which includes the adjacent (and internally linked) Jean Talon (to the North)
and R.H. Coats (to the South) buildings. The building provides space for roughly 1,700
full-time equivalent civil service employees and a dedicated computer / LAN room
(fourth floor). Other building occupants include Health Canada, SNC-Lavalin Profac and
PWGSC. The building serves many functions that include office space, some storage,
class/training rooms, a daycare centre, cafeteria and gym.
Building Envelope:
The exterior brick masonry with terracotta backup walls was constructed without proper
drainage. Thus, water or moisture can become trapped within the wall system. According
to the original construction documents, the wall insulation consists of 50 mm of cork.
Property management has indicated that during the various repairs on the exterior wall,
they have found little evidence of the cork. During cold weather, the lack of sufficient
insulation affects both the comfort level for the occupants and the performance of the
mechanical hot water radiators located on the perimeter walls. With only minimum
insulation between the radiator and the exterior brick, the supply/return piping can freeze.
Granite stone surrounds the window and the main entrances and is predominant on the
eight end wings of the building. There are few random cracks in the stone pieces and
some of the windowsills have spalled on the exterior surface. Mortar joints are in varying
condition with some cracked and some being replaced with sealant that has failed in
many areas and requires replacement. The windows, main and secondary entrance doors
and curtainwall assembly above the entrance doors were replaced in 1993-1994 and are
in fair to good condition.
Based on the above building envelope information, the exterior wall construction is
considered thermally deficient and requires comprehensive upgrading, including new air
barrier, insulation and retrofit of the heating system. Assessment of the window systems
(i.e. window sills) should also be considered in the retrofit.
There are 16 different roof areas associated with the building. They vary in age from 1 to
over 20 years with their condition varying from excellent to fair. Due to their varying
age, replacement will be staggered throughout the next 30 years. There have been no
recent reports of moisture infiltration.

Engineering Vulnerability Assessment of the Main Statistics Canada Building to the Impacts of Climate Change
HOK Canada 23:128
Structural:
The structural system is generally in average condition with no apparent sign of
significant problems. Recently, seismic screening has been performed with the intent to
identify buildings where “reasonable doubt” as to the seismic adequacy exists. Base on
the screening the Structural Index is 17.15 and Non-structural Index is 9.0 with the
Seismic Priority Index being 26.15. As such, the SPI indicates a high priority and further
investigation is warranted at this time.
Exterior Elements:
Although we could not physically inspect the exterior site conditions (due to snow cover
at time of assessment), based on the building condition report the site components are
generally in fair condition. However, some of the grass covered areas adjacent to the
building have a reverse slope towards the building foundation walls and are known to
require prompt attention. The settlement around foundations walls has caused the
reversed slopes around the building. Other exterior elements of note that need to be
examined as part of the assessment are as follows:
� Concrete and masonry walls, including retaining walls
� Stairs (both in metal and concrete)
� Plazas, decks and loading bays
� Window and stair wells
� Manhole and other access point to site services and mechanical systems
� Exterior mechanical units (i.e. generators, etc.)
� Areas of storm water discharge being too close to the building
� Walkways and areas (bituminous, concrete and pavers)
� Parking lots
� Some foundation walls have areas of water infiltration
Mechanical Systems:
The central air handling systems have been replaced between 1997 and 2007 with only a
few systems that have not been replaced yet. Some of the computer room cooling units
were replaced in 2006. Washroom fixtures and piping have been replaced since 2001, and
is ongoing. The majority of the chilled water piping has been replaced in 1995.
Electrical Systems:
The building voltage was converted to 347/600V 3ph 4W in the late 90’s and the lighting
is being converted to 347V (about 60% completed) the exit lighting and emergency
lighting has been reviewed and upgraded in 2006. One of the original generators was
removed in the generator room, and a new 1250 KW generator set added adjacent to the
building in the courtyard, for the fourth floor data centre.
Jean Talon Building
The Jean Talon Building is also located on the Tunney’s Pasture campus at 170
Promenade Tunney's Pasture Driveway and is connected (internally) to both the Main
Statistics Canada Building. The structure was built in 1979 and consists of a 13-storey
office tower with a Mechanical penthouse on the 14th level. Statistics Canada is the sole

Engineering Vulnerability Assessment of the Main Statistics Canada Building to the Impacts of Climate Change
HOK Canada 24:128
tenant of the Jean Talon Building with a total useable area of the building of 60,907 m2
and accommodating roughly 1,700 full time employees.
Building Envelope:
The roofs are comprised of inverted membrane assemblies, with waterproofing
completely hidden by insulation and ballast. The existing roof has a service life of
approximately 25 years with a replacement required in 2019. With the exception of the
sloped glazing, the window systems are the original and should be scheduled for
complete replacement in 2029. Window coverings throughout the building are either
horizontal metal slat blinds or roller sunshades. The primary entrance doors have a
remaining life expectancy of just over twenty years. Service doors are in good condition
with replacement required between 15 to 25 years. The cladding of the building is a
precast concrete curtain-wall. Localized bowing was evident along with failed joint
sealant.
Exterior Elements:
Site components are generally in fair condition. Some of the areas adjacent to the
building have a reverse slope towards the building foundation walls and require prompt
attention.
Structural:
The structural system is generally in good condition with no apparent sign of significant
problems. According to the drawings provided, all footings bear on limestone bedrock
having allowable bearing pressure capacity as follows: Columns – 120 ksf; Elevator
Core, Stairs, Elevator Pits - 50 ksf ; Perimeter Wall, Retaining Walls – 15 ksf.
The drawings available for review did not indicate design loading of the concrete slabs.
Therefore maximum floor loading is not known. The building has been in service for 28
years with no reporting or evidence of problems with respect to floor or roof loading.
Recently, seismic screening has been performed with the intent to identify buildings
where “reasonable doubt” as to the seismic adequacy exists. Base on the screening the
Structural Index is 3.04 and Non-structural Index is 1.2 with the Seismic Priority Index
being 4.24. As such, the SPI indicates a low priority and further investigation is not
warranted at this time.
Mechanical:
Most of the mechanical equipment and materials are original from 1976, thus making
them 32 years old at the time of this report. Generally, setpoints, flow rates, temperatures
and capacities have all changed since the building was originally designed. Thus all
replacement equipment might be resized to a different capacity from original.
The building is equipped with sprinklers throughout. The sprinkler and standpipe systems
are combined above grade but separate below grade.
Mechanical equipment is being run to Treasury Board Secretariat standards. Based on
this requirement a random sample was performed on the 6th
floor with supply air from all
systems at about 21,236 l/sec (45,000 cfm) and the approximate general airflow rate at

Engineering Vulnerability Assessment of the Main Statistics Canada Building to the Impacts of Climate Change
HOK Canada 25:128
about 5.87l/sec per m2 (1.15 cfm/ft
2). These flow rates are conventional and do not
indicate an insufficient overall airflow rate. Carbon dioxide levels are monitored with
sensors that control outdoor air dampers through the Building Automation System (BAS)
so that carbon dioxide levels don’t reach unacceptable levels and that outdoor air is
maintained to all floors.
Electrical:
The electrical systems in the building are in good condition. The base building lighting
fixtures have been upgraded to T-8 fluorescent fixtures. The emergency diesel generator
is regularly tested and in good condition. Variable speed drives for the air-handling units
will have to be replaced with new drives. The fire alarm and voice communication
system is relatively new and should continue to provide reliable service for many years to
come.
Brooke Claxton Building
The Brooke Claxton Building is a 19-storey office tower, including a single level podium
and two mechanical penthouse levels. Constructed in 1964, the building serves as the
Headquarters for Health Canada with the upper two floors housing the Minister, Deputy
Minister and other executive offices. In total, the building comprises a rentable floor area
of approximately 21,089.4 m2 and accommodates approximately 815 full time
employees.
The main office floors (2-16) each have a useable floor area of 1,045 m2 and are
primarily dedicated to office space with a central service core. The basement podium (all
on one level) is substantially larger than the typical floor plate for the office tower having
5,624.2 m2. Most of the podium is finished and dedicated into office space. It also houses
a cafeteria, fitness centre, print shop, Health Canada Crisis Centre and the main
boardroom facility. An aboriginal ‘wellness lodge’ is also located in this area. The
podium is at grade on the north end of the site and has exterior and dock loading
facilities, as well as a small amount of storage space. The south end of the site is oriented
toward pedestrian entry into the office building.
It is in good condition, having undergone a major modernization program between 1990
and 1995 with new interior finishes and mechanical / electrical systems.
In 2004, the Brooke Claxton Building was declared a “Classified” Federal Heritage
Building because of its historical associations, and its architectural and environmental
values. The designation is confined to the footprint of the building.
Building Envelope:
The office tower is clad with a combination of precast concrete panels finished with a
rough slate green finish and smooth finished light granite column covers none of which
exhibit evidence of generalized distress or movement. There is some minor deterioration
of the granite, with one soffit piece previously fallen. Brick walls are used around the
mechanical areas on the roof top. Regular maintenance of the brick will help to maintain
these components and will also reduce leakage into the building by installing through-

Engineering Vulnerability Assessment of the Main Statistics Canada Building to the Impacts of Climate Change
HOK Canada 26:128
wall flashing. The mechanical area wells are visible only from the roof level or from
within the area wells. These wells should (recommended in the Building Condition
Report) be covered with a roof to reduce further deterioration while potentially gaining
use of the area.
The windows are in fair condition. The windows are double glazed clear anodized
aluminium windows with fixed uppers and formerly operable awning style lower lights
that have been fixed shut and hardware removed. The basement level windows are of
similar construction. The glazing system has a remaining service life of less than 10 years
and as such requires ongoing maintenance. There is reported to be damage of ground
level glazing panels due to the damage from high winds while condensation and breakage
of window seals is also problematic throughout the building. Continued deterioration of
the sealed units, possible air or water infiltration, which may eventually affect other
building components, can result in more costly repairs/replacement. Reduce visibility
through failed sealed units and reduced aesthetics in the lobby and on the Minister’s floor
is taking place. The cafeteria window wall in the basement is about the only window
fully replaced in 2001. The main entrance doors on the south side of the ground floor
consist of two sets of four single glazed – clear anodized aluminium doors in clear
anodized aluminium frames creating an enclosed vestibule. There are also two single
glazed aluminium doors to the 16th
floor terrace however the terrace is no longer accessed
by tenants and the doors are locked and only used for maintenance access. The main and
basement entrance doors were repaired in the major renovation in 1995 and this extends
the life of these doors. Other doors have no major signs of deterioration and appear to be
serviced regularly. During the winter, ice formation due to condensation increases the
door maintenance requirements. The overhead doors are in good condition and were
replaced in 1997.
The tower roof is comprised of inverted loose laid reinforced PVC Sarnafil membrane
system with concrete topped (CT) insulation and was last replaced in 1990. Deterioration
of the CT boards have made them susceptible to wind blow-off. The podium level is
comprised of an inverted modified bitumen membrane system with type 4 polystyrene
and precast panels and was last replaced in 1997. The 16th
floor terrace was recently
retro-fitted in 2007 with an inverted modified bitumen system. A gutter system is located
along the north edge of the podium overlooking the parking area and was last replaced in
1995.
Site Features:
Items requiring attention in the short term include asphalt crack sealing in the north
parking lots, re-finishing of all exterior steel railings and repair/replacement of loading
dock lift table. Surface drainage at the site include area drains on the podium, catch
basins located in the parking lots and on the City streets and to drainage swales located
between adjacent properties. These storm water management systems were last replaced
in 1996. Between 1993 and 1998 concrete walkways/areaways, paved parking lots and
roadways were replaced.

Engineering Vulnerability Assessment of the Main Statistics Canada Building to the Impacts of Climate Change
HOK Canada 27:128
Exterior stairs, ramps and loading docks are in good condition due to their recent
replacement. Podium stairs and exterior concrete ramp replaced in 2004; loading dock
and stairs replaced in 1995.
Structural:
The building is in good condition. The tower structure is concrete encased steel columns
around the perimeter and reinforced shearwalls in the core of the building that support
concrete encased steel beams. The core of the building is the only interior structure that
minimizes remodelling impacts of the building and thus there is significant flexibility in
this regard. The podium level structure consists of reinforced concrete columns and
basement walls that support reinforced concrete beams. It is anticipated that the frame
will last the life of the building (beyond the next 30 years).
The foundation systems consists of reinforced concrete spread footings and foundation /
basement walls. The reinforced concrete basement walls on the north side of the building
are exposed on the exterior and regular, routine repairs are imminent. The exterior
finishes are average with some stains from moisture runoff primarily from the podium
level. Overall the foundations are considered to be in good condition.
The roof structure consists of reinforced concrete slabs on concrete encased steel beams.
The podium structure consists of reinforced concrete slabs on concrete beams. There is
some deterioration along the edge of the podium slab walls and potentially this area is
subject to greater deterioration that will require regular maintenance.
There is some deterioration and leakage around the perimeter of the podium slab. The
terracotta wall cover in the penthouse exhibits movement, which should be reviewed. The
seismic system of the building does not comply with the most recent building code and
will require reinforcement during any major renovation to the building.
Mechanical:
The building is heated and cooled via a perimeter 2 pipe induction system and interior
variable air volume systems. Controls are pneumatic, with Direct Digital Control front-
end controls of the main equipment. The induction system was installed in 1994, as were
the lobby and cafeteria air handling systems. The systems are in good condition;
however, the tower air handling systems have insufficient capacity during the shoulder
seasons and peak summer cooling loads.
Electrical:
Much of the power distribution system has been replaced starting in about 1995, however
some of the original cabling and conduit for the distribution from the main secondary
switchboard remains in service. The electrical distribution system can be generally
characterized as in good condition. The emergency power system was installed in 1985
and is in average condition. Extensive renovations have been undertaken to the indoor
lighting and emergency lighting systems. The overall condition is considered good, with
adequate free space for expansions or additions.

Engineering Vulnerability Assessment of the Main Statistics Canada Building to the Impacts of Climate Change
HOK Canada 28:128
Applicable Jurisdictional Considerations, Codes and Standards
To inform the project team in terms of how the test buildings are managed, an overview
and scan was conducted on the jurisdictions and instruments used to oversee, plan and
manage the buildings on the Campus. This section of the case study provides an overview
of the Acts, Policies, Codes and Standards that apply to the test buildings. Federal
Government of Canada via Public Works and Government Services Canada has
jurisdiction and direct control or influence on the planning, operation and daily
maintenance of the buildings in Tunney’s Pasture. The following Government of Canada
Legislation applies to the legal structure for the buildings:
� Financial Administration Act;
� Federal Real Property and Federal Immovables Act;
� Surplus Crown Assets Act; and
� Public Works and Government Services Act.
Note: The National Capital Commission, under the National Capital Act, also has
legislated responsibilities for real property within the National Capital Region (NCR).
These responsibilities include the approval of all sales or transfers of federal lands within
the NCR, approval of demolition of buildings on federal lands within the NCR, approval
of land use or development plans, approvals for exterior alterations and additions to
buildings on federal lands in the NCR.
The following Building compliance acts/regulations are applicable to all the buildings
considered in this Assessment:
� Canada Labour Code – Part II (1985);
� Canada Occupational Safety and Health Regulations (SOR/86-304);
� National Building Code of Canada (2005); and
� National Fire Code of Canada (2005).
A range of standards provided by Canadian Standards Association (CSA) and American
Society of Heating, Refrigerating and Air-Conditioning Engineers (ASHRAE) support
the Labour Code and Canada Occupational Safety and Health Regulations. Of note as it
relates to the health, safety and comfort of the building occupants are:
� ASHRAE Standard 55-1981, Thermal Environmental Conditions for Human
Occupancy; and
� ASHRAE Standard 62-2001n, Ventilation for Acceptable Indoor Air Quality
NOTE: The Treasury Board of Canada Secretariat Occupational Safety and Health
Directive (effective January 1st 2006) stipulates that for in office accommodation, air (dry
bulb) temperatures during working hours should be maintained within the 20-26 °C
range. Temperatures between 17-20 °C and above 26 °C can be uncomfortable, and
occupancy should not exceed 3 hours daily or 120 hours annually in each of these

Engineering Vulnerability Assessment of the Main Statistics Canada Building to the Impacts of Climate Change
HOK Canada 29:128
extremes. Temperatures above 26 °C are deemed to be uncomfortable when the humidex
reading to a given temperature equals 40 or less.
SNC-Lavalin-Profac, the building managers, are contracted by PWGSC to be primarily
responsible for daily operation and maintenance of all the test buildings. They are also
involved in assisting and informing the development of the Building Condition Reports
every 5 years that are then used to budget and plan for upgrades, renovations, rebuilding,
etc. through Investment Plans.
In addition to the above Acts, Policies, Codes and Standards, the the following federal
environmental Acts apply to all buildings on the Tunney’s Pasture site:
� Federal Real Property Act, brought into force on September 15, 1992.
� Canadian Environmental Assessment Act (CEAA), January 19, 1995.
� Canadian Environmental Protection Act (CEPA), 1988 (currently under review)
� Auditor General Act
� Fisheries Act
� Migratory Birds Convention Act
These Acts, however, are more applicable when new buildings are constructed or when
major renovations are planed on existing facilities or Campuses.

Engineering Vulnerability Assessment of the Main Statistics Canada Building to the Impacts of Climate Change
HOK Canada 30:128
Vulnerability Assessment As outlined above in the Project Approach section, the Project Team used the PIEVC
Protocol to assess the vulnerability of the three test buildings to climate changes. This
section of the report, primarily discusses how the Team applied Steps 3 through 5 of the
Protocol (the Climate Change and Buildings sections above have already discussed the
main elements of Steps 1 and 2). Step 3 can be considered to be the “heart” of the
Vulnerability Assessment, whereas Steps 4 and 5 are intended to screen through,
prioritize and develop recommendations for the infrastructure (building) components that
have been identified to be vulnerable to climate change.
Objectives and Methodology
Appendix C provides the full PIEVC Engineering Protocol and an explanation of the
overall Vulnerability Assessment methodology. The project team followed the main steps
in the Protocol where possible by using the PIEVC provided Worksheets. A copy of the
completed Worksheets for the Main Statistics Canada Building are provided in Appendix
B. A full application of the Steps 1 and 2 in the protocol was not conducted for the Jean
Talon or Brooke Claxton Buildings as it would be for the most part identical to the Main
Statistics Canada Building (see Project Approach above). Instead, emphasis was placed
on Step 3, 4 and 5 of the Assessment in order to identify the core differences in possible
vulnerability of components between the three buildings. As well, the team noted any
possible recommendations for the Main Statistics Canada Building that would not be
applicable to the Jean Talon or Brooke Claxton Buildings.
Step 3 primarily involves a qualitative assessment in which professional judgement is
used to determine the likely affect of changes in the climate factors (identified in Step 2)
will have on the building components (also identified in Step 2). To achieve this the
project team developed a Vulnerability Assessment Matrix based on the template
provided in Step 4.3.6 of the PIEVC Protocol. As per the Protocol, the Probability (SC)
and Severity Scale (SR) factors were used to calculate the priority of the affect of climate
change factor on each building component. The team selected values along the 0 to 7
scale based on the probability of the expected climate change factor influencing the
building component and severity of the potential impact this change would have on the
component. Method A and Method E were used to select values for probability and
severity respectively as shown in Table 2 below.
Table 2 Probability and Severity Scale Factor methodologies used in the Vulnerability Assessment of
the three test buildings.
Scale Probability Scale (Sc) Factor - “Method A”
Severity Scale (SR) Factor – “Method E”
0 negligible or negligible or
not applicable not applicable
1 improbable / very low / unlikely / rare /

Engineering Vulnerability Assessment of the Main Statistics Canada Building to the Impacts of Climate Change
HOK Canada 31:128
highly unlikely measurable change
2 remote low / seldom / marginal /
change in serviceability
3 occasional occasional
loss of some capability
4 moderate / moderate
possible loss of some capacity
5 often likely regular / loss of capacity
and loss of some function
6 probable major / likely / critical /
loss of function
7 certain / highly extreme/ frequent/ continuous
probable /loss of asset
This method was chosen to align with current prioritization schemes and risk
management methodologies used by Public Works and Government Services Canada in
the management of its Real Property portfolio.
The Vulnerability Assessment Matrix automatically calculated the “priority of climate
change effect” (Pc) for each building component. As per the Protocol this calculation was
done following the formula of Pc = Sc x SR. The building components were then ranked
according to their Pc values as follows:
• Pc values between 12 and 35 identified building components where climate
change will possibly have a major effect; and
• Pc values 36 and above indicated components that have a strong probability of
severe effect.
Those building components with Pc values between 12 and 35 were then subjected to an
“indicator analysis” according to Step 4 in the Protocol (see Worksheet 4 in Appendix B).
The outcomes of Step 4 and the building component that obtained Pc values of 36 or
higher, formed the input into Step 5 – Recommendations (See Worksheet 5 in Appendix
B). Step 5 in the Protocol structured the development of recommendations for each of the
building components that:
• Are identified as having a strong probability of severe effect due to climate
change; and
• Are identified as having a lack of adaptive capacity due to climate change.

Engineering Vulnerability Assessment of the Main Statistics Canada Building to the Impacts of Climate Change
HOK Canada 32:128
In addition to relying on the outcomes of Step 3 and 4 of the Protocol to develop
recommendations, the project team relied on the data from the building condition reports
(e.g. current conditions of building components), interviews and building tours.
Findings
Consultations and Building Tour Findings
The project team had several consultation meetings with representatives from SNC-
Lavalin Profac – the building managers contracted by PWGSC – to gather more
information and data concerning:
• details on the buildings, the important components and the current interactions
between these components and the weather and climate;
• current condition, state of repair, construction, materials and expected life cycle of
building components;
• anecdotal evidence of interactions of building components with the weather and
climate;
• current capacities and loads on specific building components; and
• the rating of probability and severity scale factors for specific building
components.
The key observations and outcomes from these consultations and meetings are:
• Building operators have excellent experience with the current status of building
components and the affects of weather and climate on their deterioration and
expected remaining life cycle.
• Current patterns and strength of winds affects the snowdrift patterns at the
building envelope and along the parapet such that snow needs to be moved so as
to not cause damage and danger to pedestrians below.
• Water staining was observed at the windowsill and lintel (precast and stone) that
is affecting the integrity of these systems (Main Statistics Canada Building)
• Operators have observed extended and more extreme periods of hot, humid
weather in summer that need to be factored into the probability/severity ratings of
some components.
• The heating and cooling systems needed to maintain the humidity and
temperature levels for LAN/computer rooms are critical to ensure the security of
computer services to employees.
• Operators are very concerned about increased freeze thaw cycles and their effect
on masonry mortar, walkways, parking area and building envelops where joints
and different materials are fastened together.
• Soil settling combined with potentially increased rain/snow may decrease the
ability to manage storm water.
The above and other more detailed information gained during these meetings and tours
are integrated into this report. In particular the observations and outcomes of building
tours helped the project team to determine the Probability and Severity Scale factors
required in Step 3 – Vulnerability Assessment (see Table 2). For example, the
observation by Building Managers that extended and more extreme periods of hot, humid

Engineering Vulnerability Assessment of the Main Statistics Canada Building to the Impacts of Climate Change
HOK Canada 33:128
weather in summer are having an affect, provided the project team with additional
rationale to increase the probability/severity ratings of building components relating to
cooling, humidity and ventilation. Specific details can be found in Appendix B,
Worksheets 1, 2 and 3.
Main Statistics Canada Building
The major findings regarding the Main Statistics Canada Building are that there are a
range of different building components that are, to varying degrees, vulnerable to climate
change. Table 3 shows the outcomes of the Vulnerability Assessment Matrix applied to
the Main Statistics Canada Building. Building components were assigned a “priority of
climate change effect” score (Pc) using professional judgement in rating the Probability
and Severity Scale factors for each building component. Building components with a Pc
value of 36 or higher were identified as having a strong probability of severe effect due to
climate change (indicated by * in Table 3). Building components with Pc values between
12 and 35 were identified for further analysis in Step 4 to understand the possible
vulnerability due to climate change.
Table 3 List of building components identified in Step 3 – Vulnerability Assessment of the Protocol as
potentially vulnerable to climate change.
Building Component Priority of climate change effect (Pc)
Exterior Systems
• Site Drainage 12
• Storm Drains* 36
• Tunnels, manholes and access doors 35
• Freestanding walls – concrete and masonry 20-25
• Retaining Walls 12
• Walkways – asphalt, concrete, unit pavers* 42
• Stairs – concrete and metal* 30-36
• Ramps* 36
• Parking Areas – asphalt, concrete, unit pavers* 42
Building Systems
• Masonry walls* 36
• Stone Panels* 36
• Precast Concrete Window Sills 30
• Glazed Curtain Wall 16
• Metal Cladding 16
• Windows – aluminium 16
• Doors – steel and aluminium 12
• Flat Roof Systems 30
Mechanical and Electrical Systems
• Heating System and Adequacy 12
• Cooling System and Adequacy* 42
• Provision/Supply and Reliability of Electrical Power: 35
Based on Steps 3 and 4 of the Protocol and the building condition reports, results from
interviews and building tour, the Project Team determined a set of findings for the
Vulnerability Assessment of the Main Statistics Canada Building. These are discussed
below according to the main groupings of building components.

Engineering Vulnerability Assessment of the Main Statistics Canada Building to the Impacts of Climate Change
HOK Canada 34:128
Main findings, Exterior Systems:
1. Storm Drains: Although the design parameters of the storm drains were not
available, the Project Team used professional judgment and civil engineering
input3 to determine that the existing storm drains meet and are potentially at full
capacity. Based on projected increased precipitation, these systems will
potentially be inadequate and as such may need to be supplemented with storm
water retention areas or with ground water recharge systems.
2. Tunnels, manholes and access doors: This infrastructure component is below
grade and throughout the campus supplying all buildings with critically needed
steam and chilled water. Although the Tunnels are currently being maintained and
managed by PWGSC, no technical information was available for this system at
the time of the assessment. Due to the sites proximity to the river and increase in
precipitation year round, ground water issues may affect this infrastructure so
much so that it could require draining / pumping systems.
3. Walkways and Parking Areas: Due to increased freeze thaw and rain over the
winter months it can be expected that there will be more ice build-up on
walkways. The Tunney’s Pasture campus has well over 10,000 people with only
about 1000 parking spots. It therefore has a strong pedestrian component given its
proximity to the transit way and parking restrictions. Health and safety of
pedestrians and prevention of injury on ice is very important. At the same time the
freeze thaw cycle will cause heaving and material deterioration making the
condition of the walkways prone to tripping hazards. This will pose a significant
risk and cost to maintaining this infrastructure component. Higher Temperatures
will affect walkways especially asphalt walkways as it will cause the material to
soften thus affecting its wear. For example, shoe heels will puncture into the
walkway and create crevices that in the winter will be subjected to freeze thaw
and cause the walkway to breakdown.
4. Stairs: Increased freeze thaw cycles will cause heaving and material deterioration
making the stair areas prone to occupant tripping/falling/injury. This could pose a
significant risk during emergencies and evacuations. Stairs should be kept clear
of snow and ice during winter months to ensure dry conditions and prevent
material deterioration. Note, because of the public nature of this building and the
unionized civil service occupants, snow clearing on steps is promptly dealt with in
accordance with PWGSC standards.
5. Ramps: Increased freeze thaw cycles will cause heaving and material
deterioration making the ramps an area prone to occupant tripping/falling/injury.
This could pose a significant risk during emergencies and evacuations. Stairs
should be kept clear of snow and ice during winter months to ensure dry
conditions and prevent material deterioration. Note, because of the public nature
of this building and the unionized civil service occupants, snow clearing on ramps
is promptly dealt with in accordance with PWGSC standards.
Main findings, Building Systems:
3 Trevor Kealey, R.V. Anderson Associates Ltd., Ottawa.

Engineering Vulnerability Assessment of the Main Statistics Canada Building to the Impacts of Climate Change
HOK Canada 35:128
6. Building Envelop: Due to increased rain over the year, moisture will make its way
into the building envelope. The result of this will mean increased brick failure.
Building Management is currently seeing some evidence of this. With no drainage
cavity it will make it more difficult to keep the envelop dry. The only means of
drying out the envelop is through building heat migrating out and solar radiation
throughout the year. In the winter months any moisture within the envelope will
be subjected to freeze thaw cycles therefore affecting the structural integrity of the
building envelop materials. Higher humidity levels in the summer months may
have the same effect in that moisture will migrate into the envelop that can cause
damage. Alterations on the interior and exterior side of the building envelop will
require serious consideration before any action is taken as it can significantly alter
the performance and negatively impact the system. In addition such changes will
have significant affects on heating, cooling and ventilation loads and requirements
for the building.
7. Flat Roof Systems: Given that flat roofs will retain some water and that freeze
thaw cycles are expected to increase over the winter months, this will pose a
significant strain on the integrity of the system so much so that the life cycle will
be shortened. Unexpected leaks may take place and therefore compromise the
structure and finishes below. This system is vital to the well being of a building’s
operations and as such is critical system that requires constant monitoring. NHote
that current building management practices require annual review of this system
such that it will safeguard the system.
Main findings, Mechanical Systems:
8. Heating System and Adequacy: It was found that at times during the winter the
hot water heating system (supply from the CHCP) has a hard time keeping up
with the interior heating demands causing the interior environment to be cold and
uncomfortable. This is primarily due to the fact that there is little to no insulation
in exterior walls often resulting in the heating pipes freezing. However, based on
the projected increases in temperature during the winter months, and a reduced
frost season, the adequacy of the system to meet demands may prove to be
reduced or eliminated. It should be noted that currently, because of a lack of
insulation, the exterior building envelop relies on a certain amount of heat to keep
it warm and dry, that in turn ensures the envelops structural integrity. Therefore
the heating system and its adequacy are intimately linked to the condition and
technology of building envelop. Therefore, the main weakness related to heating
the building is actually the building envelop itself.
9. Cooling System and Adequacy: Climate change impacts the capability of the
cooling system to meet loads for the Tunney’s Pasture facilities in two ways:
a. Outdoor temperature and humidity increases load through higher sensible
and latent cooling of make-up air supply and infiltration as well as
increases in envelope conduction gains. As the relative humidity
projections are relatively constant, the projected rises in temperature result
in increases of make-air and infiltration loads at a rate of about 5kJ/m3 or
5W/l/s, mostly latent. Assuming a combined air change rate of 1 ACH, the

Engineering Vulnerability Assessment of the Main Statistics Canada Building to the Impacts of Climate Change
HOK Canada 36:128
load increase can be estimated thus: building floor area (m2) x
temperature rise (0K) x 5 (W) = additional cooling load (W). Building
envelope gains are smaller and require envelope areas and U-values. The
cooling coils and air distribution may be insufficient to maintain
acceptable conditions.
b. The central chilling plant depends on sufficiently cool water and pumping
rates from the Ottawa River to maintain capacity and possibly operation.
A combined effect of lower summer rainfall and higher ambient
temperatures will raise temperatures and lower flow rates of the Ottawa
River. Increased usage for heat rejection and urbanization upstream will
have similar effects. Although current capacity exceeds demand by a 50%
margin currently, the combination of lower capacity due to condenser
temperature rise and higher loads may reduce the margin to criticality. The
older steam turbines will be called in to duty more frequently and shorten
their serviceable life.
10. Provision/Supply and Reliability of Electrical Power: As temperature and
humidity levels will increase, electrical demands will also increase with no
guarantee that the utility will be able to supply enough power city wide. Power
supply and reliability is therefore very vulnerable. This element is not reviewed as
part of typical building condition management practices and therefore will require
special attention and monitoring.
The project team also found through Step 4 of the Protocol – Indicator Analysis – that the
following building components have adaptive capacity through typical building science
best practices that could be implemented as part of the building management program
through regular scheduled building maintenance activities:
Exterior Systems:
1. Site Drainage – related to slopes away from the building and includes soil
permeability and hard surfaces like stairs / ramps
2. Freestanding walls - concrete and masonry
3. Retaining walls – concrete
4. Stairs – metal
Envelop Systems:
1. Precast Concrete - Window Sills
2. Glazed Curtain wall
3. Metal Cladding
4. Aluminium windows and steel doors
In summary, for the Main Statistics Canada Building, the project team found that the
highest priority building components due to climate change are:
• the walkways, parking areas, stairs and ramps because of potential risk to human
health, safety, injury, falling etc.

Engineering Vulnerability Assessment of the Main Statistics Canada Building to the Impacts of Climate Change
HOK Canada 37:128
• the building envelop because accelerated deterioration will affect the structural
integrity of the building
• the adequacy of the cooling system because is poses significant costs to PWGSC
and directly affects occupant comfort and productivity
• the reliability of power (electricity) to the building because it is critical to the
daily work and productivity of occupants and the operation of the computer/LAN
room.
Jean Talon Building
The main findings with respect to the Jean Talon building were very similar to the Main
Statistics Canada Building. The highest priority considerations are similar in that the
exterior systems (e.g. walkways, ramps, parking areas and stairs), building envelop,
cooling systems and reliability of power are the key vulnerabilities. However, there are
specific differences in the findings:
1. Retaining Concrete Walls – This element is one difference when compared to the
other 2 test sites. The loading area for this building requires that there is a
retaining wall on the north side of the building. The wall is easily 1.5 stories in
height. Freeze thaw cycles and increases in moisture content in the earth along
with water infiltration at grade between the earth and wall structure could cause
movement or deterioration.
2. Building Envelop – The most note worthy element is the precast detailing at the
parapet level. It was observed that snow was making its way behind the precast
panel and between the structure that supports the panel. Upon closer observation,
at the top of the parapet wall there is no cap to neither cover the cavity nor shed
water away from this cavity. As well, bowing precast walls were observed in
several locations and must be noted as unique to the 3 buildings studied. Both of
these situations are not necessarily climate change related but are rooted in
buildings science. Through typical building management practices, these issues
should be adequately monitored and hopefully resolved.
3. High Parapet Walls – Typically, a parapet well is not greater than 2 feet high. In
the case of Jean Talon some of the parapets are easily the height of one storey.
The high parapet wall produces unique situations for snow drifts and wind
patterns that would require further study. At this point we can not be conclusive
about this unique building condition.
Brooke Claxton Building
The main findings with respect to the Brooke Claxton building were very similar to the
Main Statistics Canada Building. The highest priority considerations are similar in that
the exterior systems (e.g. walkways, ramps, parking areas and stairs), building envelop,
cooling systems and reliability of power are the key vulnerabilities. However, there are
specific differences in the findings:

Engineering Vulnerability Assessment of the Main Statistics Canada Building to the Impacts of Climate Change
HOK Canada 38:128
1. Metal Gutters - Unlike most buildings at Tunney’s Pasture, the Brooke Claxton
building uses metal gutters on the north end of the podium so as to not drain
directly on the users of the building entry points and loading dock facility located
below. Over the winter months ice accumulation can form along the edge of the
podium not only on the north side but also the west and east side. From a building
science perspective this can case deterioration of the roof and exterior wall. On a
health and safety level this may also pose some risk to pedestrians especially on
the north side. Generally, typical building management practices should guard
against this risk and in our professional opinion is part of standard building best
practices currently underway.
2. Tunnels, manholes, access doors – The elevation of the tunnel system at Brooke
Claxton is at a slightly lower elevation and is in closer proximity to the Ottawa
River. Due to greater levels of precipitation year round and like all tunnels on site
it will be affected by water infiltration as was evident during the Brooke Claxton
building tour.
3. Building Envelop – Like the Main Stats Building, Brooke Claxton has an aging
building envelope that is mostly of the original construction vintage. It is over 40
years into its life cycle and as such will require maintenance and upgrades to
preserve its integrity especially since this building has an exterior based structural
system. Current building science places the structure on the interior so that it is
kept warm and dry.
4. Podium Roof – Generally, the podium roof has been detailed in such a way that
there is little to no roof overhang. With this existing scenario, rain water drains
directly on the east podium wall as staining is evident on this elevation. This
condition is unique yet similar to the Jean Talon building which has a similar
podium walk-up for ground floor entry to the building. Deterioration on the wall,
especially over the winter months, can take place and can be accelerated due to
increased freeze thaw cycles.
Summary of Findings
As mentioned above, the findings and highest priority considerations resulting form the
Vulnerability Assessment are very similar across all three test buildings in that the
exterior systems (e.g. walkways, ramps, parking areas and stairs), building envelop,
cooling systems and reliability of power are the key vulnerabilities. There is however,
differences in considerations regarding roofs, building envelop, tunnels and retaining
walls that are specific to each building. Details of the Vulnerability Assessment (Step 3)
for each building can be found at the end of Appendix B.
Other Potential Changes
The project team identified three main potential changes/variables that may affect the
vulnerability of the three test buildings due to climate change. The first, is that changes
occupant/employee density and space dedicated to computers/servers/mainframes will
affect the loads put on the building power, ventilation, heating and cooling systems. The

Engineering Vulnerability Assessment of the Main Statistics Canada Building to the Impacts of Climate Change
HOK Canada 39:128
future changes in occupancy and space usage are currently unknown and therefore this
can also be seen as a limitation of the Assessment.
Second, the Tunney’s Pasture Campus is currently the focus of a Master Planning
exercise being undertaken by Public Works and Government Services Canada. The
outcomes of this study are unknown at this time and difficult to predict. However, they
may affect the investment plans and budgets and resulting priorities for the three test
buildings.
Finally, there is uncertainty and fluctuating budgets surrounding the investment and long-
term capital plans for these buildings as administered by Public Works and Government
Services Canada. This can result in deferred maintenance that can affect the ability to
maintain the building to the required performance standards. They can also change the
operating and maintenance priorities for the building as well as planned capital upgrades.
Thus, the planned upkeep and replacement of specific building components is difficult to
predict. However, one can see that the results of this assessment could inform the future
development and prioritization of these budgets, reports and plans for the test buildings
and the Tunney’s Pasture Campus in general.
Data Sufficiency and Limitations
The building data from the 2007 and 2008 building condition reports are assumed to be
accurate. Current building management practices by PWGSC and SNC-Lavalin Profac
ensure that all building components are reviewed on a 5-year cycle. The resulting
Building Condition Reports inform the planning, prioritization and budgeting of service,
upgrades, renovations, rehabilitation etc. for the buildings. These reports and supporting
processes as well as qualified and informed building managers provided the project team
with high quality information to inform the vulnerability assessment.
With respect to limitations of the climate change data, the models used can be considered
to be the best available estimates. Most of climate change factors relevant to the test
buildings and their performance were provided by Ouranos (see Appendix A). However
because sensitivity or uncertainty analysis is still under development in the climate
change modelling field, the expected changes developed through the climate change
models and scenarios were considered to be general estimates in the assessment.
In terms of other limitations, the Project Team identified the following:
• Making predictions about the service life of building materials and components
requires in-depth knowledge of materials, their composition, manufacture and
their response to a number of different weather and climate related factors. This
in-depth knowledge is outside the scope and areas of expertise of the project team
and the purpose of this assessment. That being said, the team has identified the
building components that require additional analysis or research.
• The inability to predict the occurrence of extreme weather events that cause
building components or materials to fail prematurely.
• The Heritage designation of the Main Statistics Canada and Brooke Claxton
Buildings could affect the potential priorities and plans to improve, upgrade or

Engineering Vulnerability Assessment of the Main Statistics Canada Building to the Impacts of Climate Change
HOK Canada 40:128
refurbish the building, particularly the building envelop. This factor was not
included or researched as part of this assessment.
• Because the test buildings rely on the Central Heating and Cooling Plant (CHCP)
for heating and cooling for much of their space, the efficiency and affects of
increased loads on the CHCP need to be studied further. The central heating and
cooling plant was recently modernized, one would assume that they did take into
account more recent data. This is a major limitation of the current assessment as
the building and its components should be considered to be an integrated system
working to provide the necessary functions for its occupants, for example changes
to the building envelope will impact heating and cooling loads. This in turn can
affect the demands placed on the CHCP and roof-top units for the computer/LAN
rooms.

Engineering Vulnerability Assessment of the Main Statistics Canada Building to the Impacts of Climate Change
HOK Canada 41:128
Conclusions & Recommendations First, for the three buildings, the project team found that the highest priority
considerations due to climate change are:
• the walkways, parking areas, stairs and ramps because of potential risk to human
health, safety, injury, falling etc.
• the building envelop because of accelerated deterioration will affect the structural
integrity of the building.
• the adequacy of the cooling system because is poses significant costs to PWGSC
and directly affects occupant comfort and productivity.
• the reliability of power (electricity) to the building because it is critical to the
daily work and productivity of occupants and the operation of the computer/LAN
room.
Specific recommendations for the three buildings include:
J. A detailed research study should be conducted that investigates the loads from
potential increases in precipitation on the site rain and storm water drains and
tunnels. The study should consider the existing site drainage capacity, soil types,
site slopes/topography, ground water tables and bedrock topography to investigate
if there are any possible risks/vulnerabilities to these component. As well the
study should have a scope that examines the potential effects on the function of
the buildings, footings, foundation walls, slab on grade and retaining walls.
Ideally the study should also consider any possible future changes to the overall
plan/layout/building density (i.e. Master Plan) of the Campus and explore the
optimum engineering solution such as ground water recharge or storm water
retention areas.
K. In conjunction to the above recommendation, PWGSC should consider and assess
how climate change will affect Federal Real Property that is in close proximity to
the Ottawa River, its watershed and flood plain. This may warrant that PWGSC
initiate or involve themselves in studies on the climate change effects on the
Gatineau River, Rideau River or Rideau Canal. In either case, this would also
provide more information for subsequent assessments on the Campus that could
include flood plain considerations/risk.
L. It is crucial that all walkways, stairs, and parking areas be kept clear of snow and
ice in the winter in accordance with current building management practices. This
will help ensure an optimal life cycle and structural integrity for these asphalt,
concrete and unit paver surfaces. Maintaining current practices and budget for
snow/ice clearing will help ensure occupant and public safety in these areas. As
these surfaces reach the end of their life cycle, PWGSC should consider
replacement with materials that will withstand increased freeze-thaw cycles.
These materials should also try to minimize heat gain in the areas surrounding the
building in order to reduce possible cooling loads on the building during the
summer.

Engineering Vulnerability Assessment of the Main Statistics Canada Building to the Impacts of Climate Change
HOK Canada 42:128
M. In the Main Statistics Canada building, the heating system pipes can freeze and
burst in the winter months, resulting in building envelop water damage. This in
turn can affect the structural integrity of the building. This is high priority area
that warrants the research and application of a building envelop technology that
can mitigate this problem as well as manage the affects of increased precipitation
and potential moisture migration into the envelop due to climate change. It should
be emphasized that changes to the building envelop will affect the performance
and loads on the heating, cooling and ventilation systems. Thus, any changes to
the envelop will require modification of the heating, cooling and ventilation
systems to ensure optimum building performance in line with current building
science and codes. As mentioned above, the building’s Heritage status may need
to be considered in any changes to the structure or envelop.
N. The Brooke Claxton Building, as with the Main Statistics Canada Building, has an
aging building envelope that is mostly of the original construction vintage. It is
over 40 years into its life cycle and as such will require maintenance and upgrades
to preserve its integrity especially since this building has an exterior based
structural system. Research and application of a envelop technology that will keep
the interior warm and dry, without affecting structural integrity is recommended.
As mentioned above, the building’s Heritage status may need to be considered in
any changes to the structure or envelop.
O. The flat roof systems will be particularly vulnerable to climate change due to
increase freeze-thaw cycles and summer temperatures. Roof deterioration is likely
to be accelerated. Therefore, PWGSC should investigate and determine the
optimum flat roof technology, design options, mitigation strategies that will
accommodate the potential effects of increased freeze thaw and ice build-up. It is
recommended that such a study should investigate current best practices in
climates that are currently similar to the predicted climate change for the Ottawa
Region (i.e. warmer, more freeze thaw) and also investigate the feasibility of
adapting a technology that sheds more easily/reliably moisture, snow and rain.
P. The potential increased spring, summer and fall temperatures due to climate
change can have a direct affect on all the buildings cooling systems. A detailed
engineering evaluation needs to be conducted on the anticipated loads due to
climate change and the optimum solution for each building. Such an evaluation
should evaluate the suitability of various adaptive measures/technologies such as
exterior shading devices, passive cooling techniques, etc. It should also recognize
potential changes/engineering options for the building envelop (discussed above)
to ensure systems are optimally sized for the existing and projected loads.
Secondly, PWGSC should conduct a separate or integrated evaluation based on
the Campus as a system of buildings, each presenting differing loads and
responses to climate change to the Plant. This could be in the form of a climate
change vulnerability assessment based on the PIEVC Protcol on the Central
Heating and Cooling Plant. In any case, the evaluation/assessment should model
and consider:
a. the projected loads on each building and as a Campus;
b. current and future CHCP capacities;

Engineering Vulnerability Assessment of the Main Statistics Canada Building to the Impacts of Climate Change
HOK Canada 43:128
c. the various technology options/adaptive measures for the buildings on the
Campus;
d. the future Master Plan for the Campus;
e. various technologies/adaptive measures for the CHCP itself such as co-
generation and geothermal heating and cooling; and
f. that the engineering solution meet or exceed the Government of Canada’s
objectives to reduce GHG emissions and Air Pollutants.
g. Any potential changes to the Ottawa River (used by the Plant for cooling)
such as water temperature, flow, height etc. that may be due to climate
change.
Q. PWGSC should being working with the local electrical utility (e.g. Hydro Ottawa)
to study and plan for the cumulative effects on electricity loads, demand,
consumption, etc. during spring, summer and fall from all the buildings at the
Tunney’s Pasture Campus. This work should also be done in conjunction or at
least consider the evaluation/assessment of the CHCP and the potential
technologies (e.g. co-generation) that can reduce demands and loads on the local
electrical utiliy. These efforts will help ensure that the electrical power supply is
reliable for the buildings on the Campus and in the region.
R. PWGSC and other building landlords and operators should begin to plan for the
expected changes in climate. This is particularly the case for buildings of similar
vintages and construction types as the test buildings. Those owners and operators
with buildings requiring renewal, major renovation or complete rebuilding within
the next 10-15 years, should be planning and designing these buildings to meet
future climatic conditions.
Action on these recommendations should be initiated within the next 6-18 month
timeframe.
Secondly, the Project Team recommends that the current building management processes
be maintained to help ensure that many building components (e.g. stairs, walkways,
ramps, windows, doors) adversely affected by climate change (i.e. premature
deterioration) will be identified and subsequent remedial action taken to reduce or
eliminate any specific impacts. In other words, we find that this management approach
indirectly guards against climate change vulnerabilities for several building components
and systems. This is because Federal buildings are managed under a rigorous process that
includes Asset Management Plans, Building Condition Reports and Building
Management Plans, to name a few. This building management process is based on sound
financial and building science best practices and overall ensures that the building asset is
kept in the best condition, practically speaking. The review of these reports and
subsequent meetings and consultations with PWGSC and SNC-Lavalin Profac provided
excellent sources of data and practical information about the buildings and their
components, current state of repair and expected lifespan.
Thirdly, despite the rigorous building management processes in place and utilized by
PWGSC and SNC-Lavalin-Profac, there are gaps in the Building Condition Reports
related to how the building operates as a system. In other words, current emphasis in

Engineering Vulnerability Assessment of the Main Statistics Canada Building to the Impacts of Climate Change
HOK Canada 44:128
condition reporting and operations is focused on a “component by component” basis,
whereas, a “building as a system” approach (Figure 2) could prove beneficial in terms of
planning and responding to changes in climate that affect numerous building
components/systems simultaneously. For example the inter-relationship between heating
and cooling systems and the building envelop, insulation levels and ventilation could be
further elaborated in order to prioritize building investments and budgets.
Figure 2 Building as an interrelated group of systems.
Finally, the project team recognizes that the Main Statistics Canada and Brooke Claxton
Buildings have Heritage designation. The Project Team recommends that this be
considered when possible engineering solutions are evaluated and implemented.
Mitigation and adaptation techniques will need to factor in this designation. This may be
particularly important for changes required in the building envelop that may or may not
affect the building façades, profiles and aesthetics.
Applicability to other buildings
While the Vulnerability Assessment focused on the three test buildings, particular
elements of the findings and recommendations can be applicable to other buildings in the
region, especially of similar vintages and construction. First, increased freeze-thaw cycles
will likely have similar effects on buildings and other types of infrastructure in the
region. The Project Team, in the course of the assessment noted that the City of Ottawa
has been studying and responding to increases in freeze-thaw cycles with respect to
sidewalk and road clearing activities.

Engineering Vulnerability Assessment of the Main Statistics Canada Building to the Impacts of Climate Change
HOK Canada 45:128
Second, increases in precipitation in the form of rain particularly in fall, winter and spring
will put increased loads on building envelops and flat roofs in the region. It could be
anticipated that many landlords and building managers will be addressing problems
associated with increased moisture infiltration into building envelops either through
failed roofing systems or cladding systems, sills, etc.
Third – and perhaps most important from a climate change perspective – the increases in
spring, summer and fall temperatures in the region will put higher demands on cooling
systems. This in turn will increase loads on the electrical utilities during these seasons.
Strategies will need to implemented at various levels in order to manage the demand and
ensure that increases in electricity consumption do not result in increased GHG emissions
– resulting in further climate change. The Project Team believes that increases in cooling
demand could be managed by a combination of building technologies (e.g. external
shading, envelop upgrades, passive cooling, ground source heat pumps), changing
occupant behaviour, increased utility capacity and renewable/green electricity generation,
etc.
Finally, it should be noted that the availability of data and information for the test
buildings and commitment of the building managers aided the vulnerability assessment
process. However, this may not be the case with other buildings, landlords or
jurisdictions. The Project Team believes that the amount and quality of building
component information should be well evaluated and their limitations identified if similar
assessments are conducted on other buildings.
Recommendations to Improve the Protocol
As discussed above, the project team applied the PIEVC Engineering Protocol for
Climate Change Infrastructure Vulnerability Assessment to the buildings in this project.
The team was asked by PIEVC and PWGSC to evaluate the overall Protocol and the
climate change data provided by Ouranos and their applicability to the building sector.
This section of the case study summarizes the Project Teams evaluation of the Protocol
and the cliamte change data.
The Protocol
The following points summarize the evaluation of the Protocol and suggest specific
improvements that may also be applicable to other infrastructure sectors.
The Project Team believes there is potential to align the terminology in the Protocol to
that used by climate and weather specialists as well as engineers and architects (e.g.
National Building Code, CSA, ISO and ASHRAE). For example, the protocol uses such
terms as “climate change factor” and “climate change parameter” while Environment
Canada and Ouranos refer to changes in a climatic indices (e.g. change in average annual
maximum temperature) that is expected in the future. The Team recommends that the
Protocol and Worksheets be revised to ensure consistency in terminology between
climatologists and the engineering profession. Where possible the revision should use
established terminology being used in the disciplines to aid future project teams in

Engineering Vulnerability Assessment of the Main Statistics Canada Building to the Impacts of Climate Change
HOK Canada 46:128
understanding the Protocol and the basic methodology. A second step could be a
collaboration, through PIEVC, between CSA, ASHRAE and climate change
modelers/scenario developers such as Ouranos to revise the Protocol specific to the
infrastructure sectors being assessed.
Also in relation to terminology, the Protocol and Worksheets also use such terms as
“climate change baseline” and “climate change trends” that are not properly defined in
the Glossary. Thus, it is recommended that PIEVC create a revised Glossary of Terms
that encompasses all the terminology being used in the Protocol and supporting
Worksheets.
Repetition of terms and data fields in Protocol and supporting Worksheets were also
found to create confusion as to their meaning. For example, the Protocol asks the user to
consider and document “Jurisdictional Considerations” in Step 1 and Step 2.
Furthermore, Step 5 requires a restatement of “Limitations” that have previously been
documented in Steps 1, 2. Furthermore, the Protocol does not clearly explain what is
being requested in these different Steps or why data from one Step should also be copied
or reiterated in another. Other terms that appear frequently that warrant some clarification
include “limitations, data sufficiency, other change factors and infill data.” The Team
recommends that the Protocol be reviewed in order to assess where repetition of these
and other terms and data fields can be reduced and/or simplified along with an
explanation of the significance of the data field.
To aid readability, clarity and understanding around the considerations, tasks or analysis
the user of the Protocol should undertake at different Steps, the Team recommends that a
set of illustrations or text examples be inserted into the Protocol. The existing Protocol
does include several flowcharts to assist the reader in understanding the methodology and
logic, however, these too could be improved by making references in the charts to the
numbered Steps and sub-Steps. For example, in Step 3 when trying to assess the
probability and severity it is initially not apparent what is being looked at. Is the analysis
about the probability and severity of climate change or is it about the effect of climate
and the impact that it will have on the infrastructure component? Upon reflection the later
made more sense even though initial the former was what came to mind based on Step 2
work completed.
Finally, at times, the Protocol and Worksheets are unclear in their instructions and/or
there is an inconsistency in terminology. For example, in Step 4.2.1, Data Gathering and
Sufficiency in the Protocol, the bulleted items “a, b and c” should relate to Table 4.2.1 in
Worksheet 2. However there is discrepancy in terminology between these bulleted items
and the columns in the table. Bulleted item “c” states “provide references,” whereas the
corresponding column in Table 4.2.1 states “References and Assumptions: on data and
infill data.” To eliminate confusion and between the Protocol and the Worksheets, it is
recommended that a thorough revision of both be undertaken to ensure consistency.

Engineering Vulnerability Assessment of the Main Statistics Canada Building to the Impacts of Climate Change
HOK Canada 47:128
Climate Data/Scenarios
The Project Team found that the current set of climate change data, models and scenarios
as provided by Ouranos for this case study are particularly relevant to the building sector.
The key climate indices investigated in the Assessment (Temperature, Rain, Snow, Wind,
HDDays, CDDays, Frost Season, Rain on Snow) are adequate to do a high-level
vulnerability assessment of buildings in Canada. However, it was recognized and
accepted that there are specific limitations regarding the uncertainty of extreme weather
events, freeze-thaw cycles, humidity and solar radiation/cloud cover that would aid the
assessment of other buildings. It should be mentioned that some of these could be
extrapolated from long (+25 year) trends and data sources not specific to Environment
Canada climatic data.
Of key interest to the assessment of buildings are: the potential for moisture infiltration
into the envelop; freeze-thaw cycles that deteriorate building materials, especially roof
membrane, concrete and masonry; and temperature and humidity extremes that can affect
the ability of HVAC systems to maintain an acceptable indoor environment. The Project
Team recognizes that for future assessments of buildings, specific climatic indices that
relate to these key interests could become important to ensure consistency in application
of the overall Assessment and Protocol. As discussed above, such indices should be
aligned to current ASHRAE modeling/design data tools, codes or standards. Possible
additional indices include: dew point frequency distribution; enthalpy frequency
distribution; wind speed frequency distribution; a dry/wet bulb-wind joint index; and a
humidity-temp joint index.
In addition, there is potential to improve the utility or presentation of the climate change
indices and scenarios. First, engineers and architects could benefit from a layperson’s
indication of what climate would be like in 10, 20, 50 year time horizon (e.g. in 2050
Ottawa’s climate will be roughly similar to Philadelphia). This would allow research and
comparison of building codes and best design practices of these regions to understand
what may or may not work in terms of adaptation or mitigation techniques and
technologies.
The project team found that that the spatial parameter of a 20-50km radius around the test
buildings was very reasonable and that micro climatic factors would be too
detailed/focused for the level of the assessment. However, the factors of
elevation/topography data would be important for buildings closer to rivers, streams,
lakes etc. Naturally, the climate data and scenarios did not address or encompass changes
to the Ottawa River or water table/ground water. Availability to this data is important as
Tunney’s Pasture Campus relies on the Ottawa River given that the central heating and
cooling plant is connected to this natural resource. This is outside the scope of such
scenarios, but indicates a need for future assessment projects to look at the affects
changes in climate indices will have on other natural systems that may in turn affect the
infrastructure.
In terms of temporal climate change horizons/scenarios, the +10, 25, 50 year time
horizons are also reasonable at this time, given the typical design life of the majority of

Engineering Vulnerability Assessment of the Main Statistics Canada Building to the Impacts of Climate Change
HOK Canada 48:128
Canada’s building stock. However it is recognized that historical or culturally valuable
buildings may need longer time horizons.

Engineering Vulnerability Assessment of the Main Statistics Canada Building to the Impacts of Climate Change
HOK Canada 49:128
References Adaptation Options for Infrastructure Under Changing Climate Conditions. Occasional
Paper 10. Heather Auld, Don MacIver, Joan Klassen. Adaptation and Impacts Research
Division, Environment Canada. Toronto, Canada, 2007.
Assessment of the Need to Adapt Buildings in New Zealand to the Impacts of Climate
Change, Study Report 197. J. Bengtsson, R. Hargreaves and I.C. Page. Branz Ltd., New
Zealand, 2007.
Building Condition Report: Statistics Canada Building #3 – Tunney’s Pasture Ottawa
4520354. PWGSC/TPSGC, Ottawa, Canada. December 28, 2007.
Building Condition Report: Brooke Claxton Building #7 – Tunney’s Pasture Ottawa
4520353. PWGSC/TBPSGC, Ottawa, Canada. March 2008.
Changing Weather Patterns, Uncertainty and Infrastructure Risks: Emerging Adaptation
Requirements. Occasional Paper 9. Heather Auld, Don MacIver. Adaptation and Impacts
Research Division, Environment Canada. Toronto, Canada, 2007.
City of Portage La Prairie Water Resources Infrastructure Assessment – Phase II Pilot
Study, Executive Summary. Genivar in association with TetrES Consultants Inc.
November, 2007.
Climate change in Canada: Climate scenarios for the public infrastructure vulnerability
assessment. Ouranos. Ottawa, Canada, February 2008.
Climate change in Canada: Climate scenarios for the public infrastructure vulnerability
assessment. Addendum. Ouranos. Ottawa, Canada, April 2008.
Condition Assessment: Jean Talon Building #5 – Tunney’s Pasture Ottawa 4520365.
PWGSC/TPSGC, Ottawa, Canada, January 22, 2008.
PIEVC Engineering Protocol for Climate Change Infrastructure Vulnerability
Assessment. PIEVC-CVIIP, Engineers Canada, Revision 7.1 October 31, 2007.
Estimation of potential impact of climate change on the heating energy use of existing
houses. Radu Zmeureanu, Guillaume Renaud. Energy Policy 36, 2008, Elsevier. pp 303-
310.
Infrastructure Vulnerability to Climate Change – Vancouver Sewerage Area, Draft
Report. Kerr Wood Leidal Associates Ltd. Vancouver, Canada. February 2008.
Planning for Atmospheric Hazards and Disaster Management Under Changing Climate
Conditions. Occasional Paper 12. Heather Auld, Don MacIver, Joan Klassen, Neil

Engineering Vulnerability Assessment of the Main Statistics Canada Building to the Impacts of Climate Change
HOK Canada 50:128
Comer, Bryan Tugwood. Adaptation and Impacts Research Division, Environment
Canada. Toronto, Canada, 2007.
Public Buildings – Infrastructure Impacts, Vulnerabilities and Design Considerations for
Future Climate Change. Canadian Council of Professional Engineers. Prepared by Paul
Steenhof, Ph.D. Ottawa, Canada, March 2008.
Weathering of Building Infrastructure and the Changing Climate: Adaptation Options.
Occasional Paper 11. Heather Auld, Joan Klassen, Neil Comer. Adaptation and Impacts
Research Division, Environment Canada. Toronto, Canada, 2007.

Engineering Vulnerability Assessment of the Main Statistics Canada Building to the Impacts of Climate Change
HOK Canada 51:128
Acknowledgements The case study team would like to thank the participation and contribution of the
following people:
Michael Murawnik, Property Manager, SNC-Lavalin Profac
Shelley LeBlanc, Property Manager, SNC-Lavalin Profac
Peter Morris, Property Manager, SNC-Lavalin Profac
Susan Kehoe, Director Quality & Performance Management, SNC-Lavalin Profac
Brian Drier, Maintenance Team Leader, SNC-Lavalin Profac
Brent Dagg, Maintenance Team Leader, SNC-Lavalin Profac
Brian Kyle, Acting Director, Innovations and Solutions Directorate, Public Works and
Government Services Canada
Edward Morofsky, Buildings Control Engineer Specialist, Public Works and Government
Services Canada
Ed Kutrowski, Portfolio Manager, Public Works and Government Services Canada

Engineering Vulnerability Assessment of the Main Statistics Canada Building to the Impacts of Climate Change
HOK Canada 52:128
Appendix A – Climate Change in Canada, climate scenarios for the public infrastructure vulnerability assessment: Ottawa Buildings case study

Ouranos, a research consortium on regional climatology and adaptation to climate change, is a joint initiative of the Government of Québec, Hydro-Québec, and the Meteorological Service of Canada with the participation of UQAM, Université Laval, McGill University, and the INRS. Valorisation Recherche Québec collaborated on the establishment and financing of Ouranos. The opinions and results presented in this publication are the sole responsibility of Ouranos and do not reflect in any way those of the aforementioned organizations.
CClliimmaattee cchhaannggee iinn CCaannaaddaa
CClliimmaattee sscceennaarriiooss ffoorr tthhee ppuubblliicc iinnffrraassttrruuccttuurree
vvuullnneerraabbiilliittyy aasssseessssmmeenntt
OOttttaawwaa BBuuiillddiinnggss ccaassee ssttuuddyy
Produced for the Public Infrastructure Engineering Vulnerability Committee (PIEVC)
By Ouranos
February 2008

Climate scenarios for PIEVC case studies 2 Ottawa (ON) – Buildings Call-up offer # 06 Ouranos, March 2008
Report prepared by:
Travis Logan Specialist – Climate change scenarios
Caroline Larrivée Specialist – Climate change and infrastructure
Diane Chaumont Coordinator – Climate Change Scenarios

Climate scenarios for PIEVC case studies 3 Ottawa (ON) – Buildings Call-up offer # 06 Ouranos, March 2008
Table of contents
1. Introduction ......................................................................................................................4 2. Methodology .....................................................................................................................5
2.1. Selection of weather stations .....................................................................................5 2.2. Choice of climate model .............................................................................................6 2.3. Climate model simulations and time periods ..............................................................8 2.4. Description of climate indices .....................................................................................8 2.5. Regionalization of climate indices ............................................................................12
3. Results ............................................................................................................................13 3.1 Climate scenarios for Temperature, Rain, Snow, Wind, Frost and Other indices ....13 3.2 Literature review for other climate indices ................................................................19
4 Conclusion......................................................................................................................22 5 References ......................................................................................................................23

Climate scenarios for PIEVC case studies 4 Ottawa (ON) – Buildings Call-up offer # 06 Ouranos, March 2008
1. Introduction
The Canadian Council of Professional Engineers set up the Public Infrastructure Engineering Vulnerability Committee (PIEVC) to examine the vulnerability of public infrastructure to climate change across the nation. A series of case studies serve to assess infrastructure vulnerability with the protocol proposed in Phase 1 of the PIEVC initiative and provide feedback on the state of different categories of infrastructure throughout the country. The current study is located in the Ottawa region (Ontario) and focuses on buildings.
The draft engineering protocol requires information on a variety of climatic elements to use as input towards estimating the vulnerability of infrastructure to climate change. Estimates of climatic elements enable quantitative estimations of the exposure of the infrastructure and help identify which changes in climatic conditions will have the most impact on its vulnerability.
In order to provide coherent and comparable results for all of the case studies, the vulnerability analyses must be based on plausible and equi-probable scenarios of climate change for the various regions of the country where the case studies are being conducted. Ouranos has been mandated to provide this data.
This report provides historical climate data and climate change scenarios for the Ottawa region on the vulnerability of a government building complex.
The data provided in this report is intended for the use of this case study only and should not be used for any other purpose because the results are specific to the characteristics of this project (location, timeframe, etc.).

Climate scenarios for PIEVC case studies 5 Ottawa (ON) – Buildings Call-up offer # 06 Ouranos, March 2008
2. Methodology
2.1. Selection of weather stations
Observed weather station data was obtained from Environment Canada’s national archives for the area of interest. Archived data were screened in order to select stations deemed to have a sufficiently long/complete record. Selection criteria included: a data series minimum length of 20 years, with less than 10% missing data and a final year being no earlier than 1995. A summary of the selected stations is presented in Table 2.1. The distribution of the stations within the study region is shown in Figure 2.1.
Table 2.1 Selected Environment Canada station data for variables of Temperature, Precipitation, Snow and Wind
(Selection was based on the criteria of a minimum record length of 20 years and a maximum of 10% missing data, and final year no earlier than 1995).
Climatic Variables
IDTMAX TMIN SNOWFALL RAINFALL
SNOW ON GROUND
WIND
6105976 yes yes yes yes yes no
6106000 yes yes yes yes yes yes
7030170 yes yes yes yes yes no
7031360 yes yes yes yes yes no
7034365 yes yes yes yes yes no

Climate scenarios for PIEVC case studies 6 Ottawa (ON) – Buildings Call-up offer # 06 Ouranos, March 2008
Figure 2.1 Canadian Regional Climate Model (CRCM4) grid and location of selected climate stations within the study area.
2.2. Choice of climate model
Impacts and adaptation projects should be based on projections of multiple climatic simulations in order to ensure that uncertainty of future climate projections is fully explored and incorporated in decision-making processes. Furthermore, in a regional context, such as the current PIEVC case study, downscaling of coarse resolution Global Circulation Model (GCM) output is desirable. Regional climate modeling employing the commonly termed approach of dynamical downscaling is one area of expertise covered by the Ouranos consortium and its research partners. Ouranos has contributed to the development of the Canadian Regional Climate Model (CRCM; Caya and Laprise, 1999) which, like other regional climate models (RCMs), uses principles of conservation on energy, mass and movement to generate temporal series of physically coherent climatic variables. Developed using the same physical principles as GCMs, RCMs concentrate on a portion of the globe and allow production of simulations at higher spatial resolution (approximately 45km for the CRCM compared to the several hundred seen with typical GCMs). Dynamical downscaling can have a particular advantage in simulating meso-scale weather events when compared with global models. As such, extreme events (particularly precipitation events) are typically better reproduced by regional modeling

Climate scenarios for PIEVC case studies 7 Ottawa (ON) – Buildings Call-up offer # 06 Ouranos, March 2008
efforts. Plummer et al. (2006) showed that general observed patterns of precipitation and temperature are relatively well reproduced over North America by the CRCM (version 3.7.1). In a study by Mailhot et al. (2007), regional comparison of CRCM precipitation output (again version 3.7.1) and corresponding intensity-duration-frequency curves showed favourable results versus observed values for southern Quebec. Mailhot et al.(2007) also state that there is good indication that CRCM results are statistically consistent with observations in terms of extreme rainfall estimates.
In general, the majority of CRCM simulations produced by Ouranos for impacts and adaptation purposes focus on the future period of 2041-2070 (termed horizon 2050). However, due to increasing demand for climatic scenarios for different future periods a small number of continuous simulations have been produced for the period 1961-2100. Two of these simulations have been selected for use in this case study. The simulations were produced using the CRCM, version 4.1.1 (Music and Caya, 2007; Brochu and Laprise, 2007). This selection was based on the advantages of having increased spatial resolution (compared to GCMs), the availability of continuous future daily series for the period 1961-2100 (the future horizons of interest in the case study being horizons 2020, 2050 and 2080). The choice was also due to the time constraints imposed for completion of the project.
NB - it is important to note that, due to the restricted number of simulations, caution is required in the interpretation of any modeling effort or analysis based on the scenarios provided. Use of only 2 simulations is sufficient for sensitivity analyses but lacks the robustness provided by the use of a large ensemble of simulations (recommended for decision-making or policy planning; see Conclusions - section 4 of this report).
The two simulations (CRCM 4.1.1 ACU; CRCM4.1.1 ADC) were carried out for a domain centred over Québec and covering an area of approximately 5,050 km by 4,000 km with a horizontal grid-size mesh of 45 km (true at 60 degrees north latitude) for the period 1961-2100. The simulations were driven at their boundaries by atmospheric fields taken from simulation output of the 4th and 5th members of the third generation coupled Canadian Global Climate Model (CGCM3) (Scinocca and MacFarlane, 2004). Both global and regional simulations were performed using the IPCC SRES A2 greenhouse gas (GHG) and aerosol projected evolution1. Figure 2.2 shows the simulated mean global temperature evolution according to the multiple GCM output grouped under various SRES scenarios. It is interesting to note that the emissions scenarios diverge very little before approximately 2050.
1 “The A2 storyline and scenario family describes a very heterogeneous world. The underlying
theme is self-reliance and preservation of local identities. Fertility patterns across regions converge very slowly, which results in continuously increasing population. Economic development is primarily regionally oriented and per capita economic growth and technological change more fragmented and slower than other storylines.” (Nakicenovic et al., 2000)

Climate scenarios for PIEVC case studies 8 Ottawa (ON) – Buildings Call-up offer # 06 Ouranos, March 2008
Figure 2.2 Mean global temperature evolution according to the multiple GCM output grouped under various SRES different scenarios.
2.3. Climate model simulations and time periods
A total of 9 CRCM grid cells, centred on the study area of interest (see figure 2.1), were selected for analysis. Corresponding grid cell data from the two CRCM 4.1.1 simulations described in section 2.2 (ACU and ADC) were extracted and used to calculate the climate indices listed in section 2.4. Future changes in indices were determined for three future periods or horizons: horizon 2020 (2011 – 2040); horizon 2050 (2041-2070); and horizon 2080 (2071-2100) with respect to the present period (1961-1990).
Changes (or deltas) in indices are calculated as either the difference or ratio between simulated future conditions and simulated present day conditions. Deltas can then be applied to calculated observed values either through addition (difference) or multiplication (ratio).
2.4. Description of climate indices
The choice and priority of climate indices was made in consultation with the client in terms of project needs as well as in terms of the limitations of the climate model simulations. Calculated indices were chosen from those having been known and used in the climate literature in the past.
Temperature indices
a. Monthly average maximum temperature (Monthly AVG TMAX): - average daily maximum temperature for a given month over the time period

Climate scenarios for PIEVC case studies 9 Ottawa (ON) – Buildings Call-up offer # 06 Ouranos, March 2008
b. Monthly average minimum temperature (Monthly AVG TMIN): - average daily minimum temperature for a given month over the time period
c. Average annual daily maximum temperature (annual_max):
IitannualI
i/)365max(max_
1
��
���
��
�
Calculated as the sum of it 365max for years i through I divided by the
number of years. Where it 365max is the highest daily temperature for a
given year i
d. Average annual daily minimum temperature (annual_min):
IitannualI
i/)365min(min_
1
��
���
��
�
Calculated as the sum of it 365min for years i through I divided by the
number of years. Where it 365min is the lowest daily temperature for a given
year i
Rain indices *Rain indices refer in all cases to precipitation in liquid form
a. Rainfall Frequency 6 hour (6h_frequency) - cutoff values of 5, 10 and 20 mm- frequency of events that are greater than cutoff(s)
b. Rainfall Frequency 1 day (1day_frequency) - cutoff values of 5, 10 and 20 mm- frequency of events that are greater than cutoff(s)
c. Yearly Max. Rainfall (annual_max_rain):
- average maximum yearly rainfall event for 1, 2 and 5-day periods
IixrainrainannualI
i/)365(max__
1
��
���
��
�
Calculated as the sum of ixrain365 for years i through I divided by the
number of years. Where ixrain365 is the highest rainfall amount for a given
year i summed over period of x days.
d. Average total annual / seasonal rainfall (Avg_total_rain) - average sum of liquid precip for the year and 4 seasons (DJF, MAM, JJA, SON)

Climate scenarios for PIEVC case studies 10 Ottawa (ON) – Buildings Call-up offer # 06 Ouranos, March 2008
e. Simple Daily Intensity Index (SDII) - mean rainfall amount per wet day (wet day > 1mm)
f. Drought : Average maximum annual dryspell length (Avg_max_dryspell - average yearly maximum number of consecutive ‘no rain days’ (< 1mm) for the season April 1 – Oct 31st
IdSPELLidryspellMAXAvgI
i/)(__
1
��
���
��
�
Calculated as the sum of dSPELLi for years i through I divided by the
number of years. Where dSPELLi is the maximum dryspell length for a given
year i.
g. Wetspell: Average maximum annual wetspell length (Avg_max_wetspell) - average yearly maximum number of consecutive ‘rain days’ (> 1 mm) for the season April 1 – Oct 31st
IwSPELLiwetspellMAXAvgI
i/)(__
1
��
���
��
�
Calculated as the sum of wSPELLi for years i through I divided by the
number of years. Where wSPELLi is the maximum wetspell length for a
given year i.
Snow indices *Snow index values in mm indicate values of Snow Water Equivalent (SWE) in all cases.**Observed snowfall values from EC stations had units of cm of snow and were converted to SWE using an assumed conversion ratio of 10:1 (i.e. 10 mm of fresh snow = 1mm SWE)
a. Snowfall Frequency 1 day (1day_frequency) - cutoff values of 5, 10 and 20 mm- frequency of events that are greater than cutoff(s)
b. Yearly Max. Snowfall (annual_max_snow): - average maximum yearly rainfall event for 1, 2 and 5-day periods
IixsnowsnowannualI
i/)365(max__
1
��
���
��
�
Calculated as the sum of ixsnow365 for years i through I divided by the
number of years. Where ixsnow365 is the highest rainfall amount for a given
year i summed over period of x days.

Climate scenarios for PIEVC case studies 11 Ottawa (ON) – Buildings Call-up offer # 06 Ouranos, March 2008
c. Average Total annual / seasonal rainfall (Avg_total) - average sum of solid precipitation for the year and 4 seasons (DJF, MAM, JJA, SON)
d. Simple Daily Intensity Index (SDII) - mean snowfall amount per wet day (wet day > 1mm)
e. Rain on snow events - occurrence defined as presence liquid precipitation > 1mm combined with presence of snow on ground (> 0) - cutoff values of 1, 5 and 10 mm- frequency of events that are greater that cutoff(s) over 1-day period
Wind indices *Wind index values in m/s indicate values of average wind speed over a 6h period. **NB – A 6hour timestep was used as this is the minimum timestep available for analysis for the CRCM4 data.
a. Monthly average 6h Windspeed (Monthly AVG WIND6h): - average 6h windspeed for a given month over the time period
b. Yearly Max. 6hour Wind (Avg annual MAX6h):
- average maximum yearly 6h Wind
IiwindhMAXannualAvgI
i/)365(6__
1
��
���
��
�
Calculated as the sum of iwind365 for years i through I divided by the
number of years. Where iwind365 is the highest 6h mean windspeed for a
given year i.
Frost indices
a. Frost Season (fr_seas_dys) - average annual max length in days that the 30 day moving average of daily average temperature remains consecutively below 0 degrees celsius
b. Freeze Thaw Cycles (frz_thw_freq) - frequency of days where tmax > 0 degrees C and tmin < 0 degrees C
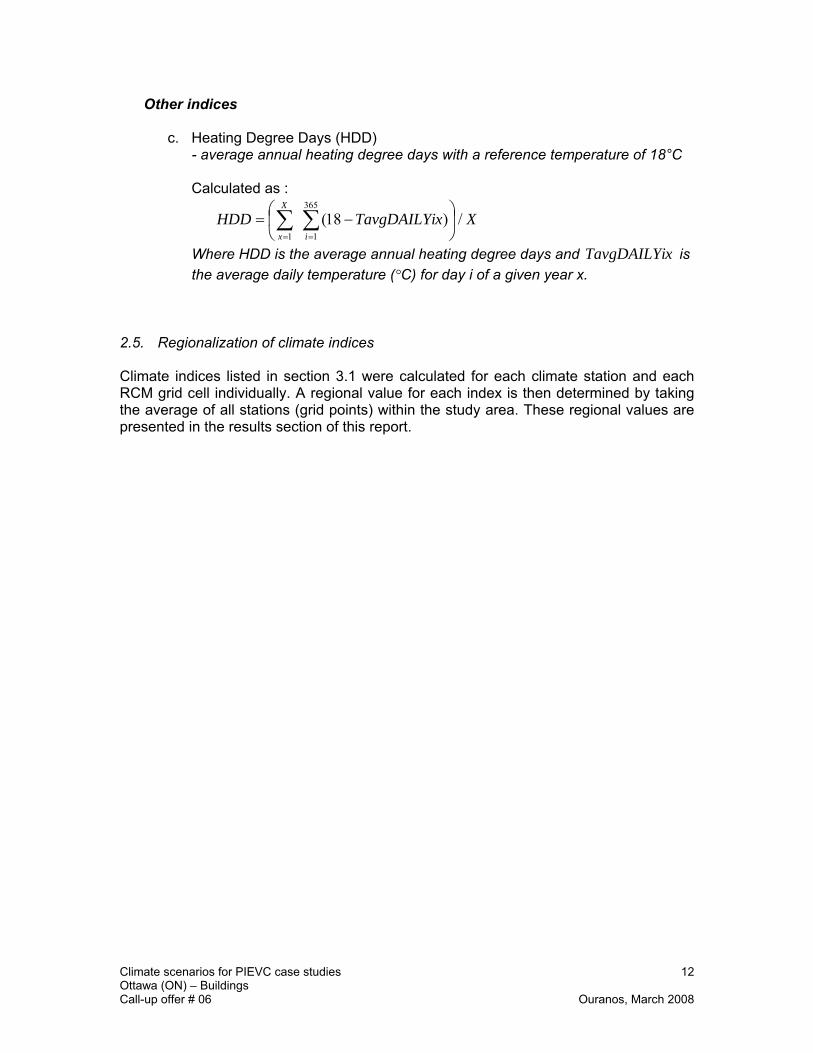
Climate scenarios for PIEVC case studies 12 Ottawa (ON) – Buildings Call-up offer # 06 Ouranos, March 2008
Other indices
c. Heating Degree Days (HDD) - average annual heating degree days with a reference temperature of 18°C
Calculated as :
XxTavgDAILYiHDDi
X
x/)18(
365
11
��
���
��
��
Where HDD is the average annual heating degree days and xTavgDAILYi is
the average daily temperature (°C) for day i of a given year x.
2.5. Regionalization of climate indices
Climate indices listed in section 3.1 were calculated for each climate station and each RCM grid cell individually. A regional value for each index is then determined by taking the average of all stations (grid points) within the study area. These regional values are presented in the results section of this report.

Climate scenarios for PIEVC case studies 13 Ottawa (ON) – Buildings Call-up offer # 06 Ouranos, March 2008
3. Results
3.1 Climate scenarios for Temperature, Rain, Snow, Wind, Frost and Other indices
TEMPERATURE indices
TEMPERATURE : Monthly AVG TMAX
Future Change ACU Future Change ADC
2020 2050 2080 2020 2050 2080 MonthObserved
(°C) (°C) (°C) (°C) (°C) (°C) (°C)
January -6.20 0.43 2.99 4.77 2.00 4.16 5.76
February -4.24 1.57 3.13 4.90 2.92 4.40 5.15
March 1.72 1.34 2.81 4.23 2.43 2.62 4.34
April 10.75 1.54 3.15 5.31 2.05 2.68 4.03
May 18.64 1.82 2.36 4.63 1.95 3.87 6.13
June 23.85 1.35 3.20 4.88 1.84 3.14 4.55
July 26.36 1.38 3.64 5.34 2.65 3.59 5.95
August 25.07 2.05 3.62 6.26 1.66 3.34 5.22
September 19.99 0.88 2.46 4.94 1.49 3.11 4.94
October 12.75 1.24 2.77 4.61 2.13 2.93 5.04
November 4.78 1.26 2.32 2.98 1.28 2.34 4.13
December -3.09 1.26 3.03 4.22 2.56 3.24 4.32
TEMPERATURE : Monthly AVG TMIN
Future Change ACU Future Change ADC
2020 2050 2080 2020 2050 2080 MonthObserved
(°C) (°C) (°C) (°C) (°C) (°C) (°C)
January -16.43 1.30 4.57 7.50 2.54 5.21 8.24
February -15.36 2.69 4.62 7.46 3.70 5.88 8.02
March -8.54 2.69 4.65 7.39 3.44 4.26 6.87
April -0.22 2.34 4.32 6.78 2.58 3.66 5.40
May 6.33 2.06 3.19 5.23 2.59 4.33 6.21
June 11.69 1.22 2.82 4.40 1.61 2.83 4.02
July 14.24 1.70 3.33 4.88 2.32 3.11 5.04
August 13.10 2.08 3.39 5.47 1.63 3.13 4.53
September 8.63 1.04 2.52 4.82 1.71 3.08 4.84
October 2.73 1.39 2.45 4.42 1.92 2.98 5.10
November -2.87 1.12 2.40 3.33 1.61 2.70 4.45
December -11.71 1.63 3.79 5.48 2.73 4.19 5.95

Climate scenarios for PIEVC case studies 14 Ottawa (ON) – Buildings Call-up offer # 06 Ouranos, March 2008
TEMPERATURE : annual max /annual min
Future Change ACU Future Change ADC
2020 2050 2080 2020 2050 2080 MonthObserved
(°C) (°C) (°C) (°C) (°C) (°C) (°C)
annual maximum 33.43 1.67 3.55 5.73 2.33 4.12 5.94
annual minimum -32.24 2.30 5.01 8.99 2.14 5.58 9.14
RAIN indices
RAIN : 6h_Frequency
Future Change ACU Future Change ADC Cutoff(mm)
Observed(frequency) 2020
(ratio)2050(ratio)
2080(ratio)
2020(ratio)
2050(ratio)
2080(ratio)
5 0.023 1.06 1.23 1.35 1.10 1.19 1.37
10 0.009 1.21 1.58 1.74 1.13 1.26 1.69
20 0.002 1.55 2.13 2.90 1.24 1.67 2.73
RAIN : 1day_Frequency
Future Change ACU Future Change ADC
2020 2050 2080 2020 2050 2080 Cutoff(mm)
Observed(frequency)
(ratio) (ratio) (ratio) (ratio) (ratio) (ratio)
5 0.12 1.06 1.16 1.20 1.07 1.15 1.23
10 0.06 1.06 1.21 1.31 1.09 1.18 1.37
20 0.02 1.18 1.57 1.76 1.20 1.27 1.77
RAIN: Avg_Max_rain
Future Change ACU Future Change ADC
2020 2050 2080 2020 2050 2080 Period(days)
Observed(mm)
(ratio) (ratio) (ratio) (ratio) (ratio) (ratio)
1 46.66 1.08 1.14 1.18 1.02 1.03 1.15
2 55.52 0.97 1.06 1.10 1.03 1.07 1.20
5 72.41 1.00 1.06 1.09 1.01 1.05 1.15
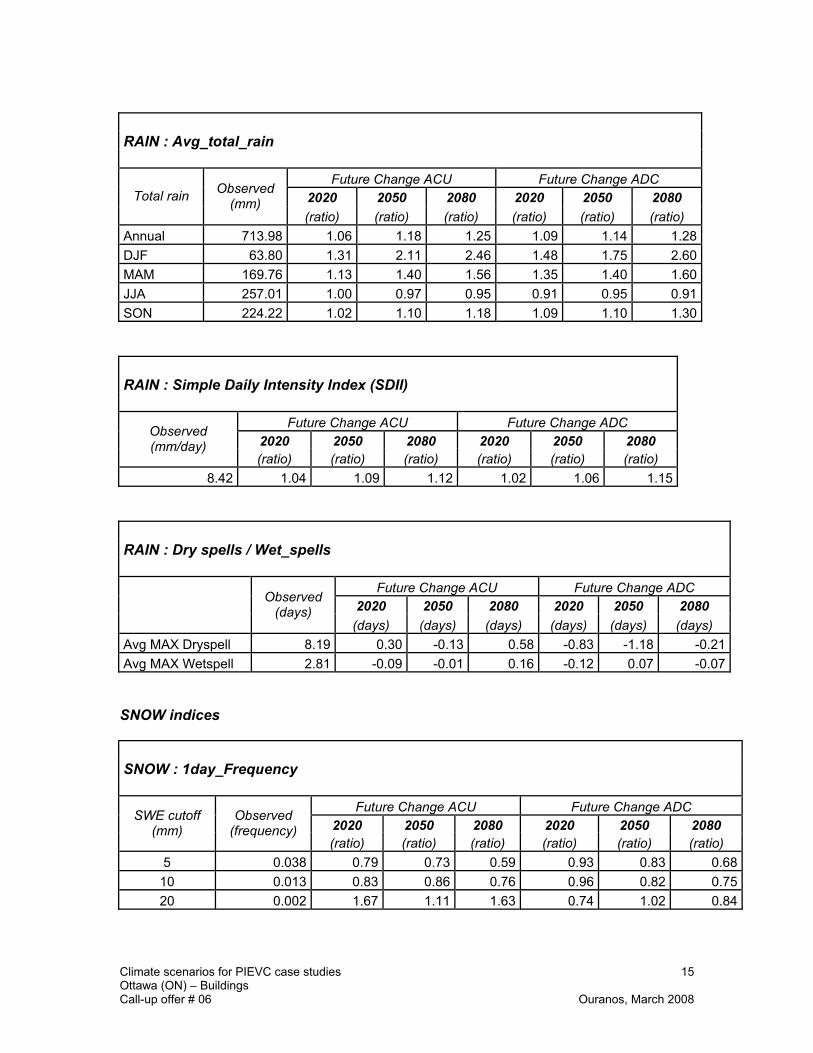
Climate scenarios for PIEVC case studies 15 Ottawa (ON) – Buildings Call-up offer # 06 Ouranos, March 2008
RAIN : Avg_total_rain
Future Change ACU Future Change ADC
2020 2050 2080 2020 2050 2080 Total rain Observed
(mm) (ratio) (ratio) (ratio) (ratio) (ratio) (ratio)
Annual 713.98 1.06 1.18 1.25 1.09 1.14 1.28
DJF 63.80 1.31 2.11 2.46 1.48 1.75 2.60
MAM 169.76 1.13 1.40 1.56 1.35 1.40 1.60
JJA 257.01 1.00 0.97 0.95 0.91 0.95 0.91
SON 224.22 1.02 1.10 1.18 1.09 1.10 1.30
RAIN : Simple Daily Intensity Index (SDII)
Future Change ACU Future Change ADC
2020 2050 2080 2020 2050 2080 Observed(mm/day)
(ratio) (ratio) (ratio) (ratio) (ratio) (ratio)
8.42 1.04 1.09 1.12 1.02 1.06 1.15
RAIN : Dry spells / Wet_spells
Future Change ACU Future Change ADC
2020 2050 2080 2020 2050 2080 Observed
(days) (days) (days) (days) (days) (days) (days)
Avg MAX Dryspell 8.19 0.30 -0.13 0.58 -0.83 -1.18 -0.21
Avg MAX Wetspell 2.81 -0.09 -0.01 0.16 -0.12 0.07 -0.07
SNOW indices
SNOW : 1day_Frequency
Future Change ACU Future Change ADC
2020 2050 2080 2020 2050 2080 SWE cutoff
(mm) Observed
(frequency) (ratio) (ratio) (ratio) (ratio) (ratio) (ratio)
5 0.038 0.79 0.73 0.59 0.93 0.83 0.68
10 0.013 0.83 0.86 0.76 0.96 0.82 0.75
20 0.002 1.67 1.11 1.63 0.74 1.02 0.84

Climate scenarios for PIEVC case studies 16 Ottawa (ON) – Buildings Call-up offer # 06 Ouranos, March 2008
SNOW`: Annual_Max_snow
Future Change ACU Future Change ADC
2020 2050 2080 2020 2050 2080 Period(days)
Observed(mm)
(ratio) (ratio) (ratio) (ratio) (ratio) (ratio)
1 21.21 1.07 1.02 1.09 0.86 1.00 0.87
2 25.95 1.04 1.04 1.07 0.88 1.01 0.88
5 33.07 1.03 1.05 1.03 0.87 0.97 0.83
SNOW : Avg_total_snow
Future Change ACU Future Change ADC
2020 2050 2080 2020 2050 2080 Total snowfall
(SWE)Observed
(mm) (ratio) (ratio) (ratio) (ratio) (ratio) (ratio)
Annual 208.69 0.89 0.78 0.67 0.90 0.84 0.71
DJF 146.02 0.90 0.81 0.78 0.95 0.97 0.85
MAM 41.46 0.85 0.77 0.45 0.87 0.73 0.57
JJA 0.00 0.00 0.00 0.00 0.00 0.00 0.00
SON 20.64 0.86 0.60 0.51 0.69 0.40 0.32
SNOW : Simple Daily Intensity Index (SDII)
Future Change ACU Future Change ADC
2020 2050 2080 2020 2050 2080 Observed(mm/day)
(ratio) (ratio) (ratio) (ratio) (ratio) (ratio)
5.39 0.99 0.99 1.03 1.00 1.01 1.02
SNOW : Rain_on_Snow_events
Future Change ACU Future Change ADC
2020 2050 2080 2020 2050 2080 Rain cutoff
(mm) Observed
(frequency) (ratio) (ratio) (ratio) (ratio) (ratio) (ratio)
1 0.030 0.95 1.05 1.04 1.05 0.98 1.08
5 0.015 1.08 1.23 1.17 1.08 1.11 1.26
10 0.007 1.08 1.33 1.23 1.23 1.18 1.61

Climate scenarios for PIEVC case studies 17 Ottawa (ON) – Buildings Call-up offer # 06 Ouranos, March 2008
WIND indices
WIND : Monthly AVG WIND6h
Future Change ACU Future Change ADC
2020 2050 2080 2020 2050 2080 MonthObserved
(km/h) (ratio) (ratio) (ratio) (ratio) (ratio) (ratio)
January 15.38 0.97 1.04 1.08 1.02 1.08 1.11
February 15.24 0.99 0.95 1.01 1.05 1.03 1.06
March 15.57 0.99 1.04 1.04 1.08 1.05 1.06
April 15.94 1.03 1.07 1.11 1.00 1.03 1.08
May 13.93 1.02 1.01 1.05 1.06 1.06 1.04
June 12.48 0.98 0.99 0.96 0.99 0.96 0.98
July 11.33 0.96 0.95 0.93 1.00 1.00 0.99
August 10.92 0.96 0.91 0.92 1.00 0.97 0.94
September 12.06 0.98 0.98 0.94 0.96 0.95 0.94
October 13.35 0.97 1.01 0.98 0.97 1.00 0.98
November 14.58 1.03 1.04 1.06 1.02 0.99 1.06
December 14.76 0.97 1.03 1.04 1.04 0.97 1.02
WIND : AVG Annual MAX WIND6h
Future Change ACU Future Change ADC
2020 2050 2080 2020 2050 2080 Observed(km/h) (ratio) (ratio) (ratio) (ratio) (ratio) (ratio)
48.03 0.96 0.99 0.97 1.01 0.98 0.96
FROST indices
FROST SEASON LENGTH : fr_seas_dys
Future Change ACU Future Change ADC
2020 2050 2080 2020 2050 2080 Observed
(days) (days) (days) (days) (days) (days) (days)
125.14 -16.66 -38.28 -61.29 -24.77 -28.58 -51.59

Climate scenarios for PIEVC case studies 18 Ottawa (ON) – Buildings Call-up offer # 06 Ouranos, March 2008
FREEZE THAW EVENTS: fr_thw_freq
Future Change ACU Future Change ADC
2020 2050 2080 2020 2050 2080 Observed
(frequency) (ratio) (ratio) (ratio) (ratio) (ratio) (ratio)
0.21 0.94 0.92 0.86 0.98 0.95 0.87
OTHER indices
HEATING DEGREE DAYS: HDD
Future Change ACU Future Change ADC
2020 2050 2080 2020 2050 2080 Observed
(HDD) (HDD) (HDD) (HDD) (HDD) (HDD) (HDD)
4376.73 -567 -1178 -1889 -810 -1287 -1950

Climate scenarios for PIEVC case studies 19 Ottawa (ON) – Buildings Call-up offer # 06 Ouranos, March 2008
3.2 Literature review for other climate indices
While climate scenarios for temperature changes and changes in precipitation patterns are quite reliable, there is far greater uncertainty linked to projections for relatively small-scale or very localized atmospheric phenomena. Most authors agree that GHG concentrations do have an effect on these events; however, it remains difficult to find reliable projections that indicate future trends of intensity, direction or frequency for events such as storms, intense winds or other extreme events (Maarten, 2006). Climate scenarios are therefore difficult to produce for certain very localized events (wind gusts, tornadoes, thunderstorms) or events where processes are complex and depend on a number of factors (hurricanes, ice storms). The observed data is insufficient to validate the model outputs for these events.
Moreover, any seemingly apparent trend stemming from the observed data must be interpreted carefully as an increase could result from a combination of factors such as:
- increased weather station coverage - improved quality of the data collected - changes in land use (and corresponding increases in damage claims).
Consequently, among the list of climate elements that were requested for the Ottawa case study, it is not possible to provide sound numerical climate scenarios that could be used for the infrastructure vulnerability assessment. The following is the list of climate variables that fall under this category with a review of the literature explaining possible changes.
WIND (hurricanes, tornadoes, thunderstorms, winds gusts)
According to the Fourth Assessment Report of the Intergovernmental Panel on Climate Change (IPCC, 2007), it is “more likely than not” that the observed trend of hurricane intensification since the 1970s is linked to human-induced greenhouse gas emissions. The report also claims that “it is likely that future tropical cyclones (typhoons and hurricanes) will become more intense, with larger peak wind speeds and more heavy precipitation associated with ongoing increases of tropical sea surface temperatures.” However, there is no clear trend in terms of the frequency of tropical cyclones. Although some authors claim that there has been an increase in the frequency of hurricanes, namely in the North Atlantic (Holland et al. 2007, Webster et al. 2005), there remains much debate as to the possible mechanisms explaining this.
Results from some model simulations suggest that the atmosphere over mid-latitude land areas could become more unstable in the future, suggesting that an increase in convective activity is quite probable (Balling et al. 2003). However, researchers have been unable to identify significant increases in overall severe storm activity as measured in the magnitude and/or frequency of thunderstorms, hail events, tornadoes, hurricanes, and winter storm activity in North America. Increasing trends in damages caused by these events seem to be more closely linked to changes in demography and land use (Balling et al. 2003)

Climate scenarios for PIEVC case studies 20 Ottawa (ON) – Buildings Call-up offer # 06 Ouranos, March 2008
ICE (ice build-up, ice accretion, freezing rain)
Ice build-up, caused by melting blocks of ice that accumulate and obstruct water ways or pile up around infrastructure components, can be triggered by: - rapid melt events when there is a significant accumulation of snow and ice - heavy precipitation events in spring when there is still a cover of ice - heavy rain on snow events
Warmer average temperatures throughout the year (see climate scenarios in section 3.1) suggest that the length and severity of the cold season will decrease. However, depending on precipitation patterns, this could mean either an increase or decrease in river or lake ice build-up, because of the nature of the precipitation as well as the intensity of the events that cause ice build-up.
Very few studies have been conducted on the possible impacts of climate change on freezing rain events and ice storms. A study conducted over northern and eastern Ontario (Cheng et al. 2007) suggests that freezing rain events could move further north as the boundary between snowfall and rainfall shifts northward. However, as the temperatures increase in the Fall and Spring (beginning and end of the winter season), freezing rain events could decrease since precipitation falling as freezing rain could fall as liquid rain under warmer conditions. At present, it remains unknown how climate change could affect the frequency and severity of freezing rain events and ice storms (Irland, 2000, Cheng et al. 2007).
SNOW (rapid melt events)
Variations and trends in temperature significantly influence snow covered areas, namely by determining whether precipitation falls as snow or rain and determining snowmelt (IPCC, 2007). However rapid snowmelt events are difficult to predict because they depend on a number of factors, including: - temperature and precipitation conditions at the time of the melt - total amount of snow on the ground
Because these events occur as the result of a combination of factors and can be very localized (in both time and space), it is difficult to establish reliable scenarios of change in future climate conditions. Moreover, the inherent variability of the climate makes it difficult to predict whether this type of event will occur more frequently or more intensely, as a change in only one of the determining factors can determine whether rapid snowmelt will happen or not.
Nevertheless, it is recognized that changes in average temperature will impact precipitation and wind patterns and influence the change in probability distributions of many atmospheric processes. Indeed, a warmer atmosphere increases the chances for convective activity. This is already the case in warmer regions of the world during warmer seasons (Balling et al. 2003). This will impact the frequency, intensity, duration and direction of extreme events such as tornadoes, hailstorms, thunderstorms. However, it remains difficult to determine quantitatively precisely how these events will change.

Climate scenarios for PIEVC case studies 21 Ottawa (ON) – Buildings Call-up offer # 06 Ouranos, March 2008
Climate change will also influence the variability of the climate, including inter-annual events such as El Nino. However, climate scenarios on this type of climate phenomenon or event have not yet been developed.
To assess the vulnerability of infrastructure to changes in these parameters where numerical scenarios are not reliable, it can be useful to conduct “what if” scenarios, using a plausible factor of change to add to historical trend data and local knowledge of climate events. These sensitivity analyses help to determine at what threshold the infrastructure can become vulnerable to climatic events and estimate the likelihood of such events happening based on the physics of climate change and on local observations of climate events.

Climate scenarios for PIEVC case studies 22 Ottawa (ON) – Buildings Call-up offer # 06 Ouranos, March 2008
4 Conclusion
The case studies carried out within the PIEVC initiative to assess infrastructure vulnerability to climate change using the protocol developed in Phase 1 of the initiative require plausible and reliable climate scenarios based on similar methodologies in order to compare the relative vulnerability of various infrastructures throughout the country.
This report provides historical climate data and climate change scenarios for the Ottawa region case study on the vulnerability of a government building complex.
Prudence is required in the interpretation of analyses based on the future scenarios provided. Climate scenario production was limited to the use of only 2 simulations.Furthermore, these simulations were produced by the same regional climate model(CRCM 4.1.1), driven by two runs of the same GCM (CGCM3) and the same GHG emissions scenario (SRES A2). In short, the predicted changes cover only a small portion of the spectrum or envelope of changes that would be produced via the use of multiple SRES scenarios and multiple driving models (or even multiple RCMs). As such, it is recommended that any decision or policy making activities be based on an expanded version of the present case study.
At present, large ensemble analyses using strictly RCM output are not possible over North America. However, Ouranos continues to produce RCM simulations, and is also actively involved in the North American Regional Climate Change Assessment Program (NARCCAP http://www.narccap.ucar.edu/), an international program that will serve the high resolution climate scenario needs of the United States, Canada, and northern Mexico, using regional climate model, coupled global climate model, and time-slice experiments. The needs of the PIEVC (i.e. simulations with a fine spatial resolution, and inclusion of a number of extreme indices) would be best addressed using an ensemble of multiple RCM driven by multiple pilot GCMs such as will be produced with NARCCAP project This approach would allow a large inclusion of possible futures and thus better cover the envelope of uncertainty. Further research continues to be needed in climate modeling and climate scenarios in order to provide reliable data for climate change vulnerability and impacts assessments.

Climate scenarios for PIEVC case studies 23 Ottawa (ON) – Buildings Call-up offer # 06 Ouranos, March 2008
5 References
Balling, R. C. and R. S. Cerveny (2003) “Compilation and Discussion of Trends in Severe Storms in the United States: Popular Perception v. Climate Reality”, Natural Hazards 29(2), pp.103 - 112.
Brochu, R., and R. Laprise. 2007. Surface Water and Energy Budgets over the Mississippi and Columbia River Basins as Simulated by Two Generations of the Canadian Regional Climate Model. Atmos.-Ocean, 45(1), 19-35.
Caya, D. and R. Laprise (1999) “A semi-implicit semi-lagrangian regional climate model: The Canadian RCM”, Monthly Weather Review, 127(3), pp.341-362.
Cheng, C.S., H. Auld, G. Li, J. Klaassen, Q. Li (2007) “Possible impacts of freezing rain in south central Canada using downscaled future climate scenarios”, Natural Hazards and Earth Systems Science, 7, pp.71-87.
Emanuel, K. (2005) “Increasing destructiveness of tropical cyclones over the past 30 years” Nature v. 436.
Holland, G.J., P.J. Webster (2007) “Heightened tropical cyclone activity in the North Atlantic: natural variability or climate trend?”, Philosphical Transactions of the Royal Society A., Published online.
Intergovernmental Panel on Climate Change (2007) Climate Change 2007: The Physical Science Basis. Contribution of Working Group I to the Fourth Assessment Report of the Intergovernmental Panel on Climate Change.
Irland, L. C. (2000) “Ice storms and forest impacts”, Science of the Total Environment 262(3), pp.231-242.
Knuston, T.R., R.E. Tuleya (2004) “Impact of CO2-Induced Warming on Simulated Hurricane Intensity and Precipitation: Sensitivity to the Choice of Climate Model and Convective Parameterization”, Journal of Climate, Vol. 17(18), pp.3477-3495.
Mailhot, A., S. Duchesne, D. Caya et G. Talbot (2007). Assessment of future change in Intensity-Duration-Frequency (IDF) curves for Southern Quebec using the Canadian Regional Climate Model (CRCM). Journal of Hydrology, 347(1-2): 197-210.
Music, B., and D. Caya (2007) “Evaluation of the Hydrological Cycle over the Mississippi River Basin as Simulated by the Canadian Regional Climate Model (CRCM)”, Journal of Hydrometeorology, 8(5), 969-988.
Nakicenovic, N., J. Alcamo, G. Davis, B. de Vries, J. Fenhann, S. Gaffin, K. Gregory, A. Grübler, T.Y. Jung, T. Kram, E.L. La Rovere, L. Michaelis, S. Mori, T. Morita, W. Pepper, H. Pitcher, L. Price, K. Raihi, A. Roehrl, H.-H. Rogner, A. Sankovski, M. Schlesinger, P. Shukla, S. Smith, R. Swart, S. van Rooijen, N. Victor et Z. Dadi (2000) Emissions Scenarios. Special report by Working Group III of the Intergovernmental Panel on Climate Change, Cambridge University Press, Cambridge, 599p.
Plummer, D.A., D. Caya, A. Frigon, H. Côté, M. Giguère, D. Paquin, S. Biner, R. Harvey, and R. de Elia, (2006) “Climate and Climate Change over North America as Simulated by the Canadian RCM”, Journal of Climate, vol.19(13), pp.3112-3132.
Scinocca, J. F., N.A. McFarlane (2004) “The Variability of Modeled Tropical Precipitation”, Journal of Atmospheric Sciences, 61(16), pp.1993-2015.
Climate scenarios for PIEVC case studies 24 Ottawa (ON) – Buildings Call-up offer # 06 Ouranos, March 2008
Van Aalst, Maarten K. (2006) “The impacts of climate change on the risk of natural disasters”, Disasters, v.30(1), pp.5–18.
Webster, P.J., G.J. Holland, J.A. Curry, and H.-R. Chang (2005) “Changes in Tropical Cyclone Number, Duration, and Intensity in a Warming Environment”, Science, v.309(5742), pp.1844–1846.
Ouranos, a research consortium on regional climatology and adaptation to climate change, is a joint initiative of the Government of Québec, Hydro-Québec, and the Meteorological Service of Canada with the participation of UQAM, Université Laval, McGill University, and the INRS. Valorisation Recherche Québec collaborated on the establishment and financing of Ouranos. The opinions and results presented in this publication are the sole responsibility of Ouranos and do not reflect in any way those of the aforementioned organizations.
AADDDDEENNDDUUMM TTOO
CClliimmaattee cchhaannggee iinn CCaannaaddaa
CClliimmaattee sscceennaarriiooss ffoorr tthhee ppuubblliicc iinnffrraassttrruuccttuurree
vvuullnneerraabbiilliittyy aasssseessssmmeenntt
OOttttaawwaa BBuuiillddiinngg ccaassee ssttuuddyy
Produced for the Public Infrastructure Engineering Vulnerability Committee (PIEVC)
By Ouranos
April 2008

ADDENDUM to climate scenarios report
Climate scenarios for PIEVC case studies Addendum-1 Ottawa (ON) – Buildings Call-up offer # 06 Ouranos, April 2008
Scenarios for relative humidity and solar radiation were considered important for the vulnerability assessment of buildings in the Ottawa case study. This addendum report provides scenarios of change for these two variables developed using the same methodology described in the final report for climate scenarios.
Other indices
a. Monthly average relative humidity (Monthly AVG RH) - Average daily relative humidity for a given month over the time period
b. Monthly average solar radiation (Monthly AVG SR) - Average daily solar radiation (direct and diffuse received on a horizontal surface) for a given month over the time period
c. Cooling Degree Days (CDD)
- Average annual cooling degree days with a reference temperature of 18°C . Calculated as :
if TavgDAILYix > 18 XxTavgDAILYiHDDi
X
x/)18(
365
11
��
���
��
��
Where CDD is the average annual cooling degree days and TavgDAILYix is the average daily temperature ( °C) for day i of a given year x. NB – calculated only for days when TavgDAILYix is greater than 18 degrees C.
HUMIDITY indices
RELATIVE HUMIDITY : Monthly AVG RH
Future Change ACU Future Change ADC
2020 2050 2080 2020 2050 2080 MonthObserved
(%) (ratio) (ratio) (ratio) (ratio) (ratio) (ratio)
January 70 1.01 1.00 1.02 1.02 1.02 1.02
February 67 1.01 0.99 1.00 1.02 1.01 1.01
March 65.5 1.01 1.02 1.03 1.01 1.04 1.03
April 61.5 1.02 1.07 1.11 1.07 1.08 1.11
May 62 1.01 1.04 1.03 1.02 1.02 1.02
June 65.5 1.00 1.00 1.00 0.99 0.99 0.99
July 67.5 1.00 0.99 0.98 0.99 0.98 0.96
August 71 1.00 0.99 0.97 1.00 0.99 0.97
September 73.5 1.01 1.00 0.99 1.00 0.99 0.99
October 72 1.02 1.01 1.02 1.01 1.02 1.03
November 76 1.00 1.01 1.02 1.01 1.02 1.03
December 76 1.01 1.01 1.02 1.03 1.04 1.03

ADDENDUM to climate scenarios report
Climate scenarios for PIEVC case studies Addendum-1 Ottawa (ON) – Buildings Call-up offer # 06 Ouranos, April 2008
SOLAR RADIATON indices
SOLAR RADIATION : Monthly AVG SR
Future Change ACU Future Change ADC
2020 2050 2080 2020 2050 2080 MonthObserved
(MJ/m2/day)
(ratio) (ratio) (ratio) (ratio) (ratio) (ratio)
January 5.51 0.98 0.926 in progress 0.975 0.93 in progress
February 9.29 0.95 0.997 in progress 0.954 1.00 in progress
March 13.10 0.96 0.95 in progress 0.96 0.95 in progress
April 16.70 1.00 0.95 in progress 1.00 0.95 in progress
May 19.30 0.99 0.94 in progress 0.99 0.94 in progress
June 21.38 1.02 1.03 in progress 1.02 1.03 in progress
July 21.10 0.99 1.04 in progress 0.99 1.04 in progress
August 17.71 1.02 1.05 in progress 1.02 1.05 in progress
September 12.89 1.00 1.04 in progress 1.00 1.04 in progress
October 8.39 0.98 1.03 in progress 0.98 1.03 in progress
November 4.72 1.02 0.97 in progress 1.02 0.97 in progress
December 3.89 0.96 0.94 in progress 0.96 0.94 in progress
COOLING DEGREE DAYS indices
COOLING DEGREE DAYS: CDD
Future Change ACU Future Change ADC
2020 2050 2080 2020 2050 2080 Observed
(CDD) (CDD) (CDD) (CDD) (CDD) (CDD) (CDD)
234 95 216 397 121 217 386

Engineering Vulnerability Assessment of the Main Statistics Canada Building to the Impacts of Climate Change
HOK Canada 53:128
Appendix B – Completed Worksheets and Other Working Material
Worksheet 1 Project Definition – Main Statistics Canada Building
4.1.1 Identify Infrastructure which is to be evaluated for climate change vulnerability
Choose Infrastructure: Main Statistics Canada Building #3 150 Promenade Tunney's Pasture Driveway Ottawa, Ontario Canada
General Description: The Main Stats Building (Building #3) is located in Tunney’s Pasture, a 46 hectare federal government campus, in the western sector of the City of Ottawa. Bounded by the Ottawa River Parkway (north), Parkdale Avenue (east), Scott Street (south) and Northwestern Avenue (west). This location offers excellent views of the Ottawa River and Gatineau Hills, as well as convenient access to the Ottawa River Parkway. Within Tunney’s Pasture, the roads and servicing infrastructure are owned and maintained by the federal government and connected to off-site city owned services. The asset comprises 39,445.9 m2 rentable area and was built in 1952. In 2005 the building was designated as a FHBRO heritage building. It is a two-storey building with a full basement and partial third and fourth floors. Overall the asset is considered to be in “average” condition and is reasonably functional. It has received periodic upgrades and refurbishments over the years and in recent years various tenant and common areas have been upgraded to meet current accommodation standards. The building is occupied primarily by Statistics Canada and is part of a larger node for that tenant which includes the adjacent (and internally linked) Jean Talon and R.H. Coats buildings. Other building occupants include Health Canada, BLJC and PWGSC. The building serves many functions that include office space, some storage, class/training rooms, a daycare centre, cafeteria and gym.
Additional background & detailed information sources
Links and references
Asset Management Plan (September 2003)
Building Condition Report (December 2007)
4.1.2 Identify Climate Factors of Interest
State general Climate factors to be considered
Temperature – average monthly, annual max and min
Rain – average total rain, average seasonal rain
Rain - frequency of 6h and 1 day rain events
Snow – average total snow
Rain on Snow – frequency of events
Frost Season – length of frost season

Engineering Vulnerability Assessment of the Main Statistics Canada Building to the Impacts of Climate Change
HOK Canada 54:128
Heating Degree Days – average annual number of HDD, and days above 18 degrees Celsuis
Humidity – average monthly, average seasonal
Ground water, water table
Flood events - from Ottawa River
Additional background & detailed information sources
Ouranos – Climate Scenarios Report (February 2008)
4.1.3 Identify the Time Frame
Three separate time horizons were used for assessing the climate change vulnerability of this building: horizon 2020 (2011-2040 in the model); horizon 2050 (2041-2070 in the model); and horizon 2080 (2071-2100 in the model). Baseline climate data with respect to the present period (1961-1990) was developed as follows: Observed weather station data was obtained from Environment Canada’s national archives for the area of interest. Archived data were screened in order to select stations deemed to have a sufficiently long/complete record. Selection criteria included: a data series minimum length of 20 years, with less than 10% missing data and a final year being no earlier than 1995.
Notes: The following climate factors where not covered by the Ouranos Climate Scenarios Report: Humidity – average monthly, average seasonal Ground water, water table Flood events - from Ottawa River However, the other climate factors were deemed to have an impact on these
4.1.4 Identify the Geography
Building: The Main Statistics Canada Building is situated in Tunney’s Pasture, a Government of Canada campus of federal buildings that has been planned and landscaped with generous green space between buildings. It is flanked on the North by the Jean Talon Building and on the South by the R.H. Coats Building, both occupied by Statistics Canada. The building foundation is believed to be sitting on limestone bedrock. At its closest point, the Ottawa River is approximately 610 metres to the NNW of the building. The Ottawa River Parkway (vehicle roadway) separates the Tunney’s Pasture campus and partially manicured/maintained public green space along the Ottawa River. The site geography is flat although other, more recent buildings (1970s/80s) seem to be situated higher than the Main Statistics Canada Building. Geographic coverage of climate change scenarios: The future climate change scenarios were developed based on a spatial area as follows: Two modelling simulations (CRCM 4.1.1 ACU; CRCM4.1.1 ADC) were carried out for a domain centred over Québec and covering an area of approximately 5,050 km by 4,000 km with a horizontal grid-size mesh of 45 km (true at 60 degrees north latitude) for the periods 1961-2100. Greater spatial resolution is not currently available in the climate change models.

Engineering Vulnerability Assessment of the Main Statistics Canada Building to the Impacts of Climate Change
HOK Canada 55:128
Notes:
4.1.5 Identify the Jurisdictional Considerations
Notes:
The following Building compliance acts/regulations are applicable to the Main Statistics Canada Buiding: ASHRAE Standard 55-1981, Thermal Environmental Conditions for Human Occupancy ASHRAE Standard 62-2001n, Ventilation for Acceptable Indoor Air Quality Canada Labour Code – Part II (Labour Code) Canada Occupational Safety and Health Regulations National Building Code of Canada (2005) National Fire Code of Canada (2005)
The following federal environmental Acts apply to all buildings on the Tunney’s Pasture site including the Main Statistics Canada Building: Federal Real Property Act, brought into force on September 15, 1992. Canadian Environmental Assessment Act (CEAA), January 19, 1995. Canadian Environmental Protection Act (CEPA), 1988 (currently under review) Auditor General Act Fisheries Act Migratory Birds Convention Act
No provincial acts or regulations apply to federal real property including this building.
4.1.6 Site Visit
Summary of findings from interviews
4
Summer months have extended and more extreme periods of hot, humid weather.
Due to Space Optimization there is an increased occupancy load well beyond what the buildings were designed for.
During the summer, energy conservation measures are implemented building wide. These include reduced lighting levels, slight increases in air temperature (i.e. chilled water temperature was typically 4 degrees now is 7 degrees to conserve energy).
Power outages and energy reliability are of concern. During the summer months this is likely to happen once per year.
Has observed changes in vegetation, for example some trees lose leaves earlier – end of August.
Soil settlement is due to truck drivers who access two courtyard areas that is causing soil settlement.
Roof top condensing units are used to keep the LAN Room cool. 45% RH is maintained in this space.
Non climate change related - Acid content in rainwater is affecting material durability like metal siding.
Proximity of Transit Way to R. H. Coats and in particular air intakes can affect air quality.
4 Notes from interviews shall be kept by Consultant for future reference. There will be no need to append
these documents to the Worksheets.

Engineering Vulnerability Assessment of the Main Statistics Canada Building to the Impacts of Climate Change
HOK Canada 56:128
Masonry mortar has very course sand, as such is being affected by acid rain. No weeping holes exist therefore freeze thaw cycles affect the building envelop.
Water quality is being affected by heavy rain or quick thaw which causes lots of turbulence in Ottawa River such that it affects taste and smell. Had an incident in 2002.
NCC is responsible for snow removal at Tunney’s Pasture.
Combined sanitary and storm water systems due to building vintage. In heavy storms you can get flooding. As well, because the road elevation is higher than the building, storm water tends to run towards the building. The building has storm water related pumps to deal with this problem.
Wind tends to come from the river to Tunneys Pasture. Generally the campus is very windy.
4th floor Computer / LAN Room is critical to the operation. This room is kept at 45% RH throughout the year. Power
outages cripple operations and regularly happen about once per year. It is feared to be an increasing problem due to general power reliability.
Ultra Violet light is believed to affect materials and their durability
Key Observations
Building operator has very good experience with the site and is knowledgeable. He is keen on being Green / Sustainable which helps with our work and being successful.
Wind affects the snow drift patterns at the building envelop and along the parapet such that snow needs to be moved so as to not cause damage.
Water staining was observed at the window sill and lintel (precast and stone) which is affecting the integrity of these systems.
Areas for follow-up in subsequent steps
� Observed extended periods and more extreme periods of hot, humid weather in summer will be noted and may be factored into the probability/severity rating for some building components.
� Increased occupancy load well beyond what the buildings were designed may be factored in Step 3. � The potentially increased load on the heating and cooling system to maintain the humidity and
temperature levels for the LAN/computer room will try to be assessed in subsequent steps. � Increased freeze thaw cycles and its effect on masonry mortar will try to be assessed in subsequent steps. � Soil settling combined with potentially increased rain/snow may increase vulnerability to manage
melt/storm water – to be noted in subsequent steps.
4.1.7 Assess Data Sufficiency
State Assumptions proposed for the assessment, if any
Rationale
Building data is assumed to be accurate. Building condition reports are current to Dec. 2007.
Climate baseline and climate change projections for temperature, rain, snow, frost season and heating degree days are assumed to be best available.
Ouranos used best available data and models in producing baseline and future estimates.
Historical data on humidity is considered accurate. Data gathered from Environment Canada databases for McDonald Cartier station(ID 6106000), Ottawa. Canadian Climate Normals (1971-2000)

Engineering Vulnerability Assessment of the Main Statistics Canada Building to the Impacts of Climate Change
HOK Canada 57:128
4.1.7 Assess Data Sufficiency
Where insufficient information currently available
Identify process to develop data Process
Future projections for humidity are not currently available and insufficient.
Climate change models factor in humidity, but data cannot be extracted from the current method of developing simulations.
Baseline flood plain data and water table, ground water/water table were not available at the time of the case study.
Project schedule did not allow data gathering from relevant sources.
Where data cannot be developed, identify the data gap as a finding in Step 5 of the Protocol – Recommendations. List Data Gap as findings to be sent to STEP 5 (Worksheet 5: Section 4.5.2)
1. Future projections for humidity are not currently available and insufficient.
2. Baseline (historical) flood plain data and water table, ground water/water table were not available at the time of the case study.
3. Future projected flood plain and water table, ground water/water table information was not available at the time of the case study.
Date: March 20, 2008
Prepared by:
Vince Catalli

En
gin
ee
rin
g V
uln
era
bili
ty A
sse
ssm
en
t o
f th
e M
ain
Sta
tistics C
an
ad
a B
uild
ing
to
th
e I
mp
acts
of
Clim
ate
Ch
an
ge
HO
K C
an
ad
a
5
8:1
28
Wo
rksh
ee
t 2
Da
ta G
ath
erin
g a
nd
Su
ffic
ien
cy –
Ma
in S
tatistics C
an
ad
a B
uild
ing
4
.2.1
Sta
te I
nfr
as
tru
ctu
re C
om
po
ne
nts
wh
ich
are
to
be
ev
alu
ate
d f
or
cli
ma
te c
ha
ng
e v
uln
era
bil
ity
5
(r
efe
ren
ce
Ap
pe
nd
ix A
– G
lob
al
Infr
as
tru
ctu
re L
isti
ng
)
Ge
ne
ral
De
sc
rip
tio
n
Da
ta
Infi
ll M
iss
ing
Da
ta u
sin
g r
ea
so
na
ble
a
ss
um
pti
on
s
Re
fere
nc
e a
nd
As
su
mp
tio
ns
on
da
ta a
nd
in
fill
da
ta
EX
TE
RIO
R S
YS
TE
MS
Ex
teri
or
sy
ste
ms
are
on
e o
f th
e k
ey
in
fra
str
uc
ture
co
mp
on
en
ts t
ha
t in
terf
ac
e
dir
ec
tly
wit
h c
lim
ate
ch
an
ge
.
1.1
S
ite
Dra
ina
ge
– r
ela
ted
to
slo
pe
s a
wa
y
fro
m t
he
bu
ildin
g a
nd
in
clu
de
s s
oil
pe
rme
ab
ility
a
nd
ha
rd s
urf
ace
s lik
e s
tair
s /
ra
mp
s
Be
ca
use
th
ere
is a
n in
cre
ase
in
pre
cip
ita
tio
n o
ve
r th
e y
ea
r e
xce
pt
for
the
su
mm
er,
it
is u
ncle
ar
wh
at
imp
act
this
will
ha
ve
on
so
il co
nd
itio
ns a
rou
nd
an
d
un
de
r th
e b
uild
ing
. T
rackin
g c
ha
ng
es in
so
il co
nd
itio
ns is a
mu
st
as s
tru
ctu
ral a
nd
be
low
gra
de
syste
ms w
ill b
e a
ffe
cte
d.
At
this
tim
e s
oil
rela
ted
d
ata
is a
ga
p.
1.2
S
ite
Dra
ins –
sto
rm/r
ain
wa
ter
T
he
de
sig
n p
ara
me
ters
fo
r site
dra
ins a
re
un
kn
ow
n a
nd
we
re u
na
va
ilab
le.
Du
e t
o a
p
roje
cte
d in
cre
ase
in
pre
cip
ita
tio
n o
f u
p t
o 3
0%
a
lon
g w
ith
a s
ub
sta
ntia
l in
cre
ase
in
extr
em
e
eve
nts
it
is c
ritica
l to
in
ve
stig
ate
th
is ite
m f
urt
he
r.
Syste
ms r
ela
ted
to
site
dra
ina
ge
are
cri
tica
l to
e
nsu
re t
ha
t w
ate
r in
filtra
tio
n w
ill n
ot
take
pla
ce
. W
ate
r in
filtra
tio
n c
an
ca
use
sig
nific
an
t d
am
ag
e
to v
ari
ou
s b
uild
ing
syste
ms a
nd
ca
n p
ose
a
sig
nific
an
t ri
sk.
2.0
W
alls
2
.1
Fre
esta
nd
ing
Th
e M
ain
Sta
ts B
uild
ing
use
s f
ree
sta
nd
ing
wa
lls
as a
n a
rch
ite
ctu
ral fe
atu
re t
o d
efin
e v
ari
ou
s
co
urt
ya
rds (
i.e
. e
ntr
y c
ou
rtya
rd,
de
live
ry a
rea
).
2.1
.1
co
ncre
te
De
pe
nd
ing
on
ha
irlin
e c
racks c
om
bin
ed
with
an
in
cre
ase
in
win
d d
rive
n r
ain
an
d f
ree
ze
th
aw
cycle
s m
ate
ria
l sta
bili
ty is o
f co
nce
rn.
Clim
ate
Fre
esta
nd
ing
wa
lls a
re a
sp
ecia
l b
ree
d o
f w
alls
th
at
are
exp
ose
d t
o w
ea
the
r a
ll-ro
un
d.
Win
d
dri
ve
n r
ain
alo
ng
with
fre
eze
th
aw
cycle
s w
ill
5 W
here
ava
ilabl
e, r
evie
w o
pera
tions
inci
dent
rep
orts
, dai
ly lo
gs. I
nter
view
infr
astr
uctu
re o
wne
rs a
nd o
pera
tors
to id
entif
y hi
stor
ical
eve
nts
that
may
not
be
docu
men
ted
or r
etrie
vabl
e fr
om d
atab
ases
.

En
gin
ee
rin
g V
uln
era
bili
ty A
sse
ssm
en
t o
f th
e M
ain
Sta
tistics C
an
ad
a B
uild
ing
to
th
e I
mp
acts
of
Clim
ate
Ch
an
ge
HO
K C
an
ad
a
5
9:1
28
ch
an
ge
will
mo
re t
ha
n lik
ely
ha
ve
an
im
pa
ct
on
d
ura
bili
ty o
f m
ate
ria
ls o
ve
r a
life
cycle
th
at
ma
y b
e
red
uce
d.
Info
rma
tio
n o
n m
ate
ria
l w
ea
the
rin
g d
ue
to
clim
ate
ch
an
ge
is u
nkn
ow
n w
ith
no
da
ta t
o
su
pp
ort
it.
2.1
.2
ma
so
nry
In
th
e c
ase
of
the
bri
ck m
aso
nry
wa
lls w
hic
h h
ave
n
o w
ee
pin
g h
ole
s t
o a
llow
fo
r d
rain
ag
e it
is
un
cle
ar
on
th
e r
ate
of
ma
teri
al d
ete
rio
ratio
n t
ha
t is
ta
kin
g p
lace
ba
se
d o
n t
od
ay’s
sta
nd
ard
bu
ildin
g
scie
nce
kn
ow
ho
w.
It m
ay b
e a
cce
lera
ted
as a
re
su
lt o
f clim
ate
ch
an
ge
fa
cto
rs (
refe
r to
ite
m
ab
ove
).
aff
ect
the
ma
teri
al sta
bili
ty o
f th
ese
wa
lls g
ive
n
tha
t b
oth
co
ncre
te a
nd
bri
ck m
aso
nry
are
re
lative
ly p
oro
us m
ate
ria
ls t
ha
t w
ill a
llow
m
ois
ture
to
pe
ne
tra
te.
If d
ete
rio
ratio
n is t
akin
g
pla
ce
(d
ue
to
sig
nific
an
t sn
ow
fa
ll w
e c
ou
ld n
ot
exa
min
e)
the
n t
he
str
uctu
ral in
teg
rity
of
the
se
w
alls
ma
y c
om
e in
to q
ue
stio
n a
nd
eve
ntu
ally
b
eco
me
a s
afe
ty h
aza
rd.
2
.2
Re
tain
ing
Th
ere
are
a n
um
be
r o
f re
tain
ing
wa
ll sce
na
rio
s
at
all
thre
e s
tud
y s
ite
s.
Th
ese
in
clu
de
win
do
w
an
d e
xit s
tair
we
lls a
nd
lo
ad
ing
do
ck r
ela
ted
w
alls
du
e t
o b
elo
w g
rad
e a
cce
ss.
All
are
co
ncre
te b
uilt
.
2.2
.1
co
ncre
te
Siz
ab
le c
on
cre
te w
alls
th
at
reta
in s
ign
ific
an
t e
art
h
loa
ds e
xis
t o
n s
ite
. In
on
e c
ase
be
twe
en
Ma
in
Sta
ts a
nd
th
e R
.H.
Co
ats
bu
ildin
g t
he
wa
ll is
m
ovin
g a
t th
e t
op
. F
ree
ze
th
aw
ma
y b
e t
he
cu
lpri
t d
ue
to
in
cre
ase
in
mo
istu
re c
on
ten
t in
th
e e
art
h
alo
ng
with
wa
ter
infiltra
tio
n a
t g
rad
e b
etw
ee
n t
he
e
art
h a
nd
wa
ll str
uctu
re.
Info
rma
tio
n o
n c
ha
ng
ing
so
il co
nd
itio
ns w
ou
ld b
e h
elp
ful to
un
de
rsta
nd
th
is
situ
atio
n.
A r
eta
inin
g w
all
wa
s o
bse
rve
d t
o b
e s
hiftin
g.
As
a r
esu
lt,
this
issu
e m
eri
ts f
urt
he
r a
na
lysis
an
d
stu
dy.
3.0
W
alk
wa
ys
W
alk
wa
ys a
re a
n im
po
rta
nt
me
an
s o
f a
cce
ssin
g
the
site
at
a p
ed
estr
ian
le
ve
l. A
t th
e s
am
e t
ime
, clim
ate
ch
an
ge
ma
y p
ose
a h
ea
lth
an
d s
afe
ty
risk (
ice
re
late
d)
wh
ile a
lso
aff
ect
ma
teri
al
sta
bili
ty a
nd
du
rab
ility
.
3
.1
Asp
ha
lt
Ma
teri
al p
rop
ert
y in
form
atio
n a
nd
th
e im
pa
ct
tha
t clim
ate
ch
an
ge
will
ha
ve
on
th
ese
ma
teri
als
is
un
kn
ow
n.
Mo
re d
ata
wo
uld
be
be
ne
ficia
l so
th
at
be
tte
r d
ecis
ion
s c
an
ta
ke
pla
ce
.
Incre
ase
s in
te
mp
era
ture
, e
sp
ecia
lly in
th
e
su
mm
er,
ma
y im
pa
ct
asp
ha
lt s
urf
ace
s d
ue
to
in
cre
ase
s in
he
at
ga
in.
Th
is a
ffe
cts
th
e m
ate
ria
l sta
bili
ty w
hile
it
ma
y a
lso
aff
ect
the
life
cycle
. M
ate
ria
l p
rop
ert
y in
form
atio
n d
ue
to
acce
lera
ted
w
ea
the
rin
g c
ase
d b
y c
lima
te c
ha
ng
e is

En
gin
ee
rin
g V
uln
era
bili
ty A
sse
ssm
en
t o
f th
e M
ain
Sta
tistics C
an
ad
a B
uild
ing
to
th
e I
mp
acts
of
Clim
ate
Ch
an
ge
HO
K C
an
ad
a
6
0:1
28
un
kn
ow
n.
In a
dd
itio
n w
he
n w
e c
ou
ple
th
e
su
mm
er
eve
nt
with
win
ter
rain
eve
nts
an
d f
ree
ze
th
aw
we
ma
y f
ind
th
at
ma
teri
al d
ete
rio
ratio
n w
ill
be
acce
lera
ted
an
d p
rod
uce
tri
pp
ing
ha
za
rds f
or
use
rs.
Incre
ase
d ice
on
pa
thw
ays a
lon
g w
ith
sa
lt
usa
ge
will
ag
ain
ma
ke
ma
teri
al sta
bili
ty w
ors
e.
3
.2
Co
ncre
te
Ha
irlin
e c
racks in
co
ncre
te a
lon
g w
ith
win
ter
rain
a
nd
fre
eze
th
aw
will
aff
ect
the
ma
teri
al sta
bili
ty /
d
ura
bili
ty.
Re
fer
to a
bo
ve
an
d b
elo
w f
or
rela
ted
in
form
atio
n.
3
.3
Un
it p
ave
rs
Incre
ase
s in
win
ter
rain
eve
nts
co
up
led
with
fr
ee
ze
th
aw
ma
y r
esu
lt in
sh
iftin
g u
nit p
ave
rs.
Th
is m
ay t
he
n c
au
se
tri
pp
ing
ha
za
rds f
or
use
rs.
Ma
teri
al p
rop
ert
y c
on
sid
era
tio
ns a
s p
er
Asp
ha
lt
ab
ove
wo
uld
als
o a
pp
ly.
4.0
S
tair
s
E
xte
rio
r sta
irs a
re t
he
pri
ma
ry m
ea
ns o
f e
nte
rin
g
all
thre
e b
uild
ing
s.
Th
ey a
re a
lso
a m
ea
ns o
f e
gre
ss in
em
erg
en
cy s
itu
atio
ns.
Th
ey a
re c
ritica
l to
th
e e
ffe
ctive
op
era
tio
n o
f th
ese
fe
de
ral o
ffic
es.
4
.1
Co
ncre
te
Ha
irlin
e c
racks in
co
ncre
te a
lon
g w
ith
win
ter
rain
a
nd
fre
eze
th
aw
will
aff
ect
the
ma
teri
al sta
bili
ty /
d
ura
bili
ty.
Incre
ase
d ice
on
sta
irs a
lon
g w
ith
sa
lt
usa
ge
will
ag
ain
ma
ke
ma
teri
al sta
bili
ty w
ors
e.
As w
ell,
an
y e
art
h b
en
ea
th t
he
sta
ir m
ay r
esu
lt in
h
ea
vin
g a
ga
inst
the
sta
ir t
ha
t w
ill f
urt
he
r im
pa
ct
the
sta
ir’s
str
uctu
ral sta
bili
ty /
du
rab
ility
.
4
.2
Me
tal
Ma
teri
al p
rop
ert
y in
form
atio
n a
nd
th
e im
pa
ct
tha
t clim
ate
ch
an
ge
will
ha
ve
on
th
ese
ma
teri
als
is
un
kn
ow
n.
Mo
re d
ata
wo
uld
be
be
ne
ficia
l so
th
at
be
tte
r d
ecis
ion
s c
an
ta
ke
pla
ce
.
Incre
ase
s in
pre
cip
ita
tio
n y
ea
r ro
un
d a
lon
g w
ith
h
igh
er
leve
ls o
f h
um
idity m
ay im
pa
ct
the
ma
teri
al
sta
bili
ty o
f th
e m
eta
l sta
irs.
Sin
ce
th
ese
sta
irs a
re
pa
inte
d in
da
rk c
olo
urs
it
will
acce
lera
te t
he
m
eltin
g o
f sn
ow
an
d ice
. In
ye
ars
of
he
avy s
no
w
it m
ay t
ake
mo
re t
ime
to
acco
mp
lish
me
ltin
g.
Use
of
sa
lt w
ill a
gg
rava
te t
he
situ
atio
n b
y
ca
usin
g in
cre
ase
d le
ve
ls o
f m
ate
ria
l d
ete
rio
ratio
n.
5.0
Ra
mp
s
E
xte
rio
r ra
mp
s a
re t
he
pri
ma
ry m
ea
ns f
or
acce
ssib
le e
ntr
y t
o t
he
bu
ildin
gs a
nd
as s
uch

En
gin
ee
rin
g V
uln
era
bili
ty A
sse
ssm
en
t o
f th
e M
ain
Sta
tistics C
an
ad
a B
uild
ing
to
th
e I
mp
acts
of
Clim
ate
Ch
an
ge
HO
K C
an
ad
a
6
1:1
28
the
y a
re a
vita
l in
fra
str
uctu
re c
om
po
ne
nt.
Re
fer
to 3
.2 a
nd
4.1
ab
ove
fo
r m
ore
de
tails
.
6.0
L
oa
din
g d
ock
A
ll th
ree
ca
se
stu
dy b
uild
ing
s r
ely
he
avily
on
use
o
f th
e lo
ad
ing
do
ck.
In a
ll ca
se
s t
he
se
are
as a
re
slo
pe
d d
ow
n b
elo
w g
rad
e a
nd
are
exp
ose
d t
o
we
ath
er
co
nd
itio
ns y
ea
r ro
un
d.
Giv
en
in
cre
ase
d
pre
cip
ita
tio
n,
sto
rm w
ate
r d
rain
ag
e is im
po
rta
nt.
7.0
W
ind
ow
/ S
tair
we
lls
W
ind
ow
an
d s
tair
we
lls a
re s
un
ke
n a
rea
s t
ha
t ca
n b
e s
en
sitiv
e t
o s
no
w a
nd
wa
ter
accu
mu
latio
n.
In t
he
ca
se
of
the
Ma
in S
tats
B
uild
ing
, h
ea
t lo
ss d
uri
ng
th
e w
inte
r ca
n c
au
se
sn
ow
me
ltin
g n
ea
r th
e b
uild
ing
wh
ich
th
en
will
fr
ee
ze
ove
rnig
ht.
Du
e t
o in
cre
ase
d p
recip
ita
tio
n
thro
ug
ho
ut
the
ye
ar
exce
pt
for
the
su
mm
er
mo
nth
s,
flo
od
ing
an
d w
ate
r in
filtra
tio
n m
ay t
ake
p
lace
. T
his
in
fra
str
uctu
re a
lso
re
tain
s e
art
h o
n
on
e s
ide
th
at
ma
y c
om
plic
ate
th
e s
itu
atio
n a
s
ind
ica
ted
ab
ove
in
th
e r
eta
inin
g w
all
se
ctio
n
2.2
.1.
7
.1
Co
ncre
te
Re
fer
to 2
.2.1
ab
ove
8.0
P
ark
ing
, ve
hic
le a
rea
s
P
ark
ing
an
d v
eh
icle
acce
ss a
re a
n im
po
rta
nt
me
an
s o
f a
cce
ssin
g t
he
site
wh
ile it
als
o h
as a
p
ed
estr
ian
le
ve
l fu
nctio
n.
At
the
sa
me
tim
e,
clim
ate
ch
an
ge
ma
y p
ose
a h
ea
lth
an
d s
afe
ty
risk (
ice
re
late
d)
wh
ile a
lso
aff
ectin
g t
he
syste
m’s
m
ate
ria
l sta
bili
ty a
nd
du
rab
ility
.
8
.1
Asp
ha
lt
Re
fer
to 3
.1 a
bo
ve
8
.2
Co
ncre
te
Re
fer
to 3
.2 a
bo
ve
8
.3
Un
it p
ave
rs
Re
fer
to 3
.3 a
bo
ve
9.0
M
an
ho
les/a
cce
ss d
oo
rs
With
an
in
cre
ase
in
pre
cip
ita
tio
n,
it is e
xp
ecte
d
tha
t w
ate
r in
filtra
tio
n w
ill in
cre
ase
. T
he
cu
rre
nt
tun
ne
l h
as a
sto
rm w
ate
r syste
m in
pla
ce
an
d it
is
un
cle
ar
wh
eth
er
it w
ill b
e a
de
qu
ate
. M
ore
da
ta
ab
ou
t th
e s
torm
wa
ter
syste
m in
th
e t
un
ne
l is
re
qu
ire
d.
Tu
nn
ey’s
Pa
stu
re r
elie
s o
n t
un
ne
ls t
ha
t d
eliv
er
he
atin
g p
lan
t ste
am
an
d c
hill
ed
wa
ter.
At
va
rio
us
loca
tio
ns o
n c
am
pu
s t
he
re a
re e
xte
rio
r a
nd
in
teri
or
acce
ss p
oin
ts t
o t
he
tu
nn
el syste
m f
or
rou
tin
e o
pe
ratio
n a
nd
ma
na
ge
me
nt
co
nsid
era
tio
ns.

En
gin
ee
rin
g V
uln
era
bili
ty A
sse
ssm
en
t o
f th
e M
ain
Sta
tistics C
an
ad
a B
uild
ing
to
th
e I
mp
acts
of
Clim
ate
Ch
an
ge
HO
K C
an
ad
a
6
2:1
28
BU
ILD
ING
SY
ST
EM
S
10
.0
Fo
un
da
tio
n,
Flo
ors
an
d R
oo
fs
10
.1
Fo
otin
gs –
co
ncre
te
10
.2
Wa
lls -
co
ncre
te
10
.3
Sla
b o
n g
rad
e -
co
ncre
te
Be
ca
use
th
ere
is a
n in
cre
ase
in
pre
cip
ita
tio
n o
ve
r th
e y
ea
r e
xce
pt
for
the
su
mm
er,
it
is u
ncle
ar
wh
at
imp
act
this
will
ha
ve
on
so
il co
nd
itio
ns a
rou
nd
an
d
un
de
r th
e b
uild
ing
. T
rackin
g c
ha
ng
es in
so
il co
nd
itio
ns is a
mu
st
as s
tru
ctu
ral a
nd
be
low
gra
de
syste
ms w
ill b
e a
ffe
cte
d.
At
this
tim
e s
oil
rela
ted
d
ata
is a
ga
p.
Be
low
gra
de
str
uctu
re h
as a
str
on
g c
on
ne
ctio
n
to a
nu
mb
er
of
clim
ate
ch
an
ge
im
pa
cts
. H
igh
er
leve
ls o
f p
recip
ita
tio
n w
ill a
ffe
ct
site
dra
ina
ge
is
su
es a
rou
nd
th
e b
uild
ing
pe
rim
ete
r. H
igh
er
pre
cip
ita
tio
n w
ill a
ffe
ct
be
low
gra
de
so
il co
nd
itio
ns a
s w
e c
an
exp
ect
hig
he
r le
ve
ls o
f m
ois
ture
co
nte
nt
ag
ain
st
fou
nd
atio
n w
alls
. B
eca
use
th
e b
uild
ing
fo
un
da
tio
n is b
elie
ve
d t
o
rest
on
be
dro
ck,
an
y c
ha
ng
es (
incre
ase
) in
th
e
wa
ter
tab
le m
ay a
ffe
ct
hyd
rosta
tic p
ressu
re
ag
ain
st
the
fo
un
da
tio
n w
alls
. A
ny c
racks in
th
e
fou
nd
atio
n m
ay a
llow
wa
ter
infiltra
tio
n.
W
arm
er
win
ters
alo
ng
with
fre
eze
th
aw
cycle
s
will
aff
ect
su
rfa
ce
le
ve
l g
rou
nd
co
nd
itio
ns.
A
ll o
f th
ese
will
aff
ect
the
in
teg
rity
of
be
low
gra
de
str
uctu
ral syste
ms.
10
.4
Pre
ca
st
Lig
ht
We
igh
t C
on
cre
te P
an
el
Ro
of
Th
e r
oo
f m
em
bra
ne
is o
ne
of
the
ke
y c
om
po
ne
nts
o
f th
e r
oo
f syste
m.
In
form
atio
n g
ap
s e
xis
t in
te
rms o
f ro
of
me
mb
ran
e w
ea
the
rin
g d
ue
to
clim
ate
ch
an
ge
. T
he
ro
of
me
mb
ran
e h
as a
dir
ect
rela
tio
nsh
ip t
o t
he
ro
of
str
uctu
re m
ostly in
te
rms o
f ke
ep
ing
th
e s
tru
ctu
re d
ry.
If m
ois
ture
ma
ke
s its
w
ay in
to t
he
ro
of
str
uctu
re t
he
n t
he
str
uctu
re m
ay
exp
eri
en
ce
fre
eze
th
aw
re
late
d s
tre
ss n
ot
to
me
ntio
n w
ate
r d
am
ag
e t
o t
he
off
ice
sp
ace
be
low
. T
he
Je
an
Ta
lon
bu
ildin
g is a
n e
xa
mp
le o
f th
is
situ
atio
n h
avin
g r
ece
ntly t
o d
ea
l w
ith
a w
inte
r ro
of
lea
k.
Ro
ofin
g s
tru
ctu
res a
re s
tro
ng
ly t
ied
to
oth
er
co
mp
on
en
ts o
f th
e r
oo
fin
g s
yste
m.
Th
is in
clu
de
s
the
ro
of
me
mb
ran
e,
insu
latio
n,
ba
llast
ma
teri
al,
roo
f d
rain
s,
pa
rap
et
wa
lls,
win
do
w w
ash
ing
a
nch
ors
, ro
oft
op
un
its,
me
ch
an
ica
l p
en
tho
use
co
nn
ectio
ns,
etc
. It
is c
ritica
l to
un
de
rsta
nd
th
at
oth
er
syste
ms m
ay im
pa
ct
the
ro
of
str
uctu
re s
o
the
re is a
n in
terd
ep
en
de
ncy a
mo
ng
diffe
ren
t syste
ms.
EN
VE
LO
P S
YS
TE
MS
11
.0
Cla
dd
ing
T
he
we
tte
r fa
ll, w
inte
r a
nd
sp
rin
g a
lon
g w
ith
th
e
mo
re h
um
id s
um
me
r m
ay r
esu
lt in
mo
re /
a
cce
lera
ted
cla
dd
ing
syste
m f
ailu
res.
Th
e a
cid
ic
pro
pe
rtie
s o
f th
e p
recip
ita
tio
n m
ay a
lso
pla
y in
to
Pri
ma
ry f
un
ctio
n o
f th
e b
uild
ing
cla
dd
ing
syste
m
is t
o d
elin
ea
te in
teri
or
an
d e
xte
rio
r co
nd
itio
ns s
o
tha
t a
co
mfo
rta
ble
wo
rk e
nvir
on
me
nt
is
pro
du
ce
d.
Sin
ce
clim
ate
ch
an
ge
is t
akin
g p
lace

En
gin
ee
rin
g V
uln
era
bili
ty A
sse
ssm
en
t o
f th
e M
ain
Sta
tistics C
an
ad
a B
uild
ing
to
th
e I
mp
acts
of
Clim
ate
Ch
an
ge
HO
K C
an
ad
a
6
3:1
28
this
sce
na
rio
. D
ata
ga
ps e
xis
t o
n a
ma
teri
al
pro
pe
rty le
ve
l to
un
de
rsta
nd
th
ese
co
nd
itio
ns f
ully
, w
hile
at
the
sa
me
tim
e k
no
win
g t
he
ch
em
ica
l p
rop
ert
ies o
f th
e p
recip
ita
tio
n m
ay a
llow
fo
r m
ore
a
ccu
rate
ju
dg
em
en
t o
n t
he
im
pa
ct
the
se
co
nd
itio
ns w
ill h
ave
on
th
e c
lad
din
g.
this
syste
m w
ill b
e a
ffe
cte
d b
y t
em
pe
ratu
re,
rain
, w
ind
dri
ve
n s
no
w,
fre
eze
th
aw
, re
du
ce
d h
ea
tin
g
de
gre
e d
ays a
nd
in
cre
ase
d h
um
idity le
ve
ls.
In
su
mm
ary
th
e h
ott
er,
we
tte
r, h
um
id c
on
ditio
n
alo
ng
with
fre
eze
th
aw
cycle
s in
th
e w
inte
r w
ill
ha
ve
im
pa
ct
on
th
e c
lad
din
g.
1
1.1
P
reca
st
Co
ncre
te
Da
ta g
ap
s e
xis
t w
ith
win
d d
rive
n r
ain
an
d s
no
w
esp
ecia
lly d
uri
ng
th
e w
inte
r. I
t is
cri
tica
l to
ge
t a
b
ett
er
un
de
rsta
nd
ing
on
th
is e
sp
ecia
lly w
he
n
fre
eze
th
aw
is f
acto
red
in
. M
ate
ria
l p
rop
ert
y d
ata
is
als
o m
issin
g,
esp
ecia
lly r
ela
ted
to
ma
teri
al
we
ath
eri
ng
wh
ich
ma
y b
e a
cce
lera
ted
du
e t
o m
ore
p
recip
ita
tio
n a
nd
oth
er
clim
ate
ch
an
ge
im
pa
cts
.
At
the
pe
nth
ou
se
le
ve
l o
f Je
an
Ta
lon
bu
ildin
g
sn
ow
wa
s o
bse
rve
d b
etw
ee
n t
he
pre
ca
st
co
ncre
te p
an
el a
nd
th
e b
uild
ing
str
uctu
re.
Th
is
ind
ica
tes t
ha
t th
ere
is r
ain
an
d s
no
w m
akin
g its
w
ay b
eh
ind
th
e p
reca
st
co
ncre
te c
lad
din
g t
ha
t ca
n a
ffe
ct
the
syste
m a
dve
rse
ly a
t th
e a
nch
ors
a
nd
with
th
e o
ffic
e s
pa
ce
be
low
. T
his
situ
atio
n
ca
lls t
o q
ue
stio
n d
eta
ilin
g issu
es a
t th
e p
ara
pe
t w
all.
Fu
rth
er
an
aly
sis
is r
eq
uir
ed
. In
ad
ditio
n t
he
jo
ints
be
twe
en
pa
ne
ls w
ill n
ee
d t
o b
e lo
oke
d a
t a
s c
alk
ing
de
tails
are
a lim
itin
g f
acto
r w
ith
th
is
cla
dd
ing
syste
m.
Hig
he
r te
mp
era
ture
s a
lon
g w
ith
th
e in
cre
ase
s in
te
mp
era
ture
ra
ng
e c
an
ca
use
p
reca
st
syste
ms t
o b
ow
with
so
me
evid
en
ce
of
this
at
the
Je
an
Ta
lon
bu
ildin
g.
La
stly,
wa
ll ca
vity
dra
ina
ge
is a
lso
cri
tica
l to
allo
w f
or
mo
istu
re a
nd
w
ate
r to
esca
pe
.
1
1.2
G
laze
d C
urt
ain
wa
ll
T
he
re a
re s
ma
ll a
rea
s o
f cu
rta
in w
all
at
the
Ma
in
Sta
ts B
uild
ing
th
at
we
re r
ep
lace
d in
19
93
-19
94
a
lon
g w
ith
all
win
do
ws.
At
the
Je
an
Ta
lon
b
uild
ing
, w
ith
th
e e
xce
ptio
n o
f th
e s
lop
ed
g
lazin
g,
all
of
it’s
ori
gin
al w
ind
ow
s a
re s
till
in
pla
ce
. T
yp
ica
lly g
laze
d s
yste
ms a
re d
esig
ne
d t
o
tole
rate
a c
ert
ain
am
ou
nt
of
wa
ter
infiltra
tio
n d
ue
to
win
d d
rive
n s
no
w a
nd
ra
in.
No
issu
es h
ave
b
ee
n r
ais
ed
in
th
e B
uild
ing
Co
nd
itio
n R
ep
ort
s
rela
ted
to
wa
ter
infiltra
tio
n.
1
1.3
M
aso
nry
wa
ll G
ive
n in
cre
ase
d w
ind
dri
ve
n p
recip
ita
tio
n o
ve
r th
e
win
ter
mo
nth
s it
is u
ncle
ar
wh
at
will
ta
ke
pla
ce
w
ith
th
e m
ate
ria
l in
teg
rity
of
the
Ma
in S
tats
Ma
so
nry
wa
lls a
re u
se
d a
t th
e M
ain
Sta
ts
bu
ildin
g o
nly
an
d a
re m
ad
e u
sin
g a
Fle
mis
h
bo
nd
te
ch
niq
ue
th
at
relie
s o
n a
do
ub
le la
ye
r o
f

En
gin
ee
rin
g V
uln
era
bili
ty A
sse
ssm
en
t o
f th
e M
ain
Sta
tistics C
an
ad
a B
uild
ing
to
th
e I
mp
acts
of
Clim
ate
Ch
an
ge
HO
K C
an
ad
a
6
4:1
28
exte
rio
r m
aso
nry
wa
lls.
Th
ere
is m
ois
ture
re
late
d
sta
inin
g o
n t
he
wa
lls a
t th
e p
rese
nt
tim
e t
ha
t w
ill
no
t b
e h
elp
ed
by t
he
win
do
w s
ills t
ha
t a
re c
racke
d
an
d g
en
era
lly in
po
or
co
nd
itio
n.
An
y m
ois
ture
th
at
en
ters
th
e m
aso
nry
wa
ll h
as n
o e
asy w
ay o
ut
oth
er
tha
n t
o r
ely
on
so
lar
rad
iatio
n a
nd
/or
the
h
ea
tin
g s
yste
m t
o d
ry t
he
wa
ll o
ut.
bri
ck w
ith
alte
rna
tin
g b
ricks b
ein
g u
se
d
len
gth
wis
e t
o b
on
d t
he
tw
o la
ye
rs.
On
th
e in
sid
e
face
of
the
exte
rio
r w
all
is a
th
ird
la
ye
r m
ad
e u
p
of
terr
aco
tta
blo
ck.
Th
e e
xte
rio
r w
all
ha
s n
eith
er
dra
ina
ge
ca
vity n
or
an
y w
ee
pin
g h
ole
s t
o a
llow
fo
r w
ate
r /
mo
istu
re t
o d
rain
.
11
.4
Sto
ne
Pa
ne
ls (
inclu
din
g lin
tels
an
d s
ills)
Incre
ase
s in
win
d d
rive
n p
recip
ita
tio
n o
ve
r th
e
win
ter
mo
nth
s w
ill a
ffe
ct
the
ma
teri
al in
teg
rity
of
the
Ma
in S
tats
exte
rio
r sto
ne
wa
lls.
Sig
ns o
f m
ois
ture
re
late
d s
tain
ing
is v
isib
le.
Th
e s
itu
atio
n is
sim
ilar
to t
he
ma
so
nry
wa
ll situ
atio
n (
refe
ren
ce
1
1.3
ab
ove
).
Sto
ne
is u
se
d o
n t
he
Ma
in S
tats
bu
ildin
g a
s a
n
arc
hite
ctu
ral a
cce
nt.
Th
ere
ap
pe
ars
to
be
no
d
rain
ag
e c
avity a
s t
he
se
exte
rio
r w
alls
are
bu
ilt
sim
ilar
to t
he
ma
so
nry
wa
lls 1
1.3
ab
ove
. E
vid
en
ce
of
ma
teri
al cra
ckin
g a
nd
wa
ter
infiltra
tio
n s
tain
ing
are
re
su
ltin
g in
th
e s
yste
m’s
w
ea
the
rin
g t
ha
t m
ay s
tart
to
sh
ow
fa
ilure
an
d
ca
use
oth
er
da
ma
ge
.
1
1.5
M
eta
l C
lad
din
g
M
eta
l cla
dd
ing
is u
se
d a
t th
e p
en
tho
use
le
ve
l o
f th
e M
ain
Sta
ts B
uild
ing
. It
sh
ow
s m
od
est
sig
ns
of
ma
teri
al str
ess t
ha
t re
late
s t
o s
tain
ing
fro
m
pre
cip
ita
tio
n.
12
.0
Win
do
ws /
Do
ors
T
he
re is lim
ite
d t
ech
nic
al in
form
atio
n t
ha
t id
en
tifie
s h
ow
th
ese
syste
ms a
re b
ein
g a
ffe
cte
d b
y
ch
an
gin
g c
lima
te.
Win
do
ws a
nd
do
ors
are
pa
rt o
f th
e e
xte
rio
r w
all
syste
m a
nd
as s
uch
are
aff
ecte
d b
y s
imila
r w
ea
the
r re
late
d c
on
ditio
ns.
Un
like
pre
ca
st
co
ncre
te,
ma
so
nry
an
d s
ton
e,
win
do
ws a
nd
d
oo
rs m
ayb
e a
ffe
cte
d le
ss b
y w
ind
dri
ve
n
pre
cip
ita
tio
n.
Ho
we
ve
r, in
cre
ase
s in
te
mp
era
ture
w
ill e
xp
ose
th
e s
yste
m a
nd
ca
use
oth
er
failu
res
to t
ake
pla
ce
. F
or
exa
mp
le t
he
me
tal w
ind
ow
sp
ace
r a
nd
se
al w
ill u
nd
erg
o e
xp
an
sio
n a
nd
co
ntr
actio
n t
ha
t m
ay a
cce
lera
te t
he
fa
ilure
of
the
syste
m.
1
2.1
A
lum
inu
m W
ind
ow
s
Re
fer
to 1
1.2
ab
ove
. R
efe
r to
11
.2 a
bo
ve
.
1
2.2
D
oo
rs (
Ste
el /
Alu
min
um
) R
efe
r to
12
.0 a
bo
ve
R
efe
r to
12
.0 a
bo
ve
.
13
.0
Fla
t R
oo
f S
yste
ms
Th
e a
ffe
ct
of
fre
eze
th
aw
an
d h
igh
er
tem
pe
ratu
res,
inclu
din
g t
em
pe
ratu
re s
win
gs in
w
inte
r m
ay r
esu
lt in
mo
re a
cce
lera
ted
ra
tes o
f m
ate
ria
l d
ete
rio
ratio
n.
Co
nclu
siv
e d
ata
on
th
e r
oo
f
Th
e f
lat
roo
f syste
m is m
ad
e u
p o
f va
rio
us
ma
teri
al la
ye
rs t
ha
t in
clu
de
ro
of
me
mb
ran
e,
ba
llast
ma
teri
al, r
oo
f str
uctu
re,
insu
latio
n a
nd
so
me
tim
es c
eili
ng
fin
ish
ma
teri
als
. T
he
mo
st

En
gin
ee
rin
g V
uln
era
bili
ty A
sse
ssm
en
t o
f th
e M
ain
Sta
tistics C
an
ad
a B
uild
ing
to
th
e I
mp
acts
of
Clim
ate
Ch
an
ge
HO
K C
an
ad
a
6
5:1
28
me
mb
ran
e a
nd
th
e im
pa
ct
tha
t clim
ate
ch
an
ge
will
h
ave
on
th
e m
em
bra
ne
is u
nkn
ow
. A
s w
ell,
th
e
eff
ect
of
ba
llast
ma
teri
al to
mitig
ate
in
cre
ase
s in
te
mp
era
ture
is u
nkn
ow
n.
Mo
re d
ata
wo
uld
he
lp t
o
eva
lua
te t
his
syste
m.
cri
tica
l co
mp
on
en
t o
f th
e s
yste
m is t
he
m
em
bra
ne
th
at
sh
ed
s w
ate
r a
wa
y f
rom
th
e
bu
ildin
g s
tru
ctu
re a
nd
in
teri
or.
Fre
eze
th
aw
cycle
s w
ill a
ffe
ct
the
du
rab
ility
of
the
ro
of
me
mb
ran
e t
ha
t ca
n r
esu
lt in
syste
m f
ailu
res.
ME
CH
AN
ICA
L S
YS
TE
MS
14
.0
HV
AC
Th
e C
en
tra
l H
ea
tin
g P
lan
t is
a k
ey s
yste
m t
ha
t su
pp
lies T
un
ne
y’s
Pa
stu
re w
ith
ste
am
an
d
ch
ille
d w
ate
r. T
he
pla
nt
ha
s r
ece
ntly b
ee
n
mo
de
rniz
ed
an
d u
pd
ate
d t
o t
od
ay’s
sta
nd
ard
s in
o
rde
r to
ke
ep
up
with
ca
mp
us r
eq
uir
em
en
ts.
It
dra
ws u
po
n a
na
tura
l g
as e
ne
rgy s
up
ply
in
ord
er
to f
un
ctio
n.
Th
e O
tta
wa
riv
er
pla
ys a
ke
y r
ole
as
the
pla
nt
use
s t
he
bo
dy o
f w
ate
r to
co
nd
itio
n
wa
ter
use
d o
n t
he
ca
mp
us.
14
.1
He
atin
g S
yste
m a
nd
Ad
eq
ua
cy
Th
e b
uild
ing
is c
on
ne
cte
d t
o t
he
Tu
nn
ey’s
Pa
stu
re
ce
ntr
al h
ea
tin
g a
nd
co
olin
g p
lan
t. T
he
pla
nt
relie
s
on
th
e O
tta
wa
riv
er
to c
on
ditio
n w
ate
r u
se
d o
n
ca
mp
us.
Ove
rall,
riv
er
wa
ter
tem
pe
ratu
res a
re
ge
ne
rally
in
cre
asin
g d
ue
to
a w
arm
er
clim
ate
an
d
is t
he
refo
re a
ffe
ctin
g t
he
he
atin
g a
nd
co
olin
g
pla
nt.
Cu
rre
nt
an
d s
om
e h
isto
ric d
ata
is a
va
ilab
le
on
riv
er
wa
ter
tem
pe
ratu
re c
ha
ng
es.
Th
e M
ain
Sta
ts B
uild
ing
is t
he
old
est
bu
ildin
g
(19
52
) th
at
is b
ein
g r
evie
we
d b
y t
his
stu
dy.
As
su
ch
it
ha
s little
to
no
in
su
latio
n a
nd
re
lies o
n a
ce
rta
in a
mo
un
t o
f h
ea
t to
ke
ep
th
e b
uild
ing
e
nve
lop
e w
arm
an
d d
ry s
o t
ha
t it m
ain
tain
s its
str
uctu
ral in
teg
rity
. A
t tim
es d
uri
ng
th
e w
inte
r th
e
ho
t w
ate
r h
ea
tin
g s
yste
m h
as a
ha
rd t
ime
ke
ep
ing
up
with
th
e in
teri
or
he
atin
g d
em
an
ds.
Oft
en
th
e p
ipe
s w
ill f
ree
ze
an
d c
au
se
th
e in
teri
or
en
vir
on
me
nt
to b
e c
old
an
d u
nco
mfo
rta
ble
. B
ase
d o
n p
roje
cte
d in
cre
ase
s in
te
mp
era
ture
th
is m
ay p
rove
to
be
re
du
ce
d o
r e
limin
ate
d.
14
.2
Co
olin
g S
yste
m a
nd
Ad
eq
ua
cy
Th
e b
uild
ing
is c
on
ne
cte
d t
o t
he
Tu
nn
ey’s
Pa
stu
re
ce
ntr
al h
ea
tin
g a
nd
co
olin
g p
lan
t. T
he
pla
nt
relie
s
on
th
e O
tta
wa
riv
er
to c
on
ditio
n w
ate
r u
se
d o
n
ca
mp
us.
Ove
rall,
riv
er
wa
ter
tem
pe
ratu
res a
re
ge
ne
rally
in
cre
asin
g d
ue
to
a w
arm
er
clim
ate
an
d
is t
he
refo
re a
ffe
ctin
g t
he
he
atin
g a
nd
co
olin
g
pla
nt.
Cu
rre
nt
an
d s
om
e h
isto
ric d
ata
is a
va
ilab
le
on
riv
er
wa
ter
tem
pe
ratu
re c
ha
ng
es.
Pro
jecte
d t
em
pe
ratu
res a
re e
xp
ecte
d t
o in
cre
ase
a
lon
g w
ith
th
e h
um
idity le
ve
ls.
As s
uch
th
is w
ill
ve
ry lik
ely
be
an
issu
e f
or
su
mm
er
bu
ildin
g
op
era
tio
ns a
s t
he
y a
re h
avin
g a
difficu
lt t
ime
of
ke
ep
ing
th
e s
pa
ce
co
ol a
nd
co
mfo
rta
ble
. A
t th
e
sa
me
tim
e,
the
fe
de
ral g
ove
rnm
en
t h
as in
stitu
ted
a
n e
ne
rgy c
on
se
rva
tio
n p
rog
ram
th
at
ha
s
resu
lte
d in
de
live
rin
g c
hill
ed
wa
ter
to a
ll fa
cili
tie
s
at
hig
he
r te
mp
era
ture
s.
Sp
ace
op
tim
iza
tio
n a
nd
h
igh
er
use
of
co
mp
ute
rs a
nd
oth
er
tech
no
log
ies

En
gin
ee
rin
g V
uln
era
bili
ty A
sse
ssm
en
t o
f th
e M
ain
Sta
tistics C
an
ad
a B
uild
ing
to
th
e I
mp
acts
of
Clim
ate
Ch
an
ge
HO
K C
an
ad
a
6
6:1
28
ha
ve
re
su
lte
d in
hig
he
r h
ea
t le
ve
ls b
ein
g
pro
du
ce
d w
ith
in t
he
sp
ace
. T
his
ha
s r
esu
lte
d in
m
akin
g t
he
sp
ace
ve
ry h
ard
to
ke
ep
co
ol a
nd
co
nd
itio
n,
esp
ecia
lly d
uri
ng
th
e s
um
me
r m
on
ths.
It
sh
ou
ld b
e n
ote
d t
ha
t th
e h
ea
tin
g p
lan
t re
lies o
n
rive
r w
ate
r fo
r co
olin
g a
nd
if
the
so
lar
rad
iatio
n is
aff
ectin
g r
ive
r w
ate
r te
mp
era
ture
s (
e.g
. in
cre
asin
g)
the
n t
he
co
olin
g c
ap
acity o
f th
e p
lan
t w
ill b
e a
ffe
cte
d a
nd
be
co
me
vu
lne
rab
le.
Th
is
ma
y b
e c
om
po
un
de
d b
y d
rye
r/lo
we
r ra
infa
ll co
nd
itio
ns in
su
mm
er
eff
ective
ly r
ed
ucin
g t
he
flo
w o
f th
e r
ive
r d
uri
ng
Ju
ne
, Ju
ly a
nd
Au
gu
st.
T
he
lo
we
r th
e w
ate
r le
ve
l th
e e
asie
r it w
ill b
e t
o
aff
ect
eve
n h
igh
er
wa
ter
tem
pe
ratu
res d
uri
ng
th
e
su
mm
er.
Th
is is a
clim
ate
ch
an
ge
aff
ect
tha
t re
qu
ire
s m
ore
in
form
atio
n a
nd
stu
dy t
ha
t is
o
uts
ide
th
e s
co
pe
of
this
asse
ssm
en
t.
EL
EC
TR
ICA
L S
YS
TE
MS
15
.0
Em
erg
en
cy p
ow
er
syste
ms /
ge
ne
rato
rs
(in
clu
din
g f
ue
l su
pp
ly)
E
me
rge
ncy p
ow
er
syste
ms a
re a
va
ilab
le o
n t
his
ca
mp
us s
tric
tly t
o k
ee
p v
ita
l syste
ms o
pe
ratio
na
l.
It is n
ot
a b
acku
p s
yste
m f
or
10
0%
of
the
b
uild
ing
fu
nctio
ns b
ut
rath
er
se
rve
s s
uch
fu
nctio
ns a
s t
he
ma
in d
ata
ce
ntr
e,
em
erg
en
cy
ligh
tin
g,
etc
. T
his
ele
me
nt
ha
s a
dir
ect
rela
tio
nsh
ip w
ith
16
.0 b
elo
w.
16
.0
Po
we
r S
up
ply
an
d R
elia
bili
ty
Po
we
r su
pp
ly is n
ot
just
a f
un
ctio
n o
f th
e T
un
ne
y’s
P
astu
re C
am
pu
s in
fra
str
uctu
re a
s it
is a
mo
re f
ar
rea
ch
ing
co
mp
on
en
t th
at
is c
ity w
ide
. T
he
sco
pe
o
f th
is s
tud
y f
ocu
se
s s
tric
tly o
n t
he
bo
un
da
rie
s o
f th
e b
uild
ing
an
d r
elie
s o
n a
ve
ry r
elia
ble
en
erg
y
su
pp
ly (
ele
ctr
icity,
na
tura
l g
as,
oil,
etc
.).
Ove
rall,
p
ow
er
su
pp
ly a
nd
re
liab
ility
is d
ifficu
lt t
o e
va
lua
te
as a
ris
k a
s it
wo
uld
re
qu
ire
fu
rth
er
rese
arc
h a
nd
d
iscu
ssio
n w
ith
th
e v
ari
ou
s lo
ca
l u
tilit
y c
om
pa
nie
s.
Po
we
r su
pp
ly a
nd
re
liab
ility
is a
ke
y c
on
ce
rn f
or
the
Sta
tistics C
an
ad
a o
pe
ratio
n a
t T
un
ne
y’s
P
astu
re.
Du
rin
g t
he
su
mm
er
mo
nth
s,
du
e t
o
hig
he
r te
mp
era
ture
s a
nd
mo
re h
um
id c
on
ditio
ns,
use
of
air
co
nd
itio
nin
g is v
ery
pre
va
len
t th
rou
gh
ou
t th
e c
ity o
f O
tta
wa
. S
o m
uch
so
th
at
po
we
r re
liab
ility
will
be
co
mp
rom
ise
d a
nd
ha
s f
ail
du
rin
g t
he
su
mm
er
for
pe
rio
ds o
f u
p t
o 4
8 h
ou
rs.
Sta
tistic C
an
ad
a r
elie
s o
n t
he
ma
in d
ata
ce
ntr
e
as its
co
re b
usin
ess f
un
ctio
n.
With
ou
t p
ow
er
em
plo
ye
es a
re s
en
t h
om
e a
s t
he
ir o
pe
ratio
n

En
gin
ee
rin
g V
uln
era
bili
ty A
sse
ssm
en
t o
f th
e M
ain
Sta
tistics C
an
ad
a B
uild
ing
to
th
e I
mp
acts
of
Clim
ate
Ch
an
ge
HO
K C
an
ad
a
6
7:1
28
gri
nd
s t
o a
ha
lt.
4.2
.2 S
tate
Cli
ma
te B
as
eli
ne
S
tate
ge
ne
ral
Cli
ma
te P
ara
me
ters
fo
r u
se
in
ST
EP
3 o
f A
ss
es
sm
en
t (R
efe
ren
ce
Ap
pe
nd
ix B
– C
lim
ate
Ch
an
ge
Pa
ram
ete
rs L
ist)
(A
dd
itio
na
l R
efe
ren
ce
– P
IEV
C D
ata
In
teg
rity
an
d A
va
ila
bil
ity
Re
vie
w)
Cli
ma
te i
nfo
rma
tio
n s
ou
rce
Te
mp
era
ture
pa
ram
ete
rs
a.
Mo
nth
ly a
ve
rag
e m
axim
um
te
mp
era
ture
(M
on
thly
AV
G T
MA
X):
b
. M
on
thly
ave
rag
e m
inim
um
te
mp
era
ture
(M
on
thly
AV
G T
MIN
):
c.
Ave
rag
e a
nn
ua
l d
aily
ma
xim
um
te
mp
era
ture
(a
nn
ua
l_m
ax):
d
. A
ve
rag
e a
nn
ua
l d
aily
min
imu
m t
em
pe
ratu
re (
an
nu
al_
min
):
Ou
ran
os –
Clim
ate
Sce
na
rio
s R
ep
ort
(F
eb
rua
ry
20
08
)
Ra
in p
ara
me
ters
(p
recip
ita
tio
n in
liq
uid
fo
rm)
a.
Ra
infa
ll F
req
ue
ncy 6
ho
ur
(6h
_fr
eq
ue
ncy)
b
. R
ain
fall
Fre
qu
en
cy 1
da
y (
1d
ay_
fre
qu
en
cy)
c.
Ye
arl
y M
ax.
Ra
infa
ll (a
nn
ua
l_m
ax_
rain
) d
. A
ve
rag
e t
ota
l a
nn
ua
l /
se
aso
na
l ra
infa
ll (A
vg
_to
tal_
rain
) -
ave
rag
e s
um
of
liqu
id p
recip
fo
r th
e
ye
ar
an
d 4
se
aso
ns
e.
Sim
ple
Da
ily I
nte
nsity I
nd
ex (
SD
II)
- m
ea
n s
no
wfa
ll a
mo
un
t p
er
we
t d
ay (
we
t d
ay >
1m
m)
f.
Dro
ug
ht
: A
ve
rag
e m
axim
um
an
nu
al d
rysp
ell
len
gth
(A
vg
_m
ax_
dry
sp
ell)
- a
ve
rag
e y
ea
rly
ma
xim
um
nu
mb
er
of
co
nse
cu
tive
‘n
o r
ain
da
ys’ (<
1m
m)
for
the
se
aso
n A
pri
l 1
– O
ct
31
st
g
. W
ets
pe
ll: A
ve
rag
e m
axim
um
an
nu
al w
ets
pe
ll le
ng
th (
Avg
_m
ax_
we
tsp
ell)
- a
ve
rag
e y
ea
rly
ma
xim
um
nu
mb
er
of
co
nse
cu
tive
‘ra
in d
ays’ (>
1 m
m)
for
the
se
aso
n A
pri
l 1
– O
ct
31
st
Ou
ran
os –
Clim
ate
Sce
na
rio
s R
ep
ort
(F
eb
rua
ry
20
08
)
Sn
ow
pa
ram
ete
rs
a.
Sn
ow
fall
Fre
qu
en
cy 1
da
y (
1d
ay_
fre
qu
en
cy)
b.
Ye
arl
y M
ax.
Sn
ow
fall
(an
nu
al_
ma
x_
sn
ow
):
c.
Ave
rag
e T
ota
l a
nn
ua
l /
se
aso
na
l ra
infa
ll (A
vg
_to
tal)
d
. S
imp
le D
aily
In
ten
sity I
nd
ex (
SD
II)
e.
Ra
in o
n s
no
w e
ve
nts
Ou
ran
os –
Clim
ate
Sce
na
rio
s R
ep
ort
(F
eb
rua
ry
20
08
)
Win
d p
ara
me
ters
a
. M
on
thly
ave
rag
e 6
h W
ind
sp
ee
d (
Mo
nth
ly A
VG
WIN
D6
h)
b.
Ye
arl
y M
ax.
6h
ou
r W
ind
(A
vg
an
nu
al M
AX
6h
)
Ou
ran
os –
Clim
ate
Sce
na
rio
s R
ep
ort
(F
eb
rua
ry
20
08
)
Fro
st
pa
ram
ete
rs
a.
Fro
st
Se
aso
n (
fr_
se
as_
dys)
b.
Fre
eze
Th
aw
Cycle
s (
frz_
thw
_fr
eq
) -
fre
qu
en
cy o
f d
ays w
he
re t
ma
x >
0
Ou
ran
os –
Clim
ate
Sce
na
rio
s R
ep
ort
(F
eb
rua
ry
20
08
)
He
atin
g D
eg
ree
Da
ys (
HD
D)
pa
ram
ete
r a
ve
rag
e a
nn
ua
l h
ea
tin
g d
eg
ree
da
ys w
ith
a r
efe
ren
ce
O
ura
no
s –
Clim
ate
Sce
na
rio
s R
ep
ort
(F
eb
rua
ry

En
gin
ee
rin
g V
uln
era
bili
ty A
sse
ssm
en
t o
f th
e M
ain
Sta
tistics C
an
ad
a B
uild
ing
to
th
e I
mp
acts
of
Clim
ate
Ch
an
ge
HO
K C
an
ad
a
6
8:1
28
tem
pe
ratu
re o
f 1
8°C
20
08
)
Hu
mid
ex (
mo
nth
ly a
ve
rag
e):
�
Extr
em
e H
um
ide
x
�
Da
ys w
ith
Hu
mid
ex >
= 3
0
�
Da
ys w
ith
Hu
mid
ex >
= 3
5
�
Da
ys w
ith
Hu
mid
ex >
= 4
0 R
ela
tive
hu
mid
ity
Hu
mid
ity (
mo
nth
ly a
ve
rag
e):
�
Ave
rag
e V
ap
ou
r P
ressu
re (
kP
a)
�
Ave
rag
e R
ela
tive
Hu
mid
ity -
06
00
LS
T (
%)
�
Ave
rag
e R
ela
tive
Hu
mid
ity -
15
00
LS
T (
%)
Da
ta g
ath
ere
d f
rom
En
vir
on
me
nt
Ca
na
da
d
ata
ba
se
s f
or
McD
on
ald
Ca
rtie
r sta
tio
n (
ID
61
06
00
0),
Ott
aw
a.
Ca
na
dia
n C
lima
te N
orm
als
(1
97
1-2
00
0)
Lis
t E
xtr
em
e C
lim
ate
ev
en
t
Fre
qu
en
cy
D
ura
tio
n
Sta
te J
us
tifi
ca
tio
n
for
infill
of
mis
sin
g d
ata
No
extr
em
e c
lima
tic e
ve
nts
co
nsid
ere
d in
th
is
asse
ssm
en
t d
ue
to
th
e u
nce
rta
inty
of
futu
re
pro
jectio
ns o
f e
xtr
em
e e
ve
nts
.

En
gin
ee
rin
g V
uln
era
bili
ty A
sse
ssm
en
t o
f th
e M
ain
Sta
tistics C
an
ad
a B
uild
ing
to
th
e I
mp
acts
of
Clim
ate
Ch
an
ge
HO
K C
an
ad
a
6
9:1
28
4
.2.3
Sta
te C
lim
ate
Ch
an
ge
As
su
mp
tio
ns
Re
lev
an
ce
& a
pp
lic
ab
ilit
y o
f O
bs
erv
ed
glo
ba
l o
r re
gio
na
l c
lim
ate
ch
an
ge
tre
nd
s
Inc
rem
en
tal
ch
an
ge
s
to in
fra
str
uctu
re
% i
nc
rea
se
or
de
cre
as
e t
o
Cli
ma
te C
ha
ng
e B
as
eli
ne
ba
se
d
on
TR
EN
DS
Infi
ll d
ata
(w
he
re a
pp
rop
ria
te)
&
refe
ren
ce
so
urc
es
-
Pro
vid
e w
ritt
en
ju
stifica
tio
n
Re
lev
an
ce
& a
pp
lic
ab
ilit
y o
f O
bs
erv
ed
glo
ba
l o
r re
gio
na
l c
lim
ate
ch
an
ge
tre
nd
s
Inc
rem
en
tal
ch
an
ge
s
to in
fra
str
uctu
re
% i
nc
rea
se
or
de
cre
as
e t
o
Cli
ma
te C
ha
ng
e B
as
eli
ne
ba
se
d
on
SE
NS
ITIT
Y A
NA
LY
SIS
Infi
ll d
ata
(w
he
re a
pp
rop
ria
te)
&
refe
ren
ce
so
urc
es
-
Pro
vid
e w
ritt
en
ju
stifica
tio
n
Clim
ate
ch
an
ge
fu
ture
s n
ot
asse
sse
d u
sin
g s
en
sitiv
ity a
na
lysis
. T
he
refo
re,
no
tre
nd
s in
clu
de
d in
th
is
se
ctio
n.
Sta
te a
nd
De
sc
rib
e C
lim
ate
Ch
an
ge
Mo
de
ls u
se
d,
if a
ny
Th
ree
se
pa
rate
tim
e h
ori
zo
ns w
ere
use
d f
or
asse
ssin
g t
he
clim
ate
ch
an
ge
vu
lne
rab
ility
of
this
b
uild
ing
: h
ori
zo
n 2
02
0 (
20
11
-20
40
in
th
e m
od
el)
;
ho
rizo
n 2
05
0 (
20
41
-20
70
in
th
e m
od
el)
; a
nd
h
ori
zo
n 2
08
0 (
20
71
-21
00
in
th
e m
od
el)
. B
ase
line
clim
ate
da
ta w
ith
re
sp
ect
to t
he
pre
se
nt
pe
rio
d (
19
61
-19
90
) w
as d
eve
lop
ed
as f
ollo
ws:
Ob
se
rve
d w
ea
the
r sta
tio
n d
ata
wa
s o
bta
ine
d f
rom
En
vir
on
me
nt
Ca
na
da
’s n
atio
na
l a
rch
ive
s f
or
the
are
a o
f in
tere
st.
Arc
hiv
ed
da
ta w
ere
scre
en
ed
in
ord
er
to s
ele
ct
sta
tio
ns d
ee
me
d t
o h
ave
a
su
ffic
ien
tly lo
ng
/co
mp
lete
re
co
rd.
Se
lectio
n c
rite
ria
in
clu
de
d:
a d
ata
se
rie
s m
inim
um
le
ng
th o
f 2
0
ye
ars
, w
ith
le
ss t
ha
n 1
0%
mis
sin
g d
ata
an
d a
fin
al ye
ar
be
ing
no
ea
rlie
r th
an
19
95
. G
eo
gra
ph
ic c
ove
rag
e o
f clim
ate
ch
an
ge
sce
na
rio
s:
Th
e f
utu
re c
lima
te c
ha
ng
e s
ce
na
rio
s w
ere
de
ve
lop
ed
ba
se
d o
n a
sp
atia
l a
rea
as f
ollo
ws:
Tw
o
mo
de
llin
g s
imu
latio
ns (
CR
CM
4.1
.1 A
CU
; C
RC
M4
.1.1
AD
C)
we
re c
arr
ied
ou
t fo
r a
do
ma
in
ce
ntr
ed
ove
r Q
ué
be
c a
nd
co
ve
rin
g a
n a
rea
of
ap
pro
xim
ate
ly 5
,05
0 k
m b
y 4
,00
0 k
m w
ith
a
ho
rizo
nta
l g
rid
-siz
e m
esh
of
45
km
(tr
ue
at
60
de
gre
es n
ort
h la
titu
de
) fo
r th
e p
eri
od
s 1
96
1-2
10
0.
Re
fere
nc
e
Ou
ran
os –
Clim
ate
Sce
na
rio
s R
ep
ort
(F
eb
rua
ry
20
08
)
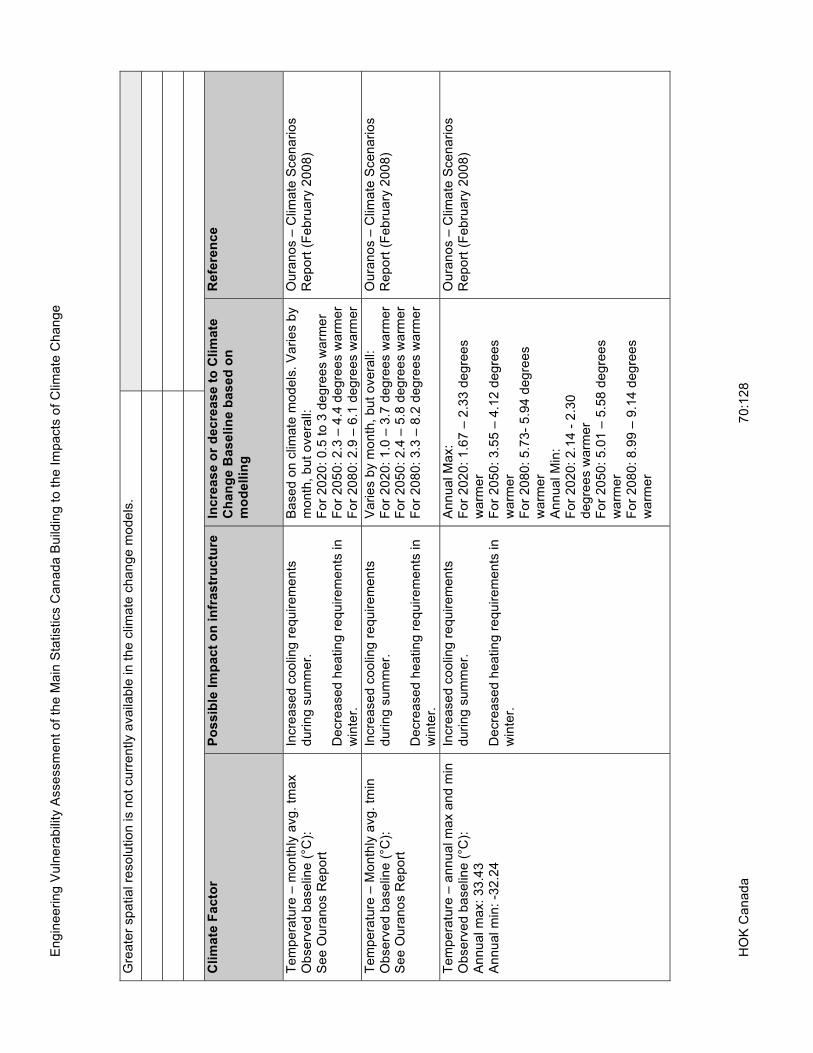
En
gin
ee
rin
g V
uln
era
bili
ty A
sse
ssm
en
t o
f th
e M
ain
Sta
tistics C
an
ad
a B
uild
ing
to
th
e I
mp
acts
of
Clim
ate
Ch
an
ge
HO
K C
an
ad
a
7
0:1
28
Gre
ate
r sp
atia
l re
so
lutio
n is n
ot
cu
rre
ntly a
va
ilab
le in
th
e c
lima
te c
ha
ng
e m
od
els
.
Cli
ma
te F
ac
tor
Po
ss
ible
Im
pa
ct
on
in
fra
str
uc
ture
In
cre
as
e o
r d
ec
rea
se
to
Cli
ma
te
Ch
an
ge
Ba
se
lin
e b
as
ed
on
m
od
ell
ing
Re
fere
nc
e
Te
mp
era
ture
– m
on
thly
avg
. tm
ax
Ob
se
rve
d b
ase
line
(°C
):
Se
e O
ura
no
s R
ep
ort
Incre
ase
d c
oo
ling
re
qu
ire
me
nts
d
uri
ng
su
mm
er.
D
ecre
ase
d h
ea
tin
g r
eq
uir
em
en
ts in
w
inte
r.
Ba
se
d o
n c
lima
te m
od
els
. V
ari
es b
y
mo
nth
, b
ut
ove
rall:
F
or
20
20
: 0
.5 t
o 3
de
gre
es w
arm
er
F
or
20
50
: 2
.3 –
4.4
de
gre
es w
arm
er
Fo
r 2
08
0:
2.9
– 6
.1 d
eg
ree
s w
arm
er
Ou
ran
os –
Clim
ate
Sce
na
rio
s
Re
po
rt (
Fe
bru
ary
20
08
)
Te
mp
era
ture
– M
on
thly
avg
. tm
in
Ob
se
rve
d b
ase
line
(°C
):
Se
e O
ura
no
s R
ep
ort
Incre
ase
d c
oo
ling
re
qu
ire
me
nts
d
uri
ng
su
mm
er.
D
ecre
ase
d h
ea
tin
g r
eq
uir
em
en
ts in
w
inte
r.
Va
rie
s b
y m
on
th,
bu
t o
ve
rall:
F
or
20
20
: 1
.0 –
3.7
de
gre
es w
arm
er
Fo
r 2
05
0:
2.4
– 5
.8 d
eg
ree
s w
arm
er
Fo
r 2
08
0:
3.3
– 8
.2 d
eg
ree
s w
arm
er
Ou
ran
os –
Clim
ate
Sce
na
rio
s
Re
po
rt (
Fe
bru
ary
20
08
)
Te
mp
era
ture
– a
nn
ua
l m
ax a
nd
min
O
bse
rve
d b
ase
line
(°C
):
An
nu
al m
ax:
33
.43
A
nn
ua
l m
in:
-32
.24
Incre
ase
d c
oo
ling
re
qu
ire
me
nts
d
uri
ng
su
mm
er.
D
ecre
ase
d h
ea
tin
g r
eq
uir
em
en
ts in
w
inte
r.
An
nu
al M
ax:
Fo
r 2
02
0:
1.6
7 –
2.3
3 d
eg
ree
s
wa
rme
r F
or
20
50
: 3
.55
– 4
.12
de
gre
es
wa
rme
r F
or
20
80
: 5
.73
- 5
.94
de
gre
es
wa
rme
r A
nn
ua
l M
in:
Fo
r 2
02
0:
2.1
4 -
2.3
0
de
gre
es w
arm
er
Fo
r 2
05
0:
5.0
1 –
5.5
8 d
eg
ree
s
wa
rme
r F
or
20
80
: 8
.99
– 9
.14
de
gre
es
wa
rme
r
Ou
ran
os –
Clim
ate
Sce
na
rio
s
Re
po
rt (
Fe
bru
ary
20
08
)

En
gin
ee
rin
g V
uln
era
bili
ty A
sse
ssm
en
t o
f th
e M
ain
Sta
tistics C
an
ad
a B
uild
ing
to
th
e I
mp
acts
of
Clim
ate
Ch
an
ge
HO
K C
an
ad
a
7
1:1
28
Ra
in –
Avg
. to
tal ra
in
Ob
se
rve
d b
ase
line
(m
m):
A
nn
ua
l: 7
13
.98
D
JF
: 6
3.8
0
MA
M:
16
9.7
6
JJA
: 2
57
.01
S
ON
: 2
24
.22
Sh
ed
an
d d
rain
in
cre
asin
g a
mo
un
ts
of
rain
.
Incre
ase
d w
ate
r ta
ble
/pre
ssu
re o
n
fou
nd
atio
n a
nd
fo
otin
gs.
Dro
ug
ht
imp
act
on
site
flo
ra d
uri
ng
su
mm
er.
An
nu
al:
20
20
: 6
-9%
in
cre
ase
2
05
0:
14
-18
% in
cre
ase
2
08
0:
25
-28
% in
cre
ase
D
JF
: 2
02
0:
31
-48
% in
cre
ase
2
05
0:
75
-11
1%
in
cre
ase
2
08
0:
14
6-2
60
% in
cre
ase
M
AM
:
20
20
: 1
3-3
5%
in
cre
ase
2
05
0:
40
% in
cre
ase
2
08
0:
56
-60
% in
cre
ase
JJA
: 2
02
0:
0-9
% d
ecre
ase
2
05
0:
3-5
% d
ecre
ase
2
08
0:
5-9
% d
ecre
ase
S
ON
: 2
02
0:
2-9
% in
cre
ase
2
05
0:
10
% in
cre
ase
2
08
0:
18
-30
% in
cre
ase
Ra
in –
dry
sp
ells
/we
t sp
ells
O
bse
rve
d b
ase
line
(d
ays):
A
vg
. m
ax d
rysp
ell:
8.1
9
Avg
. m
ax w
ets
pe
ll: 2
.81
Pla
nt
se
lectio
n f
or
lan
dsca
pin
g a
nd
n
ee
d f
or
irri
ga
tio
n.
A
vg
. M
ax D
rysp
ell:
2
02
0:
inco
nclu
siv
e
20
50
: 0
.13
to
1.1
8 d
ays s
ho
rte
r (2
-1
5%
) 2
08
0:
inco
nclu
siv
e
Avg
. M
ax W
ets
pe
ll 2
02
0:
0.0
9 t
o 0
.12
da
ys s
ho
rte
r (3
-4
%)
20
50
: in
co
nclu
siv
e
20
80
: in
co
nclu
siv
e
Wh
ere
th
e f
utu
re c
ha
ng
e m
od
els
of
AC
U a
nd
AD
C d
isa
gre
ed
in
te
rms
of
an
in
cre
ase
or
de
cre
ase
, th
e
pro
jectio
n w
as a
ssu
me
d t
o b
e
inco
nclu
siv
e.
Ra
in –
Avg
. M
ax r
ain
O
bse
rve
d b
ase
line
(m
m)
1 d
ay p
eri
od
: 4
6.6
6
2 d
ay p
eri
od
: 5
5.5
2
5 d
ay p
eri
od
: 7
2.4
1
Incre
ase
d d
em
an
d o
n h
an
dlin
g
vo
lum
e o
f ra
inw
ate
r fr
om
ro
of
an
d
site
.
1 d
ay p
eri
od
: 2
02
0:
2-8
% in
cre
ase
2
05
0:
3-1
4%
in
cre
ase
2
08
0:
15
-18
% in
cre
ase
2
da
y p
eri
od
:

En
gin
ee
rin
g V
uln
era
bili
ty A
sse
ssm
en
t o
f th
e M
ain
Sta
tistics C
an
ad
a B
uild
ing
to
th
e I
mp
acts
of
Clim
ate
Ch
an
ge
HO
K C
an
ad
a
7
2:1
28
20
20
: in
co
nclu
siv
e
20
50
: 6
-7%
in
cre
ase
2
08
0:
10
-20
% in
cre
ase
5
da
y p
eri
od
: 2
02
0:
0-1
% in
cre
ase
2
05
0:
5-6
% in
cre
ase
2
08
0:
9-1
5%
in
cre
ase
Ra
in –
6h
fre
qu
en
cy
Ob
se
rve
d b
ase
line
(fr
eq
ue
ncy):
5
mm
cu
toff
: 0
.02
3
10
mm
cu
toff
: 0
.00
9
20
mm
cu
toff
: 0
.00
2
Incre
ase
d d
em
an
d o
n h
an
dlin
g
sh
ort
bu
rsts
of
hig
h v
olu
me
ra
inw
ate
r fr
om
ro
of
an
d s
ite
.
5m
m c
uto
ff:
20
20
: 6
-10
% in
cre
ase
2
05
0:
19
-23
% in
cre
ase
2
08
0:
35
-37
% in
cre
ase
1
0m
m c
uto
ff:
20
20
: 1
3-2
1%
in
cre
ase
2
05
0:
26
-58
% in
cre
ase
2
08
0:
69
-74
% in
cre
ase
2
0 m
m c
uto
ff:
20
20
: 2
4-5
5%
in
cre
ase
2
05
0:6
7-1
13
% in
cre
ase
2
08
0:
17
3-1
90
% in
cre
ase
No
te t
ha
t th
e o
bse
rve
d (
ba
se
line
fr
eq
ue
ncy is v
ery
lo
w,
ma
kin
g t
he
se
in
cre
ase
s r
ela
tive
ly in
sig
nific
an
t).
Ra
in –
1 d
ay f
req
ue
ncy
Ob
se
rve
d b
ase
line
(fr
eq
ue
ncy):
5
mm
cu
toff
: 0
.12
1
0m
m c
uto
ff:
0.0
6
20
mm
cu
toff
: 0
.02
Incre
ase
d d
em
an
d o
n h
an
dlin
g
sh
ort
bu
rsts
of
hig
h v
olu
me
ra
inw
ate
r fr
om
ro
of
an
d s
ite
.
5m
m c
uto
ff:
20
20
: 6
-7%
in
cre
ase
2
05
0:
15
-16
% in
cre
ase
2
08
0:
20
-23
% in
cre
ase
1
0m
m c
uto
ff:
20
20
: 6
-9%
in
cre
ase
2
05
0:
18
-21
% in
cre
ase
2
08
0:
31
-37
% in
cre
ase
2
0m
m c
uto
ff:
20
20
: 1
8-2
0%
in
cre
ase
2
05
0:
27
-57
% in
cre
ase
2
08
0:
76
-77
% in
cre
ase
No
te t
ha
t th
e o
bse
rve
d (
ba
se
line
fr
eq
ue
ncy is v
ery
lo
w,
ma
kin
g t
he
se
in
cre
ase
s r
ela
tive
ly in
sig
nific
an
t).
Ra
in –
Sim
ple
Da
ily in
ten
sity in
de
x
Ob
se
rve
d b
ase
line
(m
m/d
ay):
8.4
2
Incre
ase
d d
em
an
d o
n h
an
dlin
g o
ne
d
ay e
ve
nts
of
rain
wa
ter
fro
m r
oo
f a
nd
site
.
20
20
: 2
-4%
in
cre
ase
2
05
0:
6-9
% in
cre
ase
2
08
0:
12
-15
% in
cre
ase
Sn
ow
– a
ve
rag
e t
ota
l sn
ow
O
bse
rve
d b
ase
line
(S
WE
):
An
nu
al: 2
08
.69
De
cre
ase
d s
no
w lo
ad
on
ro
ofin
g
syste
ms.
An
nu
al:
20
20
: 1
0-1
1%
de
cre
ase
2
05
0:
16
-22
% d
ecre
ase

En
gin
ee
rin
g V
uln
era
bili
ty A
sse
ssm
en
t o
f th
e M
ain
Sta
tistics C
an
ad
a B
uild
ing
to
th
e I
mp
acts
of
Clim
ate
Ch
an
ge
HO
K C
an
ad
a
7
3:1
28
DJF
: 1
46
.02
M
AM
: 4
1.4
6
JJA
: 0
S
ON
: 2
0.6
4
20
80
: 2
9-3
3%
de
cre
ase
D
JF
: 2
02
0:
5-1
0%
de
cre
ase
2
05
0:
3-1
9%
de
cre
ase
2
08
0:
15
-22
% d
ecre
ase
M
AM
: 2
02
0:
13
-15
% d
ecre
ase
2
05
0:
23
-27
% d
ecre
ase
2
08
0:
43
-55
% d
ecre
ase
JJA
:
Ze
ro c
ha
ng
e f
or
all
futu
res (
ze
ro
sn
ow
) S
ON
: 2
02
0:
14
-31
% d
ecre
ase
2
05
0:
40
-60
% d
ecre
ase
2
08
0:
49
-68
% d
ecre
ase
Sn
ow
– a
nn
ua
l m
ax s
no
w
Ob
se
rve
d b
ase
line
(m
m):
1
da
y p
eri
od
: 2
1.2
1
2 d
ay p
eri
od
: 2
5.9
5
5 d
ay p
eri
od
: 3
3.0
7
Ab
ility
to
ha
nd
le s
ho
rt in
ten
se
sn
ow
fall
eve
nts
– s
no
wcle
ari
ng
, sn
ow
loa
d.
1 d
ay p
eri
od
: 2
02
0:
inco
nclu
siv
e
20
50
: 0
-2%
in
cre
ase
2
08
0:
inco
nclu
siv
e
2 d
ay p
eri
od
: 2
02
0:
inco
nclu
siv
e
20
50
: 1
-4%
in
cre
ase
2
08
0:
inco
nclu
siv
e
5 d
ay p
eri
od
: in
co
nclu
siv
e f
or
all
futu
res
Wh
ere
th
e f
utu
re c
ha
ng
e m
od
els
of
AC
U a
nd
AD
C d
isa
gre
ed
in
te
rms
of
an
in
cre
ase
or
de
cre
ase
, th
e
pro
jectio
n w
as a
ssu
me
d t
o b
e
inco
nclu
siv
e.
Sn
ow
– 1
da
y f
req
ue
ncy
Ob
se
rve
d f
req
ue
ncy:
5m
m S
WE
cu
toff
: 0
.03
8
10
mm
SW
E c
uto
ff:
0.0
13
2
0m
m S
WE
cu
toff
: 0
.00
2
De
cre
ase
d d
em
an
d t
o h
an
dle
sh
ort
in
ten
se
sn
ow
fall
eve
nts
–
sn
ow
cle
ari
ng
, sn
ow
loa
d.
5m
m S
WE
cu
toff
: 2
02
0:
7-2
1%
de
cre
ase
2
05
0:
17
-27
% d
ecre
ase
2
08
0:
32
-41
% d
ecre
ase
1
0m
m S
WE
cu
toff
: 2
02
0:
4-1
7%
de
cre
ase
2
05
0:
14
-18
% d
ecre
ase
2
08
0:
24
-25
% d
ecre
ase
2
0m
m S
WE
cu
toff
: 2
02
0:
inco
nclu
siv
e
20
50
: 2
-11
% in
cre
ase
Wh
ere
th
e f
utu
re c
ha
ng
e m
od
els
of
AC
U a
nd
AD
C d
isa
gre
ed
in
te
rms
of
an
in
cre
ase
or
de
cre
ase
, th
e
pro
jectio
n w
as a
ssu
me
d t
o b
e
inco
nclu
siv
e.
N
ote
th
at
the
ob
se
rve
d (
ba
se
line
fr
eq
ue
ncy is v
ery
lo
w,
ma
kin
g t
he
se
in
cre
ase
s r
ela
tive
ly in
sig
nific
an
t).

En
gin
ee
rin
g V
uln
era
bili
ty A
sse
ssm
en
t o
f th
e M
ain
Sta
tistics C
an
ad
a B
uild
ing
to
th
e I
mp
acts
of
Clim
ate
Ch
an
ge
HO
K C
an
ad
a
7
4:1
28
20
80
: in
co
nclu
siv
e
Sn
ow
– s
imp
le d
aily
in
ten
sity in
de
x
Ob
se
rve
d b
ase
line
(m
m/d
ay):
5
.39
Sn
ow
cle
ari
ng
an
d s
no
wlo
ad
d
em
an
d o
n r
oo
f a
nd
site
.
20
20
: 0
-1%
de
cre
ase
2
05
0:
inco
nclu
siv
e
20
80
: 2
-3%
in
cre
ase
Wh
ere
th
e f
utu
re c
ha
ng
e m
od
els
of
AC
U a
nd
AD
C d
isa
gre
ed
in
te
rms
of
an
in
cre
ase
or
de
cre
ase
, th
e
pro
jectio
n w
as a
ssu
me
d t
o b
e
inco
nclu
siv
e.
Sn
ow
– R
ain
on
Sn
ow
eve
nts
O
bse
rve
d b
ase
line
(fr
eq
ue
ncy):
1
mm
cu
toff
: 0
.03
0
5m
m c
uto
ff:
0.0
15
1
0m
m c
uto
ff:
0.0
07
Incre
ase
d n
ee
d t
o s
he
d/d
rain
ra
in
du
rin
g w
inte
r/co
ld d
ays.
1
mm
ra
in c
uto
ff:
20
20
: in
co
nclu
siv
e
20
50
: in
co
nclu
siv
e
20
80
: 4
-8%
in
cre
ase
5
mm
ra
in c
uto
ff:
20
20
: 8
% in
cre
ase
2
05
0:
11
-23
% in
cre
ase
2
08
0:
17
-26
% in
cre
ase
1
0m
m r
ain
cu
toff
: 2
02
0:
8-2
3%
in
cre
ase
2
05
0:
18
-33
% in
cre
ase
2
08
0:
23
-61
% in
cre
ase
Wh
ere
th
e f
utu
re c
ha
ng
e m
od
els
of
AC
U a
nd
AD
C d
isa
gre
ed
in
te
rms
of
an
in
cre
ase
or
de
cre
ase
, th
e
pro
jectio
n w
as a
ssu
me
d t
o b
e
inco
nclu
siv
e.
Win
d –
Mo
nth
ly a
vg
win
d6
h
Ob
se
rve
d b
ase
line
: S
ee
Ou
ran
os R
ep
ort
Win
d d
rive
n s
no
w a
nd
ra
in d
uri
ng
w
inte
r a
ga
inst
faça
de
an
d w
alls
.
Le
ss w
ind
dri
ve
n r
ain
in
su
mm
ers
.
Va
rie
s b
y m
on
th a
nd
fu
ture
. G
en
era
lly p
roje
cte
d c
ha
ng
e v
ari
es
be
twe
en
a d
ecre
ase
of
9%
to
an
in
cre
ase
of
11
% in
ob
se
rve
d w
ind
sp
ee
d in
km
/h f
or
avg
. 6
h p
eri
od
.
Ge
ne
rally
win
die
r w
inte
rs,
ca
lme
r su
mm
ers
.
Win
d –
Avg
. a
nn
ua
l m
ax w
ind
6h
O
bse
rve
d b
ase
line
: 4
8.0
3 k
m/h
Le
ss w
ind
lo
ad
on
ph
ysic
al
str
uctu
re,
win
do
ws a
nd
wa
lls,
do
ors
, e
tc.
20
20
: in
co
nclu
siv
e
20
50
: 1
-2%
de
cre
ase
2
08
0:
3-4
% d
ecre
ase
Wh
ere
th
e f
utu
re c
ha
ng
e m
od
els
of
AC
U a
nd
AD
C d
isa
gre
ed
in
te
rms
of
an
in
cre
ase
or
de
cre
ase
, th
e
pro
jectio
n w
as a
ssu
me
d t
o b
e
inco
nclu
siv
e.
Fro
st
Se
aso
n L
en
gth
– d
ays
Ob
se
rve
d b
ase
line
: 1
25
.14
da
ys
Incre
ase
d g
row
ing
se
aso
n a
ffe
cts
ty
pe
s o
f flo
ra f
or
lan
dsca
pin
g.
Le
ss d
em
an
d f
or
he
atin
g d
uri
ng
w
inte
r.
20
20
: 1
6-2
4 d
ays le
ss
20
50
: 2
8-3
8 d
ays le
ss
20
80
: 5
1-6
1 d
ays le
ss
Fre
eze
Th
aw
Eve
nts
– f
req
ue
ncy
Ob
se
rve
d b
ase
line
: L
ess f
rost
he
avin
g o
f w
alk
wa
ys,
sta
irs,
pa
ve
rs,
ma
so
nry
2
02
0:
2-6
% d
ecre
ase
2
05
0:
5-8
% d
ecre
ase

En
gin
ee
rin
g V
uln
era
bili
ty A
sse
ssm
en
t o
f th
e M
ain
Sta
tistics C
an
ad
a B
uild
ing
to
th
e I
mp
acts
of
Clim
ate
Ch
an
ge
HO
K C
an
ad
a
7
5:1
28
0.2
1 f
req
ue
ncy
de
teri
ora
tio
n,
etc
. 2
08
0:
13
-14
% d
ecre
ase
He
atin
g D
eg
ree
Da
ys –
O
bse
rve
d b
ase
line
:
43
76
.73
HD
D
De
cre
ase
d h
ea
tin
g lo
ad
du
rin
g
win
ter.
In
cre
ase
d g
row
ing
se
aso
n a
ffe
cts
ty
pe
s o
f flo
ra f
or
lan
dsca
pin
g.
20
20
: 5
67
-81
0 d
ays le
ss
20
50
: 1
17
8-1
28
7 d
ays le
ss
20
80
: 1
88
9-1
95
0 d
ays le
ss
Hu
mid
ex (
mo
nth
ly a
ve
rag
e):
E
xtr
em
e H
um
ide
x
Da
ys w
ith
Hu
mid
ex >
= 3
0
Da
ys w
ith
Hu
mid
ex >
= 3
5
Da
ys w
ith
Hu
mid
ex >
= 4
0 R
ela
tive
h
um
idity
Ob
se
rve
d b
ase
line
: S
ee
Ott
aw
a C
lima
te N
orm
als
19
71
-2
00
0.x
ls
De
cre
ase
d a
bili
ty f
or
CH
CP
an
d
roo
f to
p u
nits t
o m
ain
tain
ad
eq
ua
te
co
olin
g t
o b
uild
ing
du
rin
g s
um
me
r.
No
fu
ture
pro
jectio
ns a
va
ilab
le.
Hu
mid
ity (
mo
nth
ly a
ve
rag
e):
A
ve
rag
e V
ap
ou
r P
ressu
re (
kP
a)
A
ve
rag
e R
ela
tive
Hu
mid
ity -
0
60
0L
ST
(%
)
Ave
rag
e R
ela
tive
Hu
mid
ity -
1
50
0L
ST
(%
) O
bse
rve
d b
ase
line
: S
ee
Ott
aw
a C
lima
te N
orm
als
19
71
-2
00
0.x
ls
De
cre
ase
d a
bili
ty f
or
CH
CP
an
d
roo
f to
p u
nits t
o m
ain
tain
ad
eq
ua
te
co
olin
g t
o b
uild
ing
du
rin
g s
um
me
r.
No
fu
ture
pro
jectio
ns a
va
ilab
le.
Pra
cti
tio
ne
r D
efi
ne
d C
lim
ate
Ch
an
ge
As
su
mp
tio
ns
R
ati
on
ale

En
gin
ee
rin
g V
uln
era
bili
ty A
sse
ssm
en
t o
f th
e M
ain
Sta
tistics C
an
ad
a B
uild
ing
to
th
e I
mp
acts
of
Clim
ate
Ch
an
ge
HO
K C
an
ad
a
7
6:1
28
4
.2.4
Sta
te T
ime
Fra
me
In
fra
str
uc
ture
Sa
fe O
pe
rati
on
Tim
e P
eri
od
Tim
e (
Ye
ars
)
De
sig
n L
ife
of
Infr
as
tru
ctu
re c
om
po
ne
nts
Infr
as
tru
ctu
re C
om
po
ne
nt
Infr
as
tru
ctu
re C
om
po
ne
nt/
Sy
ste
m
SE
RV
ICE
LIF
E
(Ye
ars
)
SE
RV
ICE
LIF
E
RE
MA
ININ
G
(Ye
ars
)
EX
TE
RIO
R S
YS
TE
MS
Site
Dra
ina
ge
– r
ela
ted
to
slo
pe
s a
wa
y
fro
m t
he
bu
ildin
g a
nd
in
clu
de
s s
oil
pe
rme
ab
ility
a
nd
ha
rd s
urf
ace
s lik
e s
tair
s /
ra
mp
s
30
to
60
1
0 t
o 2
5
Site
Dra
ins –
sto
rm/r
ain
wa
ter
[ a
dd
ed
] 8
0
25
Wa
lls
F
ree
sta
nd
ing
co
ncre
te
80
3
5
ma
so
nry
7
5
35
R
eta
inin
g
co
ncre
te
40
1
0 t
o 2
0

En
gin
ee
rin
g V
uln
era
bili
ty A
sse
ssm
en
t o
f th
e M
ain
Sta
tistics C
an
ad
a B
uild
ing
to
th
e I
mp
acts
of
Clim
ate
Ch
an
ge
HO
K C
an
ad
a
7
7:1
28
4.2
.4 S
tate
Tim
e F
ram
e
ma
so
nry
n
ot
ap
plic
ab
le
Wa
lkw
ays
A
sp
ha
lt
22
3
to
20
C
on
cre
te
30
3
to
15
U
nit p
ave
rs
30
1
8
Sta
irs
C
on
cre
te
30
2
0
M
eta
l 2
0
20
Ra
mp
s
30
2
5
Lo
ad
ing
do
ck
20
1
5
Win
do
w /
Sta
ir w
ells
C
on
cre
te
40
1
0 t
o 2
0
M
aso
nry
n
ot
ap
plic
ab
le
Gu
tte
rs -
me
tal
Pa
rkin
g,
ve
hic
le a
rea
s
A
sp
ha
lt
20
1
0
C
on
cre
te
no
t a
pp
lica
ble
U
nit p
ave
rs
no
t a
pp
lica
ble
Ma
nh
ole
s/a
cce
ss d
oo
rs
BU
ILD
ING
SY
ST
EM
S
Fo
un
da
tio
n F
loo
rs a
nd
Ro
ofs
F
oo
tin
gs –
co
ncre
te
11
0
55
W
alls
- c
on
cre
te
11
0
55
S
lab
on
gra
de
- c
on
cre
te
11
0
55
P
reca
st
Lig
ht
We
igh
t C
on
cre
te
P
an
el R
oo
f 1
10
5
5

En
gin
ee
rin
g V
uln
era
bili
ty A
sse
ssm
en
t o
f th
e M
ain
Sta
tistics C
an
ad
a B
uild
ing
to
th
e I
mp
acts
of
Clim
ate
Ch
an
ge
HO
K C
an
ad
a
7
8:1
28
4.2
.4 S
tate
Tim
e F
ram
e
En
ve
lop
Syste
ms
P
reca
st
Co
ncre
te
no
t a
pp
lica
ble
G
laze
d C
urt
ain
wa
ll
50
3
5
M
aso
nry
wa
ll 7
5
plu
s 3
0
S
ton
e P
an
els
(in
clu
din
g h
ea
de
r a
nd
sill
s)
50
to
90
2
5 t
o 3
5
M
eta
l C
lad
din
g
50
1
0 t
o 1
5
Win
do
ws /
Do
ors
A
lum
inu
m W
ind
ow
s
50
3
5
D
oo
rs (
Ste
el /
Alu
min
um
) 4
5 t
o 5
0
25
to
40
Fla
t R
oo
f S
yste
ms
20
to
25
1
to
20
ME
CH
AN
ICA
L S
YS
TE
MS
He
atin
g S
yste
m a
nd
Ad
eq
ua
cy
25
to
40
1
to
25
Co
olin
g S
yste
m a
nd
Ad
eq
ua
cy
25
4
to
15
EL
EC
TR
ICA
L S
YS
TE
MS
Em
erg
en
cy p
ow
er
syste
ms /
ge
ne
rato
rs
(in
clu
din
g f
ue
l su
pp
ly)
25
to
35
1
0 t
o 3
5
Po
we
r S
up
ply
an
d R
elia
bili
ty
Oth
er
Re
lev
an
t C
om
me
nts
De
sig
n life
an
d e
xp
ecte
d s
erv
ice
life
re
ma
inin
g b
ase
d o
n B
uild
ing
Co
nd
itio
n R
ep
ort
, D
ece
mb
er
20
07
.

En
gin
ee
rin
g V
uln
era
bili
ty A
sse
ssm
en
t o
f th
e M
ain
Sta
tistics C
an
ad
a B
uild
ing
to
th
e I
mp
acts
of
Clim
ate
Ch
an
ge
HO
K C
an
ad
a
7
9:1
28
4
.2.5
Ge
og
rap
hy
M
ajo
r C
om
po
ne
nts
of
loc
al
ge
og
rap
hy
Re
fere
nc
e
Fo
r in
tro
du
cti
on
, s
ee
4.1
.4
Mic
roclim
ate
aro
un
d t
he
in
fra
str
uctu
re is in
flu
en
ce
d b
y p
roxim
ity t
o t
he
Ott
aw
a R
ive
r. T
his
is
assu
me
d t
o c
rea
te a
mo
de
ratio
n o
f th
e t
em
pe
ratu
re d
uri
ng
sp
rin
g t
ime
wh
ile ice
an
d c
old
me
lt
wa
ter
flo
w.
In t
he
fa
ll, t
he
eff
ect
is a
ssu
me
d t
o b
e r
eve
rse
, e
leva
tin
g t
he
te
mp
era
ture
slig
htly.
Ho
we
ve
r, t
he
se
eff
ects
are
pro
ba
bly
min
or
in n
atu
re a
nd
he
avily
de
pe
nd
an
t u
po
n t
he
win
d.
- n
on
e -
It w
as n
ote
d t
ha
t w
ind
s c
an
be
pa
rtic
ula
rly s
tro
ng
on
th
e s
ite
du
e t
o t
he
la
yo
ut
of
the
Tu
nn
ey’s
P
astu
re c
am
pu
s a
nd
th
e N
NW
-SS
E a
xis
ori
en
tatio
n o
f P
rom
en
ad
e T
un
ne
y's
Pa
stu
re D
rive
wa
y
alo
ng
wh
ich
ma
ny o
f th
e c
am
pu
se
s b
uild
ing
s a
re o
rie
nte
d.
By in
terv
iew
with
SN
C-L
ava
lin P
rofa
c b
uild
ing
m
an
ag
ers
an
d P
WG
SC
re
pre
se
nta
tive
s.
4
.2.6
Sp
ec
ific
Ju
ris
dic
tio
na
l C
on
sid
era
tio
ns
Fo
r in
tro
du
ctio
n,
se
e 4
.1.5
Ju
ris
dic
tio
n t
ha
t h
av
e d
ire
ct
co
ntr
ol
or
infl
ue
nc
e o
n i
nfr
as
tru
ctu
re
Fe
de
ral G
ove
rnm
en
t o
f C
an
ad
a v
ia P
ub
lic W
ork
s a
nd
Go
ve
rnm
en
t S
erv
ice
s C
an
ad
a
Se
cti
on
s o
f la
ws
an
d b
yla
ws
th
at
es
tab
lis
h l
eg
al
str
uc
ture
fo
r th
e i
nfr
as
tru
ctu
re
Re
fere
nc
e
Th
e f
ollo
win
g G
ove
rnm
en
t o
f C
an
ad
a L
eg
isla
tio
n a
pp
lies t
o t
he
le
ga
l str
uctu
re f
or
the
b
uild
ing
s:
•
Fin
an
cia
l A
dm
inis
tra
tio
n A
ct
•
Fe
de
ral R
ea
l P
rop
ert
y a
nd
Fe
de
ral Im
mo
va
ble
s A
ct
•
Su
rplu
s C
row
n A
sse
ts A
ct
•
Pu
blic
Wo
rks a
nd
Go
ve
rnm
en
t S
erv
ice
s A
ct
No
te:
Th
e N
atio
na
l C
ap
ita
l C
om
mis
sio
n,
un
de
r th
e N
atio
na
l C
ap
ita
l A
ct,
ha
s le
gis
late
d
resp
on
sib
ilitie
s f
or
rea
l p
rop
ert
y w
ith
in t
he
Na
tio
na
l C
ap
ita
l R
eg
ion
(N
CR
). T
he
se
re
sp
on
sib
ilitie
s in
clu
de
th
e a
pp
rova
l o
f a
ll sa
les o
r tr
an
sfe
rs o
f fe
de
ral la
nd
s w
ith
in t
he
N
CR
, a
pp
rova
l o
f d
em
olit
ion
of
bu
ildin
gs o
n f
ed
era
l la
nd
s w
ith
in t
he
NC
R,
ap
pro
va
l o
f

En
gin
ee
rin
g V
uln
era
bili
ty A
sse
ssm
en
t o
f th
e M
ain
Sta
tistics C
an
ad
a B
uild
ing
to
th
e I
mp
acts
of
Clim
ate
Ch
an
ge
HO
K C
an
ad
a
8
0:1
28
4.2
.6 S
pe
cif
ic J
uri
sd
icti
on
al
Co
ns
ide
rati
on
s
la
nd
use
or
de
ve
lop
me
nt
pla
ns,
ap
pro
va
ls f
or
exte
rio
r a
lte
ratio
ns a
nd
ad
ditio
ns t
o
bu
ildin
gs o
n f
ed
era
l la
nd
s in
th
e N
CR
.
Se
cti
on
s o
f re
gu
lati
on
s t
ha
t e
sta
bli
sh
le
ga
l s
tru
ctu
re f
or
the
in
fra
str
uc
ture
R
efe
ren
ce
Th
e f
ollo
win
g f
ed
era
l re
gu
latio
ns a
pp
ly t
o t
he
le
ga
l str
uctu
re o
f th
e M
ain
Sta
tistics
Ca
na
da
bu
ildin
g:
•
Fe
de
ral R
ea
l P
rop
ert
y R
eg
ula
tio
ns
•
Pro
cu
rem
en
t T
rad
e R
eg
ula
tio
ns
•
Go
ve
rnm
en
t C
on
tra
cts
Re
gu
latio
ns
Re
al P
rop
ert
y M
an
ag
em
en
t, T
rea
su
ry B
oa
rd o
f C
an
ad
a
Se
cre
tari
at.
U
RL
: h
ttp
://w
ww
.tb
s-s
ct.
gc.c
a/r
pm
-gb
i/site
/ho
me
-accu
eil.
asp
x
Re
lev
an
t S
tan
da
rds
to
th
e d
es
ign
, o
pe
rati
on
an
d m
ain
ten
an
ce
of
the
in
fra
str
uc
ture
R
efe
ren
ce
Na
tio
na
l B
uild
ing
Co
de
of
Ca
na
da
20
05
Ca
na
da
La
bo
ur
Co
de
, P
art
II
(19
85
) a
nd
th
e s
up
po
rtin
g C
an
ad
a O
ccu
pa
tio
na
l H
ea
lth
a
nd
Sa
fety
Re
gu
latio
ns (
SO
R/8
6-3
04
).
Th
e L
ab
ou
r C
od
e a
nd
Re
gu
latio
ns a
re s
ub
se
qu
en
tly s
up
po
rte
d b
y a
ra
ng
e o
f sta
nd
ard
s p
rovid
ed
by C
an
ad
ian
Sta
nd
ard
s A
sso
cia
tio
n (
CS
A)
an
d A
me
rica
n S
ocie
ty
of
He
atin
g,
Re
frig
era
tin
g a
nd
Air
-Co
nd
itio
nin
g E
ng
ine
ers
(A
SH
RA
E).
De
taile
d lis
tin
g o
f th
ese
ap
plic
ab
le s
tan
da
rds t
o a
ll th
e e
lem
en
ts o
f th
e b
uild
ing
is b
eyo
nd
th
e s
co
pe
of
this
pro
ject.
Sp
ecific
ally
: •
AS
HR
AE
Sta
nd
ard
55
-19
81
, T
he
rma
l E
nvir
on
me
nta
l C
on
ditio
ns f
or
Hu
ma
n
Occu
pa
ncy
•
AS
HR
AE
Sta
nd
ard
62
-20
01
n,
Ve
ntila
tio
n f
or
Acce
pta
ble
In
do
or
Air
Qu
alit
y
De
pa
rtm
en
t o
f Ju
stice
Ca
na
da
: C
an
ad
a L
ab
ou
r C
od
e (
19
85
):
htt
p:/
/la
ws.ju
stice
.gc.c
a/e
n/L
-2/
Occu
pa
tio
na
l H
ea
lth
an
d S
afe
ty R
eg
ula
tio
ns (
SO
R/8
6-3
04
):
htt
p:/
/la
ws.ju
stice
.gc.c
a/e
n/L
-2/S
OR
-86
-30
4/in
de
x.h
tml
No
te,
oth
er
fed
era
l o
rga
niz
atio
ns p
lay a
ro
le in
th
e d
esig
n a
nd
op
era
tio
n o
f fe
de
ral
bu
ildin
gs,
su
ch
as:
•
Pa
rks C
an
ad
a e
sta
blis
he
s n
atio
na
l g
oa
ls t
o p
rote
ct
fed
era
l h
eri
tag
e b
uild
ing
s
an
d n
atio
na
l h
isto
ric s
ite
s.
It
als
o d
eve
lop
s p
olic
ies,
sta
nd
ard
s a
nd
gu
ide
line
s
in c
on
su
lta
tio
n w
ith
oth
er
de
pa
rtm
en
ts.
Th
rou
gh
th
e F
ed
era
l H
eri
tag
e B
uild
ing
s

En
gin
ee
rin
g V
uln
era
bili
ty A
sse
ssm
en
t o
f th
e M
ain
Sta
tistics C
an
ad
a B
uild
ing
to
th
e I
mp
acts
of
Clim
ate
Ch
an
ge
HO
K C
an
ad
a
8
1:1
28
4.2
.6 S
pe
cif
ic J
uri
sd
icti
on
al
Co
ns
ide
rati
on
s
Re
vie
w O
ffic
e,
Pa
rks C
an
ad
a p
rovid
es c
rite
ria
an
d a
pro
ce
ss f
or
eva
lua
tin
g
an
d d
esig
na
tin
g h
eri
tag
e c
ha
racte
r, p
rovid
es a
dvic
e a
nd
re
co
mm
en
da
tio
ns t
o
oth
er
de
pa
rtm
en
ts,
an
d m
ain
tain
s a
re
gis
ter
of
fed
era
l h
eri
tag
e b
uild
ing
s.
Th
e
min
iste
r re
sp
on
sib
le f
or
the
Ag
en
cy is r
esp
on
sib
le f
or
ap
pro
vin
g t
he
he
rita
ge
d
esig
na
tio
ns f
or
fed
era
l b
uild
ing
s b
ase
d o
n t
he
re
co
mm
en
da
tio
n o
f a
n
inte
rde
pa
rtm
en
tal a
dvis
ory
bo
ard
. •
Th
e C
an
ad
ian
En
vir
on
me
nta
l A
sse
ssm
en
t A
ge
ncy a
dm
inis
ters
th
e C
an
ad
ian
E
nvir
on
me
nta
l A
sse
ssm
en
t A
ct
an
d a
dvis
es f
ed
era
l d
ep
art
me
nts
(i.e
. P
WG
SC
) o
f th
eir
ob
liga
tio
ns u
nd
er
the
Act.
•
En
vir
on
me
nt
Ca
na
da
pro
vid
es a
dvic
e t
o P
WG
SC
on
en
vir
on
me
nta
l m
att
ers
, in
clu
din
g c
on
tam
ina
ted
site
s,
sp
ecie
s a
t ri
sk a
nd
en
vir
on
me
nta
l a
sse
ssm
en
t.
Th
rou
gh
a f
ull
co
nsu
lta
tive
pro
ce
ss,
the
de
pa
rtm
en
t a
lso
wo
rks w
ith
d
ep
art
me
nts
to
esta
blis
h f
ed
era
l e
nvir
on
me
nta
l g
oa
ls a
nd
ob
jective
s a
nd
to
d
eve
lop
re
gu
latio
ns,
dir
ective
s,
gu
ide
line
s,
sta
nd
ard
s,
or
co
de
s t
ha
t a
ffe
ct
the
m.
In c
o-o
pe
ratio
n w
ith
pa
rtn
ers
, th
e d
ep
art
me
nt
de
ve
lop
s e
nvir
on
me
nta
l q
ua
lity c
rite
ria
, site
asse
ssm
en
t p
roto
co
ls a
nd
oth
er
en
vir
on
me
nta
l to
ols
an
d
tech
no
log
ies.
•
Th
e D
ep
art
me
nt
of
Fis
he
rie
s a
nd
Oce
an
s C
an
ad
a,
un
de
r th
e F
ish
eri
es A
ct,
h
as a
re
gu
lato
ry f
un
ctio
n w
ith
re
sp
ect
to t
he
pro
tectio
n o
f fish
ha
bita
t a
nd
th
e
pre
ve
ntio
n o
f p
ollu
tio
n.
Fis
he
rie
s a
nd
Oce
an
s C
an
ad
a p
rovid
es a
dvic
e a
nd
su
pp
ort
to
En
vir
on
me
nt
Ca
na
da
an
d c
usto
dia
n d
ep
art
me
nts
co
nce
rnin
g,
am
on
g o
the
r th
ing
s,
the
im
pa
ct
of
co
nta
min
atio
n a
nd
re
me
dia
tio
n s
tra
teg
ies o
n
fish
ha
bita
ts.
Th
e d
ep
art
me
nt
is a
lso
th
e c
om
pe
ten
t m
inis
try f
or
aq
ua
tic
sp
ecie
s a
t ri
sk u
nd
er
the
Sp
ecie
s a
t R
isk A
ct.
•
Hu
ma
n R
eso
urc
es a
nd
Skill
s D
eve
lop
me
nt
Ca
na
da
is r
esp
on
sib
le f
or
an
d
en
su
res c
om
plia
nce
with
th
e C
an
ad
a L
ab
ou
r C
od
e,
Pa
rt 2
an
d a
tte
nd
an
t h
ea
lth
an
d s
afe
ty r
eg
ula
tio
ns w
ith
re
sp
ect
to f
ed
era
l w
ork
pla
ce
s.
Fir
e
pro
tectio
n s
erv
ice
s a
re d
eliv
ere
d b
y t
he
de
pa
rtm
en
t's L
ab
ou
r P
rog
ram
, w
hic
h
ha
s a
s its
ma
nd
ate
"e
nsu
rin
g t
he
pro
tectio
n,
co
nse
rva
tio
n a
nd
min
imiz
atio
n o
f ri
sks t
o life
, p
rop
ert
y a
nd
th
e G
ove
rnm
en
t's f
ina
ncia
l p
ositio
n".
No
te t
ha
t P
WG
SC
co
ntr
acts
with
Pri
va
te S
ecto
r B
uild
ing
Ma
na
ge
me
nt
Fir
ms t
o
op
era
te a
nd
ma
na
ge
a la
rge
po
rtio
n o
f th
e F
ed
era
l G
ove
rnm
en
t’s r
ea
l p
rop
ert
y
po
rtfo
lio.
Fo
r th
e M
ain
Sta
tistics C
an
ad
a B
uild
ing
th
is f
irm
is S
NC
-La
va
lin-P
rofa
c.

En
gin
ee
rin
g V
uln
era
bili
ty A
sse
ssm
en
t o
f th
e M
ain
Sta
tistics C
an
ad
a B
uild
ing
to
th
e I
mp
acts
of
Clim
ate
Ch
an
ge
HO
K C
an
ad
a
8
2:1
28
4.2
.6 S
pe
cif
ic J
uri
sd
icti
on
al
Co
ns
ide
rati
on
s
S
pe
cific
te
rms o
f th
e c
on
tra
ct
be
twe
en
PW
GS
C a
nd
SN
C-L
ava
lin-P
rofa
c w
ere
no
t a
va
ilab
le a
t th
e t
ime
of
this
asse
ssm
en
t. H
ow
eve
r, it
is u
nd
ers
too
d t
ha
t th
e t
erm
s
inclu
de
th
e d
esig
n,
op
era
tio
n a
nd
ma
inte
na
nce
of
the
Ma
in S
tatistics C
an
ad
a B
uild
ing
to
be
in
co
mp
lian
ce
with
all
rele
va
nt
leg
isla
tio
n,
reg
ula
tio
n,
sta
nd
ard
s,
gu
ide
line
s a
nd
p
olic
ies f
or
fed
era
l re
al p
rop
ert
y.
No
te a
lso
th
at
SN
C-L
ava
lin-P
rofa
c h
as c
on
tin
uo
use
a
cce
ss t
o P
WG
SC
ma
na
ge
me
nt
an
d s
taff
to
en
su
re p
rop
er
ma
na
ge
me
nt
of
the
b
uild
ing
an
d h
as a
cce
ss t
o P
WG
SC
Pro
fessio
na
l &
Te
ch
nic
al S
erv
ice
s G
rou
p,
the
C
en
tre
of
Exp
ert
ise
fo
r re
al p
rop
ert
y m
an
ag
em
en
t.
Re
lev
an
t G
uid
eli
ne
s f
or
de
sig
n,
op
era
tio
n a
nd
ma
inte
na
nc
e o
f th
e i
nfr
as
tru
ctu
re
Re
fere
nc
e
Th
e g
uid
elin
es t
ha
t in
form
th
e d
esig
n,
op
era
tio
n a
nd
ma
inte
na
nce
of
the
bu
ildin
gs a
re
pri
ma
rily
: •
He
alth
Ca
na
da
Gu
ide
line
s
•
Ca
na
da
La
bo
ur
Co
de
(1
98
5)
•
Th
e C
an
ad
ian
Occu
pa
tio
na
l S
afe
ty a
nd
He
alth
Re
gu
latio
ns (
CO
HS
R),
Pa
rt I
I,
Div
isio
n I
II -
HV
AC
Syste
ms
No
te t
ha
t th
e T
rea
su
ry B
oa
rd o
f C
an
ad
a S
ecre
tari
at
Occu
pa
tio
na
l S
afe
ty a
nd
He
alth
D
ire
ctive
(e
ffe
ctive
Ja
nu
ary
1st
20
06
) is
ap
plic
ab
le t
o in
off
ice
acco
mm
od
atio
n.
It
sp
ecifie
s t
ha
t th
e a
ir (
dry
bu
lb)
tem
pe
ratu
res d
uri
ng
wo
rkin
g h
ou
rs s
ho
uld
be
m
ain
tain
ed
with
in t
he
20
-26
°C r
an
ge
. T
em
pe
ratu
res b
etw
ee
n 1
7-2
0°C
an
d a
bo
ve
26
°C
ca
n b
e u
nco
mfo
rta
ble
, a
nd
occu
pa
ncy s
ho
uld
no
t e
xce
ed
3 h
ou
rs d
aily
or
12
0 h
ou
rs
an
nu
ally
in
ea
ch
of
the
se
extr
em
es.
Te
mp
era
ture
s a
bo
ve
26
°C a
re d
ee
me
d t
o b
e
un
co
mfo
rta
ble
wh
en
th
e h
um
ide
x r
ea
din
g t
o a
giv
en
te
mp
era
ture
eq
ua
ls 4
0 o
r le
ss.
Gu
ide
to
th
e M
an
ag
em
en
t o
f R
ea
l P
rop
ert
y,
Tre
asu
ry B
oa
rd o
f C
an
ad
a S
ecre
tari
at.
Tre
asu
ry B
oa
rd o
f C
an
ad
a S
ecre
tari
at.
UR
L:
htt
p:/
/ww
w.t
bs-
sct.
gc.c
a/r
pm
-gb
i/g
mrp
-gg
bi/g
mrp
-gg
bi_
e.a
sp
En
vir
on
me
nta
l G
uid
e f
or
Fe
de
ral R
ea
l P
rop
ert
y M
an
ag
ers
, T
rea
su
ry B
oa
rd o
f C
an
ad
a
Se
cre
tari
at.
T
rea
su
ry B
oa
rd o
f C
an
ad
a S
ecre
tari
at.
UR
L:
htt
p:/
/ww
w.t
bs-
sct.
gc.c
a/p
ub
s_
po
l/d
cg
pu
bs/t
b_
g3
/en
vir
o_
e.a
sp
Gu
ide
to
th
e M
on
ito
rin
g o
f R
ea
l P
rop
ert
y M
an
ag
em
en
t (C
ha
pte
r 2
-3),
Tre
asu
ry B
oa
rd
of
Ca
na
da
Se
cre
tari
at.
T
rea
su
ry B
oa
rd o
f C
an
ad
a S
ecre
tari
at.
UR
L:
htt
p:/
/ww
w.t
bs-
sct.
gc.c
a/p
ub
s_
po
l/d
cg
pu
bs/R
ea
lPro
pe
rty/a
bh
2-3
t-1
_e
.asp

En
gin
ee
rin
g V
uln
era
bili
ty A
sse
ssm
en
t o
f th
e M
ain
Sta
tistics C
an
ad
a B
uild
ing
to
th
e I
mp
acts
of
Clim
ate
Ch
an
ge
HO
K C
an
ad
a
8
3:1
28
4.2
.6 S
pe
cif
ic J
uri
sd
icti
on
al
Co
ns
ide
rati
on
s
Infr
as
tru
ctu
re o
wn
er/
op
era
tor
ad
min
istr
ati
ve
pro
ce
ss
es
an
d p
oli
cie
s a
s t
he
y
ap
ply
to
th
e i
nfr
as
tru
ctu
re
Re
fere
nc
e
Th
e f
ollo
win
g p
olic
ies a
pp
ly f
or
the
ad
min
istr
atio
n o
f re
al p
rop
ert
y w
ith
in t
he
fe
de
ral
Go
ve
rnm
en
t o
f C
an
ad
a:
Po
licy o
n I
nve
stm
en
t P
lan
nin
g –
Asse
ts a
nd
Acq
uir
ed
Se
rvic
es,
Tre
asu
ry B
oa
rd
of
Ca
na
da
Se
cre
tari
at,
Ju
ne
7,
20
07
(to
be
fu
lly im
ple
me
nte
d A
pri
l 1
, 2
01
1).
T
rea
su
ry B
oa
rd o
f C
an
ad
a S
ecre
tari
at.
UR
L:
htt
p:/
/ww
w.t
bs-
sct.
gc.c
a/p
ub
s_
po
l/d
cg
pu
bs/T
BM
_1
22
/ip
aa
s-p
iasa
_e
.asp
Po
licy o
n t
he
Ma
na
ge
me
nt
of
Re
al P
rop
ert
y,
Tre
asu
ry B
oa
rd o
f C
an
ad
a S
ecre
tari
at.
Tre
asu
ry B
oa
rd o
f C
an
ad
a S
ecre
tari
at.
UR
L:
htt
p:/
/ww
w.t
bs-
sct.
gc.c
a/p
ub
s_
po
l/d
cg
pu
bs/a
as-g
asa
/pm
rp-p
gb
i/p
mrp
-p
gb
i_e
.asp
Po
licy o
n F
ire
Pro
tectio
n,
Inve
stig
atio
n a
nd
Re
po
rtin
g,
Tre
asu
ry B
oa
rd o
f C
an
ad
a
Se
cre
tari
at.
Tre
asu
ry B
oa
rd o
f C
an
ad
a S
ecre
tari
at.
UR
L:
htt
p:/
/ww
w.t
bs-
sct.
gc.c
a/P
ub
s_
po
l/d
cg
pu
bs/R
ea
lPro
pe
rty/C
HA
P2
-5_
e.a
sp
Po
licy o
n L
on
g-t
erm
Ca
pita
l P
lan
s,
Tre
asu
ry B
oa
rd o
f C
an
ad
a S
ecre
tari
at.
T
rea
su
ry B
oa
rd o
f C
an
ad
a S
ecre
tari
at.
UR
L:
htt
p:/
/ww
w.t
bs-
sct.
gc.c
a/p
ub
s_
po
l/d
cg
pu
bs/R
ea
lPro
pe
rty/ltc
p-p
ilt_
e.a
sp
Po
licy F
ram
ew
ork
fo
r th
e M
an
ag
em
en
t o
f A
sse
ts a
nd
Acq
uir
ed
Se
rvic
es,
Tre
asu
ry
Bo
ard
of
Ca
na
da
Se
cre
tari
at
Tre
asu
ry B
oa
rd o
f C
an
ad
a S
ecre
tari
at.
UR
L:
htt
p:/
/ww
w.t
bs-
sct.
gc.c
a/p
ub
s_
po
l/d
cg
pu
bs/a
as-g
asa
/fm
aa
s-c
pg
asa
/fm
aa
s-
cp
ga
sa
_e
.asp
Po
licy o
n P
roje
ct
Ma
na
ge
me
nt,
Tre
asu
ry B
oa
rd o
f C
an
ad
a S
ecre
tari
at
Tre
asu
ry B
oa
rd o
f C
an
ad
a S
ecre
tari
at.
UR
L:
htt
p:/
/ww
w.t
bs-
sct.
gc.c
a/p
ub
s_
po
l/d
cg
pu
bs/t
bm
_1
22
/CH
AP
T2
-2_
e.a
sp
Co
mm
on
Se
rvic
es P
olic
y,
Tre
asu
ry B
oa
rd o
f C
an
ad
a S
ecre
tari
at.
Tre
asu
ry B
oa
rd o
f C
an
ad
a S
ecre
tari
at.
UR
L:
htt
p:/
/ww
w.t
bs-
sct.
gc.c
a/P
ub
s_
po
l/d
cg
pu
bs/T
B_
93
/csp
-psc_
e.a
sp
Ad
ditio
na
l m
an
da
tory
re
qu
ire
me
nts
fo
r th
e m
an
ag
em
en
t o
f re
al p
rop
ert
y a
re s
et
ou
t in
th
e f
ollo
win
g p
olic
y in
str
um
en
ts:
•
Dir
ective
on
th
e S
ale
or
Tra
nsfe
r o
f S
urp
lus R
ea
l P
rop
ert
y;
•
Acce
ssib
ility
Sta
nd
ard
fo
r R
ea
l P
rop
ert
y;
•
Ap
pra
isa
ls a
nd
Estim
ate
s S
tan
da
rd f
or
Re
al P
rop
ert
y;
an
d
•
Re
po
rtin
g S
tan
da
rd f
or
Re
al P
rop
ert
y.
Tre
asu
ry B
oa
rd o
f C
an
ad
a S
ecre
tari
at.
Se
e:
htt
p:/
/ww
w.t
bs-
sct.
gc.c
a f
or
de
taile
d d
escri
ptio
ns a
nd
lis
tin
gs o
f th
ese
p
olic
ies.

En
gin
ee
rin
g V
uln
era
bili
ty A
sse
ssm
en
t o
f th
e M
ain
Sta
tistics C
an
ad
a B
uild
ing
to
th
e I
mp
acts
of
Clim
ate
Ch
an
ge
HO
K C
an
ad
a
8
4:1
28
4.2
.6 S
pe
cif
ic J
uri
sd
icti
on
al
Co
ns
ide
rati
on
s
N
ote
: th
ere
are
exce
ptio
ns t
o t
he
se
po
licie
s in
th
at
the
y a
re n
ot
rele
va
nt
to s
om
e o
f th
e
pro
vin
cia
l e
mp
loye
es w
ork
ing
in
Fe
de
ral sp
ace
. F
urt
he
rmo
re,
PW
GS
C/S
NC
-La
va
lin-
Pro
fac h
ave
th
e p
ractice
of
follo
win
g m
ost
str
ing
en
t le
gis
latio
n.
4
.2.7
Oth
er
Ch
an
ge
Eff
ec
ts
Ch
an
ge
s i
n u
se
pa
tte
rn t
ha
t in
cre
as
e/d
ec
rea
se
th
e c
ap
ac
ity
of
the
in
fra
str
uc
ture
R
efe
ren
ce
PW
GS
C is c
on
tin
uo
usly
op
tim
izin
g s
pa
ce
usa
ge
with
it’s r
ea
l p
rop
ert
y h
old
ing
s a
nd
in
co
nso
rt
with
SN
C-L
ava
lin P
rofa
c.
Th
ese
ch
an
ge
s d
o a
ffe
ct
the
ca
pa
city o
f th
e in
fra
str
uctu
re t
o m
ain
tain
o
ptim
um
wo
rk e
nvir
on
me
nts
fo
r b
uild
ing
occu
pa
nts
. H
ow
eve
r, t
he
cu
rre
nt
sta
nd
ard
s a
pp
lied
to
o
ccu
pa
ncy d
en
sity w
ith
th
e M
ain
Sta
tistics C
an
ad
a b
uild
ing
are
still
with
in t
he
ab
ility
of
the
b
uild
ing
syste
ms t
o c
rea
te e
nvir
on
me
nts
th
at
me
et
the
ap
plic
ab
le c
od
es a
nd
sta
nd
ard
s (
i.e
. C
an
ad
a L
ab
ou
r C
od
e a
nd
Occu
pa
tio
na
l H
ea
lth
an
d S
afe
ty R
eg
ula
tio
ns).
F
urt
he
rmo
re,
incre
ase
d u
se
(th
rou
gh
hig
he
r e
mp
loye
e/o
ccu
pa
nt
de
nsitie
s)
with
in t
he
bu
ildin
g w
ill
ha
ve
an
eff
ect
on
th
e h
ea
tin
g a
nd
co
olin
g lo
ad
s p
lace
d o
n t
he
bu
ildin
g s
yste
ms a
nd
th
e c
en
tra
l h
ea
tin
g a
nd
co
olin
g p
lan
t. H
igh
er
de
nsity o
f IT
/IM
eq
uip
me
nt
als
o h
as d
ire
ct
eff
ects
on
he
atin
g,
co
olin
g a
nd
ve
ntila
tio
n s
yste
ms,
oft
en
re
qu
irin
g a
dd
itio
na
l co
olin
g,
ve
ntila
tio
n a
nd
hu
mid
ity c
on
tro
l to
be
im
ple
me
nte
d.
Th
e r
atio
be
twe
en
em
plo
ye
e/w
ork
sta
tio
n s
pa
ce
an
d I
T/I
M s
pa
ce
ca
n h
ave
co
nsid
era
ble
aff
ect
on
th
e b
uild
ing
syste
ms,
pa
rtic
ula
rly h
ea
tin
g,
ve
ntila
tio
n a
nd
hu
mid
ity c
on
tro
l.
Op
era
tio
n a
nd
ma
inte
na
nc
e p
rac
tic
es
th
at
inc
rea
se
/de
cre
as
e c
ap
ac
ity
of
infr
as
tru
ctu
re
Re
fere
nc
e
Th
e f
req
ue
ncy o
f m
ain
ten
an
ce
an
d q
ua
lity o
f m
ain
ten
an
ce
pra
ctice
s h
ave
in
flu
en
ce
on
th
e
ca
pa
city o
f th
e b
uild
ing
, p
art
icu
larl
y o
n t
he
lo
ng
evity o
f b
uild
ing
co
mp
on
en
ts a
nd
syste
ms.
De
ferr
ed
ma
inte
na
nce
an
d lo
w q
ua
lity m
ate
ria
ls w
ill a
cce
lera
te d
ete
rio
ratio
n o
f b
uild
ing
syste
ms.
Th
is is p
art
icu
larl
y im
po
rta
nt
for
bu
ildin
gs t
ha
t a
re r
ea
ch
ing
th
e e
nd
of
the
ir d
esig
n life
sp
an
.
Ch
an
ge
s i
n m
an
ag
em
en
t p
oli
cy
th
at
aff
ec
t th
e l
oa
d p
att
ern
on
th
e i
nfr
as
tru
ctu
re
Re
fere
nc
e

En
gin
ee
rin
g V
uln
era
bili
ty A
sse
ssm
en
t o
f th
e M
ain
Sta
tistics C
an
ad
a B
uild
ing
to
th
e I
mp
acts
of
Clim
ate
Ch
an
ge
HO
K C
an
ad
a
8
5:1
28
Ch
an
ge
s t
o t
he
po
licie
s g
ove
rnin
g in
ve
stm
en
ts in
ma
inte
na
nce
an
d r
eca
pita
liza
tio
n o
f fe
de
ral
bu
ildin
gs m
ay a
cce
lera
te t
he
re
fitt
ing
an
d/o
r co
mp
lete
re
bu
ildin
g o
f th
e M
ain
Sta
tistics C
an
ad
a
Bu
ildin
g.
Su
ch
ch
an
ge
s m
ay a
lso
in
dic
ate
th
e n
ee
d t
o d
eco
mm
issio
n t
he
bu
ildin
g (
as it
is n
ea
r th
e
en
d o
f its d
esig
n life
) a
nd
bu
ild a
ne
w f
acili
ty.
Ho
we
ve
r, m
ee
tin
g w
ith
PW
GS
C a
nd
SN
C-L
ava
lin
Pro
fac in
dic
ate
d t
ha
t th
is w
as u
nlik
ely
in
th
e n
ea
r fu
ture
(5
-10
ye
ars
).
Ch
an
ge
s i
n L
aw
s,
Re
gu
lati
on
s a
nd
Sta
nd
ard
s t
ha
t a
ffe
ct
the
lo
ad
pa
tte
rn o
n t
he
in
fra
str
uc
ture
R
efe
ren
ce
No
ch
an
ge
s in
th
e la
ws r
eg
ula
tio
n o
r sta
nd
ard
s a
re e
xp
ecte
d t
o a
ffe
ct
the
lo
ad
pa
tte
rn o
n t
he
in
fra
str
uctu
re.
4.2
.8 A
ss
es
s D
ata
Su
ffic
ien
cy
C
om
me
nt
on
us
ing
re
lati
ve
ly s
ho
rt t
erm
me
as
ure
me
nts
to
ma
ke
lo
ng
te
rm p
red
icti
on
s
Lim
ita
tio
ns
Th
e B
uild
ing
Co
nd
itio
n R
ep
ort
s t
ha
t a
re p
rod
uce
d f
or
PW
GS
C a
nd
SN
C-L
ava
lin P
rofa
c f
acto
r in
th
e
life
cycle
s o
f m
ajo
r a
nd
min
or
bu
ildin
g m
ate
ria
ls a
nd
co
mp
on
en
ts.
Alth
ou
gh
th
ese
re
po
rts a
re
pro
du
ce
d t
hro
ug
h s
ho
rt t
erm
ob
se
rva
tio
ns,
the
scie
nce
of
bu
ildin
g m
ain
ten
an
ce
an
d c
on
ditio
n
rep
ort
ing
is s
uch
th
at
bu
ildin
g o
pe
rato
rs a
nd
ma
na
ge
rs c
an
eff
ective
ly s
ch
ed
ule
an
d b
ud
ge
t m
ain
ten
an
ce
du
tie
s t
o m
ain
tain
th
e b
uild
ing
sta
nd
ard
s a
nd
op
era
tio
na
l p
ara
me
ters
to
su
it its
o
ccu
pa
nts
.
In t
erm
s o
f clim
ate
ch
an
ge
fa
cto
rs,
the
cu
rre
nt
mo
de
ls a
re b
ase
d o
n in
pu
t fr
om
25
ye
ar
his
tori
ca
l d
ata
/b
ase
line
s t
o m
ake
pre
dic
tio
ns t
ha
t a
re 1
2,
32
an
d 6
2 y
ea
rs in
to t
he
fu
ture
.
A k
ey lim
ita
tio
n t
o e
nsu
rin
g a
nd
ma
kin
g
pre
dic
tio
ns a
bo
ut
se
rvic
e life
of
bu
ildin
g m
ate
ria
ls
an
d c
om
po
ne
nts
is t
he
ava
ilab
le/f
ore
ca
ste
d
bu
dg
et.
Un
ce
rta
inty
an
d f
luctu
atin
g b
ud
ge
ts c
an
re
su
lt in
de
ferr
ed
ma
inte
na
nce
th
at
ca
n in
tu
rn
aff
ect
the
ab
ility
to
ma
inta
in t
he
bu
ildin
g t
o t
he
re
qu
ire
d p
erf
orm
an
ce
sta
nd
ard
s.
A s
eco
nd
lim
ita
tio
n is t
he
in
ab
ility
to
pre
dic
t th
e o
ccu
rre
nce
o
f a
ccid
en
ts a
nd
extr
em
e w
ea
the
r e
ve
nts
th
at
ca
use
bu
ildin
g c
om
po
ne
nts
or
ma
teri
als
to
fa
il p
rem
atu
rely
.
With
re
sp
ect
to lim
ita
tio
ns o
f th
e c
lima
te c
ha
ng
e
mo
de
ls,
the
mo
de
ls u
se
d c
an
be
co
nsid
ere
d t
o
be
th
e b
est
ava
ilab
le e
stim
ate
s.
Ho
we
ve
r se
nsitiv
ity o
r u
nce
rta
inty
an
aly
sis
is s
till
un
de
r d
eve
lop
me
nt
in t
he
clim
ate
ch
an
ge
mo
de
ling

En
gin
ee
rin
g V
uln
era
bili
ty A
sse
ssm
en
t o
f th
e M
ain
Sta
tistics C
an
ad
a B
uild
ing
to
th
e I
mp
acts
of
Clim
ate
Ch
an
ge
HO
K C
an
ad
a
8
6:1
28
fie
ld.
Da
ta E
va
lua
tio
n
C
om
me
nt
Eff
ec
t o
n A
ss
es
sm
en
t
Da
ta G
ap
s
Th
ere
are
no
cu
rre
nt
estim
ate
s a
rou
nd
th
e f
req
ue
ncy a
nd
in
ten
sity o
f e
xtr
em
e w
ea
the
r e
ve
nts
fo
r th
e O
tta
wa
Re
gio
n.
It is
un
ce
rta
in if
the
se
will
in
cre
ase
, d
ecre
ase
or
if t
he
re w
ill b
e
ch
an
ge
s a
s t
o t
he
typ
es o
f e
ve
nts
(i.e
. h
ail
sto
rms,
torn
ad
oe
s,
etc
).
Po
ssib
le c
ha
ng
es in
so
il co
nd
itio
ns a
nd
wa
ter
tab
les a
re c
urr
en
t d
ata
ga
ps –
th
is r
ela
tes t
o t
he
ab
ility
fo
r th
e s
ite
to
dra
in r
ain
an
d
sto
rm w
ate
r a
nd
hyd
rosta
tic p
ressu
res a
ga
inst
fou
nd
atio
n
foo
tin
gs a
nd
wa
lls.
W
ind
dri
ve
n r
ain
in
de
x/f
acto
r is
a c
urr
en
t d
ata
ga
p t
ha
t re
late
s t
o
the
bu
ildin
g e
nve
lop
’s a
bili
ty t
o s
he
d a
nd
re
dir
ect
rain
an
d s
no
w.
Ch
an
ge
s in
riv
er
wa
ter
tem
pe
ratu
re w
ill a
ffe
ct
the
use
of
rive
r w
ate
r a
t a
ce
ntr
al p
lan
t th
at
relie
s o
n it
to c
on
ditio
n w
ate
r u
se
d o
n
a c
am
pu
s lik
e T
un
ne
y’s
Pa
stu
re.
It is a
ssu
me
d t
ha
t th
e f
req
ue
ncy a
nd
in
ten
sity o
f e
xtr
em
e w
ea
the
r e
ve
nts
will
be
with
in t
he
ca
pa
city o
f th
e b
uild
ing
to
with
sta
nd
. In
ad
ditio
n,
su
ch
estim
atio
n a
nd
mo
de
llin
g is e
xtr
em
ely
tim
e
an
d r
eso
urc
e in
ten
siv
e a
nd
wo
uld
re
qu
ire
a
dd
itio
na
l p
roje
cts
in
ord
er
to p
red
ict
in a
ma
nn
er
tha
t w
ou
ld b
e v
alu
ab
le t
o in
form
in
ve
stm
en
t,
op
era
tio
n a
nd
ma
inte
na
nce
de
cis
ion
s.
C
ha
ng
es in
so
il co
nd
itio
ns a
nd
wa
ter
tab
le w
ere
n
ot
facto
red
in
to t
he
asse
ssm
en
t.
Ch
an
ge
s in
win
d d
rive
n r
ain
we
re a
ssu
me
d t
o
incre
ase
ba
se
d o
n t
he
clim
ate
ch
an
ge
sce
na
rio
s
ind
ica
tin
g a
n in
cre
ase
in
to
tal ra
in a
nd
in
ten
se
ra
in e
ve
nts
. It
wa
s a
ssu
me
d in
ten
se
ra
in e
ve
nts
co
incid
e w
ith
hig
he
r w
ind
s,
ca
usin
g w
ind
dri
ve
n
rain
. W
arm
er
rive
r w
ate
r te
mp
era
ture
s w
ere
assu
me
d
su
ch
th
at
it w
ill c
om
pro
mis
e t
he
co
olin
g c
ap
acity
at
Tu
nn
ey’s
Pa
stu
re e
sp
ecia
lly d
uri
ng
th
e
su
mm
er
mo
nth
s.
Da
ta Q
ua
lity
Da
ta q
ua
lity f
rom
th
e B
uild
ing
Co
nd
itio
n R
ep
ort
an
d s
ite
vis
it w
as
co
nsid
ere
d e
xce
llen
t.
Da
ta p
rovid
ed
fro
m t
he
clim
ate
ch
an
ge
mo
de
llin
g w
as
co
nsid
ere
d t
he
be
st
ava
ilab
le f
or
the
re
gio
n.
Da
ta A
cc
ura
cy
Da
ta a
ccu
racy f
rom
th
e B
uild
ing
Co
nd
itio
n R
ep
ort
an
d s
ite
vis
it
wa
s c
on
sid
ere
d e
xce
llen
t.
Da
ta a
ccu
racy in
th
e c
lima
te c
ha
ng
e m
od
elli
ng
wa
s c
on
sid
ere
d
to b
e t
he
be
st
ava
ilab
le e
stim
ate
s/p
red
ictio
ns p
ossib
le.

En
gin
ee
rin
g V
uln
era
bili
ty A
sse
ssm
en
t o
f th
e M
ain
Sta
tistics C
an
ad
a B
uild
ing
to
th
e I
mp
acts
of
Clim
ate
Ch
an
ge
HO
K C
an
ad
a
8
7:1
28
Ap
pli
ca
bil
ity
of
Tre
nd
s
Re
lia
bil
ity
of
se
lec
ted
cli
ma
te
mo
de
ls
Re
liab
ility
of
the
clim
ate
mo
de
ls is s
till
un
ce
rta
in a
t th
is t
ime
. H
ow
eve
r, t
he
mo
de
ls u
se
d h
ave
be
en
esta
blis
he
d t
hro
ug
h a
co
nse
nsu
s b
ase
d a
pp
roa
ch
in
vo
lvin
g in
tern
atio
na
l clim
ate
ch
an
ge
exp
ert
s.
Th
ese
mo
de
ls u
se
d a
re g
en
era
lly a
cce
pte
d
with
in t
he
fie
ld t
o b
e a
pp
lica
ble
to
Ca
na
da
th
e r
eg
ion
.
Re
lia
bil
ity
of
cli
ma
te c
ha
ng
e
as
su
mp
tio
ns
/sc
en
ari
os
R
elia
bili
ty o
f th
e c
lima
te c
ha
ng
e s
ce
na
rio
s is s
till
un
ce
rta
in a
t th
is
tim
e.
Ho
we
ve
r, t
he
clim
ate
ch
an
ge
fa
cto
rs t
ha
t w
ere
ge
ne
rate
d
fro
m t
he
mo
de
ls f
or
the
re
gio
n a
re in
ag
ree
me
nt
with
ma
ny o
f th
e
ke
y c
ha
ng
es n
ote
d b
y t
he
IP
CC
an
d c
lima
te c
ha
ng
e e
xp
ert
s f
or
Ca
na
da
.
Oth
er
Fa
cto
rs
- n
on
e n
ote
d -
4.2
.8 p
art
c
Es
tab
lis
h P
rio
rity
in
re
fere
nc
ed
do
cu
me
nts
R
efe
ren
ce
Do
cu
me
nt
R
efe
ren
ce
Pri
ori
ty
(hig
he
st
reli
an
ce
fir
st)
Bu
ildin
g C
on
ditio
n R
ep
ort
, D
ece
mb
er
20
07
.
1st
pri
ori
ty
Clim
ate
ch
an
ge
in
Ca
na
da
: C
lima
te s
ce
na
rio
s f
or
the
pu
blic
in
fra
str
uctu
re v
uln
era
bili
ty
asse
ssm
en
t –
Ott
aw
a B
uild
ing
Ca
se
Stu
dy.
Ou
ran
os,
Qu
eb
ec,
Fe
bru
ary
20
08
.
2
nd
pri
ori
ty
Clim
ate
ch
an
ge
in
Ca
na
da
: C
lima
te s
ce
na
rio
s f
or
the
pu
blic
in
fra
str
uctu
re v
uln
era
bili
ty
asse
ssm
en
t –
Ott
aw
a B
uild
ing
Ca
se
Stu
dy,
Ad
de
nd
um
. O
ura
no
s,
Qu
eb
ec,
Ap
ril 2
00
8.
3rd
pri
ori
ty
Pla
nn
ing
fo
r A
tmo
sp
he
ric H
aza
rds a
nd
Dis
aste
r M
an
ag
em
en
t u
nd
er
Ch
an
gin
g C
lima
te
Co
nd
itio
ns.
En
vir
on
me
nt
Ca
na
da
, O
cca
sio
na
l P
ap
er
12
, 2
00
7.
4
th
Ch
an
gin
g W
ea
the
r P
att
ern
s,
Un
ce
rta
inty
an
d I
nfr
astr
uctu
re R
isks:
Em
erg
ing
Ad
ap
tatio
n
Re
qu
ire
me
nts
. E
nvir
on
me
nt
Ca
na
da
, O
cca
sio
na
l P
ap
er
9,
20
07
.
5th
Win
ter
Op
era
tio
ns U
pd
ate
. C
ity o
f O
tta
wa
.
6th
We
ath
eri
ng
of
Bu
ildin
g I
nfr
astr
uctu
re a
nd
th
e C
ha
ng
ing
Clim
ate
: A
da
pta
tio
n O
ptio
ns.
En
vir
on
me
nt
Ca
na
da
, O
cca
sio
na
l P
ap
er
11
, 2
00
7.
7
th
4.2
.8 p
art
d
Da
ta S
uff
icie
nc
y

En
gin
ee
rin
g V
uln
era
bili
ty A
sse
ssm
en
t o
f th
e M
ain
Sta
tistics C
an
ad
a B
uild
ing
to
th
e I
mp
acts
of
Clim
ate
Ch
an
ge
HO
K C
an
ad
a
8
8:1
28
Ide
nti
fy p
roc
es
s t
o d
ev
elo
p d
ata
, w
he
re i
ns
uff
icie
nt
Da
ta N
ee
de
d
Pro
ce
ss
Mo
re in
form
atio
n w
as n
ee
de
d o
n u
nd
ers
tan
d t
he
ch
an
ge
in
fre
eze
-th
aw
cycle
s.
In
form
atio
n w
as p
rovid
ed
by H
ea
the
r A
uld
fro
m E
nvir
on
me
nt
Ca
na
da
an
d
the
City o
f O
tta
wa
’s D
ep
art
me
nt
of
Pu
blic
Wo
rks t
o u
nd
ers
tan
d t
he
ch
an
ge
s in
th
ese
cycle
s o
ve
r th
e c
om
ing
ye
ars
. T
his
in
form
atio
n w
as u
se
d
in S
tep
3 o
f th
e a
sse
ssm
en
t
Hu
mid
ity w
as o
f in
tere
st
to t
he
te
am
be
ca
use
it
pla
ys a
ke
y f
acto
r in
th
e
eff
icie
ncy o
f a
ir c
on
ditio
n a
nd
co
olin
g s
yste
ms.
Th
e c
lima
te c
ha
ng
e f
acto
rs
pro
vid
ed
by t
he
clim
ate
mo
de
ls d
id n
ot
inclu
de
hu
mid
ity.
Ou
ran
os w
as c
on
tacte
d t
o p
rovid
e h
um
idity in
dic
es f
or
the
clim
ate
ch
an
ge
sce
na
rio
s.
Th
is w
as p
rovid
ed
th
rou
gh
an
ad
de
nd
um
to
th
e in
itia
l (s
ee
a
bo
ve
re
fere
nce
do
cu
me
nts
).
So
lar
rad
iatio
n in
dic
es w
ere
als
o o
f in
tere
st
to t
he
stu
dy t
ea
m a
s t
his
ca
n
aff
ect
so
lar
he
at
ga
in o
f b
uild
ing
s.
Th
e c
lima
te c
ha
ng
e f
acto
rs p
rovid
ed
by
the
clim
ate
mo
de
ls d
id n
ot
inclu
de
so
lar
rad
iatio
n.
Ou
ran
os w
as c
on
tacte
d t
o p
rovid
e s
ola
r ra
dia
tio
n in
dic
es f
or
the
clim
ate
ch
an
ge
sce
na
rio
s.
Th
is w
as p
rovid
ed
th
rou
gh
an
ad
de
nd
um
to
th
e in
itia
l (s
ee
ab
ove
re
fere
nce
do
cu
me
nts
).
Co
olin
g d
eg
ree
da
ys w
ere
als
o o
f in
tere
st
be
ca
use
th
ey w
ill a
llow
p
red
ictio
ns t
o b
e m
ad
e a
s t
o t
he
ove
rall
“co
olin
g s
ea
so
n”
for
the
bu
ildin
g.
Th
e c
lima
te c
ha
ng
e f
acto
rs p
rovid
ed
by t
he
clim
ate
mo
de
ls d
id n
ot
inclu
de
co
olin
g d
eg
ree
da
ys.
Ou
ran
os w
as c
on
tacte
d t
o p
rovid
e c
oo
ling
de
gre
e d
ays in
dic
es f
or
the
clim
ate
ch
an
ge
sce
na
rio
s.
Th
is w
as p
rovid
ed
th
rou
gh
an
ad
de
nd
um
to
th
e
initia
l (s
ee
ab
ove
re
fere
nce
do
cu
me
nts
).
Wh
ere
da
ta c
an
no
t b
e d
ev
elo
pe
d,
ide
nti
fy t
he
da
ta g
ap
as
a f
ind
ing
in
Ste
p 5
of
the
Pro
toc
ol
– R
ec
om
me
nd
ati
on
s.
Lis
t D
ata
Ga
p a
s f
ind
ing
s t
o b
e s
en
t to
ST
EP
5 (
Wo
rks
he
et
5:
Se
cti
on
4.5
.2)
4.
Fu
rth
er
info
rma
tio
n a
nd
mo
de
llin
g n
ee
ds t
o b
e d
on
e t
o p
red
ict
ch
an
ge
s in
extr
em
e w
ea
the
r e
ve
nts
in
th
e r
eg
ion
. If
it
is g
en
era
lly a
cce
pte
d t
ha
t th
ere
will
be
in
cre
ase
s in
extr
em
e w
ea
the
r e
ve
nts
, cu
rre
nt
bu
ildin
g c
od
es t
ha
t a
pp
ly s
ho
uld
be
re
vie
we
d t
o d
ete
rmin
e if
the
y a
re s
uff
icie
nt.
5.
Po
ssib
le c
ha
ng
es in
so
il co
nd
itio
ns a
nd
wa
ter
tab
les a
re c
urr
en
t d
ata
ga
ps –
th
is r
ela
tes t
o t
he
ab
ility
fo
r th
e s
ite
to
dra
in r
ain
an
d s
torm
wa
ter
an
d h
yd
rosta
tic p
ressu
res a
ga
inst
fou
nd
atio
n f
oo
tin
gs a
nd
wa
lls.
6.
Win
d d
rive
n r
ain
in
de
x/f
acto
r is
a c
urr
en
t d
ata
ga
p t
ha
t re
late
s t
o t
he
bu
ildin
g e
nve
lop
’s a
bili
ty t
o s
he
d a
nd
re
dir
ect
rain
an
d s
no
w.
7.
Ch
an
ge
s in
riv
er
wa
ter
tem
pe
ratu
re is a
da
ta g
ap
th
at
will
aff
ect
the
co
olin
g c
ap
acity a
t fa
cili
tie
s t
ha
t re
ly o
n t
his
me
tho
d.
Dat
e:
Mar
ch 2
0, 2
008
Pre
par
ed b
y:
V
ince
Cat
alli
Engineering Vulnerability Assessment of the Main Statistics Canada Building to the Impacts of Climate Change
HOK Canada 89:128
Worksheet 3 Vulnerability Assessment – Main Statistics Canada Building
In this step, the project team identified the building component responses to the most relevant
climate change factors determined through Step 2. This was done by first verifying that the
building components response to the climate change factors could affect the overall performance
of the building. This is discussed below in Step 4.3.1. Once the list of building components have
an associated performance response, a vulnerability assessment was conducted by assessing each
component against each climate change factor determined in Step 2. This was done through Step
4.3.2 and 4.3.3, a prioritization exercise that assessed the probability and severity of effect that
each climate change factor would have on each building component. This determined which
building components are expected to have negative/detrimental responses to climate change (i.e.
which are the most vulnerable).
Note: the method used in this Step of the Protocol has been modified from the October 31, 2007
version (7.1). The instructions in version 7.1 directed the practitioner to two different assessment
matrices with differing, but overlapping instructions. The project team determined that the
performance response relationship provided a “verification” check to understand the influence a
particular building component would have on overall building performance, if it is affected by
climate change. Second, the team determined, this verified list of components could then be used
in the vulnerability assessment matrix (Step 4.3.6 in version 7.1) as originally outlined. The
project team suggests this part of the Protocol and corresponding worksheet be revised to avoid
any confusion and simplify the process for future practitioners.
4.3.1 Initial assessment of performance response.
The project team created a matrix using spreadsheet software where the column headers were
comprised of what was determined as the key performance factors of the building. These were
in-line with the template provided in Step 4.3.6 in version 7.1 of the Protocol (Worksheet 3).
Although the generic performance factors generic provided in the Protocol were used, to aid the
assessment, they were defined the by the project team as follows:
• Structural Integrity: ability of the building structural system and its components (roof
trusses, floor trusses, floor panels, I-joists, or engineered beams) to withstand anticipated
loads.
• Serviceability: ability of property and building managers to perform regular scheduled
maintenance, service and repair on the building’s systems and components.
• Functionality: ability of the building to perform it’s primary functions of providing space
for building occupants in the form of offices, computer facilities, storage, class/training
rooms, a daycare centre, cafeteria and gym.
• Operations and Maintenance: regularly scheduled duties for property and building
managers to operate the building and maintain it’s systems.
• Emergency response risk: any risk posed to building managers, health and safety officers
and other first responders such as firefighters, police officers, and ambulance personnel
when responding to an emergency in or around the building.

Engineering Vulnerability Assessment of the Main Statistics Canada Building to the Impacts of Climate Change
HOK Canada 90:128
• Insurance Considerations: changes, effects, events or actions that may pose potential
insurance/legal liability to the landlord or building management.
• Policies and Procedures: a course or principle of action(s) adopted or used by the landlord
or building managers that direct individuals, business and other entities in the short and
long term operation and management of the building.
• Economics: a cost or benefit associated with day to day operation and management of the
building.
• Public Health and Safety: a cross-disciplinary area concerned with protecting the safety,
health and welfare of people engaged in work at the building and members of the public
who live in the communities nearby.
• Environmental Effects: the impact that the operation of the building - either positive or
negative – has on the natural environment including impacts to land, air, soil, water and
flora and fauna.
Once these performance factors were defined, the row titles of the matrix were completed based
on the key building components as identified and listed in Step 4.2.1 (see Worksht2_Main Stats).
Next the team completed the matrix, based on initial professional opinion, by determining if each
building component’s response to climate change would affect each key performance factor of
the building. Answers were provided as either yes or no. This method was deemed sufficient as a
screen or initial assessment to verify that the specific building components identified in Step
4.2.1 have an affect on one or more dimensions of the building’s performance. The total number
of “yes” responses were calculated in the final column in the matrix. It can be seen that all
components identified in Step 4.2.1 were verified to have an affect on at least 3 or more
dimensions of building performance. This was anticipated by the team, as the building can be
seen as a set of components of an integrated system (i.e. each component plays a separate, but
vital role in the overall function and performance of the whole building).

Engineering Vulnerability Assessment of the Main Statistics Canada Building to the Impacts of Climate Change
HOK Canada 91:128
4.3.1 Initial Assessment of Performance Response Relationship - building component response/affect on building performance

Engineering Vulnerability Assessment of the Main Statistics Canada Building to the Impacts of Climate Change
HOK Canada 92:128
4.3.2 Determine key climate change factors Using the key climate change factors listed in Step 4.2.3, the team developed a Vulnerability
Assessment Matrix. The following table was used to populate the column headers in the Matrix.
4.3.2 Key climate change factors (from Worksheet 2 – section 4.2.3)
Temperature - Increases in monthly tmax - Increases in monthly tmin - Increases in annual avg. max - Increases in annual avg. min
Rain - Avg. total rain increases DJF, MAM, SON - Decreases JJA - Avg. Max rain increases for 1, 2 and 5 day periods - 6h frequency increases - 1 day frequency increases - Simple daily intensity index increases
Snow - Average total snow increases - 1 day frequency increases - Rain on Snow events increases
Wind - Monthly avg wind6h increases in winter - Monthly avg. wind 6h decreases in summer - Avg. annual max wind6h - decreases
Frost Season Length - decreases - frequency of freeze/thaw events increases
Heating Degree Days - Less HDDays -
Cooling Degree Days - More CDDays -
Humidity - monthly average increases -
4.3.3 Vulnerability Assessment Matrix: Climate Change Effect vs Infrastructure Component
Performance Scaling
The Matrix was developed based on the template provided in Step 4.3.6 from version 7.1 of the
PIEVC Protocol. As per the Protocol, the Probability (Figure 7 (SC)) and Severity Scale (Figure
8 (SR)) factors were used to to calculate the priority of the affect of climate change factor on each
building component as per the following formula:
PC = SC � SR
Where:

Engineering Vulnerability Assessment of the Main Statistics Canada Building to the Impacts of Climate Change
HOK Canada 93:128
PC = Priority of Climate Effect
SC = Scale factor for Probability
SR = Scale factor for Severity
The project team prioritized a number of climate-infrastructure interactions, or relationships,
according to the default prioritization system is based on a scale of 1 to 10. The team selected
values along the scale based on probability and severity of outcomes. Method A and Method E
were used to select values for probability and severity respectively.
Figure 7: Probability Scale (Sc)Factors
Scale Probability
Method A (used) Method B Method C
0 negligible or <0.1 % negligible or
not applicable <0.1 / 20 not applicable
1 improbable / 5 % improbable
highly unlikely 1 / 20 1:1 000 000
2 remote 20 % remote
4 / 20 1:100 000
3 occasional 35 % occasional
7 / 20 1:10 000
4 moderate / 50 % moderate
possible 10 / 20 1:1 000
5 often 65 % probable
13 / 20 1:100
6 probable 80 % frequent
16 / 20 1:10
7 certain / highly >95 % continuous
probable >19 / 20 1:1
Figure 8: Severity Scale (Sr) Factors
Scale M a g n i t u d e Severity of Consequences and
Effects

Engineering Vulnerability Assessment of the Main Statistics Canada Building to the Impacts of Climate Change
HOK Canada 94:128
M e t h o d D
( u s e d ) Method E
0 no effect negligible or
not applicable
1 measurable very low / unlikely / rare /
0.0125 measurable change
2 minor low / seldom / marginal /
0.025 change in serviceability
3 moderate occasional
0.050 loss of some capability
4 major moderate
0.100 loss of some capacity
5 serious likely regular / loss of capacity
0.200 and loss of some function
6 hazardous major / likely / critical /
0.400 loss of function
7 catastrophic extreme/ frequent/ continuous
0.800 / loss of asset
This method was chosen to align with current prioritization schemes and risk management
methodologies currently used by Public Works and Government Services Canada in the
management of this and other buildings in its Real Property portfolio.
The Vulnerability Assessment Matrix was developed to automatically calculate the value of PC
in the corresponding cell for each building component. For ease of viewing, the Pc values are
colour coded, with scores between 12 and 35 as yellow and scores 36 and higher with red.
Potential Cumulative Effects
Where the team determined there was a cumulative impact of different climate change factors,
the possibility of compounded factors was given a higher weighting in the probabilyt and
severity scale factors based on professional judgement. The Matrix indicates, several of these
compound factors through gray cell shading in the column headers and individual matrix cells.

Engineering Vulnerability Assessment of the Main Statistics Canada Building to the Impacts of Climate Change
HOK Canada 95:128
4.3.4 Identify and prioritize vulnerable building components
The following building components had a Pc score of 36 or more for one or more climate change factors in the Vulnerability Assessment Matrix. These are also transferred to Step 5, section 4.5.2.
1. Exterior Systems: a. Site Drains – storm and rain water b. Walkways – concrete, asphalt, unit pavers c. Stairs – concrete d. Ramps – concrete e. Parking vehicle areas – concrete, asphalt, unit pavers
2. Building Systems: a. Envelop Systems:
i. masonry walls

Engineering Vulnerability Assessment of the Main Statistics Canada Building to the Impacts of Climate Change
HOK Canada 96:128
ii. stone panels (including headers and sills)
3. Mechanical Systems: a. Cooling System and Adequacy
For components and relationships with Pc score between 12 and 35 for one or more climate change factors in the Vulnerability Assessment Matrix, they were identified for further Indicator Analysis in Step 4 (Section 4.4.4 and 4.4.8 in Worksheet 4)
• Site Drainage – related to slopes away from the building and includes soil permeability and hard surfaces like stairs / ramps
• Exterior Systems: a. Walls:
i. Freestanding – concrete, masonry ii. Retaining – concrete
b. Stairs - metal c. Tunnels manholes/access doors
• Building Systems: a. Envelop Systems:
i. Precast Concrete - Window Sills ii. Glazed Curtain wall iii. Metal Cladding
b. Windows / Doors: i. Aluminium Windows ii. Doors (Steel / Aluminium)
c. Flat Roof Systems (including roof drains)
• Electrical Systems: a. Power Supply and Reliability
Date: May 5, 2008
Prepared by:
Vince Catalli

En
gin
ee
rin
g V
uln
era
bili
ty A
sse
ssm
en
t o
f th
e M
ain
Sta
tistics C
an
ad
a B
uild
ing
to
th
e I
mp
acts
of
Clim
ate
Ch
an
ge
HO
K C
an
ad
a
9
7:1
28
Wo
rksh
ee
t 4
In
dic
ato
r A
na
lysis
– M
ain
Sta
tistics C
an
ad
a B
uild
ing
The
pro
ject
tea
m d
eter
min
ed t
hat
key
build
ing
com
pone
nts
vuln
erab
le t
o cl
imat
e ch
ange
(in
Ste
p 4.
3) s
houl
d be
an
alys
ed in
Ste
p 4.
4 –
Indi
cato
r A
naly
sis.
How
ever
, as
illu
stra
ted
belo
w in
4.4
.4.,
the
capa
city
, lo
ads
and
ther
efor
e th
eir
vuln
erab
ility
, on
the
se b
uild
ing
com
pone
nts
coul
d no
t be
qua
ntifi
ed i
n m
eani
ngfu
l te
rms.
Thi
s is
due
to
a nu
mbe
r of
fact
ors:
1.
The
re i
s co
mpl
exity
to
the
varia
bles
tha
t ne
ed t
o be
con
side
red
to q
uant
ify l
oads
and
cap
aciti
es.
For
ex
ampl
e, t
he p
ossi
ble
load
s on
the
bui
ldin
g�s
enve
lop
syst
em/c
ompo
nent
are
gov
erne
d by
suc
h fa
ctor
s as
m
ater
ial c
hara
cter
istic
s, te
mpe
ratu
re, t
empe
ratu
re fl
uctu
atio
ns, s
olar
rad
iatio
n, in
cide
nt m
oist
ure
(rai
n/sn
ow),
fr
eeze
-tha
w c
ycle
s, w
ind
load
s, m
ass
of c
ompo
nent
s, t
herm
al e
xpan
sion
coe
ffici
ents
and
fas
teni
ng/jo
inin
g m
etho
ds w
ith o
ther
mat
eria
ls/c
ompo
nent
s, e
tc.
Thu
s, t
he c
alcu
latio
n of
loa
ds a
nd c
apac
ities
is
mul
ti-di
men
sion
al a
nd c
anno
t be
easi
ly c
alcu
late
d w
ithou
t det
aile
d sc
ienc
e ba
sed
mod
els.
2.
T
he c
ompl
exity
of
dete
rmin
ing
the
dete
riora
tion
rate
s an
d ex
pect
ed r
educ
tion
of l
ife c
ycle
of
the
mat
eria
ls
used
in
the
com
pone
nts.
Suc
h de
term
inat
ions
req
uire
in-
dept
h kn
owle
dge
of b
uild
ing
mat
eria
l sc
ienc
e an
d of
ten
invo
lves
the
com
pone
nt m
anuf
actu
rers
and
/or
test
ing
labo
rato
ries.
3.
T
he s
yste
ms
natu
re o
f ho
w b
uild
ing
com
pone
nts
are
conn
ecte
d an
d w
ork
toge
ther
to
ensu
re t
he p
rope
r fu
nctio
ning
and
per
form
ance
of t
he b
uild
ing
to m
eet t
he r
elev
ant s
tand
ards
. T
here
fore
an
appr
oach
was
tak
en b
y th
e te
am b
ased
on
prof
essi
onal
judg
emen
t as
to
dete
rmin
ing
the
key
build
ing
com
pone
nts
that
are
vul
nera
ble
to c
limat
e ch
ange
and
tho
se t
hat
have
ada
ptiv
e ca
paci
ty (
Ste
ps 4
.4.9
and
4.4
.10
belo
w).

En
gin
ee
rin
g V
uln
era
bili
ty A
sse
ssm
en
t o
f th
e M
ain
Sta
tistics C
an
ad
a B
uild
ing
to
th
e I
mp
acts
of
Clim
ate
Ch
an
ge
HO
K C
an
ad
a
9
8:1
28
4
.4.4
Ca
lcu
lati
on
of
To
tal
Lo
ad
(L
T)
Infr
as
tru
ctu
re C
om
po
ne
nt
(fro
m 4
.3.5
fro
m W
ork
Sh
ee
t 3
) 4
.4.1
Ex
isti
ng
Lo
ad
L
E
4.4
.2 C
lim
ate
Lo
ad
L
C
4.4
.3 O
the
r L
oa
d
LO
To
tal
Lo
ad
L
T =
LE+
LC+
LO
1.
Exte
rio
r S
yste
ms:
a.
Site
Dra
ina
ge
– r
ela
ted
to
slo
pe
s
aw
ay f
rom
th
e b
uild
ing
an
d
inclu
de
s s
oil
pe
rme
ab
ility
an
d
ha
rd s
urf
ace
s lik
e s
tair
s /
ra
mp
s
Th
e e
xis
tin
g lo
ad
ca
nn
ot
be
ca
lcu
late
d in
qu
an
tita
tive
te
rms.
Un
de
term
ine
d
U
nd
ete
rmin
ed
Un
de
term
ine
d
Re
fer
to B
CR
20
07
–
Pa
ge
s 2
5 a
nd
34
to
44
.
E
xis
tin
g d
rain
ag
e d
oe
s n
ot
se
em
to
be
ca
usin
g w
ate
r in
filtra
tio
n t
hro
ug
h t
he
fo
un
da
tio
n.
Exis
tin
g s
ite
d
rain
ag
e lo
ad
ca
lcu
latio
ns
wo
uld
re
qu
ire
a d
eta
iled
su
rve
y o
f so
il ty
pe
s,
slo
pe
s
an
d a
ud
it o
f site
dra
ins.
Ca
lcu
latio
n o
f clim
ate
lo
ad
wo
uld
re
qu
ire
d
eta
iled
mo
de
llin
g a
nd
a
na
lysis
th
at
is o
uts
ide
th
e s
co
pe
of
this
a
sse
ssm
en
t.
No
ne
kn
ow
n
2.
Exte
rio
r S
yste
ms:
a.
Wa
lls: i.
Fre
esta
nd
ing
- c
on
cre
te
an
d m
aso
nry
Th
e e
xis
tin
g lo
ad
ca
nn
ot
be
ca
lcu
late
d in
qu
an
tita
tive
te
rms.
Un
de
term
ine
d
U
nd
ete
rmin
ed
Un
de
term
ine
d
Re
fer
to B
CR
20
07
–
Pa
ge
s 2
0 a
nd
22
.
L
oa
ds o
n f
ree
sta
nd
ing
wa
lls
are
su
nlig
ht,
te
mp
era
ture
, ra
in/s
no
w/ice
, e
tc.
Estim
atio
n
of
su
ch
lo
ad
s is o
uts
ide
th
e
sco
pe
of
this
asse
ssm
en
t.
Ad
ditio
na
l lo
ad
s d
ue
to
clim
ate
wo
uld
pri
ma
rily
b
e in
th
e f
orm
of
incre
ase
d f
ree
ze
/th
aw
cycle
s,
tem
pe
ratu
re
extr
em
es a
nd
ra
in/s
no
w a
mo
un
ts.
Th
e e
stim
ate
d
ad
ditio
na
l lo
ad
on
th
e
wa
lls f
rom
th
ese
fa
cto
rs is o
uts
ide
th
e
sco
pe
of
this
a
sse
ssm
en
t.
No
ne
kn
ow
n
3.
Exte
rio
r S
yste
ms:
a.
Wa
lls:
Th
e e
xis
tin
g lo
ad
ca
nn
ot
be
ca
lcu
late
d in
qu
an
tita
tive
U
nd
ete
rmin
ed
Un
de
term
ine
d
U
nd
ete
rmin
ed

En
gin
ee
rin
g V
uln
era
bili
ty A
sse
ssm
en
t o
f th
e M
ain
Sta
tistics C
an
ad
a B
uild
ing
to
th
e I
mp
acts
of
Clim
ate
Ch
an
ge
HO
K C
an
ad
a
9
9:1
28
4.4
.4 C
alc
ula
tio
n o
f T
ota
l L
oa
d (
LT)
Infr
as
tru
ctu
re C
om
po
ne
nt
(fro
m 4
.3.5
fro
m W
ork
Sh
ee
t 3
) 4
.4.1
Ex
isti
ng
Lo
ad
L
E
4.4
.2 C
lim
ate
Lo
ad
L
C
4.4
.3 O
the
r L
oa
d
LO
To
tal
Lo
ad
L
T =
LE+
LC+
LO
i.
Re
tain
ing
- c
on
cre
te
term
s.
Re
fer
to B
CR
20
07
–
Pa
ge
s 3
0 t
o 3
2.
L
oa
ds o
n r
eta
inin
g w
alls
are
re
late
d t
o s
oil
typ
es,
so
il m
ois
ture
co
nte
nt,
fr
ee
ze
/th
aw
cycle
s,
rain
/sn
ow
/ice
, e
tc.
Estim
atio
n
of
su
ch
lo
ad
s is o
uts
ide
th
e
sco
pe
of
this
asse
ssm
en
t.
Ad
ditio
na
l lo
ad
s d
ue
to
clim
ate
wo
uld
pri
ma
rily
b
e in
th
e f
orm
of
incre
ase
d f
ree
ze
/th
aw
cycle
s,
tem
pe
ratu
re
extr
em
es a
nd
ch
an
ge
s
in s
oil
mo
istu
re
co
nte
nt.
Th
e e
stim
ate
d
ad
ditio
na
l lo
ad
on
th
e
wa
lls f
rom
th
ese
fa
cto
rs is o
uts
ide
th
e
sco
pe
of
this
a
sse
ssm
en
t.
No
ne
kn
ow
n
4.
Exte
rio
r S
yste
ms:
a.
Sta
irs –
me
tal
Th
e e
xis
tin
g lo
ad
ca
nn
ot
be
ca
lcu
late
d in
qu
an
tita
tive
te
rms.
Un
de
term
ine
d
U
nd
ete
rmin
ed
Un
de
term
ine
d
Re
fer
to B
CR
20
07
–
Pa
ge
29
.
L
oa
ds o
n s
tair
s a
re p
rim
ari
ly
use
an
d e
nvir
on
me
nt
rela
ted
(t
em
p,
su
nlig
ht,
pre
cip
ita
tio
n,
etc
). E
stim
atio
n o
f su
ch
lo
ad
s
wo
uld
re
qu
ire
de
taile
d
me
ch
an
ica
l a
nd
ma
teri
al
mo
de
llin
g,
wh
ich
is o
uts
ide
th
e s
co
pe
of
this
a
sse
ssm
en
t.
Ad
ditio
na
l clim
ate
re
late
d lo
ad
s o
n s
tair
s
are
mo
stly in
th
e f
orm
o
f in
cre
ase
d
pre
cip
ita
tio
n a
nd
fr
ee
ze
/th
aw
cycle
s t
ha
t m
ay a
cce
lera
te m
eta
l d
ete
rio
ratio
n a
nd
m
ea
ns o
f fa
ste
nin
g t
o
the
bu
ildin
g o
r su
bstr
ate
s u
se
d.
No
ne
kn
ow
5.
Exte
rio
r S
yste
ms:
a.
Tu
nn
els
ma
nh
ole
s/a
cce
ss d
oo
rs
Th
e e
xis
tin
g lo
ad
ca
nn
ot
be
ca
lcu
late
d in
qu
an
tita
tive
te
rms.
Un
de
term
ine
d
U
nd
ete
rmin
ed
Un
de
term
ine
d
Re
fer
to B
CR
20
07
–
Pa
ge
33
.
W
ate
r p
en
etr
atio
n in
to t
he
P
ossib
le in
filtra
tio
n o
f N
on
e k
no
wn

En
gin
ee
rin
g V
uln
era
bili
ty A
sse
ssm
en
t o
f th
e M
ain
Sta
tistics C
an
ad
a B
uild
ing
to
th
e I
mp
acts
of
Clim
ate
Ch
an
ge
HO
K C
an
ad
a
1
00
:12
8
4.4
.4 C
alc
ula
tio
n o
f T
ota
l L
oa
d (
LT)
Infr
as
tru
ctu
re C
om
po
ne
nt
(fro
m 4
.3.5
fro
m W
ork
Sh
ee
t 3
) 4
.4.1
Ex
isti
ng
Lo
ad
L
E
4.4
.2 C
lim
ate
Lo
ad
L
C
4.4
.3 O
the
r L
oa
d
LO
To
tal
Lo
ad
L
T =
LE+
LC+
LO
syste
m h
as n
ot
be
en
a
pro
ble
m t
o d
ate
. D
rain
ag
e
syste
ms in
th
e t
un
ne
l a
re
su
ffic
ien
t sh
ou
ld t
his
occu
r.
Th
e e
xis
tin
g lo
ad
co
uld
be
co
nsid
ere
d t
o b
e z
ero
.
wa
ter
in t
he
tu
nn
el
syste
ms c
ou
ld o
ccu
r if
gro
un
d w
ate
r ta
ble
ris
e
to e
xe
rt c
on
tin
uo
us
hyd
rosta
tic p
ressu
re
on
tu
nn
el w
alls
. H
ow
eve
r, t
his
a
dd
itio
na
l clim
ate
lo
ad
ca
nn
ot
be
ca
lcu
late
d in
q
ua
ntita
tive
te
rms d
ue
to
a la
ck o
f d
ata
fo
r g
rou
nd
wa
ter
tab
le
leve
ls o
n t
he
site
an
d
ca
mp
us.
6.
Bu
ildin
g S
yste
ms:
a.
En
ve
lop
Syste
ms:
i.
Pre
ca
st
Co
ncre
te -
W
ind
ow
Sill
s
Th
e e
xis
tin
g lo
ad
ca
nn
ot
be
ca
lcu
late
d in
qu
an
tita
tive
te
rms.
Un
de
term
ine
d
U
nd
ete
rmin
ed
Un
de
term
ine
d
Re
fer
to B
CR
20
07
–
Pa
ge
s 6
1 t
o 6
6.
F
un
ctio
n o
f w
ind
ow
sill
s is t
o
dra
in w
ate
r a
nd
su
pp
ort
w
ind
ow
lo
ad
s,
the
refo
re,
exis
tin
g lo
ad
ca
nn
ot
be
ca
lcu
late
d in
qu
an
tita
tive
te
rms.
Clim
ate
lo
ad
ca
nn
ot
be
ca
lcu
late
d in
q
ua
ntita
tive
te
rms.
No
ne
kn
ow
n
7.
Bu
ildin
g S
yste
ms:
a.
En
ve
lop
Syste
ms:
i.
Gla
ze
d C
urt
ain
wa
ll
Th
e e
xis
tin
g lo
ad
ca
nn
ot
be
ca
lcu
late
d in
qu
an
tita
tive
te
rms.
Un
de
term
ine
d
U
nd
ete
rmin
ed
Un
de
term
ine
d
Re
fer
to B
CR
20
07
–
Pa
ge
s 6
3 t
o 6
4.
T
he
ab
ility
of
the
cu
rta
in w
all
to m
ee
t its p
erf
orm
an
ce
re
qu
ire
me
nts
(i.e
. w
ate
r/ra
in
dra
ina
ge
, th
erm
al co
mfo
rt,
ve
ntila
tio
n,
with
sta
nd
win
d
Clim
ate
lo
ad
ca
nn
ot
be
ca
lcu
late
d in
q
ua
ntita
tive
te
rms
No
ne
kn
ow
n
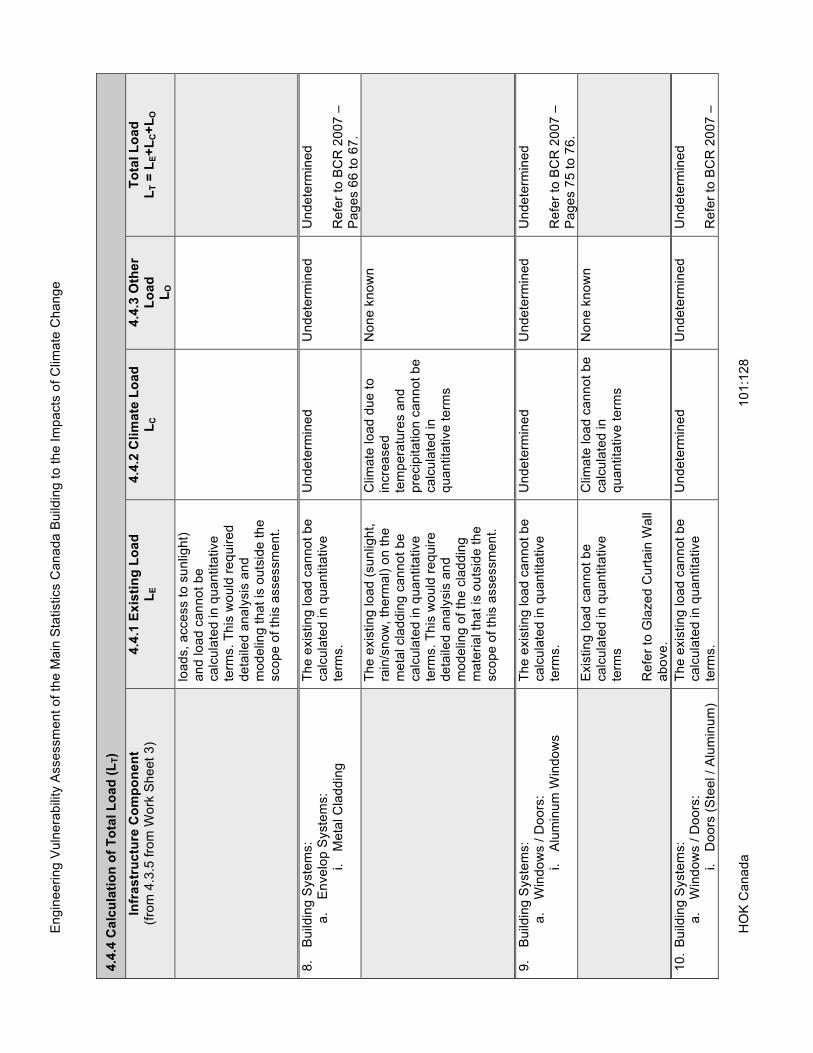
En
gin
ee
rin
g V
uln
era
bili
ty A
sse
ssm
en
t o
f th
e M
ain
Sta
tistics C
an
ad
a B
uild
ing
to
th
e I
mp
acts
of
Clim
ate
Ch
an
ge
HO
K C
an
ad
a
1
01
:12
8
4.4
.4 C
alc
ula
tio
n o
f T
ota
l L
oa
d (
LT)
Infr
as
tru
ctu
re C
om
po
ne
nt
(fro
m 4
.3.5
fro
m W
ork
Sh
ee
t 3
) 4
.4.1
Ex
isti
ng
Lo
ad
L
E
4.4
.2 C
lim
ate
Lo
ad
L
C
4.4
.3 O
the
r L
oa
d
LO
To
tal
Lo
ad
L
T =
LE+
LC+
LO
loa
ds,
acce
ss t
o s
un
ligh
t)
an
d lo
ad
ca
nn
ot
be
ca
lcu
late
d in
qu
an
tita
tive
te
rms.
Th
is w
ou
ld r
eq
uir
ed
d
eta
iled
an
aly
sis
an
d
mo
de
ling
th
at
is o
uts
ide
th
e
sco
pe
of
this
asse
ssm
en
t.
8.
Bu
ildin
g S
yste
ms:
a.
En
ve
lop
Syste
ms:
i.
Me
tal C
lad
din
g
Th
e e
xis
tin
g lo
ad
ca
nn
ot
be
ca
lcu
late
d in
qu
an
tita
tive
te
rms.
Un
de
term
ine
d
U
nd
ete
rmin
ed
Un
de
term
ine
d
Re
fer
to B
CR
20
07
–
Pa
ge
s 6
6 t
o 6
7.
T
he
exis
tin
g lo
ad
(su
nlig
ht,
ra
in/s
no
w,
the
rma
l) o
n t
he
m
eta
l cla
dd
ing
ca
nn
ot
be
ca
lcu
late
d in
qu
an
tita
tive
te
rms.
Th
is w
ou
ld r
eq
uir
e
de
taile
d a
na
lysis
an
d
mo
de
ling
of
the
cla
dd
ing
m
ate
ria
l th
at
is o
uts
ide
th
e
sco
pe
of
this
asse
ssm
en
t.
Clim
ate
lo
ad
du
e t
o
incre
ase
d
tem
pe
ratu
res a
nd
p
recip
ita
tio
n c
an
no
t b
e
ca
lcu
late
d in
q
ua
ntita
tive
te
rms
No
ne
kn
ow
n
9.
Bu
ildin
g S
yste
ms:
a.
Win
do
ws /
Do
ors
: i.
Alu
min
um
Win
do
ws
Th
e e
xis
tin
g lo
ad
ca
nn
ot
be
ca
lcu
late
d in
qu
an
tita
tive
te
rms.
Un
de
term
ine
d
U
nd
ete
rmin
ed
Un
de
term
ine
d
Re
fer
to B
CR
20
07
–
Pa
ge
s 7
5 t
o 7
6.
E
xis
tin
g lo
ad
ca
nn
ot
be
ca
lcu
late
d in
qu
an
tita
tive
te
rms
Re
fer
to G
laze
d C
urt
ain
Wa
ll a
bo
ve
.
Clim
ate
lo
ad
ca
nn
ot
be
ca
lcu
late
d in
q
ua
ntita
tive
te
rms
No
ne
kn
ow
n
10
. B
uild
ing
Syste
ms:
a.
Win
do
ws /
Do
ors
: i.
Do
ors
(S
tee
l /
Alu
min
um
)
Th
e e
xis
tin
g lo
ad
ca
nn
ot
be
ca
lcu
late
d in
qu
an
tita
tive
te
rms.
Un
de
term
ine
d
U
nd
ete
rmin
ed
Un
de
term
ine
d
Re
fer
to B
CR
20
07
–

En
gin
ee
rin
g V
uln
era
bili
ty A
sse
ssm
en
t o
f th
e M
ain
Sta
tistics C
an
ad
a B
uild
ing
to
th
e I
mp
acts
of
Clim
ate
Ch
an
ge
HO
K C
an
ad
a
1
02
:12
8
4.4
.4 C
alc
ula
tio
n o
f T
ota
l L
oa
d (
LT)
Infr
as
tru
ctu
re C
om
po
ne
nt
(fro
m 4
.3.5
fro
m W
ork
Sh
ee
t 3
) 4
.4.1
Ex
isti
ng
Lo
ad
L
E
4.4
.2 C
lim
ate
Lo
ad
L
C
4.4
.3 O
the
r L
oa
d
LO
To
tal
Lo
ad
L
T =
LE+
LC+
LO
P
ag
es 6
8 t
o 7
4.
E
xis
tin
g lo
ad
ca
nn
ot
be
ca
lcu
late
d in
qu
an
tita
tive
te
rms
Re
fer
to G
laze
d C
urt
ain
Wa
ll a
bo
ve
.
Clim
ate
lo
ad
ca
nn
ot
be
ca
lcu
late
d in
q
ua
ntita
tive
te
rms
No
ne
kn
ow
n
11
. B
uild
ing
Syste
ms:
a.
Fla
t R
oo
f S
yste
ms (
inclu
din
g r
oo
f d
rain
s)
Th
e e
xis
tin
g lo
ad
ca
nn
ot
be
ca
lcu
late
d in
qu
an
tita
tive
te
rms.
Un
de
term
ine
d
U
nd
ete
rmin
ed
Un
de
term
ine
d
Re
fer
to B
CR
20
07
–
Pa
ge
s 7
8 t
o 8
0.
C
alc
ula
tio
ns o
f ro
of
dra
in
loa
ds c
ou
ld n
ot
be
ma
de
, a
s
exis
tin
g d
esig
n/a
s b
uilt
sp
ecific
atio
ns w
ere
no
t a
va
ilab
le.
T
he
ab
ility
of
the
ro
of
to m
ee
t its p
erf
orm
an
ce
re
qu
ire
me
nts
a
nd
lo
ad
(i.e
. sh
ed
w
ate
r/ra
in,
the
rma
l co
mfo
rt,
with
sta
nd
win
d u
plif
t,
with
sta
nd
su
nlig
ht
/ te
mp
era
ture
flu
ctu
atio
ns /
fr
ee
ze
th
aw
cycle
s,
ke
ep
m
ois
ture
ou
t to
pre
se
rve
str
uctu
re a
nd
in
teri
or
fin
ish
) ca
nn
ot
be
ca
lcu
late
d in
q
ua
ntita
tive
te
rms.
Th
is
wo
uld
re
qu
ire
d d
eta
iled
a
na
lysis
an
d m
od
elin
g t
ha
t is
o
uts
ide
th
e s
co
pe
of
this
a
sse
ssm
en
t.
Clim
ate
lo
ad
ca
nn
ot
be
ca
lcu
late
d in
q
ua
ntita
tive
te
rms
No
ne
kn
ow
n
12
. E
lectr
ica
l S
yste
ms:
a.
Po
we
r S
up
ply
an
d R
elia
bili
ty
Th
e e
xis
tin
g lo
ad
ca
nn
ot
be
ca
lcu
late
d in
qu
an
tita
tive
U
nd
ete
rmin
ed
Un
de
term
ine
d
U
nd
ete
rmin
ed

En
gin
ee
rin
g V
uln
era
bili
ty A
sse
ssm
en
t o
f th
e M
ain
Sta
tistics C
an
ad
a B
uild
ing
to
th
e I
mp
acts
of
Clim
ate
Ch
an
ge
HO
K C
an
ad
a
1
03
:12
8
4.4
.4 C
alc
ula
tio
n o
f T
ota
l L
oa
d (
LT)
Infr
as
tru
ctu
re C
om
po
ne
nt
(fro
m 4
.3.5
fro
m W
ork
Sh
ee
t 3
) 4
.4.1
Ex
isti
ng
Lo
ad
L
E
4.4
.2 C
lim
ate
Lo
ad
L
C
4.4
.3 O
the
r L
oa
d
LO
To
tal
Lo
ad
L
T =
LE+
LC+
LO
term
s.
Re
fer
to B
CR
20
07
–
Pa
ge
s 1
67
to
18
9.
T
he
exis
tin
g a
nd
his
tori
ca
l e
lectr
ica
l p
ow
er
co
nsu
mp
tio
n
of
the
bu
ildin
g is k
no
wn
. H
ow
eve
r, t
he
qu
an
tifica
tio
n
of
relia
bili
ty a
nd
pro
vis
ion
of
ele
ctr
ica
l su
pp
ly is t
oo
co
mp
lex t
o c
on
du
ct
with
in
th
e s
co
pe
of
this
a
sse
ssm
en
t. S
uch
an
e
xe
rcis
e w
ou
ld h
ave
to
in
vo
lve
th
e lo
ca
l e
lectr
ica
l u
tilit
ies a
nd
a m
od
elli
ng
of
su
ch
fa
cto
rs.
Po
we
r re
liab
ility
is
cri
tica
l o
ve
r th
e s
pri
ng
, su
mm
er
an
d f
all
esp
ecia
lly
wh
en
te
mp
era
ture
s a
nd
h
um
idity a
re h
igh
er.
It
ha
s a
d
ire
ct
rela
tio
nsh
ip w
ith
co
mm
un
ity u
sa
ge
city w
ide
a
s d
uri
ng
th
is t
ime
it
will
pe
ak
an
d n
ot
be
ab
le t
o s
atisfy
th
e
de
ma
nd
.
Th
e c
oo
ling
lo
ad
on
th
e b
uild
ing
is
exp
ecte
d t
o in
cre
ase
d
ue
to
hig
he
r te
mp
era
ture
s a
nd
h
um
idity le
ve
ls a
nd
th
ere
fore
th
e e
lectr
icity
co
nsu
mp
tio
n a
nd
lo
ad
o
f th
e b
uild
ing
. T
his
m
ay h
ave
an
aff
ect
on
p
art
icu
larl
y
da
ys/p
eri
od
s in
th
e
su
mm
er.
Su
ch
pe
rio
ds
wh
en
th
e r
eg
ion
al lo
ad
o
n t
he
ele
ctr
icity
utilit
ies c
ou
ld p
ut
po
we
r su
pp
ly a
nd
re
liab
ility
at
risk.
H
ow
eve
r th
is e
ffe
ct
is
difficu
lt t
o p
red
ict
or
mo
de
l d
ue
to
th
e
co
mp
lex n
atu
re o
f th
e
ele
ctr
icity g
rid
an
d
mitig
atio
n m
ea
su
res
un
de
rta
ke
n b
y c
urr
en
t u
tilit
y p
rovid
ers
. S
uch
p
red
ictio
ns a
re o
uts
ide
th
e s
co
pe
of
this
a
sse
ssm
en
t.
No
ne
kn
ow
n

En
gin
ee
rin
g V
uln
era
bili
ty A
sse
ssm
en
t o
f th
e M
ain
Sta
tistics C
an
ad
a B
uild
ing
to
th
e I
mp
acts
of
Clim
ate
Ch
an
ge
HO
K C
an
ad
a
1
04
:12
8
4.4
.8 C
alc
ula
tio
n o
f T
ota
l C
ap
ac
ity
(C
T)
Fo
r a
ll t
he
bu
ild
ing
co
mp
on
en
ts b
elo
w,
a c
alc
ula
tio
n o
f to
tal
ca
pa
cit
y c
ou
ld n
ot
be
ca
rrie
d o
ut.
Sin
ce
to
tal
loa
ds
(4
.4.4
) c
ou
ld n
ot
be
ca
lcu
late
d o
r e
sti
ma
ted
, to
tal
ca
pa
cit
y c
alc
ula
tio
ns
we
re n
ot
un
de
rta
ke
n.
Th
e r
ea
so
ns
fo
r th
is a
re p
rov
ide
d a
bo
ve
in
th
e
“b
as
is o
f d
ete
rmin
ati
on
ex
pla
na
tio
ns
” (
4.4
.1 a
nd
4.4
.2)
Infr
as
tru
ctu
re C
om
po
ne
nt
(fro
m s
ectio
n 4
.3.5
of
Wo
rk S
he
et
3)
4.4
.5 E
xis
tin
g
Ca
pa
cit
y
CE
4.4
.6 M
atu
rin
g
Ca
pa
cit
y
CM
4.4
.7
Ad
dit
ion
al
Ca
pa
cit
y
CA
To
tal
Ca
pa
cit
y
CT =
CE+
CM+
CA
1.
Exte
rio
r S
yste
ms:
a.
Site
Dra
ina
ge
– r
ela
ted
to
slo
pe
s a
wa
y
fro
m t
he
bu
ildin
g a
nd
in
clu
de
s s
oil
pe
rme
ab
ility
an
d h
ard
su
rfa
ce
s lik
e s
tair
s
/ ra
mp
s
Un
de
term
ine
d
U
nd
ete
rmin
ed
Un
de
term
ine
d
U
nd
ete
rmin
ed
E
xis
tin
g c
ap
acity
ca
nn
ot
be
ca
lcu
late
d in
q
ua
ntita
tive
te
rms
No
ma
turi
ng
ca
pa
city is
an
ticip
ate
d.
No
in
cre
ase
s o
r d
ecre
ase
s in
a
dd
itio
na
l ca
pa
city is
an
ticip
ate
d o
r b
ein
g p
lan
ne
d.
2.
Exte
rio
r S
yste
ms:
a.
Wa
lls:
i.
Fre
esta
nd
ing
- c
on
cre
te
an
d m
aso
nry
Un
de
term
ine
d
U
nd
ete
rmin
ed
Un
de
term
ine
d
U
nd
ete
rmin
ed
E
xis
tin
g c
ap
acity
ca
nn
ot
be
ca
lcu
late
d in
q
ua
ntita
tive
te
rms
No
ma
turi
ng
ca
pa
city is
an
ticip
ate
d.
No
in
cre
ase
s o
r d
ecre
ase
s in
a
dd
itio
na
l ca
pa
city is
an
ticip
ate
d o
r b
ein
g p
lan
ne
d.
3.
Exte
rio
r S
yste
ms:
a.
Wa
lls:
i.
Re
tain
ing
- c
on
cre
te
Un
de
term
ine
d
U
nd
ete
rmin
ed
Un
de
term
ine
d
U
nd
ete
rmin
ed
E
xis
tin
g c
ap
acity
ca
nn
ot
be
ca
lcu
late
d in
q
ua
ntita
tive
No
ma
turi
ng
ca
pa
city is
an
ticip
ate
d.
No
in
cre
ase
s o
r d
ecre
ase
s in
a
dd
itio
na
l ca
pa
city is

En
gin
ee
rin
g V
uln
era
bili
ty A
sse
ssm
en
t o
f th
e M
ain
Sta
tistics C
an
ad
a B
uild
ing
to
th
e I
mp
acts
of
Clim
ate
Ch
an
ge
HO
K C
an
ad
a
1
05
:12
8
4.4
.8 C
alc
ula
tio
n o
f T
ota
l C
ap
ac
ity
(C
T)
Fo
r a
ll t
he
bu
ild
ing
co
mp
on
en
ts b
elo
w,
a c
alc
ula
tio
n o
f to
tal
ca
pa
cit
y c
ou
ld n
ot
be
ca
rrie
d o
ut.
Sin
ce
to
tal
loa
ds
(4
.4.4
) c
ou
ld n
ot
be
ca
lcu
late
d o
r e
sti
ma
ted
, to
tal
ca
pa
cit
y c
alc
ula
tio
ns
we
re n
ot
un
de
rta
ke
n.
Th
e r
ea
so
ns
fo
r th
is a
re p
rov
ide
d a
bo
ve
in
th
e
“b
as
is o
f d
ete
rmin
ati
on
ex
pla
na
tio
ns
” (
4.4
.1 a
nd
4.4
.2)
Infr
as
tru
ctu
re C
om
po
ne
nt
(fro
m s
ectio
n 4
.3.5
of
Wo
rk S
he
et
3)
4.4
.5 E
xis
tin
g
Ca
pa
cit
y
CE
4.4
.6 M
atu
rin
g
Ca
pa
cit
y
CM
4.4
.7
Ad
dit
ion
al
Ca
pa
cit
y
CA
To
tal
Ca
pa
cit
y
CT =
CE+
CM+
CA
term
s
a
nticip
ate
d o
r b
ein
g p
lan
ne
d.
4.
Exte
rio
r S
yste
ms:
a.
Sta
irs –
me
tal
Un
de
term
ine
d
U
nd
ete
rmin
ed
Un
de
term
ine
d
U
nd
ete
rmin
ed
E
xis
tin
g c
ap
acity
ca
nn
ot
be
ca
lcu
late
d in
q
ua
ntita
tive
te
rms
No
ma
turi
ng
ca
pa
city is
an
ticip
ate
d.
No
in
cre
ase
s o
r d
ecre
ase
s in
a
dd
itio
na
l ca
pa
city is
an
ticip
ate
d o
r b
ein
g p
lan
ne
d.
5.
Exte
rio
r S
yste
ms:
a.
Tu
nn
els
ma
nh
ole
s/a
cce
ss d
oo
rs
Un
de
term
ine
d
U
nd
ete
rmin
ed
Un
de
term
ine
d
U
nd
ete
rmin
ed
E
xis
tin
g c
ap
acity
ca
nn
ot
be
ca
lcu
late
d in
q
ua
ntita
tive
te
rms
No
ma
turi
ng
ca
pa
city is
an
ticip
ate
d.
No
in
cre
ase
s o
r d
ecre
ase
s in
a
dd
itio
na
l ca
pa
city is
an
ticip
ate
d o
r b
ein
g p
lan
ne
d.
6.
Bu
ildin
g S
yste
ms:
a.
En
ve
lop
Syste
ms:
i.
Pre
ca
st
Co
ncre
te -
W
ind
ow
Sill
s
Un
de
term
ine
d
U
nd
ete
rmin
ed
Un
de
term
ine
d
U
nd
ete
rmin
ed
E
xis
tin
g c
ap
acity
ca
nn
ot
be
ca
lcu
late
d in
q
ua
ntita
tive
te
rms
No
ma
turi
ng
ca
pa
city is
an
ticip
ate
d.
No
in
cre
ase
s o
r d
ecre
ase
s in
a
dd
itio
na
l ca
pa
city is
an
ticip
ate
d o
r b
ein
g p
lan
ne
d.
7.
Bu
ildin
g S
yste
ms:
Un
de
term
ine
d
Un
de
term
ine
d
Un
de
term
ine
d
Un
de
term
ine
d

En
gin
ee
rin
g V
uln
era
bili
ty A
sse
ssm
en
t o
f th
e M
ain
Sta
tistics C
an
ad
a B
uild
ing
to
th
e I
mp
acts
of
Clim
ate
Ch
an
ge
HO
K C
an
ad
a
1
06
:12
8
4.4
.8 C
alc
ula
tio
n o
f T
ota
l C
ap
ac
ity
(C
T)
Fo
r a
ll t
he
bu
ild
ing
co
mp
on
en
ts b
elo
w,
a c
alc
ula
tio
n o
f to
tal
ca
pa
cit
y c
ou
ld n
ot
be
ca
rrie
d o
ut.
Sin
ce
to
tal
loa
ds
(4
.4.4
) c
ou
ld n
ot
be
ca
lcu
late
d o
r e
sti
ma
ted
, to
tal
ca
pa
cit
y c
alc
ula
tio
ns
we
re n
ot
un
de
rta
ke
n.
Th
e r
ea
so
ns
fo
r th
is a
re p
rov
ide
d a
bo
ve
in
th
e
“b
as
is o
f d
ete
rmin
ati
on
ex
pla
na
tio
ns
” (
4.4
.1 a
nd
4.4
.2)
Infr
as
tru
ctu
re C
om
po
ne
nt
(fro
m s
ectio
n 4
.3.5
of
Wo
rk S
he
et
3)
4.4
.5 E
xis
tin
g
Ca
pa
cit
y
CE
4.4
.6 M
atu
rin
g
Ca
pa
cit
y
CM
4.4
.7
Ad
dit
ion
al
Ca
pa
cit
y
CA
To
tal
Ca
pa
cit
y
CT =
CE+
CM+
CA
a.
En
ve
lop
Syste
ms:
i.
Gla
ze
d C
urt
ain
wa
ll
E
xis
tin
g c
ap
acity
ca
nn
ot
be
ca
lcu
late
d in
q
ua
ntita
tive
te
rms
No
ma
turi
ng
ca
pa
city is
an
ticip
ate
d.
No
in
cre
ase
s o
r d
ecre
ase
s in
a
dd
itio
na
l ca
pa
city is
an
ticip
ate
d o
r b
ein
g p
lan
ne
d.
8.
Bu
ildin
g S
yste
ms:
a.
En
ve
lop
Syste
ms:
i.
Me
tal C
lad
din
g
Un
de
term
ine
d
U
nd
ete
rmin
ed
Un
de
term
ine
d
U
nd
ete
rmin
ed
E
xis
tin
g c
ap
acity
ca
nn
ot
be
ca
lcu
late
d in
q
ua
ntita
tive
te
rms
No
ma
turi
ng
ca
pa
city is
an
ticip
ate
d.
No
in
cre
ase
s o
r d
ecre
ase
s in
a
dd
itio
na
l ca
pa
city is
an
ticip
ate
d o
r b
ein
g p
lan
ne
d.
9.
Bu
ildin
g S
yste
ms:
a.
Win
do
ws /
Do
ors
: i.
Alu
min
um
Win
do
ws
Un
de
term
ine
d
U
nd
ete
rmin
ed
Un
de
term
ine
d
U
nd
ete
rmin
ed
E
xis
tin
g c
ap
acity
ca
nn
ot
be
ca
lcu
late
d in
q
ua
ntita
tive
te
rms
No
ma
turi
ng
ca
pa
city is
an
ticip
ate
d.
No
in
cre
ase
s o
r d
ecre
ase
s in
a
dd
itio
na
l ca
pa
city is
an
ticip
ate
d o
r b
ein
g p
lan
ne
d.
10
. B
uild
ing
Syste
ms:
a.
Win
do
ws /
Do
ors
: i.
Do
ors
(S
tee
l /
Alu
min
um
)
Un
de
term
ine
d
U
nd
ete
rmin
ed
Un
de
term
ine
d
U
nd
ete
rmin
ed

En
gin
ee
rin
g V
uln
era
bili
ty A
sse
ssm
en
t o
f th
e M
ain
Sta
tistics C
an
ad
a B
uild
ing
to
th
e I
mp
acts
of
Clim
ate
Ch
an
ge
HO
K C
an
ad
a
1
07
:12
8
4.4
.8 C
alc
ula
tio
n o
f T
ota
l C
ap
ac
ity
(C
T)
Fo
r a
ll t
he
bu
ild
ing
co
mp
on
en
ts b
elo
w,
a c
alc
ula
tio
n o
f to
tal
ca
pa
cit
y c
ou
ld n
ot
be
ca
rrie
d o
ut.
Sin
ce
to
tal
loa
ds
(4
.4.4
) c
ou
ld n
ot
be
ca
lcu
late
d o
r e
sti
ma
ted
, to
tal
ca
pa
cit
y c
alc
ula
tio
ns
we
re n
ot
un
de
rta
ke
n.
Th
e r
ea
so
ns
fo
r th
is a
re p
rov
ide
d a
bo
ve
in
th
e
“b
as
is o
f d
ete
rmin
ati
on
ex
pla
na
tio
ns
” (
4.4
.1 a
nd
4.4
.2)
Infr
as
tru
ctu
re C
om
po
ne
nt
(fro
m s
ectio
n 4
.3.5
of
Wo
rk S
he
et
3)
4.4
.5 E
xis
tin
g
Ca
pa
cit
y
CE
4.4
.6 M
atu
rin
g
Ca
pa
cit
y
CM
4.4
.7
Ad
dit
ion
al
Ca
pa
cit
y
CA
To
tal
Ca
pa
cit
y
CT =
CE+
CM+
CA
E
xis
tin
g c
ap
acity
ca
nn
ot
be
ca
lcu
late
d in
q
ua
ntita
tive
te
rms
No
ma
turi
ng
ca
pa
city is
an
ticip
ate
d.
No
in
cre
ase
s o
r d
ecre
ase
s in
a
dd
itio
na
l ca
pa
city is
an
ticip
ate
d o
r b
ein
g p
lan
ne
d.
11
. B
uild
ing
Syste
ms:
a.
Fla
t R
oo
f S
yste
ms (
inclu
din
g r
oo
f d
rain
s)
Un
de
term
ine
d
U
nd
ete
rmin
ed
Un
de
term
ine
d
U
nd
ete
rmin
ed
E
xis
tin
g c
ap
acity
ca
nn
ot
be
ca
lcu
late
d in
q
ua
ntita
tive
te
rms
No
ma
turi
ng
ca
pa
city is
an
ticip
ate
d.
No
in
cre
ase
s o
r d
ecre
ase
s in
a
dd
itio
na
l ca
pa
city is
an
ticip
ate
d o
r b
ein
g p
lan
ne
d.
12
. E
lectr
ica
l S
yste
ms:
a.
Po
we
r S
up
ply
an
d R
elia
bili
ty
Un
de
term
ine
d
U
nd
ete
rmin
ed
Un
de
term
ine
d
U
nd
ete
rmin
ed
E
xis
tin
g c
ap
acity
ca
nn
ot
be
ca
lcu
late
d in
q
ua
ntita
tive
te
rms
No
ma
turi
ng
ca
pa
city is
an
ticip
ate
d.
No
in
cre
ase
s o
r d
ecre
ase
s in
a
dd
itio
na
l ca
pa
city is
an
ticip
ate
d o
r b
ein
g p
lan
ne
d.

En
gin
ee
rin
g V
uln
era
bili
ty A
sse
ssm
en
t o
f th
e M
ain
Sta
tistics C
an
ad
a B
uild
ing
to
th
e I
mp
acts
of
Clim
ate
Ch
an
ge
HO
K C
an
ad
a
1
08
:12
8
4
.4.9
Ev
alu
ate
Vu
lne
rab
ilit
y (
VR)
Sin
ce
To
tal
Lo
ad
(L
T)
an
d T
ota
l C
ap
ac
ity
(C
T)
co
uld
no
t b
e c
alc
ula
ted
(s
ee
ex
pla
na
tio
ns
ab
ov
e)
a c
alc
ula
tio
n o
f v
uln
era
bil
ity
wa
s n
ot
co
nd
uc
ted
. T
he
refo
re V
R i
s u
nd
ete
rmin
ed
at
this
tim
e f
or
all
th
e b
uil
din
g c
om
po
ne
nts
id
en
tifi
ed
th
rou
gh
Ste
p 3
to
be
vu
lne
rab
le t
o
cli
ma
te c
ha
ng
e a
nd
wit
h P
C s
co
res
be
twe
en
12
an
d 3
5.
Ho
we
ve
r, b
as
ed
on
pro
fes
sio
na
l ju
dg
em
en
t, c
om
me
nta
ry h
as
be
en
pro
vid
ed
to
h
igh
lig
ht
sy
ste
ms
th
at
are
ex
tre
me
ly v
uln
era
ble
. T
his
ma
trix
ha
s b
ee
n m
od
ifie
d t
o a
cc
om
mo
da
te t
he
ab
ov
e r
ea
lity
.
Infr
as
tru
ctu
re C
om
po
ne
nt
C
om
me
nts
1.
Exte
rio
r S
yste
ms:
a.
Site
Dra
ina
ge
– r
ela
ted
to
slo
pe
s a
wa
y f
rom
th
e
bu
ildin
g a
nd
in
clu
de
s s
oil
pe
rme
ab
ility
an
d h
ard
su
rfa
ce
s lik
e s
tair
s /
ra
mp
s
Ba
se
d o
n lim
ite
d b
uild
ing
sp
ecific
in
form
atio
n a
lon
g w
ith
th
e v
inta
ge
of
co
nstr
uctio
n,
it c
an
be
exp
ecte
d t
ha
t b
elo
w g
rad
e f
ou
nd
atio
ns a
nd
fo
otin
gs
ma
y h
ave
da
mp
pro
ofin
g p
rovis
ion
s.
Dra
ina
ge
aro
un
d t
he
bu
ildin
g
pe
rim
ete
r m
ay b
e in
pla
ce
bu
t is
lik
ely
to
be
in
ad
eq
ua
te.
Na
tive
so
ils m
ay
be
use
d a
s b
ackfill
alo
ng
th
e p
eri
me
ter
wa
ll a
nd
as s
uch
will
ha
ve
sa
tura
ted
so
ils d
ire
ctly o
n t
he
be
low
gra
de
syste
ms a
nd
pe
rmit e
ve
ntu
al
wa
ter
infiltra
tio
n.
Ho
we
ve
r, t
yp
ica
l b
uild
ing
scie
nce
an
d m
an
ag
em
en
t p
ractice
s w
ou
ld
sa
feg
ua
rd d
ete
rio
ratio
n o
f th
is s
yste
m.
Giv
en
th
at
PW
GS
C h
ave
a d
eta
iled
re
vie
w o
f th
e b
uild
ing
eve
ry 5
ye
ars
to
pro
du
ce
an
up
-to
-da
te B
uild
ing
C
on
ditio
n R
ep
ort
co
rre
ctive
me
asu
res w
ou
ld b
e n
ote
d a
nd
im
ple
me
nte
d
du
e t
o d
ay t
o d
ay p
ractice
s.
2.
Exte
rio
r S
yste
ms:
a.
Wa
lls: i.
Fre
esta
nd
ing
- c
on
cre
te a
nd
ma
so
nry
Giv
en
th
at
the
re is n
o t
ie in
with
th
is s
yste
m t
o h
ab
ite
d s
pa
ce
an
d t
ha
t th
is
syste
m h
as a
esth
etic a
nd
scre
en
ing
pro
pe
rtie
s it
wa
s d
ee
me
d t
o n
ot
be
a
vita
l in
fra
str
uctu
re c
om
po
ne
nt.
Ha
vin
g s
aid
th
is,
it c
an
po
se
a h
ea
lth
an
d
sa
fety
ris
k d
ue
to
co
llap
se
sh
ou
ld t
he
syste
m d
ete
rio
rate
. D
rain
ag
e o
f th
e
wa
ll syste
m is c
ritica
l a
lon
g w
ith
a c
ap
to
sh
ed
wa
ter
at
the
to
p o
f th
e w
all.
T
he
fo
un
da
tio
n s
yste
m t
o t
he
se
wa
lls c
an
no
t re
ly o
n t
he
in
teri
or
bu
ildin
g
he
at
to k
ee
p t
he
fo
un
da
tio
ns r
ea
so
na
bly
wa
rm lik
e t
he
ba
se
me
nt
fou
nd
atio
n w
alls
. A
s a
re
su
lt,
fre
eze
th
aw
cycle
s w
ith
ha
ve
a s
ign
ific
an
t im
pa
ct
on
th
e in
teg
rity
of
the
wa
ll. T
he
ma
in r
isk is t
he
str
uctu
ral in
teg
rity
of
the
wa
ll th
at
co
uld
fa
ll d
ue
to
de
teri
ora
tio
n a
nd
th
us b
e a
he
alth
an
d s
afe
ty
risk.
H
avin
g s
aid
th
is t
he
co
mm
en
ts u
nd
er
ite
m #
1 r
eg
ard
ing
th
e c
urr
en
t b
uild
ing
scie
nce
an
d m
an
ag
em
en
t p
ractice
s o
n s
ite
als
o a
pp
ly.
Th
ese
w
ou
ld s
afe
gu
ard
th
e d
ete
rio
ratio
n o
f th
is s
yste
m c
om
po
ne
nt.

En
gin
ee
rin
g V
uln
era
bili
ty A
sse
ssm
en
t o
f th
e M
ain
Sta
tistics C
an
ad
a B
uild
ing
to
th
e I
mp
acts
of
Clim
ate
Ch
an
ge
HO
K C
an
ad
a
1
09
:12
8
3.
Exte
rio
r S
yste
ms:
a.
Wa
lls: i.
Re
tain
ing
- c
on
cre
te
Giv
en
th
at
the
re is p
ote
ntia
lly s
atu
rate
d s
oil
co
nd
itio
n o
n o
ne
sid
e o
f th
e
reta
inin
g w
all,
it
will
be
cri
tica
l to
ke
ep
wa
ter
an
d m
ois
ture
aw
ay f
rom
th
e
wa
ll so
th
at
it is a
s d
ry a
s p
ossib
le.
If n
ot
fre
eze
th
aw
cycle
s w
ill h
ave
n
eg
ative
im
pa
ct
on
th
e r
eta
inin
g w
all.
H
ow
eve
r, c
om
me
nts
un
de
r ite
m #
1 r
eg
ard
ing
th
e c
urr
en
t b
uild
ing
scie
nce
a
nd
ma
na
ge
me
nt
pra
ctice
s o
n s
ite
als
o a
pp
ly.
Th
ese
wo
uld
sa
feg
ua
rd t
he
d
ete
rio
ratio
n o
f th
is s
yste
m c
om
po
ne
nt.
4.
Exte
rio
r S
yste
ms:
a.
Sta
irs –
me
tal
Re
gu
lar
bu
ildin
g m
an
ag
em
en
t p
ractice
s m
ust
pre
va
il in
wh
ich
th
e s
tair
is
pa
inte
d o
n a
5 y
ea
r cycle
in
ord
er
to p
rese
rve
its
in
teg
rity
.
Co
mm
en
ts u
nd
er
ite
m #
1 r
eg
ard
ing
th
e c
urr
en
t b
uild
ing
scie
nce
an
d
ma
na
ge
me
nt
pra
ctice
s o
n s
ite
als
o a
pp
ly.
Th
ese
wo
uld
sa
feg
ua
rd t
he
d
ete
rio
ratio
n o
f th
is s
yste
m c
om
po
ne
nt.
5.
Exte
rio
r S
yste
ms:
a.
Tu
nn
els
ma
nh
ole
s/a
cce
ss d
oo
rs
Th
is in
fra
str
uctu
re c
om
po
ne
nt
is b
elo
w g
rad
e a
nd
th
rou
gh
ou
t th
e c
am
pu
s
su
pp
lyin
g a
ll b
uild
ing
s w
ith
cri
tica
lly n
ee
de
d s
tea
m a
nd
ch
ille
d w
ate
r. D
ue
to
th
e s
ite
s p
roxim
ity t
o t
he
riv
er
an
d in
cre
ase
in
pre
cip
ita
tio
n y
ea
r ro
un
d,
gro
un
d w
ate
r is
su
es w
ill a
ffe
ct
this
in
fra
str
uctu
re s
o m
uch
so
th
at
it w
ill
req
uir
e d
rain
ing
/ p
um
pin
g s
yste
ms.
Th
e T
un
ne
ls h
ave
a d
rain
ag
e s
yste
m
tha
t w
ill h
ave
to
be
an
aly
se
d in
ord
er
to d
ete
rmin
e h
ow
via
ble
it
is.
No
in
form
atio
n w
as p
rovid
ed
as t
his
syste
m is b
ein
g m
an
ag
ed
by P
WG
SC
an
d
SN
C P
roF
ac h
ad
no
in
form
atio
n o
n t
he
tu
nn
el syste
m.
Fu
rth
er
wo
rk is
req
uir
ed
to
un
de
rsta
nd
th
e s
yste
m a
nd
its
po
ten
tia
l vu
lne
rab
ility
.
6.
Bu
ildin
g S
yste
ms:
a.
En
ve
lop
Syste
ms:
i.
Pre
ca
st
Co
ncre
te -
Win
do
w S
ills
Giv
en
th
at
the
re is a
tw
o la
ye
r b
rick w
all
with
no
dra
ina
ge
ca
vity,
the
w
ind
ow
sill
is c
ritica
l to
sh
ed
as m
uch
wa
ter
aw
ay f
rom
th
e b
rick w
all
be
low
. R
eg
ula
r b
uild
ing
ma
na
ge
me
nt
pra
ctice
s a
s c
arr
ied
ou
t b
y S
NC
P
roF
ac w
ill r
evie
w d
eficie
ncie
s a
nd
re
ctify
win
do
w s
ills t
ha
t h
ave
d
ete
rio
rate
d a
nd
ca
n p
ose
a r
isk.
Th
ese
wo
uld
sa
feg
ua
rd t
he
de
teri
ora
tio
n
of
this
syste
m c
om
po
ne
nt.
7.
Bu
ildin
g S
yste
ms:
a.
En
ve
lop
Syste
ms:
i.
Gla
ze
d C
urt
ain
wa
ll
Gla
ze
d c
urt
ain
wa
ll syste
ms a
re m
ad
e u
p o
f m
an
y c
om
po
ne
nts
th
at
exp
an
d a
nd
co
ntr
act
at
diffe
ren
t ra
tes a
nd
th
ere
fore
aff
ect
the
syste
m’s
in
teg
rity
/ p
erf
orm
an
ce
. O
lde
r cu
rta
in w
alls
ma
y n
ot
be
de
taile
d s
uch
th
at
mo
istu
re /
wa
ter
dra
ins e
ffe
ctive
ly o
ut
of
the
syste
m.
Re
gu
lar
bu
ildin
g
ma
na
ge
me
nt
pra
ctice
s,
as c
arr
ied
ou
t b
y S
NC
Pro
Fa
c,
will
re
vie
w
de
ficie
ncie
s a
nd
re
ctify
cu
rta
in w
all
co
mp
on
en
ts t
ha
t h
ave
de
teri
ora
ted
an
d
ca
n p
ose
a s
eri
ou
s r
isk.
Th
ese
wo
uld
sa
feg
ua
rd t
he
de
teri
ora
tio
n o
f th
is
syste
m c
om
po
ne
nt.
8.
Bu
ildin
g S
yste
ms:
a.
En
ve
lop
Syste
ms:
i.
Me
tal C
lad
din
g
Me
tal cla
dd
ing
is s
ub
jecte
d t
o t
yp
ica
l w
ea
the
rin
g d
ue
to
so
lar
rad
iatio
n,
tem
pe
ratu
re f
luctu
atio
ns a
nd
ra
in /
sn
ow
eve
nts
. A
s c
lima
te c
ha
ng
e is
mo
re e
xtr
em
e t
he
cla
dd
ing
is lik
ely
to
be
exp
ose
d t
o h
ars
he
r w
ea
the
rin
g

En
gin
ee
rin
g V
uln
era
bili
ty A
sse
ssm
en
t o
f th
e M
ain
Sta
tistics C
an
ad
a B
uild
ing
to
th
e I
mp
acts
of
Clim
ate
Ch
an
ge
HO
K C
an
ad
a
1
10
:12
8
su
ch
th
at
it m
ay f
ail
ea
rlie
r in
th
e life
cycle
. R
eg
ula
r b
uild
ing
ma
na
ge
me
nt
pra
ctice
s,
as c
arr
ied
ou
t b
y S
NC
Pro
Fa
c,
will
re
vie
w d
eficie
ncie
s a
nd
re
ctify
me
tal cla
dd
ing
co
mp
on
en
ts t
ha
t h
ave
de
teri
ora
ted
an
d c
an
po
se
a
se
rio
us r
isk.
Th
ese
wo
uld
sa
feg
ua
rd t
he
de
teri
ora
tio
n o
f th
is s
yste
m
co
mp
on
en
t.
9.
Bu
ildin
g S
yste
ms:
a.
Win
do
ws /
Do
ors
: i.
Alu
min
um
Win
do
ws
Co
mm
en
ts u
nd
er
ite
m #
1 r
eg
ard
ing
th
e c
urr
en
t b
uild
ing
scie
nce
an
d
ma
na
ge
me
nt
pra
ctice
s o
n s
ite
als
o a
pp
ly.
Th
ese
wo
uld
sa
feg
ua
rd t
he
d
ete
rio
ratio
n o
f th
is s
yste
m c
om
po
ne
nt.
As w
ell
refe
r to
ite
m #
7 a
bo
ve
.
10
. B
uild
ing
Syste
ms:
a.
Win
do
ws /
Do
ors
: i.
Do
ors
(S
tee
l /
Alu
min
um
)
Th
e n
um
be
r o
f d
oo
r o
pe
nin
gs is g
en
era
lly m
uch
sm
alle
r th
an
th
e a
mo
un
t o
f g
lazin
g t
hro
ug
ho
ut
the
bu
ildin
g.
Th
is e
lem
en
t p
ose
s le
ss r
isk t
o t
he
b
uild
ing
ow
ne
r, m
an
ag
er
an
d t
en
an
t. I
t is
cri
tica
l fo
r d
oo
rs t
o h
ave
a g
oo
d
se
al so
th
at
it m
itig
ate
s in
teri
or
an
d e
xte
rio
r e
nvir
on
me
nts
, e
sp
ecia
lly
du
rin
g t
he
su
mm
er
mo
nth
s.
Re
gu
lar
bu
ildin
g m
an
ag
em
en
t p
ractice
s,
as
ca
rrie
d o
ut
by S
NC
Pro
Fa
c,
will
re
vie
w d
eficie
ncie
s a
nd
re
ctify
exte
rio
r d
oo
r co
mp
on
en
ts t
ha
t h
ave
de
teri
ora
ted
an
d c
an
po
se
a s
eri
ou
s r
isk.
Th
ese
wo
uld
sa
feg
ua
rd t
he
de
teri
ora
tio
n o
f th
is s
yste
m c
om
po
ne
nt.
11
. B
uild
ing
Syste
ms:
a.
Fla
t R
oo
f S
yste
ms (
inclu
din
g r
oo
f d
rain
s)
Giv
en
th
at
fla
t ro
ofs
will
re
tain
so
me
wa
ter
an
d t
ha
t fr
ee
ze
th
aw
cycle
s w
ill
incre
ase
ove
r th
e w
inte
r m
on
ths,
it c
an
be
exp
ecte
d t
ha
t th
is w
ill p
ose
a
sig
nific
an
t str
ain
on
th
e in
teg
rity
of
the
syste
m s
o m
uch
so
th
at
the
life
cycle
will
be
sh
ort
en
ed
. U
ne
xp
ecte
d le
aks m
ay t
ake
pla
ce
an
d t
he
refo
re
co
mp
rom
ise
th
e s
tru
ctu
re a
nd
fin
ish
es b
elo
w.
Th
is s
yste
m is v
ita
l to
th
e
we
ll b
ein
g o
f a
bu
ildin
g’s
op
era
tio
ns a
nd
as s
uch
is c
ritica
l syste
m t
ha
t re
qu
ire
s c
on
sta
nt
mo
nito
rin
g.
Typ
ica
l m
an
ag
em
en
t p
ractice
s r
eq
uir
e
an
nu
al re
vie
w o
f th
is s
yste
m s
uch
th
at
it w
ill s
afe
gu
ard
th
e s
yste
m.
12
. E
lectr
ica
l S
yste
ms:
a.
Po
we
r S
up
ply
an
d R
elia
bili
ty
As t
em
pe
ratu
re a
nd
hu
mid
ity le
ve
ls w
ill in
cre
ase
, e
lectr
ica
l d
em
an
ds w
ill
als
o in
cre
ase
with
no
gu
ara
nte
e t
ha
t th
e u
tilit
y w
ill b
e a
ble
to
su
pp
ly
en
ou
gh
po
we
r city w
ide
. P
ow
er
su
pp
ly a
nd
re
liab
ility
is t
he
refo
re v
ery
vu
lne
rab
le.
Th
is e
lem
en
t is
no
t re
vie
we
d a
s p
art
of
typ
ica
l b
uild
ing
co
nd
itio
n m
an
ag
em
en
t p
ractice
s a
nd
th
ere
fore
will
re
qu
ire
sp
ecia
l a
tte
ntio
n
an
d m
on
ito
rin
g.
Wh
en
VR >
1,
the
in
fra
str
uc
ture
co
mp
on
en
t is
vu
lne
rab
le
Infr
as
tru
ctu
re C
om
po
ne
nt
sh
ow
ing
vu
lne
rab
ilit
y s
ho
uld
be
fo
rwa
rde
d t
o S
ec
tio
n 4
.5.2
in
Wo
rk S
he
et
5 f
or
ST
EP
5 R
ec
om
me
nd
ati
on
E
va
lua
tio
n.
Lis
t In
fra
str
uc
ture
Co
mp
on
en
ts f
orw
ard
ed
to
Se
cti
on
4.5
.2 o
f W
ork
Sh
ee
t 5
fo
r R
ec
om
me
nd
ati
on
As
se
ss
me
nt
be
low
:

En
gin
ee
rin
g V
uln
era
bili
ty A
sse
ssm
en
t o
f th
e M
ain
Sta
tistics C
an
ad
a B
uild
ing
to
th
e I
mp
acts
of
Clim
ate
Ch
an
ge
HO
K C
an
ad
a
1
11
:12
8
1.
Exte
rio
r S
yste
ms:
a.
Tu
nn
els
, M
an
ho
les,
Acce
ss D
oo
rs
- F
urt
he
r w
ork
is r
eq
uir
ed
to
un
de
rsta
nd
th
e s
yste
m a
nd
its
po
ten
tia
l vu
lne
rab
ility
.
2.
Bu
ildin
g S
yste
ms:
a.
Fla
t R
oo
f S
yste
ms -
Th
is s
yste
m is v
ita
l to
th
e w
ell
be
ing
of
a b
uild
ing
’s o
pe
ratio
ns a
nd
as s
uch
is c
ritica
l syste
m t
ha
t re
qu
ire
s c
on
sta
nt
mo
nito
rin
g t
o c
om
plim
en
t cu
rre
nt
an
nu
al re
vie
w p
ractice
s in
pla
ce
.
3.
Ele
ctr
ica
l S
yste
ms:
a.
Po
we
r S
up
ply
an
d R
elia
bili
ty -
Th
is e
lem
en
t is
no
t re
vie
we
d a
s p
art
of
typ
ica
l b
uild
ing
co
nd
itio
n m
an
ag
em
en
t p
ractice
s a
nd
th
ere
fore
w
ill r
eq
uir
e s
pe
cia
l a
tte
ntio
n a
nd
mo
nito
rin
g.

En
gin
ee
rin
g V
uln
era
bili
ty A
sse
ssm
en
t o
f th
e M
ain
Sta
tistics C
an
ad
a B
uild
ing
to
th
e I
mp
acts
of
Clim
ate
Ch
an
ge
HO
K C
an
ad
a
1
12
:12
8
4
.4.1
0 A
da
pti
ve
Ca
pa
cit
y (
AR)
Sin
ce
To
tal
Lo
ad
(L
T)
an
d T
ota
l C
ap
ac
ity
(C
T)
co
uld
no
t b
e c
alc
ula
ted
(s
ee
ex
pla
na
tio
ns
ab
ov
e)
a c
alc
ula
tio
n o
f A
da
pti
ve
Ca
pa
cit
y w
as
n
ot
co
nd
uc
ted
. T
he
refo
re A
R i
s u
nd
ete
rmin
ed
at
this
tim
e f
or
all
th
e b
uil
din
g c
om
po
ne
nts
id
en
tifi
ed
th
rou
gh
Ste
p 3
to
be
vu
lne
rab
le t
o
cli
ma
te c
ha
ng
e a
nd
wit
h P
C s
co
res
be
twe
en
12
an
d 3
5.
Ho
we
ve
r, d
ue
to
pro
fes
sio
na
l ju
dg
em
en
t, c
om
me
nta
ry h
as
be
en
pro
vid
ed
to
h
igh
lig
ht
sy
ste
ms
th
at
ha
ve
ad
ap
tiv
e c
ap
ac
ity
. T
he
fo
llo
win
g m
atr
ix h
as
be
en
mo
dif
ied
to
ac
co
mm
od
ate
th
e a
bo
ve
re
ali
ty.
Infr
as
tru
ctu
re C
om
po
ne
nt
C
om
me
nts
1.
Exte
rio
r S
yste
ms:
a.
Site
Dra
ina
ge
– r
ela
ted
to
slo
pe
s a
wa
y f
rom
th
e b
uild
ing
a
nd
in
clu
de
s s
oil
pe
rme
ab
ility
an
d h
ard
su
rfa
ce
s lik
e
sta
irs /
ra
mp
s
2.
Exte
rio
r S
yste
ms:
a.
Wa
lls: i.
Fre
esta
nd
ing
- c
on
cre
te a
nd
ma
so
nry
3.
Exte
rio
r S
yste
ms:
a.
Wa
lls: i.
Re
tain
ing
- c
on
cre
te
4.
Exte
rio
r S
yste
ms:
a.
Sta
irs –
me
tal
5.
Bu
ildin
g S
yste
ms:
a.
En
ve
lop
Syste
ms:
i.
Pre
ca
st
Co
ncre
te -
Win
do
w S
ills
6.
Bu
ildin
g S
yste
ms:
a.
En
ve
lop
Syste
ms:
i.
Gla
ze
d C
urt
ain
wa
ll
7.
Bu
ildin
g S
yste
ms:
a.
En
ve
lop
Syste
ms:
i.
Me
tal C
lad
din
g
8.
Bu
ildin
g S
yste
ms:
a.
Win
do
ws /
Do
ors
: i.
Alu
min
um
Win
do
ws
9.
Bu
ildin
g S
yste
ms:
a.
Win
do
ws /
Do
ors
: i.
Do
ors
(S
tee
l /
Alu
min
um
)
Th
ese
syste
ms h
ave
ad
ap
tive
ca
pa
city t
hro
ug
h t
yp
ica
l b
uild
ing
scie
nce
b
est
pra
ctice
s t
ha
t co
uld
be
im
ple
me
nte
d a
s p
art
of
the
bu
ildin
g
ma
na
ge
me
nt
pro
gra
m t
hro
ug
h r
eg
ula
r sch
ed
ule
d b
uild
ing
ma
inte
na
nce
a
ctivitie
s.

En
gin
ee
rin
g V
uln
era
bili
ty A
sse
ssm
en
t o
f th
e M
ain
Sta
tistics C
an
ad
a B
uild
ing
to
th
e I
mp
acts
of
Clim
ate
Ch
an
ge
HO
K C
an
ad
a
1
13
:12
8
4
.4.1
2 D
ata
Su
ffic
ien
cy
Id
en
tify
pro
ce
ss
to
de
ve
lop
da
ta,
Wh
ere
in
su
ffic
ien
t
Da
ta N
ee
de
d
Pro
ce
ss
Bu
ildin
g M
ate
ria
l P
rop
ert
ies
Re
gu
lar
bu
ildin
g c
on
ditio
n r
evie
ws,
se
rvic
e life
an
aly
sis
an
d
pro
fessio
na
l ju
dg
em
en
t.
Riv
er
Wa
ter
Ye
ar
Ro
un
d T
em
pe
ratu
res
Lik
e t
he
Clif
f S
tre
et
Pla
nt
– m
on
ito
r ri
ve
r w
ate
r te
mp
era
ture
re
gu
larl
y,
da
ily a
nd
th
rou
gh
ou
t th
e d
ay.
So
il C
ha
racte
ristic M
on
ito
rin
g
De
ve
lop
so
me
so
il m
on
ito
rin
g s
tatio
ns w
ith
in t
he
Ott
aw
a r
eg
ion
Gro
un
d W
ate
r M
on
ito
rin
g
De
ve
lop
so
me
gro
un
d w
ate
r m
on
ito
rin
g s
tatio
ns w
ith
in t
he
Ott
aw
a
reg
ion
.
Wh
ere
da
ta c
an
no
t b
e d
ev
elo
pe
d,
ide
nti
fy t
he
da
ta g
ap
as
a f
ind
ing
in
Ste
p 5
of
the
Pro
toc
ol
– R
ec
om
me
nd
ati
on
s.
Lis
t D
ata
Ga
p a
s f
ind
ing
s t
o b
e s
en
t to
ST
EP
5 (
Wo
rks
he
et
5:
Se
cti
on
3.5
.2)
8.
9.
10
.
11
.
D
ate:
M
ay 9
, 200
8 P
rep
ared
by:
Vin
ce C
atal
li

En
gin
ee
rin
g V
uln
era
bili
ty A
sse
ssm
en
t o
f th
e M
ain
Sta
tistics C
an
ad
a B
uild
ing
to
th
e I
mp
acts
of
Clim
ate
Ch
an
ge
HO
K C
an
ad
a
1
14
:12
8
Wo
rksh
ee
t 5
Re
co
mm
en
da
tio
ns –
Ma
in S
tatistics C
an
ad
a B
uild
ing
4.5
.1 S
tate
Lim
itati
on
s
MA
JO
R A
SS
UM
PT
ION
S6
A
va
ila
ble
in
fra
str
uc
ture
in
form
ati
on
an
d
so
urc
es
B
uild
ing
da
ta f
rom
th
e 2
00
7 b
uild
ing
co
nd
itio
n r
ep
ort
s is a
ssu
me
d t
o b
e a
ccu
rate
. H
ow
eve
r, b
eca
use
th
e a
sse
ssm
en
t is
fo
cu
se
d o
n f
utu
re s
ce
na
rio
s f
or
the
re
gio
na
l clim
ate
, a
ke
y
limita
tio
n t
o e
nsu
rin
g a
nd
ma
kin
g p
red
ictio
ns a
bo
ut
se
rvic
e life
of
bu
ildin
g m
ate
ria
ls a
nd
co
mp
on
en
ts is t
he
ava
ilab
le/f
ore
ca
ste
d a
nd
/or
pla
ns f
or
refu
rbis
hm
en
t, r
eh
ab
ilita
tio
n,
reco
nstr
uctio
n o
r d
em
olit
ion
an
d r
eb
uild
ing
of
the
bu
ildin
g.
T
he
un
ce
rta
inty
an
d f
luctu
atin
g b
ud
ge
ts o
f in
ve
stm
en
t a
nd
lo
ng
te
rm c
ap
ita
l p
lan
s o
f P
ub
lic W
ork
s
an
d G
ove
rnm
en
t S
erv
ice
s C
an
ad
a.
Th
is c
an
re
su
lt in
de
ferr
ed
ma
inte
na
nce
th
at
ca
n in
tu
rn a
ffe
ct
the
ab
ility
to
ma
inta
in t
he
bu
ildin
g t
o t
he
re
qu
ire
d p
erf
orm
an
ce
sta
nd
ard
s.
Th
ey c
an
als
o c
ha
ng
e
the
op
era
tin
g a
nd
ma
inte
na
nce
pri
ori
tie
s f
or
the
bu
ildin
g a
s w
ell
as p
lan
ne
d c
ap
ita
l u
pg
rad
es.
H
ow
eve
r, t
he
re
su
lts o
f th
is a
sse
ssm
en
t ca
n in
form
th
e f
utu
re d
eve
lop
me
nt
of
the
se
bu
dg
ets
an
d
pla
ns f
or
the
bu
ildin
g a
nd
th
e T
un
ne
y’s
Pa
stu
re C
am
pu
s in
ge
ne
ral.
A s
eco
nd
lim
ita
tio
n is t
he
in
ab
ility
to
pre
dic
t th
e o
ccu
rre
nce
of
extr
em
e w
ea
the
r e
ve
nts
th
at
ca
use
b
uild
ing
co
mp
on
en
ts o
r m
ate
ria
ls t
o f
ail
pre
ma
ture
ly.
Av
ail
ab
le c
lim
ate
an
d i
nfo
rma
tio
n
With
re
sp
ect
to lim
ita
tio
ns o
f th
e c
lima
te c
ha
ng
e m
od
els
, th
e m
od
els
use
d c
an
be
co
nsid
ere
d t
o b
e
the
be
st
ava
ilab
le e
stim
ate
s.
Ho
we
ve
r se
nsitiv
ity o
r u
nce
rta
inty
an
aly
sis
is s
till
un
de
r d
eve
lop
me
nt
in t
he
clim
ate
ch
an
ge
mo
de
ling
fie
ld.
Av
ail
ab
le O
the
r C
ha
ng
e I
nfo
rma
tio
n
an
d s
ou
rce
s
PW
GS
C is c
on
tin
uo
usly
op
tim
izin
g s
pa
ce
usa
ge
with
it’s r
ea
l p
rop
ert
y h
old
ing
s a
nd
in
co
nso
rt w
ith
S
NC
-La
va
lin P
rofa
c.
Th
ese
ch
an
ge
s d
o a
ffe
ct
the
ca
pa
city o
f th
e in
fra
str
uctu
re t
o m
ain
tain
o
ptim
um
wo
rk e
nvir
on
me
nts
fo
r b
uild
ing
occu
pa
nts
. H
ow
eve
r, t
he
cu
rre
nt
sta
nd
ard
s a
pp
lied
to
o
ccu
pa
ncy d
en
sity w
ith
th
e M
ain
Sta
tistics C
an
ad
a b
uild
ing
are
still
with
in t
he
ab
ility
of
the
bu
ildin
g
syste
ms t
o c
rea
te e
nvir
on
me
nts
th
at
me
et
the
ap
plic
ab
le c
od
es a
nd
sta
nd
ard
s (
i.e
. C
an
ad
a
La
bo
ur
Co
de
an
d O
ccu
pa
tio
na
l H
ea
lth
an
d S
afe
ty R
eg
ula
tio
ns).
F
urt
he
rmo
re,
incre
ase
d u
se
(th
rou
gh
hig
he
r e
mp
loye
e/o
ccu
pa
nt
de
nsitie
s)
with
in t
he
bu
ildin
g w
ill
ha
ve
an
eff
ect
on
th
e h
ea
tin
g a
nd
co
olin
g lo
ad
s p
lace
d o
n t
he
bu
ildin
g s
yste
ms a
nd
th
e c
en
tra
l h
ea
tin
g a
nd
co
olin
g p
lan
t. H
igh
er
de
nsity o
f IT
/IM
eq
uip
me
nt
als
o h
as d
ire
ct
eff
ects
on
he
atin
g,
co
olin
g a
nd
ve
ntila
tio
n s
yste
ms,
oft
en
re
qu
irin
g a
dd
itio
na
l co
olin
g,
ve
ntila
tio
n a
nd
hu
mid
ity c
on
tro
l
6 N
otio
nally
, the
se a
re th
e sa
me
maj
or a
ssum
ptio
ns th
at u
nder
lie th
e en
tire
asse
ssm
ent a
s de
term
ined
in S
tep
1 an
d S
tep
2 of
this
P
roto
col.
The
y m
ay in
clud
e bo
unda
ry c
ondi
tions
use
d to
def
ine
the
stud
y ar
ea, t
ime
fram
e, r
efur
bish
men
t sch
edul
es, e
tc.

En
gin
ee
rin
g V
uln
era
bili
ty A
sse
ssm
en
t o
f th
e M
ain
Sta
tistics C
an
ad
a B
uild
ing
to
th
e I
mp
acts
of
Clim
ate
Ch
an
ge
HO
K C
an
ad
a
1
15
:12
8
to b
e im
ple
me
nte
d.
Th
e r
atio
be
twe
en
em
plo
ye
e/w
ork
sta
tio
n s
pa
ce
an
d I
T/I
M s
pa
ce
ca
n h
ave
co
nsid
era
ble
aff
ect
on
th
e b
uild
ing
syste
ms,
pa
rtic
ula
rly h
ea
tin
g,
ve
ntila
tio
n a
nd
hu
mid
ity c
on
tro
l.
T
he
fre
qu
en
cy o
f m
ain
ten
an
ce
an
d q
ua
lity o
f m
ain
ten
an
ce
pra
ctice
s h
ave
in
flu
en
ce
on
th
e
ca
pa
city o
f th
e b
uild
ing
, p
art
icu
larl
y o
n t
he
lo
ng
evity o
f b
uild
ing
co
mp
on
en
ts a
nd
syste
ms.
De
ferr
ed
ma
inte
na
nce
an
d lo
w q
ua
lity m
ate
ria
ls w
ill a
cce
lera
te d
ete
rio
ratio
n o
f b
uild
ing
syste
ms.
Th
is is p
art
icu
larl
y im
po
rta
nt
for
bu
ildin
gs t
ha
t a
re r
ea
ch
ing
th
e e
nd
of
the
ir d
esig
n life
sp
an
.
Us
e o
f G
en
eri
c/s
pe
cif
ic e
xa
mp
les
to
re
pre
se
nt
po
pu
lati
on
n
on
e
Un
ce
rta
inty
an
d r
ela
ted
co
nc
ep
ts
Th
e T
un
ne
y’s
Pa
stu
re C
am
pu
s is c
urr
en
tly t
he
fo
cu
s o
f a
Ma
ste
r P
lan
nin
g e
xe
rcis
e b
ein
g
un
de
rta
ke
n b
y P
ub
lic W
ork
s a
nd
Go
ve
rnm
en
t S
erv
ice
s C
an
ad
a.
Th
e o
utc
om
es o
f th
is s
tud
y a
re
un
kn
ow
n a
t th
is t
ime
an
d d
ifficu
lt t
o p
red
ict.
Ho
we
ve
r, t
he
y m
ay a
ffe
ct
the
in
ve
stm
en
t p
lan
s a
nd
b
ud
ge
ts a
nd
re
su
ltin
g p
rio
ritie
s f
or
the
Ma
in S
tatistics C
an
ad
a B
uild
ing
.
Th
e H
eri
tag
e d
esig
na
tio
n o
f th
e M
ain
Sta
tistics C
an
ad
a B
uild
ing
co
uld
aff
ect
the
po
ten
tia
l p
rio
ritie
s
an
d p
lan
s t
o im
pro
ve
, u
pg
rad
e o
r re
furb
ish
th
e b
uild
ing
, p
art
icu
larl
y t
he
bu
ildin
g e
nve
lop
. T
his
fa
cto
r w
as n
ot
inclu
de
d o
r re
se
arc
he
d a
s p
art
of
this
asse
ssm
en
t.
B
eca
use
th
e M
ain
Sta
tistics C
an
ad
a B
uild
ing
re
lies o
n t
he
Ce
ntr
al H
ea
tin
g a
nd
Co
olin
g P
lan
t (C
HC
P)
for
he
atin
g a
nd
co
olin
g f
or
mu
ch
of
it’s
occu
pie
d s
pa
ce
, th
e e
ffic
ien
cy a
nd
aff
ects
of
incre
ase
d lo
ad
s o
n t
he
CH
CP
ne
ed
to
be
stu
die
d f
urt
he
r. T
his
is a
ma
jor
limita
tio
n o
f th
e c
urr
en
t a
sse
ssm
en
t a
s t
he
bu
ildin
g a
nd
its
co
mp
on
en
ts s
ho
uld
be
co
nsid
ere
d t
o b
e a
n in
teg
rate
d s
yste
m
wo
rkin
g t
o p
rovid
e t
he
ne
ce
ssa
ry f
un
ctio
ns f
or
its o
ccu
pa
nts
. I.
e.
ch
an
ge
s t
o t
he
bu
ildin
g e
nve
lop
w
ill im
pa
ct
he
atin
g a
nd
co
olin
g lo
ad
s.
Oth
er
Ch
an
ge
s t
o t
he
po
licie
s g
ove
rnin
g in
ve
stm
en
ts in
ma
inte
na
nce
an
d r
eca
pita
liza
tio
n o
f fe
de
ral
bu
ildin
gs m
ay a
cce
lera
te t
he
re
fitt
ing
an
d/o
r co
mp
lete
re
bu
ildin
g o
f th
e M
ain
Sta
tistics C
an
ad
a
Bu
ildin
g.
Su
ch
ch
an
ge
s m
ay a
lso
in
dic
ate
th
e n
ee
d t
o d
eco
mm
issio
n t
he
bu
ildin
g (
as it
is n
ea
r th
e
en
d o
f its d
esig
n life
) a
nd
bu
ild a
ne
w f
acili
ty.
Ho
we
ve
r, m
ee
tin
g w
ith
PW
GS
C a
nd
SN
C-L
ava
lin
Pro
fac in
dic
ate
d t
ha
t th
is w
as u
nlik
ely
in
th
e n
ea
r fu
ture
(5
-10
ye
ars
).

En
gin
ee
rin
g V
uln
era
bili
ty A
sse
ssm
en
t o
f th
e M
ain
Sta
tistics C
an
ad
a B
uild
ing
to
th
e I
mp
acts
of
Clim
ate
Ch
an
ge
HO
K C
an
ad
a
1
16
:12
8
4.5
.2 R
eco
mm
en
da
tio
ns
Infr
as
tru
ctu
re C
om
po
ne
nt
/ D
ata
Ga
p
Re
me
dia
l E
ng
ine
eri
ng
A
cti
on
Ma
na
ge
me
nt
Ac
tio
ns
No
fu
rth
er
Ac
tio
n
Re
co
mm
en
da
tio
n
Pri
ori
ty
(lo
w,
me
diu
m,
hig
h)7
Co
mm
en
ts
Co
mp
on
en
ts w
ith
Vu
lne
rab
ilit
y
Pri
ori
ty v
alu
es
> 3
6
4.
Exte
rio
r S
yste
ms:
a
. S
ite
D
rain
s
–
sto
rm
an
d
rain
w
ate
r
Re
fer
to B
CR
2
00
7 p
ag
es
25
an
d 3
4 t
o
44
.
Re
se
arc
h t
he
de
taile
d e
xis
tin
g
an
d p
roje
cte
d lo
ad
s o
n t
he
site
d
rain
s,
so
il ty
pe
s,
site
slo
pe
s,
wa
ter
tab
les a
nd
be
dro
ck
top
og
rap
hy a
nd
gro
un
dw
ate
r ta
ble
s t
o d
ete
rmin
e if
op
tim
um
e
ng
ine
eri
ng
so
lutio
n (
e.g
. w
ate
r re
ten
tio
n a
rea
s o
r g
rou
nd
wa
ter
rech
arg
e
syste
ms).
M
ed
ium
T
his
syste
m is n
ot
ad
eq
ua
tely
mo
nito
red
at
the
BC
R le
ve
l a
s t
he
re is little
to
no
me
ntio
of
the
site
dra
ina
ge
syste
ms.
It is o
ur
un
de
rsta
nd
ing
th
at
in t
he
mid
90
’s w
ork
wa
do
ne
to
up
da
te t
he
site
dra
ina
ge
syste
m,
ho
we
ve
r w
e c
ou
ld n
ot
de
fin
itiv
ely
co
nfirm
th
is.
It is h
igh
ly lik
ely
th
at
as a
re
su
lt o
f th
isu
pd
ate
ad
de
d c
ap
acity w
as b
uilt
in
. T
he
d
esig
n p
ara
me
ters
of
the
sto
rm d
rain
s w
ere
no
t a
va
ilab
le.
Ba
se
d o
n p
rofe
ssio
na
l ju
dg
me
nt
with
civ
il e
ng
ine
eri
ng
in
pu
t, t
he
e
xis
tin
g s
torm
dra
ins m
ee
t a
nd
are
p
ote
ntia
lly a
t fu
ll ca
pa
city.
B
ase
d o
n p
roje
cte
d
incre
ase
d p
recip
ita
tio
nth
ese
syste
ms w
ill p
ote
ntia
lly b
e in
ad
eq
ua
ta
nd
as s
uch
ma
y n
ee
d t
o b
e s
up
ple
me
nte
dw
ith
sto
rm w
ate
r re
ten
tio
n a
rea
s o
r w
ith
g
rou
nd
wa
ter
rech
arg
e s
yste
ms.
5.
Exte
rio
r S
yste
ms:
a
. W
alk
wa
ys
–
co
ncre
te,
asp
ha
lt,
un
it
pa
ve
rs
Re
fer
to B
CR
2
00
7 p
ag
es
44
to
48
.
Fir
st,
it
is r
eco
mm
en
de
d t
ha
t a
ll o
f th
ese
pa
rkin
g s
urf
ace
s
be
ke
pt
fre
e a
nd
cle
ar
of
sn
ow
in
acco
rda
nce
with
cu
rre
nt
bu
ildin
g m
an
ag
em
en
t p
ractice
s.
H
igh
D
ue
to
in
cre
ase
d f
ree
ze
th
aw
an
d r
ain
ove
the
win
ter
mo
nth
s it
ca
n b
e e
xp
ecte
d t
ha
t th
ere
will
be
mo
re ice
bu
ild-u
p o
n w
alk
wa
ys
Th
e T
un
ne
y’s
Pa
stu
re c
am
pu
s h
as w
ell
ove
r 1
0,0
00
pe
op
le w
ith
on
ly a
bo
ut
10
00
p
ark
ing
sp
ots
. It
th
ere
fore
ha
s a
str
on
g
7 B
ase
d o
n p
rofe
ssio
na
l ju
dg
em
en
t a
nd
po
ten
tia
l im
pa
ct
on
ove
rall
fun
ctio
n a
nd
pe
rfo
rma
nce
of
the
bu
ildin
g.

En
gin
ee
rin
g V
uln
era
bili
ty A
sse
ssm
en
t o
f th
e M
ain
Sta
tistics C
an
ad
a B
uild
ing
to
th
e I
mp
acts
of
Clim
ate
Ch
an
ge
HO
K C
an
ad
a
1
17
:12
8
4.5
.2 R
eco
mm
en
da
tio
ns
Infr
as
tru
ctu
re C
om
po
ne
nt
/ D
ata
Ga
p
Re
me
dia
l E
ng
ine
eri
ng
A
cti
on
Ma
na
ge
me
nt
Ac
tio
ns
No
fu
rth
er
Ac
tio
n
Re
co
mm
en
da
tio
n
Pri
ori
ty
(lo
w,
me
diu
m,
hig
h)7
Co
mm
en
ts
Se
co
nd
, m
an
ag
em
en
t sh
ou
ld
en
su
re c
on
sis
ten
t le
ve
ls o
f su
ffic
ien
t b
ud
ge
t fo
r sn
ow
cle
ari
ng
.
Th
ird
, a
ll w
alk
wa
y a
nd
pa
rkin
g
su
rfa
ce
s s
ho
uld
use
ma
teri
als
th
at
will
with
sta
nd
in
cre
ase
d
fre
eze
-th
aw
cycle
s.
In a
dd
itio
n,
the
se
ma
teri
als
sh
ou
ld t
ry t
o
min
imiz
e h
ea
t g
ain
in
ord
er
to
red
uce
po
ssib
le c
oo
ling
lo
ad
s
on
th
e b
uild
ing
du
rin
g t
he
su
mm
er.
pe
de
str
ian
co
mp
on
en
t g
ive
n its
pro
xim
ity t
oth
e t
ran
sit w
ay a
nd
pa
rkin
g r
estr
ictio
ns.
He
alth
an
d s
afe
ty o
f p
ed
estr
ian
s is k
ey a
s
pre
ve
ntio
n o
f in
jury
on
ice
is v
ery
im
po
rta
nt
At
the
sa
me
tim
e t
he
fre
eze
th
aw
cycle
will
ca
se
he
avin
g a
nd
ma
teri
al d
ete
rio
ratio
n
ma
kin
g t
he
co
nd
itio
n o
f th
e w
alk
wa
ys p
ron
to t
rip
pin
g h
aza
rds.
Th
is w
ill p
ose
a
sig
nific
an
t ri
sk a
nd
co
st
to m
ain
tain
ing
th
is
infr
astr
uctu
re c
om
po
ne
nt.
H
igh
er
Te
mp
era
ture
s w
ill a
ffe
ct
wa
lkw
ays
esp
ecia
lly a
sp
ha
lt w
alk
wa
ys a
s it
will
ca
use
the
ma
teri
al to
so
fte
n t
hu
s a
ffe
ctin
g its
w
ea
r. F
or
exa
mp
le,
sh
oe
he
els
will
p
un
ctu
re in
to t
he
wa
lkw
ay a
nd
cre
ate
cre
vic
es t
ha
t in
th
e w
inte
r w
ill b
e s
ub
jecte
dto
fre
eze
th
aw
an
d c
au
se
th
e w
alk
wa
y t
o
bre
akd
ow
n f
aste
r.
6.
Exte
rio
r S
yste
ms:
a
. S
tair
s –
co
ncre
te
Re
fer
to B
CR
2
00
7 p
ag
es
56
to
58
.
No
ne
- co
ntin
ue
d m
on
ito
rin
g
thro
ug
h c
urr
en
t b
uild
ing
m
an
ag
em
en
t a
nd
bu
ildin
g
co
nd
itio
n r
ep
ort
ing
pro
ce
du
res.
L
ow
In
cre
ase
d f
ree
ze
th
aw
cycle
s w
ill c
au
se
h
ea
vin
g a
nd
ma
teri
al d
ete
rio
ratio
n m
akin
g
the
sta
irs a
n a
rea
pro
ne
to
occu
pa
nt
trip
pin
g/f
alli
ng
/in
jury
. T
his
co
uld
po
se
a
sig
nific
an
t ri
sk d
uri
ng
em
erg
en
cie
s a
nd
e
va
cu
atio
ns.
Sta
irs s
ho
uld
be
ke
pt
cle
ar
osn
ow
an
d ice
du
rin
g w
inte
r m
on
ths t
o
en
su
re d
ry c
on
ditio
ns a
nd
pre
ve
nt
ma
teri
al
de
teri
ora
tio
n.
N
ote
, b
eca
use
of
the
pu
blic
na
ture
of
this
b
uild
ing
an
d t
he
un
ion
ize
d c
ivil
se
rvic
e
occu
pa
nts
, sn
ow
cle
ari
ng
on
ste
ps is
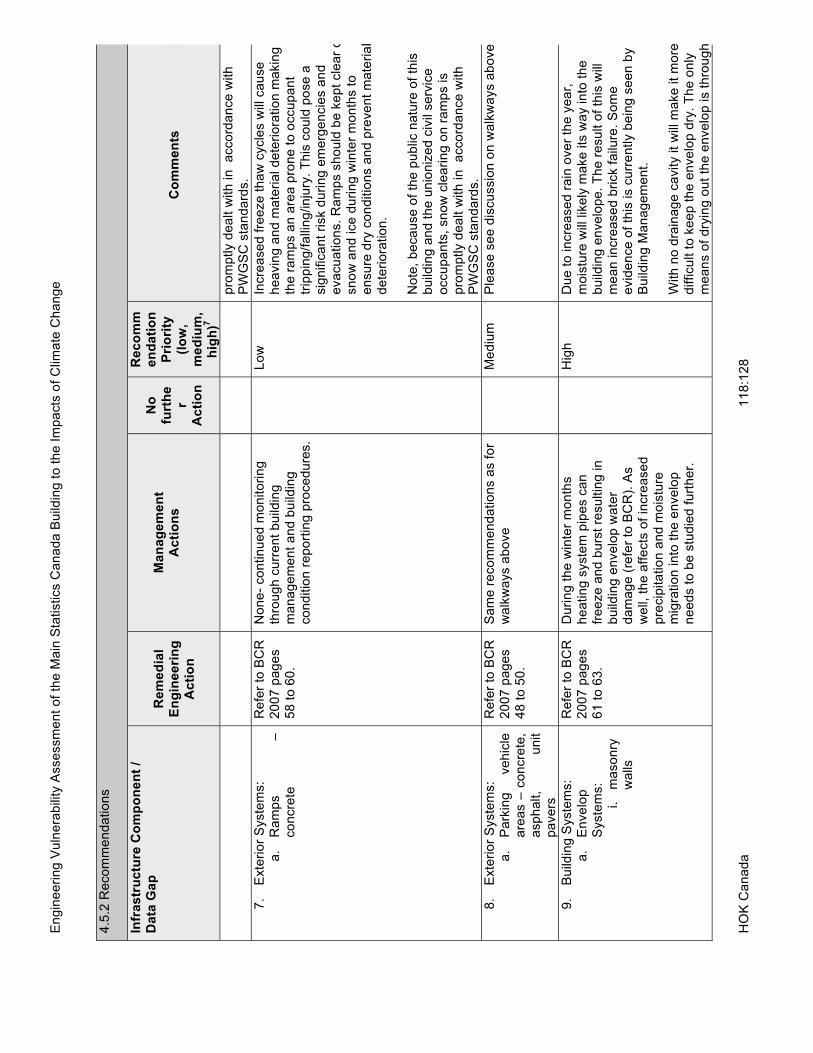
En
gin
ee
rin
g V
uln
era
bili
ty A
sse
ssm
en
t o
f th
e M
ain
Sta
tistics C
an
ad
a B
uild
ing
to
th
e I
mp
acts
of
Clim
ate
Ch
an
ge
HO
K C
an
ad
a
1
18
:12
8
4.5
.2 R
eco
mm
en
da
tio
ns
Infr
as
tru
ctu
re C
om
po
ne
nt
/ D
ata
Ga
p
Re
me
dia
l E
ng
ine
eri
ng
A
cti
on
Ma
na
ge
me
nt
Ac
tio
ns
No
fu
rth
er
Ac
tio
n
Re
co
mm
en
da
tio
n
Pri
ori
ty
(lo
w,
me
diu
m,
hig
h)7
Co
mm
en
ts
pro
mp
tly d
ea
lt w
ith
in
a
cco
rda
nce
with
P
WG
SC
sta
nd
ard
s.
7.
Exte
rio
r S
yste
ms:
a
. R
am
ps
–
co
ncre
te
Re
fer
to B
CR
2
00
7 p
ag
es
58
to
60
.
No
ne
- co
ntin
ue
d m
on
ito
rin
g
thro
ug
h c
urr
en
t b
uild
ing
m
an
ag
em
en
t a
nd
bu
ildin
g
co
nd
itio
n r
ep
ort
ing
pro
ce
du
res.
L
ow
In
cre
ase
d f
ree
ze
th
aw
cycle
s w
ill c
au
se
h
ea
vin
g a
nd
ma
teri
al d
ete
rio
ratio
n m
akin
g
the
ra
mp
s a
n a
rea
pro
ne
to
occu
pa
nt
trip
pin
g/f
alli
ng
/in
jury
. T
his
co
uld
po
se
a
sig
nific
an
t ri
sk d
uri
ng
em
erg
en
cie
s a
nd
e
va
cu
atio
ns.
Ra
mp
s s
ho
uld
be
ke
pt
cle
ar
osn
ow
an
d ice
du
rin
g w
inte
r m
on
ths t
o
en
su
re d
ry c
on
ditio
ns a
nd
pre
ve
nt
ma
teri
al
de
teri
ora
tio
n.
N
ote
, b
eca
use
of
the
pu
blic
na
ture
of
this
b
uild
ing
an
d t
he
un
ion
ize
d c
ivil
se
rvic
e
occu
pa
nts
, sn
ow
cle
ari
ng
on
ra
mp
s is
pro
mp
tly d
ea
lt w
ith
in
a
cco
rda
nce
with
P
WG
SC
sta
nd
ard
s.
8.
Exte
rio
r S
yste
ms:
a
. P
ark
ing
ve
hic
le
are
as –
co
ncre
te,
asp
ha
lt,
un
it
pa
ve
rs
Re
fer
to B
CR
2
00
7 p
ag
es
48
to
50
.
Sa
me
re
co
mm
en
da
tio
ns a
s f
or
wa
lkw
ays a
bo
ve
Me
diu
m
Ple
ase
se
e d
iscu
ssio
n o
n w
alk
wa
ys a
bo
ve
9.
Bu
ildin
g S
yste
ms:
a.
En
ve
lop
S
yste
ms:
i.
ma
so
nry
w
alls
Re
fer
to B
CR
2
00
7 p
ag
es
61
to
63
.
Du
rin
g t
he
win
ter
mo
nth
s
he
atin
g s
yste
m p
ipe
s c
an
fr
ee
ze
an
d b
urs
t re
su
ltin
g in
b
uild
ing
en
ve
lop
wa
ter
da
ma
ge
(re
fer
to B
CR
). A
s
we
ll, t
he
aff
ects
of
incre
ase
d
pre
cip
ita
tio
n a
nd
mo
istu
re
mig
ratio
n in
to t
he
en
ve
lop
n
ee
ds t
o b
e s
tud
ied
fu
rth
er.
H
igh
D
ue
to
in
cre
ase
d r
ain
ove
r th
e y
ea
r,
mo
istu
re w
ill lik
ely
ma
ke
its
wa
y in
to t
he
b
uild
ing
en
ve
lop
e.
Th
e r
esu
lt o
f th
is w
ill
me
an
in
cre
ase
d b
rick f
ailu
re.
So
me
e
vid
en
ce
of
this
is c
urr
en
tly b
ein
g s
ee
n b
y
Bu
ildin
g M
an
ag
em
en
t.
With
no
dra
ina
ge
ca
vity it
will
ma
ke
it
mo
red
ifficu
lt t
o k
ee
p t
he
en
ve
lop
dry
. T
he
on
ly
me
an
s o
f d
ryin
g o
ut
the
en
ve
lop
is t
hro
ug
h

En
gin
ee
rin
g V
uln
era
bili
ty A
sse
ssm
en
t o
f th
e M
ain
Sta
tistics C
an
ad
a B
uild
ing
to
th
e I
mp
acts
of
Clim
ate
Ch
an
ge
HO
K C
an
ad
a
1
19
:12
8
4.5
.2 R
eco
mm
en
da
tio
ns
Infr
as
tru
ctu
re C
om
po
ne
nt
/ D
ata
Ga
p
Re
me
dia
l E
ng
ine
eri
ng
A
cti
on
Ma
na
ge
me
nt
Ac
tio
ns
No
fu
rth
er
Ac
tio
n
Re
co
mm
en
da
tio
n
Pri
ori
ty
(lo
w,
me
diu
m,
hig
h)7
Co
mm
en
ts
Th
e o
ptim
um
bu
ildin
g e
nve
lop
te
ch
no
log
y n
ee
ds t
o b
e
rese
arc
he
d a
nd
ap
plie
d t
o t
he
b
uild
ing
. T
he
bu
ildin
g’s
H
eri
tag
e s
tatu
s w
ill a
lso
ne
ed
to
be
co
nsid
ere
d in
th
is s
tud
y.
Wh
at
eve
r th
e c
orr
ective
m
ea
su
re d
ecid
ed
, it w
ill r
eq
uir
e
so
me
a
lte
ratio
ns t
o t
he
h
ea
tin
g,
co
olin
g a
nd
ve
ntila
tio
n
syste
ms t
o e
nsu
re o
ptim
um
b
uild
ing
pe
rfo
rma
nce
in
lin
e
with
cu
rre
nt
bu
ildin
g s
cie
nce
a
nd
co
de
s.
bu
ildin
g h
ea
t m
igra
tin
g o
utw
ard
an
d s
ola
r ra
dia
tio
n t
hro
ug
ho
ut
the
ye
ar.
In
th
e w
inte
mo
nth
s a
ny m
ois
ture
with
in t
he
en
ve
lop
e
will
be
su
bje
cte
d t
o f
ree
ze
th
aw
cycle
s
the
refo
re a
ffe
ctin
g t
he
str
uctu
ral in
teg
rity
of
the
bu
ildin
g e
nve
lop
ma
teri
als
. H
igh
er
hu
mid
ity le
ve
ls in
th
e s
um
me
r m
on
ths m
ay
ha
ve
th
e s
am
e e
ffe
ct
in t
ha
t m
ois
ture
will
m
igra
te in
to t
he
en
ve
lop
th
at
ca
n c
au
se
d
am
ag
e.
A
ny f
utu
re a
lte
ratio
ns
to
th
e b
uild
ing
e
nve
lop
will
re
qu
ire
se
rio
us c
on
sid
era
tio
n
be
fore
an
y a
ctio
n is t
ake
n a
s it
ca
n
sig
nific
an
tly a
lte
r th
e p
erf
orm
an
ce
an
d
ne
ga
tive
ly im
pa
ct
the
syste
m.
In a
dd
itio
n,
su
ch
ch
an
ge
s m
ay h
ave
sig
nific
an
t a
ffe
cts
o
n h
ea
tin
g,
co
olin
g a
nd
ve
ntila
tio
n lo
ad
s
req
uir
em
en
ts f
or
the
bu
ildin
g.
10
. B
uild
ing
Syste
ms:
a.
En
ve
lop
S
yste
ms:
i.
sto
ne
p
an
els
(i
nclu
din
g
he
ad
ers
a
nd
sill
s)
Re
fer
to B
CR
2
00
7 p
ag
es
64
to
66
.
Se
e d
iscu
ssio
n a
bo
ve
fo
r m
aso
nry
wa
lls
H
igh
S
ee
dis
cu
ssio
n a
bo
ve
fo
r m
aso
nry
wa
lls
11
. M
ech
an
ica
l S
yste
ms:
a.
Co
olin
g
Syste
m
Re
fer
to B
CR
2
00
7 p
ag
es
De
taile
d e
ng
ine
eri
ng
e
va
lua
tio
n n
ee
ds t
o b
e
H
igh
C
lima
te c
ha
ng
e im
pa
cts
th
e c
ap
ab
ility
of
the
co
olin
g s
yste
m t
o m
ee
t lo
ad
s f
or
the

En
gin
ee
rin
g V
uln
era
bili
ty A
sse
ssm
en
t o
f th
e M
ain
Sta
tistics C
an
ad
a B
uild
ing
to
th
e I
mp
acts
of
Clim
ate
Ch
an
ge
HO
K C
an
ad
a
1
20
:12
8
4.5
.2 R
eco
mm
en
da
tio
ns
Infr
as
tru
ctu
re C
om
po
ne
nt
/ D
ata
Ga
p
Re
me
dia
l E
ng
ine
eri
ng
A
cti
on
Ma
na
ge
me
nt
Ac
tio
ns
No
fu
rth
er
Ac
tio
n
Re
co
mm
en
da
tio
n
Pri
ori
ty
(lo
w,
me
diu
m,
hig
h)7
Co
mm
en
ts
an
d A
de
qu
acy
13
9 t
o 1
49
. co
nd
ucte
d o
n t
he
an
ticip
ate
d
loa
ds r
ela
tive
to
he
atin
g,
co
olin
g a
nd
th
e v
en
tila
tio
n
syste
m.
Th
is s
tud
y s
ho
uld
e
va
lua
te t
he
su
ita
bili
ty o
f
va
rio
us a
da
ptive
m
ea
su
res/t
ech
no
log
ies s
uch
a
s e
xte
rio
r sh
ad
ing
de
vic
es,
pa
ssiv
e c
oo
ling
te
ch
niq
ue
s,
etc
..
In a
dd
itio
n,
a c
lima
te c
ha
ng
e
vu
lne
rab
ility
asse
ssm
en
t sh
ou
ld b
e c
on
du
cte
d o
n t
he
C
en
tra
l H
ea
tin
g a
nd
Co
olin
g
Pla
nt
tha
t m
od
els
an
d
co
nsid
ers
: a
) th
e v
ari
ou
s
tech
no
log
y o
ptio
ns/a
da
ptive
m
ea
su
res f
or
the
bu
ildin
gs o
n
the
Ca
mp
us;
b)
pre
dic
ted
lo
ad
s a
nd
ca
pa
citie
s;
c)
the
fu
ture
Ma
ste
r P
lan
fo
r th
e
Ca
mp
us;
an
d d
) va
rio
us
tech
no
log
ies/a
da
ptive
m
ea
su
res f
or
the
CH
CP
its
elf
su
ch
as c
o-g
en
era
tio
n a
nd
g
eo
the
rma
l h
ea
tin
g a
nd
co
olin
g.
Tu
nn
ey’s
Pa
stu
re f
acili
tie
s in
tw
o w
ays:
1.
Ou
tdo
or
tem
pe
ratu
re a
nd
hu
mid
ity
incre
ase
s lo
ad
th
rou
gh
hig
he
r se
nsib
le a
nd
late
nt
co
olin
g o
f m
ake
-up
air
su
pp
ly a
nd
in
filtra
tio
n a
s w
ell
as in
cre
ase
s in
en
ve
lop
eco
nd
uctio
n g
ain
s.
As t
he
re
lative
hu
mid
ity
pro
jectio
ns a
re r
ela
tive
ly c
on
sta
nt,
th
e
pro
jecte
d r
ise
s in
te
mp
era
ture
re
su
lt in
in
cre
ase
s o
f m
ake
-air
an
d in
filtra
tio
n lo
ad
s
at
a r
ate
of
ab
ou
t 5
kJ/m
3 o
r 5
W/l/s
, m
ostly
late
nt.
Assu
min
g a
co
mb
ine
d a
ir c
ha
ng
e
rate
of
1 A
CH
, th
e lo
ad
in
cre
ase
ca
n b
e
estim
ate
d t
hu
s:
bu
ildin
g f
loo
r a
rea
(m
2)
x
tem
pe
ratu
re r
ise
(0
K)
x 5
(W
) =
ad
ditio
na
l co
olin
g lo
ad
(W
).
Bu
ildin
g e
nve
lop
e g
ain
s a
re s
ma
ller
an
d
req
uir
e e
nve
lop
e a
rea
s a
nd
U-v
alu
es.
Th
e
co
olin
g c
oils
an
d a
ir d
istr
ibu
tio
n m
ay b
e
insu
ffic
ien
t to
ma
inta
in a
cce
pta
ble
co
nd
itio
ns.
2.
Th
e c
en
tra
l ch
illin
g p
lan
t d
ep
en
ds
on
su
ffic
ien
tly c
oo
l w
ate
r a
nd
pu
mp
ing
ra
tefr
om
th
e O
tta
wa
Riv
er
to m
ain
tain
ca
pa
city
an
d p
ossib
ly o
pe
ratio
n.
A c
om
bin
ed
eff
ect
of
low
er
su
mm
er
rain
fall
an
d h
igh
er
am
bie
nte
mp
era
ture
s w
ill r
ais
e t
em
pe
ratu
res a
nd
lo
we
r flo
w r
ate
s o
f th
e O
tta
wa
Riv
er.
In
cre
ase
d u
sa
ge
fo
r h
ea
t re
jectio
n a
nd
u
rba
niz
atio
n u
pstr
ea
m w
ill h
ave
sim
ilar

En
gin
ee
rin
g V
uln
era
bili
ty A
sse
ssm
en
t o
f th
e M
ain
Sta
tistics C
an
ad
a B
uild
ing
to
th
e I
mp
acts
of
Clim
ate
Ch
an
ge
HO
K C
an
ad
a
1
21
:12
8
4.5
.2 R
eco
mm
en
da
tio
ns
Infr
as
tru
ctu
re C
om
po
ne
nt
/ D
ata
Ga
p
Re
me
dia
l E
ng
ine
eri
ng
A
cti
on
Ma
na
ge
me
nt
Ac
tio
ns
No
fu
rth
er
Ac
tio
n
Re
co
mm
en
da
tio
n
Pri
ori
ty
(lo
w,
me
diu
m,
hig
h)7
Co
mm
en
ts
eff
ects
. A
lth
ou
gh
cu
rre
nt
ca
pa
city e
xce
ed
s
de
ma
nd
by a
50
% m
arg
in c
urr
en
tly,
the
co
mb
ina
tio
n o
f lo
we
r ca
pa
city d
ue
to
co
nd
en
se
r te
mp
era
ture
ris
e a
nd
hig
he
r lo
ad
s m
ay r
ed
uce
th
e m
arg
in t
o c
ritica
l. T
ho
lde
r ste
am
tu
rbin
es w
ill b
e c
alle
d in
to
du
tm
ore
fre
qu
en
tly a
nd
sh
ort
en
th
eir
se
rvic
ea
ble
life
.
Co
mp
on
en
ts w
ith
Vu
lne
rab
ilit
y
Pri
ori
ty v
alu
es
> 1
2 <
35
•
Exte
rio
r S
yste
ms:
a
. T
un
ne
ls
ma
nh
ole
s/a
cce
ss
do
ors
Re
fer
to B
CR
2
00
7 p
ag
e
33
.
Stu
die
s s
ho
uld
be
co
nd
ucte
d
tha
t a
re s
imila
r a
s t
ho
se
d
iscu
sse
d a
bo
ve
un
de
r S
ite
D
rain
s –
sto
rm a
nd
ra
in w
ate
r,
ab
ove
.
M
ed
ium
B
ase
d o
n in
pu
t fr
om
SN
C P
roF
ac w
ate
r p
en
etr
atio
n in
to t
he
Tu
nn
el S
yste
m h
as n
ob
ee
n a
se
rio
us p
rob
lem
. D
rain
ag
e s
yste
ms
exis
t w
ith
in t
he
tu
nn
el th
at
ap
pe
ars
to
be
su
ffic
ien
t sh
ou
ld t
his
occu
r. G
ive
n t
ha
t p
recip
ita
tio
n is o
n t
he
in
cre
ase
, th
is s
yste
mm
ay b
e a
t a
hig
he
r ri
sk a
nd
th
ere
fore
re
qu
ire
s a
mo
re d
eta
iled
an
aly
sis
.
•
Bu
ildin
g S
yste
ms:
a.
Fla
t R
oo
f S
yste
ms
(in
clu
din
g
roo
f d
rain
s)
Re
fer
to B
CR
2
00
7 p
ag
es
78
to
80
.
Co
nd
uct
a r
ese
arc
h s
tud
y t
o
de
term
ine
op
tim
um
fla
t ro
of
tech
no
log
y,
de
sig
n o
ptio
ns,
mitig
atio
n s
tra
teg
ies a
nd
p
ote
ntia
l e
ffe
cts
of
fre
eze
th
aw
a
nd
ice
bu
ild-u
p.
S
uch
a s
tud
y s
ho
uld
in
ve
stig
ate
cu
rre
nt
be
st
M
ed
ium
D
ue
to
in
cre
ase
d f
ree
ze
th
aw
an
d r
ain
ove
the
win
ter
mo
nth
s it
ca
n b
e e
xp
ecte
d t
ha
t th
ere
will
be
mo
re ice
bu
ild-u
p o
n r
oo
fs.
Th
is w
ill p
ose
a s
ign
ific
an
t ri
sk a
nd
co
st
to
ma
inta
inin
g t
his
in
fra
str
uctu
re c
om
po
ne
nt
giv
en
th
at
fre
eze
th
aw
ma
y r
esu
lt in
d
am
ag
ing
th
e r
oo
f syste
m.
De
pe
nd
ing
on
th
e t
yp
e o
f ro
of
syste
m t
he
eff
ect
will
va
ry.

En
gin
ee
rin
g V
uln
era
bili
ty A
sse
ssm
en
t o
f th
e M
ain
Sta
tistics C
an
ad
a B
uild
ing
to
th
e I
mp
acts
of
Clim
ate
Ch
an
ge
HO
K C
an
ad
a
1
22
:12
8
4.5
.2 R
eco
mm
en
da
tio
ns
Infr
as
tru
ctu
re C
om
po
ne
nt
/ D
ata
Ga
p
Re
me
dia
l E
ng
ine
eri
ng
A
cti
on
Ma
na
ge
me
nt
Ac
tio
ns
No
fu
rth
er
Ac
tio
n
Re
co
mm
en
da
tio
n
Pri
ori
ty
(lo
w,
me
diu
m,
hig
h)7
Co
mm
en
ts
pra
ctice
s in
clim
ate
s t
ha
t a
re
cu
rre
ntly s
imila
r to
th
e
pre
dic
ted
clim
ate
ch
an
ge
fo
r th
e O
tta
wa
Re
gio
n (
i.e
. w
arm
er,
mo
re f
ree
ze
th
aw
).
Wh
en
th
e r
oo
f syste
m b
rea
ks d
ow
n w
ate
r in
filtra
tio
n c
an
re
su
lt a
nd
cre
ate
da
ma
ge
to
oth
er
syste
ms b
elo
w t
he
ro
of
me
mb
ran
e.
H
igh
er
Te
mp
era
ture
s w
ill a
lso
aff
ect
roo
fin
gm
ate
ria
ls a
s it
will
ca
se
th
e m
ate
ria
l to
b
rea
k d
ow
n a
t fa
ste
r ra
tes d
ue
to
te
mp
era
ture
an
d U
V.
•
Ele
ctr
ica
l S
yste
ms:
a.
Po
we
r S
up
ply
a
nd
Re
liab
ility
Re
fer
to B
CR
2
00
7 p
ag
es
16
7 t
o 1
89
.
Re
se
arc
h s
tud
y s
ho
uld
be
co
nd
ucte
d t
og
eth
er
with
th
e
loca
l u
tilit
y (
e.g
. H
yd
ro O
tta
wa
) o
n t
he
cu
mu
lative
eff
ects
(c
on
su
mp
tio
n,
loa
ds,
pe
aks,
de
ma
nd
, e
tc.)
on
ele
ctr
icity
loa
ds d
uri
ng
sp
rin
g,
su
mm
er
an
d f
all.
Th
e s
tud
y s
ho
uld
als
o
inclu
de
th
e o
the
r b
uild
ing
s a
t th
e T
un
ne
y’s
Pa
stu
re C
am
pu
s
an
d f
acto
r in
th
e p
ossib
le
ch
an
ge
s t
o b
uild
ing
en
ve
lop
s
an
d p
ote
ntia
l co
-ge
ne
ratio
n
ca
pa
bili
tie
s a
t th
e C
HC
P.
M
ed
ium
P
ow
er
su
pp
ly a
nd
re
liab
ility
is c
ritica
l to
S
tats
Ca
na
da
’s o
pe
ratio
ns.
Po
we
r o
uta
ge
sca
n d
eh
ab
ilita
te o
pe
ratio
ns a
nd
aff
ect
clo
su
res a
s h
as b
ee
n s
ee
n in
th
e p
ast
esp
ecia
lly o
ve
r th
e s
um
me
r m
on
ths.
Du
rin
gth
e s
um
me
r, t
he
clim
ate
is e
xp
ecte
d t
o g
et
ho
tte
r a
nd
mo
re h
um
id a
nd
as a
re
su
lt
citiz
en
s o
f O
tta
wa
will
re
ly m
ore
on
air
co
nd
itio
nin
g.
Th
is in
cre
ase
in
lo
ad
th
rou
gh
ou
t O
tta
wa
will
po
se
a s
tra
in o
n t
he
en
erg
y g
rid
an
d a
ffe
ct
po
we
r re
liab
ility
th
rou
gh
ou
t th
e c
ity.
Po
we
r re
liab
ility
is
be
yo
nd
th
e c
on
tro
l o
f T
un
ne
y’s
Pa
stu
re a
s
it is a
so
urc
e o
f e
ne
rgy p
rovid
ed
by t
he
u
tilit
y a
t a
city w
ide
le
ve
l.
Th
e p
rim
ary
me
an
s o
f se
cu
rin
g p
ow
er
relia
bili
ty is t
o b
e s
elf s
uff
icie
nt.
Th
is w
ill
req
uir
e r
ed
uctio
n in
po
we
r u
sa
ge
an
d a
n
ab
ility
to
ge
ne
rate
on
site
po
we
r in
wh
ole
or
in p
art
fo
r S
tats
Ca
na
da
’s u
se
. M
ore
re
se
arc
h is r
eq
uir
ed
to
eva
lua
te o
ptio
ns.

En
gin
ee
rin
g V
uln
era
bili
ty A
sse
ssm
en
t o
f th
e M
ain
Sta
tistics C
an
ad
a B
uild
ing
to
th
e I
mp
acts
of
Clim
ate
Ch
an
ge
HO
K C
an
ad
a
1
23
:12
8
4.5
.2 R
eco
mm
en
da
tio
ns
Infr
as
tru
ctu
re C
om
po
ne
nt
/ D
ata
Ga
p
Re
me
dia
l E
ng
ine
eri
ng
A
cti
on
Ma
na
ge
me
nt
Ac
tio
ns
No
fu
rth
er
Ac
tio
n
Re
co
mm
en
da
tio
n
Pri
ori
ty
(lo
w,
me
diu
m,
hig
h)7
Co
mm
en
ts
Da
ta G
ap
s (
fro
m p
rev
iou
s
wo
rks
he
ets
)
Ba
se
line
(h
isto
rica
l) f
loo
d p
lain
d
ata
an
d g
rou
nd
wa
ter/
wa
ter
tab
le w
ere
no
t a
va
ilab
le a
t th
e
tim
e o
f th
e c
ase
stu
dy.
R
eco
mm
en
d u
sin
g t
he
stu
dy
dis
cu
sse
d u
nd
er
Site
dra
ins t
o
esta
blis
h b
ase
line
da
ta.
M
ed
ium
Fu
ture
pro
jecte
d f
loo
d p
lain
an
d
gro
un
d w
ate
r/w
ate
r ta
ble
in
form
atio
n w
as n
ot
ava
ilab
le a
t th
e t
ime
of
the
ca
se
stu
dy.
R
eco
mm
en
d P
WG
SC
in
itia
te
or
invo
lve
th
em
se
lve
s in
stu
die
s o
n t
he
clim
ate
ch
an
ge
e
ffe
cts
on
th
e O
tta
wa
Riv
er,
w
ate
rsh
ed
an
d f
loo
d p
lain
.
H
igh
Fu
rth
er
info
rma
tio
n a
nd
mo
de
llin
g
ne
ed
s t
o b
e d
on
e t
o p
red
ict
ch
an
ge
s in
extr
em
e w
ea
the
r e
ve
nts
in
th
e r
eg
ion
. If
it
is
ge
ne
rally
acce
pte
d t
ha
t th
ere
will
b
e in
cre
ase
s in
extr
em
e w
ea
the
r e
ve
nts
, cu
rre
nt
bu
ildin
g c
od
es
tha
t a
pp
ly s
ho
uld
be
re
vie
we
d t
o
de
term
ine
if
the
y a
re s
uff
icie
nt.
C
on
tin
ue
mo
nito
rin
g b
est
pra
ctice
s a
nd
sta
te o
f th
e a
rt in
clim
ate
ch
an
ge
fu
ture
sce
na
rio
m
od
elin
g a
nd
re
se
arc
h in
to
futu
re c
lima
te r
ela
ted
ch
an
ge
s
in e
xtr
em
e w
ea
the
r e
ve
nts
in
th
e r
eg
ion
.
L
ow
Po
ssib
le c
ha
ng
es in
so
il co
nd
itio
ns a
nd
wa
ter
tab
les a
re
cu
rre
nt
da
ta g
ap
s –
th
is r
ela
tes t
o
the
ab
ility
fo
r th
e s
ite
to
dra
in r
ain
a
nd
sto
rm w
ate
r a
nd
hyd
rosta
tic
pre
ssu
res a
ga
inst
foo
tin
gs,
fou
nd
atio
n w
alls
, sla
b o
n g
rad
e
an
d r
eta
inin
g w
alls
.
R
eco
mm
en
d u
sin
g t
he
stu
dy
dis
cu
sse
d u
nd
er
Site
Dra
ins t
o
un
de
rsta
nd
eff
ects
on
fo
otin
gs,
fou
nd
atio
n w
alls
, sla
b o
n
gra
de
, re
tain
ing
wa
lls,
etc
.
M
ed
ium
Win
d d
rive
n r
ain
in
de
x/f
acto
r is
a
cu
rre
nt
da
ta g
ap
th
at
rela
tes t
o
the
bu
ildin
g e
nve
lop
’s a
bili
ty t
o
D
eve
lop
an
d p
rese
nt
a
co
mb
ina
tio
n w
ind
/ra
in in
de
x in
fu
ture
clim
ate
ch
an
ge
M
ed
ium

En
gin
ee
rin
g V
uln
era
bili
ty A
sse
ssm
en
t o
f th
e M
ain
Sta
tistics C
an
ad
a B
uild
ing
to
th
e I
mp
acts
of
Clim
ate
Ch
an
ge
HO
K C
an
ad
a
1
24
:12
8
4.5
.2 R
eco
mm
en
da
tio
ns
Infr
as
tru
ctu
re C
om
po
ne
nt
/ D
ata
Ga
p
Re
me
dia
l E
ng
ine
eri
ng
A
cti
on
Ma
na
ge
me
nt
Ac
tio
ns
No
fu
rth
er
Ac
tio
n
Re
co
mm
en
da
tio
n
Pri
ori
ty
(lo
w,
me
diu
m,
hig
h)7
Co
mm
en
ts
sh
ed
an
d r
ed
ire
ct
rain
an
d s
no
w.
sce
na
rio
s f
or
bu
ildin
gs.
Ch
an
ge
s in
riv
er
wa
ter
tem
pe
ratu
re is a
da
ta g
ap
th
at
will
a
ffe
ct
the
co
olin
g c
ap
acity a
t fa
cili
tie
s t
ha
t re
ly o
n t
his
me
tho
d.
U
se
da
ta a
nd
in
form
atio
n
ga
the
red
un
de
r th
e s
tud
ies
reco
mm
en
de
d a
bo
ve
fo
r C
oo
ling
Syste
m a
nd
Ad
eq
ua
cy
M
ed
ium
4.5
.2.f
R
ep
ort
on
th
e o
ther
co
nclu
sio
ns, tr
en
ds, in
sig
hts
an
d lim
itati
on
s
Th
e f
ollo
win
g r
eco
mm
en
da
tio
ns h
ave
be
en
dra
wn
re
ga
rdin
g t
he
use
of
clim
ate
ch
an
ge
mo
de
ls a
nd
sce
na
rio
s in
th
e v
uln
era
bili
ty
asse
ssm
en
t o
f b
uild
ing
s.
Th
e c
lima
te c
ha
ng
e s
ce
na
rio
s a
nd
in
dic
es s
ho
uld
be
im
pro
ve
d a
s f
ollo
ws:
•
Th
e s
ce
na
rio
s s
ho
uld
pre
se
nt
(in
ad
ditio
n t
o s
pe
cific
in
dic
es)
a la
yp
ers
on
’s in
dic
atio
n o
f w
ha
t clim
ate
wo
uld
be
lik
e in
10
, 2
0,
50
ye
ar
tim
e h
ori
zo
n,
e.g
. in
20
50
Ott
aw
a’s
clim
ate
will
be
ro
ug
hly
sim
ilar
to P
hila
de
lph
ia.
Th
is w
ou
ld a
llow
re
se
arc
h a
nd
co
mp
ari
so
n
of
bu
ildin
g c
od
es a
nd
be
st
de
sig
n p
ractice
s in
th
ose
re
gio
ns t
o in
form
ch
an
ge
s t
ha
t n
ee
d t
o o
ccu
r in
th
e lo
ca
l re
gio
n b
ein
g s
tud
ied
.
•
Th
e t
erm
ino
log
y a
nd
pa
ram
ete
rs u
se
d in
th
e c
lima
te c
ha
ng
e in
dic
es a
nd
sce
na
rio
s s
ho
uld
be
alig
ne
d w
ith
Na
tio
na
l B
uild
ing
Co
de
, C
SA
an
d A
SH
RA
E s
tan
da
rd t
erm
ino
log
ies.
If la
rge
r n
um
be
rs o
f b
uild
ing
asse
ssm
en
ts a
re c
on
du
cte
d,
PIE
VC
, P
WG
SC
an
d
En
vir
on
me
nt
Ca
na
da
sh
ou
ld e
xp
lore
po
ssib
le c
olla
bo
ratio
n b
etw
ee
n C
SA
, A
SH
RA
E a
nd
Sce
na
rio
Mo
de
llers
to
alig
n t
erm
ino
log
y
use
d in
th
e P
IEV
C P
roto
co
l a
nd
th
e s
tan
da
rds u
se
d in
th
e in
du
str
y.
•
Ad
ditio
na
l clim
ate
pa
ram
ete
rs o
r in
dic
es w
ou
ld a
id t
he
asse
ssm
en
t p
roce
ss t
ha
t a
re a
lign
ed
with
AS
HR
AE
to
ols
an
d s
tan
da
rds,
su
ch
as:
o
De
w p
oin
t fr
eq
ue
ncy d
ist.
o
E
nth
alp
y f
req
. d
ist
o
Win
d s
pe
ed
fre
q.
dis
t o
D
ry/w
et
bu
lb-w
ind
jo
int
pa
ram
ete
r o
H
um
idity-t
em
p jo
int
pa
ram
ete
r o
E
leva
tio
n/t
op
og
rap
hy d
ata
wo
uld
be
im
po
rta
nt
for
bu
ildin
gs c
lose
r to
riv
ers
, str
ea
ms,
lake
s e
tc.
T
he
pro
ject
tea
m r
eco
gn
ize
s t
ha
t th
e M
ain
Sta
tistics C
an
ad
a B
uild
ing
ha
s H
eri
tag
e d
esig
na
tio
n.
Th
is w
ill a
nd
sh
ou
ld b
e s
tro
ng
ly
co
nsid
ere
d w
he
n p
ossib
le e
ng
ine
eri
ng
so
lutio
ns a
re e
va
lua
ted
an
d c
on
sid
ere
d.
Mitig
atio
n a
nd
ad
ap
tatio
n t
ech
niq
ue
s w
ill n
ee
d t
o f
acto
r in

En
gin
ee
rin
g V
uln
era
bili
ty A
sse
ssm
en
t o
f th
e M
ain
Sta
tistics C
an
ad
a B
uild
ing
to
th
e I
mp
acts
of
Clim
ate
Ch
an
ge
HO
K C
an
ad
a
1
25
:12
8
this
de
sig
na
tio
n.
Th
is m
ay b
e p
art
icu
larl
y im
po
rta
nt
for
ch
an
ge
s r
eq
uir
ed
in
th
e b
uild
ing
en
ve
lop
th
at
ma
y o
r m
ay n
ot
aff
ect
the
bu
ildin
g’s
fa
ça
de
, p
rofile
s a
nd
ae
sth
etics.
T
o s
um
ma
rize
, o
f h
igh
est
pri
ori
ty a
re:
•
the
wa
lkw
ays,
pa
rkin
g a
rea
s,
sta
irs a
nd
ra
mp
s b
eca
use
of
po
ten
tia
l ri
sk t
o h
um
an
he
alth
, sa
fety
, in
jury
, fa
llin
g e
tc.
•
the
bu
ildin
g e
nve
lop
be
ca
use
of
acce
lera
ted
de
teri
ora
tio
n t
ha
t w
ill a
ffe
ct
the
str
uctu
ral in
teg
rity
of
the
bu
ildin
g
•
the
ad
eq
ua
cy o
f th
e c
oo
ling
syste
m b
eca
use
is p
ose
s s
ign
ific
an
t co
sts
to
PW
GS
C a
nd
dir
ectly a
ffe
cts
occu
pa
nt
co
mfo
rt,
he
alth
a
nd
sa
fety
, a
nd
pro
du
ctivity
•
Po
we
r su
pp
ly a
nd
re
liab
ility
is a
lso
in
qu
estio
n s
uch
th
at
it w
ill s
ign
ific
an
tly a
ffe
ct
the
op
era
tio
ns.
Actio
n o
n t
he
se
th
ree
are
as a
s p
er
the
dis
cu
sse
d r
eco
mm
en
da
tio
ns s
ho
uld
be
in
itia
ted
with
in t
he
ne
xt
6-1
8 m
on
th t
ime
fra
me
Da
te:
Ma
y 9
, 2
00
8
Pre
pa
red
by
:
Vin
ce
Ca
talli

Engineering Vulnerability Assessment of the Main Statistics Canada Building to the Impacts of Climate Change
HOK Canada 126:128
Vulnerability Assessment Matrix – Jean Talon Building

Engineering Vulnerability Assessment of the Main Statistics Canada Building to the Impacts of Climate Change
HOK Canada 127:128
Vulnerability Assessment Matrix – Brooke Claxton Building