climate data record (cdr) program - ncei offers acces...climate data record (cdr) program . climate...
TRANSCRIPT
Climate Data Record (CDR) Program
Climate Algorithm Theoretical Basis Document (C-ATBD)
The Development of Advanced Microwave Sounding Unit-A (AMSU-A), AMSU-B and Microwave Humidity Sounder (MHS)
Thematic Climate Data Records (TCDR) for Hydrological Products
C-ATBD: Hydrological Properties
CDR Program Document Number: CDRP-ATBD-0804 Configuration Item Number: 01B-38c Revision 1 / May 5, 2016

CDR Program AMSU-A/B/MHS TCDR for Hydrological Applications C-ATBD CDRP-ATBD-0804 Rev. 1 05/05/16
A controlled copy of this document is maintained in the CDR Program Library. Approved for public release, distribution is unlimited.
2
REVISION HISTORY
Rev. Author DSR No. Description Date
1 Ralph Ferraro, NOAA/NESDIS/STAR Wenze Yang, Isaac Moradi, James Beauchamp UMD/ESSIC/CICS
DSR-1006
Initial Submission to CDR Program 05/05/16

CDR Program AMSU-A/B/MHS TCDR for Hydrological Applications C-ATBD CDRP-ATBD-0804 Rev. 1 05/05/16
A controlled copy of this document is maintained in the CDR Program Library. Approved for public release, distribution is unlimited.
3
TABLE of CONTENTS
1. INTRODUCTION .............................................................................................................................. 6 1.1 Purpose ..................................................................................................................................................... 6 1.2 Definitions................................................................................................................................................. 6 1.3 Document Maintenance ............................................................................................................................ 7
2. OBSERVING SYSTEMS OVERVIEW ............................................................................................ 8 2.1 Products Generated .................................................................................................................................. 9 2.2 Instrument Characteristics ........................................................................................................................ 9
3. ALGORITHM DESCRIPTION ...................................................................................................... 11 3.1 Algorithm Overview ................................................................................................................................ 11 3.2 Processing Outline................................................................................................................................... 11
3.2.1 Reading Input for AMSU-A ..................................................................................................................... 11 3.2.2 Generating AMSU-A Products................................................................................................................ 11 3.2.3 Writing AMSU-A Output ........................................................................................................................ 14 3.2.4 Reading Input for AMSU-B/MHS ............................................................................................................ 14 3.2.5 Generating AMSU-B/MHS Products ...................................................................................................... 14 3.2.6 Writing AMSU-B/MHS Output ............................................................................................................... 15
3.3 Algorithm Input ....................................................................................................................................... 15 3.3.1 Primary Sensor Data .............................................................................................................................. 15 3.3.2 Ancillary Data ......................................................................................................................................... 16 3.3.3 Derived Data .......................................................................................................................................... 16 3.3.4 Forward Models ..................................................................................................................................... 16
3.4 Theoretical Description ........................................................................................................................... 16 3.4.1 Physical and Mathematical Description for AMSU-A Products ............................................................. 16 3.4.2 Physical and Mathematical Description for AMSU-B/MHS Products .................................................... 20 3.4.3 Data Merging Strategy ........................................................................................................................... 24 3.4.4 Numerical Strategy ................................................................................................................................ 25 3.4.5 Calculations ............................................................................................................................................ 26 3.4.6 Look-Up Tables ...................................................................................................................................... 26 3.4.7 Parameterization ................................................................................................................................... 26 3.4.8 Algorithm Output ................................................................................................................................... 27
4. TEST DATASETS AND OUTPUTS ............................................................................................. 28 4.1 Test Input Datasets ................................................................................................................................. 28 4.2 Test Output Analysis ............................................................................................................................... 28
4.2.1 Reproducibility ....................................................................................................................................... 28 4.2.2 Precision and Accuracy .......................................................................................................................... 28 4.2.3 Error Budget ........................................................................................................................................... 29
5. PRACTICAL CONSIDERATIONS ................................................................................................ 30 5.1 Numerical Computation Considerations .................................................................................................. 30

CDR Program AMSU-A/B/MHS TCDR for Hydrological Applications C-ATBD CDRP-ATBD-0804 Rev. 1 05/05/16
A controlled copy of this document is maintained in the CDR Program Library. Approved for public release, distribution is unlimited.
4
5.2 Programming and Procedural Considerations ......................................................................................... 30 5.3 Quality Assessment and Diagnostics ....................................................................................................... 30 5.4 Exception Handling ................................................................................................................................. 30
5.4.1 Conditions Checked ............................................................................................................................... 30 5.4.2 Conditions Not Checked ........................................................................................................................ 31 5.4.3 Conditions Not Considered Exceptions .................................................................................................. 31
5.5 Algorithm Validation ............................................................................................................................... 31 5.6 Processing Environment and Resources .................................................................................................. 32
6. ASSUMPTIONS AND LIMITATIONS ........................................................................................ 33 6.1 Algorithm Performance ........................................................................................................................... 33 6.2 GFS Data.................................................................................................................................................. 33
7. FUTURE ENHANCEMENTS......................................................................................................... 34 7.1 Enhancement 1 – Extension of TCDR Record ........................................................................................... 34 7.2 Enhancement 3 – L3 products ................................................................................................................. 34 7.3 Enhancement 4 – Implementation of MiRS ............................................................................................. 34
8. REFERENCES .................................................................................................................................. 35
APPENDIX A. ACRONYMS AND ABBREVIATIONS ................................................................... 36
APPENDIX B. AMSU-A/B/MHS SENSOR DETAILS .................................................................. 38
APPENDIX C. SAMPLE AMSU-A TCDR FILE FORMAT ............................................................ 41
APPENDIX D. SAMPLE AMSU-B/MHS TCDR FILE FORMAT................................................. 44

CDR Program AMSU-A/B/MHS TCDR for Hydrological Applications C-ATBD CDRP-ATBD-0804 Rev. 1 05/05/16
A controlled copy of this document is maintained in the CDR Program Library. Approved for public release, distribution is unlimited.
5
LIST of FIGURES
Figure 1: Equatorial crossing times (LST) for NOAA-15 through NOAA-19, as well as MetOp-A (20) and MetOp-B (21). ................................................................................................................................................................ ... 8
Figure 2: AMSU-A/B scan geometry. Image courtesy of the COMET program. ........................................... 10
Figure 3: AMSU-A FCDR processing flow chart ......................................................................................................... 12
Figure 4: AMSU-B/MHS FCDR processing flow chart ............................................................................................. 13
Figure 5: Hydrological Properties TCDR processing flow chart ........................................................................ 14
Figure 6: Retrieved tropical ocean products comparison. Left panels display the products produced by MSPPS from original 1b, while right panels are TCDR after inter-satellite calibration. Time series of total precipitable water (TPW) is shown in (a) and (b), the difference versus N15 is shown in (e) and (f); time series of cloud liquid water (CLW) is shown in (c) and (d), the difference versus N15 is shown in (g) and (h). ............................................................................................................................................................ 25
Figure 7: Retrieved tropical land products comparison. Left panels display the products produced by MSPPS from original 1b, while right panels are TCDR after inter-satellite calibration. Time series of land surface temperature (Ts) is shown in (a) and (b), the difference versus N15 is shown in (e) and (f); time series of land surface emissivity of 50.3 GHz channel (Emis50) is shown in (c) and (d), the difference versus N15 is shown in (g) and (h). ................................................................................................. 26
LIST of TABLES
Table 1: AMSU-A/B/MHS L2 product attributes ........................................................................................................ 9
Table 2: Cloud Liquid Water Coefficients .................................................................................................................... 17
Table 3: TPW Correction Coefficients ........................................................................................................................... 18
Table 4: Coefficients Derived for AMSU Channels 1 - 3 Emissivity ................................................................... 20
Table 5: Ice Water Path Coefficients .............................................................................................................................. 22
Table 6: Rain Rate Coefficients ........................................................................................................................................ 23
Table 7: Estimated AMSU Hydrological TCDR Product Accuracy ..................................................................... 29
Table 8: Error Budget of AMSU-A/B/MHS Window Channels TCDR............................................................... 29

CDR Program AMSU-A/B/MHS TCDR for Hydrological Applications C-ATBD CDRP-ATBD-0804 Rev. 1 05/05/16
A controlled copy of this document is maintained in the CDR Program Library. Approved for public release, distribution is unlimited.
6
1. Introduction
1.1 Purpose The purpose of this document is to describe the algorithm submitted to the National Centers for Environmental Information (NCEI) by Ralph Ferraro, Principal Investigator from the NOAA/NESDIS/Center for Satellite Applications and Research (STAR), that will be used to create the Advanced Microwave Sounding Unit-A (AMSU-A), AMSU-B and Microwave Humidity Sounder (MHS) hydrological product Thematic Climate Data Record (TCDR). These products utilize the Fundamental CDR (FCDR) as input into the product retrieval package. Presently, the CDR’s are generated from the NOAA-15, -16, -17, -18, -19 and MetOp-A satellites (but will be expanded to MetOp-B in a latter phase of the project). The actual algorithm is defined by the computer program (code) that accompanies this document, and thus the intent here is to provide a guide to understanding that algorithm, from both a scientific perspective and in order to assist a software engineer or end-user performing an evaluation of the code.
1.2 Definitions Intermediate parameters to retrieve products:
Ω = (1-ωg)τ/2µ (1)
Ω = ice cloud scattering parameter
ω = cloud single-scattering albedo
g = asymmetry factor
τ = ice cloud optical thickness
µ = cosine of local zenith angle
Ω = IWPΩN/µρDe (2)
ΩN = normalized scattering parameter
De = effective particle diameter
ρ = ice particle bulk volume density
r = Ω89/Ω150 (3)
r = scattering parameter ratio
CI = convective index
εw, εi = emissivity of water and ice
CDR Program AMSU-A/B/MHS TCDR for Hydrological Applications C-ATBD CDRP-ATBD-0804 Rev. 1 05/05/16
A controlled copy of this document is maintained in the CDR Program Library. Approved for public release, distribution is unlimited.
7
ai, bi, ri (i=0 to 2, or 3, or 6) = regression coefficients
Hydrological products:
CLW = cloud liquid water
ε = emissivity
IWP = ice water path
RR = rainfall rate
SIC = sea ice concentration
SC = snow cover
SWE = snow water equivalent
TPW = total precipitable water
Ts = land surface temperature
1.3 Document Maintenance The algorithm used to generate the TCDR’s consists of two primary components – one for products that use AMSU-A only (e.g., CLW, TPW, SIC, Ts, ε) and one for products that use primarily AMSU-B/MHS (e.g., IWP, RR, SC, SWE), but require the AMSU-A products, in some cases, as input. The TCDR’s are generated using a legacy, operational product system at NESDIS/OSPO, known as the Microwave Surface and Precipitation Product System (MSPPS), see http://www.star.nesdis.noaa.gov/corp/scsb/mspps/main.html and Ferraro et al. (2005).
Synchronization between this document and the algorithm is achieved through version and revision numbers, i.e., there will be consistency between the version numbers on the front cover of this document and the version and revision numbers contained within the TCDR software itself (i.e., various header files within the software documentation). It is envisioned that the MSPPS algorithms will remain unchanged; however, version changes would primarily come about with changes in the FCDR versions.

CDR Program AMSU-A/B/MHS TCDR for Hydrological Applications C-ATBD CDRP-ATBD-0804 Rev. 1 05/05/16
A controlled copy of this document is maintained in the CDR Program Library. Approved for public release, distribution is unlimited.
8
2. Observing Systems Overview This section provides an overview of the characteristics of the AMSU-A/B/MHS observing systems and its calibration strategy. For more specific details on the AMSU-A/B/MHS sensor, please refer to Appendix B.
The AMSU-A sensors were designed to enhance the vertical profiling of temperature, while the AMSU-B/MHS sensors were designed to enhance the vertical profiling of water vapor to support NOAA’s operational mission. In this manner, it is used in conjunction with HIRS sensor as part of the ATOVS system; this is substantial upgrades to their predecessors, the MSU and SSU sensors. The first AMSU-A/B was flown on the NOAA-15 satellite in July 1998; subsequent AMSU-A/B and MHS sensors have been flown on NOAA-16, -17, -18 and -19 satellites, as well as the MetOp-A and most recently (September 2012) MetOp-B. Figure 1 shows the complete set of the satellites used in this CDR project (which covers the period 2000 through 2010), their period of records, and their time of local ascending overpass.
In addition to the legacy TOVS products and MSU climate time series which primarily utilize “sounding” channels in the oxygen (50-60 GHz) and based on heritage from the DMSP SSM/I series, NOAA began to use the AMSU-A/B/MHS window and water vapor channels (initially included for surface and precipitation screening) generating “Hydrological Products” (e.g., rain rate, snow cover, sea-ice concentration, etc.) from NOAA-15 through the Microwave Surface and Precipitation Products System (MSPPS; Ferraro et al. 2005). These products have gained increasing popularity in both the operational weather and climate communities, thus, the motivation for this project. It should be noted that an independent CDR project – MSU/AMSU Radiance FCDR’s – focuses on the AMSU-A sounding channels above 50 GHz.
Figure 1: Equatorial crossing times (LST) for NOAA-15 through NOAA-19, as well as MetOp-A (20) and MetOp-B (21). All NOAA POES satellites are indicated on the figure, however, the period for the FCDR’s is indicated by the yellow shading. This is for ascending nodes.

CDR Program AMSU-A/B/MHS TCDR for Hydrological Applications C-ATBD CDRP-ATBD-0804 Rev. 1 05/05/16
A controlled copy of this document is maintained in the CDR Program Library. Approved for public release, distribution is unlimited.
9
2.1 Products Generated The primary data sets generated from this algorithm is a swath level-2 (L2) set of hydrological cycle related products. Further details are provided in Table 1. The initial data set covers the time period from January 2000 – December 2010. The data are stored in netCDF version 4.0 files that include the necessary metadata and supplementary data fields which are described in detail in Section 3.4.7.
Table 1: AMSU-A/B/MHS L2 product attributes
Parameter Attribute
Satellite/Period of Record
NOAA-15/Jan 1, 2000 – Dec 31, 2010 NOAA-16/Jan 1, 2001 – Dec 31, 2010 NOAA-17/Jun 25, 2002 – Dec 31, 2010 NOAA-18: May 25, 2005 – Dec 31, 2010 NOAA-19: Feb 11, 2009 – Dec 31, 2010 MetOp-A: Jan 1, 2007 – Dec 31, 2010
Geographic Coverage* Global (2343 km swath width)
Spatial Resolution* 16 x 16 km (AMSU-A), 48 x 48 km AMSU-B/MHS at nadir
AMSU-A derived products CLW, TPW, SIC, Ts, ε
AMSU-B/MHS derived products
IWP, RR, SC, SWE
Precision & Accuracy Varies with product. See Section 4.2.2
*Note – there are slight differences between AMSU-B and MHS; the numbers shown are specifically for AMSU-B
2.2 Instrument Characteristics The Advanced Microwave Sounding Unit-A and -B (AMSU-A/B) and Microwave Humidity Sounder (MHS) are cross-track scanning sensors designed to measure earth scene radiances; its primary design function is to provide temperature (AMSU-A) and water vapor (AMSU-B/MHS) profiling of the atmosphere. AMSU-A/B was first flown on the NOAA-15 satellite (July 1998). The most complete references to the sensor can be found in Kidwell (1998) , and Robel et al. (2009), whereas further information is provided in Appendix B.
AMSU-A/B/MHS are multi-channel microwave radiometers that will be used for measuring global atmospheric water vapor profiles. It provides information on atmospheric water in all of its forms (with the exception of small ice particles, which are transparent at microwave frequencies). AMSU-A/B provides information even in cloudy conditions.
AMSU-A is designed to measure scene radiances in 15 discrete frequency channels (23-89 GHz), and AMSU-B/MHS is designed to measure scene radiances in 5 discrete frequency
CDR Program AMSU-A/B/MHS TCDR for Hydrological Applications C-ATBD CDRP-ATBD-0804 Rev. 1 05/05/16
A controlled copy of this document is maintained in the CDR Program Library. Approved for public release, distribution is unlimited.
10
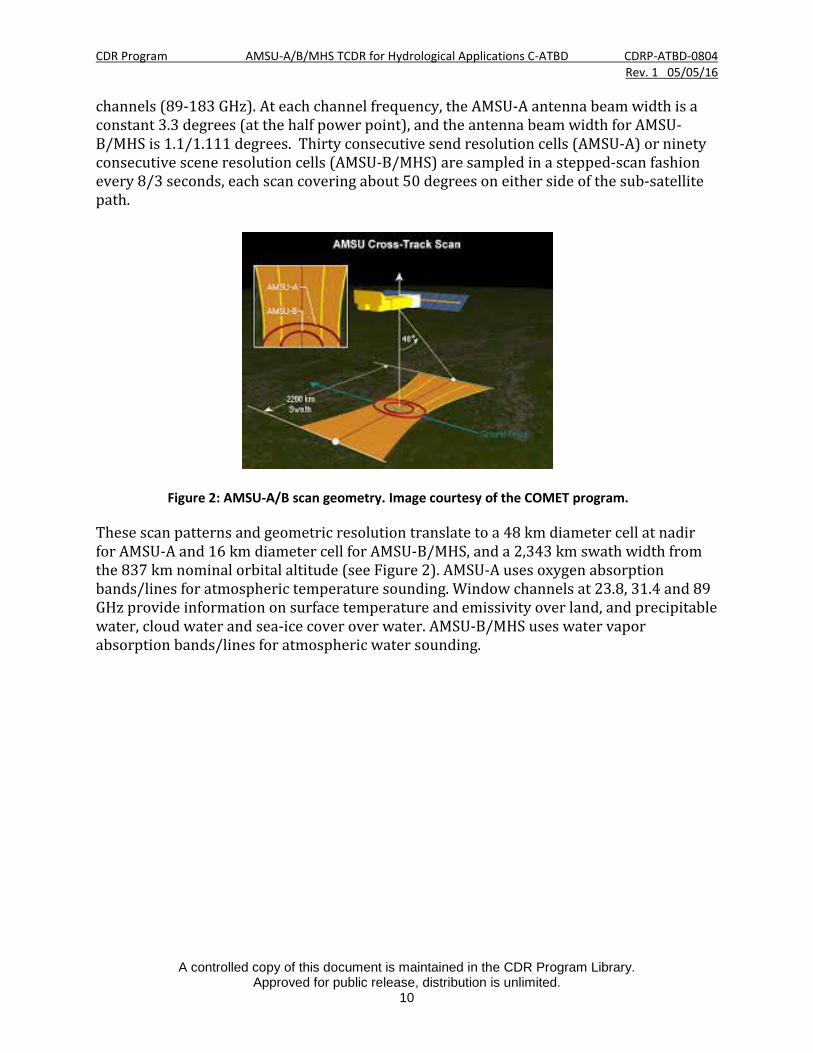
channels (89-183 GHz). At each channel frequency, the AMSU-A antenna beam width is a constant 3.3 degrees (at the half power point), and the antenna beam width for AMSU-B/MHS is 1.1/1.111 degrees. Thirty consecutive send resolution cells (AMSU-A) or ninety consecutive scene resolution cells (AMSU-B/MHS) are sampled in a stepped-scan fashion every 8/3 seconds, each scan covering about 50 degrees on either side of the sub-satellite path.
Figure 2: AMSU-A/B scan geometry. Image courtesy of the COMET program.
These scan patterns and geometric resolution translate to a 48 km diameter cell at nadir for AMSU-A and 16 km diameter cell for AMSU-B/MHS, and a 2,343 km swath width from the 837 km nominal orbital altitude (see Figure 2). AMSU-A uses oxygen absorption bands/lines for atmospheric temperature sounding. Window channels at 23.8, 31.4 and 89 GHz provide information on surface temperature and emissivity over land, and precipitable water, cloud water and sea-ice cover over water. AMSU-B/MHS uses water vapor absorption bands/lines for atmospheric water sounding.
CDR Program AMSU-A/B/MHS TCDR for Hydrological Applications C-ATBD CDRP-ATBD-0804 Rev. 1 05/05/16
A controlled copy of this document is maintained in the CDR Program Library. Approved for public release, distribution is unlimited.
11
3. Algorithm Description
3.1 Algorithm Overview This section describes the generation of the TCDR’s for the products described in Table 1. It provides details on the how the FCDR’s from AMSU-A and AMSU-B/MHS are utilized, as well as other data sets needed by the MSPPS generation system. Specific details are provided in the sections below.
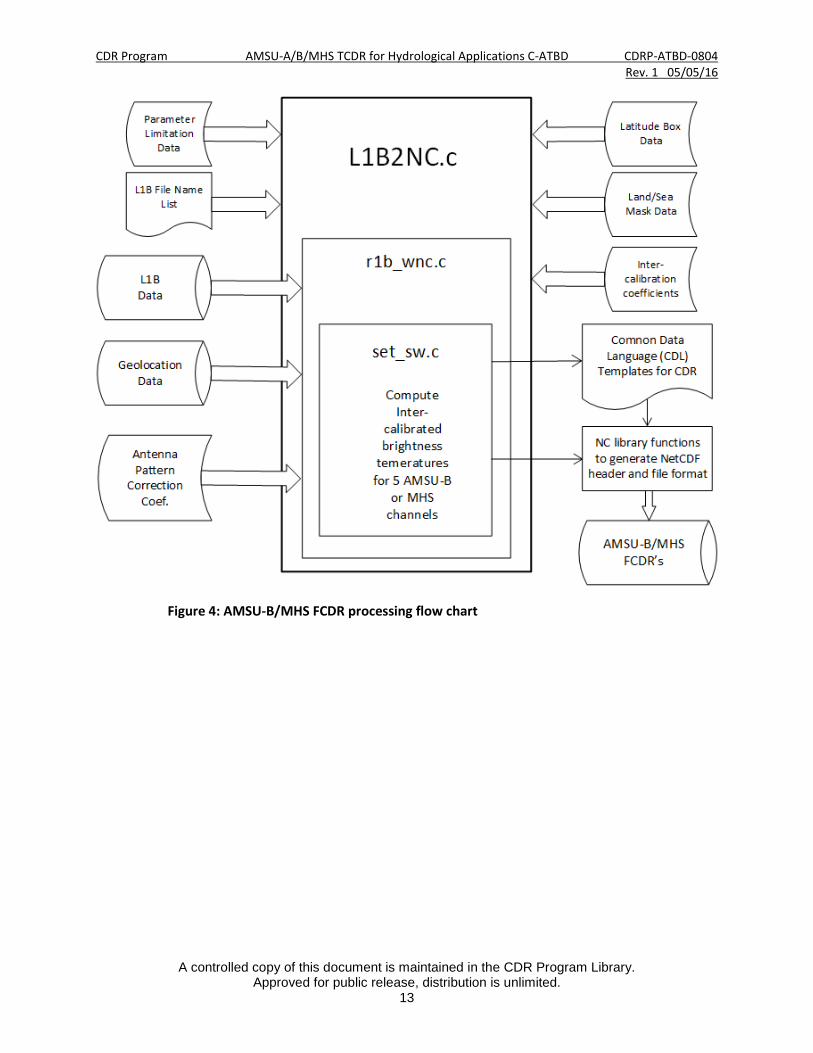
3.2 Processing Outline The steps of the AMSU-A/B/MHS TCDR algorithms include reading the input data (FCDR and ancillary data), processing the data, and the writing of the output data (TCDR). There is a sequence for processing the two TCDRs: the AMSU-A TCDR should be generated first, then the AMSU-B/MHS TCDR, as the output of AMSU-A TCDR is the input to generate AMSU-B/MHS TCDR. The processing flow is shown in Figures 3, 4, and 5. Specifically, the processing flow for AMSU-A FCDR is shown in Figure 3, and for AMSU-B/MHS FCDR is shown in Figure 4, and for the combined TCDR in Figure 5.
3.2.1 Reading Input for AMSU-A The operational system first reads all the input data for AMSU-A which include primary AMSU-A FCDR data, ancillary data (such as GFS data, etc), and derived data (including parameter limitation table, etc). These data will be described in more details in Sections 3.3.1-3.
3.2.2 Generating AMSU-A Products After reading the input data, the AMSU-A suite of hydrological products are calculated first, which include sea ice concentration (SIC), total precipitable water (TPW), cloud liquid water (CLW), land surface temperature (Ts), and land surface emissivities (ε) for 23.8, 31.4 and 50.3 GHz. Note SIC, TPW, and CLW are ocean products, and Ts and ε are land products. More details on generating AMSU-A products are described in 3.4.1.

CDR Program AMSU-A/B/MHS TCDR for Hydrological Applications C-ATBD CDRP-ATBD-0804 Rev. 1 05/05/16
A controlled copy of this document is maintained in the CDR Program Library. Approved for public release, distribution is unlimited.
12
Figure 3: AMSU-A FCDR processing flow chart
CDR Program AMSU-A/B/MHS TCDR for Hydrological Applications C-ATBD CDRP-ATBD-0804 Rev. 1 05/05/16
A controlled copy of this document is maintained in the CDR Program Library. Approved for public release, distribution is unlimited.
13
Figure 4: AMSU-B/MHS FCDR processing flow chart

CDR Program AMSU-A/B/MHS TCDR for Hydrological Applications C-ATBD CDRP-ATBD-0804 Rev. 1 05/05/16
A controlled copy of this document is maintained in the CDR Program Library. Approved for public release, distribution is unlimited.
14
Figure 5: Hydrological Properties TCDR processing flow chart
3.2.3 Writing AMSU-A Output The calculation results and meta data information for AMSU-A TCDR are written out in NetCDF4 format. Information such as conventions, title, and product version are recorded in the attribute fields (See Appendix C). For the data fields, variables are divided into two groups: data and geolocation/time. In the data group, the recorded variables are surface type, orbital mode, TPW, CLW, SIce, T_sfc, Emis_23, Emis_31, Emis_50, and product quality flag. Data in the geolocation/ time group include latitude, longitude, scan time, and scan time since 1998.
3.2.4 Reading Input for AMSU-B/MHS As AMSU-A TCDR is one of the inputs to AMSU-B/MHS TCDR products, the steps to generate AMSU-B/MHS TCDR must be taken after AMSU-A TCDR has completed. The inputs for AMSU-B/MHS TCDR also include AMSU-A FCDR (window and sounding channels), AMSU-B/MHS FCDR, ancillary data (GFS), and derived data (parameter limitation table, etc.). These data will be described in more details in Sections 3.3.1-3.
3.2.5 Generating AMSU-B/MHS Products After reading the input data, the AMSU-B/MHS suites of hydrological products would be calculated, which include rain rate (RR), snow cover (Snow), ice water path (IWP), snow

CDR Program AMSU-A/B/MHS TCDR for Hydrological Applications C-ATBD CDRP-ATBD-0804 Rev. 1 05/05/16
A controlled copy of this document is maintained in the CDR Program Library. Approved for public release, distribution is unlimited.
15
water equivalent (SWE), and effective diameter (De). More details on generating AMSU-B/MHS products are described in 3.4.2.
3.2.6 Writing AMSU-B/MHS Output The calculation results and meta information for AMSU-B/MHS TCDR are written out in NetCDF4 format. Information such as conventions, title, and product version are recorded in the attribute fields (See Appendix D). For the data fields, variables are divided into two groups: data and geolocation/time. In the data group, the recorded variables are surface type, orbital mode, RR, Snow, IWP, SWE, De, and quality flags. Data in the geolocation/ time group include latitude, longitude, scan time, and scan time since 1998.
3.3 Algorithm Input
3.3.1 Primary Sensor Data The primary sensor data for AMSU-A Hydrology TCDR is FCDR of AMSU-A data, which in turn, could be traced back to L1B of AMSU-A data. The generic L1B data, accessible from NOAA Comprehensive Large Array-data Stewardship System (CLASS), keep orbital records of these cross-scan sensors in binary format with approximately 14 files per day. AMSU-A has a resolution of 48x48 kilometers at nadir view, and150x80 kilometers at outer most beam position. The data size is 9.9 GB per satellite year with a total data size of 415 GB for all satellites and all available years. The FCDR of AMSU-A data is in netCDF format, which has good correspondence to its L1B counterpart. The data size is 4.3 GB per satellite year with a total data size of 176 GB.
The primary sensor data for AMSU-B/MHS Hydrology TCDR is FCDR of AMSU-B/MHS data, which could be tacked back to L1B data. The generic L1B data, accessible from NOAA Comprehensive Large Array-data Stewardship System (CLASS), keep orbital records of these cross-scan sensors in binary format with approximately 14 files per day. AMSU-B/MHS has a resolution of 16x16 kilometers at nadir view which increases towards the edge of the scan (approximately 26 x 52 km). The data size is ~25 GB per satellite year with a total data size of more than 1 TB for all satellites and all available years. The FCDR of AMSU-B/MHS data is in netCDF format. The data size is 22 GB per satellite year with a total data size of 807 GB.
Note, the input data to generate AMSU-B/MHS TCDR include also AMSU-A FCDR data of both window and sounding channels, and AMSU-A TCDR data.
More descriptions of the L1B data set are referred to Robel et al., (2009), KLM user’s guide. More descriptions of AMSU-A and AMSU-B/MHS Hydrology FCDR are referred to their C-ATBD respectively. More description of AMSU-A sounding FCDR is referred to the C-ATBD prepared by Zou et al. for NCEI (available at https://www.ncdc.noaa.gov/cdr/fundamental/amsu-brightness-temperature-noaa).

CDR Program AMSU-A/B/MHS TCDR for Hydrological Applications C-ATBD CDRP-ATBD-0804 Rev. 1 05/05/16
A controlled copy of this document is maintained in the CDR Program Library. Approved for public release, distribution is unlimited.
16
3.3.2 Ancillary Data The production package requires NCEP GFS Model output, which need to be preprocessed for the TCDR generation. In the current system, 8 sets of GFS variables are required daily at the interval of three hours (e.g., 00 UTC, 03 UTC, …21 UTC).
Note the land-sea mask input is not needed as the information has already been merged into FCDR data.
3.3.3 Derived Data As most sensor-related corrections have been applied in the FCDR stage, the TCDR operational system requires only the following derived data: limitation of the variable range, which is located in …/input.
3.3.4 Forward Models An ocean emissivity model is embedded in the code, which takes input of wind
speed, temperature, sea water salinity, incident angle, and frequency, to calculate the emissivity.
3.4 Theoretical Description
3.4.1 Physical and Mathematical Description for AMSU-A Products
3.4.1.1 Total Precipitable and Cloud Liquid Water Currently, CLW and TPW are determined “semi-jointly” from AMSU-A Channels 1 and 2. These are ocean algorithms for TPW and CLW.
L = a0ln[Ts - TB2] - a1ln[Ts - TB1] - a2 V = b0ln[Ts - TB2] - b1ln[Ts - TB1] - b2
where L is vertically integrated cloud liquid water (
L = ρLdzSurf
TOA
∫ ); V is vertically integrated water
vapor (
V = ρV dzSurf
TOA
∫ ); and
a0 = −0.5κV 23 /(κV 23κL 31 −κV 31κL 23)
a1 = κV 31 /κV 23
a2 = −2.0(τ o31 − a1τ o23) /µ + (1.0 − a1)ln(Ts) + ln(1.0 −ε31) − a1 ln(1.0 −ε23)
b0 = 0.5κL 23 /(κV 23κL 31 −κV 31κL 23)
b1 = κL 31 /κL 23
b2 = −2.0(τ o31 − b1τ o23) /µ + (1.0 − b1)ln(Ts) + ln(1.0 −ε31) − b1 ln(1.0 −ε23)
where
ε is sea surface emissivity;
κV is water vapor mass absorption coefficient; and
κL is cloud

CDR Program AMSU-A/B/MHS TCDR for Hydrological Applications C-ATBD CDRP-ATBD-0804 Rev. 1 05/05/16
A controlled copy of this document is maintained in the CDR Program Library. Approved for public release, distribution is unlimited.
17
liquid water mass absorption coefficient. Coefficient
κV can be derived from the following relationship
τV = κVV
There is a similar relationship for coefficient
κL :
τ L = κLL
Using Rayleigh's approximation, one can express
κL in terms of cloud layer temperature, TL, as
κL = aL + bLTL + cLTL2
Oxygen optical thickness is parameterized as a function of sea surface temperature through
τ o = ao + boTs
Table 2 lists the parameters calculated at two AMSU-A channels. They are used in the water vapor and cloud liquid water algorithms.
Table 2: Cloud Liquid Water Coefficients
23.8 GHz 31.4 GHz
ΚV 4.80423E-3 1.93241E-3
ΚL: a1 1.18201E-1 1.98774E-1
ΚL: b1 -3.48761E-3 -5.45692E-3
ΚL: c1 5.01301E-5 7.18339E-5
τo: ao 3.21410E-2 5.34214E-2
τo: bo -6.31860E-5 -1.04835E-4
The original TPW algorithm (see above) suffered from a strong angular dependence, where there was considerable drop off in retrieved TPW away from nadir. This was caused by sensor performance differences from radiative transfer calculations and related to the asymmetry seen at channels 1 and 2. In addition, there was an overall positive bias, primarily due to contamination from cloud water. The only reliable means of adjusting the TPW algorithm is through statistical matches between the AMSU values and those calculated from radiosondes. Two regression functions are applied to the original AMSU TPW to address these two issues. To make effective corrections, data are grouped into three categories: no rain (CLW < 0.2 mm), medium rain (0.2 mm ≤ CLW < 0.8 mm), and high rain (CLW ≥ 0.8 mm). TPW is corrected with

CDR Program AMSU-A/B/MHS TCDR for Hydrological Applications C-ATBD CDRP-ATBD-0804 Rev. 1 05/05/16
A controlled copy of this document is maintained in the CDR Program Library. Approved for public release, distribution is unlimited.
18
different functions for each satellite and each category. Denoting the original AMSU TPW as P0 and the corrected AMSU TPW as P, then the correction equations are
654
322
10
'*)'ln(***'
aPaPaPaaaPP
++=+++= µµ
The coefficients a1 to a6 for each satellite are given in Table 3.
Table 3: TPW Correction Coefficients
CLW < 0.2 mm
a1 a2 a3 a4 a5 a6
NOAA-15 -13.4980 12.5570 -1.7715 -2.3495 1.1183 3.6658
NOAA-16 -2.2682 -2.7575 3.0643 -1.8448 1.1009 2.5731
NOAA-17 -3.1872 0.6867 0.9997 -1.9449 1.1079 2.3839
0.2 mm ≤ CLW < 0.8 mm
a1 a2 a3 a4 a5 a6
NOAA-15 18.0600 -28.6160 9.9499 -1.8668 1.0896 2.7365
NOAA-16 44.7000 -73.1420 27.9600 -2.6990 1.1161 4.4550
NOAA-17 24.4580 -36.9190 11.9334 -1.2453 1.0537 2.0190
CLW ≥ 0.8 mm
a1 a2 a3 a4 a5 a6
NOAA-15 39.1740 -78.0370 34.0813 4.9075 0.9904 -18.8649
NOAA-16 35.9840 -79.4060 37.8766 -3.9073 1.2034 3.9595
NOAA-17 21.9450 -48.9740 22.5697 49.8421 -0.0217 -142.1647

CDR Program AMSU-A/B/MHS TCDR for Hydrological Applications C-ATBD CDRP-ATBD-0804 Rev. 1 05/05/16
A controlled copy of this document is maintained in the CDR Program Library. Approved for public release, distribution is unlimited.
19
The comparison of these two time series before and after re-calibration is shown in Figure 6.
3.4.1.2 Sea-Ice Concentration The retrieved emissivity at 23.8 GHz (Channel 1) is
ε = a + bAT1 + cAT2 + dAT3
where
a = 1.84 - 0.723 µ;
b = -0.00088;
c = 0.0066 + 0.0029 µ;
d = -0.00926.
The e missivity of water is
εwater = 0.1824 + 0.9048µ − 0.6221µ2
The emissivity of ice is
εice =0.93, if (AT1 − AT2) < 5K,
0.87, if 5 ≤ (AT1 − AT2) ≤10K,0.83, if (AT1 − AT2) >10K
Sea ice concentration (%) is computed from
sice =100(ε −εwater ) /(εice −εwater ) Note: 1. Sea ice concentration is set to be zero in the latitude band from -50 to 50 degrees. 2. A cutoff value of 30% is applied in the sea ice concentration algorithm.
3.4.1.3 Surface Temperature The current AMSU surface temperature algorithm for land area is as follows:
Ts = 2.9079 ×10² − (8.5059 ×10⁻¹ −1.9821×10−3TB23)TB23
+ (6.1433 ×10⁻¹ − 2.3579 ×10−3TB31)TB31
− (1.1493 − 5.4709 ×10−3TB50)TB50
−1.50 ×101(µ − 5.40 ×10⁻¹)
where
Ts is the estimated skin temperature,

CDR Program AMSU-A/B/MHS TCDR for Hydrological Applications C-ATBD CDRP-ATBD-0804 Rev. 1 05/05/16
A controlled copy of this document is maintained in the CDR Program Library. Approved for public release, distribution is unlimited.
20
TB23,
TB31 and
TB50 are the AMSU-A brightness temperatures at 23.8, 31.4 and 50.3 GHz frequency channels (AMSU channels 1, 2, and 3, respectively) and
µ is the cosine of the local zenith angle.
3.4.1.4 Emissivity These are land algorithms for emissivities of three AMSU channels.
εi
= b0,i + b1,iAT1 + b2,iAT12 + b3,iAT2 + b4,iAT2
2 + b5,iAT3 + b6,iAT32, i =1,2,3
where
εi is the land emissivity of Channel
i ,
i =1,2,3.
Table 4 lists the coefficients used in the above equations:
Table 4: Coefficients Derived for AMSU Channels 1 - 3 Emissivity
b0 b1 b2 b3 b4 b5 b6
ε1 -2.5404E-1 1.1326E-2 -1.9479E-5 -4.5763E-3 1.7833E-5 3.2324E-3 -1.9056E-5
ε2 -2.2606E-1 3.4481E-3 -9.7185E-6 4.3299E-3 5.3281E-6 1.8668E-3 -1.5369E-5
ε3 8.9494E-2 -3.6615E-3 -4.2390E-7 1.0636E-2 -6.4559E-6 -4.2449E-4 -6.6878E-6
The comparison surface temperature and emissivity of 50.3 GHz time series before and after re-calibration is shown in Figure 7.
3.4.2 Physical and Mathematical Description for AMSU-B/MHS Products
3.4.2.1 Snow Cover Snow cover is identified by the scattering of high frequency microwaves from ice particles and the fact that scattering reduces the high frequency brightness temperature measurements relatively to the lower frequency measurements. The following two scattering indices (Ω31.4 and Ω89.0) are used to represent the differences between the lowest frequency (AMSU-A, 23.8 GHz) and the higher frequency channels at 31.4 GHz (AMSU-A) and 89.0 GHz (AMSU-B/MHS).
Ω31.4 = TB1 - TB2 - 2.0 Ω89.0 = TB1 - TB16 - 3.0
If Ω31.4 < 3 and TB1 ≤ 215 K, then the snow type glacial snow is designated. Ω89.0 is used to identify normal snow cover on land and coast. Snow cover is present if the scattering index

CDR Program AMSU-A/B/MHS TCDR for Hydrological Applications C-ATBD CDRP-ATBD-0804 Rev. 1 05/05/16
A controlled copy of this document is maintained in the CDR Program Library. Approved for public release, distribution is unlimited.
21
Ω89.0 ≥ 1. On coast, the AMSU-A 89.0 GHz is used instead of AMSU-B to compute Ω89.0, to alleviate aliasing effects resulting from differences in resolution between AMSU-A and AMSU-B channels. There are also checks to eliminate false signatures of snow due to precipitation and cold deserts.
The new addition to the previous version extends the retrievals of snow cover to areas associated with above-freezing surface temperatures, which were labeled as "indeterminate" to remove confusion from warm rain. This "indeterminate" snow cover was sometimes misclassified as rain by the rain rate algorithm. This problem was solved as follows.
If scattering index Ω89.0 ≥ 1, and 262 K ≤ TB1 < 268 K, snow cover is identified when the following set of conditions are met:
TB16 - TB17 > 3 and, TB5L - TB19 < -7 and, TB5L < 250
3.4.2.2 Ice Water Path IWP is retrieved by using the following equations:
De = a0 + a1 r + a2 r2 + a3 r 3 ΩN = expb0 + b1 ln(De) + b2 [ln(De)]2 IWP = µ rice ρsi De Ω / ΩN
where De is the effective particle diameter; r the scattering parameter ratio of 89 GHz and 150 GHz; ΩN the normalized scattering parameter; Ω the scattering parameter estimated using brightness temperatures at cloud top and base; rice the ice density fractional ratio, rice = 1 is used in the current algorithm; and ρsi the density of solid ice. The regression coefficients ai (i = 0, 1, 2, 3) and bi (i = 0, 1, 2) are listed in Table 5 below.
Close examination of the original IWP algorithm, plus user feedback, revealed some weaknesses that have been addressed by the algorithm upgrade. Most notably was the unphysical IWP frequency distribution, which had "preferred" retrieval values rather than an expected lognormal distribution. In addition, the values over water appeared to be too high. Further refinement of the retrieval model and coefficients has led to the following changes:
• A two-stream correction to TB89 and TB150 are introduced as a function of local zenith angle.
• The coefficients to calculate De have been adjusted slightly (current values are noted in the table below) as well as the thresholds for using them.
• Change allowable values of De and Ω in instances of weak scattering due to uncertainties in their retrieval.

CDR Program AMSU-A/B/MHS TCDR for Hydrological Applications C-ATBD CDRP-ATBD-0804 Rev. 1 05/05/16
A controlled copy of this document is maintained in the CDR Program Library. Approved for public release, distribution is unlimited.
22
Table 5: Ice Water Path Coefficients
a0 a1 a2 a3
-0.300323 4.30881 -3.98255 2.78323
b0 b1 b2
De ≤ 1 mm -0.294459 1.38838 -0.753624
De > 1 mm -1.19301 2.08831 -0.857469
3.4.2.3 Rain Rate Rain rate is computed based on an IWP and rain rate relation derived from the MM5 cloud model data.
RR = a0 + a1 IWP + a2 IWP2
where the coefficients a0 to a2 are given in Table 6 below.
Thorough validation of the original rain rate algorithm revealed a strong positive bias over oceans and a weaker negative bias over land. In addition, a non-uniform distribution of rain rates existed due to the problems noted in the IWP algorithm (see above). Finally, the maximum allowed rain rate of 20 mm/hr was not realistic and was attributed to the relationship used to convert IWP to rain rate. The improved algorithm has incorporated the following changes:
• A "convective index" (CI) (e.g., weak, moderate and strong) is computed by using the three 183 GHz channels by examining differences between them; the larger the depressions are at 183+1, the deeper the convection.
• Depending upon the convective index, rain rate is computed using different coefficients (note table below).
• The maximum allowed rain rate is 30 mm/hr.

CDR Program AMSU-A/B/MHS TCDR for Hydrological Applications C-ATBD CDRP-ATBD-0804 Rev. 1 05/05/16
A controlled copy of this document is maintained in the CDR Program Library. Approved for public release, distribution is unlimited.
23
Table 6: Rain Rate Coefficients
a0 a1 a2
CI = 1 or 2
0.321717 16.5043 -3.3419
CI = 3 0.08925 20.8194 -2.9117
3.4.2.4 Snowfall Detection Algorithm Description The snowfall detection portion of the Rain Rate algorithm is activated when the surface temperature estimated from forecast models is below 269 K, or when there is snow-cover on the ground, retrieved from the snow-cover extent algorithm. The AMSU-based experimental precipitation product determines precipitation type in the form of rain or snow based only on the AMSU measurements.
When the snowfall detection scheme is activated, snowfall extent is retrieved as follows:
For TB53 >= 245 K, there is snowfall when the following sets of conditions are met:
SET1: TB89 -TB150 >= 4 AND,
TB176 <255 AND,
TB180 < 253 AND,
TB182 < 250.
Where, TB53 refers to the AMSU-A limb-corrected brightness temperature at 53.6 GHz channel frequency in the oxygen absorption band, TB89 and TB150 refer to the AMSU-B brightness temperatures at 89 and 150 GHz window channel frequencies, and TB176, TB180 and TB182 refer to the AMSU-B brightness temperatures at 183±7, 183±3, and 183±1 channel frequencies in the water vapor absorption band, respectively.
SET2:
TB89-TB150 >= 4 AND TB89-TB150 <= 10, AND
TB180 <= 253, AND
TB176 >=255 AND
TB23 < =262 AND,
TB150-TB176 >= -16, AND,
TB176-TB180 >= -3.

CDR Program AMSU-A/B/MHS TCDR for Hydrological Applications C-ATBD CDRP-ATBD-0804 Rev. 1 05/05/16
A controlled copy of this document is maintained in the CDR Program Library. Approved for public release, distribution is unlimited.
24
For TB53 < 245 AND TB53 >= 243, snowfall is detected for the following set of conditions:
Threshold = 242.5 + 5*μ
Depression = TB180 – Threshold
Depression < 0.0.
Where μ is the cosine of the local zenith angle.
For TB53 less than 243 K, snowfall is labeled as “indeterminate”.
3.4.2.5 Snow Water Equivalent The retrieval of the Snow Water Equivalent (SWE) is based on two scattering indices, which are computed as follows:
Ω31.4 = TB23 – TB31.4
Ω89 = TB23 – TB89
where, Ω31.4 and Ω89 represent the two scattering indices, and TB23, TB31.4, and TB89 represent the AMSU brightness temperature measurements at 23, 31.4 and 89 GHz channel frequencies, respectively.
The SWE is computed for the snow-covered pixels (see Section 3.4.2.1) by the following empirical relationships:
R = (TB31.4-TB89) / (TB23 – TB31.4) SWE = K1 + K2 * Ω89 for R >= 8.0, and
SWE = K3 + K4 * Ω31.4 for R < 8.0 where K1 = 1.1, K2 = 0.08, K3 = 1.7, and K4= 0.6, are empirically derived coefficients, and SWE is in cm. The algorithm implicitly differentiates between two snow-cover types: finer-grained fresh snow- and coarser-grained older snow-cover via the estimation of the mean snow-cover grain size parameter, R. The coefficient values were derived from regional studies in the U.S.
3.4.3 Data Merging Strategy The original sampling provided by the six AMSU-A and AMSU-B/MHS sensors is preserved in the output TCDR data with no merging of the resulting data either in space or in time. The resulting TCDR from each of the six sensors have been intercalibrated at the FCDR level to be physically consistent with the observed Tb from NOAA-15 (AMSU-A), NOAA-17 (AMSU-B) and NOAA-18 (MHS) channels, especially channels sensitive to lower troposphere, are subject to the influence from both the atmosphere and the surface, and consequently show diurnal cycle effect especially over land. Since the six satellites have different Equatorial Crossing Time (ECT), i.e. they overpass a certain location on earth at different times of the day, the observations of the channels from these satellites cannot be merged without removing the diurnal effect in the measurements. Most of the TCDR

CDR Program AMSU-A/B/MHS TCDR for Hydrological Applications C-ATBD CDRP-ATBD-0804 Rev. 1 05/05/16
A controlled copy of this document is maintained in the CDR Program Library. Approved for public release, distribution is unlimited.
25
derived from the FCDR also have diurnal cycle, so it is important for the FCDR to retain its temporal signature so as to preserve the diurnal properties of the TCDR. Therefore, there is no plan to merge either the FCDR or TCDR for this project.
3.4.4 Numerical Strategy The TCDR’s are generated using a legacy, operational product system at NESDIS/OSPO, known as the Microwave Surface and Precipitation Product System (MSPPS), see http://www.star.nesdis.noaa.gov/corp/scsb/mspps/main.html and Ferraro et al. (2005).
Figure 6: Retrieved tropical ocean products comparison. Left panels display the products produced by MSPPS from original 1b, while right panels are TCDR after inter-satellite calibration. Time series of total precipitable water (TPW) is shown in (a) and (b), the difference versus N15 is shown in (e) and (f); time series of cloud liquid water (CLW) is shown in (c) and (d), the difference versus N15 is shown in (g) and (h).

CDR Program AMSU-A/B/MHS TCDR for Hydrological Applications C-ATBD CDRP-ATBD-0804 Rev. 1 05/05/16
A controlled copy of this document is maintained in the CDR Program Library. Approved for public release, distribution is unlimited.
26
Figure 7: Retrieved tropical land products comparison. Left panels display the products produced by MSPPS from original 1b, while right panels are TCDR after inter-satellite calibration. Time series of land surface temperature (Ts) is shown in (a) and (b), the difference versus N15 is shown in (e) and (f); time series of land surface emissivity of 50.3 GHz channel (Emis50) is shown in (c) and (d), the difference versus N15 is shown in (g) and (h).
3.4.5 Calculations Details on the processing steps involved in the algorithm are provided in Sections 3.4.1 and 3.4.2.
3.4.6 Look-Up Tables Details of the Look-Up Tables involved in the algorithm are provided in Sections 3.4.1 and 3.4.2.
3.4.7 Parameterization Details of the parameterization involved in the algorithm are provided in Sections 3.4.1 and 3.4.2.

CDR Program AMSU-A/B/MHS TCDR for Hydrological Applications C-ATBD CDRP-ATBD-0804 Rev. 1 05/05/16
A controlled copy of this document is maintained in the CDR Program Library. Approved for public release, distribution is unlimited.
27
3.4.8 Algorithm Output For each input FCDR file, the algorithm produces an output TCDR file in NetCDF4 format. There are approximately 14 files per sensor per day and each file is approximately 0.7 Mbytes for AMSU-A TCDR, and 1.7 Mbytes for AMSU-B/MHS TCDR. The TCDR file contains the final inter-calibrated product suites. Two groups of variables are provided. The first group, geolocation/time, contains latitude, longitude, scan time, and scan time since 1998. The second group has surface type, orbital mode, earth incidence angle in common, TPW, CLW, Sea Ice, Surface Temperature, and Emissivities for AMSU-A TCDR, and RR, SC, IWP, SWE for AMSU-B/MHS TCDR, and quality flags. The data are truncated to the nearest 0.001 degree for the latitude and longitude values and to the nearest 0.01 degree for view angles. Internal NetCDF data compression is used to compress the files. An example of the format of the AMSU-A TCDR files is provided in Appendix C, and that of the AMSU-B/MHS TCDR files is provided in Appendix D.

CDR Program AMSU-A/B/MHS TCDR for Hydrological Applications C-ATBD CDRP-ATBD-0804 Rev. 1 05/05/16
A controlled copy of this document is maintained in the CDR Program Library. Approved for public release, distribution is unlimited.
28
4. Test Datasets and Outputs
4.1 Test Input Datasets The test dataset is composed of one month of AMSU-A and AMSU-B/MHS FCDR data from NOAA-15, -16, -17, -18, -19 and Metop-A for September 2009 and the ancillary data: GFS data of that month. The provided GFS data has been preprocessed to include only desirable variables: wind components U and V, surface temperature, and total precipitable water. There are eight sets of GFS variables per day at the interval of three hours.
4.2 Test Output Analysis
4.2.1 Reproducibility A set of TCDRs derived from the test FCDRs data during development is also delivered with the test input data. The TCDRs generated from the AMSU-A and AMSU-B/MHS TCDR processing system using the test input data should reproduce the same TCDRs as the data created during development. Comparisons of basic statistics such as monthly mean and standard deviation of the brightness temperatures between the two data sets will suffice to confirm the reproducibility of the test data.
4.2.2 Precision and Accuracy The TCDR data sets are derived from corresponding FCDR data sets after inter-satellite calibration. Precision of the inter-satellite calibrated data is measured by the standard deviation of the TCDR variables difference between satellites. NOAA-15 acts as the reference satellite. Figure 6 shows that TPW before inter-satellite calibration display a wet bias relative to N15, which is more clearly shown in Figure 6(e), as all the difference regarding to N15 is positive. The wet bias of TPW has been corrected by the TCDR, shown in Figure 6(b) and (f), with the overall difference closer to zero. Similarly, TCDR CLW series display a better agreement among the six on-board satellites than that of original CLW products.
An estimate of overall product accuracy is provided in Table 7 (Ferraro et al., 2005).

CDR Program AMSU-A/B/MHS TCDR for Hydrological Applications C-ATBD CDRP-ATBD-0804 Rev. 1 05/05/16
A controlled copy of this document is maintained in the CDR Program Library. Approved for public release, distribution is unlimited.
29
Table 7: Estimated AMSU Hydrological TCDR Product Accuracy
Products Channels Used Product Range Accuracy (RMS)
Total Precipitable Water 23, 31 GHz 0 - 80 mm 2.0 mm
Cloud Liquid Water 23, 31 GHz 0 - 6 mm 0.05 mm
Rain Rate 23, 31, 89 GHz 0 - 30 mm/hr 2 mm/hr
Sea Ice Concentration 23, 31 GHz 0 - 100% 15%
Snow Cover 23, 31, 89 GHz 0 - 100% 5%
Ice Water Path 89, 150 GHz 0 - 2 mm 0.10 mm
Snow Water Equivalent 23, 31, 50.3 GHz 0 - 10 cm 1 cm
Land Surface Temp. 23, 31, 50.3 GHz 250 - 325 K 5 K
Land Surface Emissivity 23, 31, 50.3 GHz 0 – 100% 10%
The estimation is based on the comparison of operational MSPPS data with radiosondes and SSM/I data, more detail of this is referred to the User Guide of MSPPS.
4.2.3 Error Budget The various errors associated with the AMSU-A and AMSU-B/MHS TCDR data are listed in Table 8. The estimation is a percentage regarding to the values in the “Accuracy” column of Table 7. It is noted that these errors cannot be combined in simple forms.
Table 8: Error Budget of AMSU-A/B/MHS Window Channels TCDR
Error Sources
Magnitude of Errors
Prospective Improvements
FCDR 50% Improve the accuracies of FCDR
MSPPS Algorithm 50% Try Microwave Integrated Retrieval System

CDR Program AMSU-A/B/MHS TCDR for Hydrological Applications C-ATBD CDRP-ATBD-0804 Rev. 1 05/05/16
A controlled copy of this document is maintained in the CDR Program Library. Approved for public release, distribution is unlimited.
30
5. Practical Considerations
5.1 Numerical Computation Considerations Endian
The AMSU-A and AMSU-B/MHS TCDR Production Package assumes IEEE little-endian environment. As the input FCDR is also in IEEE little-endian, no endian swapping is required.
Precision
The code can be run under either 32-bit or 64-bit mode.
Parallelization
This production package is not considered computationally intensive so parallel computation is not performed.
5.2 Programming and Procedural Considerations The code that implements the TCDR algorithms follows standard procedural programming constructs. No unusual programming techniques or optimizations are used as simplicity was an important design criterion.
5.3 Quality Assessment and Diagnostics The impact of inter-satellite calibration upon TCDR has been assessed, and the results are described in Yang et al. (2015). Further assessment of other aspects will be implemented.
5.4 Exception Handling Error and exception conditions are handled by direct checking of conditions/return codes in the main control flow rather than by a language-supported exception construct.
5.4.1 Conditions Checked The following conditions identify errors that necessitate the program terminate. These errors are trapped and the program prints a suitable message, then exits gracefully with a non-zero status indicating the type of error.
• If an incorrect number of arguments are supplied to the program, a usage message is printed and it exits.
• If there is an error opening or reading an input file, the program prints an error message and exits.
CDR Program AMSU-A/B/MHS TCDR for Hydrological Applications C-ATBD CDRP-ATBD-0804 Rev. 1 05/05/16
A controlled copy of this document is maintained in the CDR Program Library. Approved for public release, distribution is unlimited.
31
• If there is an error creating or writing to an output file, the program prints an error message and exits.
The following exceptions are trapped and recovered from by skipping over the item that can’t be processed, setting codes to track this, and continuing processing with the next item:
• If the FCDR data and GFS data don’t match in regarding to time period, the program prints an error message and skips this orbit.
• If some variables of GFS data are not available, the program prints relative error message, and skips this orbit.
5.4.2 Conditions Not Checked The following possible error condition is not checked for:
• In the unlikely event that the program would run out of memory, the process would terminate unexpectedly.
5.4.3 Conditions Not Considered Exceptions Where data fields are missing or do not satisfy quality control checks (described in Section 3.2.7), quality flags are set, and for those quality issues classified as serious the corresponding data fields are set to indicate missing data. All corrections/conversions are applied only to non-missing data, and if any processing stage identifies certain data as missing, it remains missing for all future processing stages. This is considered normal processing and not an exception condition.
5.5 Algorithm Validation The MSPSS algorithms themselves are validated in a paper by Ferraro et al. (2005) and previously through on-line monitoring on the MSPPS web page – www.star.nesdis.noaa.gov/corp/scsb/mspps/main.html.
In this C-ATBD we focus on time series of the variables inter-compared with similar variables from other sources to demonstrate the viability of the TCDR time series for climate applications.

CDR Program AMSU-A/B/MHS TCDR for Hydrological Applications C-ATBD CDRP-ATBD-0804 Rev. 1 05/05/16
A controlled copy of this document is maintained in the CDR Program Library. Approved for public release, distribution is unlimited.
32
5.6 Processing Environment and Resources Computer Hardware: Linux x86_64, 132 GB memory Operating System: Red Hat Enterprise Linux Server release 6.5 (Santiago) Programming Language: C Compilers: gcc 4.4.7-4 External Libraries: NetCDF 4.1.1 Total CPU Time: about 75m per satellite year for AMSU-A TCDR, 125m per satellite year for AMSU-B/MHS Wall Clock Time: about 180m per satellite year for AMSU-A TCDR, 300m per satellite year for AMSU-B/MHS Temporary Storage: 3.5 GB per satellite year for AMSU-A TCDR, 9.5 GB per satellite year for AMSU-B/MHS.

CDR Program AMSU-A/B/MHS TCDR for Hydrological Applications C-ATBD CDRP-ATBD-0804 Rev. 1 05/05/16
A controlled copy of this document is maintained in the CDR Program Library. Approved for public release, distribution is unlimited.
33
6. Assumptions and Limitations
6.1 Algorithm Performance The calculation of the AMSU hydrological suite TCDR is heavily based on the MSPPS production system, so it inherited both pros and cons of this system. The MSPPS algorithms have not been updated for many years, yet, it relies on rather simple approaches. Future uses of the FCDR would be to utilize the MiRS system which has more robust algorithms that are self-consistent. This may be a future application pending funding availability
6.2 GFS Data Due to some embedded radiative calculation in the production system, a three-hourly GFS data set is utilized in producing TCDR. Thus the availability of GFS data sets a stringent constraint to TCDR generation.

CDR Program AMSU-A/B/MHS TCDR for Hydrological Applications C-ATBD CDRP-ATBD-0804 Rev. 1 05/05/16
A controlled copy of this document is maintained in the CDR Program Library. Approved for public release, distribution is unlimited.
34
7. Future Enhancements
7.1 Enhancement 1 – Extension of TCDR Record Presently, the TCDR’s have been generated from 2000 – 2010. Future work will expand the time series through 2015 and include MetOp-B. There are also limitations in some of the products due to the lag of the FCDR’s of the AMSU-A oxygen bands (which are being generated by Cheng-Zhi Zou through a different CDR project).
7.2 Enhancement 3 – L3 products The user community might find time/space averaged products more useful than the L2 swath products. Exploiting existing software from the MSPPS system, L3 products can be developed on various time/space scales, e.g., daily, pentad, monthly; 0.5, 1.0 and 2.5 degree. Users would be polled to determine the various time/space scales of interest.
7.3 Enhancement 4 – Implementation of MiRS MiRS has become one of NOAA’s most important operational product systems; it generates temperature and moisture profiles along with other important atmospheric and surface parameters in a unique 1- DVAR scheme. It is expected to have better coverage by implementing this system.
CDR Program AMSU-A/B/MHS TCDR for Hydrological Applications C-ATBD CDRP-ATBD-0804 Rev. 1 05/05/16
A controlled copy of this document is maintained in the CDR Program Library. Approved for public release, distribution is unlimited.
35
8. References
Chen, Y., Weng, F., Han, Y., and Liu, Q (2008). Validation of the Community Radiative Transfer Model by using CloudSat data, J. Geophys. Res., vol. 113, D00A03, doi:10.1029/2007JD009561.
EUMETSAT (2010). ATOVS Level L1B Product Guide, available at http://oiswww.eumetsat.org/WEBOPS/eps-pg/ATOVS-L1/ATOVSL1-PG-index.htm.
Ferraro, R.R., F. Weng, N. Grody, L. Zhao, H. Meng, C. Kongoli, P. Pellegrino, S. Qiu and C. Dean (2005). NOAA operational hydrological products derived from the AMSU. IEEE Trans. Geo. Rem. Sens., 43: 1036 – 1049.
Grody, N. C., Zhao, J., Ferraro, R., Weng F., and Boers, R. (2001). Determination of precipitable water and cloud liquid water from the NOAA 15 AMSU, J. Geophys. Res., vol. 106, pp. 2943-2953.
Kidwell, K.B., edited (1998). NOAA Polar Orbiter Data User’s Guide, available at http://www.ncdc.noaa.gov/oa/pod-guide/ncdc/docs/podug/index.htm.
Mo, T (1999). AMSU-B/MHS antenna pattern corrections. IEEE Trans. Geosci. Remote Sens., 37(1): 103-112, 1999.
Moradi, I., H. Meng, R.R. Ferraro, and S. Bilanow (2013). Correcting geolocation errors for microwave instruments aboard NOAA satellites. IEEE Trans. Geosci. Remote Sens., 51, 3625-3637. DOI: 10.1109/TGRS.2012.2225840.
Robel, J., et al. edited (2009). NOAA KLM User’s Guide, available at http://www.ncdc.noaa.gov/oa/pod-guide/ncdc/docs/podug/index.htm.
D. A. Vallado, P. Crawford, R. Hujsak, and T. Kelso, Revisiting spacetrack report #3. AIAA/AAS Astrodynamics Specialist Conf., Keystone, CO, American Institute of Aeronautics and Astronautics, Aug. 2006.
Wang, J., Cole, H. L., Carlson, D.J., Miller, E.R., Beierle, K., Paukkunen, A., and Laine, T.K. (2002). Corrections of the humidity measurement error from the Vaisala RS80 radiosonde –application to TOGA-COARE data, J. Atmos. Oceanic Technol., Vol. 19(7), pp. 981-1002.
Yang, W., Meng, H., Ferarro, R., and Chen, Y., (2015). Inter-Calibration of AMSU-A Window Channels. IEEE Trans. Geosci. Remote Sens. (In preparation),

CDR Program AMSU-A/B/MHS TCDR for Hydrological Applications C-ATBD CDRP-ATBD-0804 Rev. 1 05/05/16
A controlled copy of this document is maintained in the CDR Program Library. Approved for public release, distribution is unlimited.
36
Appendix A. Acronyms and Abbreviations
Acronym or Abbreviation
Meaning
AMSU Advanced Microwave Sounding Unit
AMSU-A Advanced Microwave Sounding Unit-A
AMSU-B Advanced Microwave Sounding Unit-B
ATMS Advanced Technology Microwave Sounder
ATOVS Advanced Tiros Operational Vertical Sounder
C-ATBD Climate Algorithm Theoretical Basis Document
CDR Climate Data Record
CICS Cooperative Institute for Climate and Satellites
ECMWF European Centre for Medium-Range Weather Forecast
ECT Equator crossing time
EIA Earth Incidence Angle
EUMETSAT European Organization for the Exploitation of Meteorological Satellites
FCDR Fundamental Climate Data Record
FOV Field of View
HIRS High-resolution Infrared Radiation Sounder
IFOV Instantaneous Field of View
JPSS Joint Polar Satellite System
LST Local Standard Time
LZA Local Zenith Angle
MetOp Meteorological Operational Polar Satellite
MHS Microwave Humidity Sounder
NCDC National Climatic Data Center
MSPPS Microwave Surface and Precipitation Products System
NESDIS National Environmental Satellite, Data, and Information Service
NCEP National Centers for Environmental Prediction
NeDT Noise Equivalent Difference of Temperature
NOAA National Oceanic and Atmospheric Administration
POES Polar-orbiting Operational Environmental Satellites
RMSE Root Mean Square Error
SSM/I Special Sensor Microwave/Imager
STAR Center for Satellite Applications and Research
TB Brightness Temperature
CDR Program AMSU-A/B/MHS TCDR for Hydrological Applications C-ATBD CDRP-ATBD-0804 Rev. 1 05/05/16
A controlled copy of this document is maintained in the CDR Program Library. Approved for public release, distribution is unlimited.
37
TCDR Thematic Climate Data Record
TIROS Television Infrared Observation Satellite
TOVS TIROS Operational Vertical Sounder

CDR Program AMSU-A/B/MHS TCDR for Hydrological Applications C-ATBD CDRP-ATBD-0804 Rev. 1 05/05/16
A controlled copy of this document is maintained in the CDR Program Library. Approved for public release, distribution is unlimited.
38
Appendix B. AMSU-A/B/MHS Sensor Details
This appendix provides more detailed information on the AMSU-A/B/MHS sensor. This sensor is flown on the following satellites:
Satellite Launch Date
NOAA-15 5/13/1998
NOAA-16 9/21/2000
NOAA-17 6/24/2002
NOAA-18 5/20/2005
NOAA-19 2/6/2009
MetOp-A 10/19/2006
MetOp-B 9/17/2012
The AMSU-A is a fifteen-channel microwave radiometer that is used for measuring global atmospheric temperature profiles and providing information on atmospheric water in all of its forms. Sensor details are provided in Table B2. Hardware for the two lowest frequencies is located in one module (AMSU-A2) and that for the remaining thirteen frequencies in the second module (AMSU-A1). (see Figure xx). The AMSU-A2 module has a single antenna assembly, providing data for channels 1 and 2. AMSU-A1 has two separate antenna assemblies: AMSU-A11 provides data for channels 6, 7 and 9-15, and AMSU-A12 provides data for channels 3, 4, 5 and 8.
AMSU-A operates in a cross- track, stepped-line scanning geometry. The instrument has an instantaneous field-of-view of 3.3° at the half-power points providing a nominal spatial resolution at nadir of 48 km (29.8 mi). The antenna provides a cross-track scan, scanning ±48.3° from nadir with a total of 30 Earth fields-of-view per scan line. This instrument completes one scan every 8 seconds.

CDR Program AMSU-A/B/MHS TCDR for Hydrological Applications C-ATBD CDRP-ATBD-0804 Rev. 1 05/05/16
A controlled copy of this document is maintained in the CDR Program Library. Approved for public release, distribution is unlimited.
39
The AMSU-B/MHS is a five-channel microwave radiometer that is used for measuring global atmospheric water vapor profiles and providing information on atmospheric water in all of its forms. Sensor details are provided in Table B2. Hardware for the all the channels are located in one module . The AMSU-B/MHS module has a single antenna assembly, providing data for channels 1 to 5.

CDR Program AMSU-A/B/MHS TCDR for Hydrological Applications C-ATBD CDRP-ATBD-0804 Rev. 1 05/05/16
A controlled copy of this document is maintained in the CDR Program Library. Approved for public release, distribution is unlimited.
40
AMSU-B/MHS operates in a cross- track, continuous scanning geometry. The instrument has an instantaneous field-of-view of 1.1° at the half-power points providing a nominal spatial resolution at nadir of 16 km. The antenna provides a cross-track scan, scanning ±48.3° from nadir with a total of 90 Earth fields-of-view per scan line. This instrument completes one scan every 3 seconds.
AMSU-B Channel Characteristics
Channel Number
Central Frequency
(GHz)
Double-sided Maximum
(MHz)
Pass Band
(MHz)
IF Band
(MHz)
Stop Band
(MHz) NE∆T(K)
16 89.0±0.9 6000 3000 ≥ 1000 ±400 0.37 17 150.0±0.9 4000 2000 ≥ 1000 ±400 0.84 18 183.31±1.00 1000 2 x 500 500 - 1.06 19 183.31±3.00 2000 2 x 1000 1000 - 0.70 20 183.31±7.00 4000 2 x 2000 2000 - 0.60
MHS Channels and Passband Characteristics* Channel
(See Note 1) Central Frequency
(GHz) No of Passbands RF Bandwidth (MHz)(See Note 2)
T (K) (See Note 3)
Polarization (See Note 4)
H1 89.0 1 2800 0.22 V H2 157.0 1 2800 0.34 V H3 183.311 ± 1.0 2 2 x 500 0.51 H H4 183.311 ± 3.0 2 2 x 1000 0.40 H H5 190.311 1 2200 0.46 V
Notes:
1. The five MHS channels provide data continuity with AMSU-B channels 16 to 20, with some minor changes in frequency allocation and polarization, and improved performance.
2. The quoted values for the maximum bandwidths are double-sideband values and represent the maximum permissible bandwidths at the 3 dB points.
3. Ground measured values for the first flight model (NOAA-N). 4. The V and H polarizations correspond respectively to electrical fields normal or parallel
to the ground track at nadir, both rotating by an angle equal to the scan angle for off-nadir directions.

CDR Program AMSU-A/B/MHS TCDR for Hydrological Applications C-ATBD CDRP-ATBD-0804 Rev. 1 05/05/16
A controlled copy of this document is maintained in the CDR Program Library. Approved for public release, distribution is unlimited.
41
Appendix C. Sample AMSU-A TCDR File Format netcdf CICS_V00R01_AMSUA_TCDR_MOA_D08200_S013233_E031641_B0905556 dimensions: nscan = 782 ; npixel = 30 ; nchar = 20 ; nchan = 4 ; // global attributes: :Conventions = "CF-1.5" ; :Metadata_Conventions = "CF-1.5, Unidata Dataset Discovery v1.0, NOAA CDR v1.0, GDS v2.0" ; :standard_name_vocabulary = "CF Standard Name Table (v18, 22 July 2011)" ; :id = "CICS_V00R01_AMSUA_TCDR_MOA_D08200_S013233_E031641_B0905556.nc" ; :naming_authority = "gov.noaa.ncdc" ; :metadata_link = "gov.noaa.ncdc:TBD" ; :title = "CICS Version-1 AMSUA FCDR" ; :product_version = "v00r02" ; :date_issued = "TBD" ; :summary = "TBD" ; :keywords = "EARTH SCIENCE > SPECTRAL/ENGINEERING > MICROWAVE > BRIGHTNESS TEMPERATURE" ; :keywords_vocabulary = "NASA Global Change Master Directory (GCMD) Earth Science Keywords, Version 6.0" ; :platform = "MetOp-A > Meteorological Operational satellite programme - A" ; :sensor = "AMSU-A > Advanced Microwave Sounding Unit - A" ; :cdm_data_type = "Swath" ; :cdr_program = "NOAA Climate Data Record Program for satellites, FY 2011" ; :cdr_variable = "TPW, CLW, SIce, T_sfc, Emis_23, Emis_31, Emis_89" ; :source = "CICS_V00R01_AMSUA_FCDR_MOA_D08200_S013233_E031641_B0905556.nc" ; :refrences = "TBD" ; :history = "TBD" ; :date_created = "2015-06-25 14:22:56Z\000\000¯¿\\è˙¿)\\˜¿è¬ı¿§pı¿∏\036Ì¿ÆG·¿33”¿ˆ(º¿Öΰ¿ÆGâ¿ÖÎq¿)\\o¿ffv¿öôy¿" ; :creator_name = "Huan Meng, Ralph R Ferraro" ; :creator_url = "http://cics.umd.edu/AMSU-CDR/home.html" ; :creator_email = "[email protected], [email protected]" ; :institution = "DOC/NOAA/NESDIS/STAR/CoRP > Cooperative Research Program, Center for Satellite Applications and Research, NESDIS, NOAA, U.S. Department of Commerce" ; :processing_level = "NOAA level 2" ; :geospatial_lat_min = -89.5235f ; :geospatial_lat_max = 89.4035f ; :geospatial_lon_min = -179.9666f ; :geospatial_lon_max = 179.922f ; :geospatial_lat_units = "degrees_north" ; :geospatial_lon_units = "degrees_east" ; :spatial_resolution = "48km X 48km at nadir, 150km X 80km at limb" ; :time_coverage_start = "2008-07-18 01:32:33Z\000\000¯¿\\è˙¿)\\˜¿è¬ı¿§pı¿∏\036Ì¿ÆG·¿33”¿ˆ(º¿Öΰ¿ÆGâ¿ÖÎq¿)\\o¿ffv¿öôy¿" ; :time_coverage_end = "2008-07-18 03:16:41Z\000\000¯¿\\è˙¿)\\˜¿è¬ı¿§pı¿∏\036Ì¿ÆG·¿33”¿ˆ(º¿Öΰ¿ÆGâ¿ÖÎq¿)\\o¿ffv¿öôy¿" ; :time_coverage_duration = "P6248S\000¿öôI¿\037Ö[¿)\\o¿√ıà¿ÆGë¿∏\036ù¿Öα¿\n◊√¿33ª¿\\è ¿\037Ö€¿ÖΗ¿öô·¿ÕÃ\000¡R∏˛¿=\nÔ¿H·Ú¿öôŸ¿" ; :license = "No restrictions on access or use" ; :contributor_name = "TBD" ; :contributor_role = "TBD" ; group: Data_Fields variables: byte orbital_mode(nscan) ; orbital_mode:long_name = "satellite direction" ; orbital_mode:flag_values = 0b, 1b ; orbital_mode:flag_meanings = "northbound, southbound" ; orbital_mode:_FillValue = -1b ; byte surface_type_a1_1(nscan, npixel) ;

CDR Program AMSU-A/B/MHS TCDR for Hydrological Applications C-ATBD CDRP-ATBD-0804 Rev. 1 05/05/16
A controlled copy of this document is maintained in the CDR Program Library. Approved for public release, distribution is unlimited.
42
byte surface_type_a1_2(nscan, npixel) ; byte surface_type_a2(nscan, npixel) ; float earth_incidence_angle_a1_1(nscan, npixel) ; earth_incidence_angle_a1_1:long_name = "earth incidence angle for AMSU unit A1-1, e.g., 89.0 GHz" ; earth_incidence_angle_a1_1:scale_factor = 1.f ; earth_incidence_angle_a1_1:_FillValue = -999.f ; earth_incidence_angle_a1_1:units = "degree" ; earth_incidence_angle_a1_1:coordinates = "latitude_a1_1 longitude_a1_1" ; float earth_incidence_angle_a1_2(nscan, npixel) ; earth_incidence_angle_a1_2:long_name = "earth incidence angle for AMSU unit A1-2, e.g., 50.3 GHz" ; earth_incidence_angle_a1_2:scale_factor = 1.f ; earth_incidence_angle_a1_2:_FillValue = -999.f ; earth_incidence_angle_a1_2:units = "degree" ; earth_incidence_angle_a1_2:coordinates = "latitude_a1_2 longitude_a1_2" ; float earth_incidence_angle_a2(nscan, npixel) ; earth_incidence_angle_a2:long_name = "earth incidence angle for AMSU unit A2, including 23.8 GHz and 31.4 GHz" ; earth_incidence_angle_a2:scale_factor = 1.f ; earth_incidence_angle_a2:_FillValue = -999.f ; earth_incidence_angle_a2:units = "degree" ; earth_incidence_angle_a2:coordinates = "latitude_a2 longitude_a2" ; float solar_zenith_angle(nscan, npixel) ; solar_zenith_angle:standard_name = "solar zenith angle" ; solar_zenith_angle:long_name = "solar zenith angle for all AMSU-A units" ; solar_zenith_angle:scale_factor = 1.f ; solar_zenith_angle:_FillValue = -999.f ; solar_zenith_angle:units = "degree" ; ubyte product_quality_flag(nscan, nchan) ; product_quality_flag:long_name = "instrument/channel quality flag" ; product_quality_flag:Note = "The 8-bit quality flags are channel-specific. Users are advised not to use any scans for which the highest bit (bit 7) is set to 1. The lowest two bits (bits 0 and 1) are not used. The meanings of the bits are: bit 7 = Do not use scan for product generation; bit 6 = Calibration error; bit 5 = Time sequence error; bit 4 = Earth location questionable; bit 3 = Brightness temperature out of range; bit 2 = Lunar contamination warning; bit 1~0 = zero fill;" ; short TPW(nscan, npixel) ; TPW:long_name = "total precipitable water" ; short CLW(nscan, npixel) ; CLW:long_name = "cloud liquid water" ; short SIce(nscan, npixel) ; SIce:long_name = "sea ice" ; short T_sfc(nscan, npixel) ; T_sfc:long_name = "surface temperature" ; short Emis_23(nscan, npixel) ; Emis_23:long_name = "emissivity of 23 GHz" ; short Emis_31(nscan, npixel) ; Emis_31:long_name = "emissivity of 31 GHz" ; short Emis_50(nscan, npixel) ; Emis_50:long_name = "emissivity of 50 GHz" ; // group Data_Fields group: Geolocation_Time_Fields variables: float latitude_a1_1(nscan, npixel) ; latitude_a1_1:standard_name = "latitude" ; latitude_a1_1:long_name = "Latitude for AMSU unit A1-1, e.g., 89.0 GHz" ; latitude_a1_1:scale_factor = 1.f ; latitude_a1_1:lower_limit = -90.f ; latitude_a1_1:upper_limit = 90.f ; latitude_a1_1:_FillValue = -999.f ; latitude_a1_1:units = "degrees_north" ; float latitude_a1_2(nscan, npixel) ; latitude_a1_2:standard_name = "latitude" ; latitude_a1_2:long_name = "Latitude for AMSU unit A1-2, e.g., 53.0 GHz" ; latitude_a1_2:scale_factor = 1.f ; latitude_a1_2:lower_limit = -90.f ; latitude_a1_2:upper_limit = 90.f ; latitude_a1_2:_FillValue = -999.f ; latitude_a1_2:units = "degrees_north" ;
CDR Program AMSU-A/B/MHS TCDR for Hydrological Applications C-ATBD CDRP-ATBD-0804 Rev. 1 05/05/16
A controlled copy of this document is maintained in the CDR Program Library. Approved for public release, distribution is unlimited.
43
float latitude_a2(nscan, npixel) ; latitude_a2:standard_name = "latitude" ; latitude_a2:long_name = "Latitude for AMSU unit A2, including 23.8 GHz and 31.4 GHz" ; latitude_a2:scale_factor = 1.f ; latitude_a2:lower_limit = -90.f ; latitude_a2:upper_limit = 90.f ; latitude_a2:_FillValue = -999.f ; latitude_a2:units = "degrees_north" ; float longitude_a1_1(nscan, npixel) ; longitude_a1_1:standard_name = "longitude" ; longitude_a1_1:long_name = "Longitude for AMSU unit A1-1, e.g., 89.0 GHz" ; longitude_a1_1:scale_factor = 1.f ; longitude_a1_1:lower_limit = -180.f ; longitude_a1_1:upper_limit = 180.f ; longitude_a1_1:_FillValue = -999.f ; longitude_a1_1:units = "degrees_east" ; float longitude_a1_2(nscan, npixel) ; longitude_a1_2:standard_name = "longitude" ; longitude_a1_2:long_name = "Longitude for AMSU unit A1-2, e.g. 50.3 GHz" ; longitude_a1_2:scale_factor = 1.f ; longitude_a1_2:lower_limit = -180.f ; longitude_a1_2:upper_limit = 180.f ; longitude_a1_2:_FillValue = -999.f ; longitude_a1_2:units = "degrees_east" ; float longitude_a2(nscan, npixel) ; longitude_a2:standard_name = "longitude" ; longitude_a2:long_name = "Longitude for AMSU unit A2, including 23.8 GHz and 31.4 GHz" ; longitude_a2:scale_factor = 1.f ; longitude_a2:lower_limit = -180.f ; longitude_a2:upper_limit = 180.f ; longitude_a2:_FillValue = -999.f ; longitude_a2:units = "degrees_east" ; char scan_time(nscan, nchar) ; scan_time:standard_name = "time" ; scan_time:long_name = "Scan start time (UTC) in ISO8601 date/time (YYYY-MM-DD HH-MM-SSZ) format" ; scan_time:_FillValue = "0" ; double scan_time_since98(nscan) ; scan_time_since98:standard_name = "time" ; scan_time_since98:long_name = "Scan start time (UTC) in a referenced or elapsed time format" ; scan_time_since98:_FillValue = 0. ; scan_time_since98:units = "seconds since 1998-01-01 00:00:00Z" ; // group Geolocation_Time_Fields

CDR Program AMSU-A/B/MHS TCDR for Hydrological Applications C-ATBD CDRP-ATBD-0804 Rev. 1 05/05/16
A controlled copy of this document is maintained in the CDR Program Library. Approved for public release, distribution is unlimited.
44
Appendix D. Sample AMSU-B/MHS TCDR File Format netcdf CICS_V00R01_AMSUB_TCDR_N16_D05002_S015739_E035054_B2206263 dimensions: nscan = 2549 ; npixel = 90 ; nchar = 20 ; nchan = 5 ; // global attributes: :Conventions = "CF-1.5" ; :Metadata_Conventions = "CF-1.5, Unidata Dataset Discovery v1.0, NOAA CDR v1.0, GDS v2.0" ; :standard_name_vocabulary = "CF Standard Name Table (v18, 22 July 2011)" ; :id = "CICS_V00" ; :naming_authority = "gov.noaa.ncdc" ; :metadata_link = "gov.noaa.ncdc:TBD" ; :title = "CICS Version-1 AMSUB TCDR" ; :product_version = "v00r02" ; :date_issued = "TBD" ; :summary = "TBD" ; :keywords = "EARTH SCIENCE > SPECTRAL/ENGINEERING > MICROWAVE > BRIGHTNESS TEMPERATURE" ; :keywords_vocabulary = "NASA Global Change Master Directory (GCMD) Earth Science Keywords, Version 6.0" ; :platform = "NOAA-16 > National Oceanic and Atmospheric Administration - 16" ; :sensor = "AMSU-B/MHS > Advanced Microwave Sounding Unit - B / Microwave Humidity Sounder" ; :cdm_data_type = "Swath" ; :cdr_program = "NOAA Climate Data Record Program for satellites, FY 2011" ; :cdr_variable = "RR, Snow, IWP, SWE, De" ; :source = "CICS_V00R01_AMSUA_FCDR_N16_D05002_S015739_E035043_B2206263.nc" ; :refrences = "TBD" ; :history = "TBD" ; :date_created = "2016-01-20 21:14:16Z" ; :creator_name = "Huan Meng, Ralph R Ferraro" ; :creator_url = http://cics.umd.edu/AMSU-CDR/home.html" ; :creator_email = "[email protected], [email protected]" ; :institution = "DOC/NOAA/NESDIS/STAR/CoRP > Cooperative Research Program, Center for Satellite Applications and Research, NESDIS, NOAA, U.S. Department of Commerce" ; :processing_level = "NOAA level 2" ; :geospatial_lat_min = 16.515f ; :geospatial_lat_max = 89.92595f ; :geospatial_lon_min = -179.999f ; :geospatial_lon_max = 180.f ; :geospatial_lat_units = "degrees_north" ; :geospatial_lon_units = "degrees_east" ; :spatial_resolution = "16km X 16km at nadir, 50km X 27km at limb" ; :time_coverage_start = "2005-01-02 01:57:39Z" ; :time_coverage_end = "2005-01-02 03:50:54Z" ; :time_coverage_duration = "P6795S" ; :license = "No restrictions on access or use" ; :contributor_name = "TBD" ; :contributor_role = "TBD" ; group: Data_Fields variables: byte orbital_mode(nscan) ; orbital_mode:long_name = "satellite direction" ; orbital_mode:flag_values = 0b, 1b ;
CDR Program AMSU-A/B/MHS TCDR for Hydrological Applications C-ATBD CDRP-ATBD-0804 Rev. 1 05/05/16
A controlled copy of this document is maintained in the CDR Program Library. Approved for public release, distribution is unlimited.
45
orbital_mode:flag_meanings = "northbound, southbound" ; orbital_mode:_FillValue = -1b ; byte surface_type(nscan, npixel) ; float earth_incidence_angle(nscan, npixel) ; earth_incidence_angle:long_name = "earth incidence angle for AMSU-B/MHS" ; earth_incidence_angle:scale_factor = 1.f ; earth_incidence_angle:_FillValue = -99.f ; earth_incidence_angle:units = "degree" ; earth_incidence_angle:coordinates = "latitude longitude" ; float solar_zenith_angle(nscan, npixel) ; solar_zenith_angle:standard_name = "solar zenith angle" ; solar_zenith_angle:long_name = "solar zenith angle for AMSU-B/MHS" ; solar_zenith_angle:scale_factor = 1.f ; solar_zenith_angle:_FillValue = -99.f ; solar_zenith_angle:units = "degree" ; byte product_quality_flag(nscan, nchan) ; product_quality_flag:long_name = "instrument/channel quality flag" ; product_quality_flag:Note = "The 8-bit quality flags are channel-specific. Users are advised not to use any scans for which the highest bit (bit 7) is set to 1. The lowest two bits (bits 0 and 1) are not used. The meanings of the bits are: bit 7 = Do not use scan for product generation; bit 6 = Calibration error; bit 5 = Time sequence error; bit 4 = Earth location questionable; bit 3 = Brightness temperature out of range; bit 2 = Lunar contamination warning; bit 1~0 = zero fill;" ; short RR(nscan, npixel) ; RR:long_name = "Rain Rate" ; RR:scale_factor = 10.f ; RR:lower_limit = 0.f ; RR:upper_limit = 30.f ; RR:fill_value = -99.f ; RR:INDETERM_COAST = -9.f ; RR:INDETERM_FROZEN = -13.f ; RR:units = "mm/hr" ; RR:coordinates = "latitude longitude" ; short Snow(nscan, npixel) ; Snow:long_name = "Snow Cover" ; Snow:scale_factor = 1.f ; Snow:lower_limit = 0.f ; Snow:upper_limit = 100.f ; Snow:fill_value = -99.f ; Snow:INDETERM = -10.f ; Snow:INDETERM_RAIN = -6.f ; Snow:INDETERM_DESSERT = -11.f ; Snow:units = "%" ; Snow:coordinates = "latitude longitude" ; short IWP(nscan, npixel) ; IWP:long_name = "Ice Water Path" ; IWP:scale_factor = 100.f ; IWP:lower_limit = 0.f ; IWP:upper_limit = 3.f ; IWP:fill_value = -99.f ; IWP:INDETERM = -10.f ; IWP:INDETERM_SNOW = -7.f ; IWP:INDETERM_SICE = -8.f ; IWP:INDETERM_FROZEN = -13.f ; IWP:INDETERM_DESERT = -11.f ; IWP:INDETERM_ELEV = -12.f ; IWP:units = "kg/m^2" ; IWP:coordinates = "latitude longitude" ; short SWE(nscan, npixel) ; SWE:long_name = "Snow Water Equivalent" ; SWE:scale_factor = 100.f ; SWE:lower_limit = 0.f ; SWE:upper_limit = 30.f ;

CDR Program AMSU-A/B/MHS TCDR for Hydrological Applications C-ATBD CDRP-ATBD-0804 Rev. 1 05/05/16
A controlled copy of this document is maintained in the CDR Program Library. Approved for public release, distribution is unlimited.
46
SWE:fill_value = -99.f ; SWE:INDETERM_MULTI_YEAR_ICE = -14.f ; SWE:units = "cm" ; SWE:coordinates = "latitude longitude" ; short De(nscan, npixel) ; De:long_name = "Effective Diameter" ; De:scale_factor = 100.f ; De:lower_limit = 0.f ; De:upper_limit = 3.5f ; De:fill_value = -99.f ; De:INDETERM = -10.f ; De:INDETERM_SNOW = -7.f ; De:INDETERM_SICE = -8.f ; De:INDETERM_FROZEN = -13.f ; De:INDETERM_DESERT = -11.f ; De:INDETERM_ELEV = -12.f ; De:units = "mm" ; De:coordinates = "latitude longitude" ; // group Data_Fields group: Geolocation_Time_Fields variables: float latitude(nscan, npixel) ; latitude:standard_name = "latitude" ; latitude:long_name = "Latitude for AMSU-B/MHS" ; latitude:scale_factor = 1.f ; latitude:lower_limit = -90.f ; latitude:upper_limit = 90.f ; latitude:_FillValue = -99.f ; latitude:units = "degrees_north" ; float longitude(nscan, npixel) ; longitude:standard_name = "longitude" ; longitude:long_name = "Longitude for AMSU-B/MHS" ; longitude:scale_factor = 1.f ; longitude:lower_limit = -180.f ; longitude:upper_limit = 180.f ; longitude:_FillValue = -99.f ; longitude:units = "degrees_east" ; char scan_time(nscan, nchar) ; scan_time:standard_name = "time" ; scan_time:long_name = "Scan start time (UTC) in ISO8601 date/time (YYYY-MM-DD HH-MM-SSZ) format" ; scan_time:_FillValue = "0" ; double scan_time_since98(nscan) ; scan_time_since98:standard_name = "time" ; scan_time_since98:long_name = "Scan start time (UTC) in a referenced or elapsed time format" ; scan_time_since98:_FillValue = 0. ; scan_time_since98:units = "seconds since 1998-01-01 00:00:00Z" ;