climate like any other physical phenomenon is not - vvrias · pdf filein the extreme north...
TRANSCRIPT


Climate like any other physical phenomenon is notstatic but rather a fairly dynamic kind of thing. Ingreater or lesser degree it is ever changing. Tillrecently, the concept of climatic change wasconsidered of academic importance. It was onlyduring the past few decades that scientists began torecognize the inherent variability of climate on alltime scales. Climate change is the long-termvariability associated with the earth ocean climatesystem. In fact the growth and decline of past humancivilizations and other species of plants and animalsas well as the formulation of future public policyregarding all elements of human life depend on theclimate and its change.
Instrumental records of climatic elements areavailable only for the last hundred years or so.Therefore, reconstruction of past climates is donethrough indirect evidences. These evidences arebased on the findings of geology, geomorphology,botany, zoology, anthropology, glaciology,archaeology, geophysics, meteorology,oceanography, historical records and a host of otherrelated disciplines.
Fossilized remains of animal and plant life helpto determine the duration and areal extent ofclimatic conditions obtained in distant geologicpast. For e.g., fossilized pollen of Armeria sibiricaunearthed f rom sedimentary rocks inMassachusetts suggest that the cl imaticconditions there must have been similar to thosein the extreme north Canada at present.
Study of ocean floor deposits and analysis ofoxygen isotopes help in reconstruction oftemperatures as they fluctuated in geologic past.
Oxygen isotope analysis determines the periodsof glacial activity by measuring the ratiobetween two isotopes of oxygen. 16O (mostcommon) and 18O (heavier). Heavier precipitationleaves a greater concentration of the heavierisotope. It is so because the lighter isotopeevaporates more readily from the sea-surface.Thus, the greater concentration of the heavierisotope in sea water indicates extensive glacialactivity. Conversely, a marked drop in theconcentration of 18O is suggestive of warmerinter-glacial period.
Another technique to reconstruct the pastclimates is the analysis of the annual growth oftree rings. This of course, reveals the history oflocal climate.
Similarly the study of paleosols (buried soils)helps in exploring the past conditions of localclimate.
Considerable help is also taken from the studyof historical records which contains valuableinformation about draughts, floods, severestorms and other climatic extremes. Recordsof large-scale migration of peoples from oneregion to another and the nature of cropsproduced also give invaluable clues to pastclimatic conditions.
Before describing the Climate change it mustbe pointed out that the earth’s geological historyis divided into four main periods. Pre-Cambrian(Archaeozoic and Proterzoic) Paleozoic;Mesozoic; and Cenozoic (Tert iary andQuaternary).
1
VVR-IAS: 53/5, OLD RAJINDER NAGAR MARKET, DELHI-60 Ph: 011-45596505, 09999329111
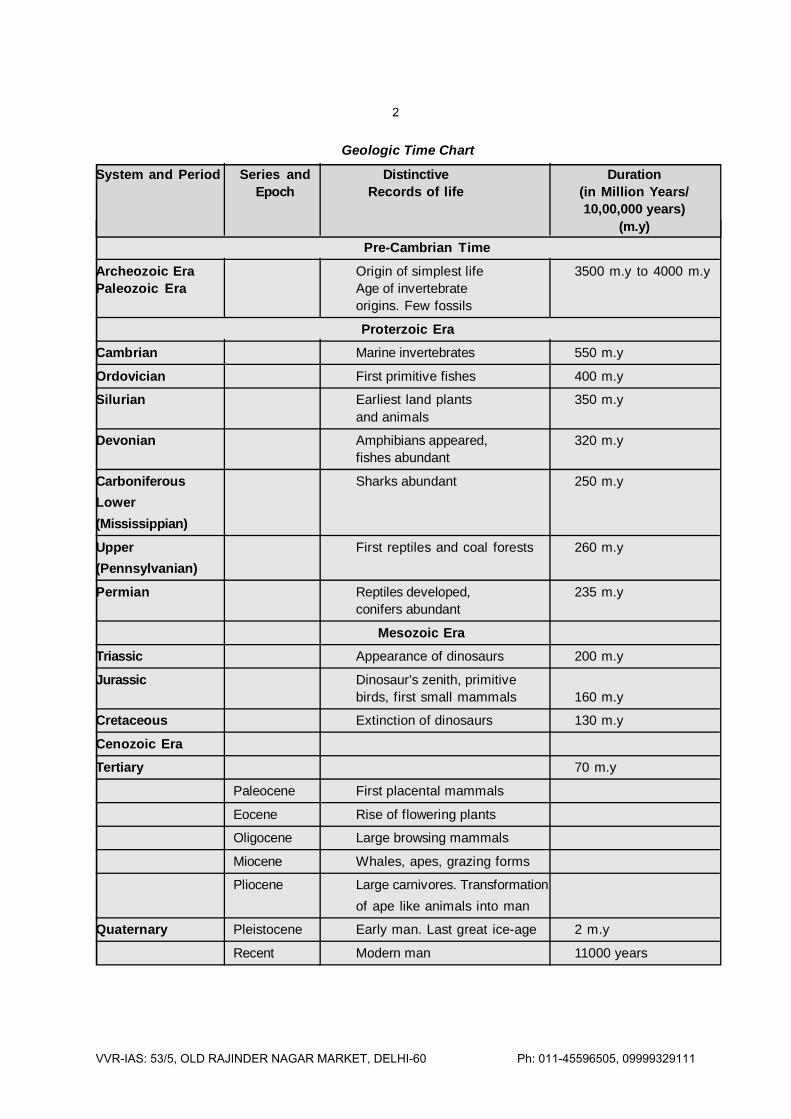
System and Period Series and Distinctive DurationEpoch Records of life (in Million Years/
10,00,000 years)(m.y)
Pre-Cambrian Time
Archeozoic Era Origin of simplest life 3500 m.y to 4000 m.yPaleozoic Era Age of invertebrate
origins. Few fossils
Proterzoic Era
Cambrian Marine invertebrates 550 m.y
Ordovician First primitive fishes 400 m.y
Silurian Earliest land plants 350 m.yand animals
Devonian Amphibians appeared, 320 m.yfishes abundant
Carboniferous Sharks abundant 250 m.yLower(Mississippian)
Upper First reptiles and coal forests 260 m.y(Pennsylvanian)
Permian Reptiles developed, 235 m.yconifers abundant
Mesozoic Era
Triassic Appearance of dinosaurs 200 m.y
Jurassic Dinosaur’s zenith, primitivebirds, first small mammals 160 m.y
Cretaceous Extinction of dinosaurs 130 m.y
Cenozoic Era
Tertiary 70 m.y
Paleocene First placental mammals
Eocene Rise of flowering plants
Oligocene Large browsing mammals
Miocene Whales, apes, grazing forms
Pliocene Large carnivores. Transformationof ape like animals into man
Quaternary Pleistocene Early man. Last great ice-age 2 m.y
Recent Modern man 11000 years
Geologic Time Chart
2
VVR-IAS: 53/5, OLD RAJINDER NAGAR MARKET, DELHI-60 Ph: 011-45596505, 09999329111
At intervals of many tens of millions of years,geological history has been punctuated by five orsix glacial episodes, the oldest known being about2500 million years ago. The last three occurred atthe beinginning of the Cambrian (550 million yearago); during the late carboniferous and Permianperiod (250 m.y) and in Pleistocene or QuarternaryIce Age (the last 2 m.y).
Flandrian Postglacial Changes: With the finalretreat of the glaciers around 10,000 years ago (8000B.C). the climate rapidly ameliorated in middle andhigher latitudes. A thermal maximum some 2–3oCwarmer than now was reached between 5000 and3000 B.C
The period 1550 to 1800 has been called ‘the LittleIce Age’, because in it the glaciers of the mountainsof Europe reached their most advanced positionssince the beginning of the postglacial epoch. Thisadvance has left well marked terminal moraines,known collectively as the neoglacial maximumlimit.
Pluvial periods: During the glacial periods theprecipitation is estimated to be greater than duringthe inter-glacial periods in tropical and subtropicalregions. The pluvial periods were separated by inter-pluvial periods when most of the lakes dried up.
On the basis of instrumental records and weatherdiaries it may be concluded that during the past100-200 years there have been many changes intemperature, precipitation and other climaticelements. The most significant aspect of thesechanges has been the world-wide cl imaticamelioration from the 1830s to the 1930s. This isthe first climatic change that can be measured andplotted on maps. The present climatic phaseresembles the warmer periods in the Middle Ages.Investigations have shown that the intensification ofthe general circulation has continued from about 1800to the 1920s in the northern and the southernhemispheres. This has led to the most rapidshrinkage of the Arctic ice. The pronounced effect ofthe intensified atmospheric circulation has been thatthe extent of the oceanic influence has increased,particularly during the winter months. Very low surfacetemperatures over the continents became rare. Thus,in winter the gradients of surface temperature showed
a declining trend. On the contrary, the temperaturegradient in summer increased. After 1850, winters,according to meteorological records, becameprogressively warmer in all polar and temperateregions. However, a reversal of this tendency isindicated by the colder winters beginning from themiddle of the twentieth century.
REGIONAL AND GLOBAL VARIATIONS
To gain some insight into the cause of climatevariation, it is worth nothing at the outset that somechanges appear to occur on a global scale, butmany others, particularly those of a short-termnature, are regional —that is, they are climaticchanges characterized by an excess of heat ofprecipitation in one region, but often matched by acorresponding deficiency in another, without meanglobal values being affected. As long as the amountof radiation from the sun, the solar constant, reallydoes remain constant, then the mean global valuesof temperature, evaporation and total precipitationshould remain unchanged, unless the compositionof the atmosphere (e.g. ozone, carbon dioxidecontent) is altered in some way. However, one of themost significant discoveries of the last decade isthat these global values are not constant. This mayseem minor, but is substantial considering the volumeof water involved, and has had the side-effect ofslightly raising sea-level.
THE LINK WITH GENERALCIRCULATION
There seems little doubt that the immediate causeof recent climate fluctuations is linked to the strengthof the general circulation, particularly in the northernhemisphere westerlies and in the trade winds. Theeffect of an intensified atmospheric circulation is toincrease the extent of oceanic influence, especiallyin winter, thereby raising mean temperatures. H. H.Lamb has made a particular study of this thesis.He has shown that the beginnings of climaticamelioration in Europe in the 1820s were linked toa pronounced increase in the vigour of the westerliesover the North Atlantic. This was accompanied by anorthward shift in depression tracks, which reached
3
VVR-IAS: 53/5, OLD RAJINDER NAGAR MARKET, DELHI-60 Ph: 011-45596505, 09999329111

their most northerly mean positions in the 1920sand 1930s. At the same time, the mean pressure ofthe Icelandic low deepened, whereas that of theAzores high and the winter Siberian high increased,resulting in increased pressure gradients over theNorth Atlantic and Europe. It has been suggestedthat increased precipitation in Antarctica may relateto the higher incidence of storm in this century.
WHAT CAUSES CLIMATES TO CHANGE?
There is little doubt that changes in Earth-Sunrelationships may be a basic cause of long-termclimatic change. In conjunction with other factorsthe human activity is now a major factor influencingclimate change.
There is a close relationship between theirradiance of the sun and the climate of earth. Adecline of 2 percent irradiance of the sun for 50years would be enough to cause renewed glaciations.A drop of 5 per cent should be adequate to bringabout a major glaciations of the Earth. For the timeassociated with human civilization which hashistorical records, diaries, planting records, clothingand use of building material, the Global climate hasundergone more or less cyclic variations. Every onemillion years there had been alternating glacial andinter-glacial episodes.
Solar Cycles: If we take the argument one stagefurther and look for the key to these circulationchanges, we inevitably return to the fundamentalfactors of the Earth’s energy budget. The linkbetween the distribution of energy and the circulationhas been stressed several times in the book.Climatologist have searched repeatedly for periodtrends in the record of climatic fluctuations, andhave particularly explored the possibility of a linkwith the well-known solar cycles.
Changes in Atmospheric Composition: Anotherpossible cause of interference in the Earth’satmospheric budget are changes in the compositionof the atmosphere.
Independent of any solar activity, the amount ofcarbon dioxide seems to bear a relationship withtemperatures.
Attempts have been made to relate climatic changeto variations in the Earth’s attitude as a planet. Thisconnection has been invoked in a number of theoriesexplaining the glacial/interglacial fluctuations withinthe Pleistocene Ice Age. The earth revolves aroundthe sun in a elliptical orbit, and at the same timerotates itself every 24 hours on an axis inclined at23½o to the plane of the orbit. At the present time,summer occurs in the northern hemisphere whenthe Earth is farthest away from the sun (aphelion),and the southern summer when it is nearest(perihelion). It is known that over long periods oftime the shape of the elliptical orbit changesbecause of different arrangements of planets in thesolar system: the angle of tilt can vary from 21½ to24½; and that the seasons will gradually swop over.The latter effect is known as the precession of theequinoxes.
These astronomical oscillations have been called‘the pacemakers of ice ages’, for although theymay not cause ice ages, many scientists agree thatthey do control the succession of glacial andinterglacial stages within them.
Continental drifting: Another suggestion is thatglaciations is linked to continental drifting. TheEwing-Donn theory proposes that Pleistoceneglaciations was initiated when, relatively speaking,the North Pole reached its present position in themiddle of the Arctic ocean, and Antarctica becamecoincident with the south polar region.
These theories are based on the presumption thatsome 300 million years ago all the continents werejoined together to form the super-continent‘Pangaea’. It was located at high latitudes far tothe south of their present positions. AlthoughPangaea was centered on the equator, its southern-most part included the South Pole. There was a riftin the Pangaea, and gradually it broke up into theseparate continents that we know at present. Thesecontinents drifted apart to occupy their presentposition.
According to the plate tectonic theory, all theseregions having glacial features were joined togetherto make one universal continent called Pangaea.This super continent was situated farther from the
4
VVR-IAS: 53/5, OLD RAJINDER NAGAR MARKET, DELHI-60 Ph: 011-45596505, 09999329111

present positions of its component parts. Later onthis super continent broke apart. Each piece driftedtowards its present position moving on a differentplate. This revolutionary theory emerging from geologythus explains how large fragments of glaciated terrainreached their scattered subtropical locations.
Since the plates move at a very slow rate of only afew centimeters per year, significant changes in thepositions of continents occur over large scales ofgeological time. Therefore large-scale climaticchanges also happen in millions of years.
Radiation and Relief : Some tentative progresshas been made in recent years in linking short-timeregional climatic changes with changes in the generalcirculation of the globe. However, there is no generalagreement as the causes of long-term climaticchange. It may be that a combination of causes isthe answer R.F. Flint has suggested a solartopographic model, which puts forward the ideathat radiation and relief factors combined arenecessary to cause an ice age.Atmospheric C-14: Variation in the emission of solarradiation determines the concentration ofatmospheric C-14. It has been argued that the majorintervals of high atmospheric C-14 activity coincideswith periods of neo-glacial expansion while theintervals of relatively low C-14 activity coincide withintervals of glacier contraction.
THEORIES ON CLIMATE CHANGE
1. The sunspot theory, 2. variation in atmosphericdust theory 3. Human induced greenhouse-gasestheory, 4. Earth orbital eccentricity theory, 5.Extraterrestrial impact theory and the passage ofearth through an interstellar dust theory.
1. THE SUNSPOT THEORY
Sunspots are the most conspicuous features on thesolar surface which appear as dark spots. Thesunspots are simply the huge magnetic storms thatoccur on the sun’s surface. There is a closerelationship between the solar activity and the numberof sunspots. The number of sunspots increases and
decreases in a cyclic manner. It may be pointed outthat sunspots are a sign of increased solar activity.
Many attempts have been made to link the well-known sunspot cycle of 11.2 years withmeteorological events, but results have beenconflicting. Another possibility is that a significantdouble cycle of 22 years exists within the pattern ofthe general circulation, and involves, among otherthings, the frequency of blocking anticyclones overEurope.
Changes in the upper atmosphere may be crucial.A recent hypothesis suggest that ozone becomesmore abundant at a certain time in the sunspotcycle. The effect of the increase is to warm thestratosphere and weaken the sub-tropical highpressure belt and in turn the westerlies circulation,causing a period of lower rainfall.
2. VARIATION IN ATMOSPHERIC DUST THEORY
Volcanic dust, because of the size of its particles,deflects light of short wavelengths coming from thesun. But long wave terrestrial radiation can easilypass through volcanic dust without any loss. It is,therefore, natural that large-scale volcanic dust maylower down the earth’s temperature to a certainextent. The large amount of volcanic dust present inthe atmosphere is possibly one of the causes of the‘Little Ice Age’. According to this theory, the iceages are supposed to be initiated during epochs offrequent volcanic eruptions.
3. HUMAN INDUCED GREENHOUSE GASES THEORY
Anthropogenic causes of climate change
Human activities are considered largely responsiblein enhancing the greenhouse effect.
A. Increase in Air temperature
The air temperature are temperature are the highestsince recordings were begun in earnest more than100 years ago. This is the result of emission ofcarbon dioxide and greenhouse gases from humanactivity including industrial processes, fossil fuelcombustion, deforestation and change, in the landuse patterns.
5
VVR-IAS: 53/5, OLD RAJINDER NAGAR MARKET, DELHI-60 Ph: 011-45596505, 09999329111
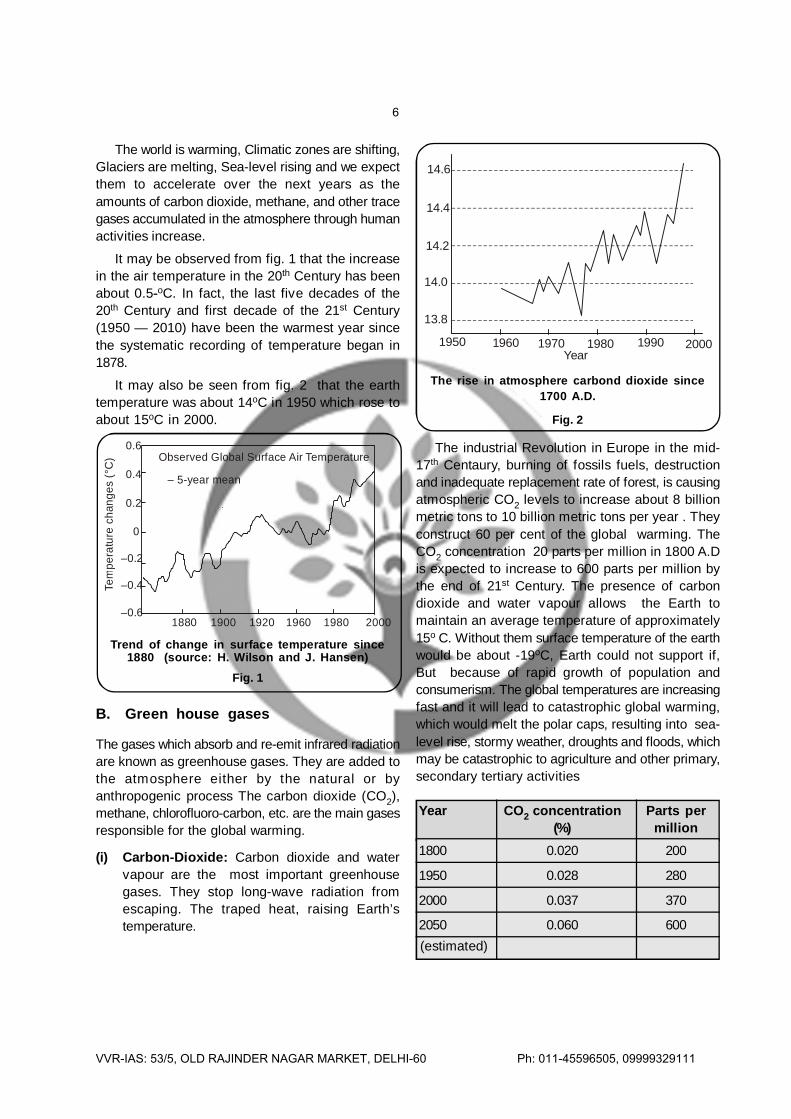
The world is warming, Climatic zones are shifting,Glaciers are melting, Sea-level rising and we expectthem to accelerate over the next years as theamounts of carbon dioxide, methane, and other tracegases accumulated in the atmosphere through humanactivities increase.
It may be observed from fig. 1 that the increasein the air temperature in the 20th Century has beenabout 0.5oC. In fact, the last five decades of the20th Century and first decade of the 21st Century(1950 — 2010) have been the warmest year sincethe systematic recording of temperature began in1878.
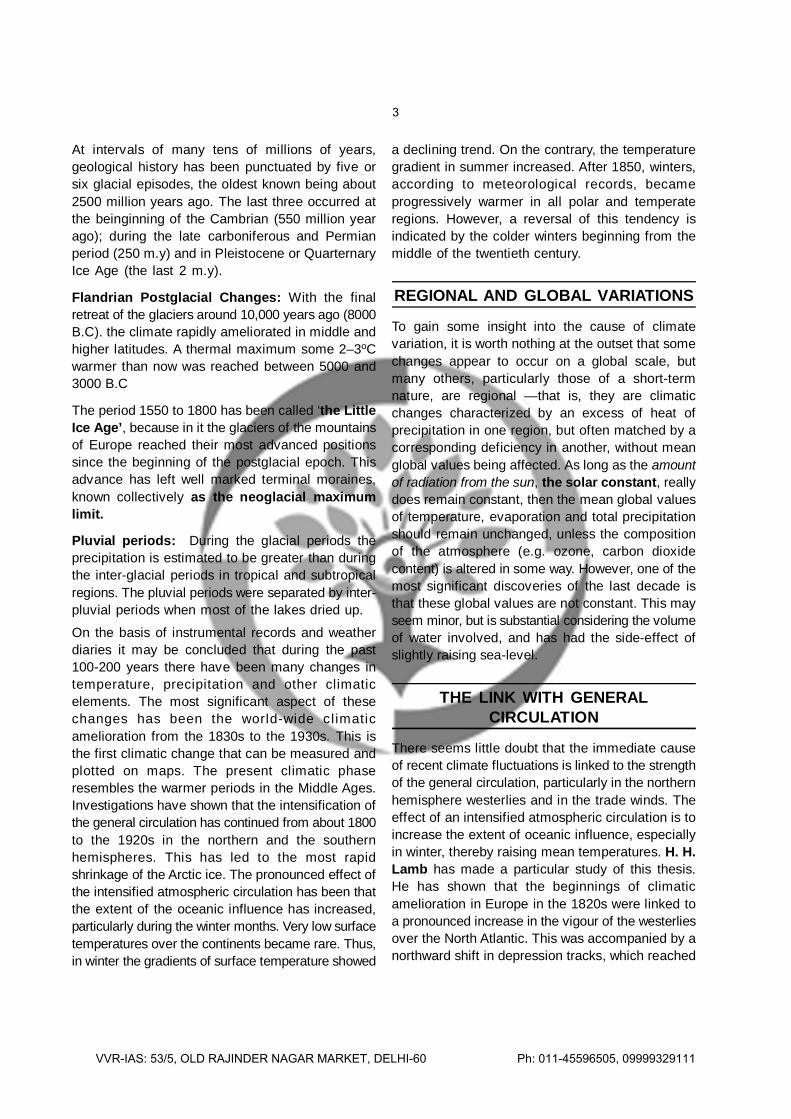
It may also be seen from fig. 2 that the earthtemperature was about 14oC in 1950 which rose toabout 15oC in 2000.
0.6
0.4
0.2
0
–0.2
–0.4
–
0.61880 1900 1920 1960 1980 2000
Observed Global Surface Air Temperature
– 5-year mean
Tem
pera
ture
chan
ges
(°C
)
Trend of change in surface temperature since1880 (source: H. Wilson and J. Hansen)
Fig. 1
B. Green house gases
The gases which absorb and re-emit infrared radiationare known as greenhouse gases. They are added tothe atmosphere either by the natural or byanthropogenic process The carbon dioxide (CO2),methane, chlorofluoro-carbon, etc. are the main gasesresponsible for the global warming.
(i) Carbon-Dioxide: Carbon dioxide and watervapour are the most important greenhousegases. They stop long-wave radiation fromescaping. The traped heat, raising Earth’stemperature.
14.6
14.4
14.2
14.0
13.8
1950 1960 1970 1980 1990 2000Year
The rise in atmosphere carbond dioxide since1700 A.D.
Fig. 2
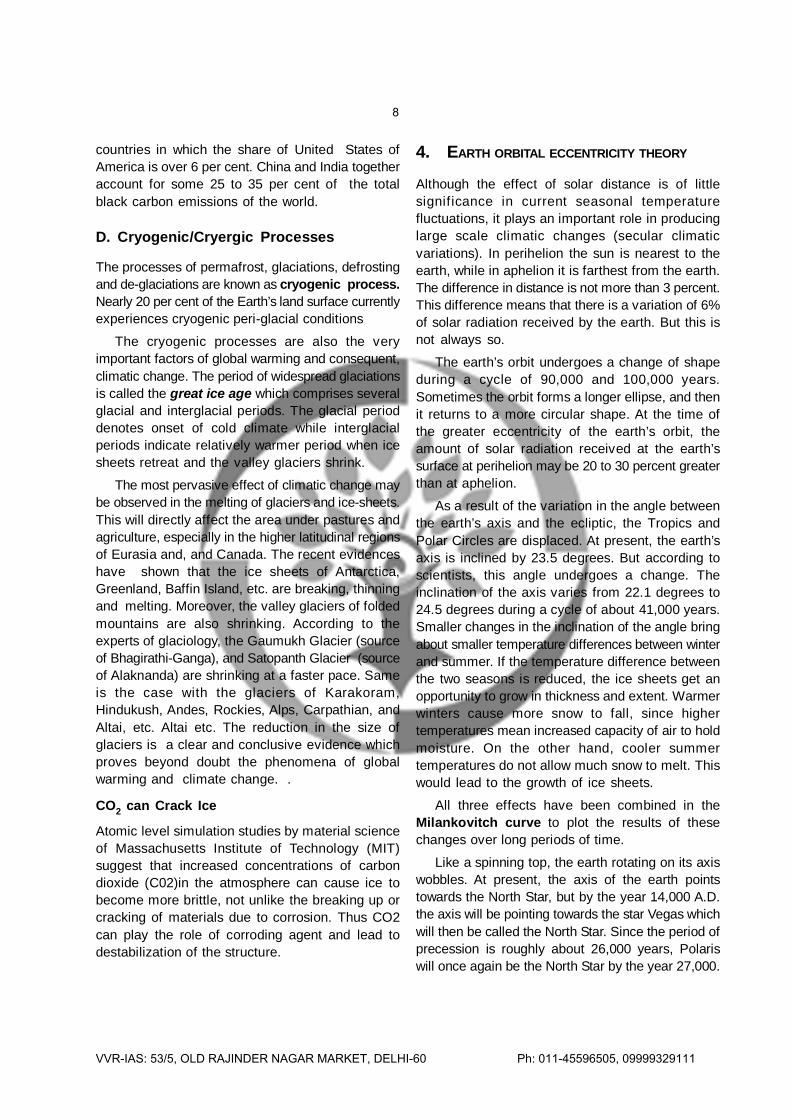
The industrial Revolution in Europe in the mid-17th Centaury, burning of fossils fuels, destructionand inadequate replacement rate of forest, is causingatmospheric CO2 levels to increase about 8 billionmetric tons to 10 billion metric tons per year . Theyconstruct 60 per cent of the global warming. TheCO2 concentration 20 parts per million in 1800 A.Dis expected to increase to 600 parts per million bythe end of 21st Century. The presence of carbondioxide and water vapour allows the Earth tomaintain an average temperature of approximately15o C. Without them surface temperature of the earthwould be about -19oC, Earth could not support if,But because of rapid growth of population andconsumerism. The global temperatures are increasingfast and it will lead to catastrophic global warming,which would melt the polar caps, resulting into sea-level rise, stormy weather, droughts and floods, whichmay be catastrophic to agriculture and other primary,secondary tertiary activities
Year CO2 concentration Parts per(%) million
1800 0.020 200
1950 0.028 280
2000 0.037 370
2050 0.060 600 (estimated)
6
VVR-IAS: 53/5, OLD RAJINDER NAGAR MARKET, DELHI-60 Ph: 011-45596505, 09999329111

360
350
340
330
320
310
300
290
280
2701700 1800 1900 2000 2100Year
CO
Con
cent
ratio
ns(p
pmby
volu
me)
2
Fig. 3: The rise in atmosphere carbon dioxidesince 1700 AD
Since the beginning of the Industrial Revolutionin Britain and Europe (1779), apart from theatmospheric concentration of carbon dioxide,methane concentrations have more than doubled,and nitrous oxide concentrations have risen by about15 per cent. The enhancement in temperature as,consequently, increased the temperature trappingcapability of the Earth’s atmosphere
(ii) Methane: Another radioactive active gascontributing to the overall greenhouse effect ismethane (CH4), which is increasing inconcentration at about 1 per cent per year.Methane is generated by organic processes,such as digestion and rotting in the absenceof oxygen (anaerobic processes).About 50 percent of the excess methane being producedcomes from bacterial action in the intestinaltracts of livestock and from under- water bacteriain rice f ields. Methane is now believedresponsible for at least 12 per cent of the totalatmospheric warming, complementing thewarming caused by the build-up of CO2 andequaling about one-half the contribution of CFCs.
(iii) Chlorofluorocarbon (CFCs): Chlorofluorocarbongases are produced large manufacturedmolecules ( polymers) containing chlorine,fluorine, and carbon. These gases possessremarkable heat properties. After slow transportto the stratosphere ozone layer CFCs react withultraviolet radiation freeing chlorine atoms thatact as a catalyst to produce reactions that
destroy ozone. Chlorofluorocarbon (CFCs) arethought to contribute about 25. per cent of theglobal warming. As stated above, CFCs absorbinfrared-in wavelength missed by carbon dioxideand water vapour in the lower troposphere. Asrelatively active gases, CFCs enhance thegreenhouse effect, and also play negative rolein stratospheric ozone depletion.
C. BIack Carbon on Climate Change
Black Carbon influences the climate in the followingtwo ways given below:
(i) When suspended in air, Black Carbon absorbssunlight and generates heat in the atmosphere,which warm the air and can affect regional cloudformation and precipitation patterns.
(ii) When deposited on snow and ice, it absorbssunlight, again generating heat, which warmsboth the air above and the snow and ice below,this accelerating melting.
Because the black carbon remains in theatmosphere for only one to four weeks, its climateeffects are strongly regional. Its short lifetime alsomeans that its climate effects would dissipate quicklyif black carbon emission were reduced, thusbenefitting most directly the countries of communitiesthat invest in policies to reduce black carbonemission.
According to experts, the black carbon may beresponsible for more than 30 per cent of recentwarming in the Arctic contributing to the accelerationof Arctic Ocean’s ice melting. Loss of ice of theArctic Ocean would lead to more rapid warming andpossibly irreversible climate change. Black Carbonmay also be driving some of the observed reductionof the snowpack in the Pacific Northwest of NorthAmerica.
Different types of soot has different amounts ofblack carbon-generally the blacker the soot, the morewarming agent it is. Fossil fuel and bio-fuel soot areblacker than soot from biomass burning, which isgenerally more of a brownish colour. Thus, controllingemissions of soot from fuel sources is an effectiveway of reducing atmospheric temperatures in-theshort term. Based on current information, most ofthe black carbon emissions come from the developed
7
VVR-IAS: 53/5, OLD RAJINDER NAGAR MARKET, DELHI-60 Ph: 011-45596505, 09999329111
countries in which the share of United States ofAmerica is over 6 per cent. China and India togetheraccount for some 25 to 35 per cent of the totalblack carbon emissions of the world.
D. Cryogenic/Cryergic Processes
The processes of permafrost, glaciations, defrostingand de-glaciations are known as cryogenic process.Nearly 20 per cent of the Earth’s land surface currentlyexperiences cryogenic peri-glacial conditions
The cryogenic processes are also the veryimportant factors of global warming and consequent,climatic change. The period of widespread glaciationsis called the great ice age which comprises severalglacial and interglacial periods. The glacial perioddenotes onset of cold climate while interglacialperiods indicate relatively warmer period when icesheets retreat and the valley glaciers shrink.
The most pervasive effect of climatic change maybe observed in the melting of glaciers and ice-sheets.This will directly affect the area under pastures andagriculture, especially in the higher latitudinal regionsof Eurasia and, and Canada. The recent evidenceshave shown that the ice sheets of Antarctica,Greenland, Baffin Island, etc. are breaking, thinningand melting. Moreover, the valley glaciers of foldedmountains are also shrinking. According to theexperts of glaciology, the Gaumukh Glacier (sourceof Bhagirathi-Ganga), and Satopanth Glacier (sourceof Alaknanda) are shrinking at a faster pace. Sameis the case with the glaciers of Karakoram,Hindukush, Andes, Rockies, Alps, Carpathian, andAltai, etc. Altai etc. The reduction in the size ofglaciers is a clear and conclusive evidence whichproves beyond doubt the phenomena of globalwarming and climate change. .
CO2 can Crack Ice
Atomic level simulation studies by material scienceof Massachusetts Institute of Technology (MIT)suggest that increased concentrations of carbondioxide (C02)in the atmosphere can cause ice tobecome more brittle, not unlike the breaking up orcracking of materials due to corrosion. Thus CO2can play the role of corroding agent and lead todestabilization of the structure.
4. EARTH ORBITAL ECCENTRICITY THEORY
Although the effect of solar distance is of littlesignificance in current seasonal temperaturefluctuations, it plays an important role in producinglarge scale climatic changes (secular climaticvariations). In perihelion the sun is nearest to theearth, while in aphelion it is farthest from the earth.The difference in distance is not more than 3 percent.This difference means that there is a variation of 6%of solar radiation received by the earth. But this isnot always so.
The earth’s orbit undergoes a change of shapeduring a cycle of 90,000 and 100,000 years.Sometimes the orbit forms a longer ellipse, and thenit returns to a more circular shape. At the time ofthe greater eccentricity of the earth’s orbit, theamount of solar radiation received at the earth’ssurface at perihelion may be 20 to 30 percent greaterthan at aphelion.
As a result of the variation in the angle betweenthe earth’s axis and the ecliptic, the Tropics andPolar Circles are displaced. At present, the earth’saxis is inclined by 23.5 degrees. But according toscientists, this angle undergoes a change. Theinclination of the axis varies from 22.1 degrees to24.5 degrees during a cycle of about 41,000 years.Smaller changes in the inclination of the angle bringabout smaller temperature differences between winterand summer. If the temperature difference betweenthe two seasons is reduced, the ice sheets get anopportunity to grow in thickness and extent. Warmerwinters cause more snow to fall, since highertemperatures mean increased capacity of air to holdmoisture. On the other hand, cooler summertemperatures do not allow much snow to melt. Thiswould lead to the growth of ice sheets.
All three effects have been combined in theMilankovitch curve to plot the results of thesechanges over long periods of time.
Like a spinning top, the earth rotating on its axiswobbles. At present, the axis of the earth pointstowards the North Star, but by the year 14,000 A.D.the axis will be pointing towards the star Vegas whichwill then be called the North Star. Since the period ofprecession is roughly about 26,000 years, Polariswill once again be the North Star by the year 27,000.
8
VVR-IAS: 53/5, OLD RAJINDER NAGAR MARKET, DELHI-60 Ph: 011-45596505, 09999329111
Due to this cyclic wobbling of the axis, climatic changeof great magnitude takes place. As a result of the tiltof the axis towards Vega in about 12,000 years, thenorthern hemisphere will experience winter when thesun is farthest from the earth (aphelion) and summerwill occur when the earth is nearest to the sun(perihelion). In this way, summers will be warmer andwinters colder than at present.
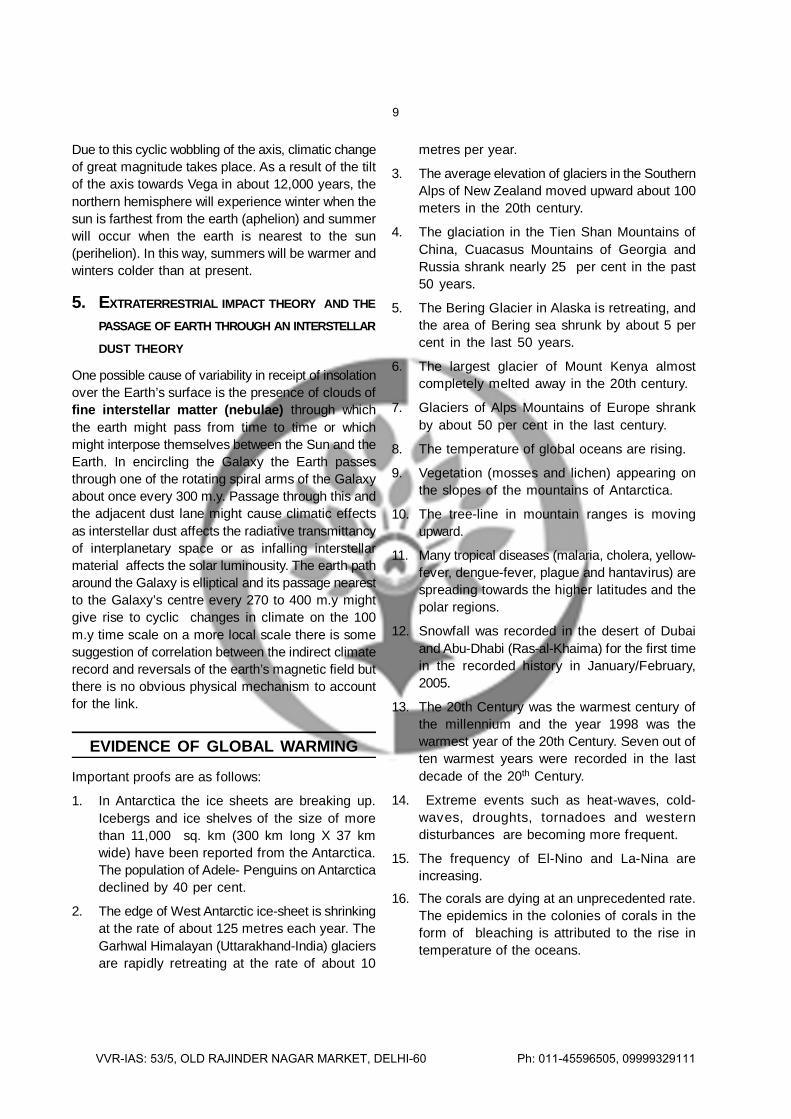
5. EXTRATERRESTRIAL IMPACT THEORY AND THE
PASSAGE OF EARTH THROUGH AN INTERSTELLAR
DUST THEORY
One possible cause of variability in receipt of insolationover the Earth’s surface is the presence of clouds offine interstellar matter (nebulae) through whichthe earth might pass from time to time or whichmight interpose themselves between the Sun and theEarth. In encircling the Galaxy the Earth passesthrough one of the rotating spiral arms of the Galaxyabout once every 300 m.y. Passage through this andthe adjacent dust lane might cause climatic effectsas interstellar dust affects the radiative transmittancyof interplanetary space or as infalling interstellarmaterial affects the solar luminousity. The earth patharound the Galaxy is elliptical and its passage nearestto the Galaxy’s centre every 270 to 400 m.y mightgive rise to cyclic changes in climate on the 100m.y time scale on a more local scale there is somesuggestion of correlation between the indirect climaterecord and reversals of the earth’s magnetic field butthere is no obvious physical mechanism to accountfor the link.
EVIDENCE OF GLOBAL WARMING
Important proofs are as follows:
1. In Antarctica the ice sheets are breaking up.Icebergs and ice shelves of the size of morethan 11,000 sq. km (300 km long X 37 kmwide) have been reported from the Antarctica.The population of Adele- Penguins on Antarcticadeclined by 40 per cent.
2. The edge of West Antarctic ice-sheet is shrinkingat the rate of about 125 metres each year. TheGarhwal Himalayan (Uttarakhand-India) glaciersare rapidly retreating at the rate of about 10
metres per year.
3. The average elevation of glaciers in the SouthernAlps of New Zealand moved upward about 100meters in the 20th century.
4. The glaciation in the Tien Shan Mountains ofChina, Cuacasus Mountains of Georgia andRussia shrank nearly 25 per cent in the past50 years.
5. The Bering Glacier in Alaska is retreating, andthe area of Bering sea shrunk by about 5 percent in the last 50 years.
6. The largest glacier of Mount Kenya almostcompletely melted away in the 20th century.
7. Glaciers of Alps Mountains of Europe shrankby about 50 per cent in the last century.
8. The temperature of global oceans are rising.
9. Vegetation (mosses and lichen) appearing onthe slopes of the mountains of Antarctica.
10. The tree-line in mountain ranges is movingupward.
11. Many tropical diseases (malaria, cholera, yellow-fever, dengue-fever, plague and hantavirus) arespreading towards the higher latitudes and thepolar regions.
12. Snowfall was recorded in the desert of Dubaiand Abu-Dhabi (Ras-al-Khaima) for the first timein the recorded history in January/February,2005.
13. The 20th Century was the warmest century ofthe millennium and the year 1998 was thewarmest year of the 20th Century. Seven out often warmest years were recorded in the lastdecade of the 20th Century.
14. Extreme events such as heat-waves, cold-waves, droughts, tornadoes and westerndisturbances are becoming more frequent.
15. The frequency of El-Nino and La-Nina areincreasing.
16. The corals are dying at an unprecedented rate.The epidemics in the colonies of corals in theform of bleaching is attributed to the rise intemperature of the oceans.
9
VVR-IAS: 53/5, OLD RAJINDER NAGAR MARKET, DELHI-60 Ph: 011-45596505, 09999329111

17. Cloudbursts and flesh floods like that of the16th June, 2013 in Uttarakhand are becomingmore frequent.
18. Untimely heavy snowfall in Kashmir, HimachalPradesh, Badrinath valley (Uttarakhand) andNepal on 16th October 2014
CONSEQUENCES OF CLIMATIC CHANGE
The consequences of global warming are complexand effect the characteristics of temperature,precipitation, soil moisture, and air-masses both atthe regional and global level. Though it is difficult toforecast how the change of climate will affect theenvironment, ecology and society, it is sure to havefar-reaching consequences.
MAJOR CONSEQUENCES OF CLIMATE CHANGE
1. Rise in sea level: The experts of Oceanographyopine that significant changes are taking place inthe sea level. In fact, the measurements of sealevel exhibit cyclical changes in sea level. Themain cause of sea level rise is the melting of ice-sheets and glaciers. It is observed that about 18thousand years before present, the sea level wasabout 82 metres below the present sea level.Since then, it is continuously rising. The moresignificant rise in the sea level occurred about6000 years before present. The sea level risegradually inundates coastal areas which affect theoccurrence and frequency of tropical cyclones,patterns of precipitation, causing droughts andfloods and ultimately affecting the vegetation,animals Soil humidity and human society.
2. Change in pressure belts and atmosphericcirculation. The Inter-Tropical Convergence Zone(ITCZ) may mover northward in the NorthernHemisphere.
3. Change in the direction of permanent and periodicwinds.
4. Change in the directions of warm and cold watercurrents.
5. Increase in the frequency of tropical andtemperate cyclones, cloud cover, tornadoes andstorms.
6. Change in the intensity and patterns of
precipitation altering natural vegetation, croppingpatterns, crop combination, agriculturalproductivity and soil belts. National parks,sanctuaries and biosphere reserves may bealtered.
7. Change in hydrological cycle and water supplywill bring changes in the soil-moisture and humuscontent of the soils.
8. The marine life will be adversely affected.Warming of temperature of the oceans mayendanger the corals worldwide.
9. Agricultural fields in the deltaic regions maysubmerge. This would effect the food supplyand international trade of grains.
10. Countries like Maldives, and greater parts ofNetherlands, etc. may submerge under water.
11. Expansion of deserts due to desertification.12. The land-based animals will have to adapt to
changing patterns of climatic belts.13. Change in the international trade pacts and geo-
politics of world.14. Climatic change will effect the nutrious value of
the food crops. The rising carbon dioxide emissionswill lead to deficiencies in iron and zinc.
CLIMATE CHANGE IN INDIANCONTEXT: CONSEQUENCES
The scientists of the Indian Institute of TropicalMeteorology (IITM), New Delhi found that temperaturewould increase by about 5°C in several parts ofIndia, especially in Gujarat (Rann of Kachchh) andRajasthan, and 3°C to 4°C in Peninsular India bythe end of the 21st Century. In addition to this, theincidence of violent and stormy weather and thefrequency of tropical cyclones may it increase byabout 50 per cent. This may lead to heat waves,more torrential rainfall and more prolonged dry spellsin the less rainfall recording areas. The risingtemperature may affect every aspect of ecology andsociety.
Following are the consequences of globalwarming and climate change in India:1. The hydrological cycle will be adversely affected.
The discharge of water even in the perennial
10
VVR-IAS: 53/5, OLD RAJINDER NAGAR MARKET, DELHI-60 Ph: 011-45596505, 09999329111
rivers may decrease by about 20 per cent by2050 resulting in decrease in fresh wateravailability.
2. In several areas, rainfall will increase, while inothers there will be decrease .
3. With Increased temperatures the rate ofevaporation will increase resulting in more ofrainfall and most of it would be in the oceans.
4. Decrease in soil moisture in the northern plainsof India and the consequent increase in salineaffected areas would effect the Agriculturalproduction by about 15 per cent . Theunseasonality of hot and cold spells will not beconducive for good agricultural productivity. Suchconditions would have a lasting influence oncropping patterns too.
5. The forest cover will change in nature and thevegetation belts will shift which will effect theareas of Biosphere Reserves and National parks.
6. With increasing temperatures effecting theHimalayan glaciers, the proneness to floods inthe plains of Indus, Satluj, Ganga andBrahmaputra will increase in the initial years
7. The deltas along coast of Tamil Nadu, AndhraPradesh, Odisha, and West Bengal maysubmerge under water. This would result insubmergence of islands in front of SundarbanDelta and the Lakshadweep.
8. With lowered productivity and production, Indiamay be forced to depend on importing food grainsto feed its teeming millions.
9. There will be increased inter-regional andinternational migration of people in search ofjobs and better quality of life.
ADAPTIVE STRATEGIES FORCLIMATE CHANGE MITIGATION
The United Nations Framework Conventionon Climate Change: The world communityrecognized that there is a problem and need to beaddressed at the earliest.
In 1992, countries joined an international treaty,the United Nations Framework Convention on ClimateChange, as a framework for international cooperation
to combat climate change by limiting average globaltemperature increases and the resulting climatechange, and coping with impacts that were, by then,inevitable.
Convention sets an ultimate objective of stabilizinggreenhouse gas concentrations “at a level that wouldprevent dangerous anthropogenic (human induced)interference with the climate system.” And such alevel should be achieved within a time-frame sufficientto allow ecosystems to adapt naturally to climatechange, to ensure that food production is notthreatened, and to enable economic development toproceed in a sustainable manner”.
The “base year” for tabulating greenhouse gasemissions has been set as 1990.
Kyoto Protocol: By 1995, countries launchednegotiations to strengthen the global response toclimate change, and, two years later in 1997, adoptedthe Kyoto Protocol. The Kyoto Protocol legally bindsdeveloped country Parties to emission reductiontargets. The Protocol’s first commitment periodstarted in 2008 and ended in 2012. The secondcommitment period began on 1 January 2013 andwill end in 2020.
There are now 196 Parties to the Convention and192 Parties to the Kyoto Protocol.
Kyoto Protocol-what it means : Its an Internationaland legally binding agreement to reduce greenhousegas emission worldwide, entered into force on 16February 2005.
The convention place the heaviest burden forfighting climate change on industrialized nations,since they are the source of most past and currentgreenhouse gas emissions. These developed nations,called “Annex I” countries listed under annex Ibelong to the organization for EconomicCooperation and Development (OECD). Theseadvanced nations, as well as 12 “economies intransition” (countries in Central and Eastern Europe,including some states formerly belonging to the SovietUnion) were expected by the year 2000 to reduceemission to 1990 levels and they succeeded.
Industrial nations agree under the convention tosupport climate-change activities in developingcountries by providing financial support to thesecountries. A system of grants and loans has been
11
VVR-IAS: 53/5, OLD RAJINDER NAGAR MARKET, DELHI-60 Ph: 011-45596505, 09999329111
set up through the convention which was managedby the Global environment Facility. Industrializedcountries also agree to share technology with less-advanced nations. Because economic developmentis vital for the world’s poorer countries and becausesuch progress is difficult to achieve even without thecomplications added by climate change theconvention accepts that the share of greenhousegas emissions produced by developing nations willgrow in the coming years. It nonetheless seeks tohelp such countries limit emissions in ways that willnot hinder their economic progress.
Paris Agreement: The 2015 Paris Agreement,adopted in Paris on 12 December 2015, marks thelatest step in the evolution of the UN climate changeregime and builds on the work undertaken under theConvention.
The Paris Agreement seeks to accelerate andintensify the actions and investment needed for asustainable low carbon future. Its central aim is tostrengthen the global response to the threat ofclimate change by keeping a global temperature risethis century well below 2 degrees Celsius abovepre-industrial levels and to pursue efforts to limit thetemperature increase even further to 1.5 degreesCelsius. The Agreement also aims to strengthen theability of countries to deal with the impacts of climatechange.
UN’s United Nations Environment Programmegathers temperature, weather, and climaticinformation to assist climate modelers and policymakers.
U.N’s Climate Science Panel said that the worldwould have to reduce greenhouse gas emissions by40-70% below 2010 levels by 2050 in order to havea fair chance to keep the rise in the globaltemperature below 2 degree Celsius and CO2 downto 430-480 parts per million (ppm) equivalent 2100.
STEPS TO REDUCE EMISSION OF GREENHOUSE
GASES
(i) Alternative sources of energy: There is aneed to increase the use of alternate
sources of energy. The renewable and non-conventional energy sources like solar , wind,tidal energy provides only about 18 per cent ofthe total electricity generated in the world andthere should be serious efforts to reduce theuse of thermal power.
(ii) Generation of Nuclear Power: Measures toincrease the production of nuclear poweras it accounts for about 14 per cent of theworld’s electricity produced and consumed.
(iii) Afforestation: Planting instead of felling moretrees
(iv) Urban Planning: encroachment of agriculturalland for non-agricultural purposes should beavoided. The urban areas should implementenvironmentally protective measures like multipletransport choices, green areas and ‘green belts.
(v) Building designing: To use the solar heat andlight resources in the construction design andalso to use insulation and high efficiencyappliances.
(vi) Controlled burning of biomass: Promotingbiomass fuelled power plants to reduce theemission of greenhouse gases.
(vii) Reduction in the growth of population:Framing of measures and policies to controlpopulation growth.
(v i i i) Reduction in consumerism: W i thconsumerism, the judicious use of goods hascome down resulting in more and more ofwastage of resources.
(xi) Mass education about ecology andenvironment: Proactive use of media, holdingworkshops, conferences and seminars cantrain and tune the general public into cultivatinghabits to Conserve resources and protect theenvironment.
(x) Developing appropriate technologies so as toadapt and mitigate the adverse impact of theemissions of greenhouse gases like The dieselvehicles should be fitted with filters to captureblack carbon and Replacement of inefficient cookstoves with cleaner alternatives.
12
VVR-IAS: 53/5, OLD RAJINDER NAGAR MARKET, DELHI-60 Ph: 011-45596505, 09999329111

IES
MASTER
This flow of incoming and outgoing energy isEarth’s energy budget. For Earth’s temperature tobe stable over long periods of time, incoming energyand outgoing energy have to be equal. In other words,the energy budget at the top of the atmospheremust balance. If incoming energy is not balancedwith the outgoing energy the earth would get warmeror cooler progressively with each passing year. Thisstate of balance is called radiative equilibrium.
Input is received in the form of short-wave solarenergy. This is called insolation.
Insolation is solar radiation received in theEarth’s atmosphere or at its surface.
Reflected heat, is in the form of long-wave radiation.This reflection is called the albedo. The albedo ofan object is the extent to which it diffusely reflectslight from the Sun.This reflected heat is trapped inour atmosphere and keeps our planet warm. This isknown as the natural greenhouse effect.
Temperature doesn’t infinitely rise, however,because atoms and molecules on Earth are not justabsorbing sunlight, they are also radiating thermalinfrared energy (heat). The amount of heat a surfaceradiates is proportional to the fourth power of itstemperature. If temperature doubles, radiated energyincreases by a factor of 16 (2 to the 4th power). Ifthe temperature of the Earth rises, the planet rapidlyemits an increasing amount of heat to space. Thislarge increase in heat loss in response to a relativelysmaller increase in temperature—referred to asradiative cooling—is the primary mechanism thatprevents runaway heating on Earth.
About 29 percent of the solar energy that arrivesat the top of the atmosphere is reflected backto space by clouds, atmospheric particles, orbright ground surfaces like sea ice and snow.This energy plays no role in Earth’s climatesystem. About 23 percent of incoming solarenergy is absorbed in the atmosphere by watervapor, dust, and ozone, and 48 percent passesthrough the atmosphere and is absorbed by thesurface.
The atmosphere and the surface of the Earthtogether absorb 71 percent of incoming solar
radiation, so together, they must radiate thatmuch energy back to space for the planet’saverage temperature to remain stable. However,the relative contribution of the atmosphere andthe surface to each process (absorbing sunlightversus radiating heat) is asymmetric. Theatmosphere absorbs 23 percent of incomingsunlight while the surface absorbs 48. Theatmosphere radiates heat equivalent to 59percent of incoming sunlight; the surfaceradiates only 12 percent. In other words, mostsolar heating happens at the surface, while mostradiative cooling happens in the atmosphere.
For the energy budget at Earth’s surface tobalance, processes on the ground must get ridof the 48 percent of incoming solar energy thatthe ocean and land surfaces absorb. Energyleaves the surface through three processes:evaporation, convection, and emission ofthermal infrared energy.
About 25 percent of incoming solar energy leavesthe surface through evaporation. Liquid watermolecules absorb incoming solar energy, andthey change phase from liquid to gas. The heatenergy that it took to evaporate the water islatent in the random motions of the water vapormolecules as they spread through theatmosphere. When the water vapor moleculescondense back into rain, the latent heat isreleased to the surrounding atmosphere.Evaporation from tropical oceans and thesubsequent release of latent heat are the primarydrivers of the atmospheric heat engine.
An additional 5 percent of incoming solar energyleaves the surface through convection. Air indirect contact with the sun-warmed groundbecomes warm and buoyant. In general, theatmosphere is warmer near the surface andcolder at higher altitudes, and under theseconditions, warm air rises, shuttling heat awayfrom the surface.
Finally, a net of about 17 percent of incomingsolar energy leaves the surface as thermalinfrared energy (heat) radiated by atoms andmolecules on the surface.
HEAT BUDGET
13
VVR-IAS: 53/5, OLD RAJINDER NAGAR MARKET, DELHI-60 Ph: 011-45596505, 09999329111
IES
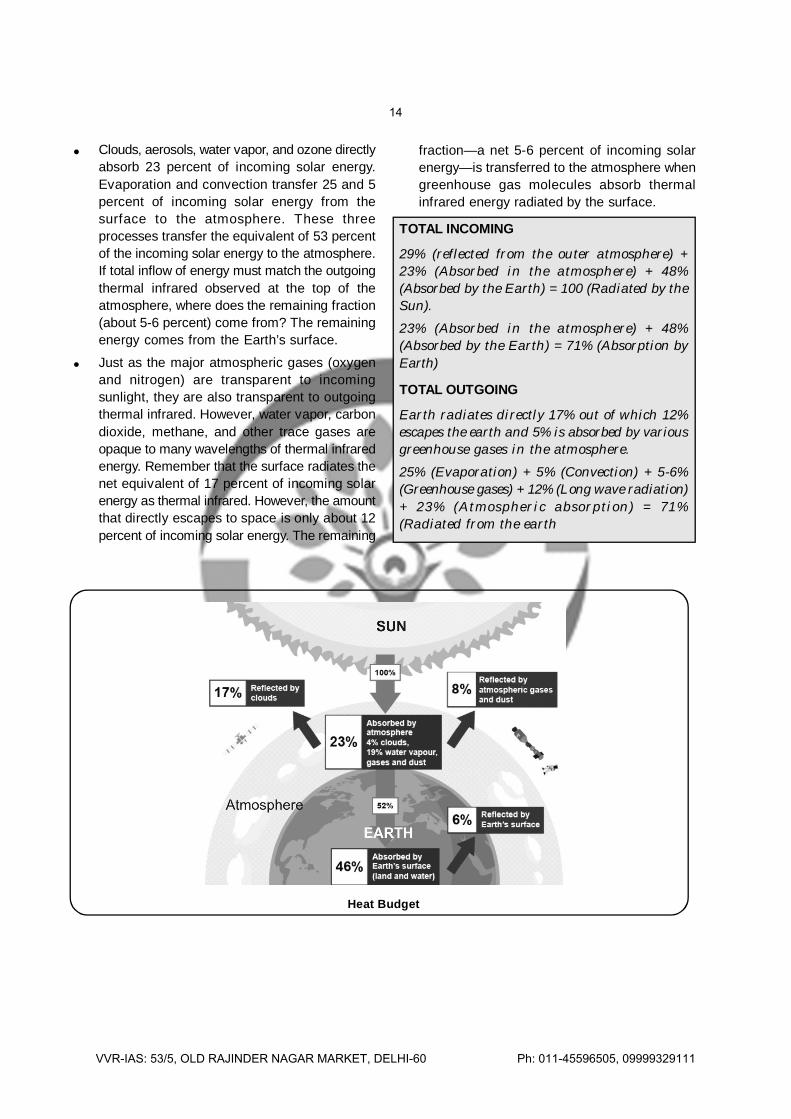
Clouds, aerosols, water vapor, and ozone directlyabsorb 23 percent of incoming solar energy.Evaporation and convection transfer 25 and 5percent of incoming solar energy from thesurface to the atmosphere. These threeprocesses transfer the equivalent of 53 percentof the incoming solar energy to the atmosphere.If total inflow of energy must match the outgoingthermal infrared observed at the top of theatmosphere, where does the remaining fraction(about 5-6 percent) come from? The remainingenergy comes from the Earth’s surface.
Just as the major atmospheric gases (oxygenand nitrogen) are transparent to incomingsunlight, they are also transparent to outgoingthermal infrared. However, water vapor, carbondioxide, methane, and other trace gases areopaque to many wavelengths of thermal infraredenergy. Remember that the surface radiates thenet equivalent of 17 percent of incoming solarenergy as thermal infrared. However, the amountthat directly escapes to space is only about 12percent of incoming solar energy. The remaining
fraction—a net 5-6 percent of incoming solarenergy—is transferred to the atmosphere whengreenhouse gas molecules absorb thermalinfrared energy radiated by the surface.
TOTAL INCOMING
29% (reflected from the outer atmosphere) +23% (Absorbed in the atmosphere) + 48%(Absorbed by the Earth) = 100 (Radiated by theSun).23% (Absorbed in the atmosphere) + 48%(Absorbed by the Earth) = 71% (Absorption byEarth)
TOTAL OUTGOING
Earth radiates directly 17% out of which 12%escapes the earth and 5% is absorbed by variousgreenhouse gases in the atmosphere.25% (Evaporation) + 5% (Convection) + 5-6%(Greenhouse gases) + 12% (Long wave radiation)+ 23% (Atmospheric absorption) = 71%(Radiated from the earth
Heat Budget
14
VVR-IAS: 53/5, OLD RAJINDER NAGAR MARKET, DELHI-60 Ph: 011-45596505, 09999329111

Objective Questions
1. The following statements about greenhouse gasmethane are correct.(i) Landfills produce methane(ii) Termites produce methane.(iii) Cattle produce methane.(iv) Methane is produced from Paddy fields.(a) i, ii and iii only (b) ii, iii and iv only
(c) i, iii and iv only (d) All are correct2. Indirect greenhouse effect is caused by
(a) CO (b) Ozone(c) Chlorofluorocarbons (CFCs)(d) Methane
3. Regarding Hydro fluorocarbons (HFCs), find outthe correct statements?(i) They are one group of the greenhouse
gases.(ii) HFCs are replacing CFCs.(iii) HFCs have shorter atmospheric liferime
than CFCs.
(a) i, ii and iv only (b) ii, iii and iv only(c) i, ii and iii only (d) All are correct
4. Match List-I (Environmental Degradation) withList-II (Constituent Causing Degradation) andselect the correct answer using codes givenbelow :
List-I List-IIA. Acid rain (i) NitrogenB. Automobile Smoke (ii) Carbon dioxideC. Ozone Depletion (iii) Nitrogen oxideD. Global Warming (iv) Oxide of sulphur
(v) Clorofluro-carbonCode :
A B C D(a) iv ii v iii(b) v iii i ii(c) iv iii v ii(d) v ii i iii
5. Green Climate Fund was set up in whichconference?(a) Doha (b) Durban(c) Cancun (d) Lima
6. Consider the following agricultural practice :(UPSC-2014)
(i) Contour bunding (ii) Relay cropping
(iii) Zero tillageIn the context of global climate change, whichof the above help/help in carbon sequestration/storage in the soil?(a) i and ii only (b) iii only(c) i, ii and iii (d) None of them
7. Which of the following is most significant factorin coral bleaching? (UPPSC-2015)(a) Mining of coral rocks(b) Outbreak of coral disease(c) Siltation of seawater(d) Global warming
8. Ozone protects biosphere from(UPPSC-2014)
(a) Infrared rays (b) Ultravioler rays(c) X-rays (d) Gamma rays
9. The main gas responsible for ozone depletionis (Maharastra PCS-2014)
(a) carbon dioxide (b) nitrogen dioxide(c) methane (d) chlorofluoro carbon
10. Which of the following group of gases contributeto the “Green House Effect”? (UPPSC-2013)(a) Ammonia and ozone(b) Carbon monoxide and sulphur dioxide
(c) Carbon tetrafluoride and nitrous oxide(d) Carbon dioxide and methane
11. Which of the following is the correct definitionof “Agenda-21”? (UPPSC-2013)
15
VVR-IAS: 53/5, OLD RAJINDER NAGAR MARKET, DELHI-60 Ph: 011-45596505, 09999329111
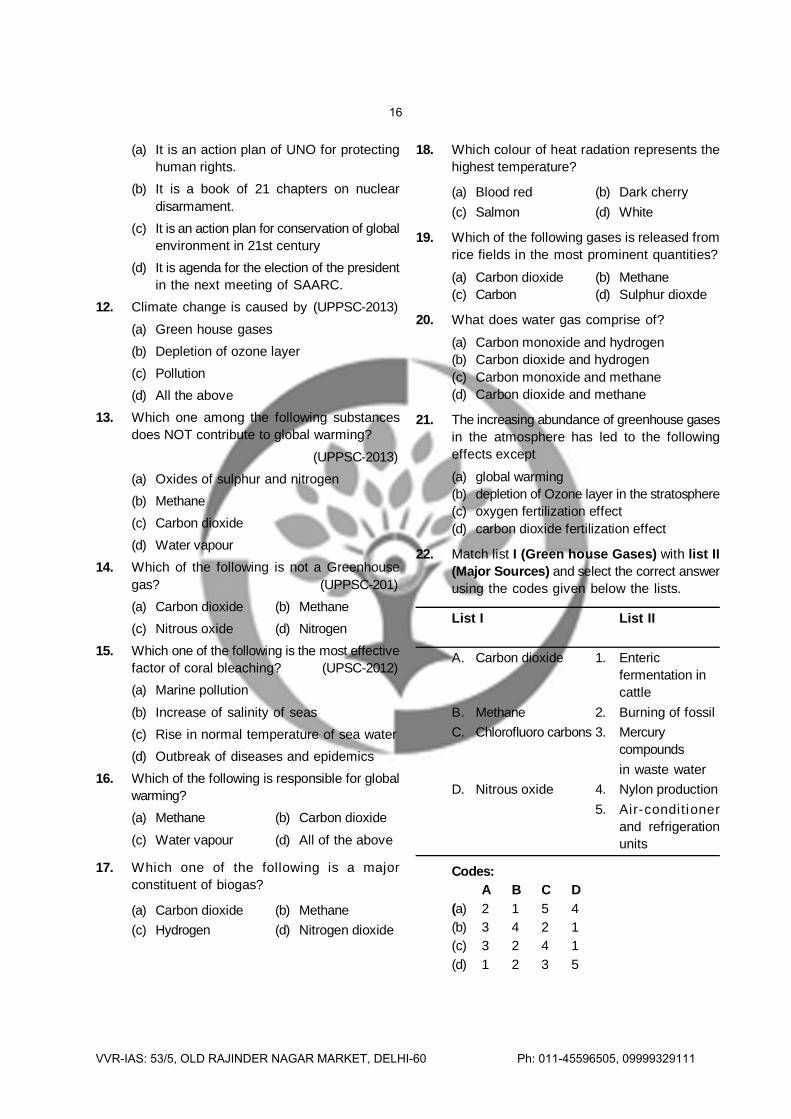
(a) It is an action plan of UNO for protectinghuman rights.
(b) It is a book of 21 chapters on nucleardisarmament.
(c) It is an action plan for conservation of globalenvironment in 21st century
(d) It is agenda for the election of the presidentin the next meeting of SAARC.
12. Climate change is caused by (UPPSC-2013)
(a) Green house gases(b) Depletion of ozone layer(c) Pollution(d) All the above
13. Which one among the following substancesdoes NOT contribute to global warming?
(UPPSC-2013)(a) Oxides of sulphur and nitrogen(b) Methane(c) Carbon dioxide(d) Water vapour
14. Which of the following is not a Greenhousegas? (UPPSC-201)(a) Carbon dioxide (b) Methane(c) Nitrous oxide (d) Nitrogen
15. Which one of the following is the most effectivefactor of coral bleaching? (UPSC-2012)(a) Marine pollution
(b) Increase of salinity of seas(c) Rise in normal temperature of sea water(d) Outbreak of diseases and epidemics
16. Which of the following is responsible for globalwarming?(a) Methane (b) Carbon dioxide
(c) Water vapour (d) All of the above
17. Which one of the following is a majorconstituent of biogas?
(a) Carbon dioxide (b) Methane(c) Hydrogen (d) Nitrogen dioxide
18. Which colour of heat radation represents thehighest temperature?
(a) Blood red (b) Dark cherry(c) Salmon (d) White
19. Which of the following gases is released fromrice fields in the most prominent quantities?
(a) Carbon dioxide (b) Methane(c) Carbon (d) Sulphur dioxde
20. What does water gas comprise of?
(a) Carbon monoxide and hydrogen(b) Carbon dioxide and hydrogen(c) Carbon monoxide and methane(d) Carbon dioxide and methane
21. The increasing abundance of greenhouse gasesin the atmosphere has led to the followingeffects except
(a) global warming(b) depletion of Ozone layer in the stratosphere(c) oxygen fertilization effect(d) carbon dioxide fertilization effect
22. Match list I (Green house Gases) with list II(Major Sources) and select the correct answerusing the codes given below the lists.
List I List II
A. Carbon dioxide 1. Entericfermentation incattle
B. Methane 2. Burning of fossilC. Chlorofluoro carbons 3. Mercury
compoundsin waste water
D. Nitrous oxide 4. Nylon production5. Air-conditioner
and refrigerationunits
Codes:A B C D
(a) 2 1 5 4(b) 3 4 2 1(c) 3 2 4 1(d) 1 2 3 5
16
VVR-IAS: 53/5, OLD RAJINDER NAGAR MARKET, DELHI-60 Ph: 011-45596505, 09999329111

23. Assertion : Presently the global atmosphereis warming up.
Reason : The depletion of stratospheric ozonelayer has resulted in increase in ultravoiletradiations reaching earth.
24. Which one of the following is mismatched?
(a) Fossil fuel burning — Release of CO2(b) Nuclear power — Radioactive wastes(c) Solar energy — Green house effect(d) Biomass burning — Release of CO2
25. Assertion : UV radiation causes photo-dissociation of ozone into O2 and O thuscausing damage to stratospheric ozone layer.
Reason : Ozone hole is resulting in globalwarming and climatic change.
26. Which one of the following is an environmentrelated disorder with correct main cause
(a) Black lung disease is found mainly inworkers of stone quarries and crushers
(b) Blue-baby disease is due to heavy use ofnitrogenous fertilizers
(c) Non-Hodgkin’s lymphoma is found mainlyin workers involved in manufacture of neem-based pesticides
(d) Skin cancer occurs mainly in peopleexposed to benzene and methane.
27. Process by which incesticides like DDT reachman is
(a) Bioaccumulation (b) Biomagnification(c) Bioremediation (d) Eutrophication
28. Match the columns
Column—I Column—IIa. Nitrous oxide 1. Secondary
pollutant fromcar exhausts
b. Chlorofluorocarbons 2. Combustion offossil fuels
c. Methane 3. Denitrificationd. Ozone 4. Refrigerators
aerosols, sprayse. Carbon dioxide 5. Cattle, rice fields,
toilets(a) a — 3, b — 4, c — 5, d — 1, e — 2(b) a — 5, b — 1, c — 3, d — 4, e — 2(c) a — 1, b — 3, c — 4, d — 5, e — 2(d) a — 2, b — 4, c — 5, d — 1, e — 3
29. Air pollution is not reduced by
(a) Using precipitators (b) Reusing wastes(c) Cleaning air (d) All the above
1. (d)
2. (a)
3. (c)
4. (c)
5. (c)
6. (c)
7. (d)
8. (b)
9. (d)
10. (d)
11. (c)
12. (d)
13. (a)
14. (d)
15. (c)
16. (d)
17. (b)
18. (d)
19. (b)
20. (a)
21. (c)
22. (a)
23. (b)
24. (c)
25. (d)
26. (b)
27. (b)
28. (a)
29. (b)
ANSWERS
17
VVR-IAS: 53/5, OLD RAJINDER NAGAR MARKET, DELHI-60 Ph: 011-45596505, 09999329111
53/5, Old Rajinder Nagar Market, Delhi-60 (9999329111, 011-45596505)
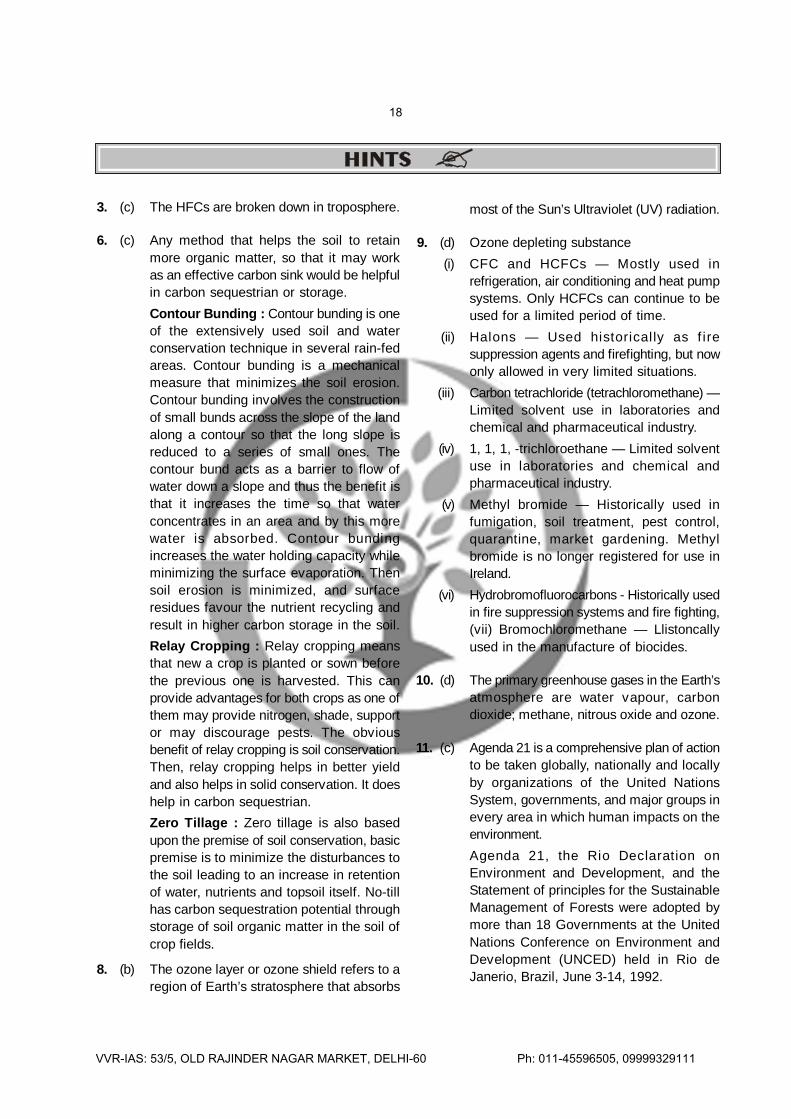
most of the Sun’s Ultraviolet (UV) radiation.
9. (d) Ozone depleting substance(i) CFC and HCFCs — Mostly used in
refrigeration, air conditioning and heat pumpsystems. Only HCFCs can continue to beused for a limited period of time.
(ii) Halons — Used historical ly as f iresuppression agents and firefighting, but nowonly allowed in very limited situations.
(iii) Carbon tetrachloride (tetrachloromethane) —Limited solvent use in laboratories andchemical and pharmaceutical industry.
(iv) 1, 1, 1, -trichloroethane — Limited solventuse in laboratories and chemical andpharmaceutical industry.
(v) Methyl bromide — Historically used infumigation, soil treatment, pest control,quarantine, market gardening. Methylbromide is no longer registered for use inIreland.
(vi) Hydrobromofluorocarbons - Historically usedin fire suppression systems and fire fighting,(vii) Bromochloromethane — Llistoncallyused in the manufacture of biocides.
10. (d) The primary greenhouse gases in the Earth’satmosphere are water vapour, carbondioxide; methane, nitrous oxide and ozone.
11. (c) Agenda 21 is a comprehensive plan of actionto be taken globally, nationally and locallyby organizations of the United NationsSystem, governments, and major groups inevery area in which human impacts on theenvironment.Agenda 21, the Rio Declaration onEnvironment and Development, and theStatement of principles for the SustainableManagement of Forests were adopted bymore than 18 Governments at the UnitedNations Conference on Environment andDevelopment (UNCED) held in Rio deJanerio, Brazil, June 3-14, 1992.
3. (c) The HFCs are broken down in troposphere.
6. (c) Any method that helps the soil to retainmore organic matter, so that it may workas an effective carbon sink would be helpfulin carbon sequestrian or storage.Contour Bunding : Contour bunding is oneof the extensively used soil and waterconservation technique in several rain-fedareas. Contour bunding is a mechanicalmeasure that minimizes the soil erosion.Contour bunding involves the constructionof small bunds across the slope of the landalong a contour so that the long slope isreduced to a series of small ones. Thecontour bund acts as a barrier to flow ofwater down a slope and thus the benefit isthat it increases the time so that waterconcentrates in an area and by this morewater is absorbed. Contour bundingincreases the water holding capacity whileminimizing the surface evaporation. Thensoil erosion is minimized, and surfaceresidues favour the nutrient recycling andresult in higher carbon storage in the soil.Relay Cropping : Relay cropping meansthat new a crop is planted or sown beforethe previous one is harvested. This canprovide advantages for both crops as one ofthem may provide nitrogen, shade, supportor may discourage pests. The obviousbenefit of relay cropping is soil conservation.Then, relay cropping helps in better yieldand also helps in solid conservation. It doeshelp in carbon sequestrian.Zero Tillage : Zero tillage is also basedupon the premise of soil conservation, basicpremise is to minimize the disturbances tothe soil leading to an increase in retentionof water, nutrients and topsoil itself. No-tillhas carbon sequestration potential throughstorage of soil organic matter in the soil ofcrop fields.
8. (b) The ozone layer or ozone shield refers to aregion of Earth’s stratosphere that absorbs
18
VVR-IAS: 53/5, OLD RAJINDER NAGAR MARKET, DELHI-60 Ph: 011-45596505, 09999329111