climate of riverton, wyoming · climate of riverton, wyoming narrative summary 1. history...
TRANSCRIPT
1
Climate of Riverton, Wyoming
Narrative Summary 1. History Observations taken by dedicated cooperative weather observers in Riverton date back to 1907, even though the National Weather Service (NWS) office on the northwest edge of town did not come into existence until 1995. Until that time, NWS observations were taken in Lander, which date back to the late 19th century. Official NWS observations are now taken by an automated surface observing system (ASOS) at the Riverton Regional Airport. The airport is located on the northwest side of town and sits nearly 600 feet higher than downtown Riverton. However, a cooperative weather observer in Riverton is currently taking daily weather observations to keep the record database intact back to 1907. These records are archived at the National Climatic Data Center (NCDC). Since these cooperative weather observers are volunteers, the record database has some missing data due to observers going on vacation or their unavailability during transition from one observer to another. However, the available data is impressive and was interrogated to create this published climate volume. Cooperative weather observations were used exclusively for this work and all observations were taken in the town of Riverton. 2. Topography Riverton is located in the center of the Wind River Basin at an elevation of 4956 feet msl. The impressive peaks of the Wind River Mountains (elevations over 13,000 feet msl) sit approximately 40 miles southwest of town but the range extends from southwest to west-northwest. The southern extent of the Absaroka Range (elevations over 13,000 feet msl) sits about 75 miles northwest of Riverton with the Owl Creek Mountains (rising above 9,000 feet msl) extending from the Absaroka Range to about 30 miles north of town. The Bridger Mountains (rising above 8,000 feet msl) are another smaller range that starts just east of the Owl Creek Mountains and eventually connect to the Bighorn Mountains (rising above 9,000 feet msl on the southern end of the range) about 75 miles northeast of Riverton. The slightest climb is to the east where elevations gradually rise to a little over 6,000 feet msl in approximately 50 miles. Beaver Rim provides another terrain feature rising above 7,000 feet msl to the south and southeast. The combination of these features provides a protected climate from the regular strong winds that hinder many other areas in Wyoming, but the complex terrain also adds to the unique climate of the basin. 3. General Climatic Summary Riverton has four distinct seasons, but at times, spring and fall can be rather abbreviated. Summers are rather long and actually quite warm with normal highs in the mid to upper 80s and lows around 50. However, the mercury frequently tops 90 degrees, about 36 times on average per year, with readings near the century mark occasionally occurring. Summers are generally quite dry except during periods when the “monsoon flow” develops and draws moisture up from the desert
2
southwest. During this period, intense thunderstorms can develop producing flash flooding along with damaging wind, hail, and isolated tornadoes. Winds are generally light but can become quite strong in the afternoon and early evening with thunderstorms in the area. Often, thunderstorms are high based and produce strong winds but little rainfall. Fall is a variable length transition period before the relatively harsh winter sets in. Snow can fall as early as September or on rare occasion as late as November. Temperatures at the beginning of the season are typically in the 70s but decrease rapidly to near 30 degrees by the average first day of winter. Snowfall amounts are generally light but one or two heavy storms are possible. Winds become more noticeable at times as more frequent weather systems move through the state. Stronger winds generally blow from the southwest in advance of a storm and from the north to northwest behind a storm. Winter can set in earlier than the calendar indicates, especially if a relatively deep snow cover develops from early fall storms, allowing an early start to the infamous basin temperature inversion. Overall, the winter storms produce light snowfall and generally light wind in town. The frequency of winter storms is erratic with several consecutive weeks without any snow, then a period of more active weather where light snow falls off and on for a week or two. Snowstorms over a foot are rare with less than 24 cases in recorded history. Areas closer to the Wind River Mountains, such as Lander, receive significantly more snow than the town of Riverton. During most winters the snow cover in the basin results in strong temperature inversions with very cold overnight lows and chilly afternoon highs. During extreme cases, the nearby mountains can be 30 to 40 degrees warmer than the basin floor or nearby cities in the state where the wind is blowing; the positive side is the absence of any wind during these periods. Once or twice a year on average, bitter arctic air slides south out of Canada providing the coldest temperatures of the season. These intrusions of arctic air are most prevalent during January and early February. Overnight lows of 20 to 30 below zero are common during this period in the normally colder low lying areas, especially near the Wind River. In extreme cases readings of 40 below zero can occur; thankfully, these periods only occur every few decades. The last episode with these extreme readings was observed during the winter of 1983-84. Spring usually comes quickly in March. The spring period is a transition period of frequent change and can produce some record breaking snowstorms due to the availability of more moisture and frequent favorable weather patterns. However, temperatures are moderating throughout the period and the snow melts much more rapidly than the winter season. Cold snaps can still persist early in the period but are usually confined to a few days rather than a few weeks, which is more common during the winter. Windy conditions are most noticeable during this period with frequent storms moving through the region. Winds react similar to fall systems.
3
Climate of Riverton, Wyoming TABLE OF CONTENTS Page ABSTRACT AND NARRATIVE SUMMARY 1-2 TABLE OF CONTENTS 3-5 MONTHLY NORMALS 6 MONTHLY TEMPERATURE RECORDS 7 MONTHLY SNOWFALL RECORDS 8 MONTHLY RAINFALL RECORDS 9 DAILY NORMALS 10-11 DAILY TEMPERATURE/PRECIPITATION/SNOWFALL RECORDS JANUARY 12 FEBRUARY 14 MARCH 16 APRIL 18 MAY 20 JUNE 22 JULY 24 AUGUST 26 SEPTEMBER 28 OCTOBER 30 NOVEMBER 32 DECEMBER 34 SNOW RECORDS TOP 10 SNOWIEST MONTHS BY MONTH 36 TOP 10 SNOWIEST SEASONS 37 ALL-TIME BIGGEST SNOWSTORMS 38 ALL-TIME SNOWIEST DAYS 39 ADDITIONAL SNOWFALL DATA 40
4
TABLE OF CONTENTS (CONTINUED)
Page TEMPERATURE RECORDS TOP 10 COLDEST AND HOTTEST YEARS AND MONTHS 41 TOP 10 COLDEST AND HOTTEST MONTHS BY MONTH 42 TOP 10 COLDEST AND WARMEST WINTERS AND SUMMERS 48 HEAT STATISTICS 49 COLD STATISTICS 50 PRECIPITATION RECORDS TOP 10 WETTEST AND DRIEST YEARS AND MONTHS 52 TOP 10 WETTEST AND DRIEST MONTHS BY MONTH 53 CONSECUTIVE WET AND DRY DAYS 58 MEASURABLE PRECIPITATION DAYS AND EXTREMES 59 HOLIDAY WEATHER 60 HEATING AND COOLING DEGREE DAYS 64
5
TABLE OF CONTENTS (CONTINUED)
Page FIGURES: 1. Record Max/Min Temperatures in Riverton 65 2. Riverton’s Biggest Snowstorms 66 3. Normal Monthly Snowfall 67 4. Normal Monthly Precipitation 68 5. Heating/Cooling Degree Days 69
6
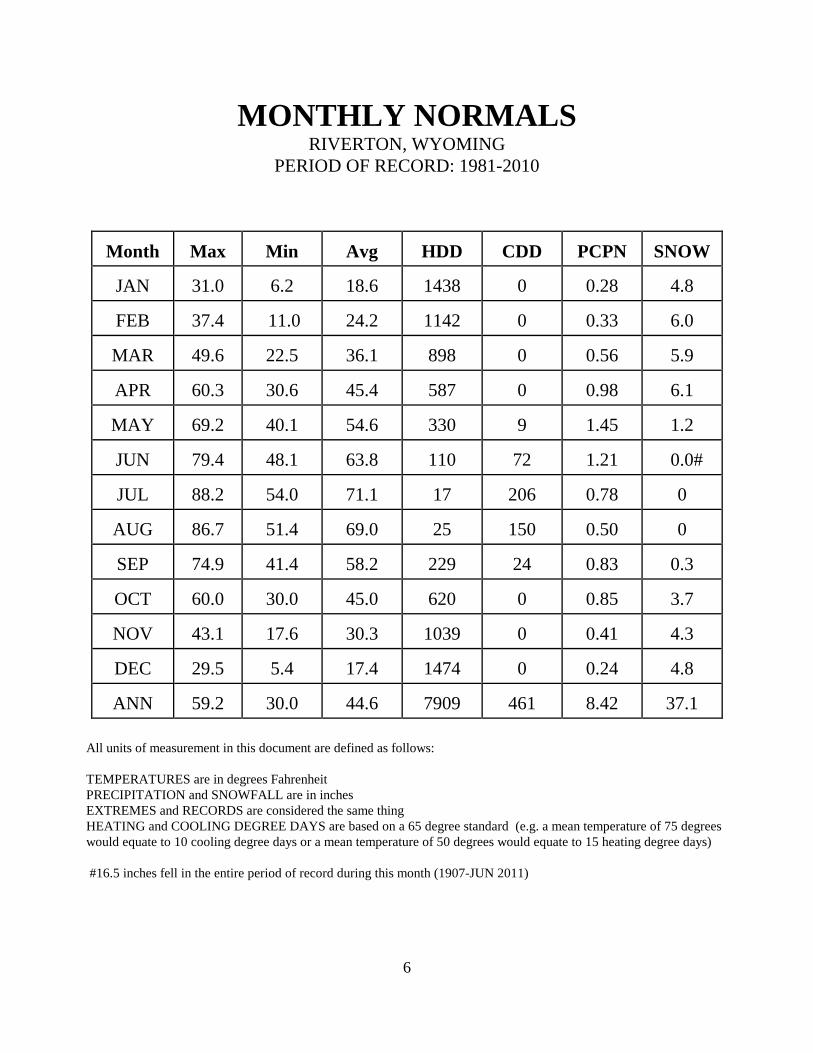
MONTHLY NORMALS RIVERTON, WYOMING
PERIOD OF RECORD: 1981-2010
Month
Max
Min
Avg
HDD
CDD
PCPN
SNOW
JAN
31.0
6.2
18.6
1438
0
0.28
4.8
FEB
37.4
11.0
24.2
1142
0
0.33
6.0
MAR
49.6
22.5
36.1
898
0
0.56
5.9
APR
60.3
30.6
45.4
587
0
0.98
6.1
MAY
69.2
40.1
54.6
330
9
1.45
1.2
JUN
79.4
48.1
63.8
110
72
1.21
0.0#
JUL
88.2
54.0
71.1
17
206
0.78
0
AUG
86.7
51.4
69.0
25
150
0.50
0
SEP
74.9
41.4
58.2
229
24
0.83
0.3
OCT
60.0
30.0
45.0
620
0
0.85
3.7
NOV
43.1
17.6
30.3
1039
0
0.41
4.3
DEC
29.5
5.4
17.4
1474
0
0.24
4.8
ANN
59.2
30.0
44.6
7909
461
8.42
37.1
All units of measurement in this document are defined as follows: TEMPERATURES are in degrees Fahrenheit PRECIPITATION and SNOWFALL are in inches EXTREMES and RECORDS are considered the same thing HEATING and COOLING DEGREE DAYS are based on a 65 degree standard (e.g. a mean temperature of 75 degrees would equate to 10 cooling degree days or a mean temperature of 50 degrees would equate to 15 heating degree days) #16.5 inches fell in the entire period of record during this month (1907-JUN 2011)
7
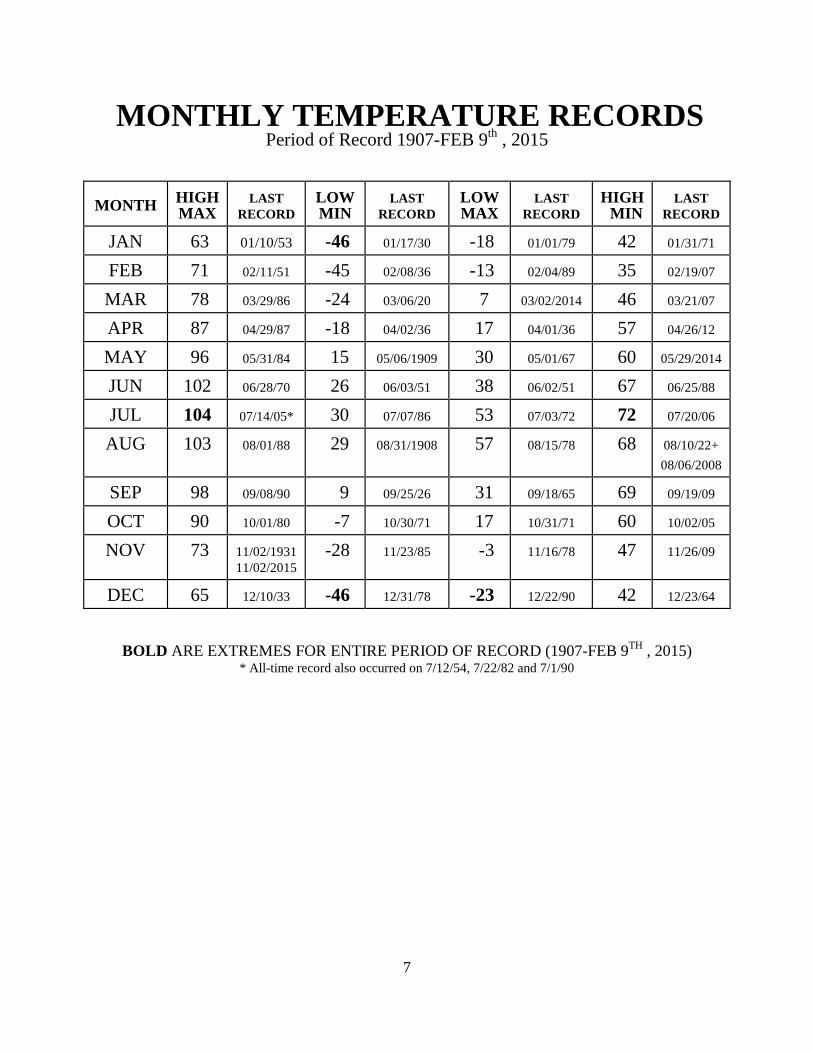
MONTHLY TEMPERATURE RECORDS Period of Record 1907-FEB 9th , 2015
MONTH
HIGH MAX
LAST
RECORD
LOW MIN
LAST
RECORD
LOW MAX
LAST
RECORD
HIGH MIN
LAST
RECORD
JAN
63 01/10/53
-46
01/17/30
-18
01/01/79
42
01/31/71
FEB
71
02/11/51
-45
02/08/36
-13
02/04/89
35
02/19/07
MAR
78
03/29/86
-24
03/06/20
7
03/02/2014
46
03/21/07
APR
87
04/29/87
-18
04/02/36
17
04/01/36
57
04/26/12
MAY
96
05/31/84
15
05/06/1909
30
05/01/67
60
05/29/2014
JUN
102
06/28/70
26
06/03/51
38
06/02/51
67
06/25/88
JUL
104
07/14/05*
30
07/07/86
53
07/03/72
72
07/20/06
AUG
103
08/01/88
29
08/31/1908
57
08/15/78
68
08/10/22+ 08/06/2008
SEP
98
09/08/90
9
09/25/26
31
09/18/65
69
09/19/09
OCT
90
10/01/80
-7
10/30/71
17
10/31/71
60
10/02/05
NOV
73
11/02/1931 11/02/2015
-28
11/23/85
-3
11/16/78
47
11/26/09
DEC
65
12/10/33
-46
12/31/78
-23
12/22/90
42
12/23/64
BOLD ARE EXTREMES FOR ENTIRE PERIOD OF RECORD (1907-FEB 9TH , 2015) * All-time record also occurred on 7/12/54, 7/22/82 and 7/1/90
8
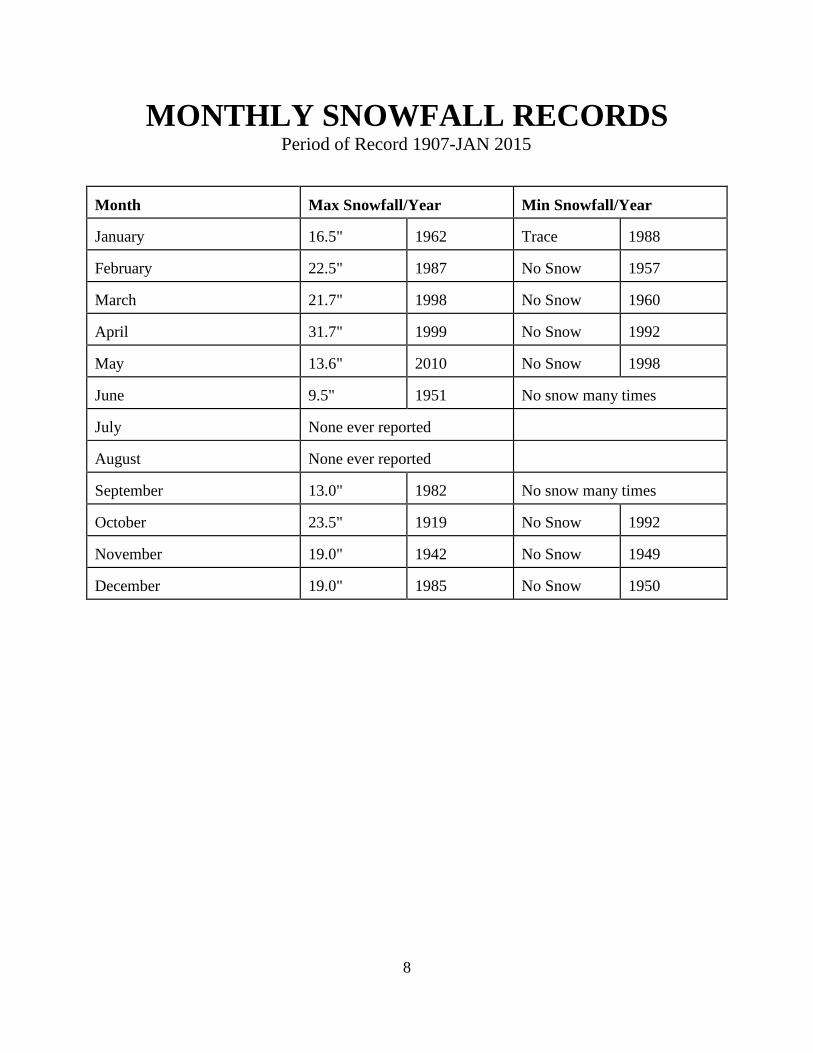
MONTHLY SNOWFALL RECORDS
Period of Record 1907-JAN 2015
Month
Max Snowfall/Year
Min Snowfall/Year
January
16.5"
1962
Trace
1988
February
22.5"
1987
No Snow
1957
March
21.7"
1998
No Snow
1960
April
31.7"
1999
No Snow
1992
May
13.6"
2010
No Snow
1998
June
9.5"
1951
No snow many times
July
None ever reported
August
None ever reported
September
13.0"
1982
No snow many times
October
23.5"
1919
No Snow
1992
November
19.0"
1942
No Snow
1949
December
19.0"
1985
No Snow
1950
9
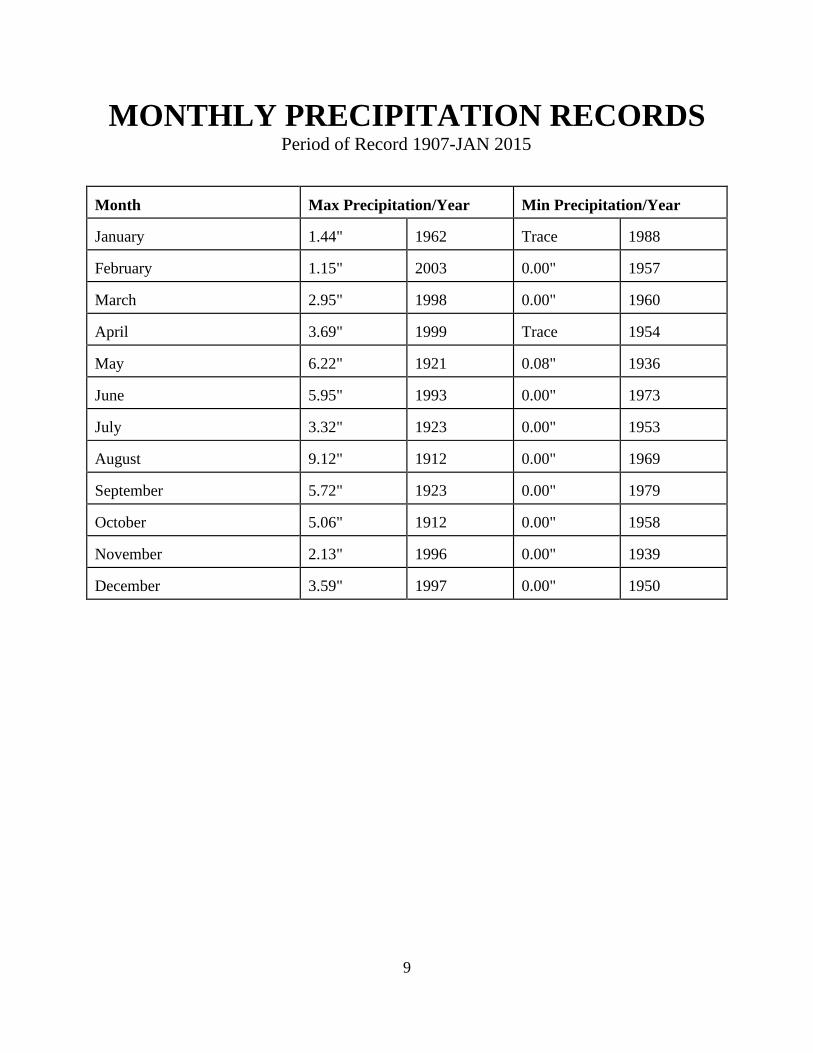
MONTHLY PRECIPITATION RECORDS
Period of Record 1907-JAN 2015
Month
Max Precipitation/Year
Min Precipitation/Year
January
1.44"
1962
Trace
1988
February
1.15"
2003
0.00"
1957
March
2.95"
1998
0.00"
1960
April
3.69"
1999
Trace
1954
May
6.22"
1921
0.08"
1936
June
5.95"
1993
0.00"
1973
July
3.32"
1923
0.00"
1953
August
9.12"
1912
0.00"
1969
September
5.72"
1923
0.00"
1979
October
5.06"
1912
0.00"
1958
November
2.13"
1996
0.00"
1939
December
3.59"
1997
0.00"
1950
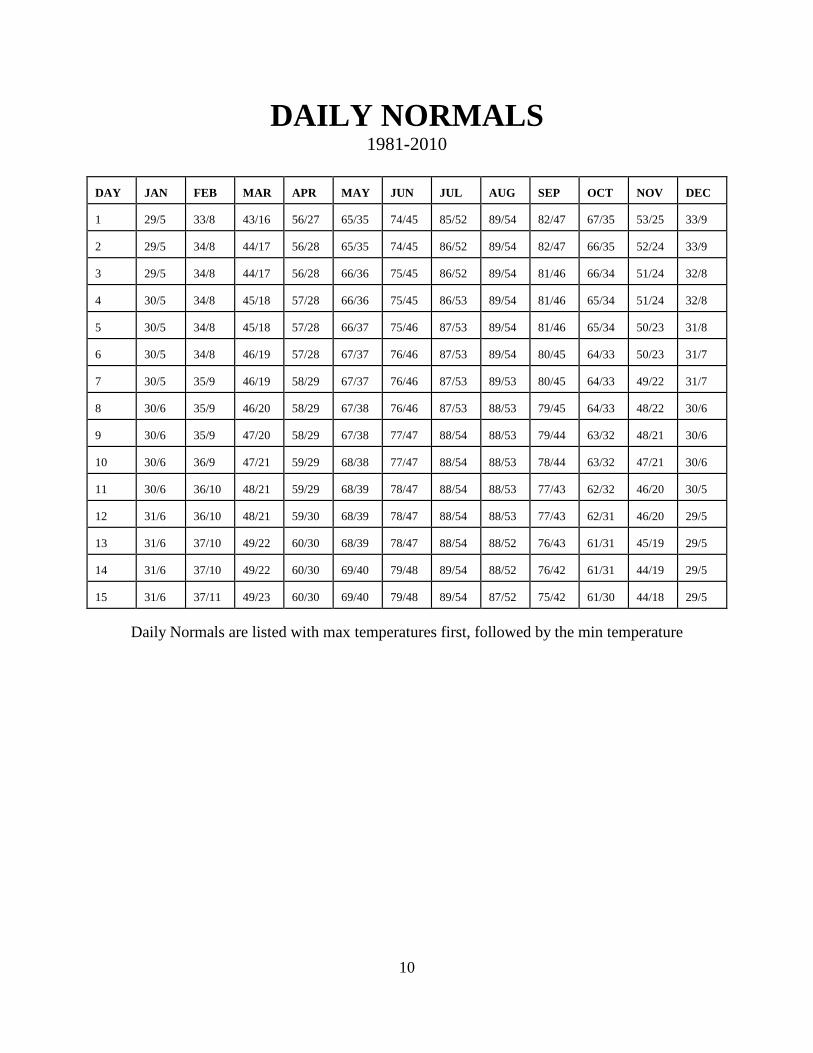
10
DAILY NORMALS 1981-2010
DAY
JAN
FEB
MAR
APR
MAY
JUN
JUL
AUG
SEP
OCT
NOV
DEC
1
29/5
33/8
43/16
56/27
65/35
74/45
85/52
89/54
82/47
67/35
53/25
33/9
2
29/5
34/8
44/17
56/28
65/35
74/45
86/52
89/54
82/47
66/35
52/24
33/9
3
29/5
34/8
44/17
56/28
66/36
75/45
86/52
89/54
81/46
66/34
51/24
32/8
4
30/5
34/8
45/18
57/28
66/36
75/45
86/53
89/54
81/46
65/34
51/24
32/8
5
30/5
34/8
45/18
57/28
66/37
75/46
87/53
89/54
81/46
65/34
50/23
31/8
6
30/5
34/8
46/19
57/28
67/37
76/46
87/53
89/54
80/45
64/33
50/23
31/7
7
30/5
35/9
46/19
58/29
67/37
76/46
87/53
89/53
80/45
64/33
49/22
31/7
8
30/6
35/9
46/20
58/29
67/38
76/46
87/53
88/53
79/45
64/33
48/22
30/6
9
30/6
35/9
47/20
58/29
67/38
77/47
88/54
88/53
79/44
63/32
48/21
30/6
10
30/6
36/9
47/21
59/29
68/38
77/47
88/54
88/53
78/44
63/32
47/21
30/6
11
30/6
36/10
48/21
59/29
68/39
78/47
88/54
88/53
77/43
62/32
46/20
30/5
12
31/6
36/10
48/21
59/30
68/39
78/47
88/54
88/53
77/43
62/31
46/20
29/5
13
31/6
37/10
49/22
60/30
68/39
78/47
88/54
88/52
76/43
61/31
45/19
29/5
14
31/6
37/10
49/22
60/30
69/40
79/48
89/54
88/52
76/42
61/31
44/19
29/5
15
31/6
37/11
49/23
60/30
69/40
79/48
89/54
87/52
75/42
61/30
44/18
29/5
Daily Normals are listed with max temperatures first, followed by the min temperature
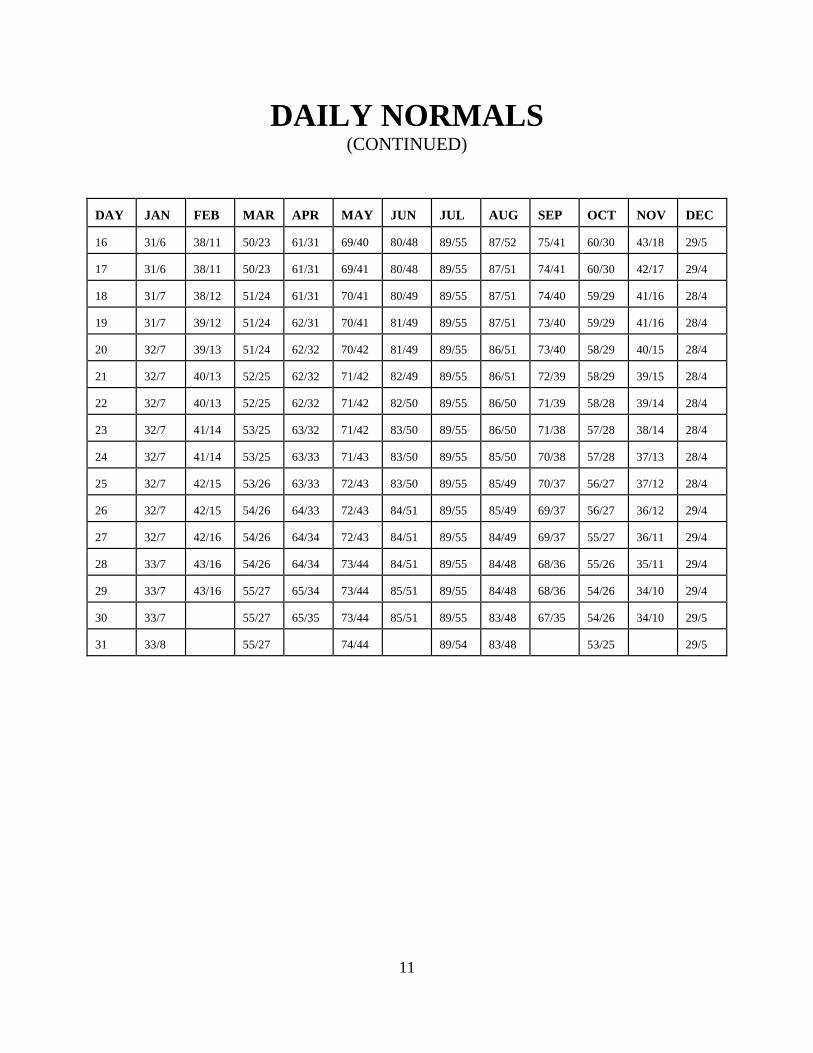
11
DAILY NORMALS (CONTINUED)
DAY JAN
FEB
MAR
APR
MAY
JUN
JUL
AUG
SEP
OCT
NOV
DEC
16
31/6
38/11
50/23
61/31
69/40
80/48
89/55
87/52
75/41
60/30
43/18
29/5
17
31/6
38/11
50/23
61/31
69/41
80/48
89/55
87/51
74/41
60/30
42/17
29/4
18
31/7
38/12
51/24
61/31
70/41
80/49
89/55
87/51
74/40
59/29
41/16
28/4
19
31/7
39/12
51/24
62/31
70/41
81/49
89/55
87/51
73/40
59/29
41/16
28/4
20
32/7
39/13
51/24
62/32
70/42
81/49
89/55
86/51
73/40
58/29
40/15
28/4
21
32/7
40/13
52/25
62/32
71/42
82/49
89/55
86/51
72/39
58/29
39/15
28/4
22
32/7
40/13
52/25
62/32
71/42
82/50
89/55
86/50
71/39
58/28
39/14
28/4
23
32/7
41/14
53/25
63/32
71/42
83/50
89/55
86/50
71/38
57/28
38/14
28/4
24
32/7
41/14
53/25
63/33
71/43
83/50
89/55
85/50
70/38
57/28
37/13
28/4
25
32/7
42/15
53/26
63/33
72/43
83/50
89/55
85/49
70/37
56/27
37/12
28/4
26
32/7
42/15
54/26
64/33
72/43
84/51
89/55
85/49
69/37
56/27
36/12
29/4
27
32/7
42/16
54/26
64/34
72/43
84/51
89/55
84/49
69/37
55/27
36/11
29/4
28
33/7
43/16
54/26
64/34
73/44
84/51
89/55
84/48
68/36
55/26
35/11
29/4
29
33/7
43/16
55/27
65/34
73/44
85/51
89/55
84/48
68/36
54/26
34/10
29/4
30
33/7
55/27
65/35
73/44
85/51
89/55
83/48
67/35
54/26
34/10
29/5
31
33/8
55/27
74/44
89/54
83/48
53/25
29/5
12
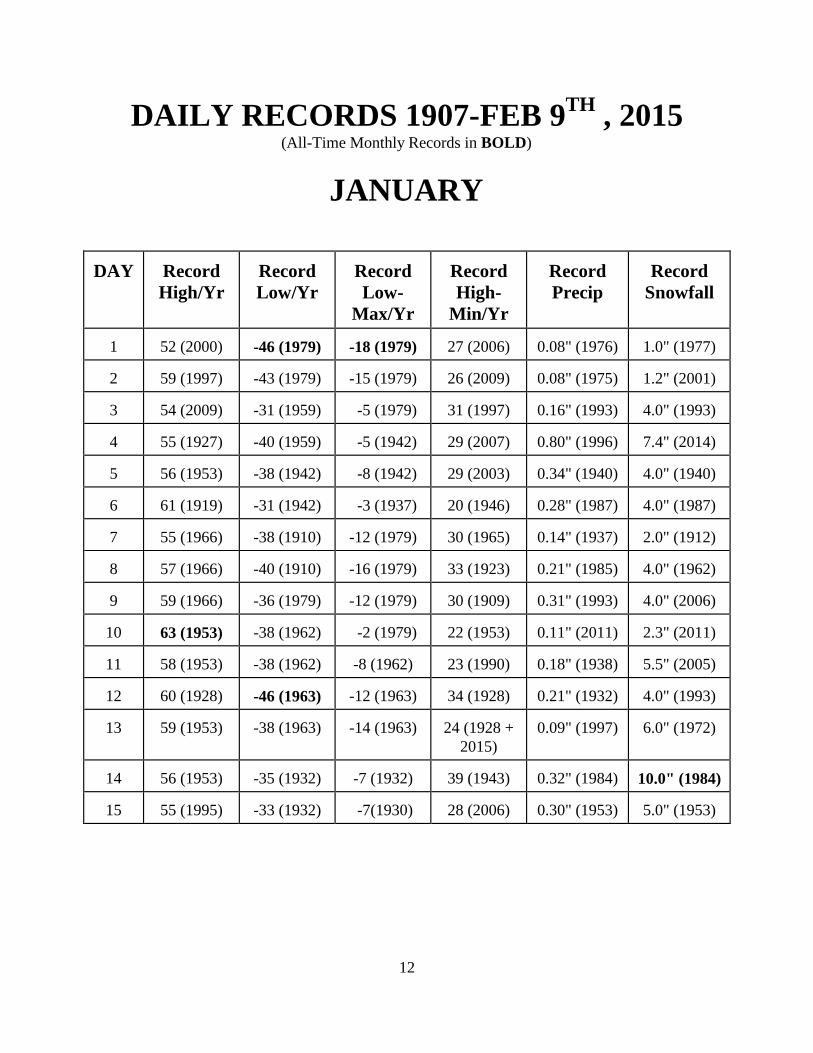
DAILY RECORDS 1907-FEB 9TH , 2015
(All-Time Monthly Records in BOLD)
JANUARY DAY
Record High/Yr
Record Low/Yr
Record Low-
Max/Yr
Record High-
Min/Yr
Record Precip
Record
Snowfall
1
52 (2000)
-46 (1979)
-18 (1979)
27 (2006)
0.08" (1976)
1.0" (1977)
2
59 (1997)
-43 (1979)
-15 (1979)
26 (2009)
0.08" (1975)
1.2" (2001)
3
54 (2009)
-31 (1959)
-5 (1979)
31 (1997)
0.16" (1993)
4.0" (1993)
4
55 (1927)
-40 (1959)
-5 (1942)
29 (2007)
0.80" (1996)
7.4" (2014)
5
56 (1953)
-38 (1942)
-8 (1942)
29 (2003)
0.34" (1940)
4.0" (1940)
6
61 (1919)
-31 (1942)
-3 (1937)
20 (1946)
0.28" (1987)
4.0" (1987)
7
55 (1966)
-38 (1910)
-12 (1979)
30 (1965)
0.14" (1937)
2.0" (1912)
8
57 (1966)
-40 (1910)
-16 (1979)
33 (1923)
0.21" (1985)
4.0" (1962)
9
59 (1966)
-36 (1979)
-12 (1979)
30 (1909)
0.31" (1993)
4.0" (2006)
10
63 (1953)
-38 (1962)
-2 (1979)
22 (1953)
0.11" (2011)
2.3" (2011)
11
58 (1953)
-38 (1962)
-8 (1962)
23 (1990)
0.18" (1938)
5.5" (2005)
12
60 (1928)
-46 (1963)
-12 (1963)
34 (1928)
0.21" (1932)
4.0" (1993)
13
59 (1953)
-38 (1963)
-14 (1963)
24 (1928 +
2015)
0.09" (1997)
6.0" (1972)
14
56 (1953)
-35 (1932)
-7 (1932)
39 (1943)
0.32" (1984)
10.0" (1984)
15
55 (1995)
-33 (1932)
-7(1930)
28 (2006)
0.30" (1953)
5.0" (1953)
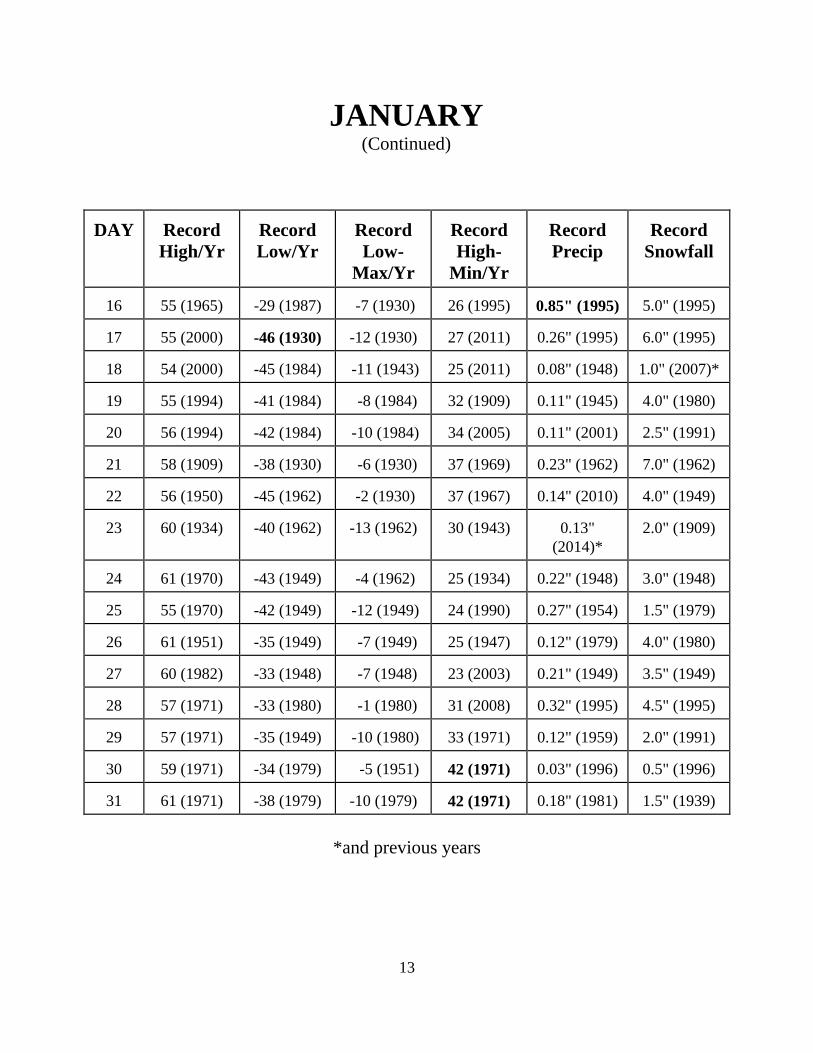
13
JANUARY (Continued)
DAY
Record High/Yr
Record Low/Yr
Record Low-
Max/Yr
Record High-
Min/Yr
Record Precip
Record
Snowfall
16
55 (1965)
-29 (1987)
-7 (1930)
26 (1995)
0.85" (1995)
5.0" (1995)
17
55 (2000)
-46 (1930)
-12 (1930)
27 (2011)
0.26" (1995)
6.0" (1995)
18
54 (2000)
-45 (1984)
-11 (1943)
25 (2011)
0.08" (1948)
1.0" (2007)*
19
55 (1994)
-41 (1984)
-8 (1984)
32 (1909)
0.11" (1945)
4.0" (1980)
20
56 (1994)
-42 (1984)
-10 (1984)
34 (2005)
0.11" (2001)
2.5" (1991)
21
58 (1909)
-38 (1930)
-6 (1930)
37 (1969)
0.23" (1962)
7.0" (1962)
22
56 (1950)
-45 (1962)
-2 (1930)
37 (1967)
0.14" (2010)
4.0" (1949)
23
60 (1934)
-40 (1962)
-13 (1962)
30 (1943)
0.13"
(2014)*
2.0" (1909)
24
61 (1970)
-43 (1949)
-4 (1962)
25 (1934)
0.22" (1948)
3.0" (1948)
25
55 (1970)
-42 (1949)
-12 (1949)
24 (1990)
0.27" (1954)
1.5" (1979)
26
61 (1951)
-35 (1949)
-7 (1949)
25 (1947)
0.12" (1979)
4.0" (1980)
27
60 (1982)
-33 (1948)
-7 (1948)
23 (2003)
0.21" (1949)
3.5" (1949)
28
57 (1971)
-33 (1980)
-1 (1980)
31 (2008)
0.32" (1995)
4.5" (1995)
29
57 (1971)
-35 (1949)
-10 (1980)
33 (1971)
0.12" (1959)
2.0" (1991)
30
59 (1971)
-34 (1979)
-5 (1951)
42 (1971)
0.03" (1996)
0.5" (1996)
31
61 (1971)
-38 (1979)
-10 (1979)
42 (1971)
0.18" (1981)
1.5" (1939)
*and previous years
14
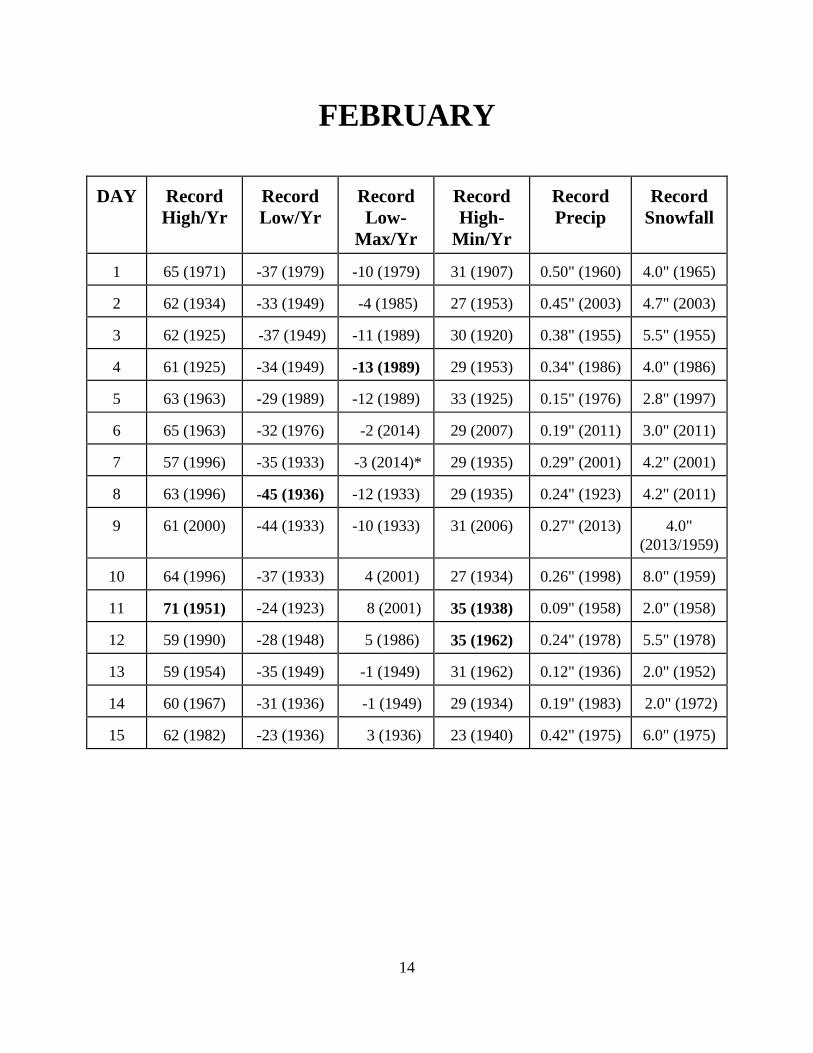
FEBRUARY
DAY
Record High/Yr
Record Low/Yr
Record Low-
Max/Yr
Record High-
Min/Yr
Record Precip
Record
Snowfall
1
65 (1971)
-37 (1979)
-10 (1979)
31 (1907)
0.50" (1960)
4.0" (1965)
2
62 (1934)
-33 (1949)
-4 (1985)
27 (1953)
0.45" (2003)
4.7" (2003)
3
62 (1925)
-37 (1949)
-11 (1989)
30 (1920)
0.38" (1955)
5.5" (1955)
4
61 (1925)
-34 (1949)
-13 (1989)
29 (1953)
0.34" (1986)
4.0" (1986)
5
63 (1963)
-29 (1989)
-12 (1989)
33 (1925)
0.15" (1976)
2.8" (1997)
6
65 (1963)
-32 (1976)
-2 (2014)
29 (2007)
0.19" (2011)
3.0" (2011)
7
57 (1996)
-35 (1933)
-3 (2014)*
29 (1935)
0.29" (2001)
4.2" (2001)
8
63 (1996)
-45 (1936)
-12 (1933)
29 (1935)
0.24" (1923)
4.2" (2011)
9
61 (2000)
-44 (1933)
-10 (1933)
31 (2006)
0.27" (2013)
4.0"
(2013/1959)
10
64 (1996) -37 (1933)
4 (2001)
27 (1934)
0.26" (1998)
8.0" (1959)
11
71 (1951)
-24 (1923)
8 (2001)
35 (1938)
0.09" (1958)
2.0" (1958)
12
59 (1990)
-28 (1948)
5 (1986)
35 (1962)
0.24" (1978)
5.5" (1978)
13
59 (1954)
-35 (1949)
-1 (1949)
31 (1962)
0.12" (1936)
2.0" (1952)
14
60 (1967)
-31 (1936)
-1 (1949)
29 (1934)
0.19" (1983)
2.0" (1972)
15
62 (1982)
-23 (1936)
3 (1936)
23 (1940)
0.42" (1975)
6.0" (1975)
15
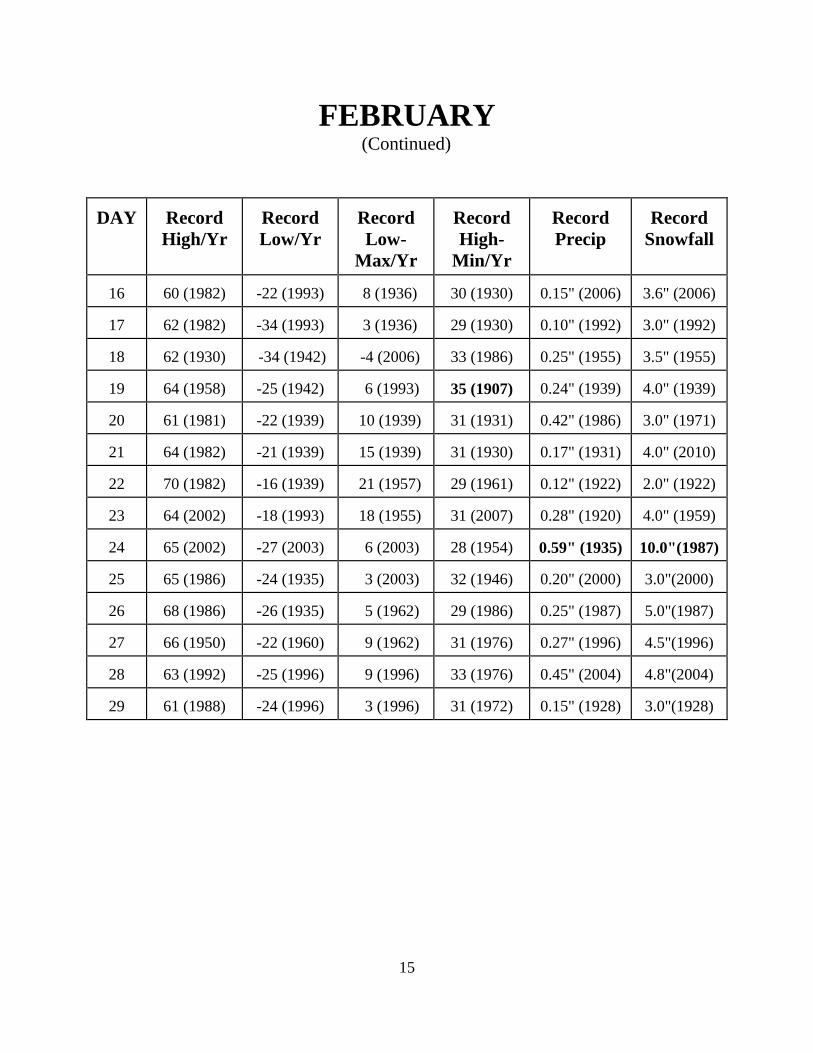
FEBRUARY (Continued)
DAY
Record High/Yr
Record Low/Yr
Record Low-
Max/Yr
Record High-
Min/Yr
Record Precip
Record
Snowfall
16
60 (1982)
-22 (1993)
8 (1936)
30 (1930)
0.15" (2006)
3.6" (2006)
17
62 (1982)
-34 (1993)
3 (1936)
29 (1930)
0.10" (1992)
3.0" (1992)
18
62 (1930)
-34 (1942)
-4 (2006)
33 (1986)
0.25" (1955)
3.5" (1955)
19
64 (1958)
-25 (1942)
6 (1993)
35 (1907)
0.24" (1939)
4.0" (1939)
20
61 (1981)
-22 (1939)
10 (1939)
31 (1931)
0.42" (1986)
3.0" (1971)
21
64 (1982)
-21 (1939)
15 (1939)
31 (1930)
0.17" (1931)
4.0" (2010)
22
70 (1982)
-16 (1939)
21 (1957)
29 (1961)
0.12" (1922)
2.0" (1922)
23
64 (2002)
-18 (1993)
18 (1955)
31 (2007)
0.28" (1920)
4.0" (1959)
24
65 (2002)
-27 (2003)
6 (2003)
28 (1954)
0.59" (1935)
10.0"(1987)
25
65 (1986)
-24 (1935)
3 (2003)
32 (1946)
0.20" (2000)
3.0"(2000)
26
68 (1986)
-26 (1935)
5 (1962)
29 (1986)
0.25" (1987)
5.0"(1987)
27
66 (1950)
-22 (1960)
9 (1962)
31 (1976)
0.27" (1996)
4.5"(1996)
28
63 (1992)
-25 (1996)
9 (1996)
33 (1976)
0.45" (2004)
4.8"(2004)
29
61 (1988)
-24 (1996)
3 (1996)
31 (1972)
0.15" (1928)
3.0"(1928)
16
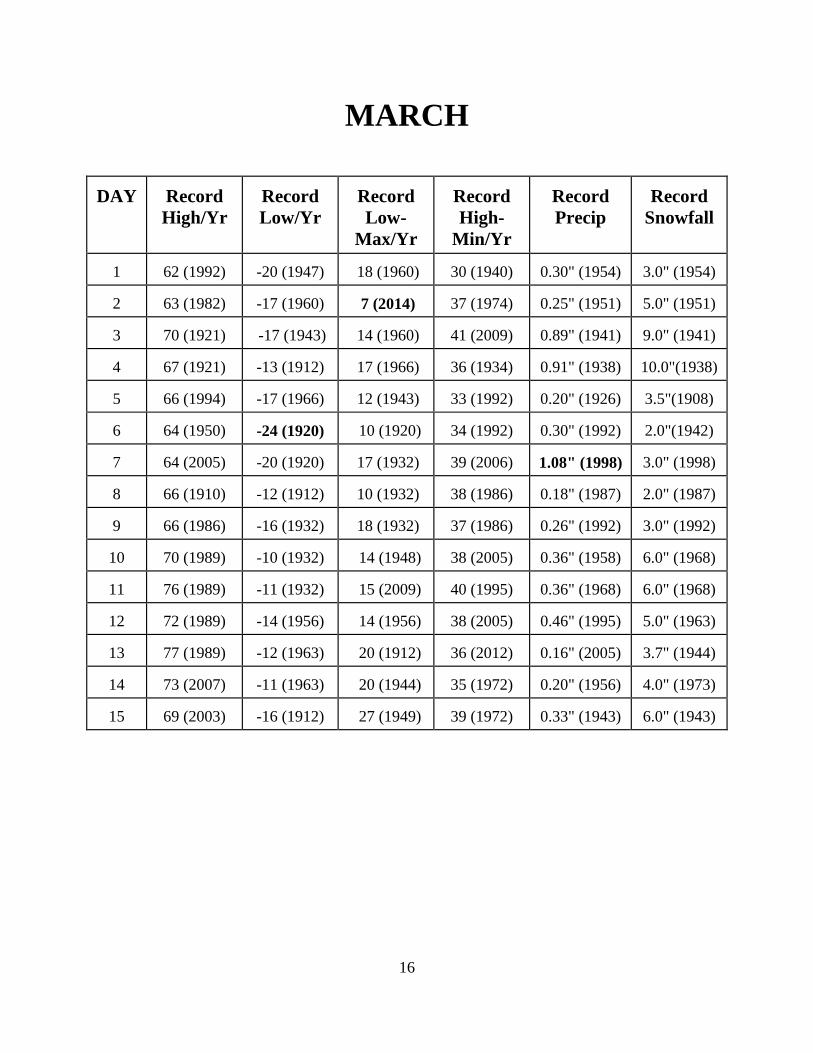
MARCH
DAY
Record High/Yr
Record Low/Yr
Record Low-
Max/Yr
Record High-
Min/Yr
Record Precip
Record
Snowfall
1
62 (1992)
-20 (1947)
18 (1960)
30 (1940)
0.30" (1954)
3.0" (1954)
2
63 (1982)
-17 (1960)
7 (2014)
37 (1974)
0.25" (1951)
5.0" (1951)
3
70 (1921)
-17 (1943)
14 (1960)
41 (2009)
0.89" (1941)
9.0" (1941)
4
67 (1921)
-13 (1912)
17 (1966)
36 (1934)
0.91" (1938)
10.0"(1938)
5
66 (1994)
-17 (1966)
12 (1943)
33 (1992)
0.20" (1926)
3.5"(1908)
6
64 (1950)
-24 (1920)
10 (1920)
34 (1992)
0.30" (1992)
2.0"(1942)
7
64 (2005)
-20 (1920)
17 (1932)
39 (2006)
1.08" (1998)
3.0" (1998)
8
66 (1910)
-12 (1912)
10 (1932)
38 (1986)
0.18" (1987)
2.0" (1987)
9
66 (1986)
-16 (1932)
18 (1932)
37 (1986)
0.26" (1992)
3.0" (1992)
10
70 (1989)
-10 (1932)
14 (1948)
38 (2005)
0.36" (1958)
6.0" (1968)
11
76 (1989)
-11 (1932)
15 (2009)
40 (1995)
0.36" (1968)
6.0" (1968)
12
72 (1989)
-14 (1956)
14 (1956)
38 (2005)
0.46" (1995)
5.0" (1963)
13
77 (1989)
-12 (1963)
20 (1912)
36 (2012)
0.16" (2005)
3.7" (1944)
14
73 (2007)
-11 (1963)
20 (1944)
35 (1972)
0.20" (1956)
4.0" (1973)
15
69 (2003)
-16 (1912)
27 (1949)
39 (1972)
0.33" (1943)
6.0" (1943)
17
MARCH (Continued)
DAY
Record High/Yr
Record Low/Yr
Record Low-
Max/Yr
Record High-
Min/Yr
Record Precip
Record
Snowfall
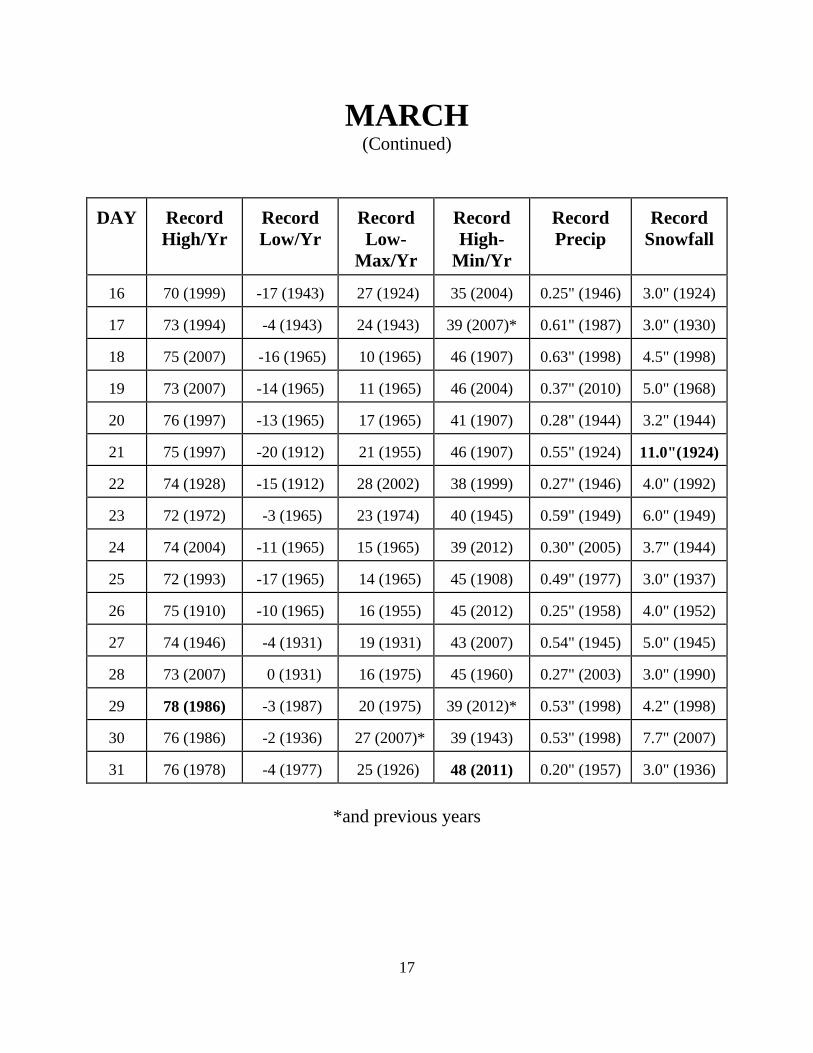
16
70 (1999)
-17 (1943)
27 (1924)
35 (2004)
0.25" (1946)
3.0" (1924)
17
73 (1994)
-4 (1943)
24 (1943)
39 (2007)*
0.61" (1987)
3.0" (1930)
18
75 (2007)
-16 (1965)
10 (1965)
46 (1907)
0.63" (1998)
4.5" (1998)
19
73 (2007)
-14 (1965)
11 (1965)
46 (2004)
0.37" (2010)
5.0" (1968)
20
76 (1997)
-13 (1965)
17 (1965)
41 (1907)
0.28" (1944)
3.2" (1944)
21
75 (1997)
-20 (1912)
21 (1955)
46 (1907)
0.55" (1924)
11.0"(1924)
22
74 (1928)
-15 (1912)
28 (2002)
38 (1999)
0.27" (1946)
4.0" (1992)
23
72 (1972)
-3 (1965)
23 (1974)
40 (1945)
0.59" (1949)
6.0" (1949)
24
74 (2004)
-11 (1965)
15 (1965)
39 (2012)
0.30" (2005)
3.7" (1944)
25
72 (1993)
-17 (1965)
14 (1965)
45 (1908)
0.49" (1977)
3.0" (1937)
26
75 (1910)
-10 (1965)
16 (1955)
45 (2012)
0.25" (1958)
4.0" (1952)
27
74 (1946)
-4 (1931)
19 (1931)
43 (2007)
0.54" (1945)
5.0" (1945)
28
73 (2007)
0 (1931)
16 (1975)
45 (1960)
0.27" (2003)
3.0" (1990)
29
78 (1986)
-3 (1987)
20 (1975)
39 (2012)*
0.53" (1998)
4.2" (1998)
30
76 (1986)
-2 (1936)
27 (2007)*
39 (1943)
0.53" (1998)
7.7" (2007)
31
76 (1978)
-4 (1977)
25 (1926)
48 (2011)
0.20" (1957)
3.0" (1936)
*and previous years
18
APRIL
DAY
Record High/Yr
Record Low/Yr
Record Low-
Max/Yr
Record High-
Min/Yr
Record Precip
Record
Snowfall
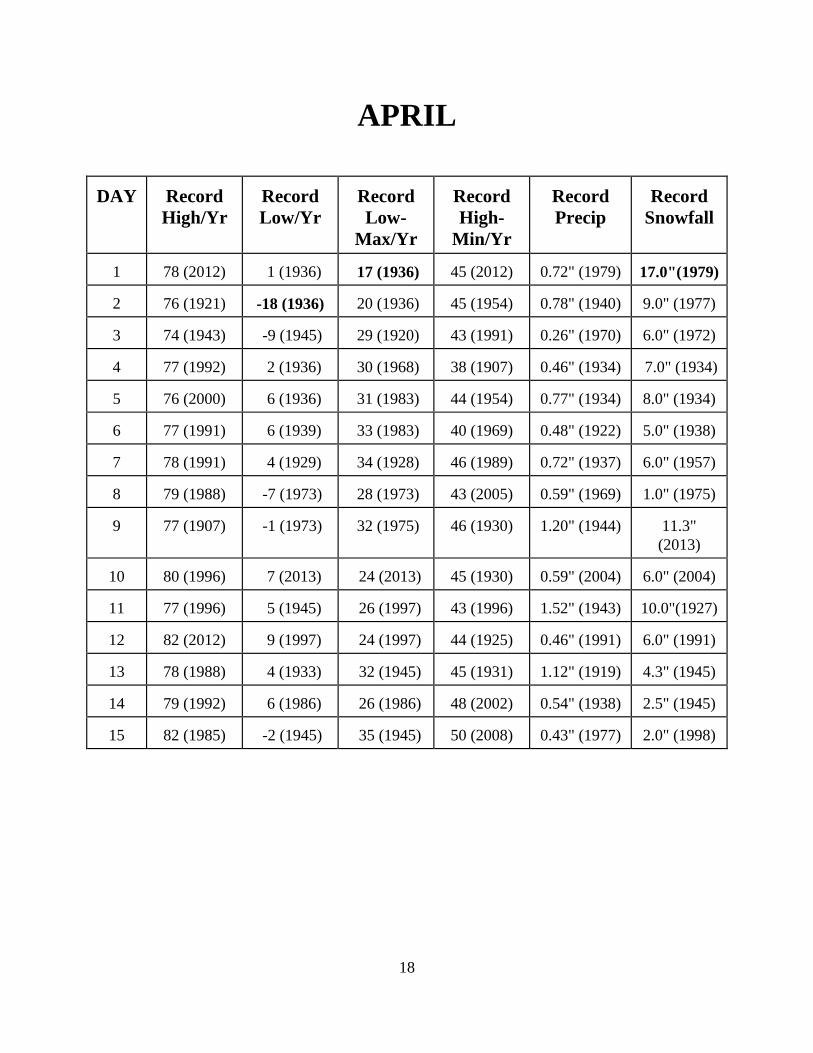
1
78 (2012)
1 (1936)
17 (1936)
45 (2012)
0.72" (1979)
17.0"(1979)
2
76 (1921)
-18 (1936)
20 (1936)
45 (1954)
0.78" (1940)
9.0" (1977)
3
74 (1943)
-9 (1945)
29 (1920)
43 (1991)
0.26" (1970)
6.0" (1972)
4
77 (1992)
2 (1936)
30 (1968)
38 (1907)
0.46" (1934)
7.0" (1934)
5
76 (2000)
6 (1936)
31 (1983)
44 (1954)
0.77" (1934)
8.0" (1934)
6
77 (1991)
6 (1939)
33 (1983)
40 (1969)
0.48" (1922)
5.0" (1938)
7
78 (1991)
4 (1929)
34 (1928)
46 (1989)
0.72" (1937)
6.0" (1957)
8
79 (1988)
-7 (1973)
28 (1973)
43 (2005)
0.59" (1969)
1.0" (1975)
9
77 (1907)
-1 (1973)
32 (1975)
46 (1930)
1.20" (1944)
11.3" (2013)
10
80 (1996)
7 (2013)
24 (2013)
45 (1930)
0.59" (2004)
6.0" (2004)
11
77 (1996)
5 (1945)
26 (1997)
43 (1996)
1.52" (1943)
10.0"(1927)
12
82 (2012)
9 (1997)
24 (1997)
44 (1925)
0.46" (1991)
6.0" (1991)
13
78 (1988)
4 (1933)
32 (1945)
45 (1931)
1.12" (1919)
4.3" (1945)
14
79 (1992)
6 (1986)
26 (1986)
48 (2002)
0.54" (1938)
2.5" (1945)
15
82 (1985)
-2 (1945)
35 (1945)
50 (2008)
0.43" (1977)
2.0" (1998)
19
APRIL (Continued)
DAY
Record High/Yr
Record Low/Yr
Record Low-
Max/Yr
Record High-
Min/Yr
Record Precip
Record
Snowfall
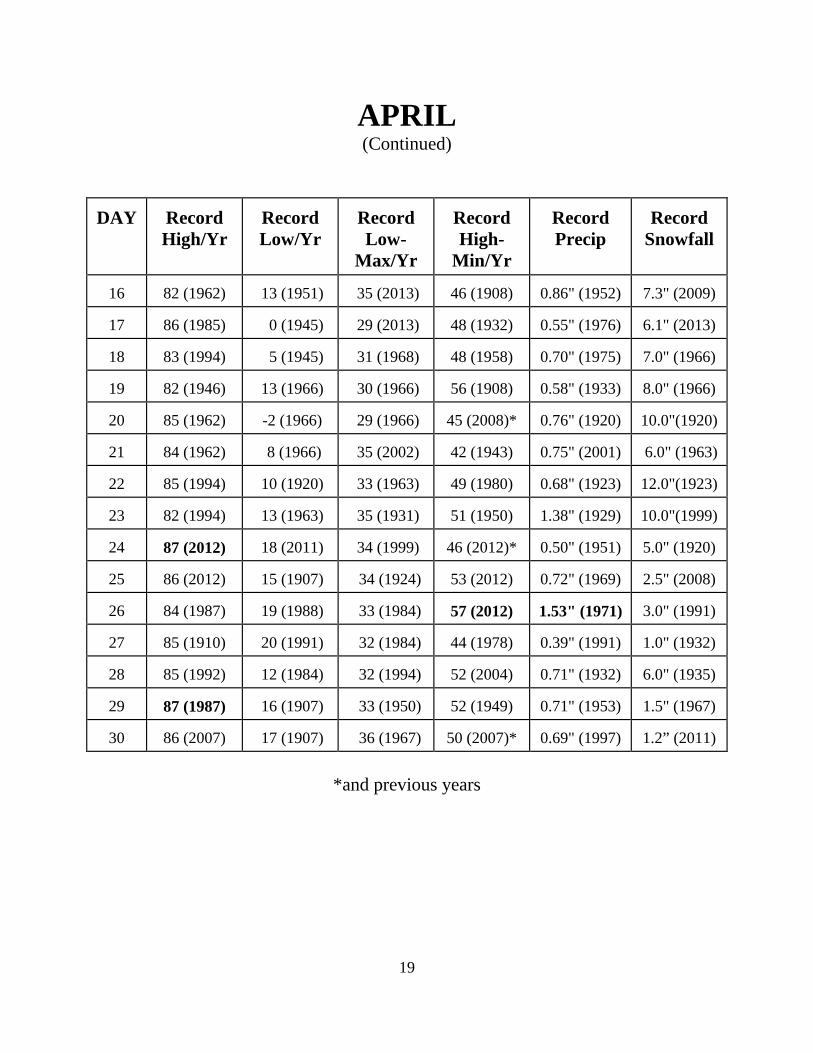
16
82 (1962)
13 (1951)
35 (2013)
46 (1908)
0.86" (1952)
7.3" (2009)
17
86 (1985)
0 (1945)
29 (2013)
48 (1932)
0.55" (1976)
6.1" (2013)
18
83 (1994)
5 (1945)
31 (1968)
48 (1958)
0.70" (1975)
7.0" (1966)
19
82 (1946)
13 (1966)
30 (1966)
56 (1908)
0.58" (1933)
8.0" (1966)
20
85 (1962)
-2 (1966)
29 (1966)
45 (2008)*
0.76" (1920)
10.0"(1920)
21
84 (1962)
8 (1966)
35 (2002)
42 (1943)
0.75" (2001)
6.0" (1963)
22
85 (1994)
10 (1920)
33 (1963)
49 (1980)
0.68" (1923)
12.0"(1923)
23
82 (1994)
13 (1963)
35 (1931)
51 (1950)
1.38" (1929)
10.0"(1999)
24
87 (2012)
18 (2011)
34 (1999)
46 (2012)*
0.50" (1951)
5.0" (1920)
25
86 (2012)
15 (1907)
34 (1924)
53 (2012)
0.72" (1969)
2.5" (2008)
26
84 (1987)
19 (1988)
33 (1984)
57 (2012)
1.53" (1971)
3.0" (1991)
27
85 (1910)
20 (1991)
32 (1984)
44 (1978)
0.39" (1991)
1.0" (1932)
28
85 (1992)
12 (1984)
32 (1994)
52 (2004)
0.71" (1932)
6.0" (1935)
29
87 (1987)
16 (1907)
33 (1950)
52 (1949)
0.71" (1953)
1.5" (1967)
30
86 (2007)
17 (1907)
36 (1967)
50 (2007)*
0.69" (1997)
1.2” (2011)
*and previous years
20
MAY
DAY
Record High/Yr
Record Low/Yr
Record Low-
Max/Yr
Record High-
Min/Yr
Record Precip
Record
Snowfall
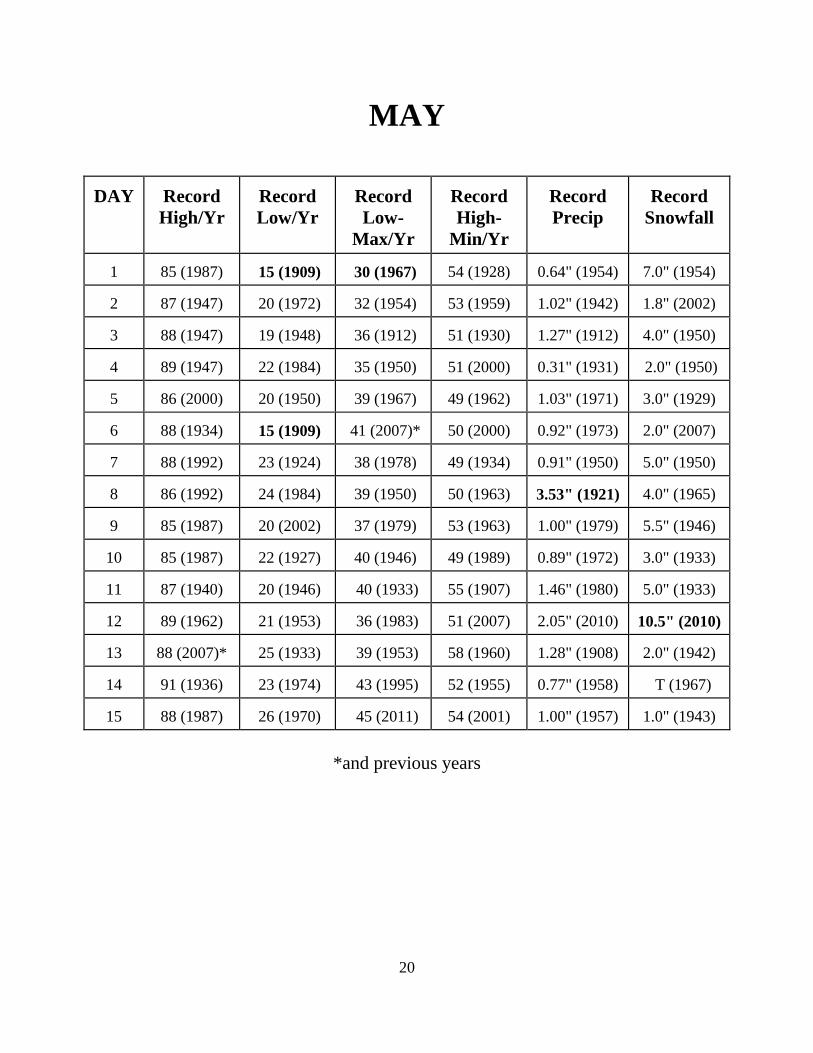
1
85 (1987)
15 (1909)
30 (1967)
54 (1928)
0.64" (1954)
7.0" (1954)
2
87 (1947)
20 (1972)
32 (1954)
53 (1959)
1.02" (1942)
1.8" (2002)
3
88 (1947)
19 (1948)
36 (1912)
51 (1930)
1.27" (1912)
4.0" (1950)
4
89 (1947)
22 (1984)
35 (1950)
51 (2000)
0.31" (1931)
2.0" (1950)
5
86 (2000)
20 (1950)
39 (1967)
49 (1962)
1.03" (1971)
3.0" (1929)
6
88 (1934)
15 (1909)
41 (2007)*
50 (2000)
0.92" (1973)
2.0" (2007)
7
88 (1992)
23 (1924)
38 (1978)
49 (1934)
0.91" (1950)
5.0" (1950)
8
86 (1992)
24 (1984)
39 (1950)
50 (1963)
3.53" (1921)
4.0" (1965)
9
85 (1987)
20 (2002)
37 (1979)
53 (1963)
1.00" (1979)
5.5" (1946)
10
85 (1987)
22 (1927)
40 (1946)
49 (1989)
0.89" (1972)
3.0" (1933)
11
87 (1940)
20 (1946)
40 (1933)
55 (1907)
1.46" (1980)
5.0" (1933)
12
89 (1962)
21 (1953)
36 (1983)
51 (2007)
2.05" (2010)
10.5" (2010)
13
88 (2007)*
25 (1933)
39 (1953)
58 (1960)
1.28" (1908)
2.0" (1942)
14
91 (1936)
23 (1974)
43 (1995)
52 (1955)
0.77" (1958)
T (1967)
15
88 (1987)
26 (1970)
45 (2011)
54 (2001)
1.00" (1957)
1.0" (1943)
*and previous years
21
MAY (Continued)
DAY
Record High/Yr
Record Low/Yr
Record Low-
Max/Yr
Record High-
Min/Yr
Record Precip
Record
Snowfall
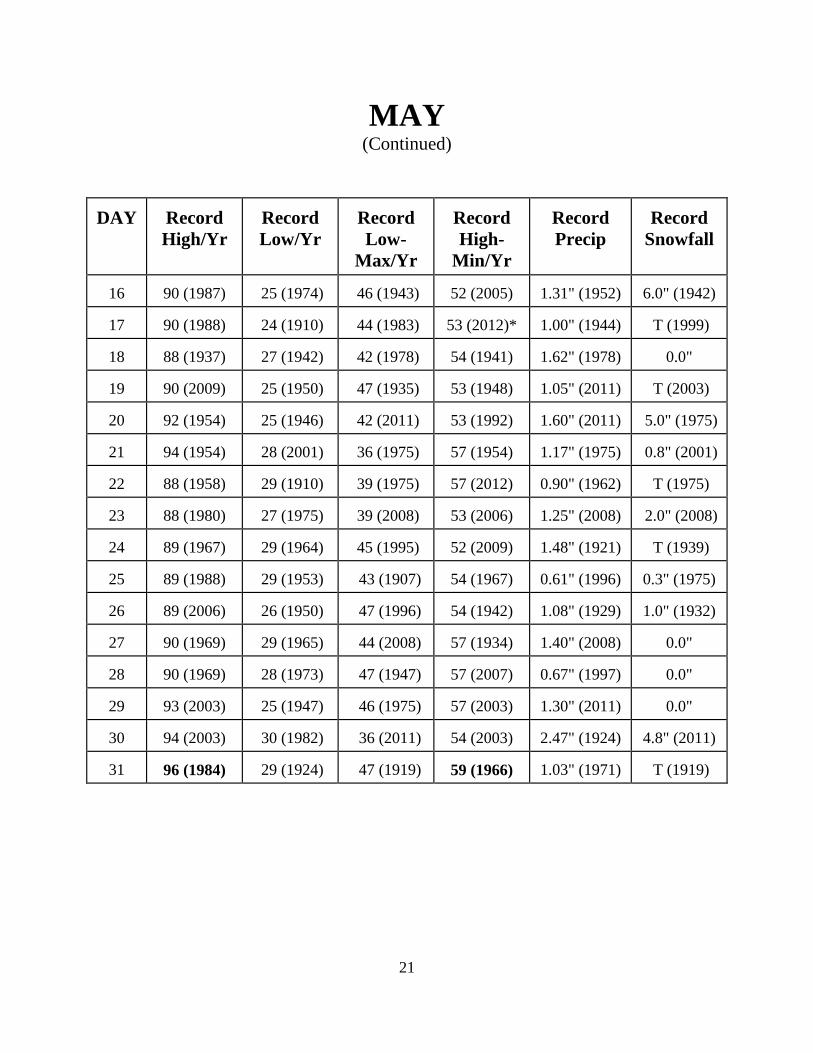
16
90 (1987)
25 (1974)
46 (1943)
52 (2005)
1.31" (1952)
6.0" (1942)
17
90 (1988)
24 (1910)
44 (1983)
53 (2012)*
1.00" (1944)
T (1999)
18
88 (1937)
27 (1942)
42 (1978)
54 (1941)
1.62" (1978)
0.0"
19
90 (2009)
25 (1950)
47 (1935)
53 (1948)
1.05" (2011)
T (2003)
20
92 (1954)
25 (1946)
42 (2011)
53 (1992)
1.60" (2011)
5.0" (1975)
21
94 (1954)
28 (2001)
36 (1975)
57 (1954)
1.17" (1975)
0.8" (2001)
22
88 (1958)
29 (1910)
39 (1975)
57 (2012)
0.90" (1962)
T (1975)
23
88 (1980)
27 (1975)
39 (2008)
53 (2006)
1.25" (2008)
2.0" (2008)
24
89 (1967)
29 (1964)
45 (1995)
52 (2009)
1.48" (1921)
T (1939)
25
89 (1988)
29 (1953)
43 (1907)
54 (1967)
0.61" (1996)
0.3" (1975)
26
89 (2006)
26 (1950)
47 (1996)
54 (1942)
1.08" (1929)
1.0" (1932)
27
90 (1969)
29 (1965)
44 (2008)
57 (1934)
1.40" (2008)
0.0"
28
90 (1969)
28 (1973)
47 (1947)
57 (2007)
0.67" (1997)
0.0"
29
93 (2003)
25 (1947)
46 (1975)
57 (2003)
1.30" (2011)
0.0"
30
94 (2003)
30 (1982)
36 (2011)
54 (2003)
2.47" (1924)
4.8" (2011)
31
96 (1984)
29 (1924)
47 (1919)
59 (1966)
1.03" (1971)
T (1919)
22
JUNE
DAY
Record High/Yr
Record Low/Yr
Record Low-
Max/Yr
Record High-
Min/Yr
Record Precip
Record
Snowfall
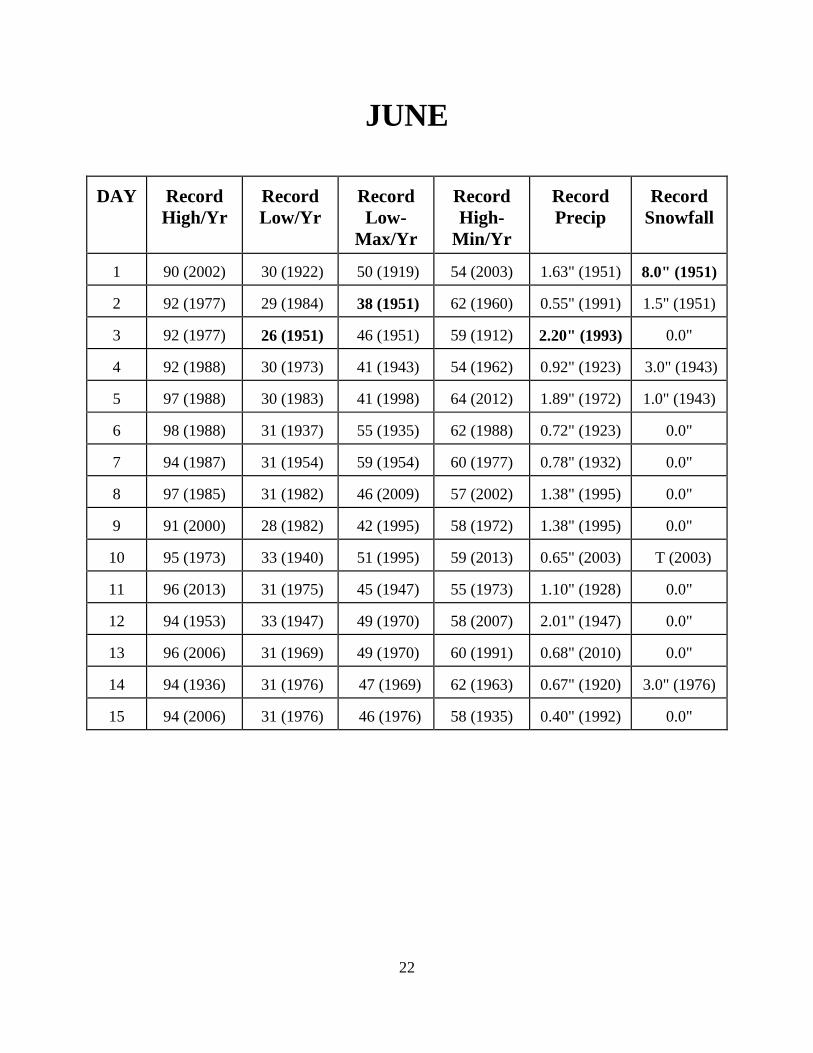
1
90 (2002)
30 (1922)
50 (1919)
54 (2003)
1.63" (1951)
8.0" (1951)
2
92 (1977)
29 (1984)
38 (1951)
62 (1960)
0.55" (1991)
1.5" (1951)
3
92 (1977)
26 (1951)
46 (1951)
59 (1912)
2.20" (1993)
0.0"
4
92 (1988)
30 (1973)
41 (1943)
54 (1962)
0.92" (1923)
3.0" (1943)
5
97 (1988)
30 (1983)
41 (1998)
64 (2012)
1.89" (1972)
1.0" (1943)
6
98 (1988)
31 (1937)
55 (1935)
62 (1988)
0.72" (1923)
0.0"
7
94 (1987)
31 (1954)
59 (1954)
60 (1977)
0.78" (1932)
0.0"
8
97 (1985)
31 (1982)
46 (2009)
57 (2002)
1.38" (1995)
0.0"
9
91 (2000)
28 (1982)
42 (1995)
58 (1972)
1.38" (1995)
0.0"
10
95 (1973)
33 (1940)
51 (1995)
59 (2013)
0.65" (2003)
T (2003)
11
96 (2013)
31 (1975)
45 (1947)
55 (1973)
1.10" (1928)
0.0"
12
94 (1953)
33 (1947)
49 (1970)
58 (2007)
2.01" (1947)
0.0"
13
96 (2006)
31 (1969)
49 (1970)
60 (1991)
0.68" (2010)
0.0"
14
94 (1936)
31 (1976)
47 (1969)
62 (1963)
0.67" (1920)
3.0" (1976)
15
94 (2006)
31 (1976)
46 (1976)
58 (1935)
0.40" (1992)
0.0"
23
JUNE (Continued)
DAY
Record High/Yr
Record Low/Yr
Record Low-
Max/Yr
Record High-
Min/Yr
Record Precip
Record
Snowfall
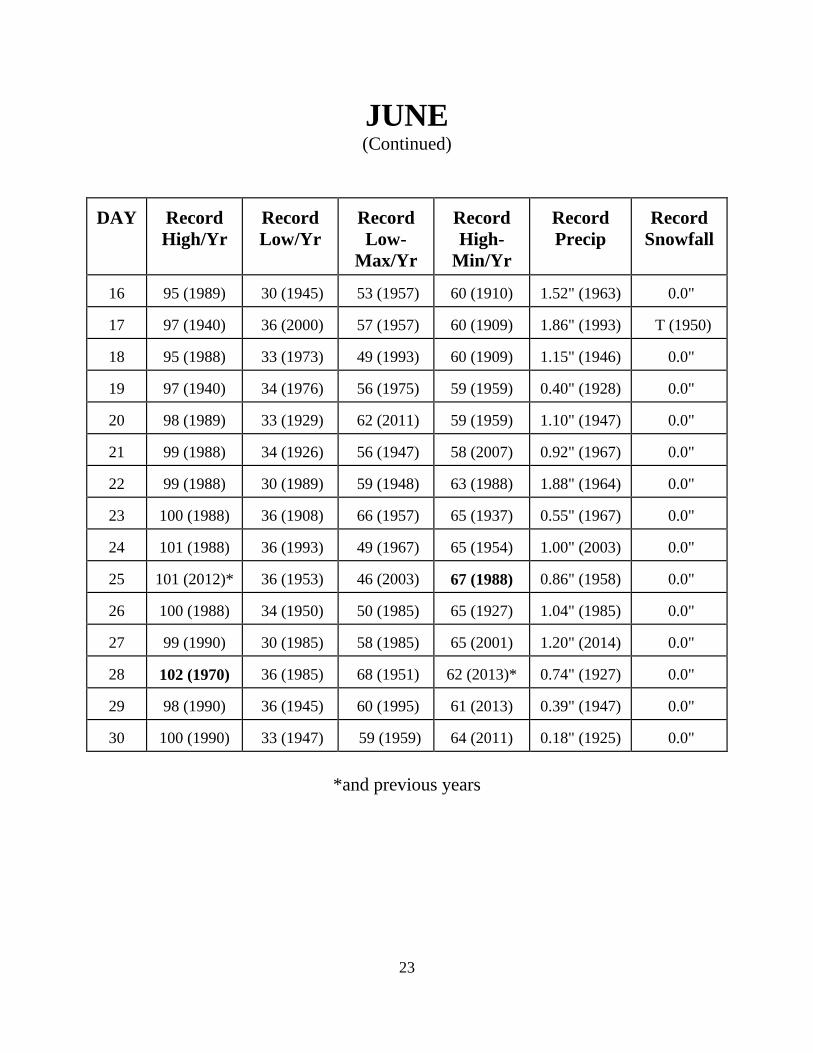
16
95 (1989)
30 (1945)
53 (1957)
60 (1910)
1.52" (1963)
0.0"
17
97 (1940)
36 (2000)
57 (1957)
60 (1909)
1.86" (1993)
T (1950)
18
95 (1988)
33 (1973)
49 (1993)
60 (1909)
1.15" (1946)
0.0"
19
97 (1940)
34 (1976)
56 (1975)
59 (1959)
0.40" (1928)
0.0"
20
98 (1989)
33 (1929)
62 (2011)
59 (1959)
1.10" (1947)
0.0"
21
99 (1988)
34 (1926)
56 (1947)
58 (2007)
0.92" (1967)
0.0"
22
99 (1988)
30 (1989)
59 (1948)
63 (1988)
1.88" (1964)
0.0"
23
100 (1988)
36 (1908)
66 (1957)
65 (1937)
0.55" (1967)
0.0"
24
101 (1988)
36 (1993)
49 (1967)
65 (1954)
1.00" (2003)
0.0"
25
101 (2012)*
36 (1953)
46 (2003)
67 (1988)
0.86" (1958)
0.0"
26
100 (1988)
34 (1950)
50 (1985)
65 (1927)
1.04" (1985)
0.0"
27
99 (1990)
30 (1985)
58 (1985)
65 (2001)
1.20" (2014)
0.0"
28
102 (1970)
36 (1985)
68 (1951)
62 (2013)*
0.74" (1927)
0.0"
29
98 (1990)
36 (1945)
60 (1995)
61 (2013)
0.39" (1947)
0.0"
30
100 (1990)
33 (1947)
59 (1959)
64 (2011)
0.18" (1925)
0.0"
*and previous years
24
JULY
DAY
Record High/Yr
Record Low/Yr
Record Low-
Max/Yr
Record High-
Min/Yr
Record Precip
Record
Snowfall
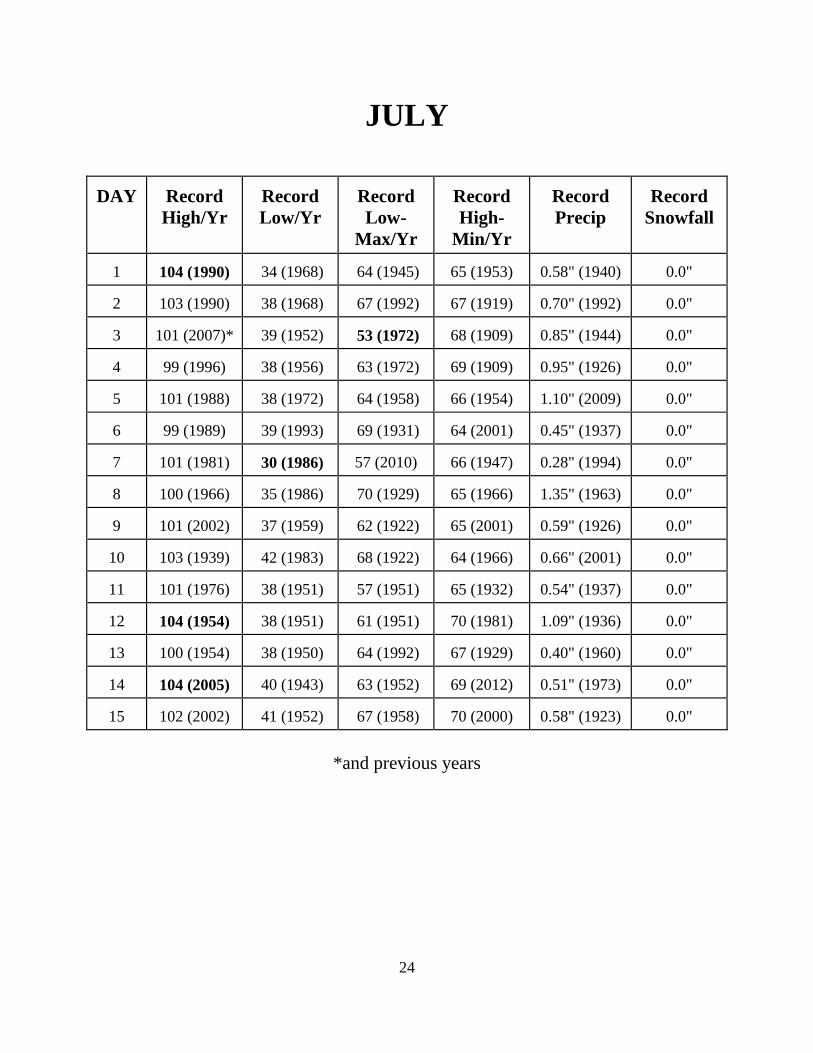
1
104 (1990)
34 (1968)
64 (1945)
65 (1953)
0.58" (1940)
0.0"
2
103 (1990)
38 (1968)
67 (1992)
67 (1919)
0.70" (1992)
0.0"
3
101 (2007)*
39 (1952)
53 (1972)
68 (1909)
0.85" (1944)
0.0"
4
99 (1996)
38 (1956)
63 (1972)
69 (1909)
0.95" (1926)
0.0"
5
101 (1988)
38 (1972)
64 (1958)
66 (1954)
1.10" (2009)
0.0"
6
99 (1989)
39 (1993)
69 (1931)
64 (2001)
0.45" (1937)
0.0"
7
101 (1981)
30 (1986)
57 (2010)
66 (1947)
0.28" (1994)
0.0"
8
100 (1966)
35 (1986)
70 (1929)
65 (1966)
1.35" (1963)
0.0"
9
101 (2002)
37 (1959)
62 (1922)
65 (2001)
0.59" (1926)
0.0"
10
103 (1939)
42 (1983)
68 (1922)
64 (1966)
0.66" (2001)
0.0"
11
101 (1976)
38 (1951)
57 (1951)
65 (1932)
0.54" (1937)
0.0"
12
104 (1954)
38 (1951)
61 (1951)
70 (1981)
1.09" (1936)
0.0"
13
100 (1954)
38 (1950)
64 (1992)
67 (1929)
0.40" (1960)
0.0"
14
104 (2005)
40 (1943)
63 (1952)
69 (2012)
0.51" (1973)
0.0"
15
102 (2002)
41 (1952)
67 (1958)
70 (2000)
0.58" (1923)
0.0"
*and previous years
25
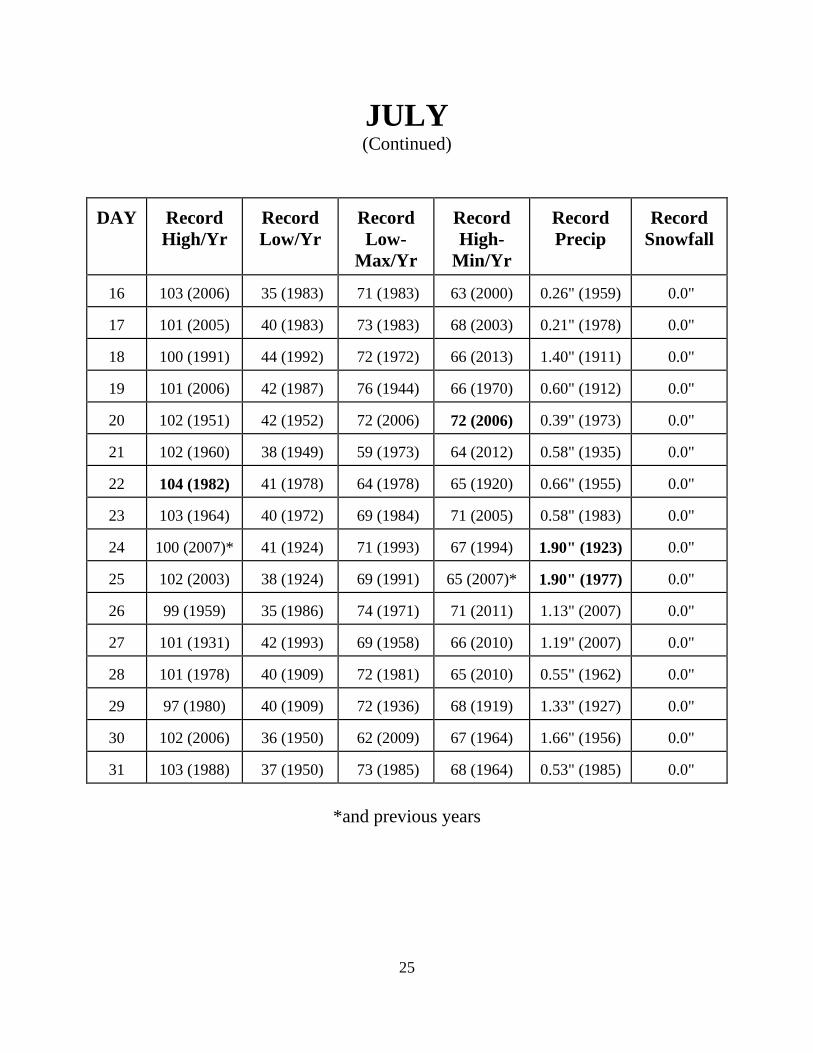
JULY (Continued)
DAY
Record High/Yr
Record Low/Yr
Record Low-
Max/Yr
Record High-
Min/Yr
Record Precip
Record
Snowfall
16
103 (2006)
35 (1983)
71 (1983)
63 (2000)
0.26" (1959)
0.0"
17
101 (2005)
40 (1983)
73 (1983)
68 (2003)
0.21" (1978)
0.0"
18
100 (1991)
44 (1992)
72 (1972)
66 (2013)
1.40" (1911)
0.0"
19
101 (2006)
42 (1987)
76 (1944)
66 (1970)
0.60" (1912)
0.0"
20
102 (1951)
42 (1952)
72 (2006)
72 (2006)
0.39" (1973)
0.0"
21
102 (1960)
38 (1949)
59 (1973)
64 (2012)
0.58" (1935)
0.0"
22
104 (1982)
41 (1978)
64 (1978)
65 (1920)
0.66" (1955)
0.0"
23
103 (1964)
40 (1972)
69 (1984)
71 (2005)
0.58" (1983)
0.0"
24
100 (2007)*
41 (1924)
71 (1993)
67 (1994)
1.90" (1923)
0.0"
25
102 (2003)
38 (1924)
69 (1991)
65 (2007)*
1.90" (1977)
0.0"
26
99 (1959)
35 (1986)
74 (1971)
71 (2011)
1.13" (2007)
0.0"
27
101 (1931)
42 (1993)
69 (1958)
66 (2010)
1.19" (2007)
0.0"
28
101 (1978)
40 (1909)
72 (1981)
65 (2010)
0.55" (1962)
0.0"
29
97 (1980)
40 (1909)
72 (1936)
68 (1919)
1.33" (1927)
0.0"
30
102 (2006)
36 (1950)
62 (2009)
67 (1964)
1.66" (1956)
0.0"
31
103 (1988)
37 (1950)
73 (1985)
68 (1964)
0.53" (1985)
0.0"
*and previous years
26
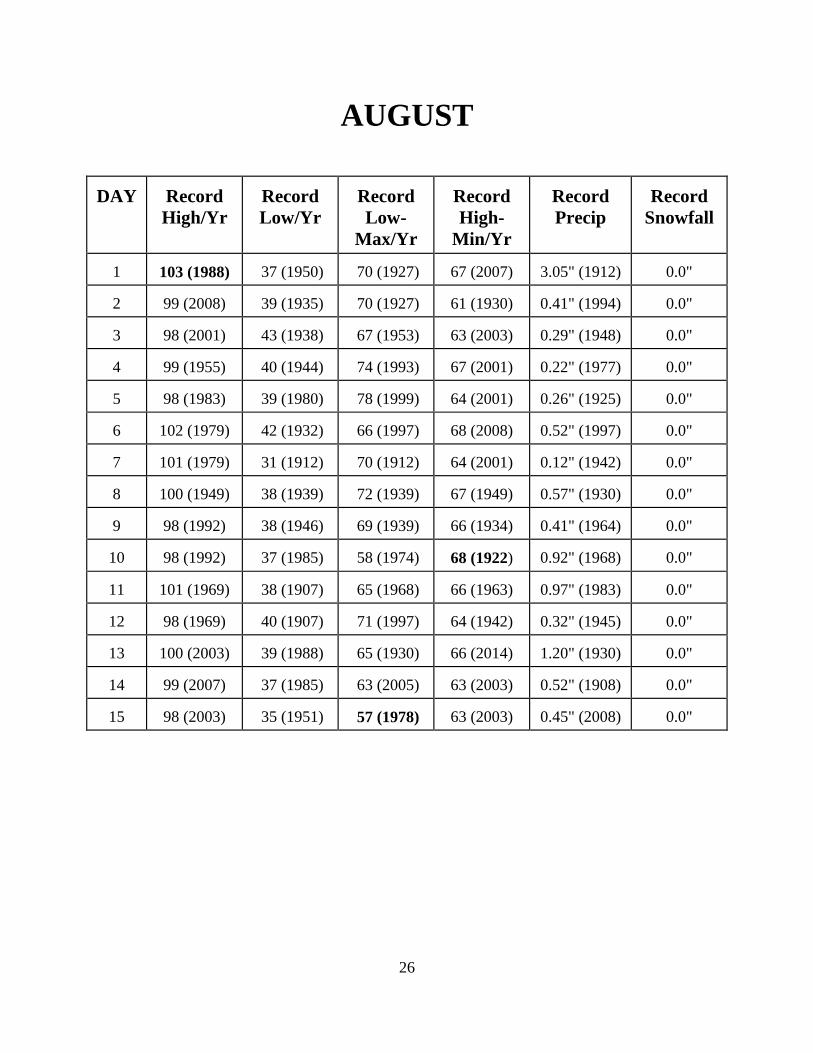
AUGUST
DAY
Record High/Yr
Record Low/Yr
Record Low-
Max/Yr
Record High-
Min/Yr
Record Precip
Record
Snowfall
1
103 (1988)
37 (1950)
70 (1927)
67 (2007)
3.05" (1912)
0.0"
2
99 (2008)
39 (1935)
70 (1927)
61 (1930)
0.41" (1994)
0.0"
3
98 (2001)
43 (1938)
67 (1953)
63 (2003)
0.29" (1948)
0.0"
4
99 (1955)
40 (1944)
74 (1993)
67 (2001)
0.22" (1977)
0.0"
5
98 (1983)
39 (1980)
78 (1999)
64 (2001)
0.26" (1925)
0.0"
6
102 (1979)
42 (1932)
66 (1997)
68 (2008)
0.52" (1997)
0.0"
7
101 (1979)
31 (1912)
70 (1912)
64 (2001)
0.12" (1942)
0.0"
8
100 (1949)
38 (1939)
72 (1939)
67 (1949)
0.57" (1930)
0.0"
9
98 (1992)
38 (1946)
69 (1939)
66 (1934)
0.41" (1964)
0.0"
10
98 (1992)
37 (1985)
58 (1974)
68 (1922)
0.92" (1968)
0.0"
11
101 (1969)
38 (1907)
65 (1968)
66 (1963)
0.97" (1983)
0.0"
12
98 (1969)
40 (1907)
71 (1997)
64 (1942)
0.32" (1945)
0.0"
13
100 (2003)
39 (1988)
65 (1930)
66 (2014)
1.20" (1930)
0.0"
14
99 (2007)
37 (1985)
63 (2005)
63 (2003)
0.52" (1908)
0.0"
15
98 (2003)
35 (1951)
57 (1978)
63 (2003)
0.45" (2008)
0.0"
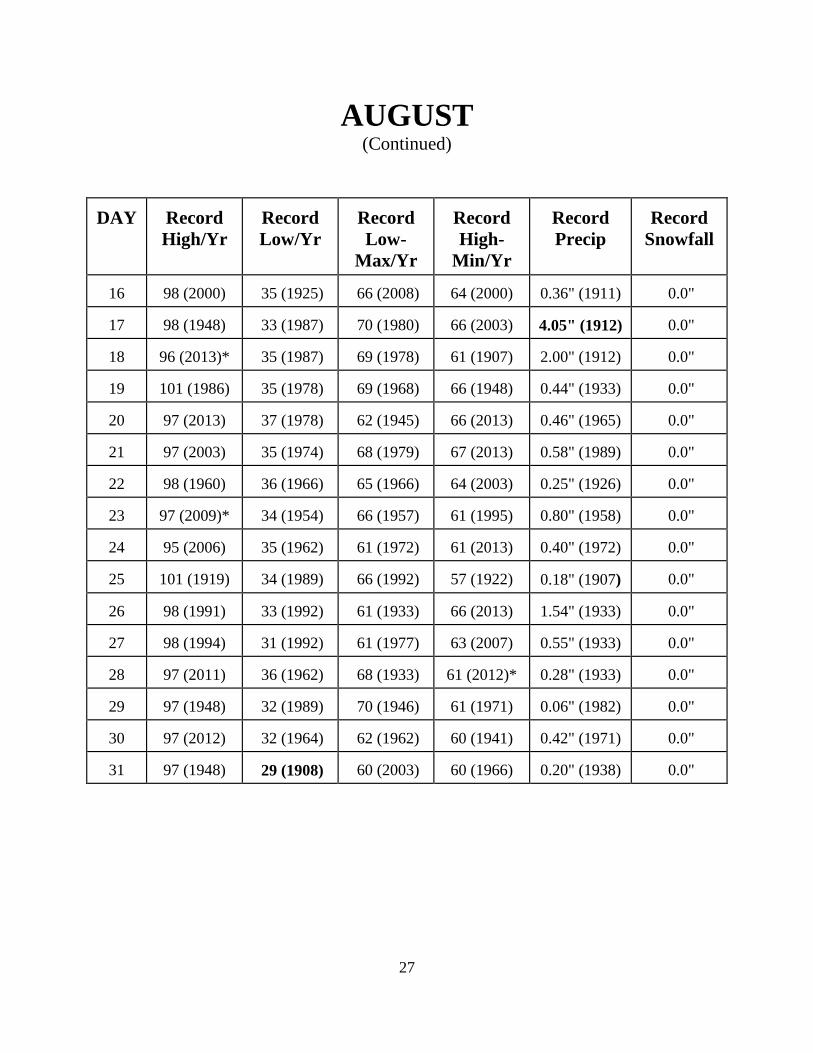
27
AUGUST (Continued)
DAY
Record High/Yr
Record Low/Yr
Record Low-
Max/Yr
Record High-
Min/Yr
Record Precip
Record
Snowfall
16
98 (2000)
35 (1925)
66 (2008)
64 (2000)
0.36" (1911)
0.0"
17
98 (1948)
33 (1987)
70 (1980)
66 (2003)
4.05" (1912)
0.0"
18
96 (2013)*
35 (1987)
69 (1978)
61 (1907)
2.00" (1912)
0.0"
19
101 (1986)
35 (1978)
69 (1968)
66 (1948)
0.44" (1933)
0.0"
20
97 (2013)
37 (1978)
62 (1945)
66 (2013)
0.46" (1965)
0.0"
21
97 (2003)
35 (1974)
68 (1979)
67 (2013)
0.58" (1989)
0.0"
22
98 (1960)
36 (1966)
65 (1966)
64 (2003)
0.25" (1926)
0.0"
23
97 (2009)*
34 (1954)
66 (1957)
61 (1995)
0.80" (1958)
0.0"
24
95 (2006)
35 (1962)
61 (1972)
61 (2013)
0.40" (1972)
0.0"
25
101 (1919)
34 (1989)
66 (1992)
57 (1922)
0.18" (1907)
0.0"
26
98 (1991)
33 (1992)
61 (1933)
66 (2013)
1.54" (1933)
0.0"
27
98 (1994)
31 (1992)
61 (1977)
63 (2007)
0.55" (1933)
0.0"
28
97 (2011)
36 (1962)
68 (1933)
61 (2012)*
0.28" (1933)
0.0"
29
97 (1948)
32 (1989)
70 (1946)
61 (1971)
0.06" (1982)
0.0"
30
97 (2012)
32 (1964)
62 (1962)
60 (1941)
0.42" (1971)
0.0"
31
97 (1948)
29 (1908)
60 (2003)
60 (1966)
0.20" (1938)
0.0"
28
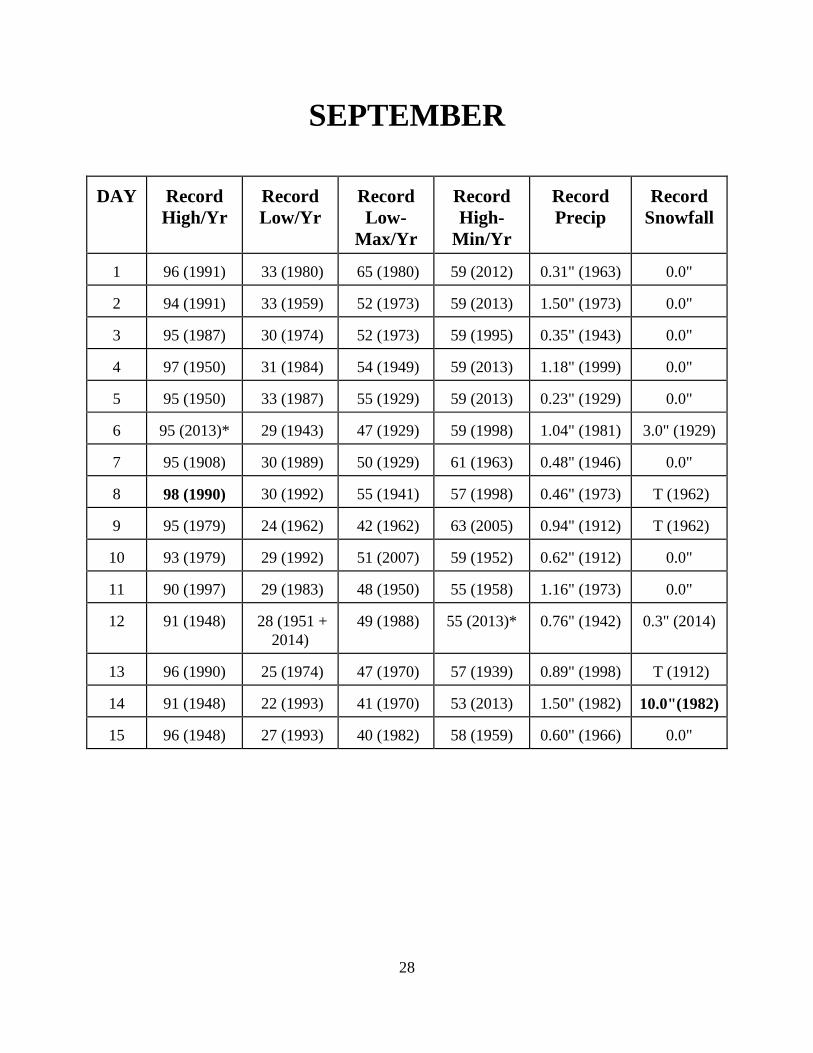
SEPTEMBER
DAY
Record High/Yr
Record Low/Yr
Record Low-
Max/Yr
Record High-
Min/Yr
Record Precip
Record
Snowfall
1
96 (1991)
33 (1980)
65 (1980)
59 (2012)
0.31" (1963)
0.0"
2
94 (1991)
33 (1959)
52 (1973)
59 (2013)
1.50" (1973)
0.0"
3
95 (1987)
30 (1974)
52 (1973)
59 (1995)
0.35" (1943)
0.0"
4
97 (1950)
31 (1984)
54 (1949)
59 (2013)
1.18" (1999)
0.0"
5
95 (1950)
33 (1987)
55 (1929)
59 (2013)
0.23" (1929)
0.0"
6
95 (2013)*
29 (1943)
47 (1929)
59 (1998)
1.04" (1981)
3.0" (1929)
7
95 (1908)
30 (1989)
50 (1929)
61 (1963)
0.48" (1946)
0.0"
8
98 (1990)
30 (1992)
55 (1941)
57 (1998)
0.46" (1973)
T (1962)
9
95 (1979)
24 (1962)
42 (1962)
63 (2005)
0.94" (1912)
T (1962)
10
93 (1979)
29 (1992)
51 (2007)
59 (1952)
0.62" (1912)
0.0"
11
90 (1997)
29 (1983)
48 (1950)
55 (1958)
1.16" (1973)
0.0"
12
91 (1948)
28 (1951 +
2014)
49 (1988)
55 (2013)*
0.76" (1942)
0.3" (2014)
13
96 (1990)
25 (1974)
47 (1970)
57 (1939)
0.89" (1998)
T (1912)
14
91 (1948)
22 (1993)
41 (1970)
53 (2013)
1.50" (1982)
10.0"(1982)
15
96 (1948)
27 (1993)
40 (1982)
58 (1959)
0.60" (1966)
0.0"
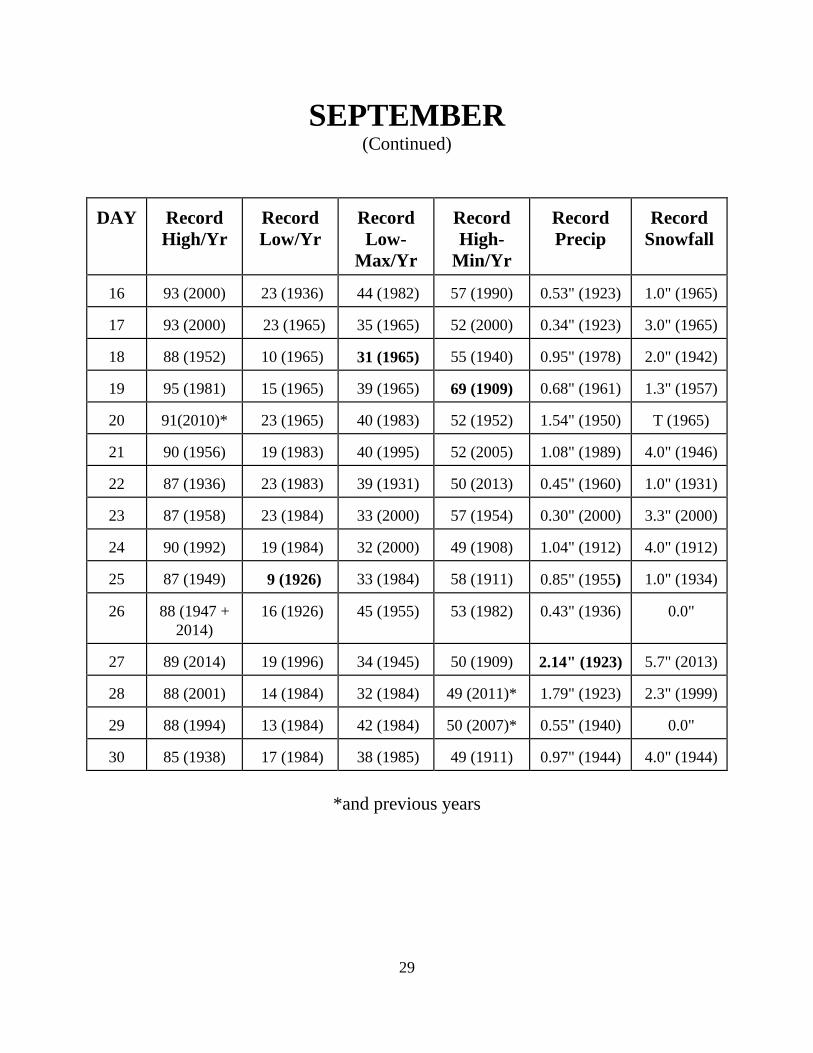
29
SEPTEMBER (Continued)
DAY
Record High/Yr
Record Low/Yr
Record Low-
Max/Yr
Record High-
Min/Yr
Record Precip
Record
Snowfall
16
93 (2000)
23 (1936)
44 (1982)
57 (1990)
0.53" (1923)
1.0" (1965)
17
93 (2000)
23 (1965)
35 (1965)
52 (2000)
0.34" (1923)
3.0" (1965)
18
88 (1952)
10 (1965)
31 (1965)
55 (1940)
0.95" (1978)
2.0" (1942)
19
95 (1981)
15 (1965)
39 (1965)
69 (1909)
0.68" (1961)
1.3" (1957)
20
91(2010)*
23 (1965)
40 (1983)
52 (1952)
1.54" (1950)
T (1965)
21
90 (1956)
19 (1983)
40 (1995)
52 (2005)
1.08" (1989)
4.0" (1946)
22
87 (1936)
23 (1983)
39 (1931)
50 (2013)
0.45" (1960)
1.0" (1931)
23
87 (1958)
23 (1984)
33 (2000)
57 (1954)
0.30" (2000)
3.3" (2000)
24
90 (1992)
19 (1984)
32 (2000)
49 (1908)
1.04" (1912)
4.0" (1912)
25
87 (1949)
9 (1926)
33 (1984)
58 (1911)
0.85" (1955)
1.0" (1934)
26
88 (1947 +
2014)
16 (1926)
45 (1955)
53 (1982)
0.43" (1936)
0.0"
27
89 (2014)
19 (1996)
34 (1945)
50 (1909)
2.14" (1923)
5.7" (2013)
28
88 (2001)
14 (1984)
32 (1984)
49 (2011)*
1.79" (1923)
2.3" (1999)
29
88 (1994)
13 (1984)
42 (1984)
50 (2007)*
0.55" (1940)
0.0"
30
85 (1938)
17 (1984)
38 (1985)
49 (1911)
0.97" (1944)
4.0" (1944)
*and previous years
30
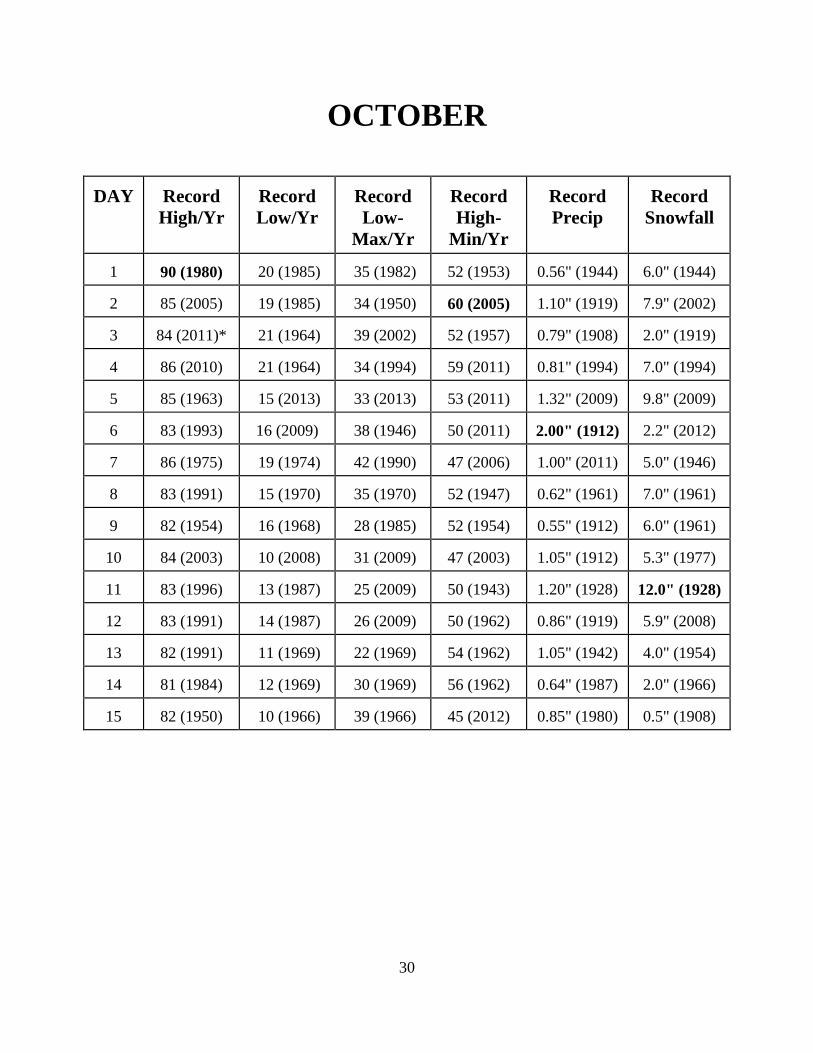
OCTOBER
DAY
Record High/Yr
Record Low/Yr
Record Low-
Max/Yr
Record High-
Min/Yr
Record Precip
Record
Snowfall
1
90 (1980)
20 (1985)
35 (1982)
52 (1953)
0.56" (1944)
6.0" (1944)
2
85 (2005)
19 (1985)
34 (1950)
60 (2005)
1.10" (1919)
7.9" (2002)
3
84 (2011)*
21 (1964)
39 (2002)
52 (1957)
0.79" (1908)
2.0" (1919)
4
86 (2010)
21 (1964)
34 (1994)
59 (2011)
0.81" (1994)
7.0" (1994)
5
85 (1963)
15 (2013)
33 (2013)
53 (2011)
1.32" (2009)
9.8" (2009)
6
83 (1993)
16 (2009)
38 (1946)
50 (2011)
2.00" (1912)
2.2" (2012)
7
86 (1975)
19 (1974)
42 (1990)
47 (2006)
1.00" (2011)
5.0" (1946)
8
83 (1991)
15 (1970)
35 (1970)
52 (1947)
0.62" (1961)
7.0" (1961)
9
82 (1954)
16 (1968)
28 (1985)
52 (1954)
0.55" (1912)
6.0" (1961)
10
84 (2003)
10 (2008)
31 (2009)
47 (2003)
1.05" (1912)
5.3" (1977)
11
83 (1996)
13 (1987)
25 (2009)
50 (1943)
1.20" (1928)
12.0" (1928)
12
83 (1991)
14 (1987)
26 (2009)
50 (1962)
0.86" (1919)
5.9" (2008)
13
82 (1991)
11 (1969)
22 (1969)
54 (1962)
1.05" (1942)
4.0" (1954)
14
81 (1984)
12 (1969)
30 (1969)
56 (1962)
0.64" (1987)
2.0" (1966)
15
82 (1950)
10 (1966)
39 (1966)
45 (2012)
0.85" (1980)
0.5" (1908)
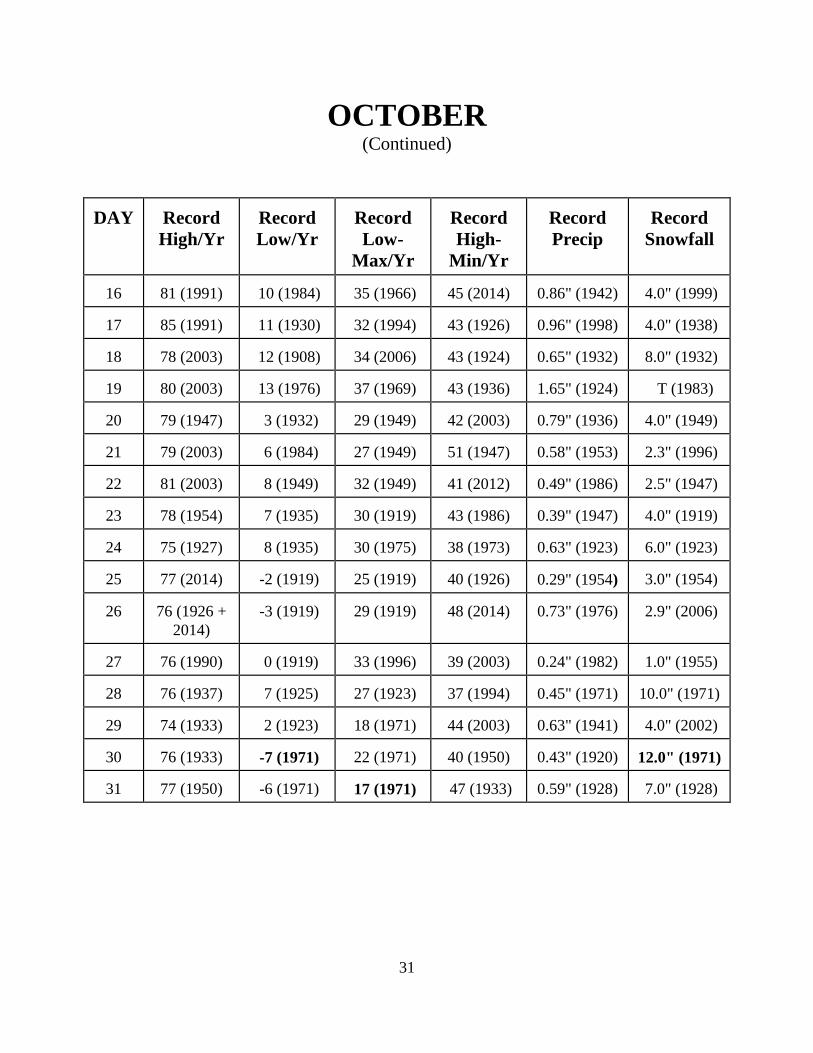
31
OCTOBER (Continued)
DAY
Record High/Yr
Record Low/Yr
Record Low-
Max/Yr
Record High-
Min/Yr
Record Precip
Record
Snowfall
16
81 (1991)
10 (1984)
35 (1966)
45 (2014)
0.86" (1942)
4.0" (1999)
17
85 (1991)
11 (1930)
32 (1994)
43 (1926)
0.96" (1998)
4.0" (1938)
18
78 (2003)
12 (1908)
34 (2006)
43 (1924)
0.65" (1932)
8.0" (1932)
19
80 (2003)
13 (1976)
37 (1969)
43 (1936)
1.65" (1924)
T (1983)
20
79 (1947)
3 (1932)
29 (1949)
42 (2003)
0.79" (1936)
4.0" (1949)
21
79 (2003)
6 (1984)
27 (1949)
51 (1947)
0.58" (1953)
2.3" (1996)
22
81 (2003)
8 (1949)
32 (1949)
41 (2012)
0.49" (1986)
2.5" (1947)
23
78 (1954)
7 (1935)
30 (1919)
43 (1986)
0.39" (1947)
4.0" (1919)
24
75 (1927)
8 (1935)
30 (1975)
38 (1973)
0.63" (1923)
6.0" (1923)
25
77 (2014)
-2 (1919)
25 (1919)
40 (1926)
0.29" (1954)
3.0" (1954)
26
76 (1926 +
2014)
-3 (1919)
29 (1919)
48 (2014)
0.73" (1976)
2.9" (2006)
27
76 (1990)
0 (1919)
33 (1996)
39 (2003)
0.24" (1982)
1.0" (1955)
28
76 (1937)
7 (1925)
27 (1923)
37 (1994)
0.45" (1971)
10.0" (1971)
29
74 (1933)
2 (1923)
18 (1971)
44 (2003)
0.63" (1941)
4.0" (2002)
30
76 (1933)
-7 (1971)
22 (1971)
40 (1950)
0.43" (1920)
12.0" (1971)
31
77 (1950)
-6 (1971)
17 (1971)
47 (1933)
0.59" (1928)
7.0" (1928)
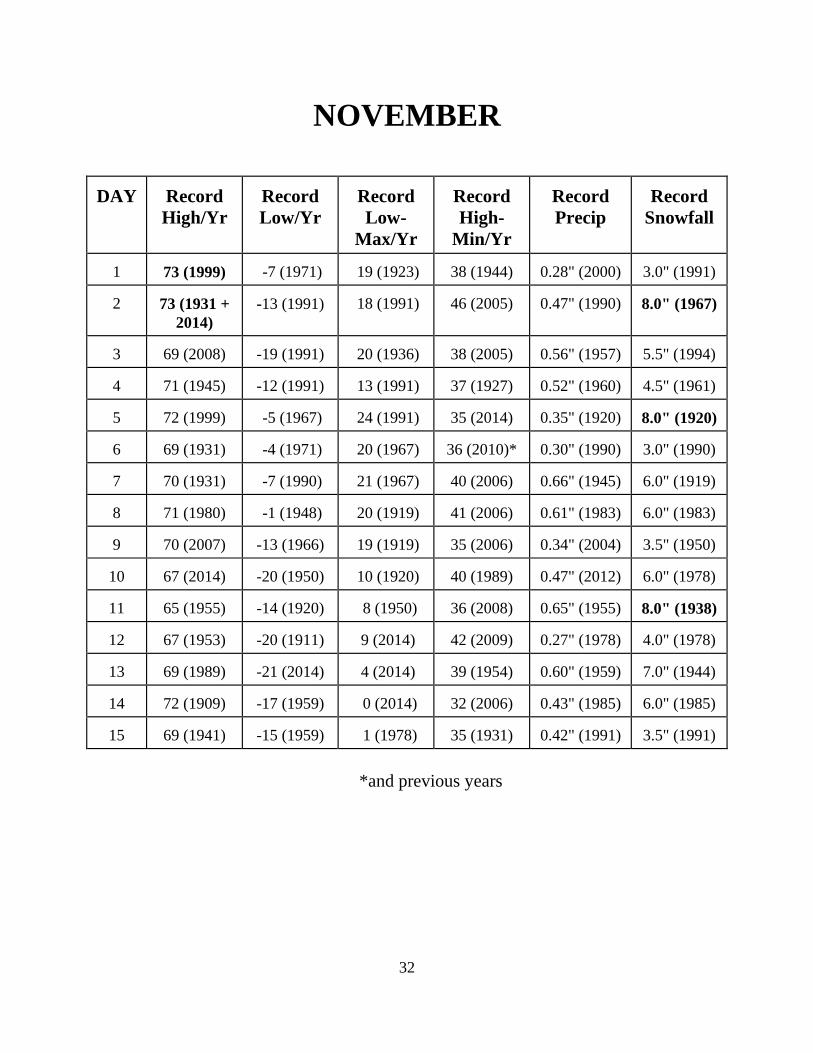
32
NOVEMBER
DAY
Record High/Yr
Record Low/Yr
Record Low-
Max/Yr
Record High-
Min/Yr
Record Precip
Record
Snowfall
1
73 (1999)
-7 (1971)
19 (1923)
38 (1944)
0.28" (2000)
3.0" (1991)
2
73 (1931 +
2014)
-13 (1991)
18 (1991)
46 (2005)
0.47" (1990)
8.0" (1967)
3
69 (2008)
-19 (1991)
20 (1936)
38 (2005)
0.56" (1957)
5.5" (1994)
4
71 (1945)
-12 (1991)
13 (1991)
37 (1927)
0.52" (1960)
4.5" (1961)
5
72 (1999)
-5 (1967)
24 (1991)
35 (2014)
0.35" (1920)
8.0" (1920)
6
69 (1931)
-4 (1971)
20 (1967)
36 (2010)*
0.30" (1990)
3.0" (1990)
7
70 (1931)
-7 (1990)
21 (1967)
40 (2006)
0.66" (1945)
6.0" (1919)
8
71 (1980)
-1 (1948)
20 (1919)
41 (2006)
0.61" (1983)
6.0" (1983)
9
70 (2007)
-13 (1966)
19 (1919)
35 (2006)
0.34" (2004)
3.5" (1950)
10
67 (2014)
-20 (1950)
10 (1920)
40 (1989)
0.47" (2012)
6.0" (1978)
11
65 (1955)
-14 (1920)
8 (1950)
36 (2008)
0.65" (1955)
8.0" (1938)
12
67 (1953)
-20 (1911)
9 (2014)
42 (2009)
0.27" (1978)
4.0" (1978)
13
69 (1989)
-21 (2014)
4 (2014)
39 (1954)
0.60" (1959)
7.0" (1944)
14
72 (1909)
-17 (1959)
0 (2014)
32 (2006)
0.43" (1985)
6.0" (1985)
15
69 (1941)
-15 (1959)
1 (1978)
35 (1931)
0.42" (1991)
3.5" (1991)
*and previous years
33
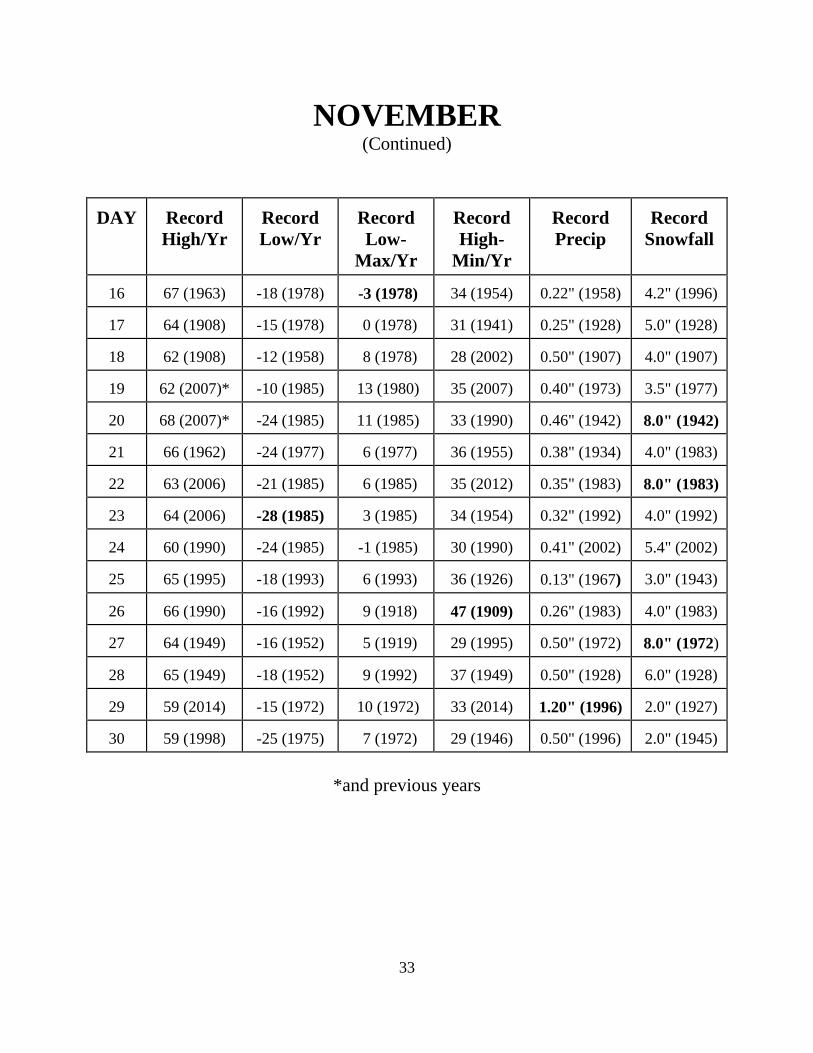
NOVEMBER (Continued)
DAY
Record High/Yr
Record Low/Yr
Record Low-
Max/Yr
Record High-
Min/Yr
Record Precip
Record
Snowfall
16
67 (1963)
-18 (1978)
-3 (1978)
34 (1954)
0.22" (1958)
4.2" (1996)
17
64 (1908)
-15 (1978)
0 (1978)
31 (1941)
0.25" (1928)
5.0" (1928)
18
62 (1908)
-12 (1958)
8 (1978)
28 (2002)
0.50" (1907)
4.0" (1907)
19
62 (2007)*
-10 (1985)
13 (1980)
35 (2007)
0.40" (1973)
3.5" (1977)
20
68 (2007)*
-24 (1985)
11 (1985)
33 (1990)
0.46" (1942)
8.0" (1942)
21
66 (1962)
-24 (1977)
6 (1977)
36 (1955)
0.38" (1934)
4.0" (1983)
22
63 (2006)
-21 (1985)
6 (1985)
35 (2012)
0.35" (1983)
8.0" (1983)
23
64 (2006)
-28 (1985)
3 (1985)
34 (1954)
0.32" (1992)
4.0" (1992)
24
60 (1990)
-24 (1985)
-1 (1985)
30 (1990)
0.41" (2002)
5.4" (2002)
25
65 (1995)
-18 (1993)
6 (1993)
36 (1926)
0.13" (1967)
3.0" (1943)
26
66 (1990)
-16 (1992)
9 (1918)
47 (1909)
0.26" (1983)
4.0" (1983)
27
64 (1949)
-16 (1952)
5 (1919)
29 (1995)
0.50" (1972)
8.0" (1972)
28
65 (1949)
-18 (1952)
9 (1992)
37 (1949)
0.50" (1928)
6.0" (1928)
29
59 (2014)
-15 (1972)
10 (1972)
33 (2014)
1.20" (1996)
2.0" (1927)
30
59 (1998)
-25 (1975)
7 (1972)
29 (1946)
0.50" (1996)
2.0" (1945)
*and previous years
34
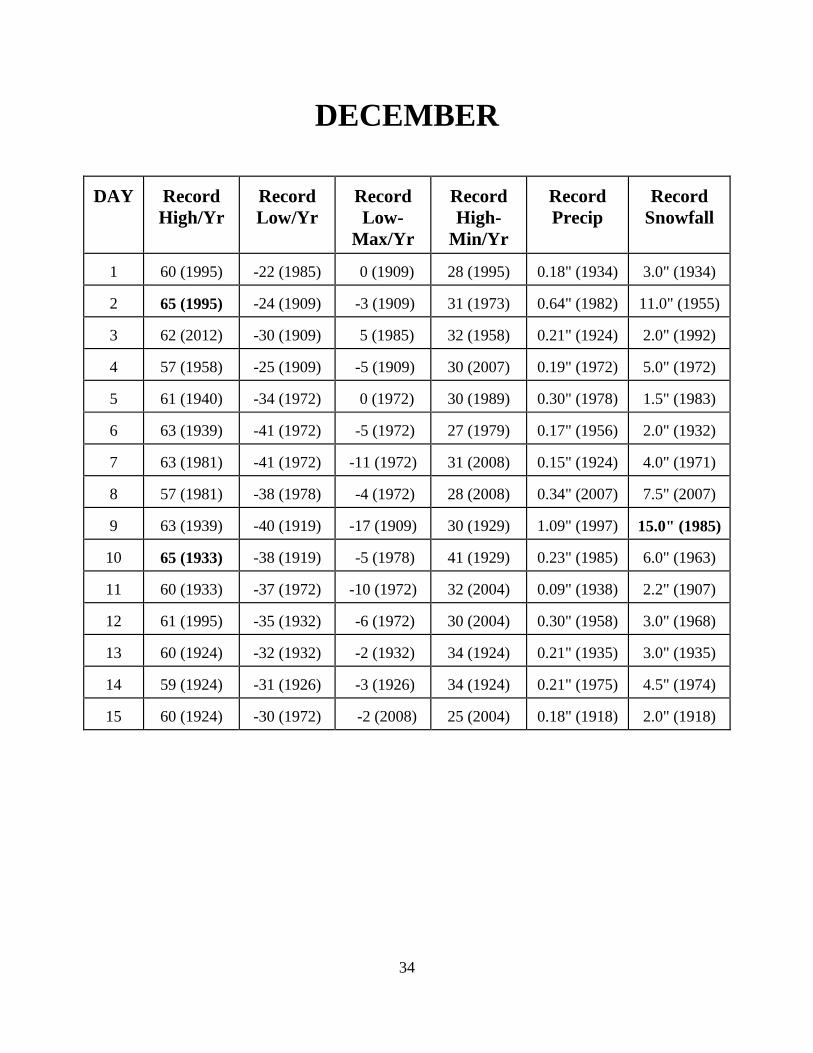
DECEMBER
DAY
Record High/Yr
Record Low/Yr
Record Low-
Max/Yr
Record High-
Min/Yr
Record Precip
Record
Snowfall
1
60 (1995)
-22 (1985)
0 (1909)
28 (1995)
0.18" (1934)
3.0" (1934)
2
65 (1995)
-24 (1909)
-3 (1909)
31 (1973)
0.64" (1982)
11.0" (1955)
3
62 (2012)
-30 (1909)
5 (1985)
32 (1958)
0.21" (1924)
2.0" (1992)
4
57 (1958)
-25 (1909)
-5 (1909)
30 (2007)
0.19" (1972)
5.0" (1972)
5
61 (1940)
-34 (1972)
0 (1972)
30 (1989)
0.30" (1978)
1.5" (1983)
6
63 (1939)
-41 (1972)
-5 (1972)
27 (1979)
0.17" (1956)
2.0" (1932)
7
63 (1981)
-41 (1972)
-11 (1972)
31 (2008)
0.15" (1924)
4.0" (1971)
8
57 (1981)
-38 (1978)
-4 (1972)
28 (2008)
0.34" (2007)
7.5" (2007)
9
63 (1939)
-40 (1919)
-17 (1909)
30 (1929)
1.09" (1997)
15.0" (1985)
10
65 (1933)
-38 (1919)
-5 (1978)
41 (1929)
0.23" (1985)
6.0" (1963)
11
60 (1933)
-37 (1972)
-10 (1972)
32 (2004)
0.09" (1938)
2.2" (1907)
12
61 (1995)
-35 (1932)
-6 (1972)
30 (2004)
0.30" (1958)
3.0" (1968)
13
60 (1924)
-32 (1932)
-2 (1932)
34 (1924)
0.21" (1935)
3.0" (1935)
14
59 (1924)
-31 (1926)
-3 (1926)
34 (1924)
0.21" (1975)
4.5" (1974)
15
60 (1924)
-30 (1972)
-2 (2008)
25 (2004)
0.18" (1918)
2.0" (1918)
35
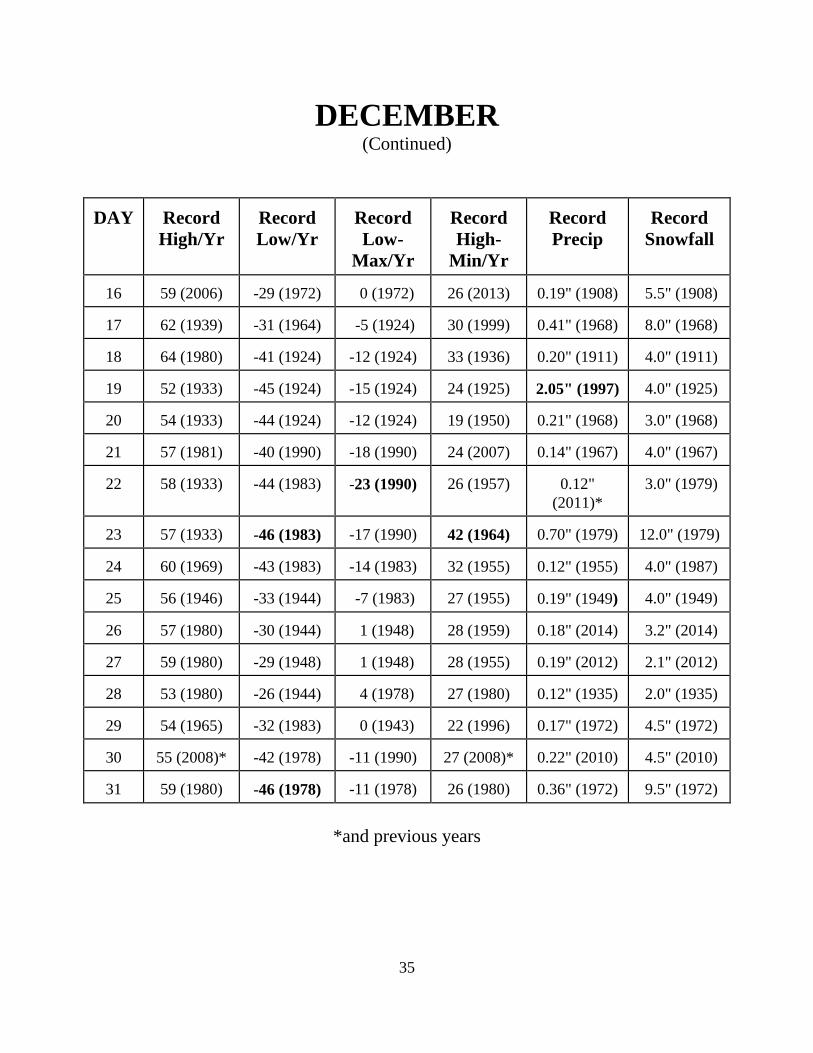
DECEMBER (Continued)
DAY
Record High/Yr
Record Low/Yr
Record Low-
Max/Yr
Record High-
Min/Yr
Record Precip
Record
Snowfall
16
59 (2006)
-29 (1972)
0 (1972)
26 (2013)
0.19" (1908)
5.5" (1908)
17
62 (1939)
-31 (1964)
-5 (1924)
30 (1999)
0.41" (1968)
8.0" (1968)
18
64 (1980)
-41 (1924)
-12 (1924)
33 (1936)
0.20" (1911)
4.0" (1911)
19
52 (1933)
-45 (1924)
-15 (1924)
24 (1925)
2.05" (1997)
4.0" (1925)
20
54 (1933)
-44 (1924)
-12 (1924)
19 (1950)
0.21" (1968)
3.0" (1968)
21
57 (1981)
-40 (1990)
-18 (1990)
24 (2007)
0.14" (1967)
4.0" (1967)
22
58 (1933)
-44 (1983)
-23 (1990)
26 (1957)
0.12"
(2011)*
3.0" (1979)
23
57 (1933)
-46 (1983)
-17 (1990)
42 (1964)
0.70" (1979)
12.0" (1979)
24
60 (1969)
-43 (1983)
-14 (1983)
32 (1955)
0.12" (1955)
4.0" (1987)
25
56 (1946)
-33 (1944)
-7 (1983)
27 (1955)
0.19" (1949)
4.0" (1949)
26
57 (1980)
-30 (1944)
1 (1948)
28 (1959)
0.18" (2014)
3.2" (2014)
27
59 (1980)
-29 (1948)
1 (1948)
28 (1955)
0.19" (2012)
2.1" (2012)
28
53 (1980)
-26 (1944)
4 (1978)
27 (1980)
0.12" (1935)
2.0" (1935)
29
54 (1965)
-32 (1983)
0 (1943)
22 (1996)
0.17" (1972)
4.5" (1972)
30
55 (2008)*
-42 (1978)
-11 (1990)
27 (2008)*
0.22" (2010)
4.5" (2010)
31
59 (1980)
-46 (1978)
-11 (1978)
26 (1980)
0.36" (1972)
9.5" (1972)
*and previous years
36
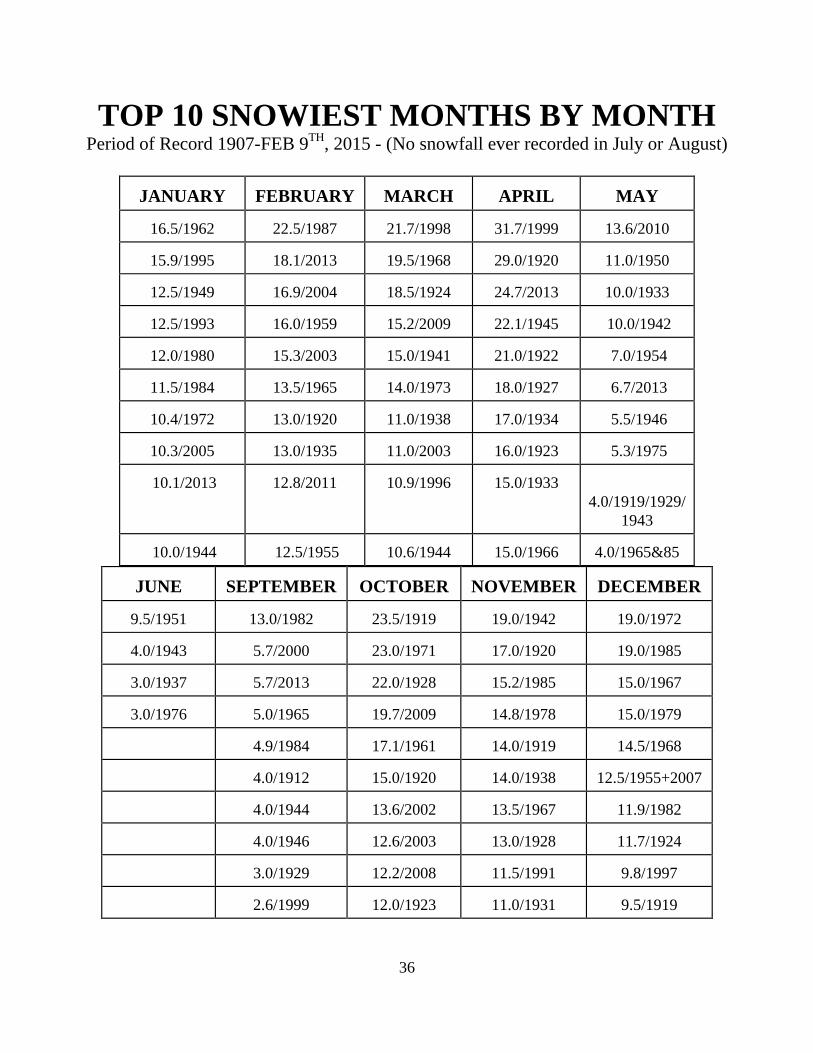
TOP 10 SNOWIEST MONTHS BY MONTH Period of Record 1907-FEB 9TH, 2015 - (No snowfall ever recorded in July or August)
JANUARY
FEBRUARY
MARCH
APRIL
MAY
16.5/1962
22.5/1987
21.7/1998
31.7/1999
13.6/2010
15.9/1995
18.1/2013
19.5/1968
29.0/1920
11.0/1950
12.5/1949
16.9/2004
18.5/1924
24.7/2013
10.0/1933
12.5/1993
16.0/1959
15.2/2009
22.1/1945
10.0/1942
12.0/1980
15.3/2003
15.0/1941
21.0/1922
7.0/1954
11.5/1984
13.5/1965
14.0/1973
18.0/1927
6.7/2013
10.4/1972
13.0/1920
11.0/1938
17.0/1934
5.5/1946
10.3/2005
13.0/1935
11.0/2003
16.0/1923
5.3/1975
10.1/2013
12.8/2011
10.9/1996
15.0/1933
4.0/1919/1929/1943
10.0/1944
12.5/1955
10.6/1944
15.0/1966
4.0/1965&85
JUNE
SEPTEMBER
OCTOBER
NOVEMBER
DECEMBER
9.5/1951
13.0/1982
23.5/1919
19.0/1942
19.0/1972
4.0/1943
5.7/2000
23.0/1971
17.0/1920
19.0/1985
3.0/1937
5.7/2013
22.0/1928
15.2/1985
15.0/1967
3.0/1976
5.0/1965
19.7/2009
14.8/1978
15.0/1979
4.9/1984
17.1/1961
14.0/1919
14.5/1968
4.0/1912
15.0/1920
14.0/1938
12.5/1955+2007
4.0/1944
13.6/2002
13.5/1967
11.9/1982
4.0/1946
12.6/2003
13.0/1928
11.7/1924
3.0/1929
12.2/2008
11.5/1991
9.8/1997
2.6/1999
12.0/1923
11.0/1931
9.5/1919
37
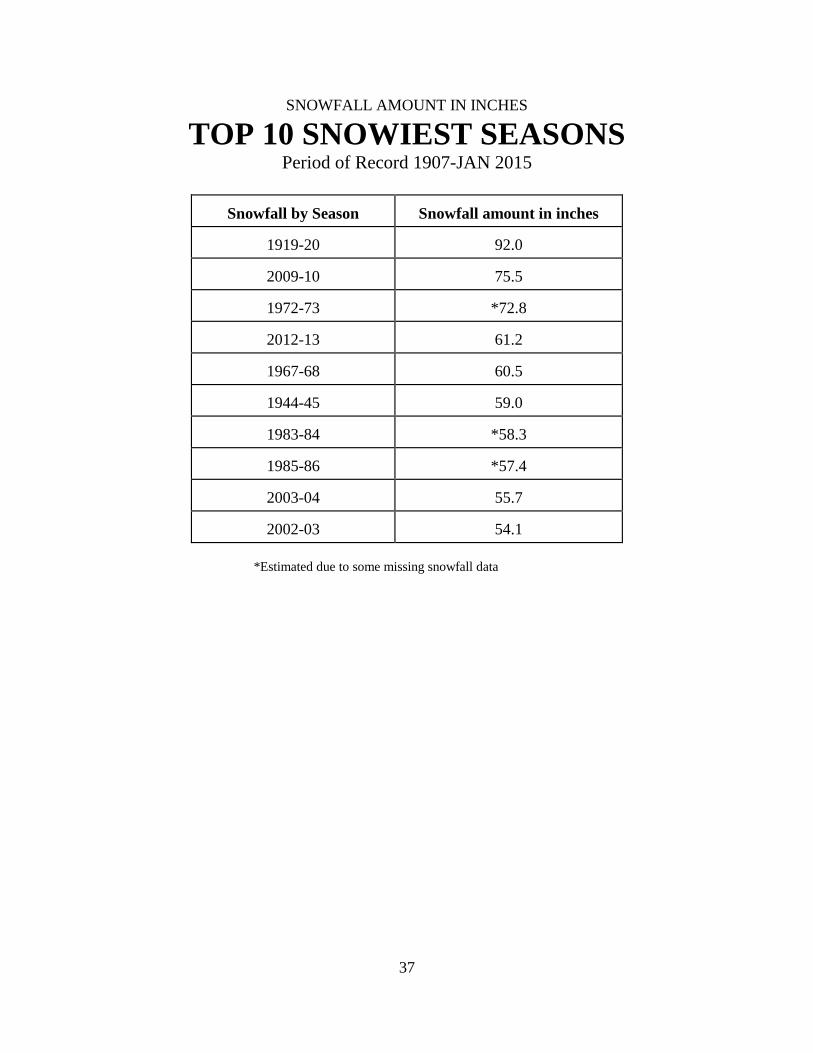
SNOWFALL AMOUNT IN INCHES
TOP 10 SNOWIEST SEASONS
Period of Record 1907-JAN 2015
Snowfall by Season
Snowfall amount in inches
1919-20
92.0
2009-10
75.5
1972-73
*72.8
2012-13
61.2
1967-68
60.5
1944-45
59.0
1983-84
*58.3
1985-86
*57.4
2003-04
55.7
2002-03
54.1
*Estimated due to some missing snowfall data
38
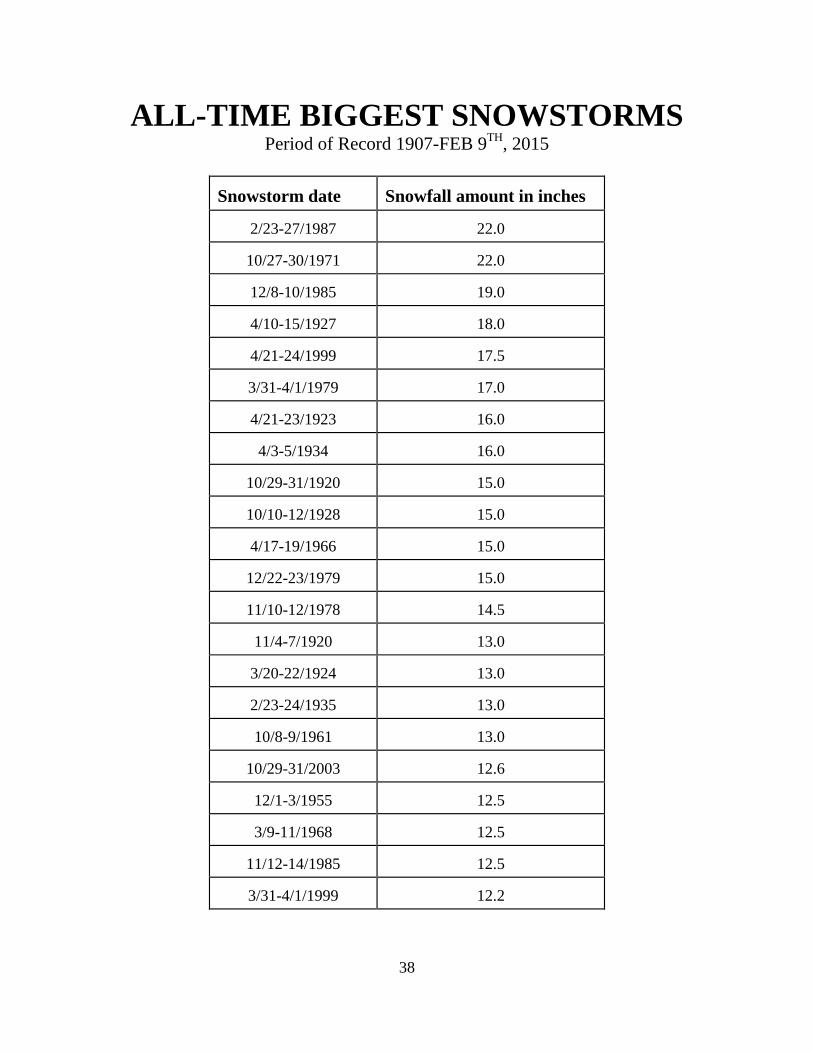
ALL-TIME BIGGEST SNOWSTORMS
Period of Record 1907-FEB 9TH, 2015
Snowstorm date
Snowfall amount in inches
2/23-27/1987
22.0
10/27-30/1971
22.0
12/8-10/1985
19.0
4/10-15/1927
18.0
4/21-24/1999
17.5
3/31-4/1/1979
17.0
4/21-23/1923
16.0
4/3-5/1934
16.0
10/29-31/1920
15.0
10/10-12/1928
15.0
4/17-19/1966
15.0
12/22-23/1979
15.0
11/10-12/1978
14.5
11/4-7/1920
13.0
3/20-22/1924
13.0
2/23-24/1935
13.0
10/8-9/1961
13.0
10/29-31/2003
12.6
12/1-3/1955
12.5
3/9-11/1968
12.5
11/12-14/1985
12.5
3/31-4/1/1999
12.2
39
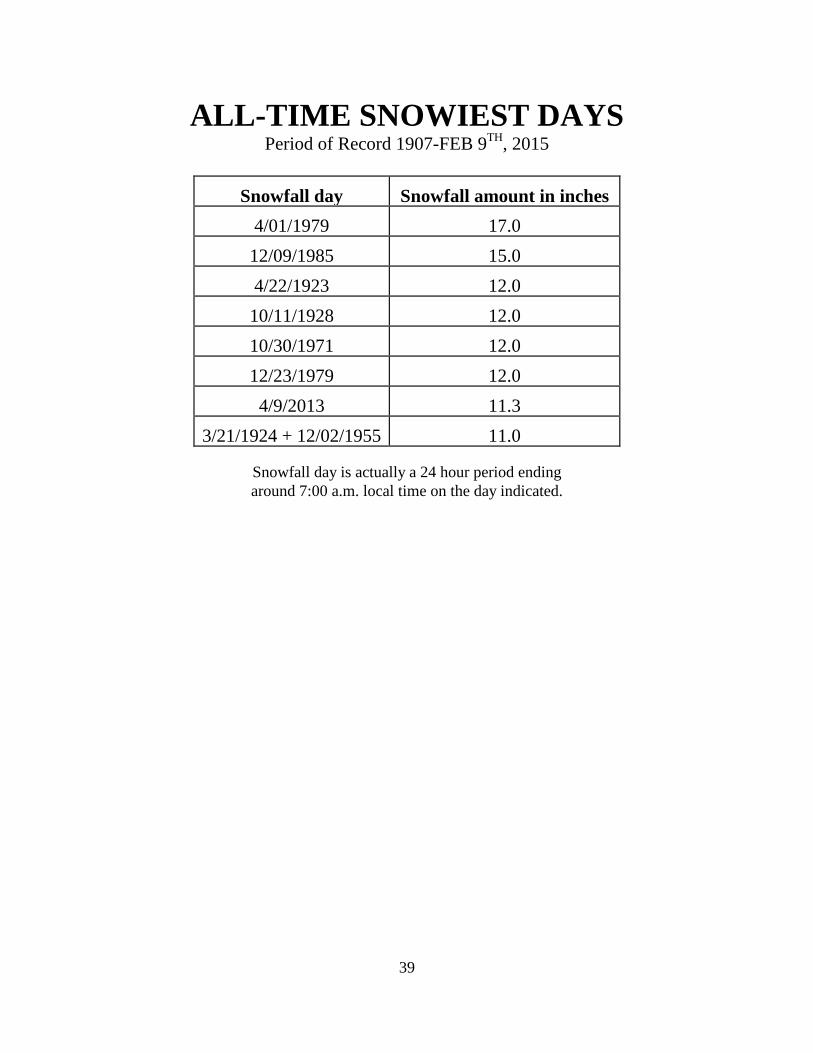
ALL-TIME SNOWIEST DAYS Period of Record 1907-FEB 9TH, 2015
Snowfall day
Snowfall amount in inches
4/01/1979
17.0 12/09/1985
15.0
4/22/1923
12.0 10/11/1928
12.0
10/30/1971
12.0 12/23/1979
12.0
4/9/2013
11.3 3/21/1924 + 12/02/1955
11.0
Snowfall day is actually a 24 hour period ending around 7:00 a.m. local time on the day indicated.
40
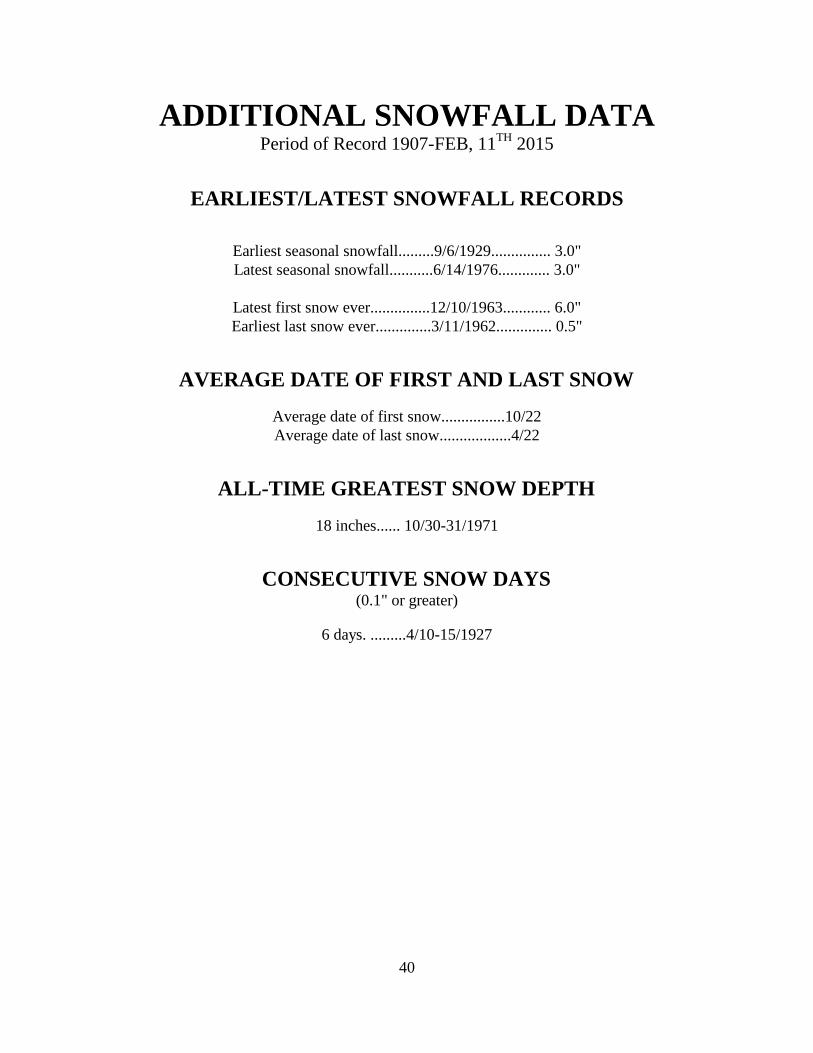
ADDITIONAL SNOWFALL DATA
Period of Record 1907-FEB, 11TH 2015
EARLIEST/LATEST SNOWFALL RECORDS
Earliest seasonal snowfall.........9/6/1929............... 3.0" Latest seasonal snowfall...........6/14/1976............. 3.0"
Latest first snow ever...............12/10/1963............ 6.0" Earliest last snow ever..............3/11/1962.............. 0.5"
AVERAGE DATE OF FIRST AND LAST SNOW
Average date of first snow................10/22 Average date of last snow..................4/22
ALL-TIME GREATEST SNOW DEPTH
18 inches...... 10/30-31/1971
CONSECUTIVE SNOW DAYS (0.1" or greater)
6 days. .........4/10-15/1927
41
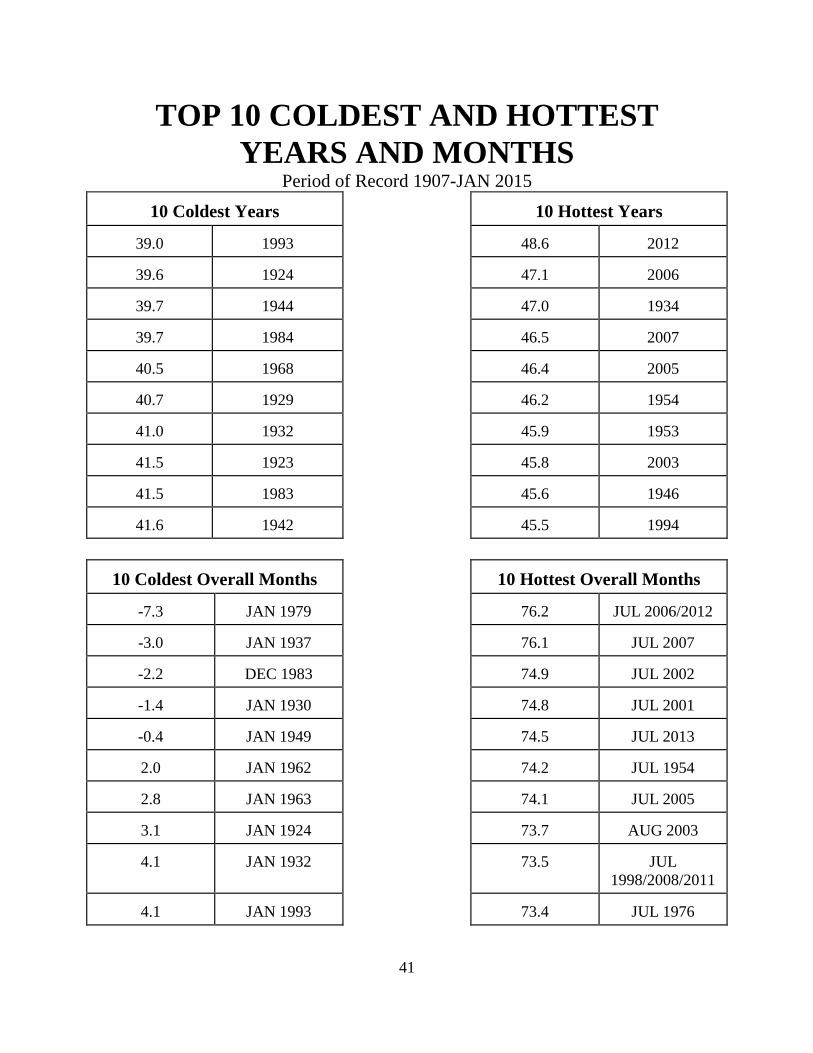
TOP 10 COLDEST AND HOTTEST YEARS AND MONTHS
Period of Record 1907-JAN 2015
10 Coldest Years
10 Hottest Years
39.0
1993
48.6
2012
39.6
1924
47.1
2006
39.7
1944
47.0
1934
39.7
1984
46.5
2007
40.5
1968
46.4
2005
40.7
1929
46.2
1954
41.0
1932
45.9
1953
41.5
1923
45.8
2003
41.5
1983
45.6
1946
41.6
1942
45.5
1994
10 Coldest Overall Months
10 Hottest Overall Months
-7.3
JAN 1979
76.2
JUL 2006/2012
-3.0
JAN 1937
76.1
JUL 2007
-2.2
DEC 1983
74.9
JUL 2002
-1.4
JAN 1930
74.8
JUL 2001
-0.4
JAN 1949
74.5
JUL 2013
2.0
JAN 1962
74.2
JUL 1954
2.8
JAN 1963
74.1
JUL 2005
3.1
JAN 1924
73.7
AUG 2003
4.1
JAN 1932
73.5
JUL
1998/2008/2011
4.1
JAN 1993
73.4
JUL 1976
42
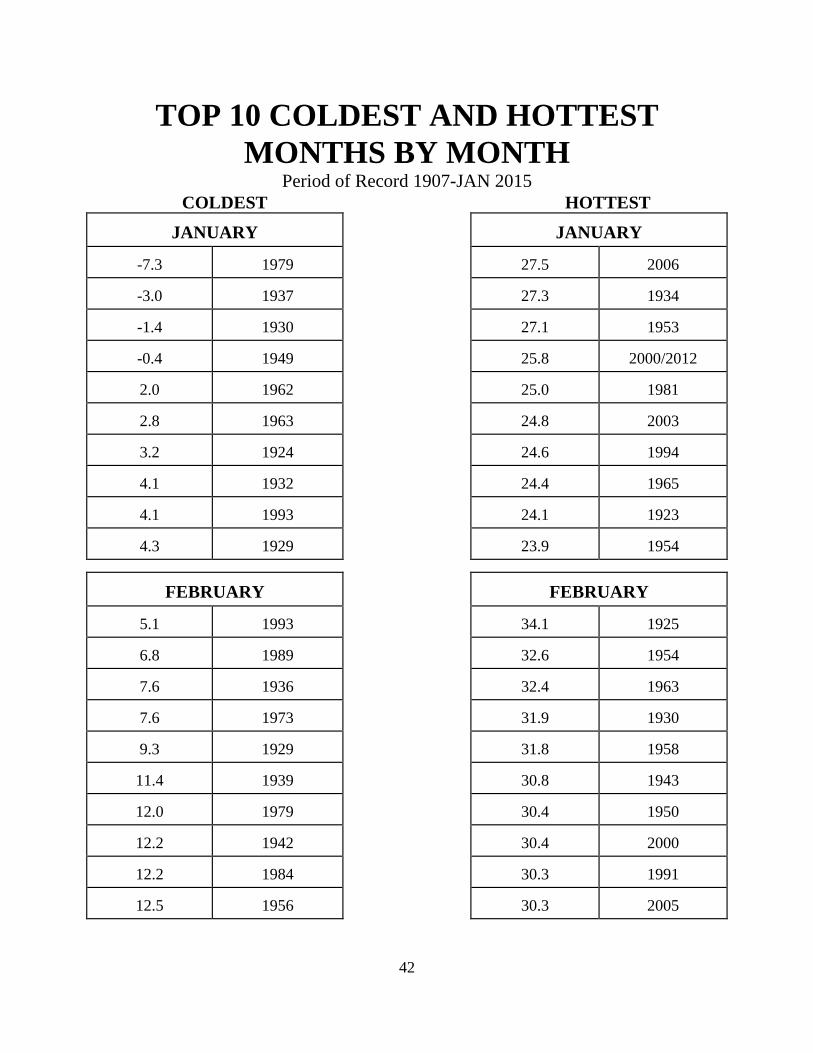
TOP 10 COLDEST AND HOTTEST MONTHS BY MONTH
Period of Record 1907-JAN 2015
COLDEST HOTTEST JANUARY
JANUARY
-7.3
1979
27.5
2006
-3.0
1937
27.3
1934
-1.4
1930
27.1
1953
-0.4
1949
25.8
2000/2012
2.0
1962
25.0
1981
2.8
1963
24.8
2003
3.2
1924
24.6
1994
4.1
1932
24.4
1965
4.1
1993
24.1
1923
4.3
1929
23.9
1954
FEBRUARY
FEBRUARY
5.1
1993
34.1
1925
6.8
1989
32.6
1954
7.6
1936
32.4
1963
7.6
1973
31.9
1930
9.3
1929
31.8
1958
11.4
1939
30.8
1943
12.0
1979
30.4
1950
12.2
1942
30.4
2000
12.2
1984
30.3
1991
12.5
1956
30.3
2005
43
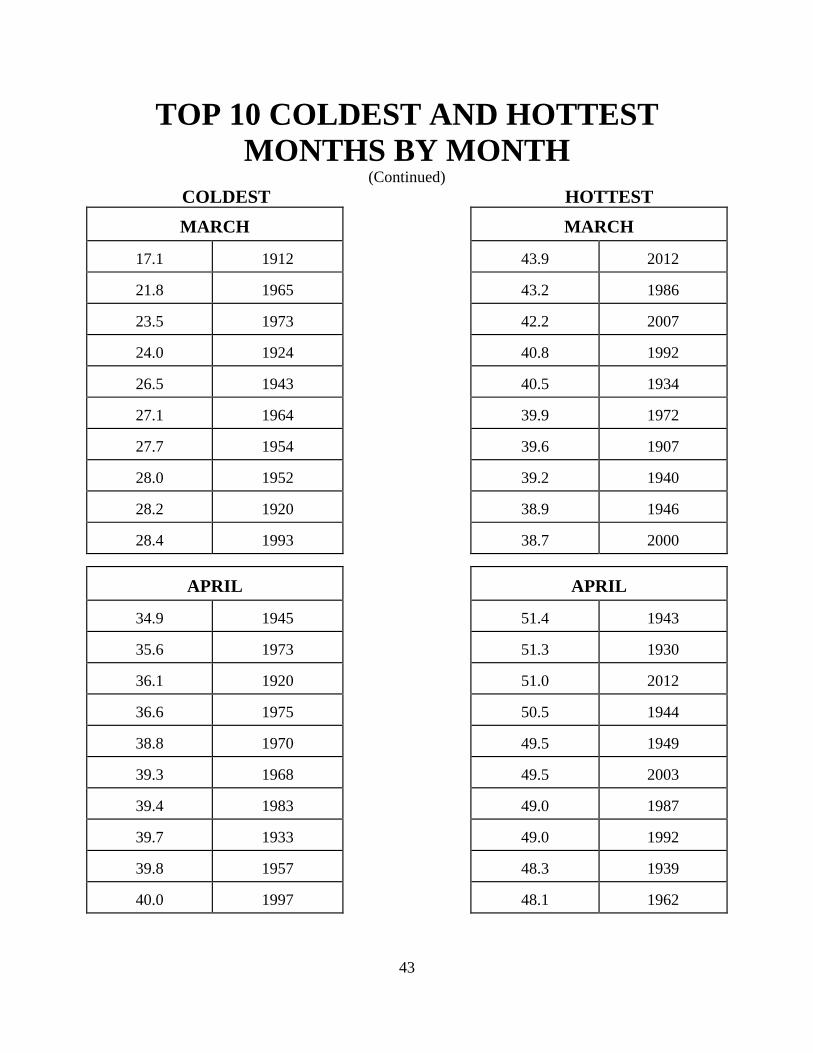
TOP 10 COLDEST AND HOTTEST MONTHS BY MONTH
(Continued) COLDEST HOTTEST
MARCH
MARCH
17.1
1912
43.9
2012
21.8
1965
43.2
1986
23.5
1973
42.2
2007
24.0
1924
40.8
1992
26.5
1943
40.5
1934
27.1
1964
39.9
1972
27.7
1954
39.6
1907
28.0
1952
39.2
1940
28.2
1920
38.9
1946
28.4
1993
38.7
2000
APRIL
APRIL
34.9
1945
51.4
1943
35.6
1973
51.3
1930
36.1
1920
51.0
2012
36.6
1975
50.5
1944
38.8
1970
49.5
1949
39.3
1968
49.5
2003
39.4
1983
49.0
1987
39.7
1933
49.0
1992
39.8
1957
48.3
1939
40.0
1997
48.1
1962
44
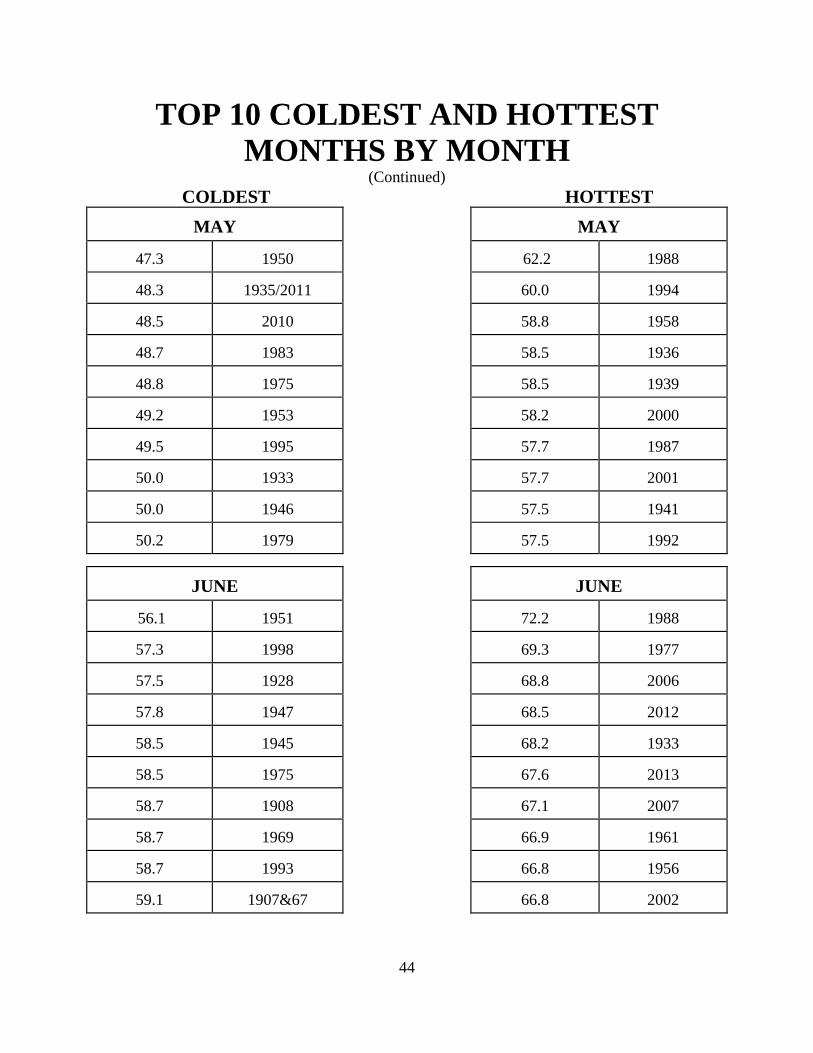
TOP 10 COLDEST AND HOTTEST MONTHS BY MONTH
(Continued) COLDEST HOTTEST
MAY
MAY
47.3
1950
62.2
1988
48.3
1935/2011
60.0
1994
48.5
2010
58.8
1958
48.7
1983
58.5
1936
48.8
1975
58.5
1939
49.2
1953
58.2
2000
49.5
1995
57.7
1987
50.0
1933
57.7
2001
50.0
1946
57.5
1941
50.2
1979
57.5
1992
JUNE
JUNE
56.1
1951
72.2
1988
57.3
1998
69.3
1977
57.5
1928
68.8
2006
57.8
1947
68.5
2012
58.5
1945
68.2
1933
58.5
1975
67.6
2013
58.7
1908
67.1
2007
58.7
1969
66.9
1961
58.7
1993
66.8
1956
59.1
1907&67
66.8
2002
45
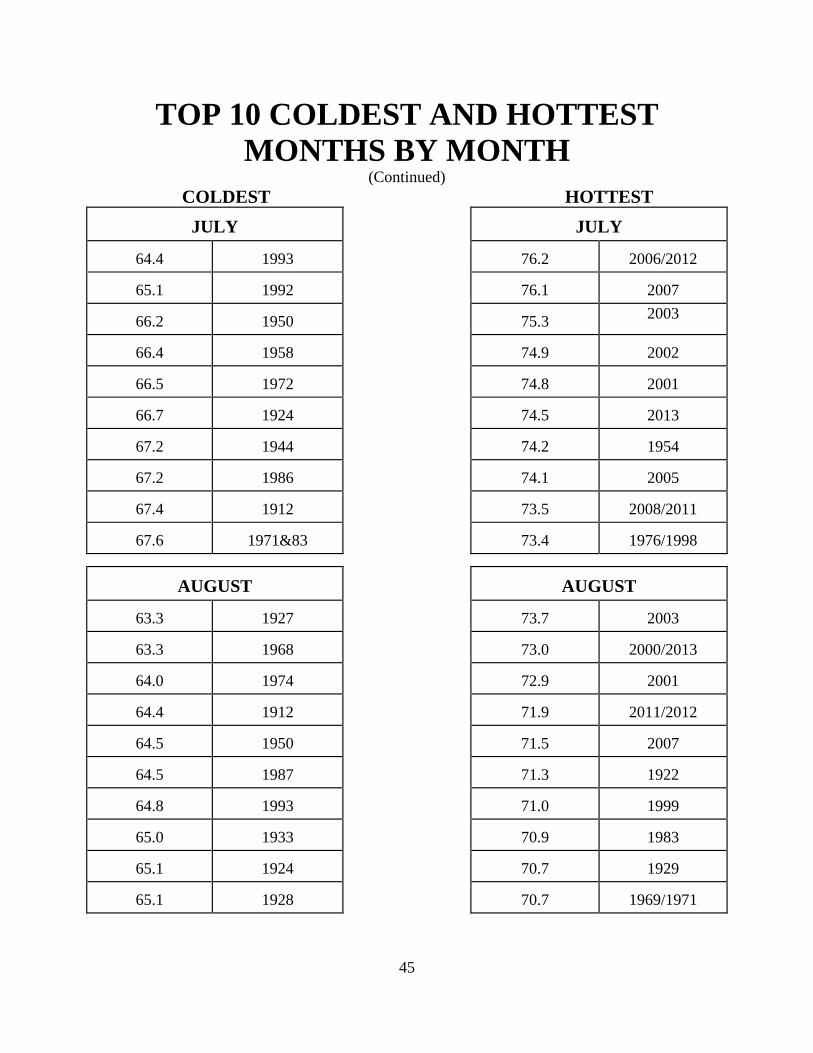
TOP 10 COLDEST AND HOTTEST MONTHS BY MONTH
(Continued) COLDEST HOTTEST
JULY
JULY
64.4
1993
76.2
2006/2012
65.1
1992
76.1
2007
66.2
1950
75.3 2003
66.4
1958
74.9
2002
66.5
1972
74.8
2001
66.7
1924
74.5
2013
67.2
1944
74.2
1954
67.2
1986
74.1
2005
67.4
1912
73.5
2008/2011
67.6
1971&83
73.4
1976/1998
AUGUST
AUGUST
63.3
1927
73.7
2003
63.3
1968
73.0
2000/2013
64.0
1974
72.9
2001
64.4
1912
71.9
2011/2012
64.5
1950
71.5
2007
64.5
1987
71.3
1922
64.8
1993
71.0
1999
65.0
1933
70.9
1983
65.1
1924
70.7
1929
65.1
1928
70.7
1969/1971
46
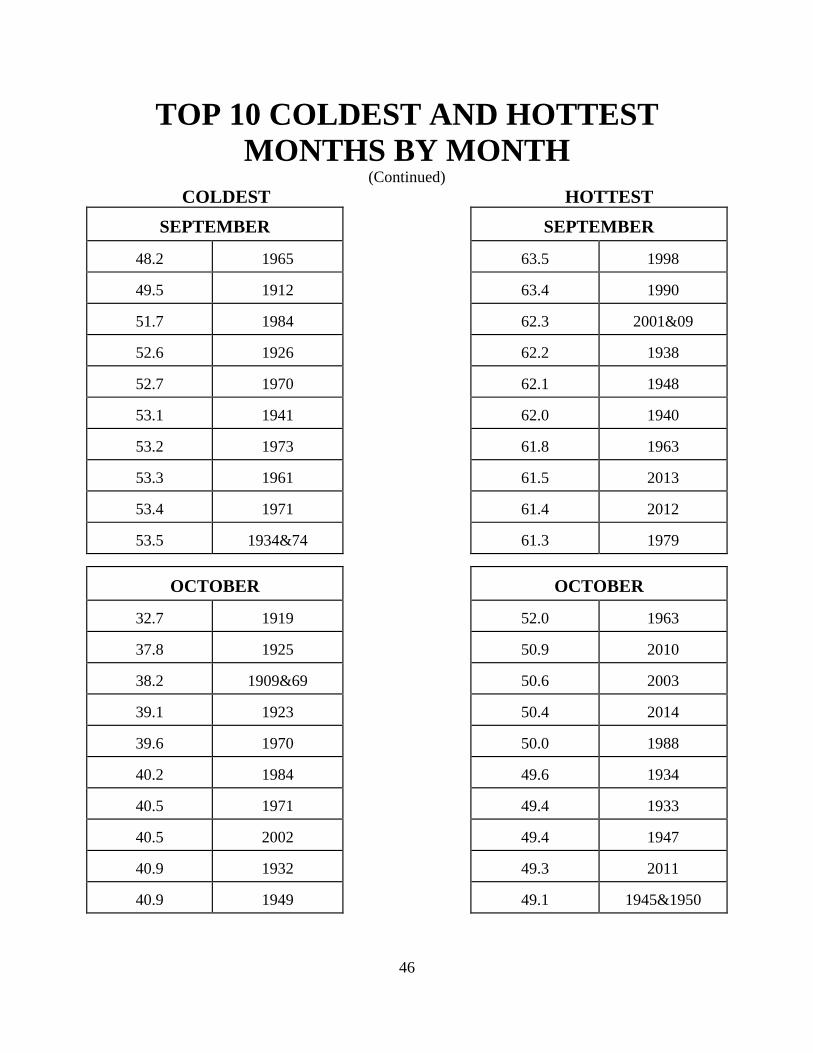
TOP 10 COLDEST AND HOTTEST MONTHS BY MONTH
(Continued) COLDEST HOTTEST
SEPTEMBER
SEPTEMBER
48.2
1965
63.5
1998
49.5
1912
63.4
1990
51.7
1984
62.3
2001&09
52.6
1926
62.2
1938
52.7
1970
62.1
1948
53.1
1941
62.0
1940
53.2
1973
61.8
1963
53.3
1961
61.5
2013
53.4
1971
61.4
2012
53.5
1934&74
61.3
1979
OCTOBER
OCTOBER
32.7
1919
52.0
1963
37.8
1925
50.9
2010
38.2
1909&69
50.6
2003
39.1
1923
50.4
2014
39.6
1970
50.0
1988
40.2
1984
49.6
1934
40.5
1971
49.4
1933
40.5
2002
49.4
1947
40.9
1932
49.3
2011
40.9
1949
49.1
1945&1950
47
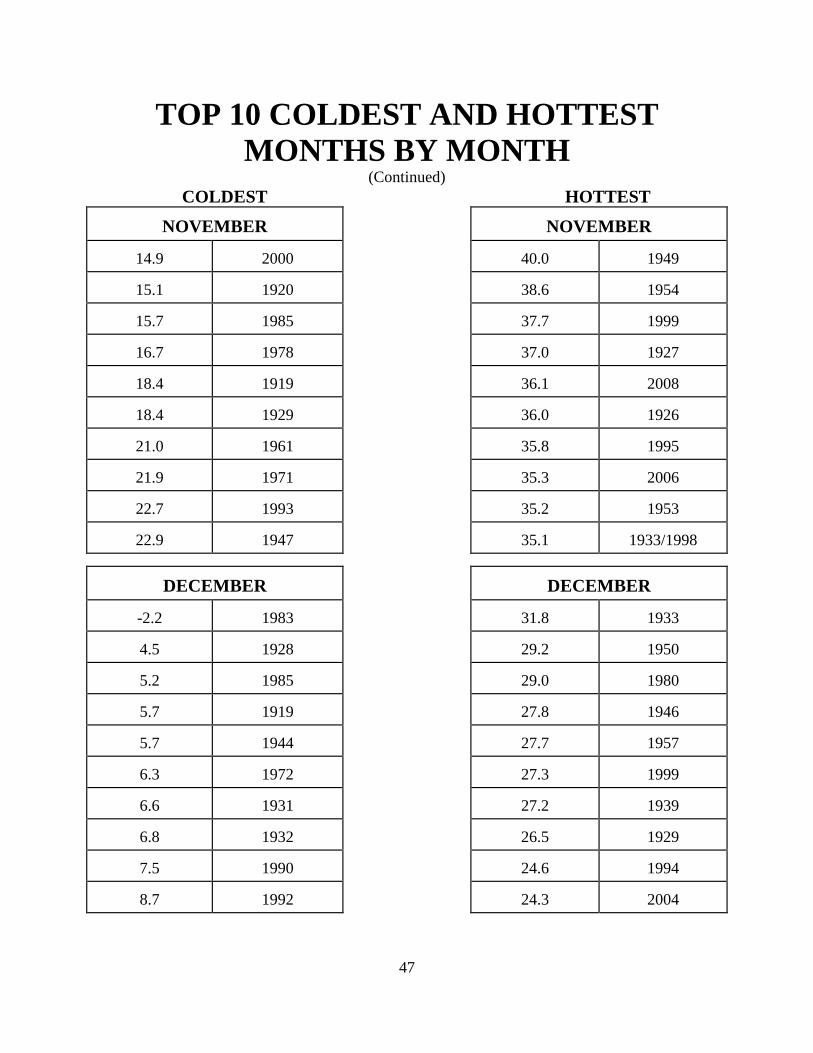
TOP 10 COLDEST AND HOTTEST MONTHS BY MONTH
(Continued) COLDEST HOTTEST
NOVEMBER
NOVEMBER
14.9
2000
40.0
1949
15.1
1920
38.6
1954
15.7
1985
37.7
1999
16.7
1978
37.0
1927
18.4
1919
36.1
2008
18.4
1929
36.0
1926
21.0
1961
35.8
1995
21.9
1971
35.3
2006
22.7
1993
35.2
1953
22.9
1947
35.1
1933/1998
DECEMBER
DECEMBER
-2.2
1983
31.8
1933
4.5
1928
29.2
1950
5.2
1985
29.0
1980
5.7
1919
27.8
1946
5.7
1944
27.7
1957
6.3
1972
27.3
1999
6.6
1931
27.2
1939
6.8
1932
26.5
1929
7.5
1990
24.6
1994
8.7
1992
24.3
2004
48
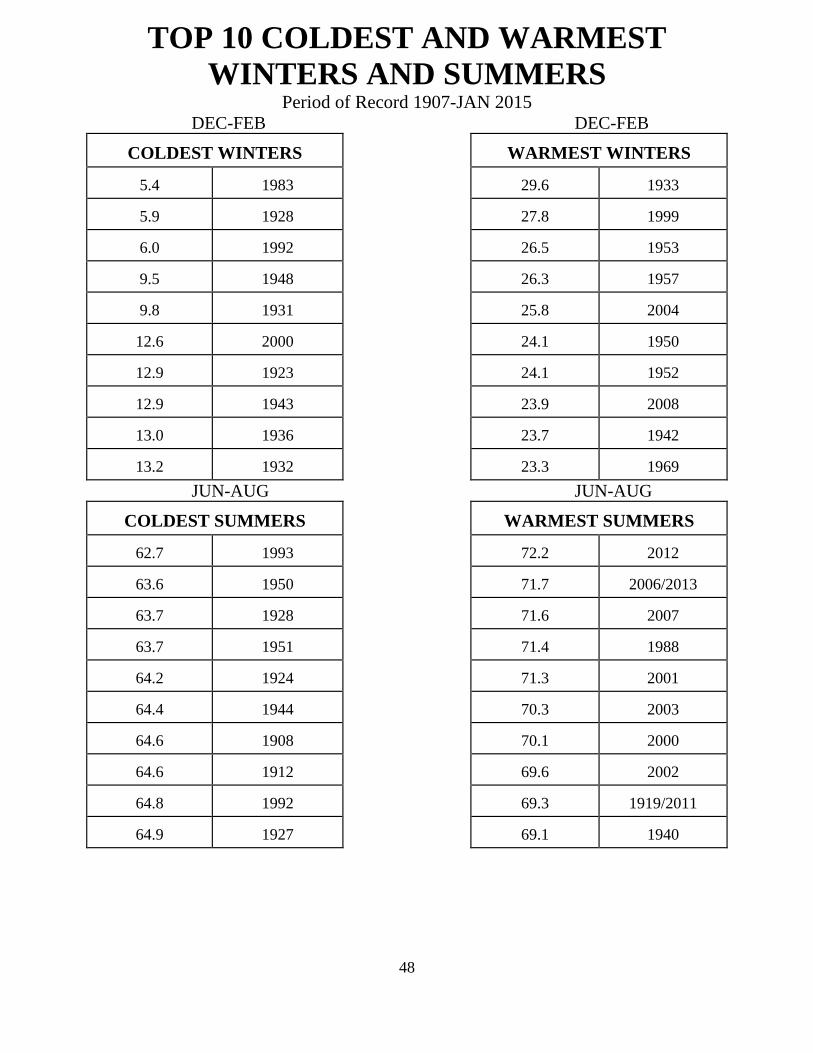
TOP 10 COLDEST AND WARMEST WINTERS AND SUMMERS
Period of Record 1907-JAN 2015
DEC-FEB DEC-FEB COLDEST WINTERS
WARMEST WINTERS
5.4
1983
29.6
1933
5.9
1928
27.8
1999
6.0
1992
26.5
1953
9.5
1948
26.3
1957
9.8
1931
25.8
2004
12.6
2000
24.1
1950
12.9
1923
24.1
1952
12.9
1943
23.9
2008
13.0
1936
23.7
1942
13.2
1932
23.3
1969
JUN-AUG JUN-AUG COLDEST SUMMERS
WARMEST SUMMERS
62.7
1993
72.2
2012
63.6
1950
71.7
2006/2013
63.7
1928
71.6
2007
63.7
1951
71.4
1988
64.2
1924
71.3
2001
64.4
1944
70.3
2003
64.6
1908
70.1
2000
64.6
1912
69.6
2002
64.8
1992
69.3
1919/2011
64.9
1927
69.1
1940
49
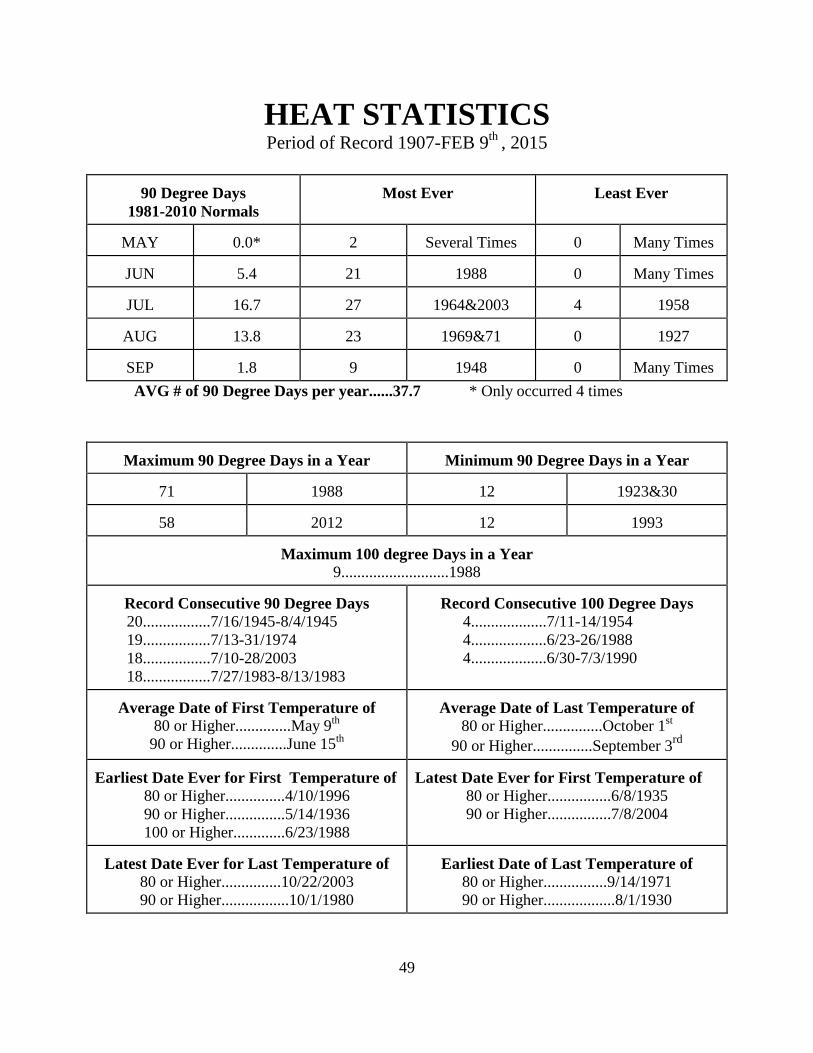
HEAT STATISTICS Period of Record 1907-FEB 9th , 2015
90 Degree Days 1981-2010 Normals
Most Ever
Least Ever
MAY
0.0*
2
Several Times
0
Many Times
JUN
5.4
21
1988
0
Many Times
JUL
16.7
27
1964&2003
4
1958
AUG
13.8
23
1969&71
0
1927
SEP
1.8
9
1948
0
Many Times
AVG # of 90 Degree Days per year......37.7 * Only occurred 4 times
Maximum 90 Degree Days in a Year
Minimum 90 Degree Days in a Year
71
1988
12
1923&30
58
2012
12
1993
Maximum 100 degree Days in a Year 9...........................1988
Record Consecutive 90 Degree Days
20.................7/16/1945-8/4/1945 19.................7/13-31/1974 18.................7/10-28/2003 18.................7/27/1983-8/13/1983
Record Consecutive 100 Degree Days
4...................7/11-14/1954 4...................6/23-26/1988 4...................6/30-7/3/1990
Average Date of First Temperature of
80 or Higher..............May 9th 90 or Higher..............June 15th
Average Date of Last Temperature of
80 or Higher...............October 1st 90 or Higher...............September 3rd
Earliest Date Ever for First Temperature of
80 or Higher...............4/10/1996 90 or Higher...............5/14/1936 100 or Higher.............6/23/1988
Latest Date Ever for First Temperature of
80 or Higher................6/8/1935 90 or Higher................7/8/2004
Latest Date Ever for Last Temperature of
80 or Higher...............10/22/2003 90 or Higher.................10/1/1980
Earliest Date of Last Temperature of
80 or Higher................9/14/1971 90 or Higher..................8/1/1930
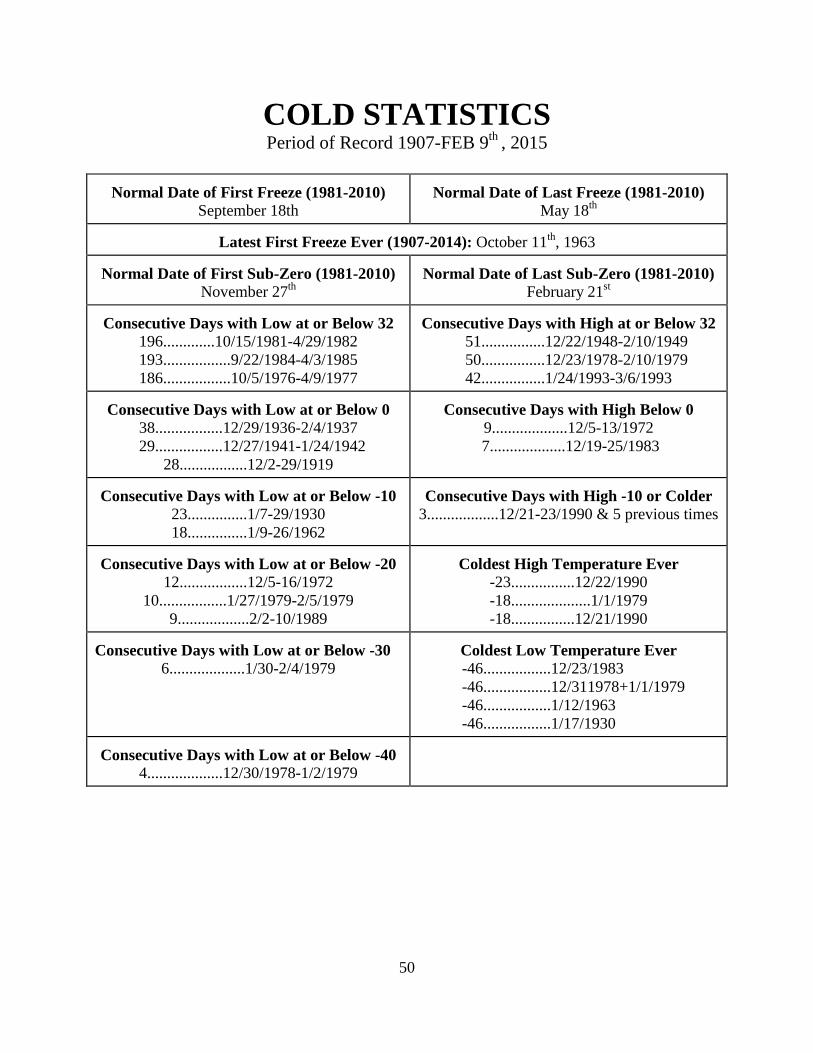
50
COLD STATISTICS Period of Record 1907-FEB 9th , 2015
Normal Date of First Freeze (1981-2010)
September 18th
Normal Date of Last Freeze (1981-2010)
May 18th
Latest First Freeze Ever (1907-2014): October 11th, 1963 Normal Date of First Sub-Zero (1981-2010)
November 27th
Normal Date of Last Sub-Zero (1981-2010)
February 21st
Consecutive Days with Low at or Below 32 196.............10/15/1981-4/29/1982 193.................9/22/1984-4/3/1985 186.................10/5/1976-4/9/1977
Consecutive Days with High at or Below 32
51................12/22/1948-2/10/1949 50................12/23/1978-2/10/1979
42................1/24/1993-3/6/1993
Consecutive Days with Low at or Below 0 38.................12/29/1936-2/4/1937
29.................12/27/1941-1/24/1942 28.................12/2-29/1919
Consecutive Days with High Below 0
9...................12/5-13/1972 7...................12/19-25/1983
Consecutive Days with Low at or Below -10
23...............1/7-29/1930 18...............1/9-26/1962
Consecutive Days with High -10 or Colder
3..................12/21-23/1990 & 5 previous times
Consecutive Days with Low at or Below -20
12.................12/5-16/1972 10.................1/27/1979-2/5/1979
9..................2/2-10/1989
Coldest High Temperature Ever
-23................12/22/1990 -18....................1/1/1979 -18................12/21/1990
Consecutive Days with Low at or Below -30
6...................1/30-2/4/1979
Coldest Low Temperature Ever
-46.................12/23/1983 -46.................12/311978+1/1/1979 -46.................1/12/1963 -46.................1/17/1930
Consecutive Days with Low at or Below -40
4...................12/30/1978-1/2/1979
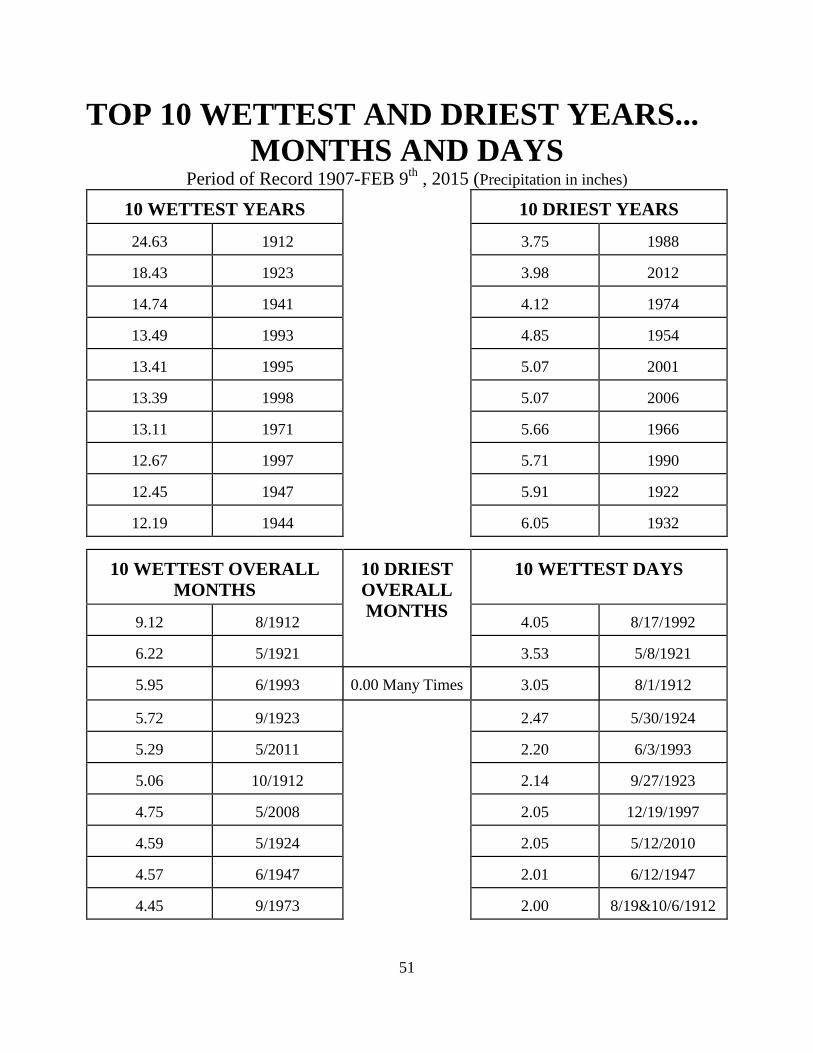
51
TOP 10 WETTEST AND DRIEST YEARS... MONTHS AND DAYS
Period of Record 1907-FEB 9th , 2015 (Precipitation in inches)
10 WETTEST YEARS
10 DRIEST YEARS
24.63
1912
3.75
1988
18.43
1923
3.98
2012
14.74
1941
4.12
1974
13.49
1993
4.85
1954
13.41
1995
5.07
2001
13.39
1998
5.07
2006
13.11
1971
5.66
1966
12.67
1997
5.71
1990
12.45
1947
5.91
1922
12.19
1944
6.05
1932
10 WETTEST OVERALL MONTHS
10 DRIEST OVERALL MONTHS
10 WETTEST DAYS
9.12
8/1912
4.05
8/17/1992
6.22
5/1921
3.53
5/8/1921
5.95
6/1993
0.00 Many Times
3.05
8/1/1912
5.72
9/1923
2.47
5/30/1924
5.29
5/2011 2.20
6/3/1993
5.06
10/1912
2.14
9/27/1923
4.75
5/2008 2.05
12/19/1997
4.59
5/1924
2.05
5/12/2010
4.57
6/1947 2.01
6/12/1947
4.45
9/1973
2.00
8/19&10/6/1912
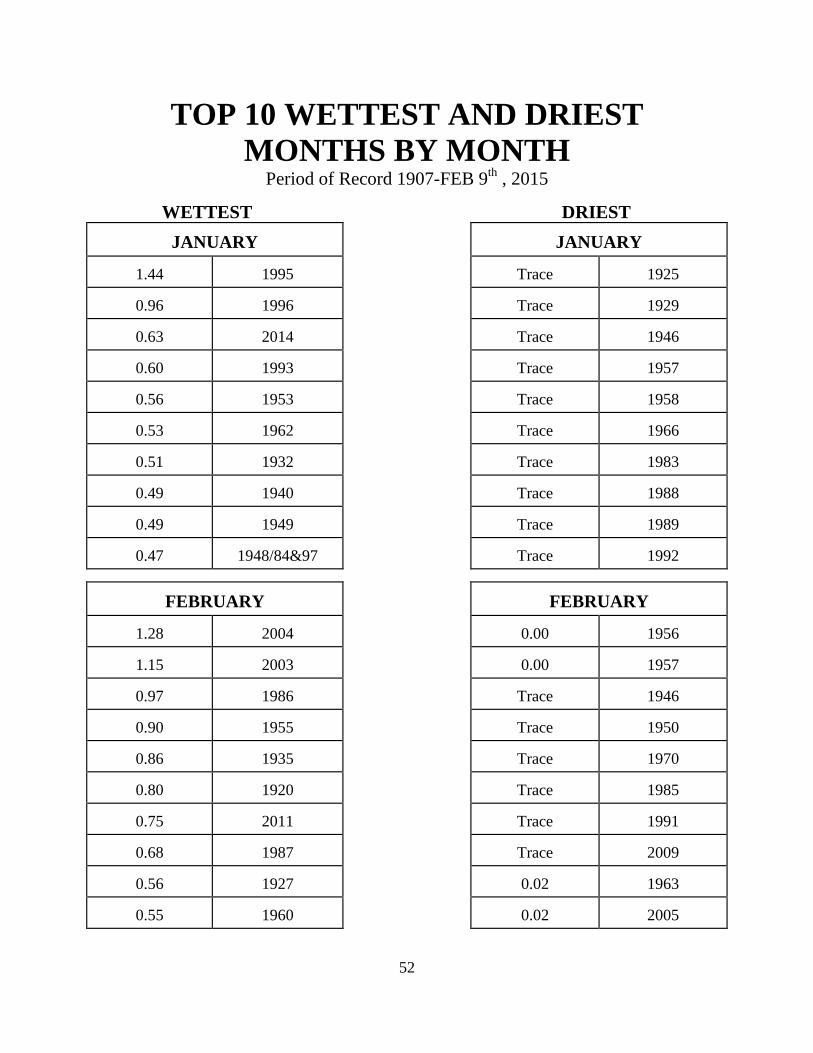
52
TOP 10 WETTEST AND DRIEST MONTHS BY MONTH
Period of Record 1907-FEB 9th , 2015
WETTEST DRIEST JANUARY
JANUARY
1.44
1995
Trace
1925
0.96
1996
Trace
1929
0.63
2014
Trace
1946
0.60
1993
Trace
1957
0.56
1953
Trace
1958
0.53
1962
Trace
1966
0.51
1932
Trace
1983
0.49
1940
Trace
1988
0.49
1949
Trace
1989
0.47
1948/84&97
Trace
1992
FEBRUARY
FEBRUARY
1.28
2004
0.00
1956
1.15
2003
0.00
1957
0.97
1986
Trace
1946
0.90
1955
Trace
1950
0.86
1935
Trace
1970
0.80
1920
Trace
1985
0.75
2011
Trace
1991
0.68
1987
Trace
2009
0.56
1927
0.02
1963
0.55
1960
0.02
2005
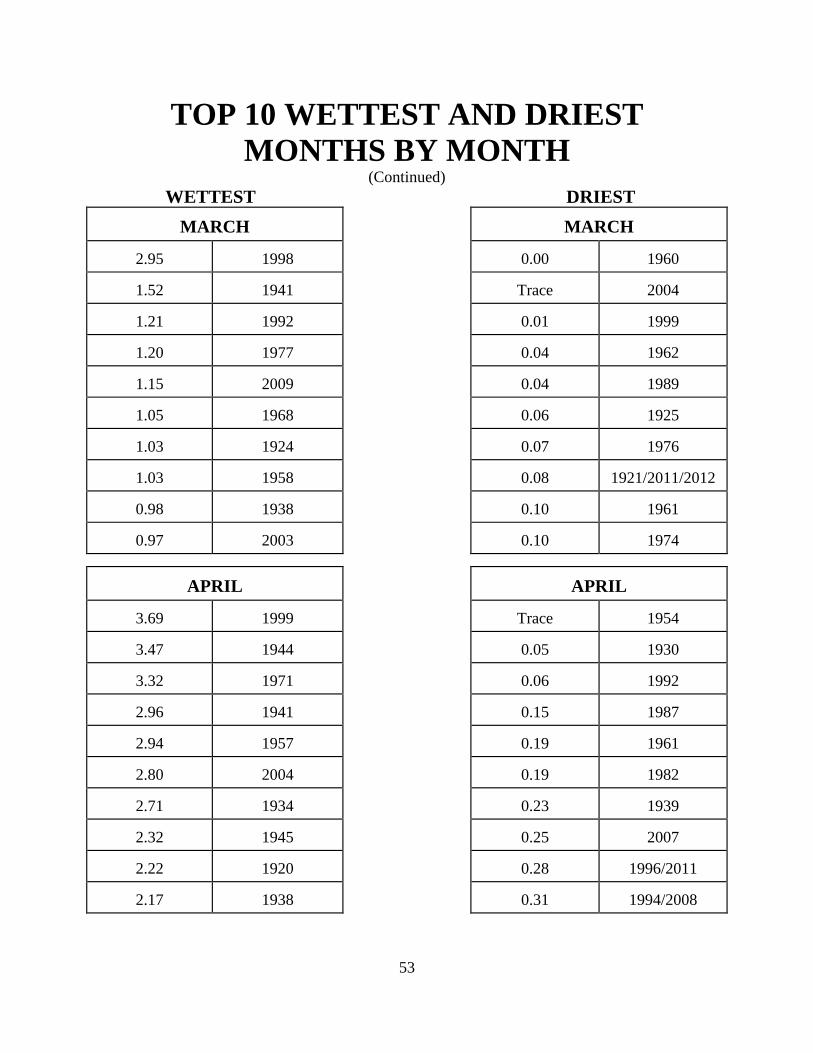
53
TOP 10 WETTEST AND DRIEST MONTHS BY MONTH
(Continued) WETTEST DRIEST
MARCH
MARCH
2.95
1998
0.00
1960
1.52
1941
Trace
2004
1.21
1992
0.01
1999
1.20
1977
0.04
1962
1.15
2009
0.04
1989
1.05
1968
0.06
1925
1.03
1924
0.07
1976
1.03
1958
0.08
1921/2011/2012
0.98
1938
0.10
1961
0.97
2003
0.10
1974
APRIL
APRIL
3.69
1999
Trace
1954
3.47
1944
0.05
1930
3.32
1971
0.06
1992
2.96
1941
0.15
1987
2.94
1957
0.19
1961
2.80
2004
0.19
1982
2.71
1934
0.23
1939
2.32
1945
0.25
2007
2.22
1920
0.28
1996/2011
2.17
1938
0.31
1994/2008
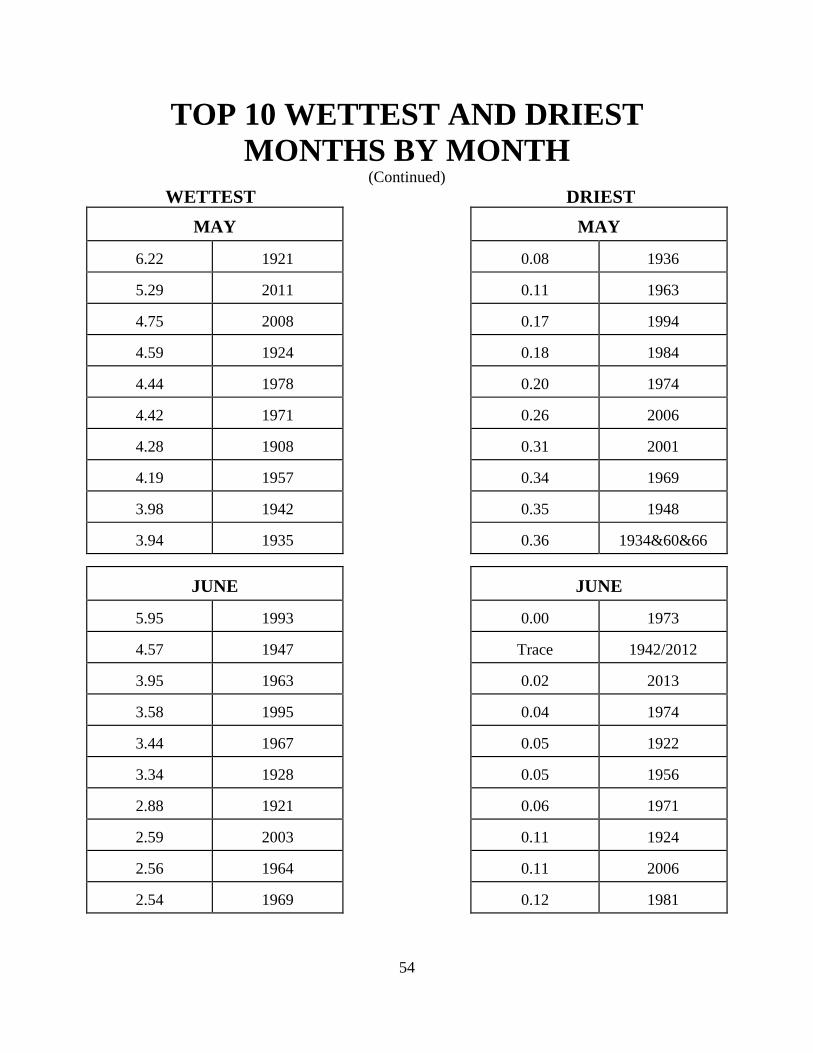
54
TOP 10 WETTEST AND DRIEST MONTHS BY MONTH
(Continued) WETTEST DRIEST
MAY
MAY
6.22
1921
0.08
1936
5.29
2011
0.11
1963
4.75
2008
0.17
1994
4.59
1924
0.18
1984
4.44
1978
0.20
1974
4.42
1971
0.26
2006
4.28
1908
0.31
2001
4.19
1957
0.34
1969
3.98
1942
0.35
1948
3.94
1935
0.36
1934&60&66
JUNE
JUNE
5.95
1993
0.00
1973
4.57
1947
Trace
1942/2012
3.95
1963
0.02
2013
3.58
1995
0.04
1974
3.44
1967
0.05
1922
3.34
1928
0.05
1956
2.88
1921
0.06
1971
2.59
2003
0.11
1924
2.56
1964
0.11
2006
2.54
1969
0.12
1981
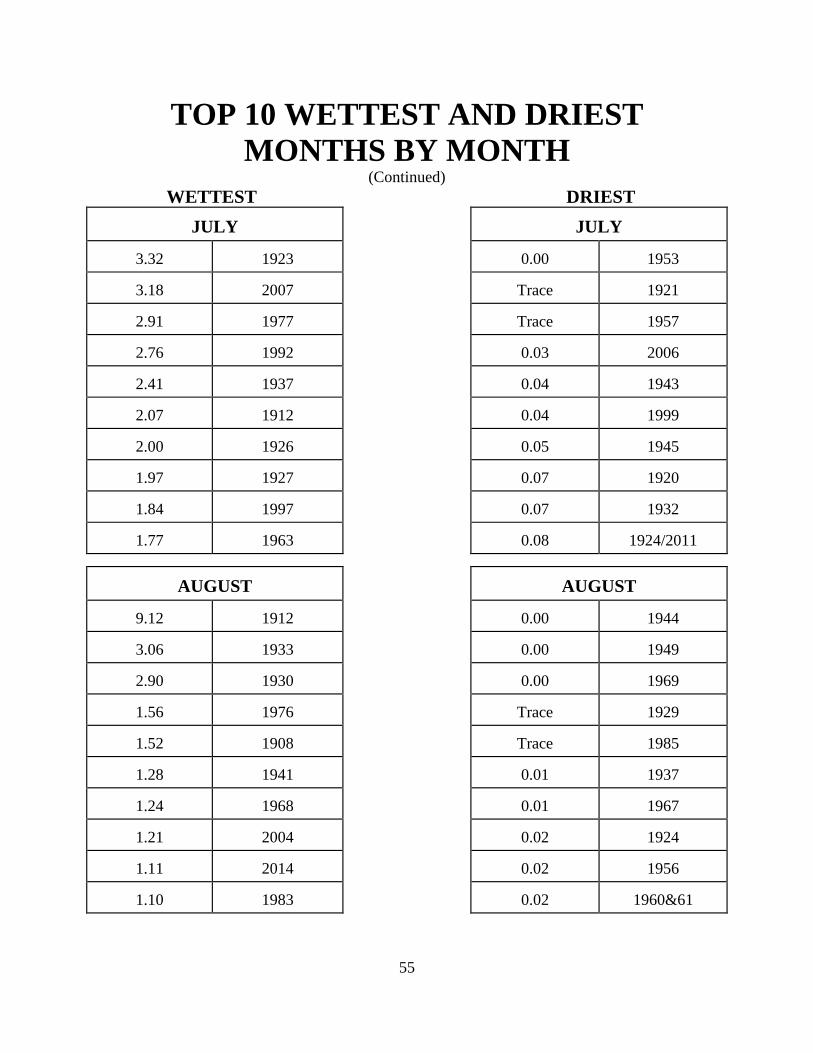
55
TOP 10 WETTEST AND DRIEST MONTHS BY MONTH
(Continued) WETTEST DRIEST
JULY
JULY
3.32
1923
0.00
1953
3.18
2007
Trace
1921
2.91
1977
Trace
1957
2.76
1992
0.03
2006
2.41
1937
0.04
1943
2.07
1912
0.04
1999
2.00
1926
0.05
1945
1.97
1927
0.07
1920
1.84
1997
0.07
1932
1.77
1963
0.08
1924/2011
AUGUST
AUGUST
9.12
1912
0.00
1944
3.06
1933
0.00
1949
2.90
1930
0.00
1969
1.56
1976
Trace
1929
1.52
1908
Trace
1985
1.28
1941
0.01
1937
1.24
1968
0.01
1967
1.21
2004
0.02
1924
1.11
2014
0.02
1956
1.10
1983
0.02
1960&61
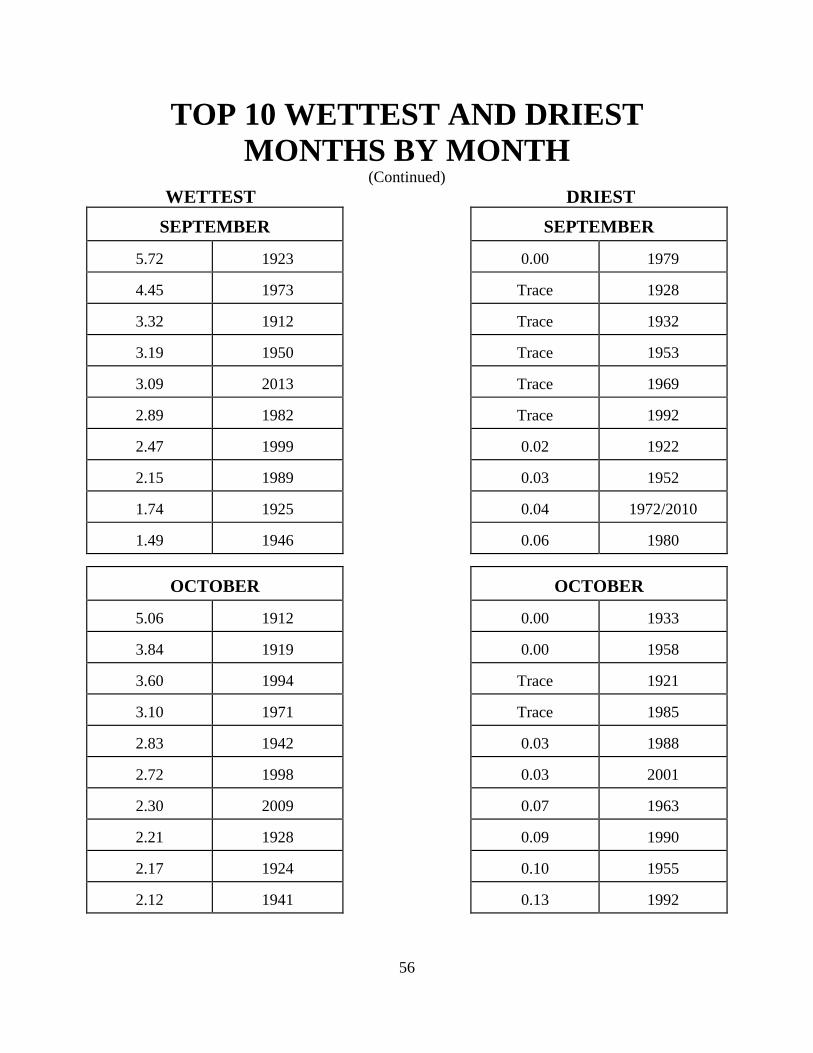
56
TOP 10 WETTEST AND DRIEST MONTHS BY MONTH
(Continued) WETTEST DRIEST
SEPTEMBER
SEPTEMBER
5.72
1923
0.00
1979
4.45
1973
Trace
1928
3.32
1912
Trace
1932
3.19
1950
Trace
1953
3.09
2013
Trace
1969
2.89
1982
Trace
1992
2.47
1999
0.02
1922
2.15
1989
0.03
1952
1.74
1925
0.04
1972/2010
1.49
1946
0.06
1980
OCTOBER
OCTOBER
5.06
1912
0.00
1933
3.84
1919
0.00
1958
3.60
1994
Trace
1921
3.10
1971
Trace
1985
2.83
1942
0.03
1988
2.72
1998
0.03
2001
2.30
2009
0.07
1963
2.21
1928
0.09
1990
2.17
1924
0.10
1955
2.12
1941
0.13
1992
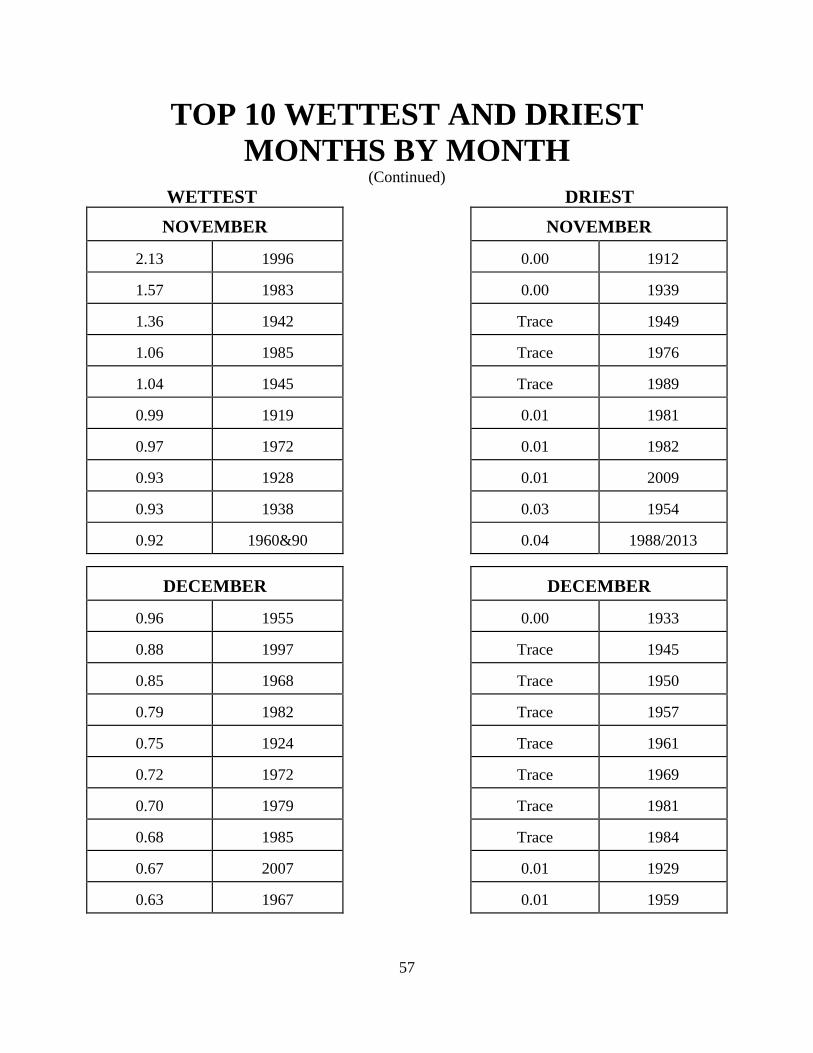
57
TOP 10 WETTEST AND DRIEST MONTHS BY MONTH
(Continued) WETTEST DRIEST
NOVEMBER
NOVEMBER
2.13
1996
0.00
1912
1.57
1983
0.00
1939
1.36
1942
Trace
1949
1.06
1985
Trace
1976
1.04
1945
Trace
1989
0.99
1919
0.01
1981
0.97
1972
0.01
1982
0.93
1928
0.01
2009
0.93
1938
0.03
1954
0.92
1960&90
0.04
1988/2013
DECEMBER
DECEMBER
0.96
1955
0.00
1933
0.88
1997
Trace
1945
0.85
1968
Trace
1950
0.79
1982
Trace
1957
0.75
1924
Trace
1961
0.72
1972
Trace
1969
0.70
1979
Trace
1981
0.68
1985
Trace
1984
0.67
2007
0.01
1929
0.63
1967
0.01
1959
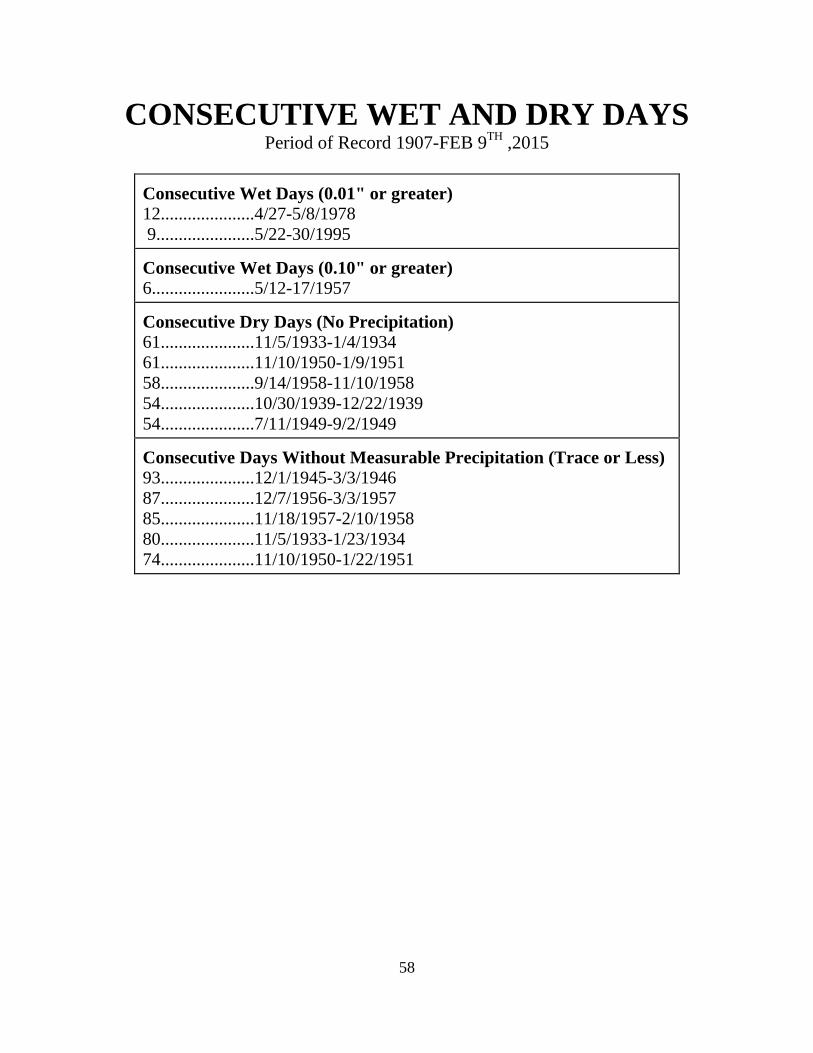
58
CONSECUTIVE WET AND DRY DAYS Period of Record 1907-FEB 9TH ,2015
Consecutive Wet Days (0.01" or greater) 12.....................4/27-5/8/1978 9......................5/22-30/1995 Consecutive Wet Days (0.10" or greater) 6.......................5/12-17/1957 Consecutive Dry Days (No Precipitation) 61.....................11/5/1933-1/4/1934 61.....................11/10/1950-1/9/1951 58.....................9/14/1958-11/10/1958 54.....................10/30/1939-12/22/1939 54.....................7/11/1949-9/2/1949 Consecutive Days Without Measurable Precipitation (Trace or Less) 93.....................12/1/1945-3/3/1946 87.....................12/7/1956-3/3/1957 85.....................11/18/1957-2/10/1958 80.....................11/5/1933-1/23/1934 74.....................11/10/1950-1/22/1951
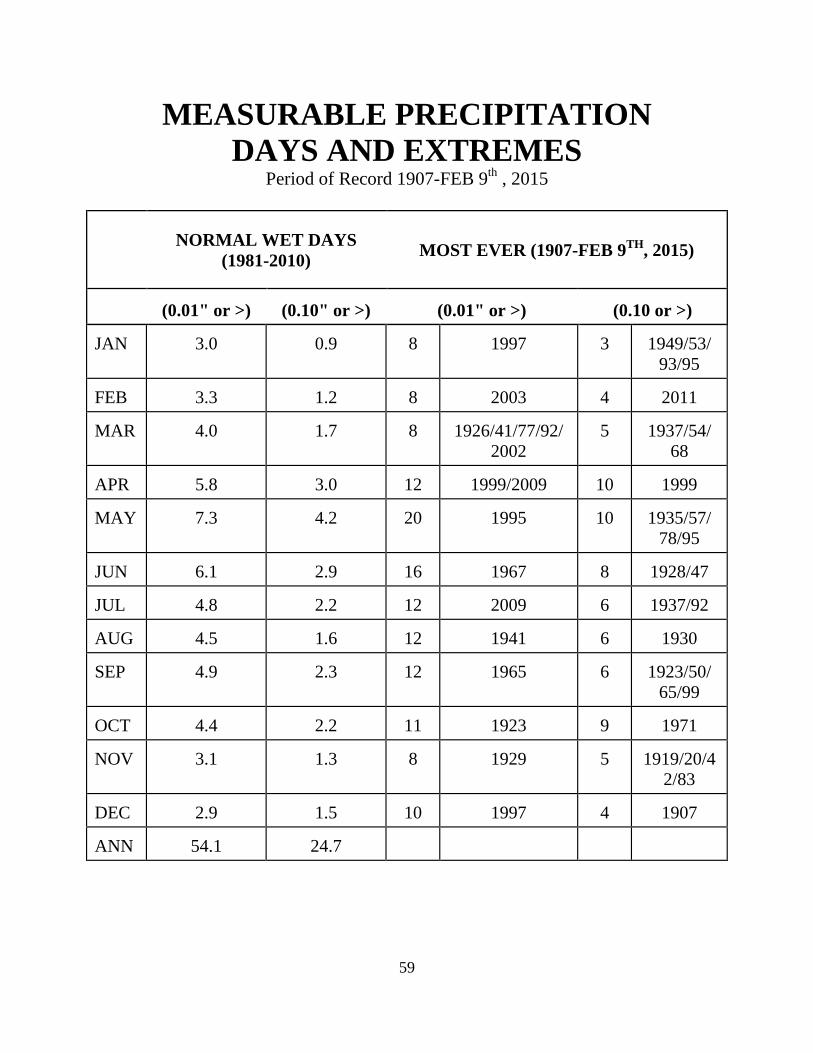
59
MEASURABLE PRECIPITATION DAYS AND EXTREMES
Period of Record 1907-FEB 9th , 2015
NORMAL WET DAYS (1981-2010) MOST EVER (1907-FEB 9TH, 2015)
(0.01" or >) (0.10" or >) (0.01" or >) (0.10 or >)
JAN
3.0
0.9
8
1997
3
1949/53/
93/95 FEB
3.3
1.2
8
2003
4
2011
MAR
4.0
1.7
8
1926/41/77/92/
2002
5
1937/54/
68 APR
5.8
3.0
12
1999/2009
10
1999
MAY
7.3
4.2
20
1995
10
1935/57/
78/95 JUN
6.1
2.9
16
1967
8
1928/47
JUL
4.8
2.2
12
2009
6
1937/92
AUG
4.5
1.6
12
1941
6
1930
SEP
4.9
2.3
12
1965
6
1923/50/
65/99 OCT
4.4
2.2
11
1923
9
1971
NOV
3.1
1.3
8
1929
5
1919/20/4
2/83 DEC
2.9
1.5
10
1997
4
1907
ANN
54.1
24.7
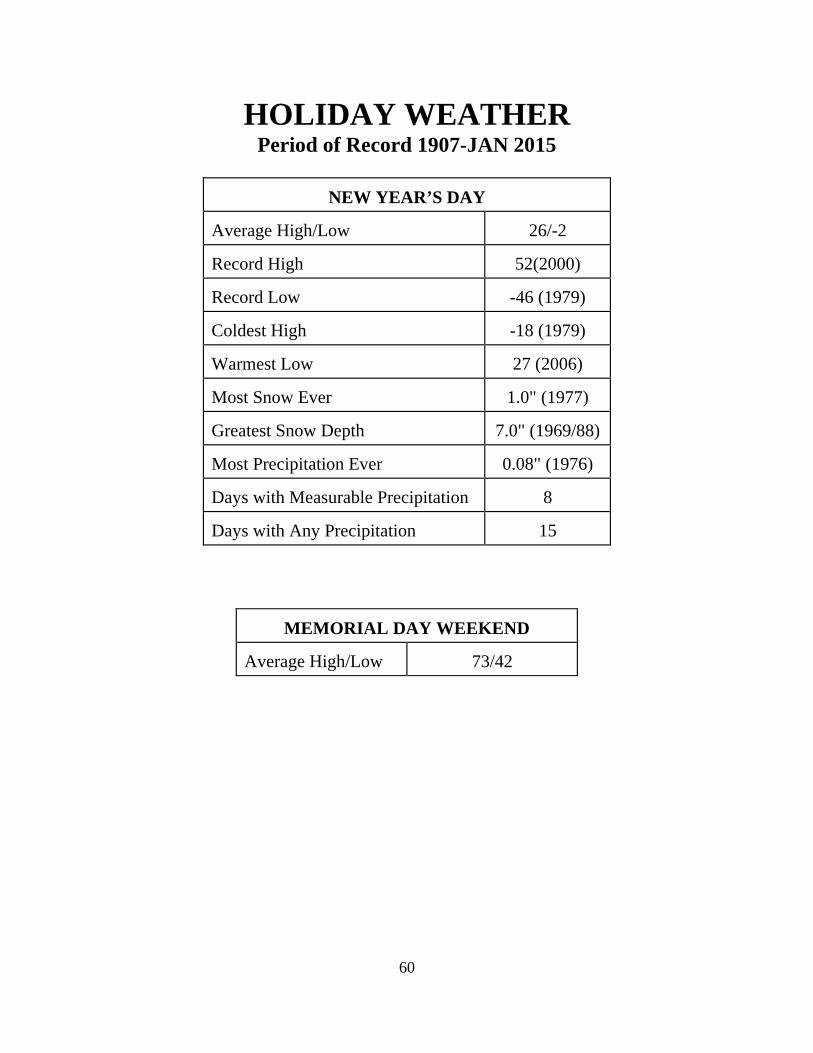
60
HOLIDAY WEATHER Period of Record 1907-JAN 2015
NEW YEAR’S DAY Average High/Low
26/-2
Record High
52(2000)
Record Low
-46 (1979)
Coldest High
-18 (1979)
Warmest Low
27 (2006)
Most Snow Ever
1.0" (1977)
Greatest Snow Depth
7.0" (1969/88)
Most Precipitation Ever
0.08" (1976)
Days with Measurable Precipitation
8
Days with Any Precipitation
15
MEMORIAL DAY WEEKEND Average High/Low
73/42
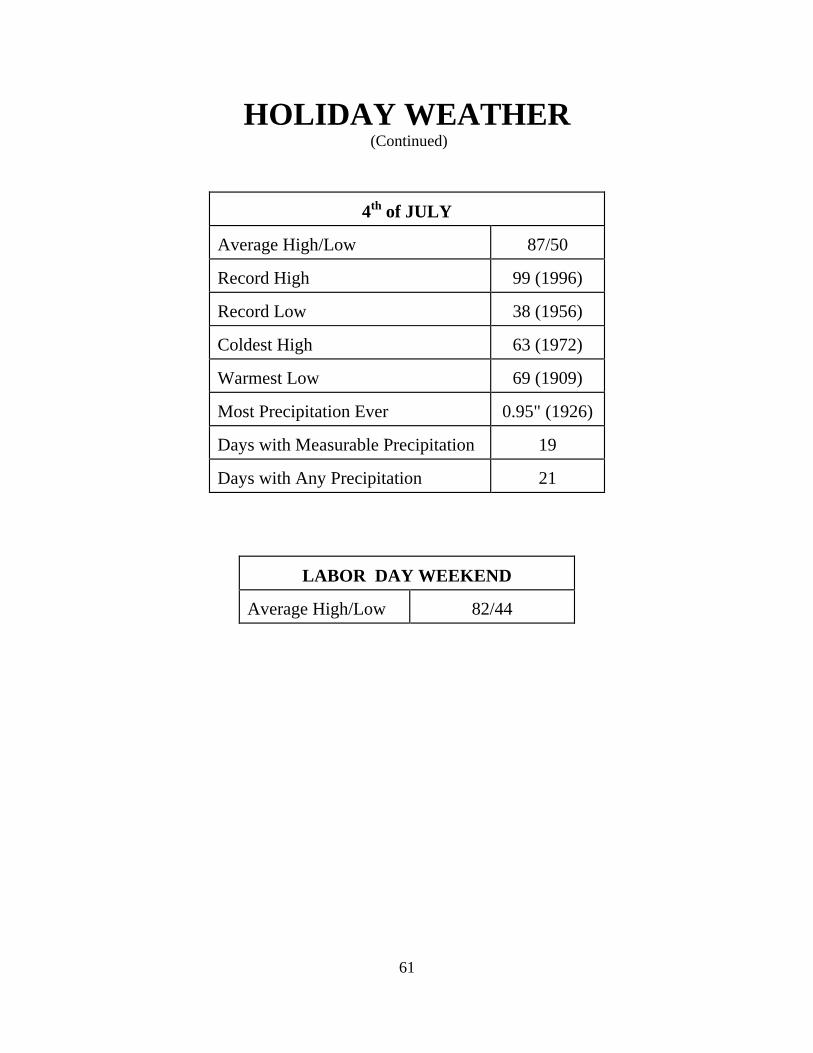
61
HOLIDAY WEATHER (Continued)
4th of JULY
Average High/Low
87/50
Record High
99 (1996)
Record Low
38 (1956)
Coldest High
63 (1972)
Warmest Low
69 (1909)
Most Precipitation Ever
0.95" (1926)
Days with Measurable Precipitation
19
Days with Any Precipitation
21
LABOR DAY WEEKEND Average High/Low
82/44
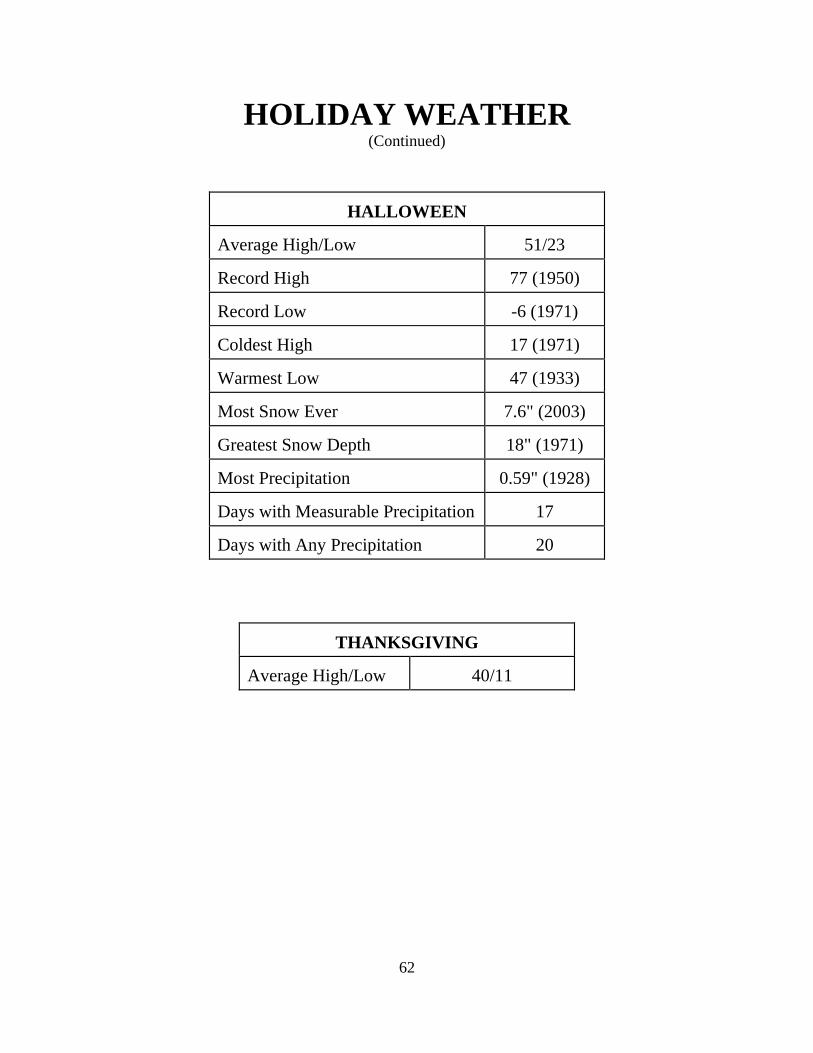
62
HOLIDAY WEATHER (Continued)
HALLOWEEN
Average High/Low
51/23
Record High
77 (1950)
Record Low
-6 (1971)
Coldest High
17 (1971)
Warmest Low
47 (1933)
Most Snow Ever
7.6" (2003)
Greatest Snow Depth
18" (1971)
Most Precipitation
0.59" (1928)
Days with Measurable Precipitation
17
Days with Any Precipitation
20
THANKSGIVING Average High/Low
40/11
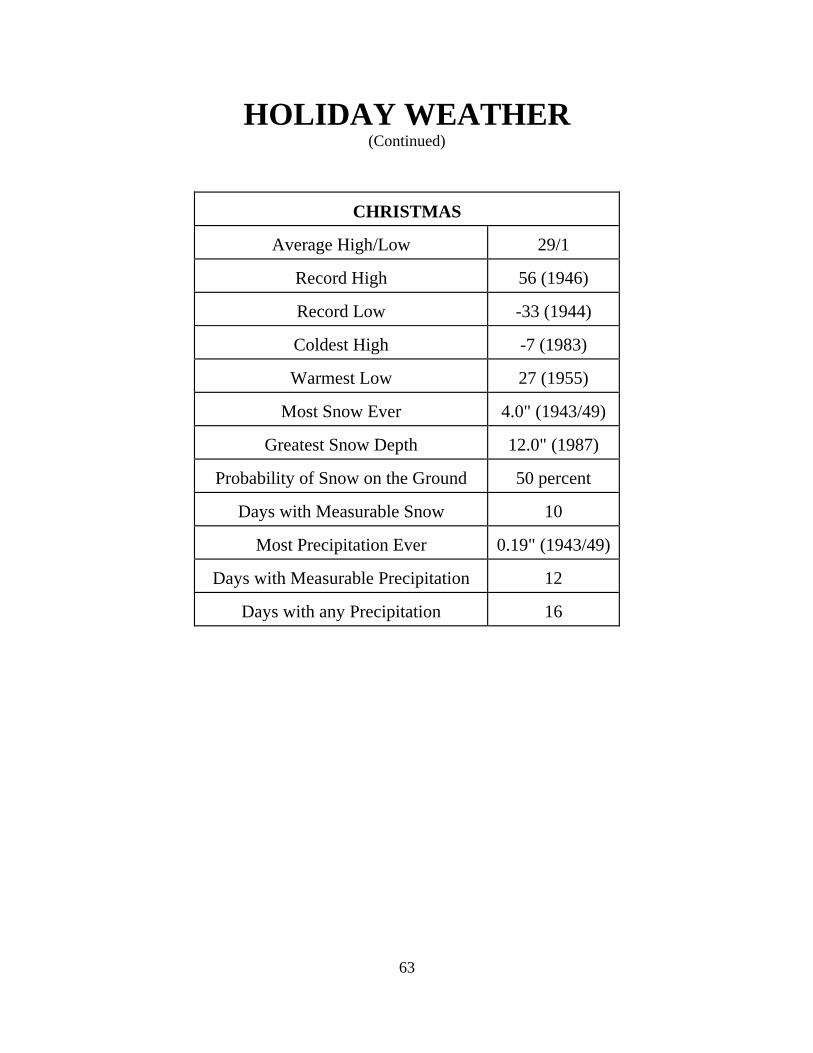
63
HOLIDAY WEATHER (Continued)
CHRISTMAS
Average High/Low
29/1
Record High
56 (1946)
Record Low
-33 (1944)
Coldest High
-7 (1983)
Warmest Low
27 (1955)
Most Snow Ever 4.0" (1943/49)
Greatest Snow Depth
12.0" (1987)
Probability of Snow on the Ground
50 percent
Days with Measurable Snow
10
Most Precipitation Ever
0.19" (1943/49)
Days with Measurable Precipitation
12
Days with any Precipitation
16
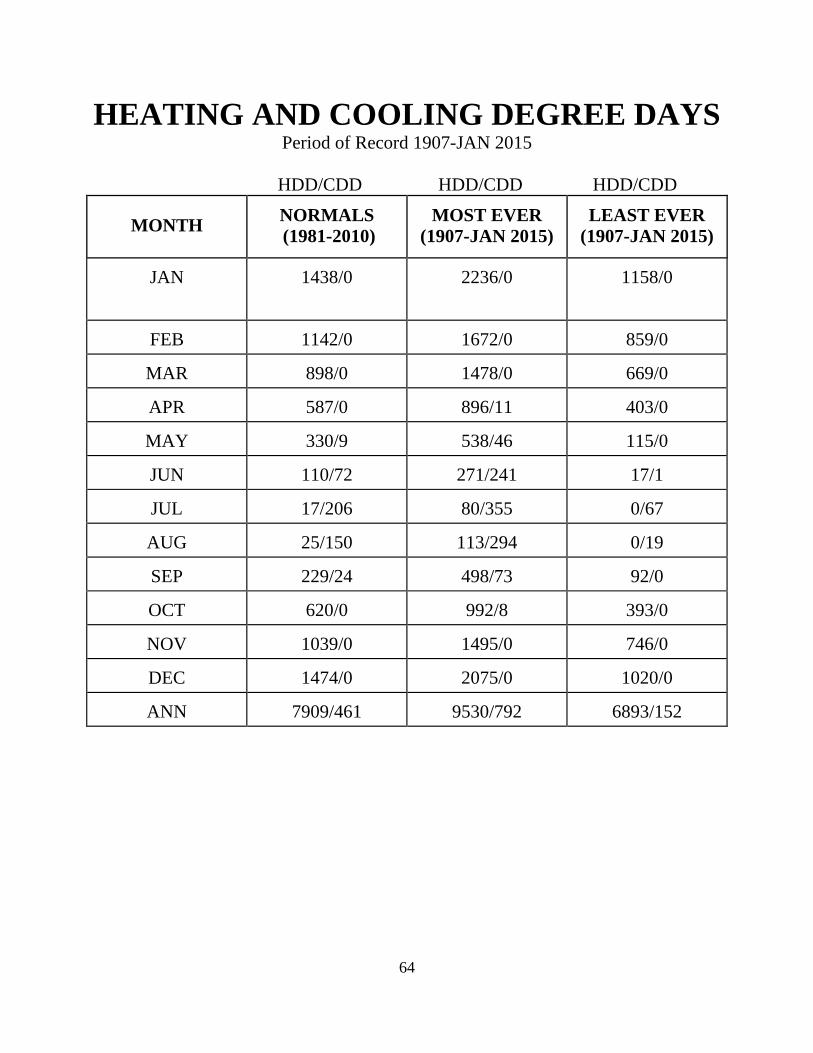
64
HEATING AND COOLING DEGREE DAYS Period of Record 1907-JAN 2015
HDD/CDD HDD/CDD HDD/CDD
MONTH
NORMALS (1981-2010)
MOST EVER
(1907-JAN 2015)
LEAST EVER
(1907-JAN 2015)
JAN
1438/0
2236/0
1158/0
FEB
1142/0
1672/0
859/0
MAR
898/0
1478/0
669/0
APR
587/0
896/11
403/0
MAY
330/9
538/46
115/0
JUN
110/72
271/241
17/1
JUL
17/206
80/355
0/67
AUG
25/150
113/294
0/19
SEP
229/24
498/73
92/0
OCT
620/0
992/8
393/0
NOV
1039/0
1495/0
746/0
DEC
1474/0
2075/0
1020/0
ANN
7909/461
9530/792
6893/152
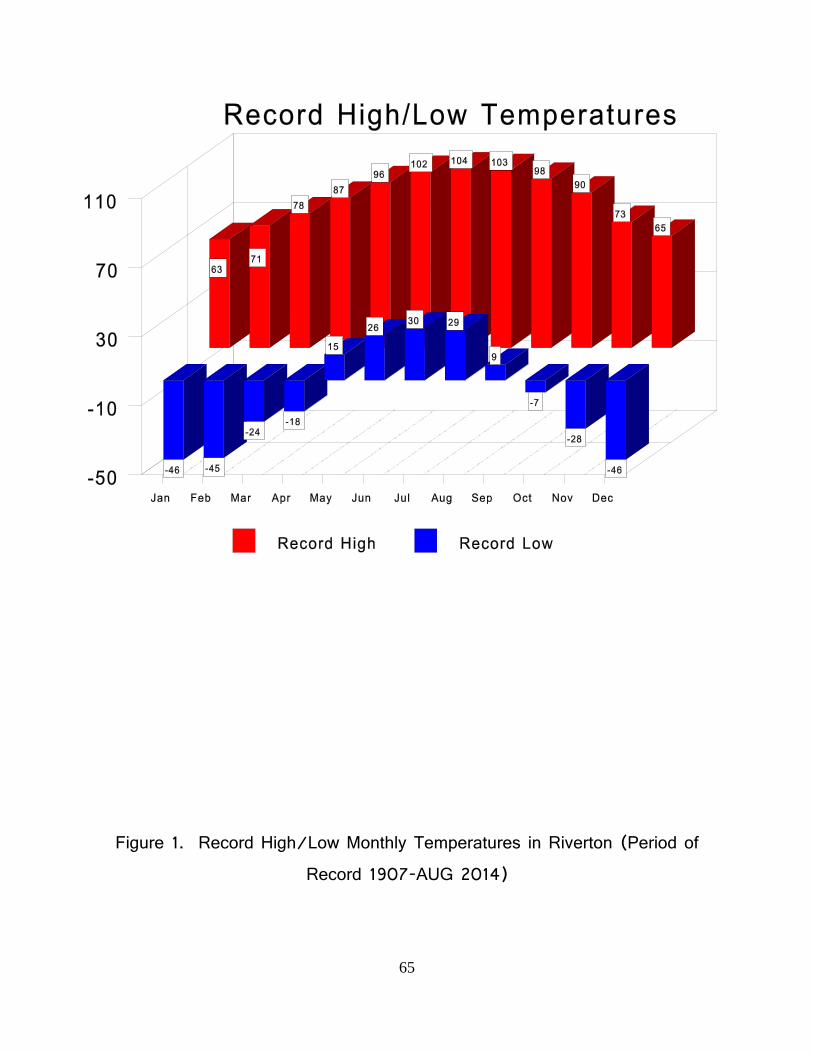
65
Figure 1. Record High/Low Monthly Temperatures in Riverton (Period of
Record 1907-AUG 2014)
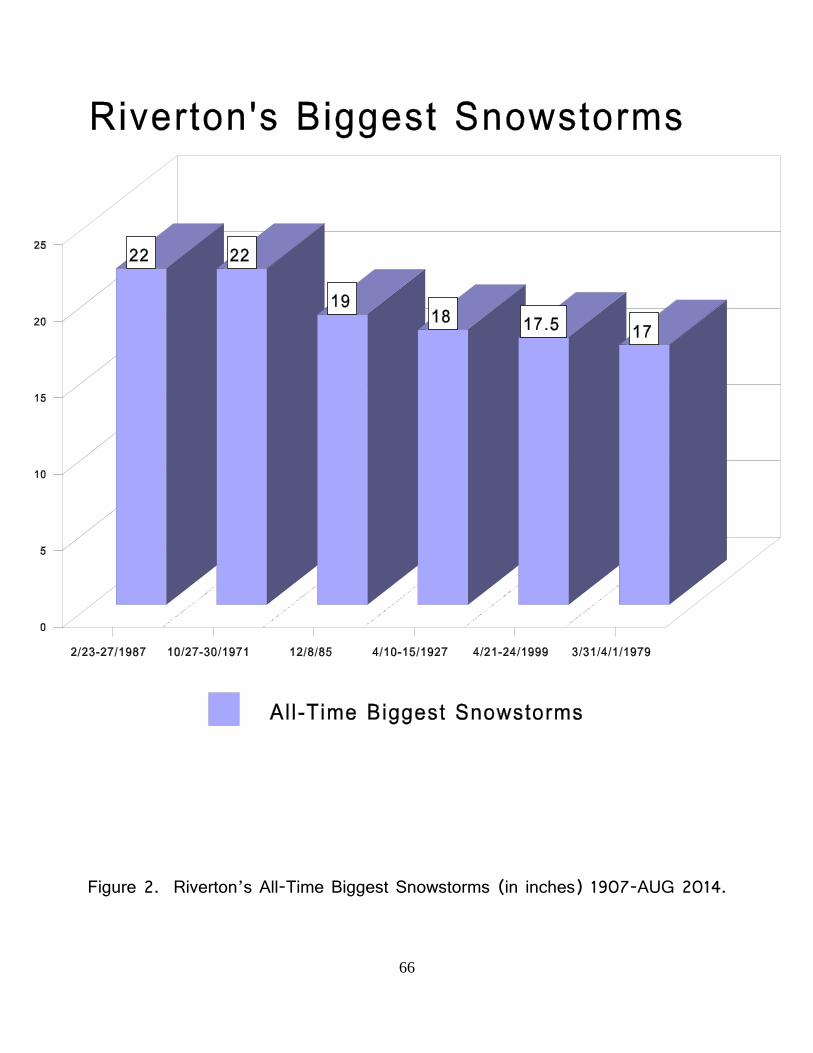
66
Figure 2. Riverton’s All-Time Biggest Snowstorms (in inches) 1907-AUG 2014.
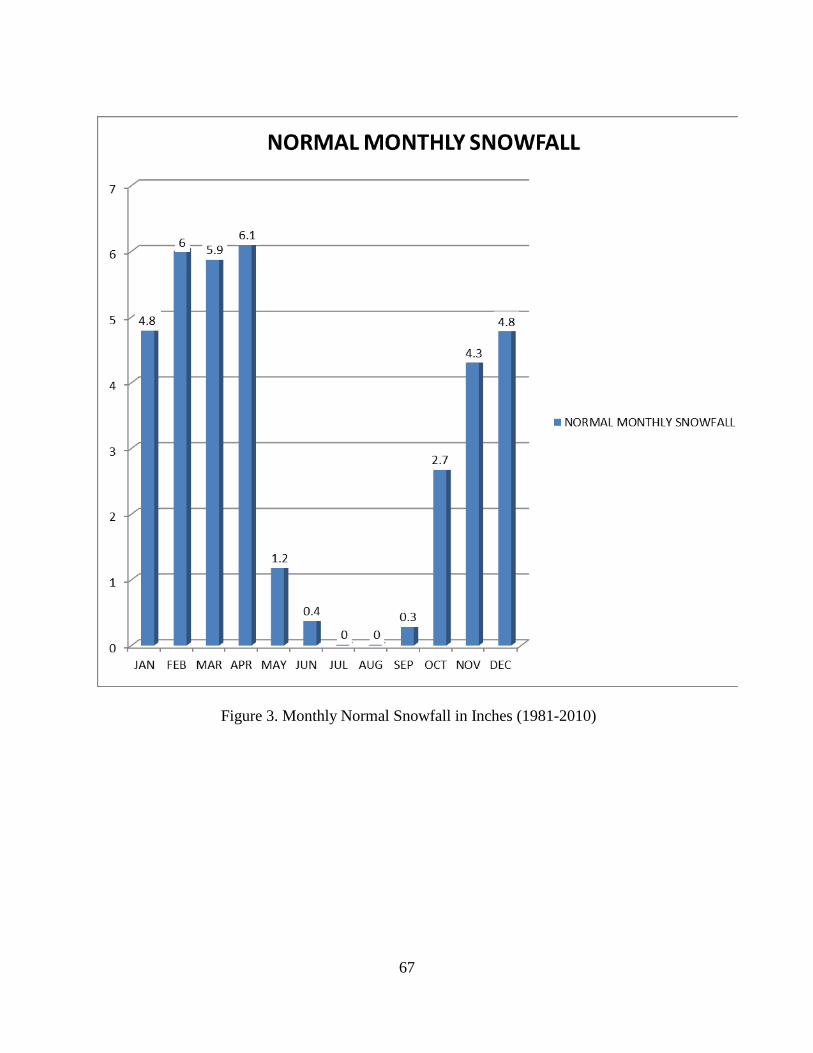
67
Figure 3. Monthly Normal Snowfall in Inches (1981-2010)
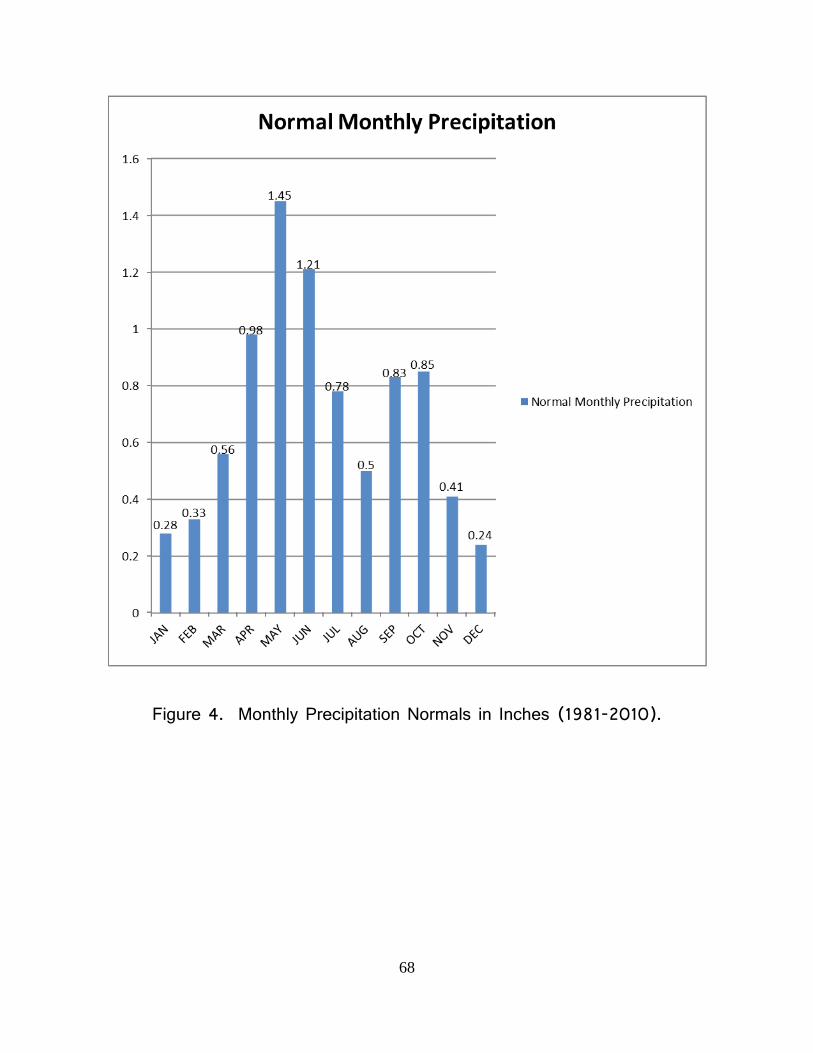
68
Figure 4. Monthly Precipitation Normals in Inches (1981-2010).
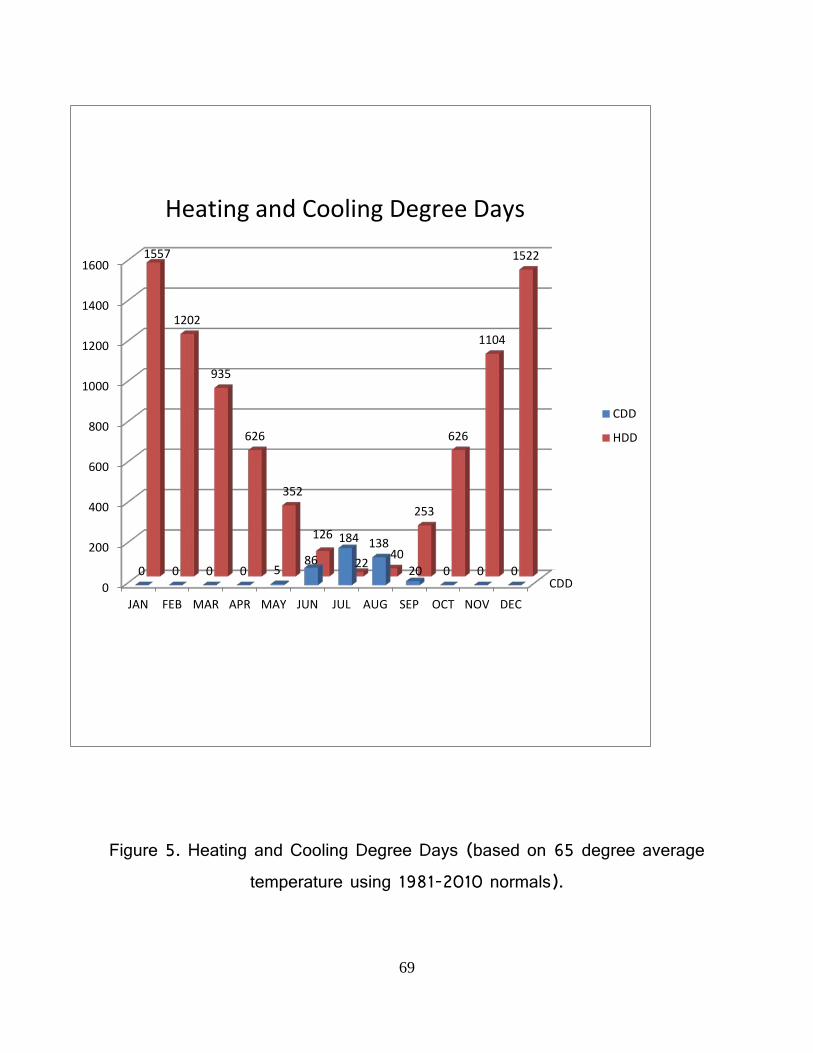
69
Figure 5. Heating and Cooling Degree Days (based on 65 degree average
temperature using 1981-2010 normals).
CDD0
200
400
600
800
1000
1200
1400
1600
JAN FEB MAR APR MAY JUN JUL AUG SEP OCT NOV DEC
0 0 0 0 586
184 138
20 0 0 0
1557
1202
935
626
352
126
2240
253
626
1104
1522
CDD
HDD
Heating and Cooling Degree Days