climate variation drives dengue dynamicsin 2014, an extensive dengue outbreak hit china, with 47,127...
TRANSCRIPT
Climate variation drives dengue dynamicsLei Xua,b,1, Leif C. Stigeb,1, Kung-Sik Chanc, Jie Zhoud, Jun Yanga, Shaowei Sanga, Ming Wange, Zhicong Yange,Ziqiang Yane, Tong Jiangf, Liang Lua, Yujuan Yuea, Xiaobo Liua, Hualiang Ling, Jianguo Xua,2, Qiyong Liua,h,i,2,and Nils Chr. Stensethb,2
aState Key Laboratory of Infectious Disease Prevention and Control, National Institute for Communicable Disease Control and Prevention, Chinese Centerfor Disease Control and Prevention, Beijing 102206, People’s Republic of China; bCentre for Ecological and Evolutionary Synthesis (CEES), Departmentof Biosciences, University of Oslo, N-0316 Oslo, Norway; cDepartment of Statistics and Actuarial Science, University of Iowa, Iowa City, IA 52242; dInstituteof Psychology, Chinese Academy of Sciences, Beijing 100101, People’s Republic of China; eTropical Diseases Research Base of State Key Laboratory ofInfectious Disease Prevention and Control, Guangzhou Center for Disease Control and Prevention, Guangzhou 510440, People’s Republic of China;fNational Climate Center, China Meteorological Administration, Beijing 100081, People’s Republic of China; gGuangdong Provincial Institute of PublicHealth, Guangdong Provincial Center for Disease Control and Prevention, Guangzhou 511430, People’s Republic of China; hShandong University ClimateChange and Health Center, Jinan 250012, People’s Republic of China; and iWorld Health Organization Collaborating Centre for Vector Surveillance andManagement Beijing 102206, People’s Republic of China
Contributed by Nils C. Stenseth, November 10, 2016 (sent for review September 10, 2016; reviewed by Robert A. Cheke and Kenneth L. Gage)
Dengue, a viral infection transmitted between people by mosqui-toes, is one of the most rapidly spreading diseases in the world.Here, we report the analyses covering 11 y (2005–2015) from thecity of Guangzhou in southern China. Using the first 8 y of data todevelop an ecologically based model for the dengue system, wereliably predict the following 3 y of dengue dynamics—years withexceptionally extensive dengue outbreaks. We demonstrate thatclimate conditions, through the effects of rainfall and temperatureon mosquito abundance and dengue transmission rate, play keyroles in explaining the temporal dynamics of dengue incidence inthe human population. Our study thus contributes to a better un-derstanding of dengue dynamics and provides a predictive tool forpreventive dengue reduction strategies.
dengue | climate | structural equation model | zero-inflated generalizedadditive models | prediction
Dengue is one of the most rapidly spreading diseases in theworld (1), including within the Guangdong province of
southern China (2). During the last 50 y, the incidence of denguehas increased 30-fold with increasing geographic expansion tonew countries (1). In 2010, an estimated 390 million dengueinfections occurred, of which around 96 million showed symp-toms (3). Dengue outbreaks in China were previously thought tobe imported and initiated by people traveling to China fromdengue-endemic areas elsewhere (4); however, recent studiessuggest that dengue may now be endemic to China as well (2). Theepidemiological triangle of both dengue fever and dengue hemor-rhagic fever, which is the more serious form of dengue, includeshosts (humans), pathogens (one or more of five dengue virus se-rotypes) (5), and mosquito vectors (Aedes albopictus and Aedesaegypti) with their ecological interactions (6). The dengue outbreaksare qualitatively known to be strongly influenced by temperature(7), humidity, rainfall, and socioeconomic factors like urbanization(8). However, a full understanding of the quantitative nature of sucheffects is largely lacking. With this paper, we provide such a quan-titative understanding of dengue dynamics.In 2014, an extensive dengue outbreak hit China, with 47,127
dengue cases diagnosed, a new record since 1986 (9). Since the1990s, dengue epidemics have gradually spread from Guangdong,Hainan, and Guangxi provinces (9). We present here a time seriesanalysis of dengue dynamics, using dengue surveillance data for theyears 2005−2015 from Guangzhou, the largest city in Guangdongand the city with the most dengue cases in China. We split the mainanalysis by using the first 8 y to develop a model, and the threeremaining years to test that model, as these latter years encompassexceptionally extensive dengue outbreaks.Monthly human dengue incidence data (number of diagnosed
cases) were obtained from the China National Notifiable DiseaseSurveillance System (10) (Fig. 1). Monthly surveillance data ofA. albopictus density, the only dengue vector species in Guangzhou,
were obtained from local Centers for Disease Control and Pre-vention (11) (Methods). We considered indices of both larval andadult densities. Temperature and precipitation data were obtainedfrom the China Meteorological Data Sharing Service System(www.cma.gov.cn/). We considered several alternative monthlytemperature (degrees Celsius) and precipitation indices in thesubsequent analyses, including mean temperature, monthly averageof daily minimum temperature, monthly average of daily maximumtemperature, cumulative precipitation (millimeters), and number ofdays with rainfall.
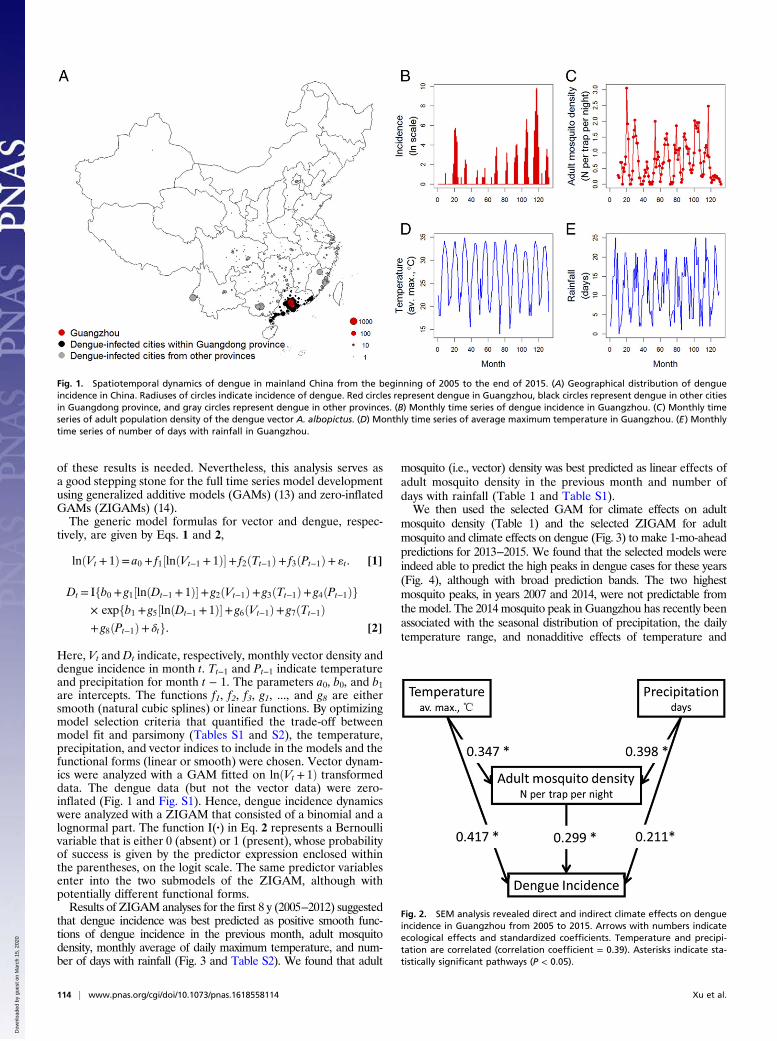
Results and DiscussionWe first explored the direct and indirect effects of temperatureand precipitation on dengue outbreaks for all years from 2005−2015using a structural equation model (SEM) (12). The SEM resultssuggest significant direct, positive effects of temperature andprecipitation on dengue incidence as well as indirect, positiveeffects of both variables through vector density (Fig. 2). Modeldiagnostics suggest that the SEM was robust: The normalized χ2test (i.e., model χ2 divided by the degrees of freedom) = 0.149,root-mean-square error of approximation < 0.001, and com-parative fit index = 1 (12). However, due to the presence of manyzeros in the data (zero inflation), and the inability of the SEMto capture nonlinear effects, some caution in the interpretation
Significance
Dengue is a vector-borne infectious disease that threatenshuman health on a global scale. Because of climate change,globalization, and other factors, dengue has increasinglyspread to new countries and over larger areas, from tropicalto temperate zones. In this study, we found that climate hasboth direct effects on dengue incidence and indirect effectsmediated by mosquito density, as mosquitoes are the vectorsof dengue. The quantitative results derived from this studymay be helpful toward advancing our understanding of howclimate influences vector-borne diseases and prove useful forthe control and prevention of dengue fever.
Author contributions: L.X. and N.C.S. designed research; L.X., L.C.S., K.-S.C., J.Z., J.Y., S.S.,M.W., Z. Yang, Z. Yan, T.J., L.L., Y.Y., X.L., H.L., J.X., Q.L., and N.C.S. performed research;L.X., L.C.S., K.-S.C., and J.Z. analyzed data; and L.X., L.C.S., and N.C.S. wrote the paper.
Reviewers: R.A.C., University of Greenwich at Medway; and K.L.G., Centers for DiseaseControl and Prevention.
The authors declare no conflict of interest.
Freely available online through the PNAS open access option.1L.X. and L.C.S. contributed equally to this work.2To whom correspondence may be addressed. Email: [email protected], [email protected], or [email protected].
This article contains supporting information online at www.pnas.org/lookup/suppl/doi:10.1073/pnas.1618558114/-/DCSupplemental.
www.pnas.org/cgi/doi/10.1073/pnas.1618558114 PNAS | January 3, 2017 | vol. 114 | no. 1 | 113–118
ECOLO
GY
Dow
nloa
ded
by g
uest
on
Mar
ch 1
5, 2
020
of these results is needed. Nevertheless, this analysis serves asa good stepping stone for the full time series model developmentusing generalized additive models (GAMs) (13) and zero-inflatedGAMs (ZIGAMs) (14).The generic model formulas for vector and dengue, respec-
tively, are given by Eqs. 1 and 2,
lnðVt + 1Þ= a0 + f1½lnðVt−1 + 1Þ�+ f2ðTt−1Þ+ f3ðPt−1Þ+ «t. [1]
Dt = Ifb0 + g1½lnðDt−1 + 1Þ�+ g2ðVt−1Þ+ g3ðTt−1Þ+ g4ðPt−1Þg× expfb1 + g5½lnðDt−1 + 1Þ�+ g6ðVt−1Þ+ g7ðTt−1Þ+ g8ðPt−1Þ+ δtg. [2]
Here, Vt and Dt indicate, respectively, monthly vector density anddengue incidence in month t. Tt−1 and Pt−1 indicate temperatureand precipitation for month t − 1. The parameters a0, b0, and b1are intercepts. The functions f1, f2, f3, g1, ..., and g8 are eithersmooth (natural cubic splines) or linear functions. By optimizingmodel selection criteria that quantified the trade-off betweenmodel fit and parsimony (Tables S1 and S2), the temperature,precipitation, and vector indices to include in the models and thefunctional forms (linear or smooth) were chosen. Vector dynam-ics were analyzed with a GAM fitted on lnðVt + 1Þ transformeddata. The dengue data (but not the vector data) were zero-inflated (Fig. 1 and Fig. S1). Hence, dengue incidence dynamicswere analyzed with a ZIGAM that consisted of a binomial and alognormal part. The function I(·) in Eq. 2 represents a Bernoullivariable that is either 0 (absent) or 1 (present), whose probabilityof success is given by the predictor expression enclosed withinthe parentheses, on the logit scale. The same predictor variablesenter into the two submodels of the ZIGAM, although withpotentially different functional forms.Results of ZIGAM analyses for the first 8 y (2005−2012) suggested
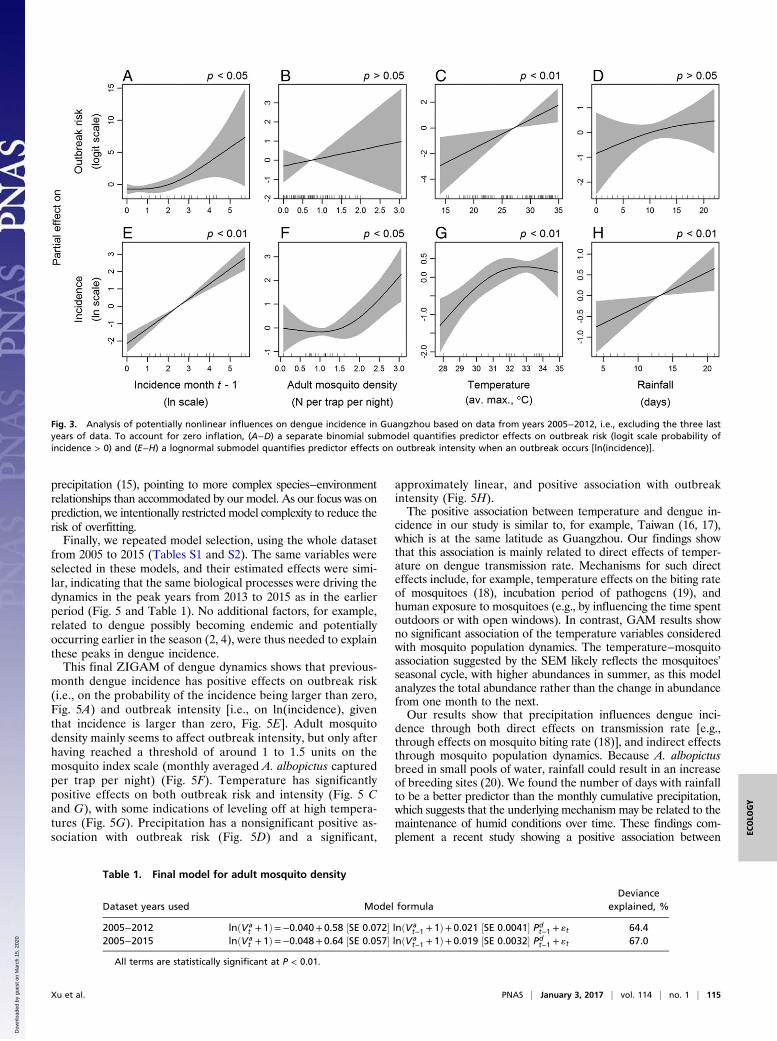
that dengue incidence was best predicted as positive smooth func-tions of dengue incidence in the previous month, adult mosquitodensity, monthly average of daily maximum temperature, and num-ber of days with rainfall (Fig. 3 and Table S2). We found that adult
mosquito (i.e., vector) density was best predicted as linear effects ofadult mosquito density in the previous month and number ofdays with rainfall (Table 1 and Table S1).We then used the selected GAM for climate effects on adult
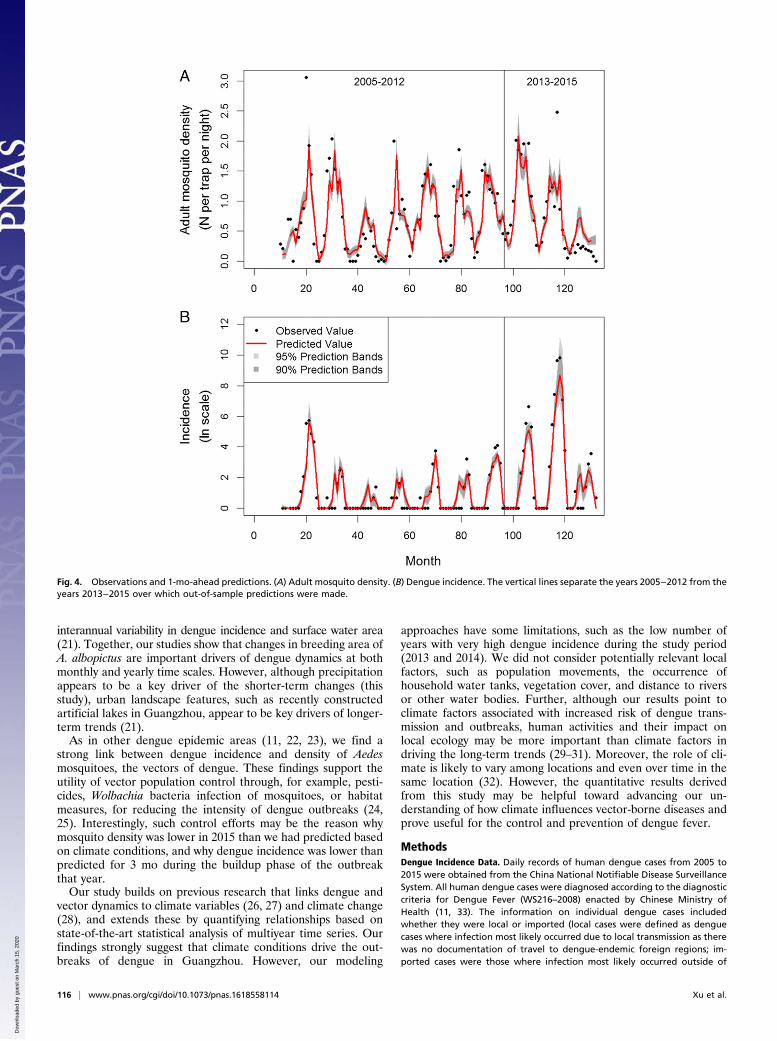
mosquito density (Table 1) and the selected ZIGAM for adultmosquito and climate effects on dengue (Fig. 3) to make 1-mo-aheadpredictions for 2013−2015. We found that the selected models wereindeed able to predict the high peaks in dengue cases for these years(Fig. 4), although with broad prediction bands. The two highestmosquito peaks, in years 2007 and 2014, were not predictable fromthe model. The 2014 mosquito peak in Guangzhou has recently beenassociated with the seasonal distribution of precipitation, the dailytemperature range, and nonadditive effects of temperature and
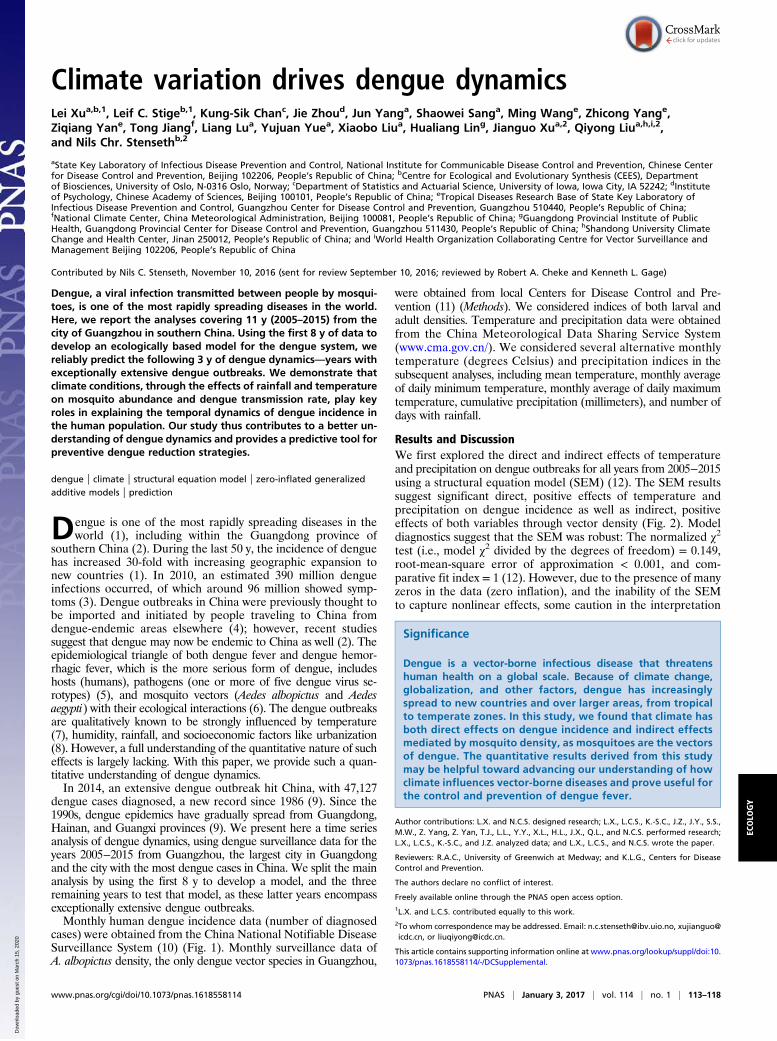
Fig. 1. Spatiotemporal dynamics of dengue in mainland China from the beginning of 2005 to the end of 2015. (A) Geographical distribution of dengueincidence in China. Radiuses of circles indicate incidence of dengue. Red circles represent dengue in Guangzhou, black circles represent dengue in other citiesin Guangdong province, and gray circles represent dengue in other provinces. (B) Monthly time series of dengue incidence in Guangzhou. (C) Monthly timeseries of adult population density of the dengue vector A. albopictus. (D) Monthly time series of average maximum temperature in Guangzhou. (E) Monthlytime series of number of days with rainfall in Guangzhou.
Fig. 2. SEM analysis revealed direct and indirect climate effects on dengueincidence in Guangzhou from 2005 to 2015. Arrows with numbers indicateecological effects and standardized coefficients. Temperature and precipi-tation are correlated (correlation coefficient = 0.39). Asterisks indicate sta-tistically significant pathways (P < 0.05).
114 | www.pnas.org/cgi/doi/10.1073/pnas.1618558114 Xu et al.
Dow
nloa
ded
by g
uest
on
Mar
ch 1
5, 2
020
precipitation (15), pointing to more complex species−environmentrelationships than accommodated by our model. As our focus was onprediction, we intentionally restricted model complexity to reduce therisk of overfitting.Finally, we repeated model selection, using the whole dataset
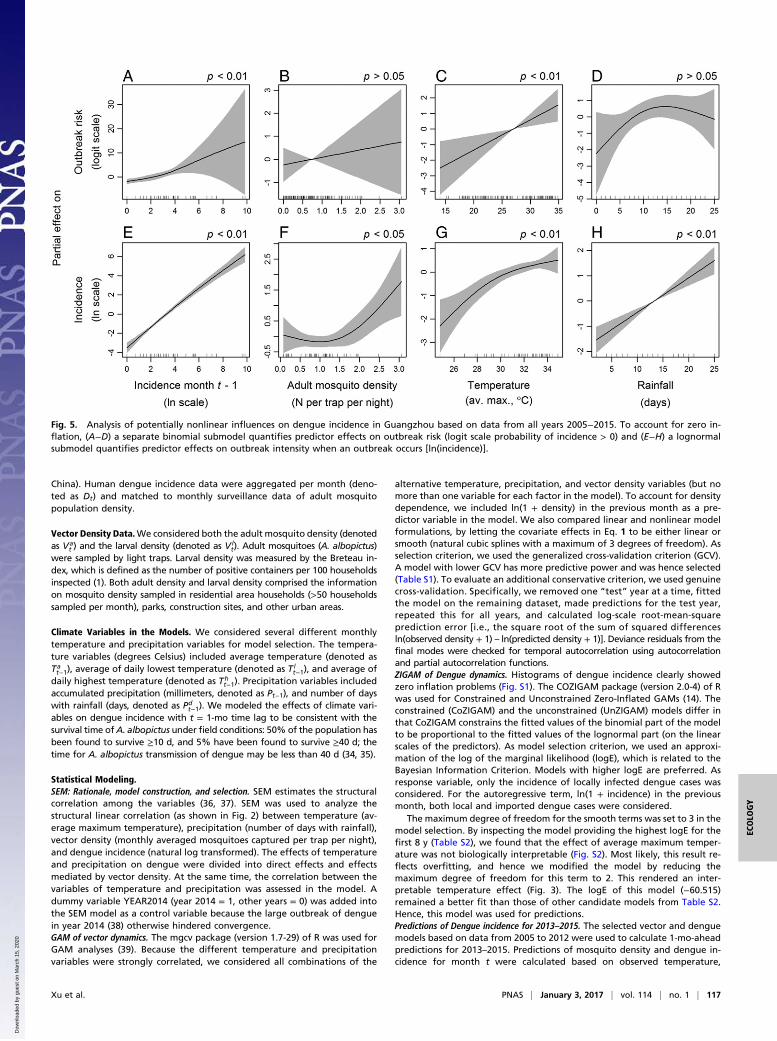
from 2005 to 2015 (Tables S1 and S2). The same variables wereselected in these models, and their estimated effects were simi-lar, indicating that the same biological processes were driving thedynamics in the peak years from 2013 to 2015 as in the earlierperiod (Fig. 5 and Table 1). No additional factors, for example,related to dengue possibly becoming endemic and potentiallyoccurring earlier in the season (2, 4), were thus needed to explainthese peaks in dengue incidence.This final ZIGAM of dengue dynamics shows that previous-
month dengue incidence has positive effects on outbreak risk(i.e., on the probability of the incidence being larger than zero,Fig. 5A) and outbreak intensity [i.e., on ln(incidence), giventhat incidence is larger than zero, Fig. 5E]. Adult mosquitodensity mainly seems to affect outbreak intensity, but only afterhaving reached a threshold of around 1 to 1.5 units on themosquito index scale (monthly averaged A. albopictus capturedper trap per night) (Fig. 5F). Temperature has significantlypositive effects on both outbreak risk and intensity (Fig. 5 Cand G), with some indications of leveling off at high tempera-tures (Fig. 5G). Precipitation has a nonsignificant positive as-sociation with outbreak risk (Fig. 5D) and a significant,
approximately linear, and positive association with outbreakintensity (Fig. 5H).The positive association between temperature and dengue in-
cidence in our study is similar to, for example, Taiwan (16, 17),which is at the same latitude as Guangzhou. Our findings showthat this association is mainly related to direct effects of temper-ature on dengue transmission rate. Mechanisms for such directeffects include, for example, temperature effects on the biting rateof mosquitoes (18), incubation period of pathogens (19), andhuman exposure to mosquitoes (e.g., by influencing the time spentoutdoors or with open windows). In contrast, GAM results showno significant association of the temperature variables consideredwith mosquito population dynamics. The temperature−mosquitoassociation suggested by the SEM likely reflects the mosquitoes’seasonal cycle, with higher abundances in summer, as this modelanalyzes the total abundance rather than the change in abundancefrom one month to the next.Our results show that precipitation influences dengue inci-
dence through both direct effects on transmission rate [e.g.,through effects on mosquito biting rate (18)], and indirect effectsthrough mosquito population dynamics. Because A. albopictusbreed in small pools of water, rainfall could result in an increaseof breeding sites (20). We found the number of days with rainfallto be a better predictor than the monthly cumulative precipitation,which suggests that the underlying mechanism may be related to themaintenance of humid conditions over time. These findings com-plement a recent study showing a positive association between
Fig. 3. Analysis of potentially nonlinear influences on dengue incidence in Guangzhou based on data from years 2005−2012, i.e., excluding the three lastyears of data. To account for zero inflation, (A−D) a separate binomial submodel quantifies predictor effects on outbreak risk (logit scale probability ofincidence > 0) and (E−H) a lognormal submodel quantifies predictor effects on outbreak intensity when an outbreak occurs [ln(incidence)].
Table 1. Final model for adult mosquito density
Dataset years used Model formulaDeviance
explained, %
2005−2012 lnðVat +1Þ=−0.040+0.58 ½SE 0.072� lnðVa
t−1 +1Þ+0.021 ½SE 0.0041� Pdt−1 + «t 64.4
2005−2015 lnðVat +1Þ=−0.048+0.64 ½SE 0.057� lnðVa
t−1 +1Þ+0.019 ½SE 0.0032� Pdt−1 + «t 67.0
All terms are statistically significant at P < 0.01.
Xu et al. PNAS | January 3, 2017 | vol. 114 | no. 1 | 115
ECOLO
GY
Dow
nloa
ded
by g
uest
on
Mar
ch 1
5, 2
020
interannual variability in dengue incidence and surface water area(21). Together, our studies show that changes in breeding area ofA. albopictus are important drivers of dengue dynamics at bothmonthly and yearly time scales. However, although precipitationappears to be a key driver of the shorter-term changes (thisstudy), urban landscape features, such as recently constructedartificial lakes in Guangzhou, appear to be key drivers of longer-term trends (21).As in other dengue epidemic areas (11, 22, 23), we find a
strong link between dengue incidence and density of Aedesmosquitoes, the vectors of dengue. These findings support theutility of vector population control through, for example, pesti-cides, Wolbachia bacteria infection of mosquitoes, or habitatmeasures, for reducing the intensity of dengue outbreaks (24,25). Interestingly, such control efforts may be the reason whymosquito density was lower in 2015 than we had predicted basedon climate conditions, and why dengue incidence was lower thanpredicted for 3 mo during the buildup phase of the outbreakthat year.Our study builds on previous research that links dengue and
vector dynamics to climate variables (26, 27) and climate change(28), and extends these by quantifying relationships based onstate-of-the-art statistical analysis of multiyear time series. Ourfindings strongly suggest that climate conditions drive the out-breaks of dengue in Guangzhou. However, our modeling
approaches have some limitations, such as the low number ofyears with very high dengue incidence during the study period(2013 and 2014). We did not consider potentially relevant localfactors, such as population movements, the occurrence ofhousehold water tanks, vegetation cover, and distance to riversor other water bodies. Further, although our results point toclimate factors associated with increased risk of dengue trans-mission and outbreaks, human activities and their impact onlocal ecology may be more important than climate factors indriving the long-term trends (29–31). Moreover, the role of cli-mate is likely to vary among locations and even over time in thesame location (32). However, the quantitative results derivedfrom this study may be helpful toward advancing our un-derstanding of how climate influences vector-borne diseases andprove useful for the control and prevention of dengue fever.
MethodsDengue Incidence Data. Daily records of human dengue cases from 2005 to2015 were obtained from the China National Notifiable Disease SurveillanceSystem. All human dengue cases were diagnosed according to the diagnosticcriteria for Dengue Fever (WS216–2008) enacted by Chinese Ministry ofHealth (11, 33). The information on individual dengue cases includedwhether they were local or imported (local cases were defined as denguecases where infection most likely occurred due to local transmission as therewas no documentation of travel to dengue-endemic foreign regions; im-ported cases were those where infection most likely occurred outside of
Fig. 4. Observations and 1-mo-ahead predictions. (A) Adult mosquito density. (B) Dengue incidence. The vertical lines separate the years 2005−2012 from theyears 2013−2015 over which out-of-sample predictions were made.
116 | www.pnas.org/cgi/doi/10.1073/pnas.1618558114 Xu et al.
Dow
nloa
ded
by g
uest
on
Mar
ch 1
5, 2
020
China). Human dengue incidence data were aggregated per month (deno-ted as Dt) and matched to monthly surveillance data of adult mosquitopopulation density.
Vector Density Data.We considered both the adult mosquito density (denotedas Va
t ) and the larval density (denoted as Vlt). Adult mosquitoes (A. albopictus)
were sampled by light traps. Larval density was measured by the Breteau in-dex, which is defined as the number of positive containers per 100 householdsinspected (1). Both adult density and larval density comprised the informationon mosquito density sampled in residential area households (>50 householdssampled per month), parks, construction sites, and other urban areas.
Climate Variables in the Models. We considered several different monthlytemperature and precipitation variables for model selection. The tempera-ture variables (degrees Celsius) included average temperature (denoted asTat−1), average of daily lowest temperature (denoted as Tl
t−1), and average ofdaily highest temperature (denoted as Th
t−1). Precipitation variables includedaccumulated precipitation (millimeters, denoted as Pt−1), and number of dayswith rainfall (days, denoted as Pd
t−1). We modeled the effects of climate vari-ables on dengue incidence with t = 1-mo time lag to be consistent with thesurvival time ofA. albopictus under field conditions: 50% of the population hasbeen found to survive ≥10 d, and 5% have been found to survive ≥40 d; thetime for A. albopictus transmission of dengue may be less than 40 d (34, 35).
Statistical Modeling.SEM: Rationale, model construction, and selection. SEM estimates the structuralcorrelation among the variables (36, 37). SEM was used to analyze thestructural linear correlation (as shown in Fig. 2) between temperature (av-erage maximum temperature), precipitation (number of days with rainfall),vector density (monthly averaged mosquitoes captured per trap per night),and dengue incidence (natural log transformed). The effects of temperatureand precipitation on dengue were divided into direct effects and effectsmediated by vector density. At the same time, the correlation between thevariables of temperature and precipitation was assessed in the model. Adummy variable YEAR2014 (year 2014 = 1, other years = 0) was added intothe SEM model as a control variable because the large outbreak of denguein year 2014 (38) otherwise hindered convergence.GAM of vector dynamics. The mgcv package (version 1.7-29) of R was used forGAM analyses (39). Because the different temperature and precipitationvariables were strongly correlated, we considered all combinations of the
alternative temperature, precipitation, and vector density variables (but nomore than one variable for each factor in the model). To account for densitydependence, we included ln(1 + density) in the previous month as a pre-dictor variable in the model. We also compared linear and nonlinear modelformulations, by letting the covariate effects in Eq. 1 to be either linear orsmooth (natural cubic splines with a maximum of 3 degrees of freedom). Asselection criterion, we used the generalized cross-validation criterion (GCV).A model with lower GCV has more predictive power and was hence selected(Table S1). To evaluate an additional conservative criterion, we used genuinecross-validation. Specifically, we removed one “test” year at a time, fittedthe model on the remaining dataset, made predictions for the test year,repeated this for all years, and calculated log-scale root-mean-squareprediction error [i.e., the square root of the sum of squared differencesln(observed density + 1) – ln(predicted density + 1)]. Deviance residuals from thefinal modes were checked for temporal autocorrelation using autocorrelationand partial autocorrelation functions.ZIGAM of Dengue dynamics. Histograms of dengue incidence clearly showedzero inflation problems (Fig. S1). The COZIGAM package (version 2.0-4) of Rwas used for Constrained and Unconstrained Zero-Inflated GAMs (14). Theconstrained (CoZIGAM) and the unconstrained (UnZIGAM) models differ inthat CoZIGAM constrains the fitted values of the binomial part of the modelto be proportional to the fitted values of the lognormal part (on the linearscales of the predictors). As model selection criterion, we used an approxi-mation of the log of the marginal likelihood (logE), which is related to theBayesian Information Criterion. Models with higher logE are preferred. Asresponse variable, only the incidence of locally infected dengue cases wasconsidered. For the autoregressive term, ln(1 + incidence) in the previousmonth, both local and imported dengue cases were considered.
The maximum degree of freedom for the smooth terms was set to 3 in themodel selection. By inspecting the model providing the highest logE for thefirst 8 y (Table S2), we found that the effect of average maximum temper-ature was not biologically interpretable (Fig. S2). Most likely, this result re-flects overfitting, and hence we modified the model by reducing themaximum degree of freedom for this term to 2. This rendered an inter-pretable temperature effect (Fig. 3). The logE of this model (−60.515)remained a better fit than those of other candidate models from Table S2.Hence, this model was used for predictions.Predictions of Dengue incidence for 2013–2015. The selected vector and denguemodels based on data from 2005 to 2012 were used to calculate 1-mo-aheadpredictions for 2013–2015. Predictions of mosquito density and dengue in-cidence for month t were calculated based on observed temperature,
Fig. 5. Analysis of potentially nonlinear influences on dengue incidence in Guangzhou based on data from all years 2005−2015. To account for zero in-flation, (A−D) a separate binomial submodel quantifies predictor effects on outbreak risk (logit scale probability of incidence > 0) and (E−H) a lognormalsubmodel quantifies predictor effects on outbreak intensity when an outbreak occurs [ln(incidence)].
Xu et al. PNAS | January 3, 2017 | vol. 114 | no. 1 | 117
ECOLO
GY
Dow
nloa
ded
by g
uest
on
Mar
ch 1
5, 2
020
precipitation, dengue incidence, and mosquito density in month t − 1. Thepredicted mosquito density for month t was used as input in the predictionof dengue for month t.Uncertainty estimation. Prediction bands were calculated using bootstrap, asfollows: For vector dynamics, we used a wild bootstrap approach (40). Theresiduals from the model for the reduced dataset (2005−2012) were firstrescaled to have the same variance as estimated by the model. We did thisby multiplying the residuals with the square root of the scale factor esti-mated from the model, divided by the standard deviation of the residuals.Ten thousand bootstrap datasets of the same size as the original reduceddataset were generated by adding to the fitted values their corresponding(rescaled) residuals, with the sign of the residuals randomly flipped. Specif-ically, each residual was multiplied by a random variable that equaled 1 or−1 with equal probability, before being added back to the fitted values. Abootstrap distribution for vector density predictions was generated byrefitting the vector model on each bootstrap dataset and using theserefitted models to make predictions for the whole period (2005−2015).
For dengue dynamics, we generated 10,000 bootstrap datasets in a two-step approach. In the first step, we sampled with replacement the rescaledresiduals from the lognormal part of the ZIGAM and added them back to thefitted values. In the second step, each data point wasmultiplied by 0 or 1, withprobability p being the fitted value from the binomial part of the ZIGAM.We then refitted the ZIGAM with the bootstrap data. Finally, we used theserefitted ZIGAMs and the bootstrap time series of mosquito density to gen-erate a bootstrap distribution of dengue incidence for the whole period.
The 0.025 [0.05] and 0.975 [0.95] quantiles from this distribution delineatethe 95% [90%] prediction limits.
ACKNOWLEDGMENTS. We thank Sari C. Cunningham for improving theEnglish of this manuscript. This research was supported by the NationalBasic Research Program of China (973 Program) (Grant 2012CB955504), theNational Natural Science Foundation of China (Grant 81273139), State KeyLaboratory for Infectious Disease Prevention and Control IndependentFund (Grant 2014SKLID106), and the Centre for Ecological and EvolutionarySynthesis of the University of Oslo.
1. World Health Organization (2009) Dengue Guidelines for Diagnosis, Treatment,Prevention and Control: New Edition (World Health Org, Geneva), pp 3–13.
2. Lin YP, et al. (2016) Clinical and epidemiological features of the 2014 large-scaledengue outbreak in Guangzhou city, China. BMC Infect Dis 16(1):102.
3. Bhatt S, et al. (2013) The global distribution and burden of dengue. Nature 496(7446):504–507.
4. Lai S, et al. (2015) The changing epidemiology of dengue in China, 1990−2014: Adescriptive analysis of 25 years of nationwide surveillance data. BMC Med 13(1):100.
5. Normile D (2013) Tropical medicine. Surprising new dengue virus throws a spanner indisease control efforts. Science 342(6157):415.
6. Rezza G (2012) Aedes albopictus and the reemergence of Dengue. BMC Public Health12(1):72.
7. Yang HM, Macoris MLG, Galvani KC, Andrighetti MTM, Wanderley DMV (2009) As-sessing the effects of temperature on dengue transmission. Epidemiol Infect 137(8):1179–1187.
8. Naish S, et al. (2014) Climate change and dengue: A critical and systematic review ofquantitative modelling approaches. BMC Infect Dis 14(1):167.
9. Wu JY, Lun ZR, James AA, Chen XG (2010) Dengue fever in mainland China. Am J TropMed Hyg 83(3):664–671.
10. Zhang H, et al. (2014) Spatiotemporal characterizations of dengue virus in mainlandChina: Insights into the whole genome from 1978 to 2011. PLoS One 9(2):e87630.
11. Sang S, et al. (2014) Predicting local dengue transmission in Guangzhou, China,through the influence of imported cases, mosquito density and climate variability.PLoS One 9(7):e102755.
12. Xu L, et al. (2015) The trophic responses of two different rodent-vector-plague sys-tems to climate change. Proc R Soc B 282(1800):20141846.
13. Hastie T, Tibshirani R (1990) Generalized Additive Models (Chapman and Hall,London), 1st Ed.
14. Liu H, Chan K-S (2010) Introducing COZIGAM: An R package for unconstrained andconstrained zero-inflated generalized additive model analysis. J Stat Softw 35(11):26.
15. Wang X, Tang S, Cheke RA (2016) A stage structured mosquito model incorporatingeffects of precipitation and daily temperature fluctuations. J Theor Biol 411:27–36.
16. Wu PC, Guo HR, Lung SC, Lin CY, Su HJ (2007) Weather as an effective predictor foroccurrence of dengue fever in Taiwan. Acta Trop 103(1):50–57.
17. Wu PC, Su HJ, Guo HR, Lung SC, Lin CY (2005) Temperature can be an effectivepredictor for dengue fever outbreak. Epidemiology 16(5):S72.
18. Patz JA, Epstein PR, Burke TA, Balbus JM (1996) Global climate change and emerginginfectious diseases. JAMA 275(3):217–223.
19. Xiao FZ, et al. (2014) The effect of temperature on the extrinsic incubation period andinfection rate of dengue virus serotype 2 infection in Aedes albopictus. Arch Virol159(11):3053–3057.
20. Gage KL, Burkot TR, Eisen RJ, Hayes EB (2008) Climate and vectorborne diseases. Am JPrev Med 35(5):436–450.
21. Tian H, et al. (2016) Surface water areas significantly impacted 2014 dengue out-breaks in Guangzhou, China. Environ Res 150:299–305.
22. Morin CW, Comrie AC, Ernst K (2013) Climate and dengue transmission: Evidence andimplications. Environ Health Perspect 121(11-12):1264–1272.
23. Tapia-Conyer R, Betancourt-Cravioto M, Méndez-Galván J (2012) Dengue: An esca-lating public health problem in Latin America. Paediatr Int Child Health 32(Suppl 1):14–17.
24. Hoffmann AA, et al. (2011) Successful establishment of Wolbachia in Aedes populationsto suppress dengue transmission. Nature 476(7361):454–457.
25. Maciel-de-Freitas R, Valle D (2014) Challenges encountered using standard vectorcontrol measures for dengue in Boa Vista, Brazil. Bull World Health Organ 92(9):685–689.
26. Hugo LE, et al. (2014) Adult survivorship of the dengue mosquito Aedes aegypti variesseasonally in central Vietnam. PloS Negl Trop Dis 8(2):e2669.
27. Otero M, Solari HG (2010) Stochastic eco-epidemiological model of dengue diseasetransmission by Aedes aegypti mosquito. Math Biosci 223(1):32–46.
28. Murray NEA, QuamMB, Wilder-Smith A (2013) Epidemiology of dengue: Past, presentand future prospects. Clin Epidemiol 5(1):299–309.
29. Gubler D (2012) Dengue, urbanization and globalization: The unholy trinity of the21st century. Int J Infect Dis 16:E2.
30. Ooi EE, Gubler DJ (2009) Dengue in Southeast Asia: Epidemiological characteristicsand strategic challenges in disease prevention. Cad Saude Publica 25(Suppl 1):S115–S124.
31. Reiter P (2001) Climate change and mosquito-borne disease. Environ Health Perspect109(Suppl 1):141–161.
32. Cazelles B, Chavez M, McMichael AJ, Hales S (2005) Nonstationary influence of El Niñoon the synchronous dengue epidemics in Thailand. PLoS Med 2(4):e106.
33. Sun J, et al. (2011) Dengue virus serotype 3 subtype III, Zhejiang Province, China.Emerg Infect Dis 17(2):321–323.
34. Brady OJ, et al. (2013) Modelling adult Aedes aegypti and Aedes albopictus survival atdifferent temperatures in laboratory and field settings. Parasites Vectors 6(1):351.
35. Costanzo KS, Schelble S, Jerz K, Keenan M (2015) The effect of photoperiod on lifehistory and blood-feeding activity in Aedes albopictus and Aedes aegypti (Diptera:Culicidae). J Vector Ecol 40(1):164–171.
36. Bentler PM (1990) Comparative fit indexes in structural models. Psychol Bull 107(2):238–246.
37. Steiger JH (1990) Structural model evaluation and modification: An interval estima-tion approach. Multivariate Behav Res 25(2):173–180.
38. Maassen GH, Bakker AB (2001) Suppressor variables in path models—Definitions andinterpretations. Sociol Methods Res 30(2):241–270.
39. R Core Team (2014) R: A Language and Environment for Statistical Computing(R Found Stat Comput, Vienna).
40. Mammen E (1993) Bootstrap and wild bootstrap for high-dimensional linear-models.Ann Stat 21(1):255–285.
118 | www.pnas.org/cgi/doi/10.1073/pnas.1618558114 Xu et al.
Dow
nloa
ded
by g
uest
on
Mar
ch 1
5, 2
020