climate vulnerability monitor 2010: the state of the climate crisis
TRANSCRIPT
8/8/2019 Climate Vulnerability Monitor 2010: The State of the Climate Crisis
http://slidepdf.com/reader/full/climate-vulnerability-monitor-2010-the-state-of-the-climate-crisis 1/291
8/8/2019 Climate Vulnerability Monitor 2010: The State of the Climate Crisis
http://slidepdf.com/reader/full/climate-vulnerability-monitor-2010-the-state-of-the-climate-crisis 2/291
8/8/2019 Climate Vulnerability Monitor 2010: The State of the Climate Crisis
http://slidepdf.com/reader/full/climate-vulnerability-monitor-2010-the-state-of-the-climate-crisis 3/291
CLIMATE
VULNERABILITYMONITOR
8/8/2019 Climate Vulnerability Monitor 2010: The State of the Climate Crisis
http://slidepdf.com/reader/full/climate-vulnerability-monitor-2010-the-state-of-the-climate-crisis 4/291
Mary Chinery-HesseChief Advisor to the Former President
of GhanaMember of the Panel of the Wise
of the African Union (incoming)
Helen ClarkAdministrator of the UN Development
Programme (UNDP)
Jan EliassonFormer President of the
UN General Assembly
Former Foreign Minister of Sweden
José María FigueresFormer President of Costa Rica
Chairman of the Carbon War Room
Saleemul HuqSenior Fellow at the International Institute
for Environment and Development (IIED)
Yolanda KakabadseInternational President of the
World Wide Fund for Nature (WWF)
Ashok KhoslaPresident of the International Union
for Conservation of Nature (IUCN)
Chairman of Development Alternatives
Co-Chair, UN Resources Panel
Ricardo LagosFormer President of Chile
Former President of the Club of Madrid
Loren LegardaSenator of the Philippines
UN International Strategy for Disaster
Reduction (ISDR) Regional Champion for
Disaster Risk Reduction and Climate Change
Adaptation for Asia and the Pacific
Ahmed Naseem
Minister of State for Foreign Affairsof the Maldives
Rajendra PachauriChairman of the Intergovernmental
Panel on Climate Change (IPCC)
Director General of The Energy
Resources Institute (TERI)
Teresa RiberaSecretary of State for Climate
Change of Spain
Johan RockströmExecutive Director of the Stockholm
Environment Institute (SEI) and Stockholm
Resilience Centre
Hans Joachim SchellnhuberFounding Director of the Potsdam Institute
for Climate Impact Research (PIK)
Klaus TöpferFormer Executive Director of the
UN Environment Programme (UNEP)
Margareta WahlströmUN Assistant Secretary-General
for Disaster Risk Reduction
Michael Zammit CutajarFormer Executive Secretary of the UN
Framework Convention on Climate Change
(UNFCCC)
ADVISORY PANEL
THE CLIMATE VULNERABLE FORUMis a global partnership of leaders of countries most
vulnerable to climate change actively seeking a firm
and urgent resolution to the growing climate crisis.The Climate Vulnerable Forum was founded by
President Mohamed Nasheed of the Maldives andfirst met in November 2009. The Declaration of the
Climate Vulnerable Forum adopted then expressed
alarm at the rate of changes and danger witnessedaround the planet due to the effects of human-
induced global warming and called for urgent mostinternational cooperation to tackle the challenge.
DARAis an international organization based in Madrid,Spain, committed to improving the quality and
effectiveness of aid for vulnerable populationssuffering from conflict, disasters and climate
change. Since its foundation in 2003 by SilviaHidalgo, DARA has conducted independent
evaluations of major development and
humanitarian assistance initiatives in over 40countries across five continents, and developed
innovative tools to promote the effectiveness ofaid and good humanitarian donorship.
8/8/2019 Climate Vulnerability Monitor 2010: The State of the Climate Crisis
http://slidepdf.com/reader/full/climate-vulnerability-monitor-2010-the-state-of-the-climate-crisis 5/291
The Advisory Panel and Peer Review Committee members serve in their personal capacity providing input to the Climate Vulnerability
Initiative that informs the development of the Climate Vulnerability Monitor. DARA is solely responsible for the final content of this report.
Yasemin AysanUnder Secretary General of International
Federation of Red Cross and Red CrescentSocieties (IFRC)
Suruchi BhadwalAssociate Director of the Earth Sciences
and Climate Change Division of The Energy
and Resources Institute (TERI)
Manuel CarballoExecutive Director of the International
Committee for Migration and Health (ICMH)
Diarmid Campbell-LendrumSenior Scientist on Public Health
and Environment of the World Health
Organisation (WHO)
Ian ChristoplosSenior Project Researcher of the Danish
Institute for International Studies (DIIS)
Pierre EncontreChief of Special Programmes of the Division
for Africa, Least Developed Countries and
Special Programmes of the UN Conference
on Trade and Development (UNCTAD)
Anne HammillSenior Researcher on Climate Change
and Energy of the International Institute
for Sustainable Development (IISD)
Juergen KroppHead of the North-South Research
Group of the Potsdam Institutefor Climate Impact Research
Marc LevyDeputy Director of the Centre
for International Earth Science
Information Network of the Earth
Institute at Columbia University
Bo LimSpecial Climate Change Advisor of
UN Development Programme (UNDP)
Urs LuterbacherChairman of the Environmental Studies
Unit of the Graduate Institute of
International and Development Studies
Pascal PeduzziHead of the Early Warning Unit of the
Global Resource Information Database
(GRID – Europe) of the UN Environment
Programme (UNEP)
Hansjoerg StrohmeyerChief of the Policy Development and Studies
Branch of the UN Of fice for the Coordination
of Humanitarian Affairs (OCHA)
Farhana YaminPortfolio Manager of the Climate Change
Division of the Children’s Investment
Fund Foundation (CIFF)
PEER REVIEW COMMITTEE
Steering Group Co - Chairs
Ross MountainDirector General of DARA
Marc LimonCounsellor of the Maldives Mission
to the UN and other international
organizations in Geneva
DARA
Matthew McKinnon (Coordinating Editor)
Lucía Fernández SuárezGeeta Uhl
Commons Consultants
Søren Peter Andreasen (Production Editor)
Jakob Mathias WichmannAnne-Mette SteinmeierPeter Utzon BergAndreas Hastrup Clemmensen
EDITORIAL TEAM
8/8/2019 Climate Vulnerability Monitor 2010: The State of the Climate Crisis
http://slidepdf.com/reader/full/climate-vulnerability-monitor-2010-the-state-of-the-climate-crisis 6/291
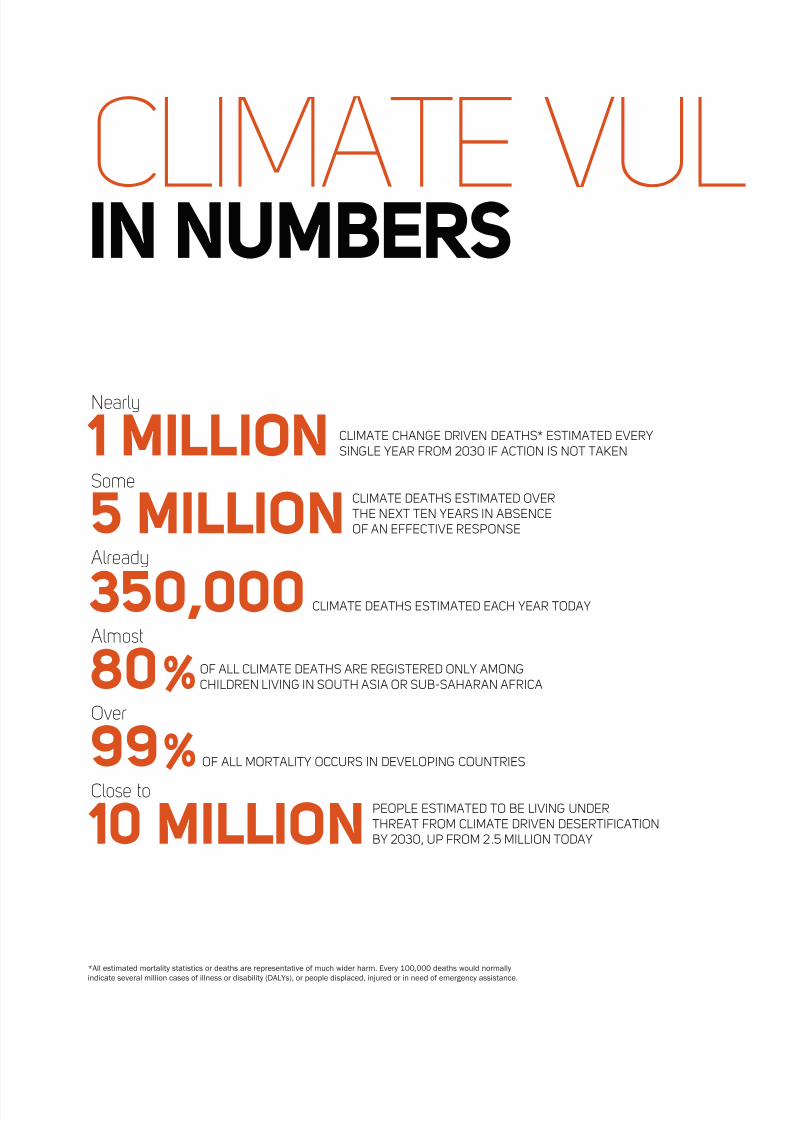
CLIMATE VULIN NUMBERS
1 MILLIONNearly
CLIMATE CHANGE DRIVEN DEATHS* ESTIMATED EVERYSINGLE YEAR FROM 2030 IF ACTION IS NOT TAKEN
5 MILLION
SomeCLIMATE DEATHS ESTIMATED OVERTHE NEXT TEN YEARS IN ABSENCE
OF AN EFFECTIVE RESPONSE
350,000Already
CLIMATE DEATHS ESTIMATED EACH YEAR TODAY
80% Almost
OF ALL CLIMATE DEATHS ARE REGISTERED ONLY AMONGCHILDREN LIVING IN SOUTH ASIA OR SUB-SAHARAN AFRICA
99% Over
OF ALL MORTALITY OCCURS IN DEVELOPING COUNTRIES
10 MILLIONClose to
PEOPLE ESTIMATED TO BE LIVING UNDERTHREAT FROM CLIMATE DRIVEN DESERTIFICATIONBY 2030, UP FROM 2.5 MILLION TODAY
*All estimated mortality statistics or deaths are representative of much wider harm. Every 100,000 deaths would normally
indicate several million cases of illness or disability (DALYs), or people displaced, injured or in need of emergency assistance.
8/8/2019 Climate Vulnerability Monitor 2010: The State of the Climate Crisis
http://slidepdf.com/reader/full/climate-vulnerability-monitor-2010-the-state-of-the-climate-crisis 7/291
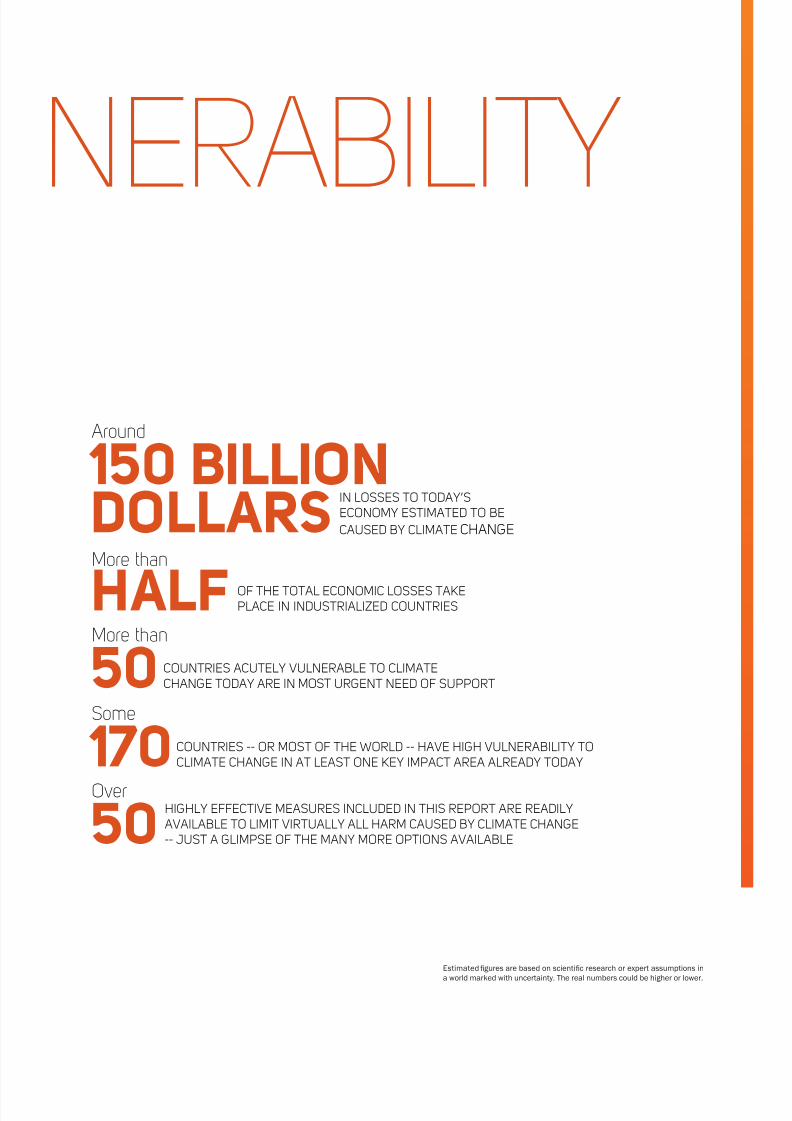
50More than
COUNTRIES ACUTELY VULNERABLE TO CLIMATECHANGE TODAY ARE IN MOST URGENT NEED OF SUPPORT
150 BILLION
DOLLARS
Around
IN LOSSES TO TODAY’SECONOMY ESTIMATED TO BE
CAUSED BY CLIMATE CHANGE
170Some
COUNTRIES -- OR MOST OF THE WORLD -- HAVE HIGH VULNERABILITY TOCLIMATE CHANGE IN AT LEAST ONE KEY IMPACT AREA ALREADY TODAY
HALFMore than
OF THE TOTAL ECONOMIC LOSSES TAKEPLACE IN INDUSTRIALIZED COUNTRIES
50Over
HIGHLY EFFECTIVE MEASURES INCLUDED IN THIS REPORT ARE READILYAVAILABLE TO LIMIT VIRTUALLY ALL HARM CAUSED BY CLIMATE CHANGE-- JUST A GLIMPSE OF THE MANY MORE OPTIONS AVAILABLE
Estimated figures are based on scientific research or expert assumptions in
a world marked with uncertainty. The real numbers could be higher or lower.
NERABILITY
8/8/2019 Climate Vulnerability Monitor 2010: The State of the Climate Crisis
http://slidepdf.com/reader/full/climate-vulnerability-monitor-2010-the-state-of-the-climate-crisis 8/291
PREFACE
Climate change is the most urgent
challenge of our time. The future of the
environment and the life it supports
rests on the decisions we take over
the coming years. This represents an
enormous responsibility on our shoulders,
which is not only a burden -- but also a
tremendous opportunity for us all.
Previous generations were not aware of
the environmental impact of economic
development and the resource constraints
of our planet. We are. They did not have
the technology and the know-how to
pursue a different path to prosperity. We
do. Our generation must seize this unique
moment to build a better, more equitable
and more sustainable world. If not, our
generation will carry a conscience that will
never be clear, from failing to act when we
had the chance.
The Climate Vulnerability Monitor lays
bare the sheer scale and breadth of
the impacts we already face. It breaks
ground in pinpointing our vulnerabilities
to climate change all around the world.
It shows how each country is vulnerable
in different ways -- some due to health
reasons or extreme weather patterns,
and others as a result of economic
factors or because of land loss from
expanding deserts or rising sea- levels.
It explains why many nations at theclimate frontline feel the impacts of
climate change more intensely. And it
demonstrates how quickly vulnerability
is accelerating almost everywhere, so
that ultimately climate change could
threaten the livelihoods, if not the
survival, of all nations and peoples. The
fate of the world is tied to the fate of the
most vulnerable.
Yet such an outcome is not inevitable.
The Monitor sends a strong signal of
caution. But it sends an equally strong
signal of hope.
This report identifies just how inexpensive
it is to limit the majority of the negative
impacts of climate change seen today,
from the effects of the most violent
storms and floods, to epidemics, severe
drought, desertification, and even
rising seas. There are even existing
programmes like those addressing
the main health issues linked to these
causes which can be readily expanded.
Countless other signs of hope exist.
Countries around the world are beginning to understand that expanding modes
of production established in nineteenth
century Europe will incur enormous
social and economic costs. Shifting
to a low-carbon economy, based on
green technology and renewable
energy, creates wealth, jobs and new
opportunities for progress. Many
countries of the Climate Vulnerable
Forum, despite having contributed little
to the climate change problem, are taking
the lead in creating this new future. TheMaldives, for example, is working to
become carbon neutral by 2020. Others
among us are pursuing similar pledges.
The Monitor was built to better identify
the needs of communities facing serious
climate impacts and to establish a
firmer understanding of the nature
of the climate crisis as it affects the
world’s nations today and in the near
future. The impact of climate change
is already a major global concern,
increasingly relevant across areas such
as business and trade, civil safety,
nature conservation, human rights, andsustainable development.
The Monitor is not perfect. Some of
the forecasts and conclusions will
THE CLIMATEVULNERABILITYMONITOR LAYS
BARE THE SHEERSCALE AND BREADTHOF THE IMPACTSWE ALREADY FACE
THE MONITOR SENDSA STRONG SIGNAL OFCAUTION. BUT IT SENDSAN EQUALLY STRONGSIGNAL OF HOPE
6 | Climate Vulnerability Monitor
8/8/2019 Climate Vulnerability Monitor 2010: The State of the Climate Crisis
http://slidepdf.com/reader/full/climate-vulnerability-monitor-2010-the-state-of-the-climate-crisis 9/291
draw criticism for either overplaying
or underplaying the seriousness of
the problem. This we welcome and
encourage. The report’s methodology
is new. The data worked with is not
always ideal. And all predictions are
marked by uncertainty and contain a
margin of error. But without a report of
this kind, the gaps in our understanding
might never be filled. It is our hope
that future Monitors will benefi t from
better data and knowledge. We hope
the report will trigger more debate and
focus more attention on improving ourunderstanding of climate change.
But limitations aside, the types of
impacts we will face in agriculture, in
health, on the shores of the world’s
oceans and otherwise are unlikely to
fundamentally change. Nor will better
knowledge radically alter the truth of
underlying vulnerabilities, like poverty
or gender inequality, which amplify
the impacts of climate change and
are present in all societies to varying
degrees. Some progress is being madein the global fight against poverty, but the
momentum in addressing climate change
is only beginning to pick up pace. The
negative effects outlined here would just
be the beginning if we fail to act.
And let us be frank: time is running
out. A near doubling in warming is
unavoidable in the next 20 years or so
as the lag in the planet’s greenhouse
effect catches up with us. We must
meet this growing challenge. If not, the
Monitor estimates that by 2030, over
130 countries will be highly vulnerable to
climate change; while over 50 countries
will suffer the kinds of acute impacts
that just a handful of particularly fragile
states are experiencing today. According
to the scientific consensus, we must
also begin reversing our patterns of
emissions within the next five years to
avoid even greater temperature change
and greater harm.
As with every study of this kind, the
Monitor lacks complete certainty, but
highlights enough threats of serious, or
even irreversible, harm that inaction is
unconscionable. This report should act
as a wake-up call to decision makers and
to people everywhere that more, much
more, has to be done, and quickly.
There is still time to act and it is well
within our power to solve the climate
crisis. A world free from pollution wouldbe healthier for everyone; renewable
technologies could bring energy to many
who have no access today; protecting
communities against climate impacts
will bolster the fight against poverty; and
everybody would enjoy a safer, more
prosperous world.
Is the world ready to act?
Those of us who believe in the potential
of climate change, both as a threat
and as a stimulus to kick-start a new
twenty-first century revolution -- this
time grounded in green growth and truly
sustainable development -- should not
despair. We must highlight the scale of
the problem, now and in the future, and
demonstrate the available options for
an alternative route. And we must argue
-- and win the debate -- that it is in all of
our interests to act now and act together.
Each of us has common but differentiated
responsibilities and abilities. But climate
change should not divide us. Quite the
opposite -- it must unite.The Climate Vulnerability Monitor is our
contribution to the global debate. We hope
that you will find it useful in your efforts.
IT IS WELL WITHINOUR POWER TO SOLVETHE CLIMATE CRISIS
CLIMATE CHANGESHOULD NOT DIVIDE US.QUITE THE OPPOSITE --IT MUST UNITE
MOHAMED NASHEEDPresident of the MaldivesFounding Chair,Climate Vulnerable Forum
JOSÉ MARÍA FIGUERESTrustee, DARAFormer President ofCosta Rica (1994-1998)
Climate Vulnerability Monitor | 7
8/8/2019 Climate Vulnerability Monitor 2010: The State of the Climate Crisis
http://slidepdf.com/reader/full/climate-vulnerability-monitor-2010-the-state-of-the-climate-crisis 10/291
“Article 3. Principles. 3.The Parties should takeprecautionary measures toanticipate, prevent or minimize
the causes of climate changeand mitigate its adverse effects.Where there are threats of serious or irreversible damage,lack of full scientific certaintyshould not be used as a reason
for postponing such measures,taking into account that policiesand measures to deal with climatechange should be cost-effectiveso as to ensure global benefits
at the lowest possible cost.” – United Nations FrameworkConvention on Climate Change(UNFCCC), Rio de Janeiro,Brazil, 1992
8/8/2019 Climate Vulnerability Monitor 2010: The State of the Climate Crisis
http://slidepdf.com/reader/full/climate-vulnerability-monitor-2010-the-state-of-the-climate-crisis 11/291
“Humanitarian action should be guided by the humanitarianprinciples of humanity, meaningthe centrality of saving human
lives and alleviating sufferingwherever it is found...” –Principles and Good Practiceof Humanitarian Donorship,Stockholm, Sweden, 2003
“The fate of the most vulnerablewill be the fate of the world.” – First Declaration of theClimate Vulnerable Forum,Male', Maldives, 2009
8/8/2019 Climate Vulnerability Monitor 2010: The State of the Climate Crisis
http://slidepdf.com/reader/full/climate-vulnerability-monitor-2010-the-state-of-the-climate-crisis 12/291
C
O N T E N
T S
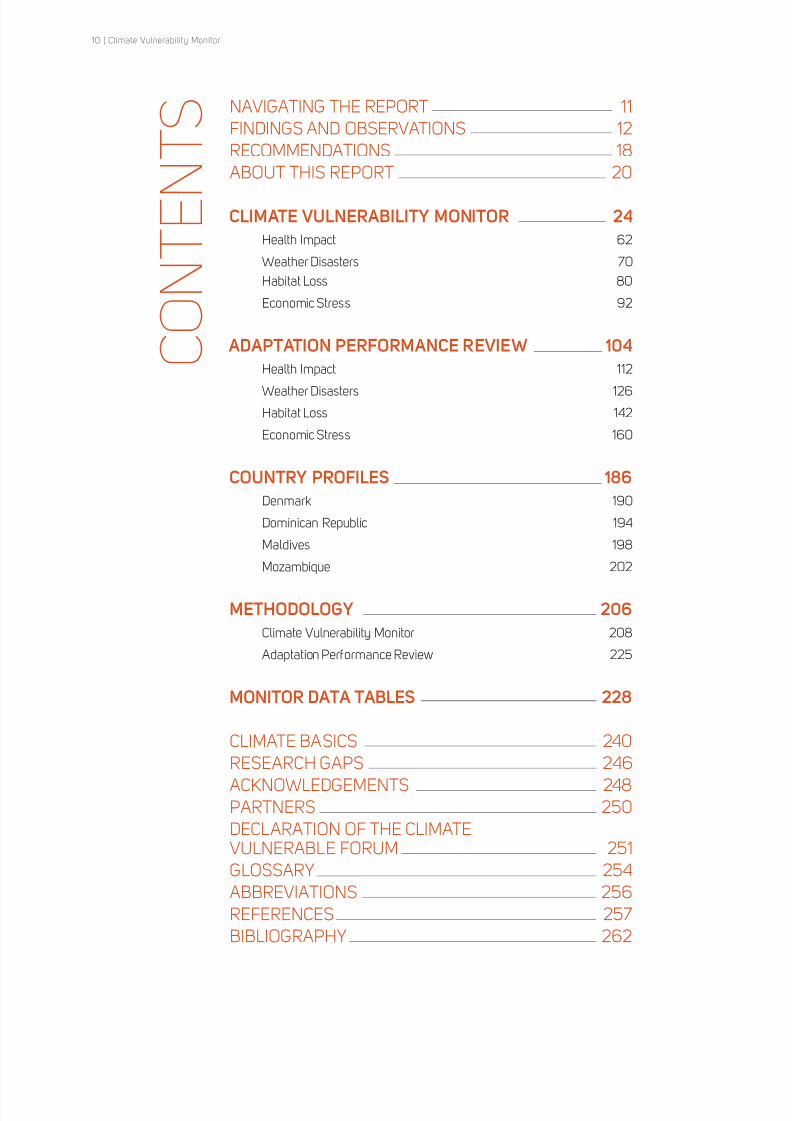
NAVIGATING THE REPORT 11FINDINGS AND OBSERVATIONS 12RECOMMENDATIONS 18
ABOUT THIS REPORT 20
CLIMATE VULNERABILITY MONITOR 24Health Impact 62
Weather Disasters 70
Habitat Loss 80
Economic Stress 92
ADAPTATION PERFORMANCE REVIEW 104 Health Impact 112
Weather Disasters 126
Habitat Loss 142
Economic Stress 160
COUNTRY PROFILES 186 Denmark 190
Dominican Republic 194
Maldives 198
Mozambique 202
METHODOLOGY 206 Climate Vulnerability Monitor 208
Adaptation Performance Review 225
MONITOR DATA TABLES 228
CLIMATE BASICS 240RESEARCH GAPS 246ACKNOWLEDGEMENTS 248PARTNERS 250DECLARATION OF THE CLIMATEVULNERABLE FORUM 251GLOSSARY 254
ABBREVIATIONS 256REFERENCES 257BIBLIOGRAPHY 262
10 | Climate Vulnerability Monitor
8/8/2019 Climate Vulnerability Monitor 2010: The State of the Climate Crisis
http://slidepdf.com/reader/full/climate-vulnerability-monitor-2010-the-state-of-the-climate-crisis 13/291
N
A V I G A T
I N G T
H E
R E P O
R T
FINDINGS AND OBSERVATIONSThe main observations made by the report.
RECOMMENDATIONSHeadline recommendations for tackling climate change
and its negative impact on the world’s communities.
ABOUT THIS REPORTAn introduction to the objectives and approach of the
Climate Vulnerability Monitor and how it was developed.
CLIMATE VULNERABILITY MONITORA global assessment of vulnerability to different aspects of
climate change including its Health Impact, Weather Disasters,
human Habitat Loss and Economic Stress on key industries
and natural resources. The Climate Vulnerability Monitor is
a new tool aimed at advancing understanding of the impact
climate change has on human society and actions needed to
address the harm this causes.
ADAPTATION PERFORMANCE REVIEWA catalogue of measures and programmes valuable for reducing
the negative effects of climate change in the areas of health,
extreme weather, degradation of human habitats and other
stresses to the economy and the environment.
COUNTRY PROFILESSnapshot studies of what the Climate Vulnerability Monitor
implies for different types of countries around the world.
METHODOLOGYA detailed explanation of the methodology developed for the
report and Climate Vulnerability Monitor, including all data,
key assumptions, models and calculations used.
MONITOR DATA TABLESBasic information from the Climate Vulnerability Monitor
in list format.
CLIMATE BASICSA brief introduction to the state of our climate and how
it is evolving as the world heats up.
RESEARCH GAPSKnowledge limitations that must be urgently addressed in order
to improve our understanding of climate change and its impact on
communities around the world. Filling these gaps will be vital for
effectively tackling the climate challenge.
Climate Vulnerability Monitor | 11
8/8/2019 Climate Vulnerability Monitor 2010: The State of the Climate Crisis
http://slidepdf.com/reader/full/climate-vulnerability-monitor-2010-the-state-of-the-climate-crisis 14/291
12 | Climate Vulnerability Monitor
FINDINGS AOBSERVATI
A HOTTER EARTH IS ALREADYCAUSING WIDESPREAD
DAMAGE AND DEATH.The artificial heating of our planet fuelled by human activities
already interferes with earth’s delicate climate leading to effects
that are dangerous for people and nature. The alarming rate of
change and spiralling effects of heat, wind, rain, deserts, sea-
levels, and other impacts on the world’s populations leave a human
toll of 350,000 deaths every single year. Stifling heat, winds, and
water shortages pressure the lands of some 2.5 million people in
arid regions degrading into desert. The effect of climate change on
storms, floods, and wildfires is estimated to leave an additional 5
billion dollars (USD) of damage each year, while rising seas cost 1%
of GDP to the lowest-income countries – 4% in the Pacific – with
annually 65 billion dollars wiped off the world economy. Globally,
the primary sectors and fisheries are already weighed down by a
further 65 billion dollars every year from climate stresses.
MOST IMPACTS ARE HIGHLYCONCENTRATED ESPECIALLYON CHILDREN AND THE POOR.Over three quarters of the death toll linked to climate change is
concentrated on children living in Sub-Saharan Africa or South Asia.
Gradual, not sudden, impacts from climate change cause more than
90% of all damage. The roughly 50 least developed countries suffer
more than one third of the global human toll linked to climate change,
and emerging economies nearly two thirds. Overall, the few additional
deaths in wealthy countries are likely offset by health gains due towarmer, shorter winters and other effects. Over 80% of people at risk
from climate-driven desertification reside in high-growth emerging
economies such as China and India. Half of the economic impacts
of climate change are felt in industrialized countries. However,
lower-income countries suffer much greater relative stresses to their
economies, mainly due to larger, less-robust agricultural sectors.
Some 50 countries are considered acutely vulnerable to climate
change today, collectively suffering most of all climate impacts.
Recognized fragile or failed states like Afghanistan, Haiti, Myanmar,
Sierra Leone, and Somalia are among the worst affected, as are
low-lying island nations facing existential threats. An average of just 24 countries are assessed as having the most severe factor of
vulnerability for each main impact area of health, extreme weather,
habitat loss, and economic stress. In every case, some two thirds of
the total global impact falls on just 10 countries.
8/8/2019 Climate Vulnerability Monitor 2010: The State of the Climate Crisis
http://slidepdf.com/reader/full/climate-vulnerability-monitor-2010-the-state-of-the-climate-crisis 15/291
Climate Vulnerability Monitor | 13
MUCH DAMAGECAUSED BY
CLIMATECHANGE ISSTILL READILYPREVENTABLE.Half or more of today’s human toll linked to climate change
could be prevented with targeted distribution of salt-water
solutions or basic dietary or vitamin supplements costing
virtually nothing. A wide array of cost-effective actions can be
taken to reduce climate vulnerabilities for each of the Monitor’sfour impact areas. Measures that reduce the impacts of
climate change on health are the most effective, followed by
those that reduce exposure to extreme weather. Preventing
loss of human habitat to desertification, sea-level rise or loss
of biodiversity, such as alpine species or coral, are the most
challenging to address, but several relatively inexpensive and
proven measures nevertheless exist. Greater impacts are
inevitable however, and eventually damage may only be able
to be limited or selectively avoided. But the worst impacts of
climate change for which several measures would become
futile can still be avoided if strong action is taken in the very
near future to reduce greenhouse gas emissions that lead
to the earth's warming. Enough market-viable opportunitiesalso exist to substitute carbon-intensive means of production,
transportation, and energy creation or avoid deforestation
for an immediate and sustained transition to a low-carbon
economy, which would stem the root causes of climate change.
NDONS
8/8/2019 Climate Vulnerability Monitor 2010: The State of the Climate Crisis
http://slidepdf.com/reader/full/climate-vulnerability-monitor-2010-the-state-of-the-climate-crisis 16/291
14 | Climate Vulnerability Monitor
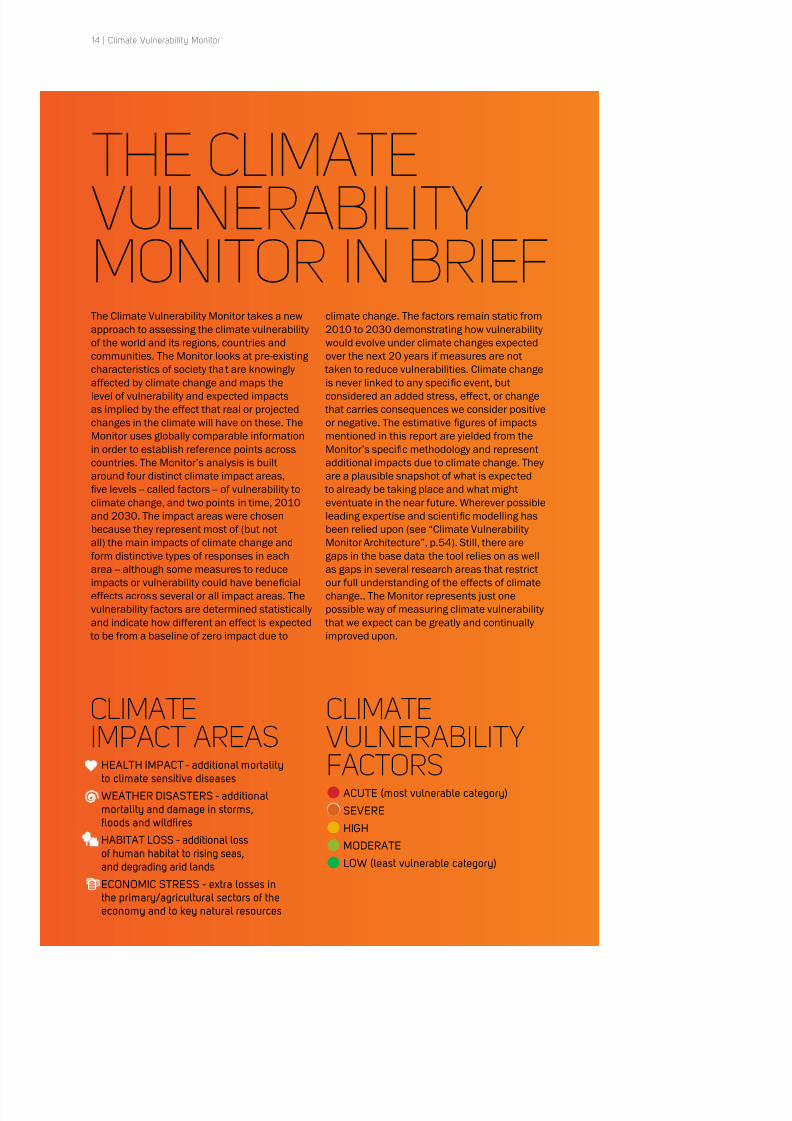
The Climate Vulnerability Monitor takes a new
approach to assessing the climate vulnerability
of the world and its regions, countries and
communities. The Monitor looks at pre-existing characteristics of society that are knowingly
affected by climate change and maps the
level of vulnerability and expected impacts
as implied by the effect that real or projected
changes in the climate will have on these. The
Monitor uses globally comparable information
in order to establish reference points across
countries. The Monitor’s analysis is built
around four distinct climate impact areas,
five levels -- called factors -- of vulnerability to
climate change, and two points in time, 2010
and 2030. The impact areas were chosen
because they represent most of (but notall) the main impacts of climate change and
form distinctive types of responses in each
area -- although some measures to reduce
impacts or vulnerability could have beneficial
effects across several or all impact areas. The
vulnerability factors are determined statistically
and indicate how different an effect is expected
to be from a baseline of zero impact due to
climate change. The factors remain static from
2010 to 2030 demonstrating how vulnerability
would evolve under climate changes expected
over the next 20 years if measures are not taken to reduce vulnerabilities. Climate change
is never linked to any specific event, but
considered an added stress, effect, or change
that carries consequences we consider positive
or negative. The estimative figures of impacts
mentioned in this report are yielded from the
Monitor’s specific methodology and represent
additional impacts due to climate change. They
are a plausible snapshot of what is expected
to already be taking place and what might
eventuate in the near future. Wherever possible
leading expertise and scientific modelling has
been relied upon (see “Climate VulnerabilityMonitor Architecture”, p.54). Still, there are
gaps in the base data the tool relies on as well
as gaps in several research areas that restrict
our full understanding of the effects of climate
change.. The Monitor represents just one
possible way of measuring climate vulnerability
that we expect can be greatly and continually
improved upon.
THE CLIMATEVULNERABILITYMONITOR IN BRIEF
CLIMATEIMPACT AREASHEALTH IMPACT - additional mortalityto climate sensitive diseases
WEATHER DISASTERS - additionalmortality and damage in storms,floods and wildfires
HABITAT LOSS - additional lossof human habitat to rising seas,and degrading arid lands
ECONOMIC STRESS - extra losses inthe primary/agricultural sectors of theeconomy and to key natural resources
CLIMATEVULNERABILITYFACTORS ACUTE (most vulnerable category)
SEVERE
HIGH
MODERATE
LOW (least vulnerable category)
8/8/2019 Climate Vulnerability Monitor 2010: The State of the Climate Crisis
http://slidepdf.com/reader/full/climate-vulnerability-monitor-2010-the-state-of-the-climate-crisis 17/291
Climate Vulnerability Monitor | 15
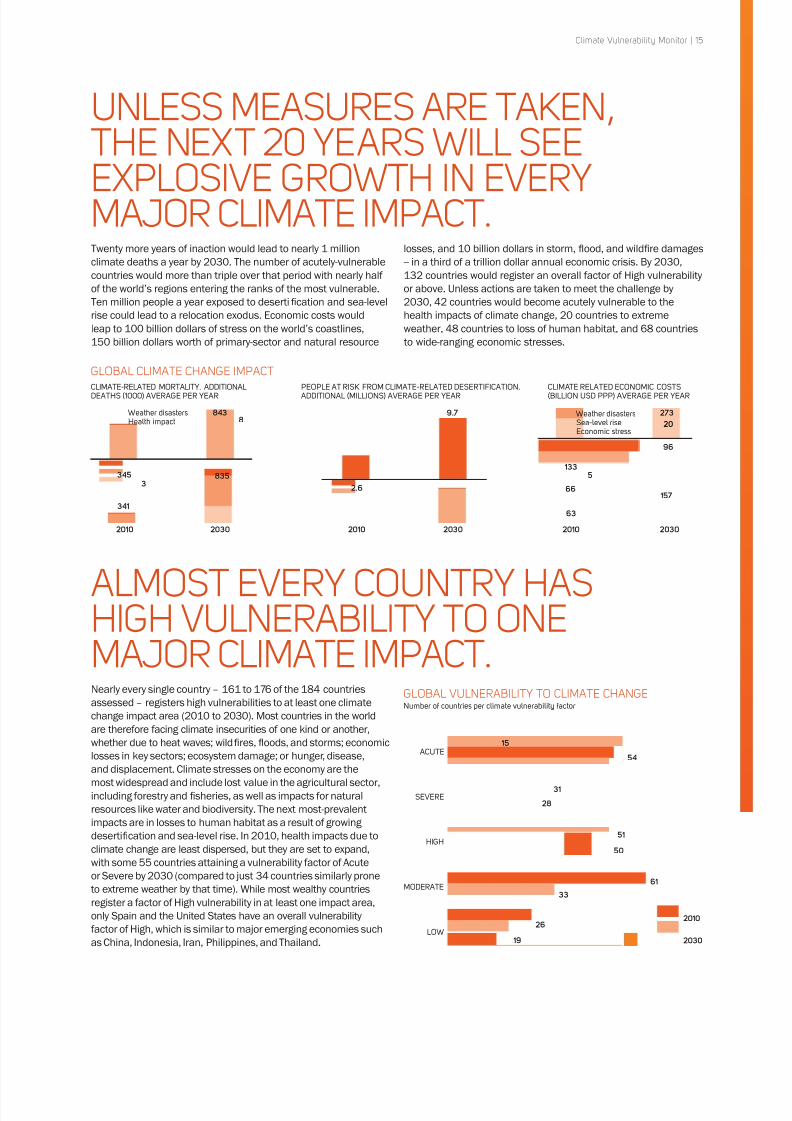
ALMOST EVERY COUNTRY HASHIGH VULNERABILITY TO ONEMAJOR CLIMATE IMPACT.Nearly every single country – 161 to 176 of the 184 countries
assessed – registers high vulnerabilities to at least one climate
change impact area (2010 to 2030). Most countries in the worldare therefore facing climate insecurities of one kind or another,
whether due to heat waves; wildfires, floods, and storms; economic
losses in key sectors; ecosystem damage; or hunger, disease,
and displacement. Climate stresses on the economy are the
most widespread and include lost value in the agricultural sector,
including forestry and fisheries, as well as impacts for natural
resources like water and biodiversity. The next most-prevalent
impacts are in losses to human habitat as a result of growing
desertification and sea-level rise. In 2010, health impacts due to
climate change are least dispersed, but they are set to expand,
with some 55 countries attaining a vulnerability factor of Acute
or Severe by 2030 (compared to just 34 countries similarly prone
to extreme weather by that time). While most wealthy countriesregister a factor of High vulnerability in at least one impact area,
only Spain and the United States have an overall vulnerability
factor of High, which is similar to major emerging economies such
as China, Indonesia, Iran, Philippines, and Thailand.
GLOBAL VULNERABILITY TO CLIMATE CHANGENumber of countries per climate vulnerability factor
ACUTE
SEVERE
HIGH
MODERATE
LOW
15
54
31
28
51
50
61
33
26
19
2010
2030
UNLESS MEASURES ARE TAKEN,THE NEXT 20 YEARS WILL SEE
EXPLOSIVE GROWTH IN EVERYMAJOR CLIMATE IMPACT.Twenty more years of inaction would lead to nearly 1 million
climate deaths a year by 2030. The number of acutely-vulnerable
countries would more than triple over that period with nearly half
of the world’s regions entering the ranks of the most vulnerable.
Ten million people a year exposed to desertification and sea-level
rise could lead to a relocation exodus. Economic costs would
leap to 100 billion dollars of stress on the world’s coastlines,
150 billion dollars worth of primary-sector and natural resource
losses, and 10 billion dollars in storm, flood, and wildfire damages
-- in a third of a trillion dollar annual economic crisis. By 2030,
132 countries would register an overall factor of High vulnerability
or above. Unless actions are taken to meet the challenge by
2030, 42 countries would become acutely vulnerable to the
health impacts of climate change, 20 countries to extreme
weather, 48 countries to loss of human habitat, and 68 countries
to wide-ranging economic stresses.
GLOBAL CLIMATE CHANGE IMPACT
Weather disastersHealth impact
Weather disastersSea-level riseEconomic stress
341
8353
8843
345
9.7
2.6
2010 2030
27320
96
157
5
66
63
133
2010 20302010 2030
CLIMATE-RELATED MORTALITY. ADDITIONALDEATHS (1000) AVERAGE PER YEAR
PEOPLE AT RISK FROM CLIMATE-RELATED DESERTIFICATION. ADDITIONAL (MILLIONS) AVERAGE PER YEAR
CLIMATE RELATED ECONOMIC COSTS(BILLION USD PPP) AVERAGE PER YEAR
8/8/2019 Climate Vulnerability Monitor 2010: The State of the Climate Crisis
http://slidepdf.com/reader/full/climate-vulnerability-monitor-2010-the-state-of-the-climate-crisis 18/291
16 | Climate Vulnerability Monitor
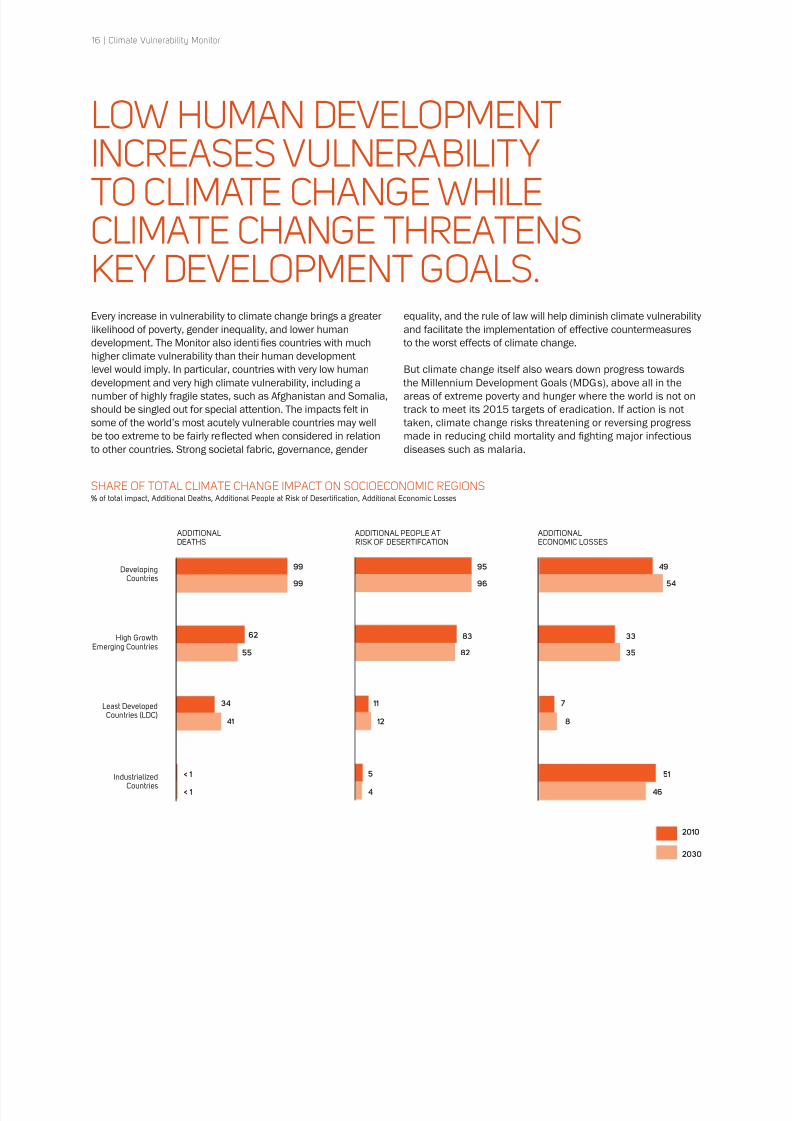
LOW HUMAN DEVELOPMENTINCREASES VULNERABILITYTO CLIMATE CHANGE WHILECLIMATE CHANGE THREATENSKEY DEVELOPMENT GOALS.Every increase in vulnerability to climate change brings a greater
likelihood of poverty, gender inequality, and lower human
development. The Monitor also identifies countries with much
higher climate vulnerability than their human developmentlevel would imply. In particular, countries with very low human
development and very high climate vulnerability, including a
number of highly fragile states, such as Afghanistan and Somalia,
should be singled out for special attention. The impacts felt in
some of the world’s most acutely vulnerable countries may well
be too extreme to be fairly reflected when considered in relation
to other countries. Strong societal fabric, governance, gender
equality, and the rule of law will help diminish climate vulnerability
and facilitate the implementation of effective countermeasures
to the worst effects of climate change.
But climate change itself also wears down progress towards
the Millennium Development Goals (MDGs), above all in the
areas of extreme poverty and hunger where the world is not on
track to meet its 2015 targets of eradication. If action is not
taken, climate change risks threatening or reversing progress
made in reducing child mortality and fighting major infectious
diseases such as malaria.
SHARE OF TOTAL CLIMATE CHANGE IMPACT ON SOCIOECONOMIC REGIONS% of total impact, Additional Deaths, Additional People at Risk of Desertification, Additional Economic Losses
ADDITIONALDEATHS
DevelopingCountries
High GrowthEmerging Countries
Least Developed
Countries (LDC)
IndustrializedCountries
ADDITIONALECONOMIC LOSSES
99 49
33
35
99 54
62
55
34 7
41 8
< 1 51
< 1
ADDITIONAL PEOPLE ATRISK OF DESERTIFCATION
95
83
82
96
11
12
5
4 46
2010
2030
8/8/2019 Climate Vulnerability Monitor 2010: The State of the Climate Crisis
http://slidepdf.com/reader/full/climate-vulnerability-monitor-2010-the-state-of-the-climate-crisis 19/291
Climate Vulnerability Monitor | 17
TACKLING CLIMATE CHANGE
IS A MAJOR OPPORTUNITY.Right now, the same steps that minimize vulnerability to climate
change collectively contribute to every major global target for
poverty eradication and to the improvement of living standards.
Effectively tackling climate impacts will be vital to bringing the
international community back on track to achieving the MDGs
in just five years’ time. But opportunities will fade as warming
increases. It will become more and more dif ficult to deal at a
local level with global forces such as warming and rising seas as
adaptation increasingly comes to involve choices about what to
preserve. And protecting communities and the environment will
be brought into ever-greater competition with narrow economic
interests as costs ultimately become prohibitive.
Tackling the root causes of climate change is also a major
opportunity. Adopting greener practices in a low-carbon
economy will bring major societal benefi ts. Fossil fuel
pollution itself is a leading risk factor for a significantly
greater human toll than the climate change it triggers
-- it was estimated to be the cause of close to 3 million
deaths worldwide in 2000.1 The exploitation of increasingly
scarce fossil fuels is also causing ongoing damage to the
environment, as was glaringly demonstrated by the 2010 Gulf
of Mexico oil spill disaster; and leading to human tragedies
such as coal mining accidents in places as diverse as China
or New Zealand. Decentralized forms of renewable energy are
much safer, cleaner, and hold significantly more promise for
the 20% of the world’s population who have no electricit y or
grid system to access traditional sources of energy producedby large-infrastructure power plants. A green technology
revolution could well hold the key to unlocking the global
inequities that continue to plague the world as a result of
unequal access to energy and other resources.
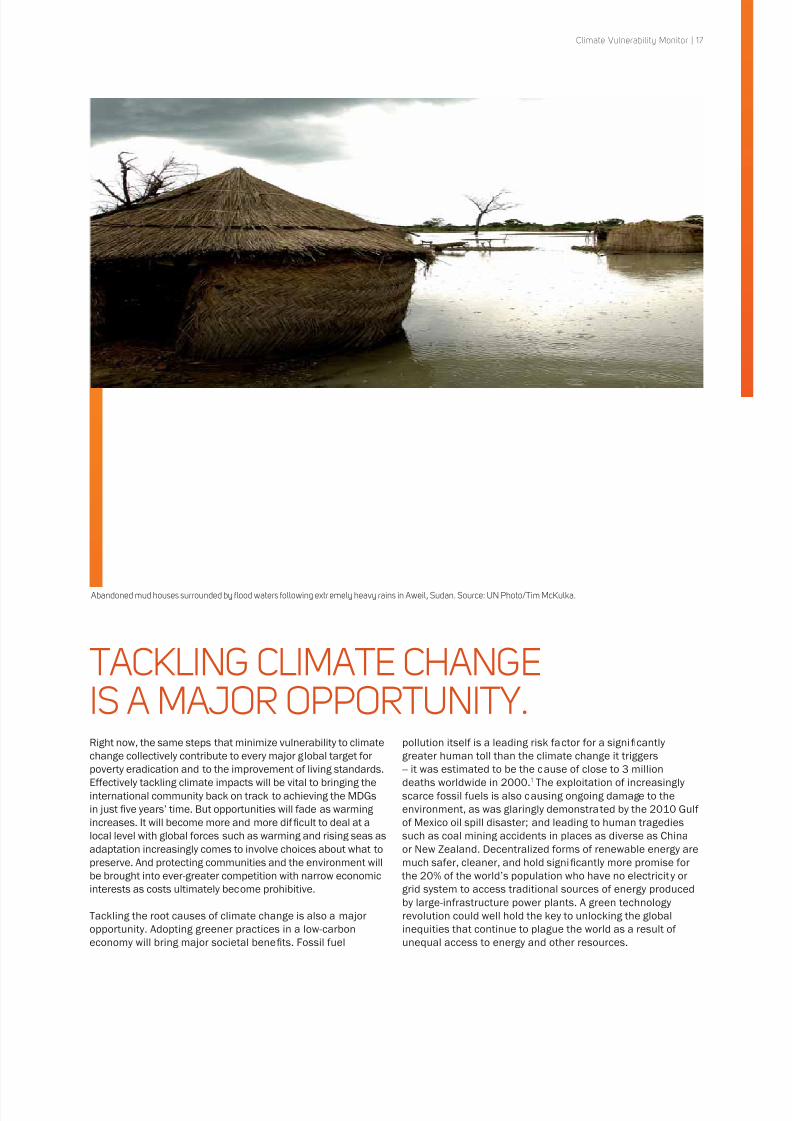
Abandoned mud houses surrounded by flood waters following extremely heavy rains in Aweil, Sudan. Source: UN Photo/Tim McKulka.
8/8/2019 Climate Vulnerability Monitor 2010: The State of the Climate Crisis
http://slidepdf.com/reader/full/climate-vulnerability-monitor-2010-the-state-of-the-climate-crisis 20/291
RECOMMEND
18 | Climate Vulnerability Monitor
While climate change is fact, the science
of its impacts is not yet exact. The full
extent of its effects on communities
remains uncertain. But we have enough
indications to suggest widespread harm
and danger is already being done all over
the world. And we can tackle that harm
with cost-effective measures readily at
hand for limiting impacts and reducing
greenhouse gas emissions that cause thewarming -- both of which must happen
in tandem. Major emitters must assume
responsibility for this crisis in accordance
with common but differentiated
responsibilities and respective
capabilities. Immediate action is needed
to prevent further warming of the planet
and any harm caused by warming we can
no longer stop. We are already committed
to levels of warming that could entail mass
extinctions of species, the disappearance
of the world’s coral reefs, and much
greater impacts on human society than
are outlined in this report.2 But the quickerwe act, the more we reinforce the ability of
vulnerable communities to withstand the
changes, the more we can limit additional
warming, and the more we can avoid the
most devastating of consequences for this
planet and the life it supports.
DANGER IS PRESENT.RESPONSES ARECOST-EFFECTIVE.
INACTION ISUNCONSCIONABLE.
Contrary to popular notions, the vast
majority of human deaths linked to climate
change are not caused by stronger storms
andfl
oods. Instead they are the resultof climate-sensitive disease. Climate
change is already causing an estimated
350,000 deaths -- and more than 10
million cases of illness every year -- mainly
due to malnutrition, diarrheal infections,
and malaria.3 Higher temperatures, water
shortages, and other impacts are weighing
down the fight against some of the world’s
most deadly diseases. Less than a quarter
of existing national adaptation programmes
of action (NAPAs) in most vulnerable
countries adequately address health
impacts due to climate change, including
just 3% of priority projects that targethealth.4 Yet exceptionally cost-effective and
established measures such as bed nets,
dietary supplements, and oral rehydration
therapies consisting of just water, salt, and
sugar are readily available to help avert any
additional deaths and reduce the extent
of major climate-sensitive illnesses in the
worst-affected areas.
IMMEDIATELYREINFORCERESPONSES TOMAJOR CLIMATE-
SENSITIVE HEALTHCONCERNS:MALNUTRITION,DIARRHEALINFECTIONS, AND MALARIA.
Climate change is already placing a
burden on poverty-reduction efforts
and is contributing to signifi
cant lostGDP potential in a number of worst-
affected countries. The countries most
vulnerable to climate change have the
highest levels of gender inequality and
the lowest levels of human development.
Reinforcing the drive for climate-friendly
development progress on all fronts is
a crucial complement to any response
aimed at reducing vulnerability to
climate change. In particular, many of
the countries most acutely vulnerable to
climate change are also fragile states,
on the limits of human development
and stable social and political order.Elsewhere, low-lying island nations are
facing imminent existential threats that
significantly undermine development.
In worst cases, vital efforts to manage
fast-depleting natural resources such
as water, or even the types of practical
measures featured in this report’s
Adaptation Performance Review and
in national plans (NAPAs), will face
serious implementation challenges
in countries with inadequate public
institutions, unstable socio-political
environments, or situations of armedconflict. Support to developing countries,
in particular including facilitated access
to green technologies, will be crucial for
supporting sustainable development.
EXPAND HUMAN AND GENDERDEVELOPMENTEFFORTS IN MOST- VULNERABLECOUNTRIES.
8/8/2019 Climate Vulnerability Monitor 2010: The State of the Climate Crisis
http://slidepdf.com/reader/full/climate-vulnerability-monitor-2010-the-state-of-the-climate-crisis 21/291
Climate Vulnerability Monitor | 19
ATIONSWarming of the planet beyond the 0.8
degrees Celsius (1.4 degrees Fahrenheit)
already seen since the industrial revolution
is set to double or even possibly triple over
the next decades.5 The humanitarian and
environmental effects of this rapid warming
should not be underestimated and will
require large-scale responses in order to
limit the harm done. Most countries highly
vulnerable to climate change also lack
resources and require external support to
combat the additional stress it places on
their communities, their economies, and
their ecosystems.Least developed countries have put
together initial programmes (NAPAs) to
respond to the local effects of climate
change that are to be externally financed,
but which still go largely unfunded
despite many of them now being several
years old. Non-negotiable resources
derived from major emitters should not
only be immediately released in order
to realize these plans in their entirety
-- and especially to implement priority
projects, which amount to less than 2
billion dollars (USD) globally.
6
The scaleof impacts captured in the Monitor would
imply that NAPAs are already inadequate
to deal with the negative effects of climate
change impacting vulnerable communities
around the world. So national plans must
be expanded in kind, in particular with
respect to human health, where hundreds
of thousands of lives are already being lost
with every single year of inaction.
But the rapid growth and widespread
prevalence of vulnerabilities around the
world imply that virtually all countries,
especially all developing countries, should
be preparing and implementing plans inorder to protect populations and resources.
Findings across the various impact area
assessments of the Monitor serve as bare-
minimum proxy indications for wider effects
that must be addressed if harm resulting
from climate change is to be prevented.
International adaptationfinance should be
stepped up without further delay to protect
communities at risk via a global funding
mechanism with legitimate and inclusive
decision-making processes.
REINFORCE NATIONALPLANS TO LIMITCLIMATE IMPACTS.
While we already have enough sound
research and analysis available to
point to serious dangers and harm
taking place around the world and to
take measures against those impacts.
A more accurate and comprehensive
understanding of the impact of climate
change on human society is impeded
by major gaps in research, science, and
socio-economic knowledge. This report
leaves out countries and known effectsof climate change due to the absence of
adequate data or research. Some key
areas of socio-economic impact have
clearly unsatisfactory or non-existent
scientific bases for their estimation. And
measures of the success of policies and
actions to limit the negative effects of
climate change are still inadequate. The
Climate Vulnerability Monitor was built
not only to improve responses to these
effects but also to reveal the limitations
on our knowledge and spur debate
aimed at a better understanding of the
impact of climate change. A detailed listof the main research gaps encountered
during the development of the Monitor is
found in this report. Urgent investment is
needed to close those gaps. And national
governments must also improve their
mapping of human vulnerability to ensure
that adaptation resources reach the most
vulnerable. If such gaps are not dealt
with, we risk seriously underestimating
or adding unnecessary ineffectiveness to
our response to this crisis when so much
is already at stake.
The lack of public support for ambitious
climate change policies continues to
be a major impediment to mobilizing
an effective response to this crisis.
Political leadership on the issue is
also weak, partially because of public
indifference. A successful international
agreement able to tackle the climate
problem relies on national decisions
based on the level of action (especially to reduce emissions) a country is willing
to assume. Unfortunately, public and
political concern is especially low in major
emitting countries whose role is central to
any solution to this crisis. The dynamics
of international media and the politics of
climate change mask a clear scientific
consensus on global warming, its causes,
and some of its key effects, feeding
scepticism that undermines support
for action desperately needed to tackle
this issue. The findings of this report
should therefore be subject to the widestpossible dissemination with the goal of
ensuring that everyone can at least be
informed of the types of dangers we run
by not tackling the climate crisis.
INVEST IN
FILLING URGENTRESEARCH GAPS.
WIDELY DISSEMINATETHE CLIMATE VULNERABILITYMONITOR’S FINDINGS.
8/8/2019 Climate Vulnerability Monitor 2010: The State of the Climate Crisis
http://slidepdf.com/reader/full/climate-vulnerability-monitor-2010-the-state-of-the-climate-crisis 22/291
ABOUT THIS
20 | Climate Vulnerability Monitor
DARA and the Climate Vulnerable Forum
created the Climate Vulnerability Monitor to advance understanding of the growing
negative effects of climate change on
society and to identify a variety of key
options to meet this new challenge.
Climate change is a global problem
whose resolution requires global
cooperation. As a result, global
policies, legislation and collaboration
frameworks, formal and informal, are
under discussion if not already in place.
It is critical that any global actions that
stem from these efforts be informed by a
clearer picture of what is at stake todayand tomorrow as a result of climate
change on a global level. Despite a
wealth of knowledge on climate change,
little consolidated information has
so far been made available regarding
the types, scales, and locations of its
impacts around the world today.
The Climate Vulnerability Monitor
comes forward as a contribution to thedebate in this respect. It is also entering
publication against a context of slow
progress on measures being taken to
deal with impacts that climate change is
already having around the world today.
Negative effects are most often triggered
when a community is unable to deal with
small additional stresses. Vulnerability,
or inability to withstand change or
harm, varies greatly from community
to community -- as do changes in
weather and existing climate conditions.
Wealthier communities may hardly notice
changes that in other regions could wellbe life threatening. Flood defences or
sophisticated health systems able to
cope with new challenges in one place
may be non-existent elsewhere. Impacts
are worsened when local environmental
conditions are already dif ficult due to
water shortages, land degradation,
or otherwise. When pre-existing
environmental challenges, changing
climate conditions, and vulnerability are
all at their highest, the consequences can
be devastating. And people suffer.
Progress, meanwhile, towards an
international agreement on climate
change that might halt the planet’s
warming is painstakingly slow. With
failure to reach a binding agreement at
the Copenhagen climate summit in 2009and no real signs of a breakthrough
since, are we oblivious to the scale of the
climate crisis already evident before us?
A near doubling in temperature increase
with correspondingly greater impacts
over the next few decades is unavoidable
and something we must prepare for. Far
more serious damage and destruction
than is outlined in this report can still
be averted but will require a steady
reduction in global greenhouse gas
emissions that trigger the warming effect.
That effort must begin in just the next few
years, or we may well risk heating up theclimate system beyond control, with ever
worsening consequences.
ARE WE OBLIVIOUSTO THE SCALE OF THECLIMATE CRISIS ALREADYEVIDENT BEFORE US?
The lack of specifics on what is happening
may well be holding back international
cooperation and is even more likely to
be restraining support to vulnerable
WHY THIS REPORT NOW?
CLIMATE CHANGE IS
A GLOBAL PROBLEMWHOSE RESOLUTIONREQUIRES GLOBALCOOPERATION
8/8/2019 Climate Vulnerability Monitor 2010: The State of the Climate Crisis
http://slidepdf.com/reader/full/climate-vulnerability-monitor-2010-the-state-of-the-climate-crisis 23/291
Climate Vulnerability Monitor | 21
REPORT
communities that are inadequately
equipped to face what, in some cases,is becoming an existential threat. Policy-
makers, in particular, have had little
indication about the relative sizes or
breadth of the different stresses taking
hold. And financial resources are dif ficult
to mobilize for a problem that has no
clear form. All of this has also kept people
out of touch with the realities of a global
crisis when strong public support is now
so crucial to resolving the problem.
Yet well-researched if imperfect
explanations of the effects of climate
change on communities around theworld do exist, as does information on
the effectiveness of measures to limit
any harmful effects. This report aims to
bring such expertise to bear in response
to simple questions: Where and how is
climate change having its most serious
effects? To what degree? And what
measures can we take to minimize the
harm? In this way, the report seeks to
clarify the extent of the main impacts
of climate change on human society
and identify some of the most effective
responses to that impact. It also aims topoint out those areas where limits to our
knowledge constrain a more accurate
understanding of this challenge -- and a
better response.
THE APPROACH
The purpose of the Monitor is to begin toprovide an assessment of different kinds
of vulnerabilities and to pinpoint who faces
them, when, and where. The intention is
to help guide, not to prioritise by exclusion
or to provide some sort of assertive and
closed list of preferences. It is not meant
to rank some countries as vulnerable and
others as not. The report is global, with
information given on a country level, but
not below that level except in isolated
areas. The approach is pragmatic, aimed at
establishing robust comparable estimates
for the main types of impacts that are
occurring, to better ensure we are dealing with them, and to better identify hurdles
that stand between us and a more accurate
picture of what is happening.
The report consists of three main parts.
First is the Climate Vulnerability Monitor
itself, which provides a map of key
vulnerabilities to climate change across
four major impact areas: Health, extreme
weather, loss of human habitat, and
stresses on the economy and natural
resources. Second is a catalogue of some
key practical actions that can be taken toreduce impacts identified in the Monitor.
Third, is a limited set of country profiles that
illustrate how the findings of the Monitor
relate to a given country’s situation.
The Climate Vulnerability Monitor is just
one of many possible approaches togauging vulnerability to climate change.
The chosen methodology of the Monitor
generates the results as outlined in this
report. Other methodologies have and will
lead to different findings.
This report understands “climate
vulnerability” as the degree to which
a community experiences danger and
harm from the negative effects of
climate change.7 That definition is taken
to include both the characteristics of a
particular community -- or underlying
vulnerability -- and exposure to changesin climate conditions and weather -- or
physical vulnerability -- both of which vary
greatly around the world. The Monitor
is not assessing adaptive capacity or
resilience per se, but what results when
combinations of climate stresses affect
a specific community. Countries with
lower vulnerability and impacts will
invariably have higher adaptive capacity
and resilience. The Monitor’s focus on
estimated negative or positive outcomes
-- impacts -- triggered by the presence
or absence of vulnerabilities differsfrom other tools. And “vulnerability” and
“impacts” that highlight vulnerabilities
are used somewhat interchangeably
across the report.
8/8/2019 Climate Vulnerability Monitor 2010: The State of the Climate Crisis
http://slidepdf.com/reader/full/climate-vulnerability-monitor-2010-the-state-of-the-climate-crisis 24/291
22 | Climate Vulnerability Monitor
The Monitor provides an indication of
the scales of harm, or in some cases
benefi ts, being triggered by climate
change. This assists the targeting of
actions that seek to reduce harm, such
as those mentioned in the Adaptation
Performance Review. But the Monitor
also reveals important information
about broader strategies to deal with
vulnerability, such as the relationship
between climate vulnerability and human
development or gender inequalities.
This information can be used to inform
strategic socio-economic or development
planning not covered in the Adaptation
Performance Review.
The Adaptation Performance Review
itself provides an assessment of
practical, concrete measures thatcan be taken to reduce vulnerability
and negative impacts due to climate
change. “Adaptation” is taken to mean
any actions that help communities or
their ecosystems cope with a changing
climate.8 The Adaptation Performance
Review assesses actions for their
effectiveness in reducing impacts that
have been pinpointed in the Monitor. It
only includes actions for which reliable
information on cost-effectiveness and
other key features of programmes
has been readily available. It is non-exhaustive, but provides a useful
indication of the array of options
available to limit impact and the varying
degrees of cost-benefi t returns that
apply to each main impact area.
WHAT ARE THEREPORT'S LIMITATIONS?In general, the measures of vulnerabilities
relied upon and sometimes the indicators
of impacts given are not always ideal.
The information drawn on must be
comparable across the board and is
often limited to the lowest common
denominator of what is available globally
-- in fact a handful of countries are
excluded for not meeting even minimal
data requirements, leaving a total of 184
countries assessed. Countries are not the
best unit of analysis for climate changes,
which may vary considerably across one
nation. Climate scientists differ in theiragreement on key changes -- such as
tropical storm activity -- and the models
themselves vary in their confidence
or certainties in predicting a role of
climate change today and in the near
future, as well as in predicting where,
for instance, changes like rainfall will
ultimately occur. Neither do changes in
weather conditions necessarily translate
to effects on the ground in the same
degree -- and yet, in some cases, there
are simply no better estimates available.
Occasional discrepancies in records usedalso have some effect on the accuracy
of this report’s assessments. Overall,
estimates of impacts could be higher or
lower. However, they are more likely too
conservative, if only because a number
of known impacts have simply been
excluded -- such as effects on freshwater
marine life, infrastructure damage from
permafrost melt, and many others --
which could well be significant to certain
communities if not globally.
Despite these shortcomings, the rough
picture this report sets out is still likely
to be reasonably accurate. Most of the
main impacts of climate change are
covered and linked to well-researched
scientific models. If adaptation efforts
were put into effect to address the levels
of impacts outlined here, vastly fewer
human lives would be at risk, and many
endangered species could be spared-- for the most part at a very low cost.
It is also important to remember that
most adaptation efforts also strengthen
the general well-being of vulnerable
communities and the world.
WHO DOES THE REPORT SERVE?The report aims to be useful for a wide
range of groups. It should complement
in particular the array of tools already
available to policy-makers and decision-
takers. Senior of fi
cials at a national levelwill have an idea of the extent to which
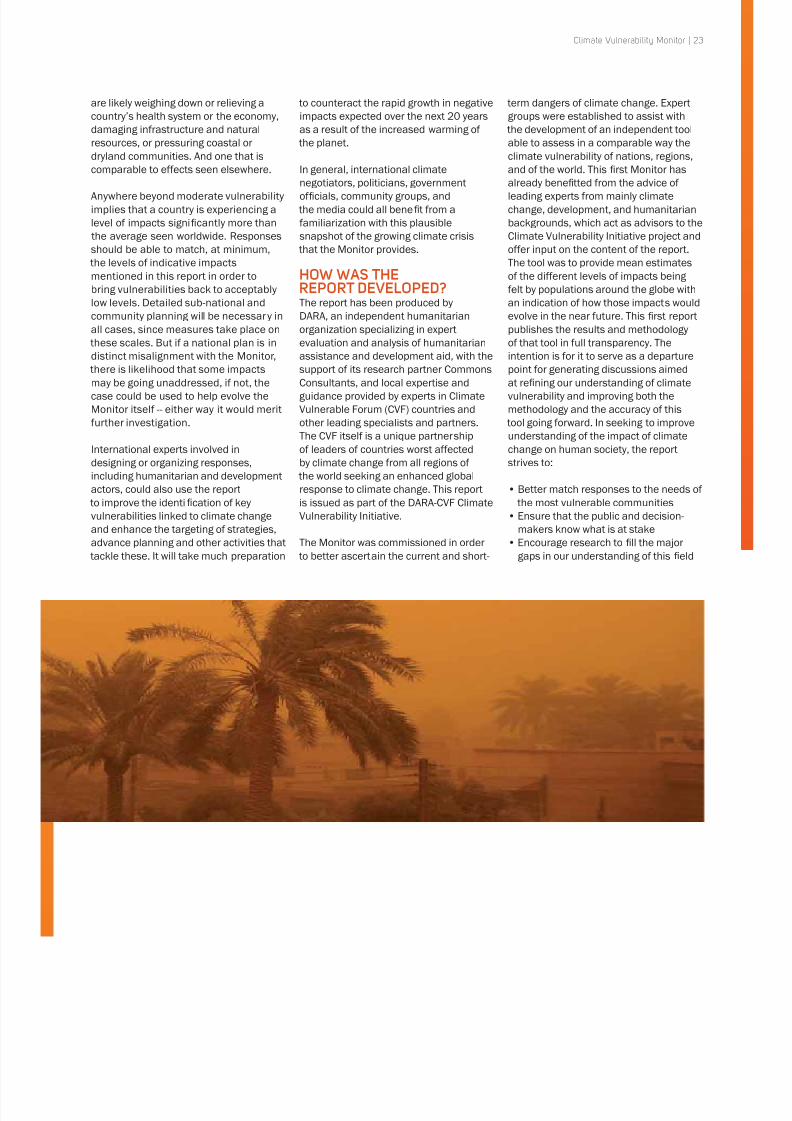
additional stresses due to climate change
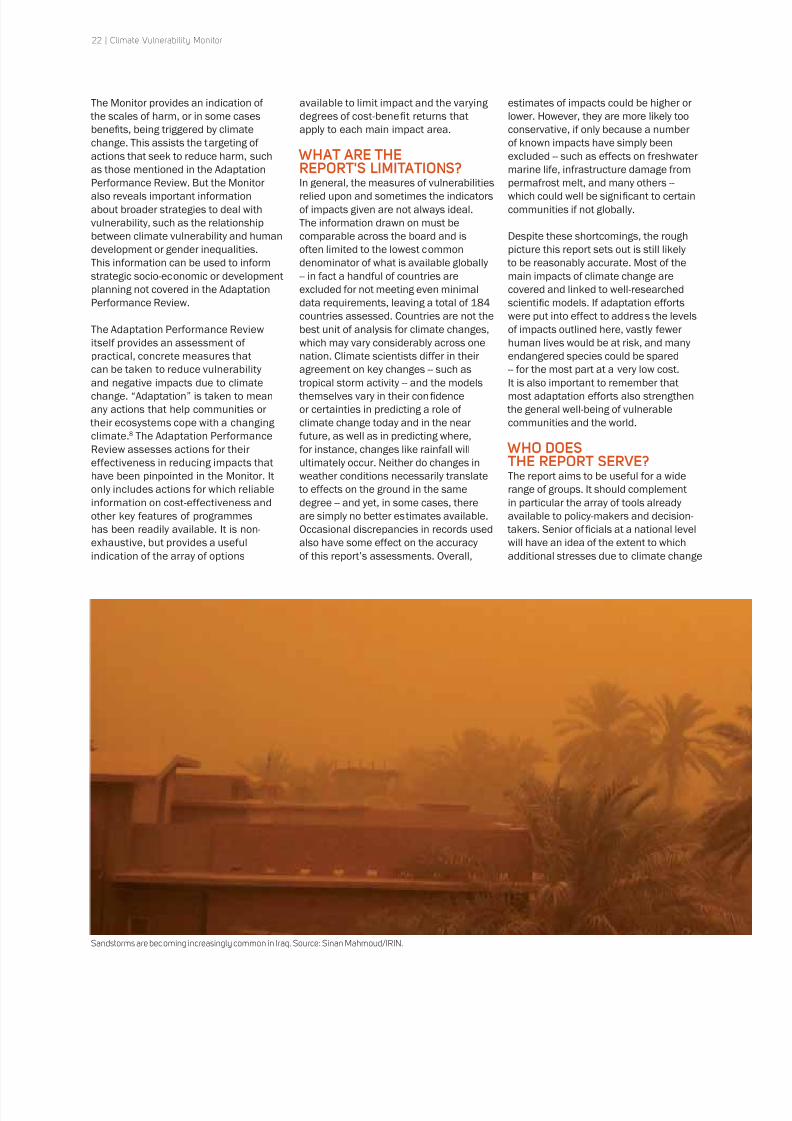
Sandstorms are becoming increasingly common in Iraq. Source: Sinan Mahmoud/IRIN.
8/8/2019 Climate Vulnerability Monitor 2010: The State of the Climate Crisis
http://slidepdf.com/reader/full/climate-vulnerability-monitor-2010-the-state-of-the-climate-crisis 25/291
Climate Vulnerability Monitor | 23
are likely weighing down or relieving a
country’s health system or the economy,
damaging infrastructure and natural
resources, or pressuring coastal or
dryland communities. And one that is
comparable to effects seen elsewhere.
Anywhere beyond moderate vulnerability
implies that a country is experiencing a
level of impacts significantly more than
the average seen worldwide. Responses
should be able to match, at minimum,
the levels of indicative impacts
mentioned in this report in order to
bring vulnerabilities back to acceptably
low levels. Detailed sub-national and
community planning will be necessary in
all cases, since measures take place on
these scales. But if a national plan is in
distinct misalignment with the Monitor, there is likelihood that some impacts
may be going unaddressed, if not, the
case could be used to help evolve the
Monitor itself -- either way it would merit
further investigation.
International experts involved in
designing or organizing responses,
including humanitarian and development
actors, could also use the report
to improve the identification of key
vulnerabilities linked to climate change
and enhance the targeting of strategies,advance planning and other activities that
tackle these. It will take much preparation
to counteract the rapid growth in negative
impacts expected over the next 20 years
as a result of the increased warming of
the planet.
In general, international climate
negotiators, politicians, government
of ficials, community groups, and
the media could all benefi t from a
familiarization with this plausible
snapshot of the growing climate crisis
that the Monitor provides.
HOW WAS THEREPORT DEVELOPED?The report has been produced by
DARA, an independent humanitarian
organization specializing in expert
evaluation and analysis of humanitarian
assistance and development aid, with thesupport of its research partner Commons
Consultants, and local expertise and
guidance provided by experts in Climate
Vulnerable Forum (CVF) countries and
other leading specialists and partners.
The CVF itself is a unique partnership
of leaders of countries worst affected
by climate change from all regions of
the world seeking an enhanced global
response to climate change. This report
is issued as part of the DARA-CVF Climate
Vulnerability Initiative.
The Monitor was commissioned in order
to better ascertain the current and short-
term dangers of climate change. Expert
groups were established to assist with
the development of an independent tool
able to assess in a comparable way the
climate vulnerability of nations, regions,
and of the world. This first Monitor has
already benefi tted from the advice of
leading experts from mainly climate
change, development, and humanitarian
backgrounds, which act as advisors to the
Climate Vulnerability Initiative project and
offer input on the content of the report.
The tool was to provide mean estimates
of the different levels of impacts being
felt by populations around the globe with
an indication of how those impacts would
evolve in the near future. This first report
publishes the results and methodology
of that tool in full transparency. The
intention is for it to serve as a departurepoint for generating discussions aimed
at refining our understanding of climate
vulnerability and improving both the
methodology and the accuracy of this
tool going forward. In seeking to improve
understanding of the impact of climate
change on human society, the report
strives to:
• Better match responses to the needs of
the most vulnerable communities
• Ensure that the public and decision-
makers know what is at stake• Encourage research to fill the major
gaps in our understanding of this field
8/8/2019 Climate Vulnerability Monitor 2010: The State of the Climate Crisis
http://slidepdf.com/reader/full/climate-vulnerability-monitor-2010-the-state-of-the-climate-crisis 26/291
8/8/2019 Climate Vulnerability Monitor 2010: The State of the Climate Crisis
http://slidepdf.com/reader/full/climate-vulnerability-monitor-2010-the-state-of-the-climate-crisis 27/291
CLIMATEVULNERABILITY
MONITOR Source: UN photo/Marco Dormino.
8/8/2019 Climate Vulnerability Monitor 2010: The State of the Climate Crisis
http://slidepdf.com/reader/full/climate-vulnerability-monitor-2010-the-state-of-the-climate-crisis 28/291
26 | CLIMATE VULNERABILITY MONITOR | Climate Vulnerability Monitor
THE CLIMATEVULNERABILITYMONITORThe Climate Vulnerability Monitor provides a global overview ofour vulnerability to climate change. It provides fair estimates ofthe types of impacts we are already facing due to changes in ourclimate. It shows where those impacts are taking place -- with mostof the harm falling on already poor and vulnerable communities.The Monitor also captures our evolving vulnerability to climatechange, which is on the rapid increase globally.
When monitoring estimated impacts of
climate change on populations around the
world it becomes immediately clear to what
extent humanity is already in the depths of a
fundamental and dangerous crisis. Most of the
world’s countries are already suffering negative
impacts due to climate change in at least one
or two different areas today. Only a few are
experiencing any benefi ts. And these are faroutweighed by the levels of damage and harm
seen elsewhere. More than 50 countries will be
acutely vulnerable to these effects by 2030 if
measures are not taken to minimize the harm.
Hundreds of thousands of lives are estimated
to be lost with every year of inaction that goes
by. The impacts are already so widespread
that this challenge is endemic: A dozen regions
register a factor of Acute vulnerability in at
least one impact area.
It is possible to reduce vulnerability, of
course. This report’s Adaptation PerformanceReview outlines cost-effective measures for
tackling all of the different types of impacts
covered by the Monitor. For every factor
increase in vulnerability there is also a
corresponding drop in human development.
The link between poverty and vulnerability to
climate change could not be clearer. And a
strategic reinforcement of human development
strategies will also be critical in meeting this
new challenge.
If we continue on the current path, in the next
20 years alone the number of most-vulnerablecountries will double that of today. We can still
take action to reverse this trend and stop the
deadly and harmful impacts. If we do not act,
vulnerability can only worsen. Fleeting benefi ts
will vanish. And all nations will realize, one-
by-one, an inevitable, global, vulnerability to a
disrupted climate.
INTRODUCTION
IF WE DO NOT ACT, VULNERABILITY CANONLY WORSEN. FLEETING BENEFITS WILLVANISH. AND ALL NATIONS WILL REALIZE,ONE-BY-ONE, AN INEVITABLE, GLOBAL,VULNERABILITY TO A DISRUPTED CLIMATE
8/8/2019 Climate Vulnerability Monitor 2010: The State of the Climate Crisis
http://slidepdf.com/reader/full/climate-vulnerability-monitor-2010-the-state-of-the-climate-crisis 29/291
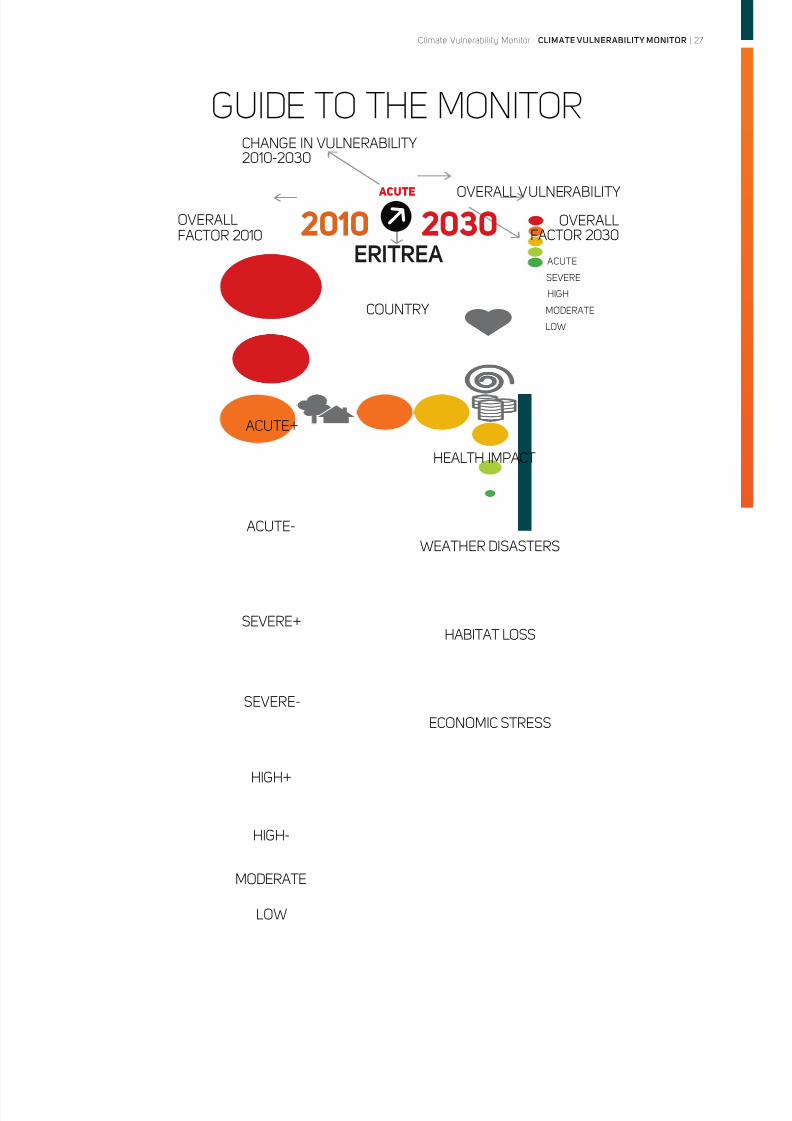
Climate Vulnerability Monitor | CLIMATE VULNERABILITY MONITOR | 27
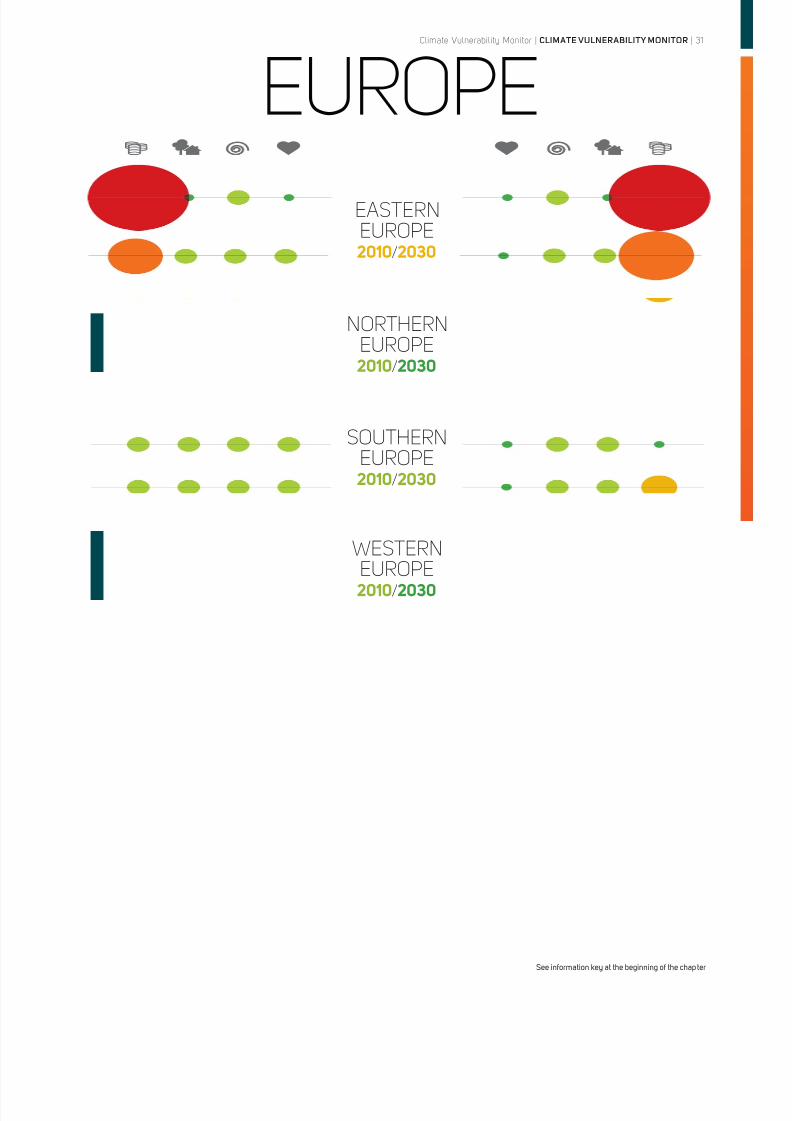
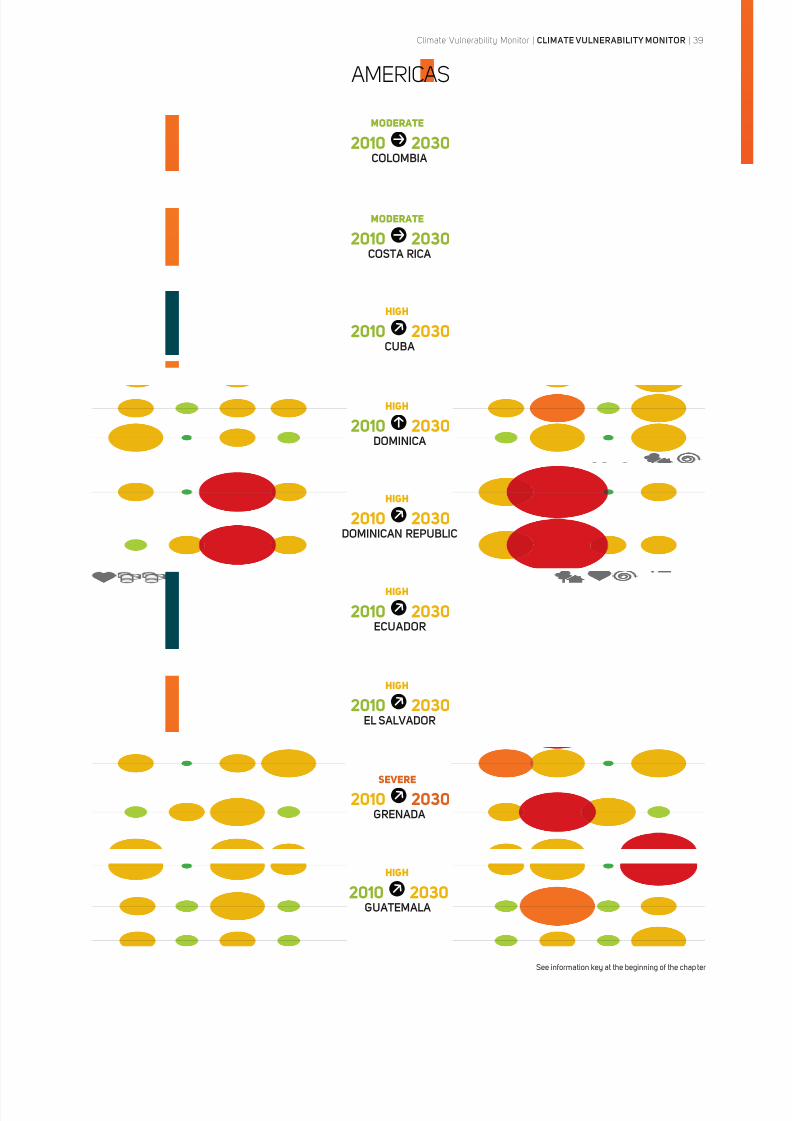
HEALTH IMPACT
WEATHER DISASTERS
HABITAT LOSS
ECONOMIC STRESS
ACUTE+
ACUTE-
SEVERE+
SEVERE-
HIGH+
HIGH-
LOW
MODERATE
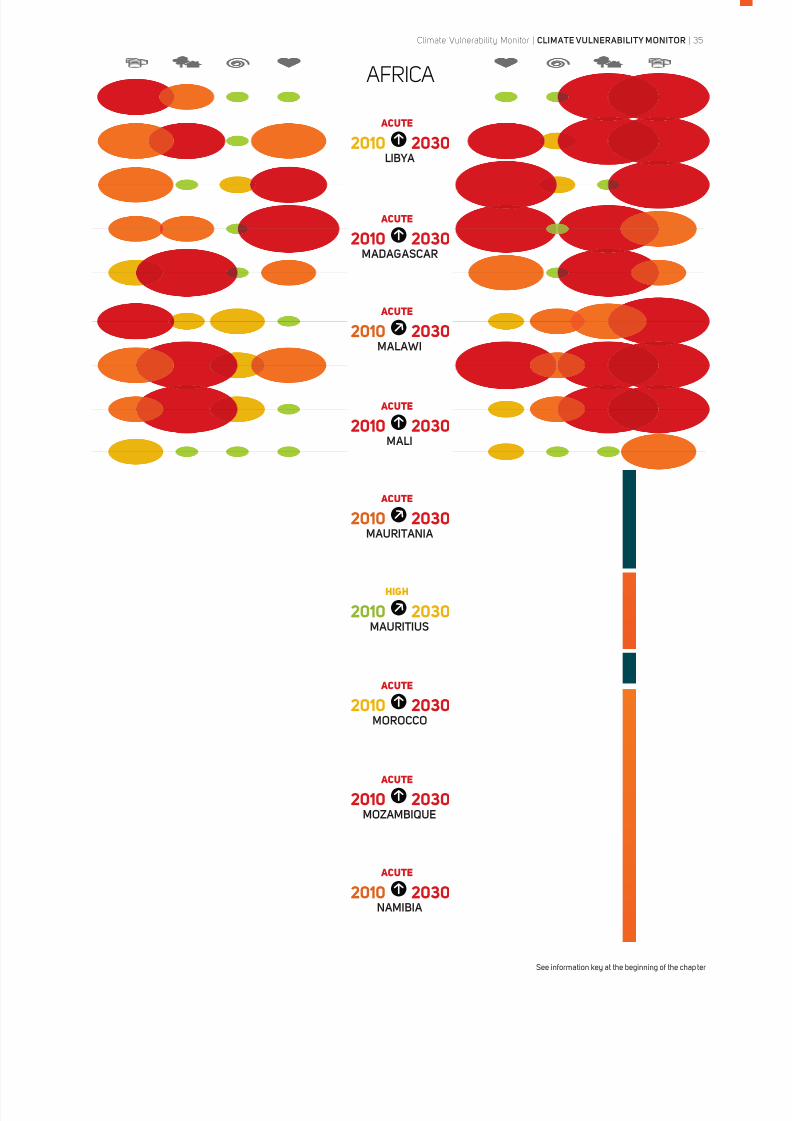
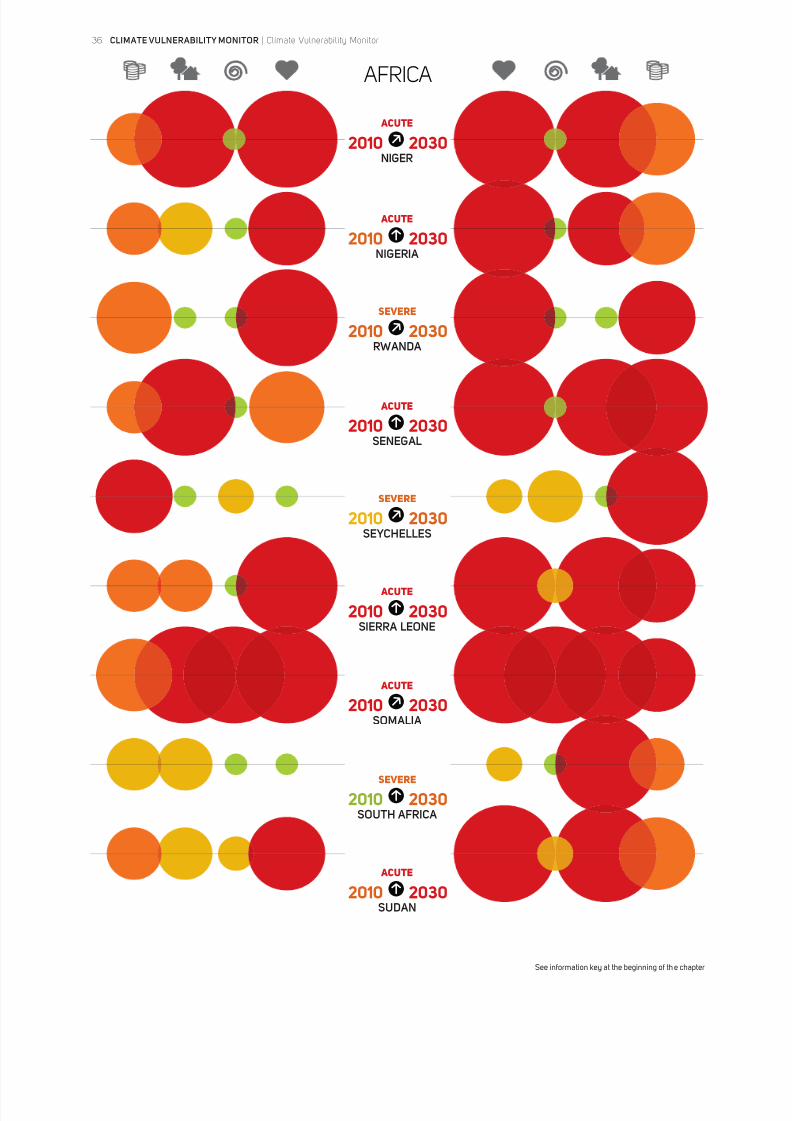
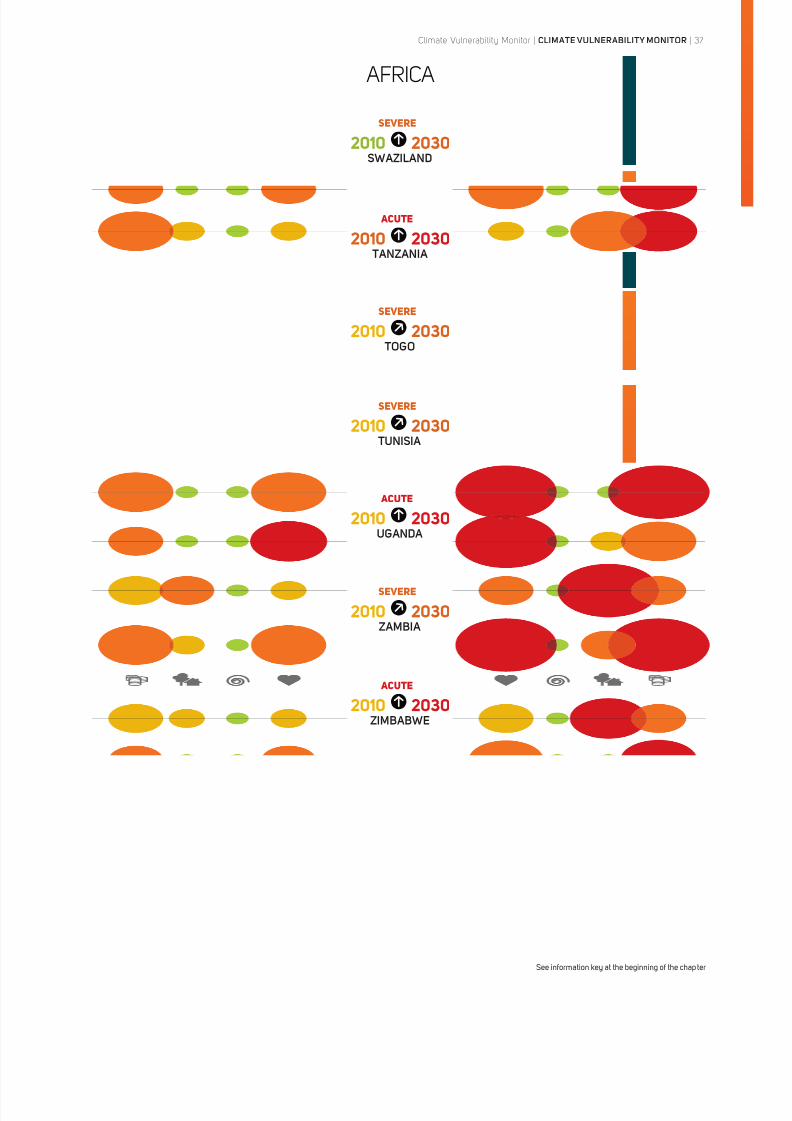
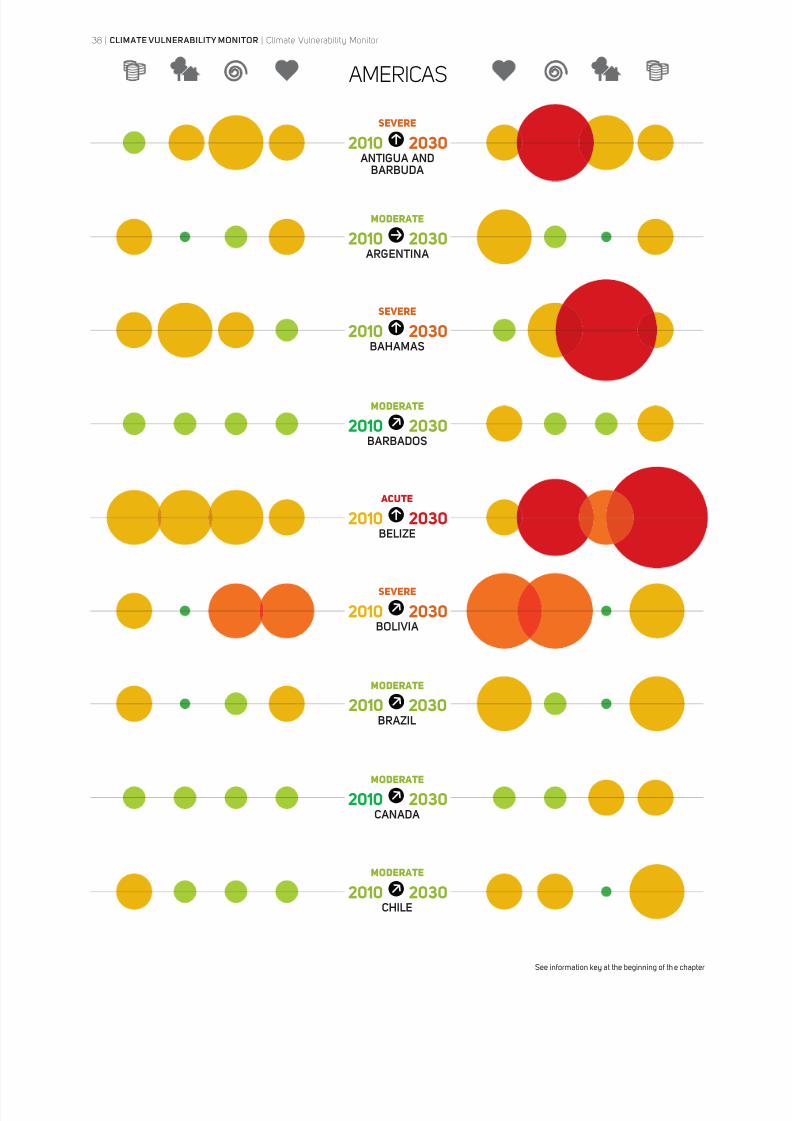
GUIDE TO THE MONITOR
COUNTRY
CHANGE IN VULNERABILITY2010-2030
OVERALLFACTOR 2010 2010 2030
ERITREA
OVERALLFACTOR 2030
MODERATE
LOW
HIGH
SEVERE
ACUTE
ACUTE OVERALL VULNERABILITY
8/8/2019 Climate Vulnerability Monitor 2010: The State of the Climate Crisis
http://slidepdf.com/reader/full/climate-vulnerability-monitor-2010-the-state-of-the-climate-crisis 30/291
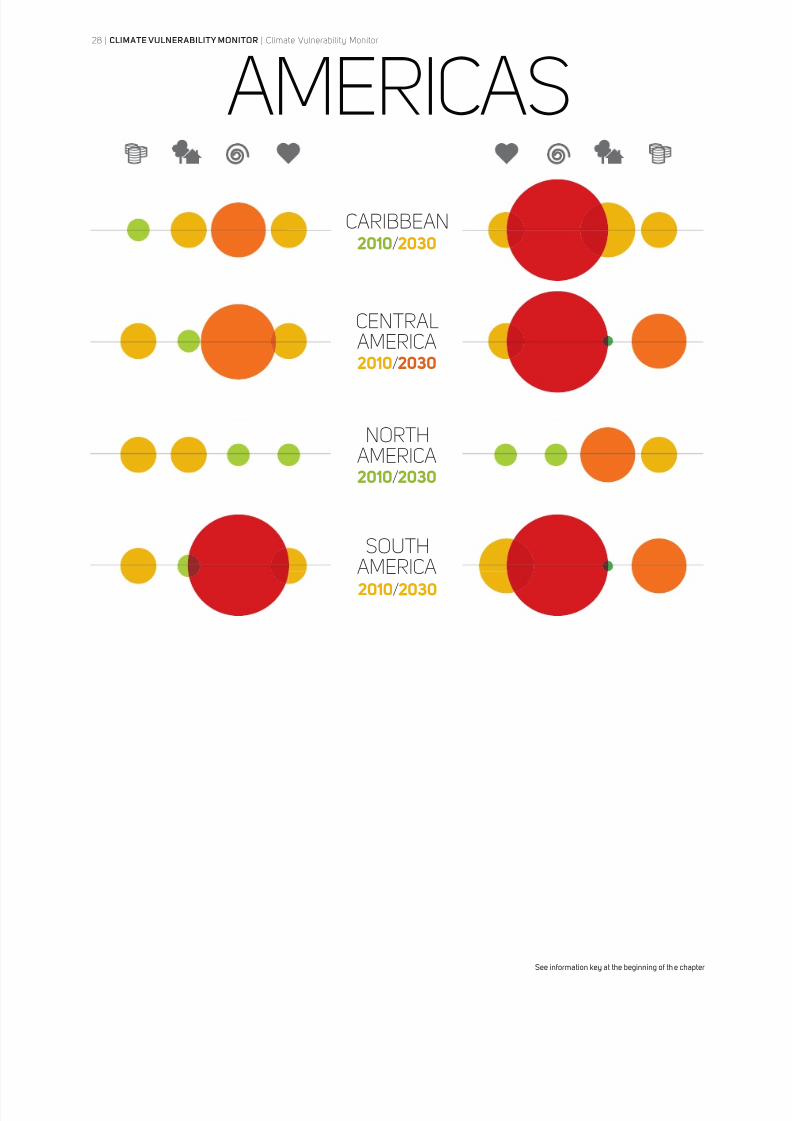
28 | CLIMATE VULNERABILITY MONITOR | Climate Vulnerability Monitor
AMERICAS
2010/ 2030
CARIBBEAN
2010/ 2030
CENTRALAMERICA
2010/ 2030
NORTHAMERICA
2010/ 2030
SOUTHAMERICA
See information key at the beginning of the chapter
8/8/2019 Climate Vulnerability Monitor 2010: The State of the Climate Crisis
http://slidepdf.com/reader/full/climate-vulnerability-monitor-2010-the-state-of-the-climate-crisis 31/291
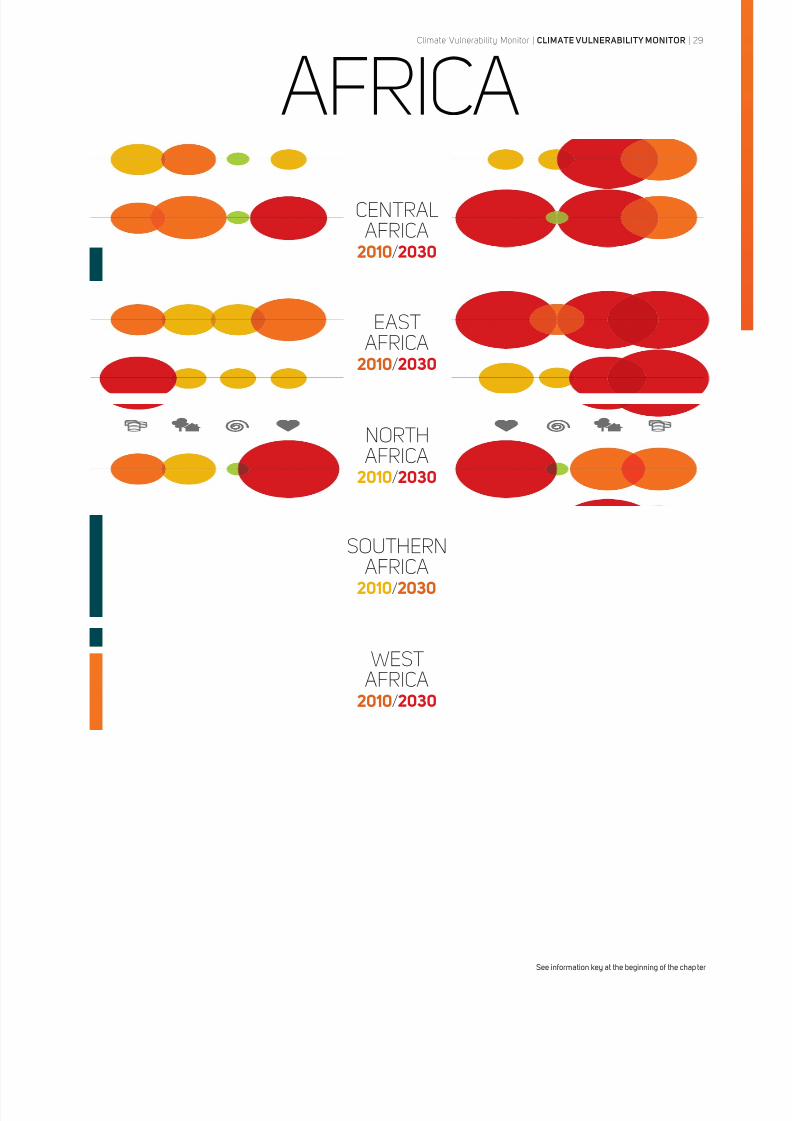
Climate Vulnerability Monitor | CLIMATE VULNERABILITY MONITOR | 29
AFRICA
2010/ 2030
CENTRALAFRICA
2010/ 2030
EASTAFRICA
2010/ 2030
NORTHAFRICA
2010/ 2030
SOUTHERNAFRICA
2010/ 2030
WESTAFRICA
See information key at the beginning of the chap ter
8/8/2019 Climate Vulnerability Monitor 2010: The State of the Climate Crisis
http://slidepdf.com/reader/full/climate-vulnerability-monitor-2010-the-state-of-the-climate-crisis 32/291
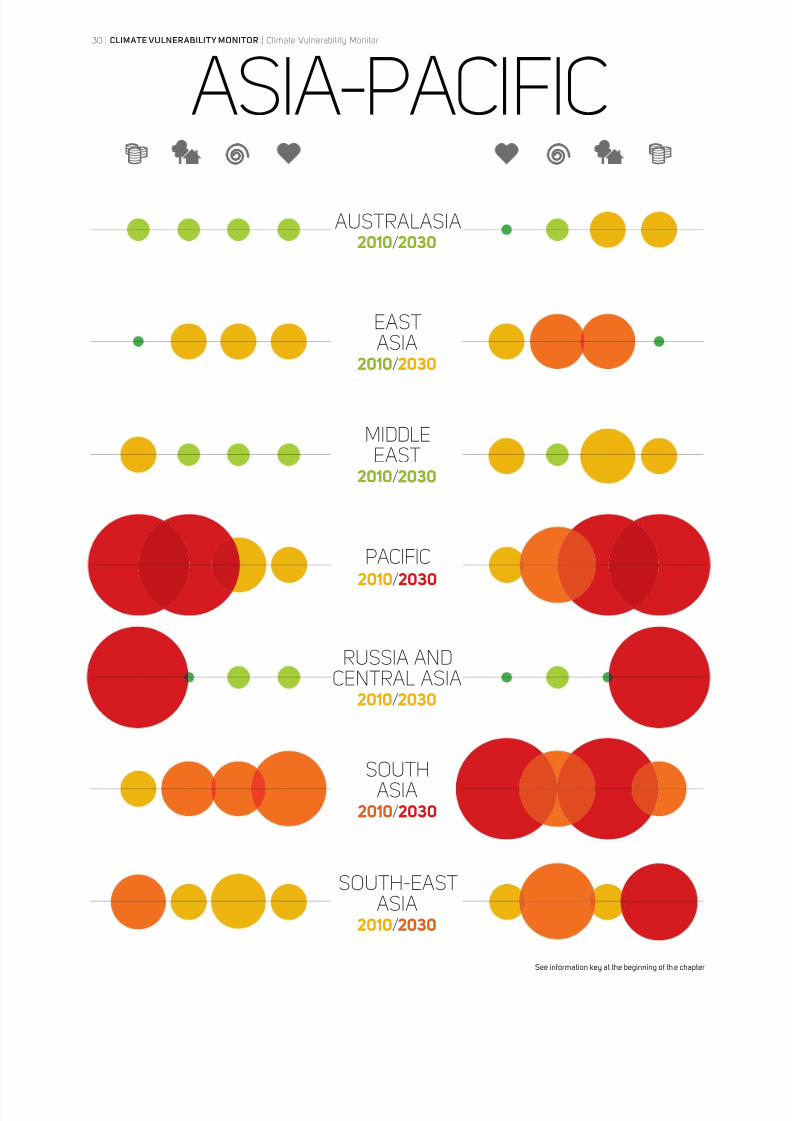
30 | CLIMATE VULNERABILITY MONITOR | Climate Vulnerability Monitor
ASIA-PACIFIC
2010/ 2030AUSTRALASIA
2010/ 2030
SOUTHASIA
2010/ 2030
SOUTH-EASTASIA
2010/ 2030
EASTASIA
2010/ 2030
MIDDLEEAST
2010/ 2030
RUSSIA ANDCENTRAL ASIA
2010/ 2030
PACIFIC
See information key at the beginning of the chapter
8/8/2019 Climate Vulnerability Monitor 2010: The State of the Climate Crisis
http://slidepdf.com/reader/full/climate-vulnerability-monitor-2010-the-state-of-the-climate-crisis 33/291
Climate Vulnerability Monitor | CLIMATE VULNERABILITY MONITOR | 31
EUROPE
2010/ 2030
EASTERNEUROPE
2010/ 2030
NORTHERNEUROPE
2010/ 2030
SOUTHERNEUROPE
2010/ 2030
WESTERNEUROPE
See information key at the beginning of the chap ter
8/8/2019 Climate Vulnerability Monitor 2010: The State of the Climate Crisis
http://slidepdf.com/reader/full/climate-vulnerability-monitor-2010-the-state-of-the-climate-crisis 34/291
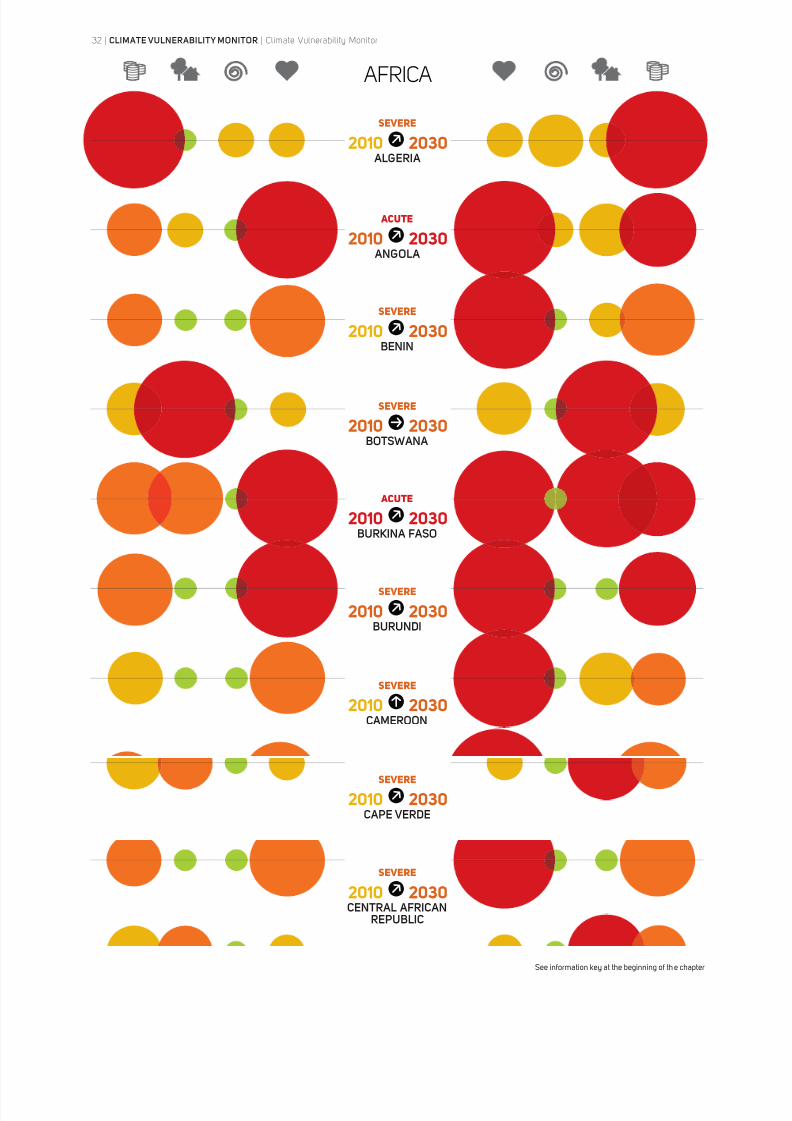
32 | CLIMATE VULNERABILITY MONITOR | Climate Vulnerability Monitor
2010 2030 ALGERIA
2010 2030 ANGOLA
2010 2030BENIN
2010 2030BOTSWANA
2010 2030
BURKINA FASO
2010 2030BURUNDI
2010
2030CAMEROON
2010 2030CAPE VERDE
2010 2030CENTRAL AFRICAN
REPUBLIC
AFRICA
See information key at the beginning of the chapter
SEVERE
ACUTE
SEVERE
SEVERE
ACUTE
SEVERE
SEVERE
SEVERE
SEVERE
8/8/2019 Climate Vulnerability Monitor 2010: The State of the Climate Crisis
http://slidepdf.com/reader/full/climate-vulnerability-monitor-2010-the-state-of-the-climate-crisis 35/291
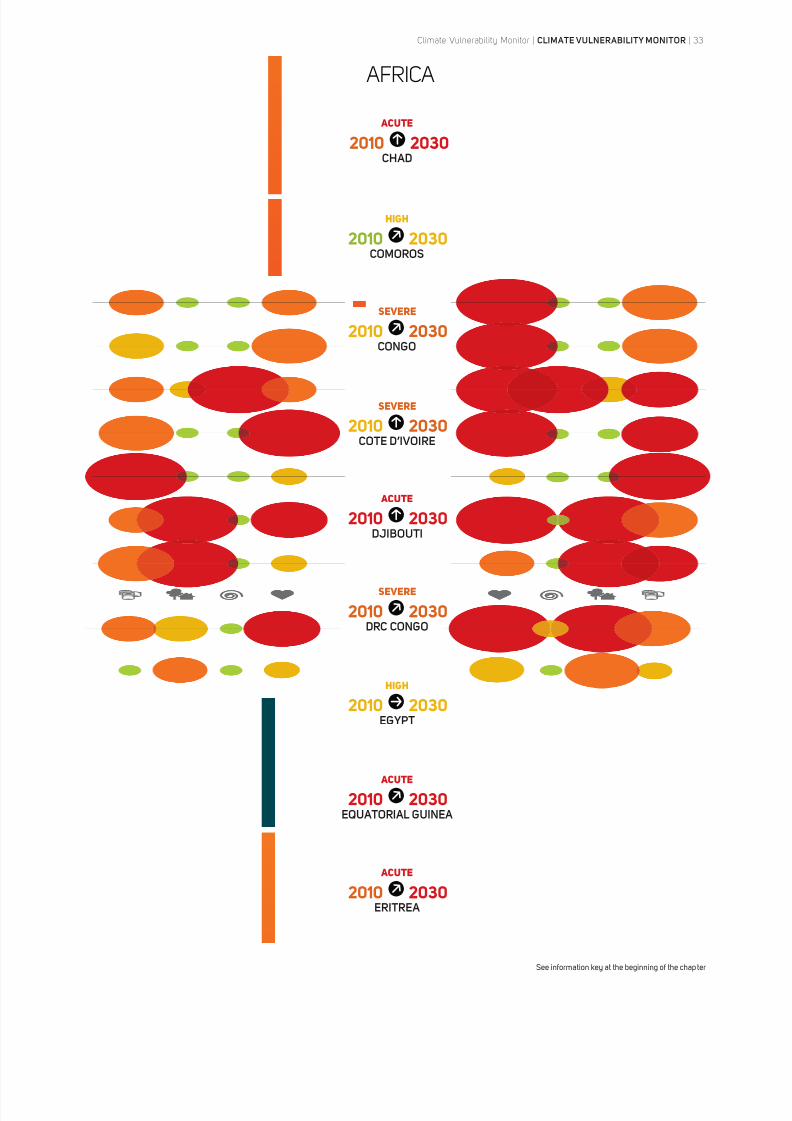
Climate Vulnerability Monitor | CLIMATE VULNERABILITY MONITOR | 33
2010 2030CHAD
2010 2030COMOROS
2010 2030CONGO
2010 2030COTE D’IVOIRE
2010 2030
DJIBOUTI
2010 2030DRC CONGO
2010
2030EGYPT
2010 2030EQUATORIAL GUINEA
2010 2030ERITREA
AFRICA
See information key at the beginning of the chap ter
ACUTE
HIGH
SEVERE
SEVERE
ACUTE
SEVERE
HIGH
ACUTE
ACUTE
8/8/2019 Climate Vulnerability Monitor 2010: The State of the Climate Crisis
http://slidepdf.com/reader/full/climate-vulnerability-monitor-2010-the-state-of-the-climate-crisis 36/291
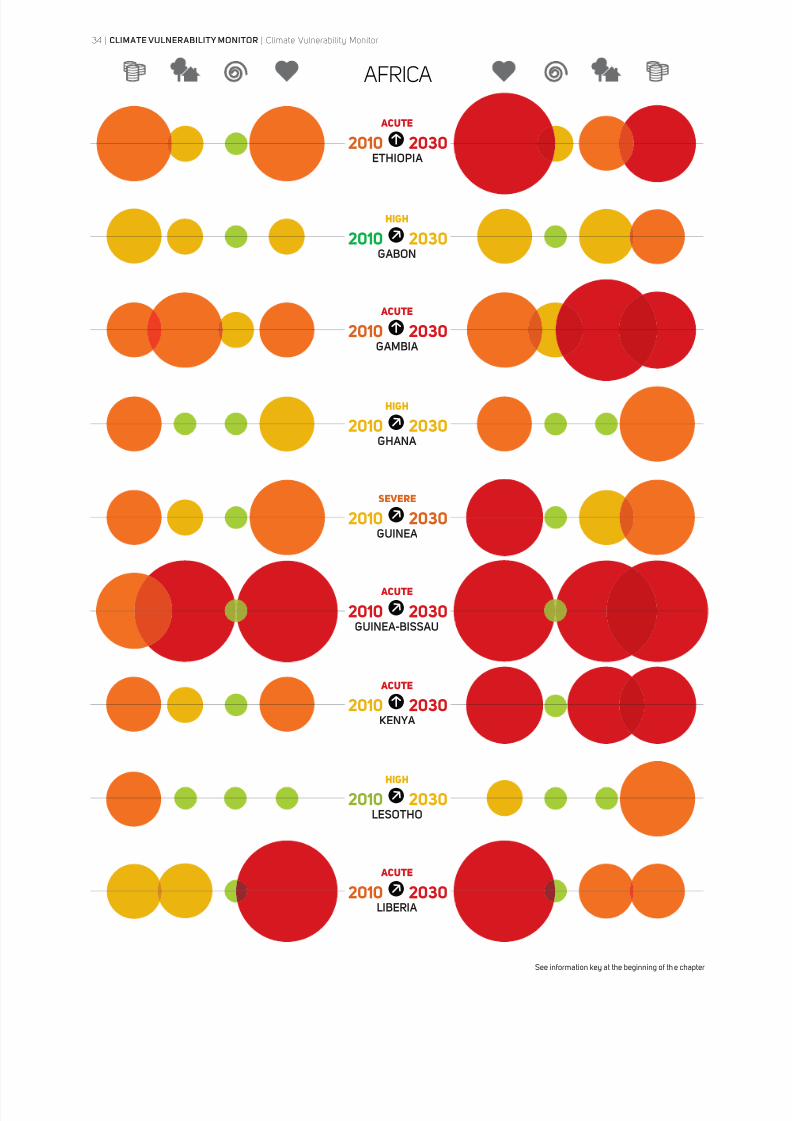
34 | CLIMATE VULNERABILITY MONITOR | Climate Vulnerability Monitor
2010 2030ETHIOPIA
2010 2030GABON
2010 2030GAMBIA
2010 2030GHANA
2010 2030
GUINEA
2010 2030GUINEA-BISSAU
2010
2030KENYA
2010 2030LESOTHO
2010 2030LIBERIA
AFRICA
See information key at the beginning of the chapter
ACUTE
HIGH
ACUTE
HIGH
SEVERE
ACUTE
ACUTE
HIGH
ACUTE
8/8/2019 Climate Vulnerability Monitor 2010: The State of the Climate Crisis
http://slidepdf.com/reader/full/climate-vulnerability-monitor-2010-the-state-of-the-climate-crisis 37/291
Climate Vulnerability Monitor | CLIMATE VULNERABILITY MONITOR | 35
2010 2030LIBYA
2010 2030MADAGASCAR
2010 2030MALAWI
2010 2030MALI
2010 2030
MAURITANIA
2010 2030MAURITIUS
2010
2030MOROCCO
2010 2030MOZAMBIQUE
2010 2030NAMIBIA
AFRICA
See information key at the beginning of the chap ter
ACUTE
ACUTE
ACUTE
ACUTE
ACUTE
HIGH
ACUTE
ACUTE
ACUTE
8/8/2019 Climate Vulnerability Monitor 2010: The State of the Climate Crisis
http://slidepdf.com/reader/full/climate-vulnerability-monitor-2010-the-state-of-the-climate-crisis 38/291
36 | CLIMATE VULNERABILITY MONITOR | Climate Vulnerability Monitor
2010 2030NIGER
2010 2030NIGERIA
2010 2030RWANDA
2010 2030SENEGAL
2010 2030
SEYCHELLES
2010 2030SIERRA LEONE
2010
2030SOMALIA
2010 2030SOUTH AFRICA
2010 2030SUDAN
AFRICA
See information key at the beginning of the chapter
ACUTE
ACUTE
SEVERE
ACUTE
SEVERE
ACUTE
ACUTE
SEVERE
ACUTE
8/8/2019 Climate Vulnerability Monitor 2010: The State of the Climate Crisis
http://slidepdf.com/reader/full/climate-vulnerability-monitor-2010-the-state-of-the-climate-crisis 39/291
Climate Vulnerability Monitor | CLIMATE VULNERABILITY MONITOR | 37
2010 2030SWAZILAND
2010 2030 TANZANIA
2010 2030 TOGO
2010 2030 TUNISIA
2010 2030
UGANDA
2010 2030 ZAMBIA
2010
2030 ZIMBABWE
AFRICA
See information key at the beginning of the chap ter
SEVERE
ACUTE
SEVERE
SEVERE
ACUTE
SEVERE
ACUTE
8/8/2019 Climate Vulnerability Monitor 2010: The State of the Climate Crisis
http://slidepdf.com/reader/full/climate-vulnerability-monitor-2010-the-state-of-the-climate-crisis 40/291
38 | CLIMATE VULNERABILITY MONITOR | Climate Vulnerability Monitor
2010 2030 ANTIGUA AND
BARBUDA
2010 2030 ARGENTINA
2010 2030BAHAMAS
2010 2030BARBADOS
2010 2030
BELIZE
2010 2030BOLIVIA
2010
2030BRAZIL
2010 2030CANADA
2010 2030CHILE
AMERICAS
See information key at the beginning of the chapter
SEVERE
MODERATE
SEVERE
MODERATE
ACUTE
SEVERE
MODERATE
MODERATE
MODERATE
8/8/2019 Climate Vulnerability Monitor 2010: The State of the Climate Crisis
http://slidepdf.com/reader/full/climate-vulnerability-monitor-2010-the-state-of-the-climate-crisis 41/291
Climate Vulnerability Monitor | CLIMATE VULNERABILITY MONITOR | 39
2010 2030COLOMBIA
2010 2030COSTA RICA
2010 2030CUBA
2010 2030DOMINICA
2010 2030
DOMINICAN REPUBLIC
2010 2030ECUADOR
2010
2030EL SALVADOR
2010 2030GRENADA
2010 2030GUATEMALA
AMERICAS
See information key at the beginning of the chap ter
MODERATE
MODERATE
HIGH
HIGH
HIGH
HIGH
HIGH
SEVERE
HIGH
8/8/2019 Climate Vulnerability Monitor 2010: The State of the Climate Crisis
http://slidepdf.com/reader/full/climate-vulnerability-monitor-2010-the-state-of-the-climate-crisis 42/291
40 | CLIMATE VULNERABILITY MONITOR | Climate Vulnerability Monitor
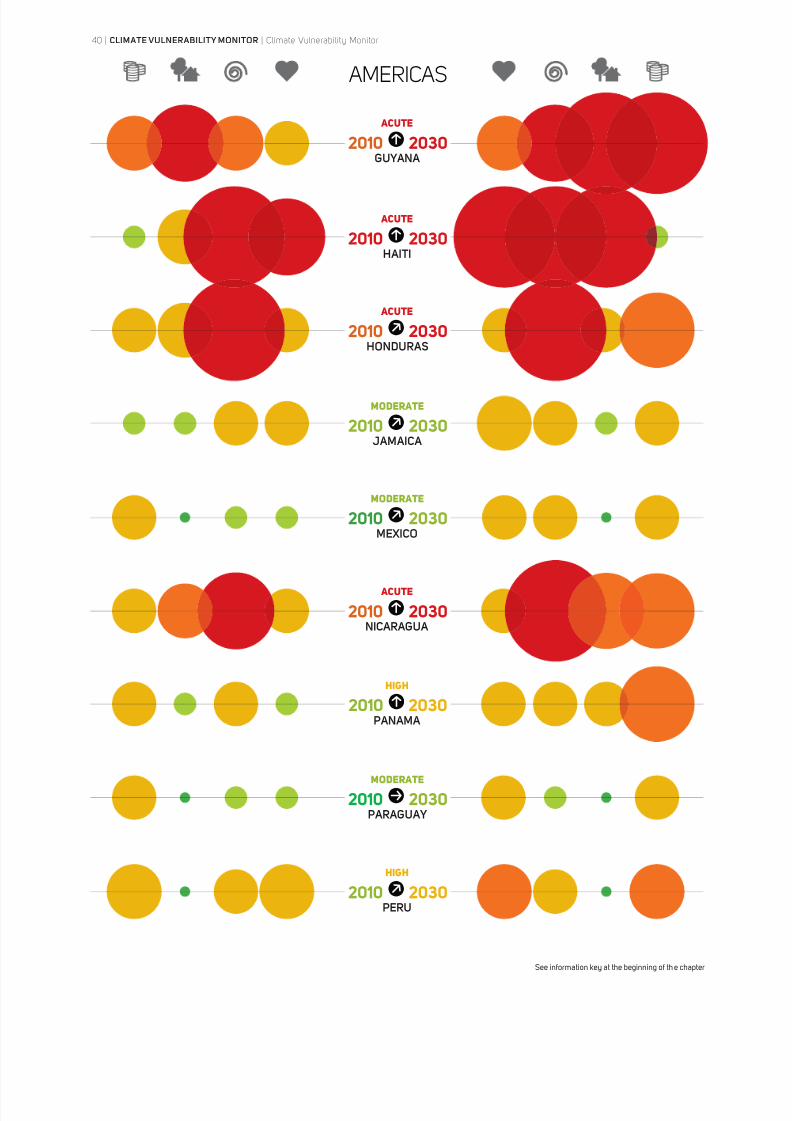
2010 2030GUYANA
2010 2030HAITI
2010 2030HONDURAS
2010 2030JAMAICA
2010 2030
MEXICO
2010 2030NICARAGUA
2010
2030PANAMA
2010 2030PARAGUAY
2010 2030PERU
AMERICAS
See information key at the beginning of the chapter
ACUTE
ACUTE
ACUTE
MODERATE
MODERATE
ACUTE
HIGH
MODERATE
HIGH
8/8/2019 Climate Vulnerability Monitor 2010: The State of the Climate Crisis
http://slidepdf.com/reader/full/climate-vulnerability-monitor-2010-the-state-of-the-climate-crisis 43/291
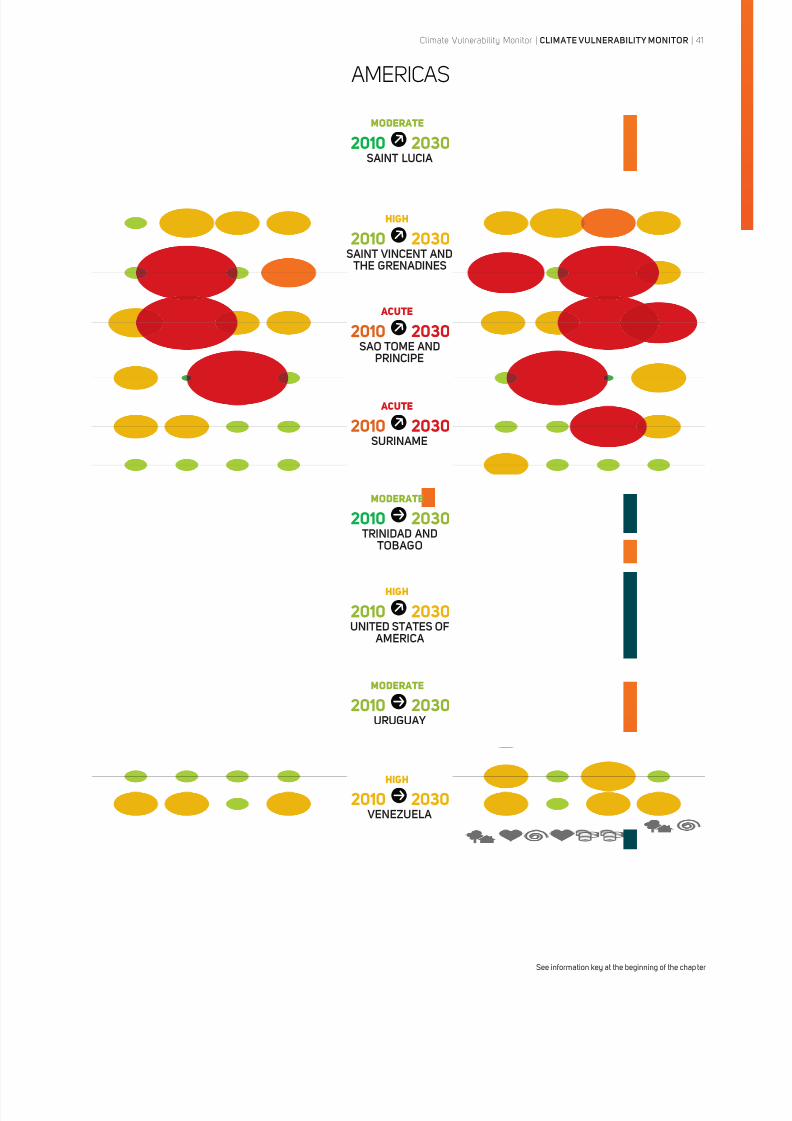
Climate Vulnerability Monitor | CLIMATE VULNERABILITY MONITOR | 41
2010 2030SAINT LUCIA
2010 2030SAINT VINCENT AND THE GRENADINES
2010 2030SAO TOME AND
PRINCIPE
2010 2030SURINAME
2010 2030
TRINIDAD AND TOBAGO
2010 2030UNITED STATES OF
AMERICA
2010
2030URUGUAY
2010 2030 VENEZUELA
AMERICAS
See information key at the beginning of the chap ter
MODERATE
HIGH
ACUTE
ACUTE
MODERATE
HIGH
MODERATE
HIGH
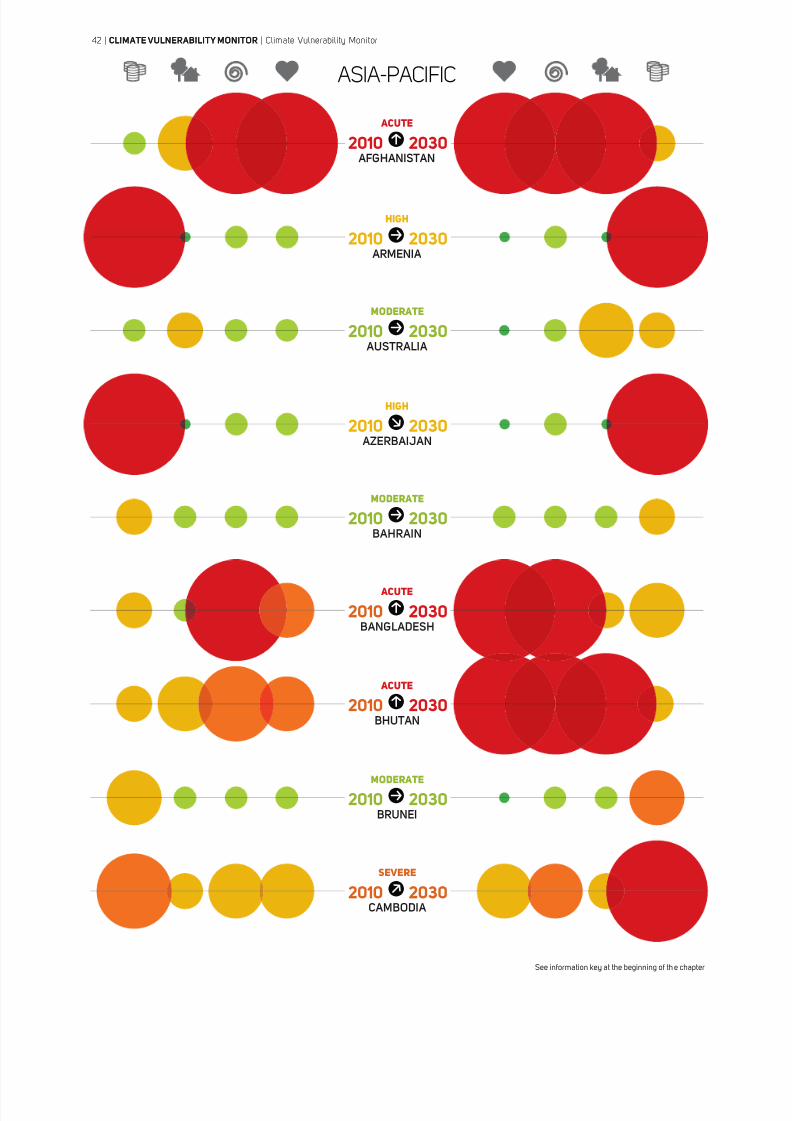
8/8/2019 Climate Vulnerability Monitor 2010: The State of the Climate Crisis
http://slidepdf.com/reader/full/climate-vulnerability-monitor-2010-the-state-of-the-climate-crisis 44/291
42 | CLIMATE VULNERABILITY MONITOR | Climate Vulnerability Monitor
2010 2030 AFGHANISTAN
2010 2030 ARMENIA
2010 2030 AUSTRALIA
2010 2030 AZERBAIJAN
2010 2030
BAHRAIN
2010 2030BANGLADESH
2010
2030BHUTAN
2010 2030BRUNEI
2010 2030CAMBODIA
42 | CLIMATE VULNERABILITY MONITOR | Climate Vulnerability Monitor
ASIA-PACIFIC
See information key at the beginning of the chapter
ACUTE
HIGH
MODERATE
HIGH
MODERATE
ACUTE
ACUTE
MODERATE
SEVERE
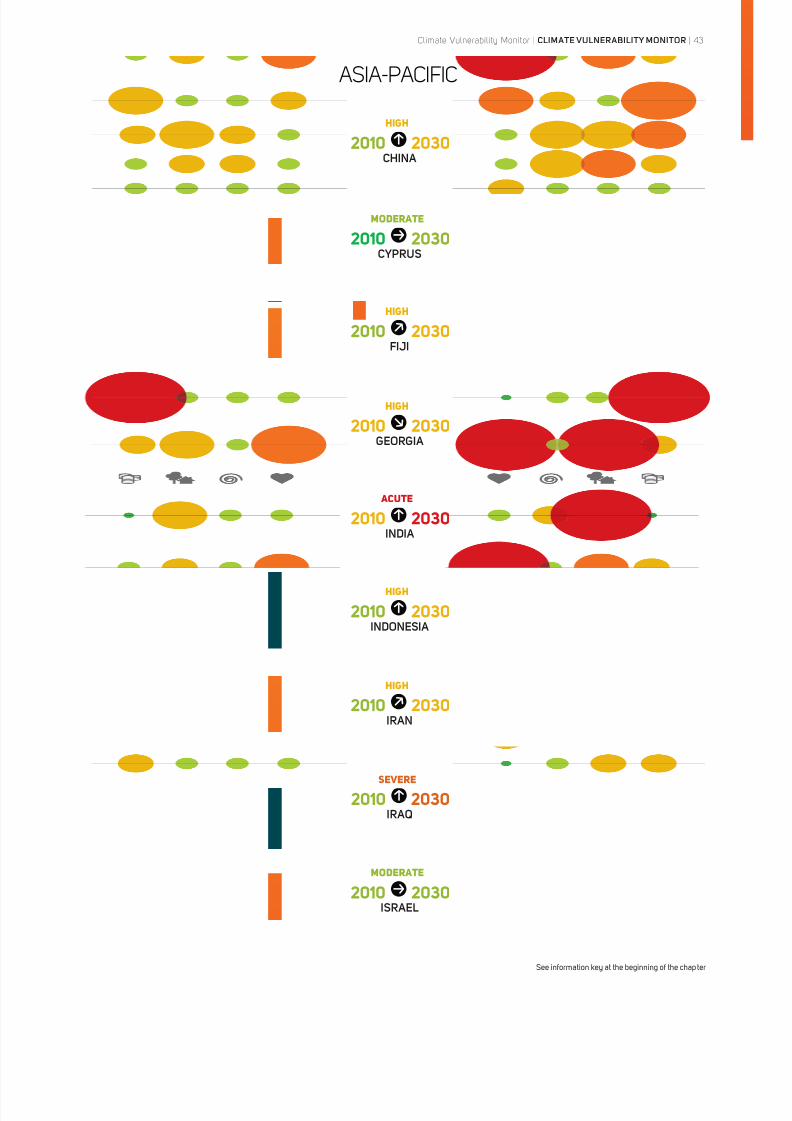
8/8/2019 Climate Vulnerability Monitor 2010: The State of the Climate Crisis
http://slidepdf.com/reader/full/climate-vulnerability-monitor-2010-the-state-of-the-climate-crisis 45/291
Climate Vulnerability Monitor | CLIMATE VULNERABILITY MONITOR | 43
2010 2030CHINA
2010 2030CYPRUS
2010 2030FIJI
2010 2030GEORGIA
2010 2030
INDIA
2010 2030INDONESIA
2010
2030IRAN
2010 2030IRAQ
2010 2030ISRAEL
ASIA-PACIFIC
See information key at the beginning of the chap ter
HIGH
MODERATE
HIGH
HIGH
ACUTE
HIGH
HIGH
SEVERE
MODERATE
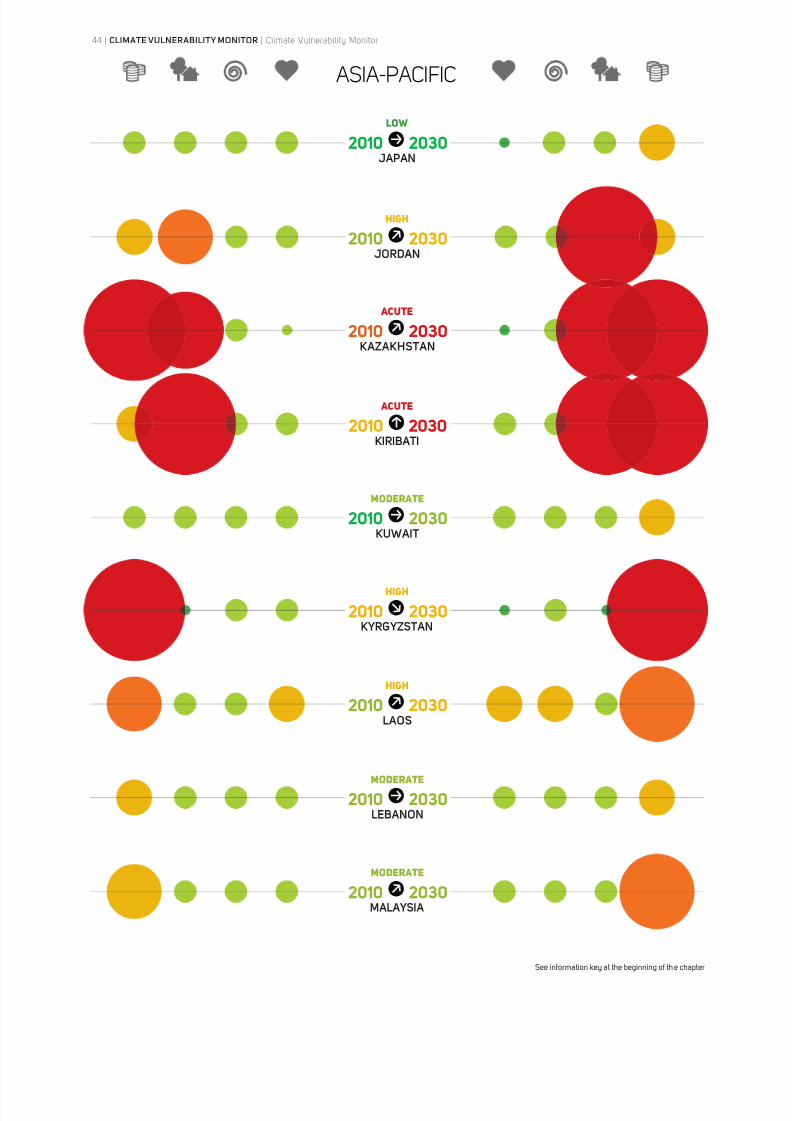
8/8/2019 Climate Vulnerability Monitor 2010: The State of the Climate Crisis
http://slidepdf.com/reader/full/climate-vulnerability-monitor-2010-the-state-of-the-climate-crisis 46/291
44 | CLIMATE VULNERABILITY MONITOR | Climate Vulnerability Monitor
2010 2030JAPAN
2010 2030JORDAN
2010 2030KAZAKHSTAN
2010 2030KIRIBATI
2010 2030
KUWAIT
2010 2030KYRGYZSTAN
2010
2030LAOS
2010 2030LEBANON
2010 2030MALAYSIA
ASIA-PACIFIC
See information key at the beginning of the chapter
LOW
HIGH
ACUTE
ACUTE
MODERATE
HIGH
HIGH
MODERATE
MODERATE
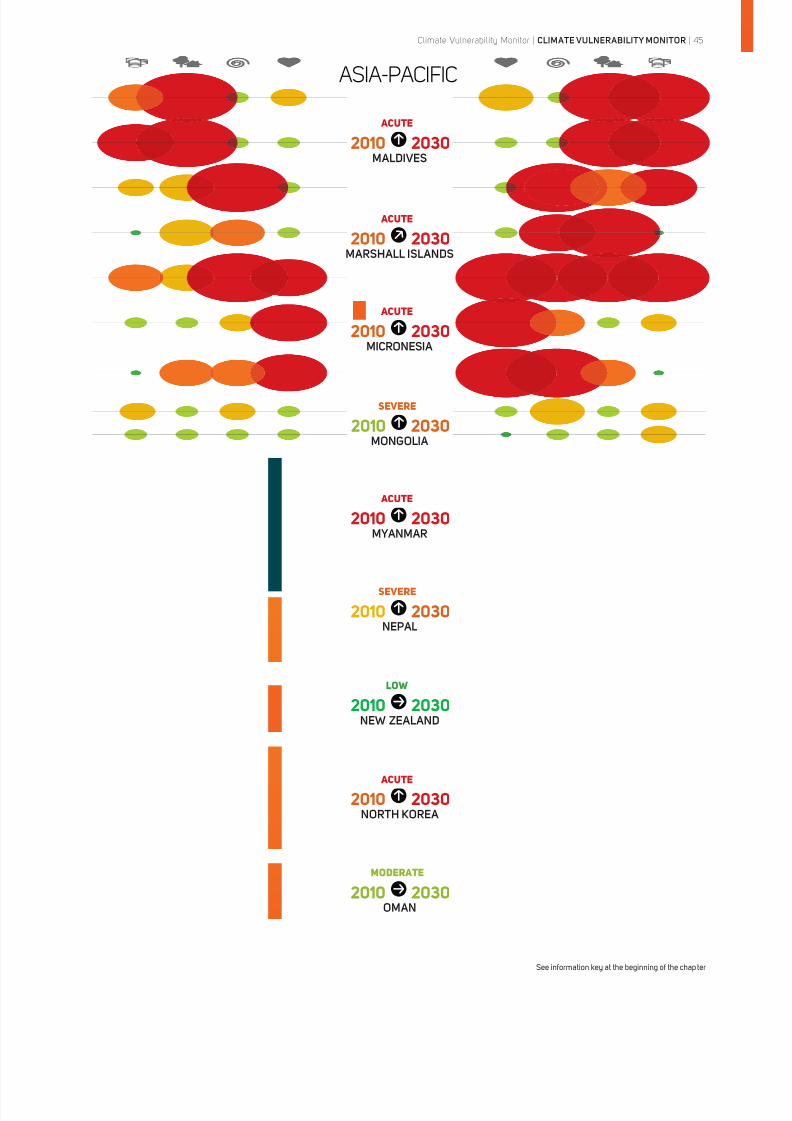
8/8/2019 Climate Vulnerability Monitor 2010: The State of the Climate Crisis
http://slidepdf.com/reader/full/climate-vulnerability-monitor-2010-the-state-of-the-climate-crisis 47/291
Climate Vulnerability Monitor | CLIMATE VULNERABILITY MONITOR | 45
2010 2030MALDIVES
2010 2030MARSHALL ISLANDS
2010 2030MICRONESIA
2010 2030MONGOLIA
2010 2030
MYANMAR
2010 2030NEPAL
2010
2030NEW ZEALAND
2010 2030NORTH KOREA
2010 2030OMAN
ASIA-PACIFIC
See information key at the beginning of the chap ter
ACUTE
ACUTE
ACUTE
SEVERE
ACUTE
SEVERE
LOW
ACUTE
MODERATE
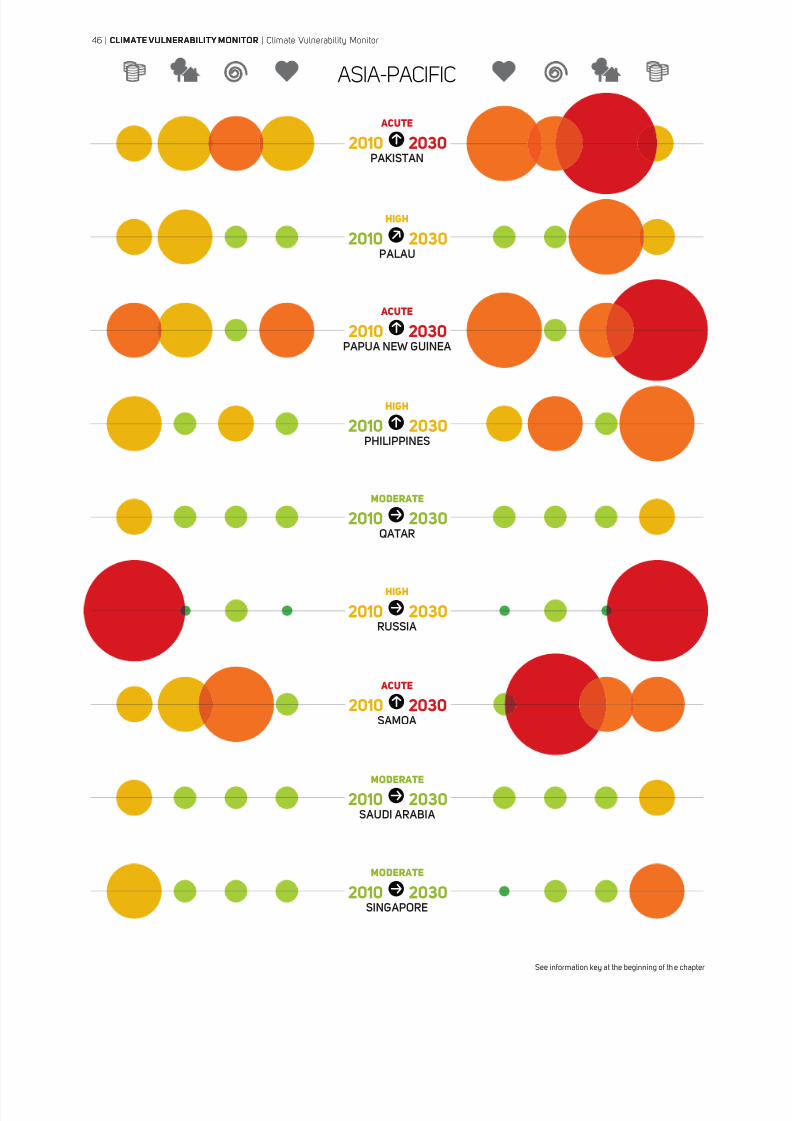
8/8/2019 Climate Vulnerability Monitor 2010: The State of the Climate Crisis
http://slidepdf.com/reader/full/climate-vulnerability-monitor-2010-the-state-of-the-climate-crisis 48/291
46 | CLIMATE VULNERABILITY MONITOR | Climate Vulnerability Monitor
2010 2030PAKISTAN
2010 2030PALAU
2010 2030PAPUA NEW GUINEA
2010 2030PHILIPPINES
2010 2030
QATAR
2010 2030RUSSIA
2010
2030SAMOA
2010 2030SAUDI ARABIA
2010 2030SINGAPORE
46 | CLIMATE VULNERABILITY MONITOR | Climate Vulnerability Monitor
ASIA-PACIFIC
See information key at the beginning of the chapter
ACUTE
HIGH
ACUTE
HIGH
MODERATE
HIGH
ACUTE
MODERATE
MODERATE
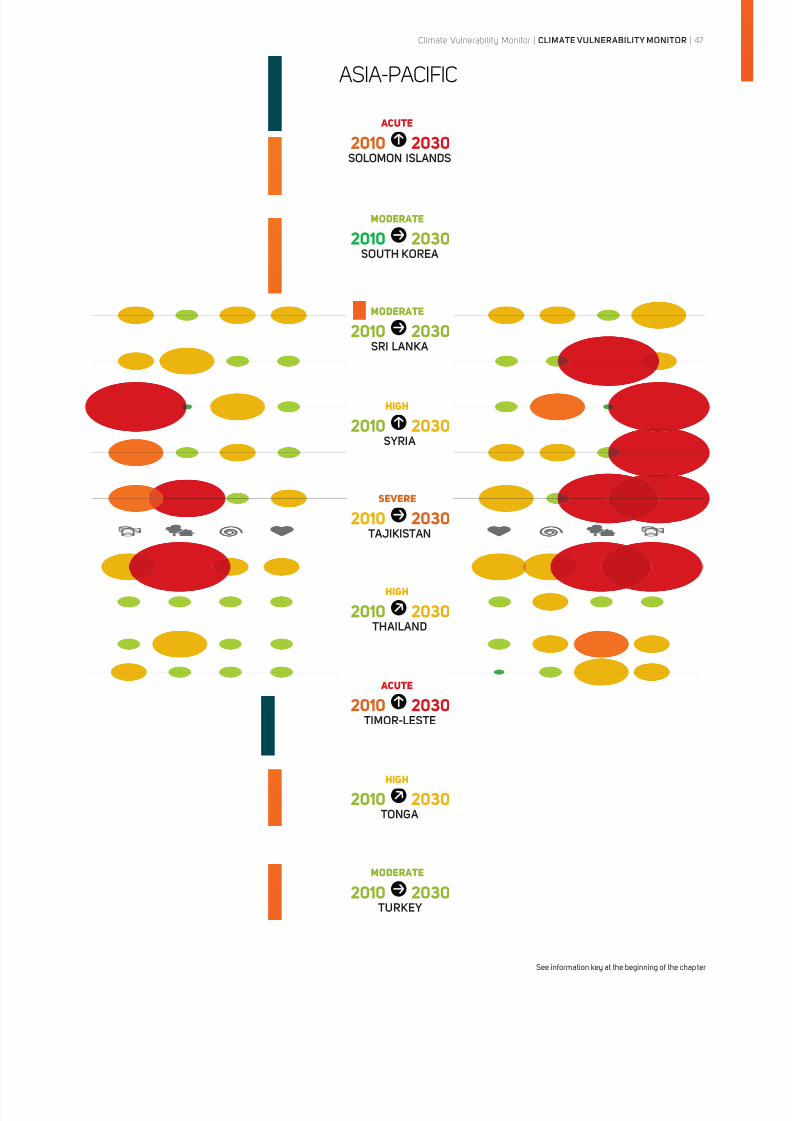
8/8/2019 Climate Vulnerability Monitor 2010: The State of the Climate Crisis
http://slidepdf.com/reader/full/climate-vulnerability-monitor-2010-the-state-of-the-climate-crisis 49/291
Climate Vulnerability Monitor | CLIMATE VULNERABILITY MONITOR | 47
2010 2030SOLOMON ISLANDS
2010 2030SOUTH KOREA
2010 2030SRI LANKA
2010 2030SYRIA
2010 2030
TAJIKISTAN
2010 2030 THAILAND
2010
2030 TIMOR-LESTE
2010 2030 TONGA
2010 2030 TURKEY
ASIA-PACIFIC
See information key at the beginning of the chap ter
ACUTE
MODERATE
MODERATE
HIGH
SEVERE
HIGH
ACUTE
HIGH
MODERATE
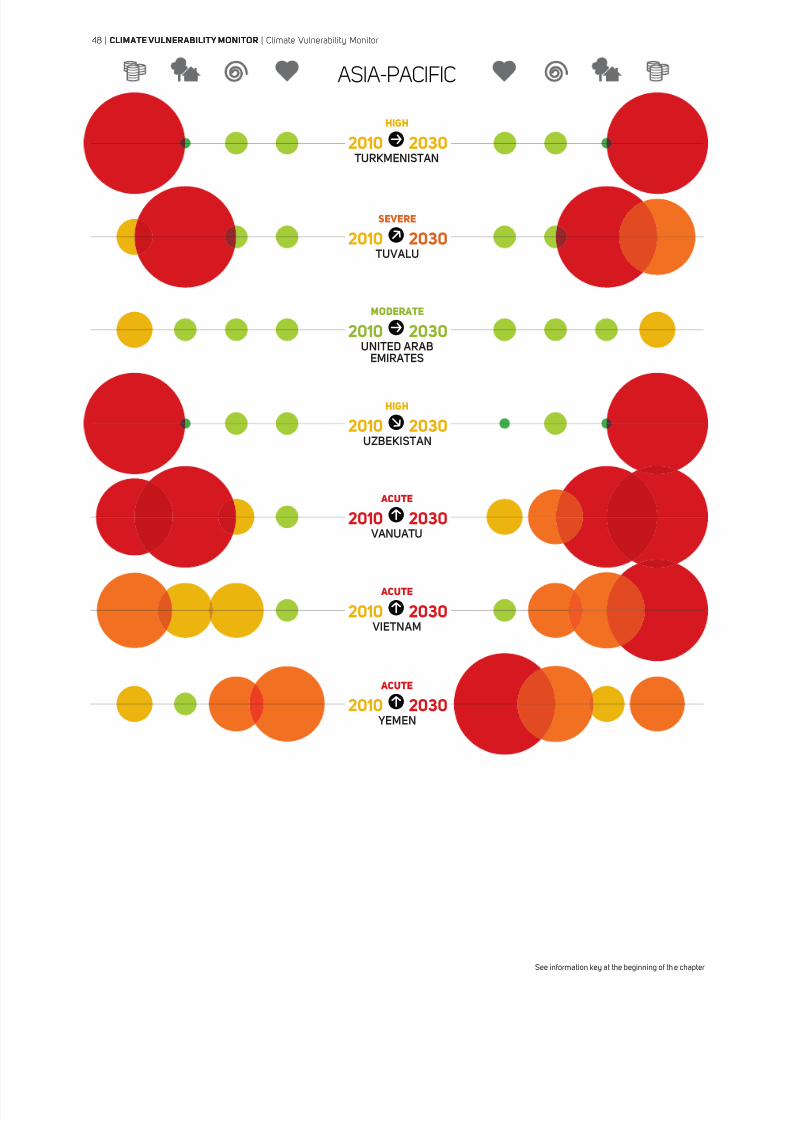
8/8/2019 Climate Vulnerability Monitor 2010: The State of the Climate Crisis
http://slidepdf.com/reader/full/climate-vulnerability-monitor-2010-the-state-of-the-climate-crisis 50/291
48 | CLIMATE VULNERABILITY MONITOR | Climate Vulnerability Monitor
2010 2030 TURKMENISTAN
2010 2030 TUVALU
2010 2030UNITED ARAB
EMIRATES
2010 2030UZBEKISTAN
2010 2030
VANUATU
2010 2030 VIETNAM
2010
2030 YEMEN
48 | CLIMATE VULNERABILITY MONITOR | Climate Vulnerability Monitor
ASIA-PACIFIC
See information key at the beginning of the chapter
HIGH
SEVERE
MODERATE
HIGH
ACUTE
ACUTE
ACUTE
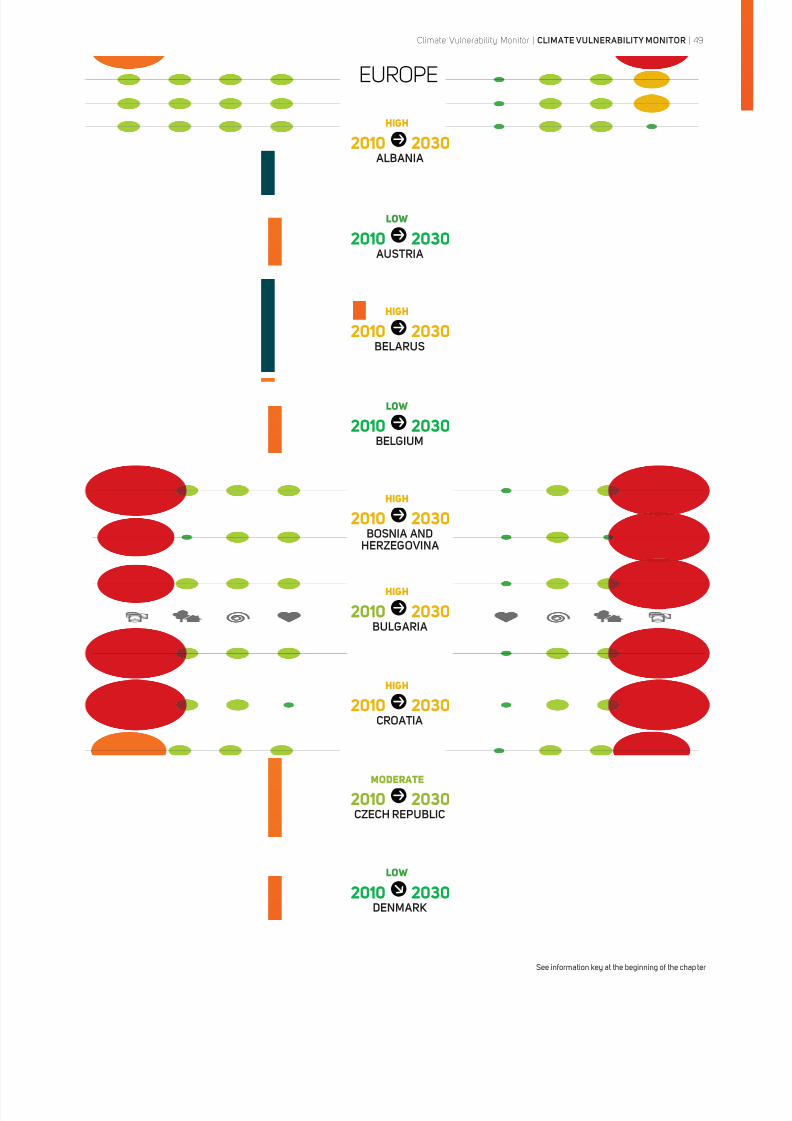
8/8/2019 Climate Vulnerability Monitor 2010: The State of the Climate Crisis
http://slidepdf.com/reader/full/climate-vulnerability-monitor-2010-the-state-of-the-climate-crisis 51/291
Climate Vulnerability Monitor | CLIMATE VULNERABILITY MONITOR | 49
2010 2030 ALBANIA
2010 2030 AUSTRIA
2010 2030BELARUS
2010 2030BELGIUM
2010 2030
BOSNIA ANDHERZEGOVINA
2010 2030BULGARIA
2010
2030CROATIA
2010 2030CZECH REPUBLIC
2010 2030DENMARK
EUROPE
See information key at the beginning of the chap ter
HIGH
LOW
HIGH
LOW
HIGH
HIGH
HIGH
MODERATE
LOW
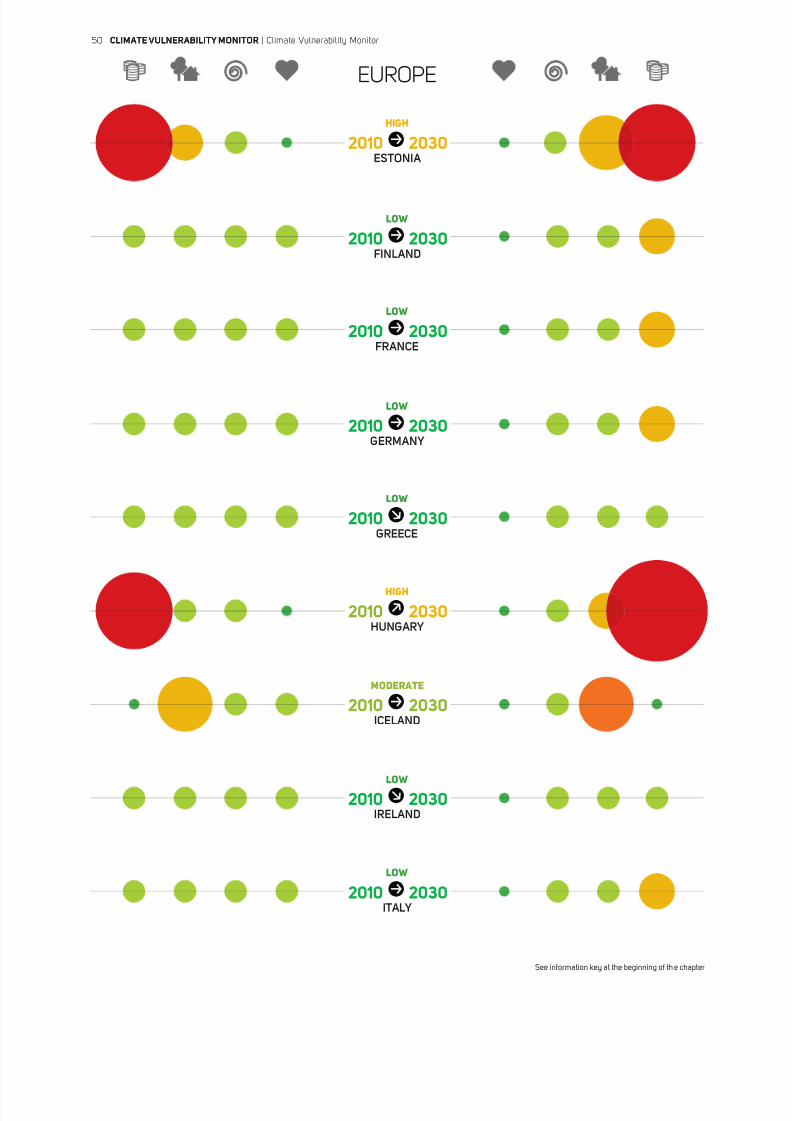
8/8/2019 Climate Vulnerability Monitor 2010: The State of the Climate Crisis
http://slidepdf.com/reader/full/climate-vulnerability-monitor-2010-the-state-of-the-climate-crisis 52/291
50 | CLIMATE VULNERABILITY MONITOR | Climate Vulnerability Monitor
2010 2030ESTONIA
2010 2030FINLAND
2010 2030FRANCE
2010 2030GERMANY
2010 2030
GREECE
2010 2030HUNGARY
2010
2030ICELAND
2010 2030IRELAND
2010 2030ITALY
50 | CLIMATE VULNERABILITY MONITOR | Climate Vulnerability Monitor
EUROPE
See information key at the beginning of the chapter
HIGH
LOW
LOW
LOW
LOW
HIGH
MODERATE
LOW
LOW
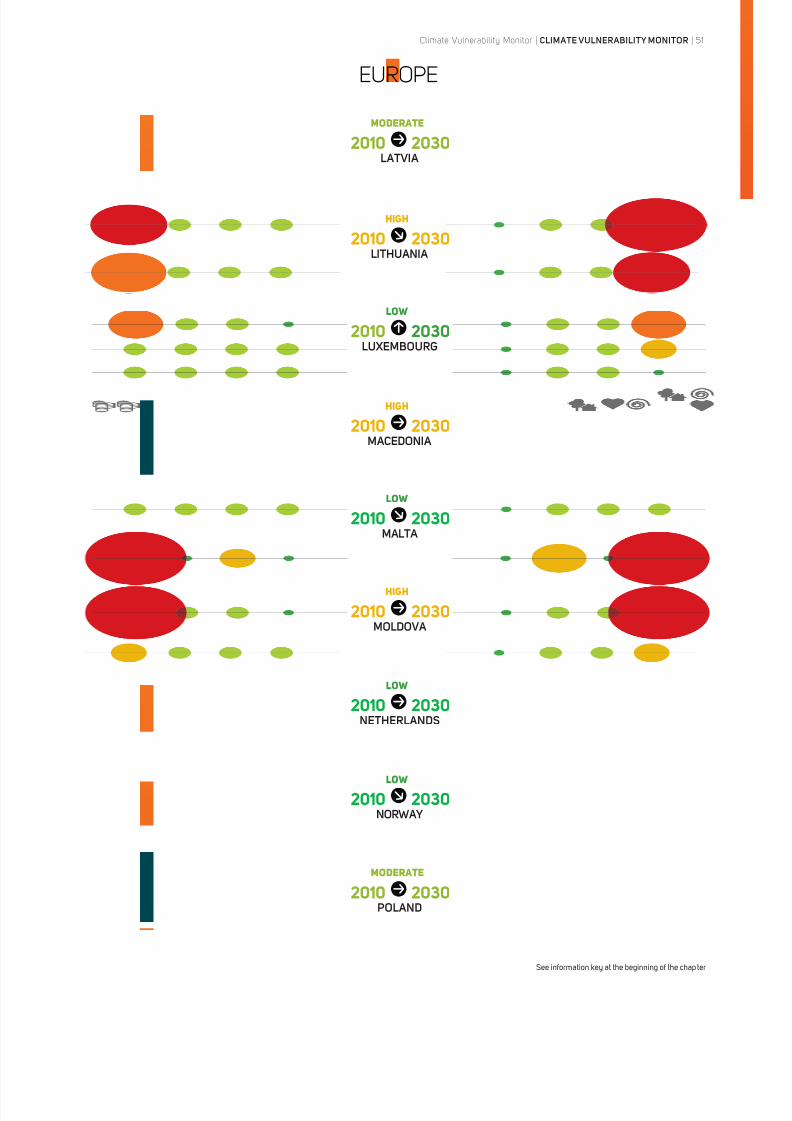
8/8/2019 Climate Vulnerability Monitor 2010: The State of the Climate Crisis
http://slidepdf.com/reader/full/climate-vulnerability-monitor-2010-the-state-of-the-climate-crisis 53/291
Climate Vulnerability Monitor | CLIMATE VULNERABILITY MONITOR | 51
2010 2030LATVIA
2010 2030LITHUANIA
2010 2030LUXEMBOURG
2010 2030MACEDONIA
2010 2030
MALTA
2010 2030MOLDOVA
2010
2030NETHERLANDS
2010 2030NORWAY
2010 2030POLAND
EUROPE
See information key at the beginning of the chap ter
MODERATE
HIGH
LOW
HIGH
LOW
HIGH
LOW
LOW
MODERATE
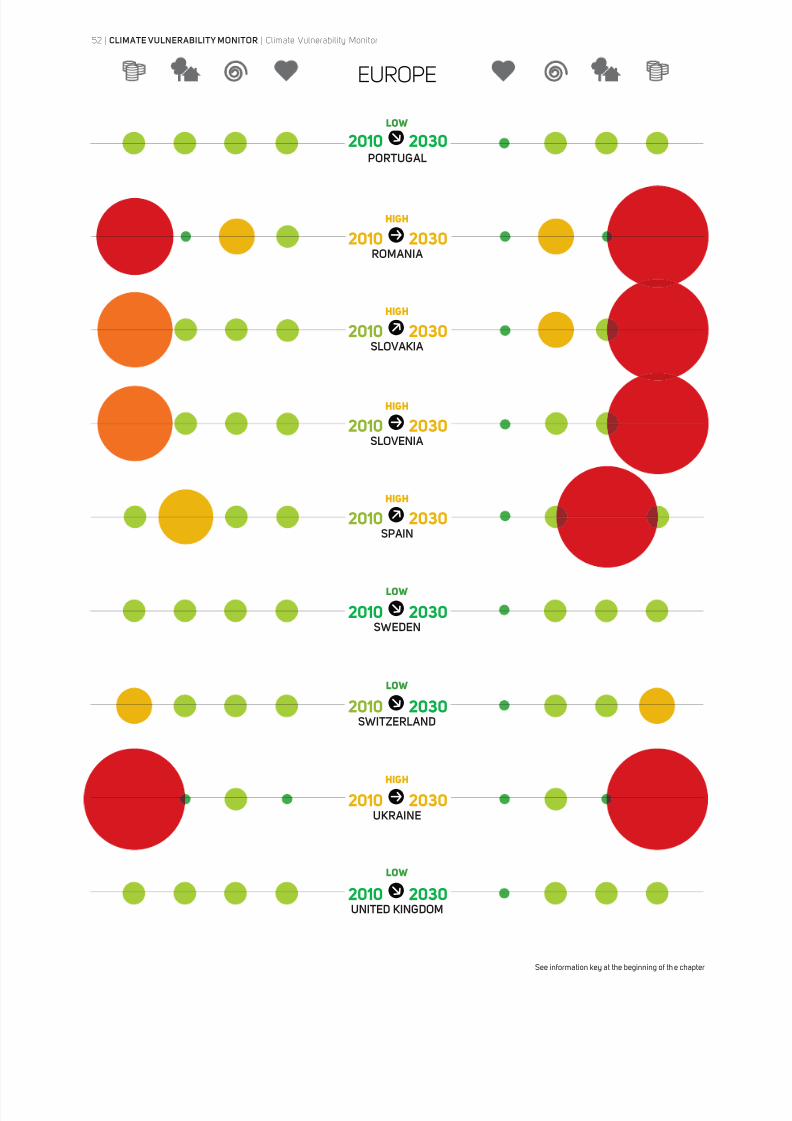
8/8/2019 Climate Vulnerability Monitor 2010: The State of the Climate Crisis
http://slidepdf.com/reader/full/climate-vulnerability-monitor-2010-the-state-of-the-climate-crisis 54/291
2010 2030PORTUGAL
2010 2030ROMANIA
2010 2030SLOVAKIA
2010 2030SLOVENIA
2010 2030
SPAIN
2010 2030SWEDEN
2010
2030SWITZERLAND
2010 2030UKRAINE
2010 2030UNITED KINGDOM
52 | CLIMATE VULNERABILITY MONITOR | Climate Vulnerability Monitor
EUROPE
See information key at the beginning of the chapter
LOW
HIGH
HIGH
HIGH
HIGH
LOW
LOW
HIGH
LOW
8/8/2019 Climate Vulnerability Monitor 2010: The State of the Climate Crisis
http://slidepdf.com/reader/full/climate-vulnerability-monitor-2010-the-state-of-the-climate-crisis 55/291
Climate Vulnerability Monitor | CLIMATE VULNERABILITY MONITOR | 53
WHAT IS THE MONITOR?
HOW THE MONITOR WORKS
The Climate Vulnerability Monitor assesses
the impact of climate change on 184 countries
based on leading research. The impacts
highlight where vulnerabilities to climate change
lie. The Monitor measures effects across four
main areas: Health Impact (deaths due to
climate-sensitive diseases), Weather Disasters
(deaths and damage caused by storms, floods,
and wildfires), Habitat Loss (populations at
risk to desertification and sea-level rise), and
Economic Stress (industry and asset losses).
The Monitor combines the four main areas
of impact and determines an overall factor
of vulnerability, which is meant to be purely
illustrative of the extent to which a given
country is suffering from multiple climate
stresses. Every country in the world thereby
has its climate vulnerability profile assessed
via the same set methodology. The Monitor
recognizes five vulnerability levels, called
“factors”: Low, Moderate, High, Severe, and
Acute. Factors give an indication of how
vulnerable a country is to the effects of climate
change in each of the impact areas, and
overall. The Monitor provides factors overall
and for today, in the year 2010, and in the near
future, for the year 2030.
DESIGNED TOISOLATE KEY IMPACTSMost existing indices of climate vulnerability
employ some combination of socio-economic
capacity set against meteorological and/or
hydrological change.9 The Monitor does not focus
directly on capacity, nor in most cases directly
on climate variables, since these in themselvesdo not pinpoint any impacts as they might occur,
such as mortality linked to climate-sensitive
diseases, or desertification aggravated by local
climate shifts. So they have limited usefulness
for targeting actual responses. The Monitor was
developed to understand and highlight climate
vulnerability in a way that could aid in the design
of actions to avert harm to communities.
The Monitor identified four main types of impacts
across the different areas of vulnerability that it
assesses. These areas were chosen over others
for various reasons. One, since each represents a
distinct set of stresses that can be isolated fromone another. A country like Rwanda, for instance,
could have serious health impacts but suffer no
marked desertification or sea-level rise impact,
and it is not affected by tropical cyclones or major
floods due to glacial melt. Two, since for each
of the different impact areas, we also outline
distinct types of measures that can be taken to
reduce the negative effects. And three, because
each of the main elements of the four different
impact areas included data sets of globally
available information and in many cases models
that already existed estimating the relationship
between the underlying variable and climatechange. As a result though, the Monitor is not
fully comprehensive in that certain impacts are
excluded. Some of the measurements are also
restricted in the information they provide -- such
as mortality only in extreme weather as opposed
to numbers of people affected or displaced -- so
impact estimates should be treated as indicators
of a wider problem.
Many countries also register severe impacts
across a range of categories. Eritrea for
instance, suffers both sea-level rise impactsand desertification and is highly vulnerable to
the health impacts of climate change. These are
multiple-stress countries, where several impacts
are brought to bear in one place, seriously
compounding one another. We have included
an overall vulnerability factor for each country,
since it captures a sense of these multiple
stresses. However, the overall factor has been
compiled with an even weighting from across the
four impact areas. Fair arguments could well be
made in favour of, for example, a much higher
weighting for impact areas where human lives
are at stake. Elsewhere, countries with very high
vulnerability in just one impact area may feelde-prioritized, or that the rigid split is prescriptive
in terms of existing national strategies. As such,
the overall vulnerability factor should not be used
for planning purposes or to prioritize responses.
Responses need to focus on tackling vulnerability
as highlighted in the individual impact areas.
The overall vulnerability level referred to in the
report is based on 2030, since while information
THE MONITOR WAS DEVELOPED TOUNDERSTAND AND HIGHLIGHT CLIMATEVULNERABILITY IN A WAY THAT COULDAID IN THE DESIGN OF ACTIONS TOAVERT HARM TO COMMUNITIES
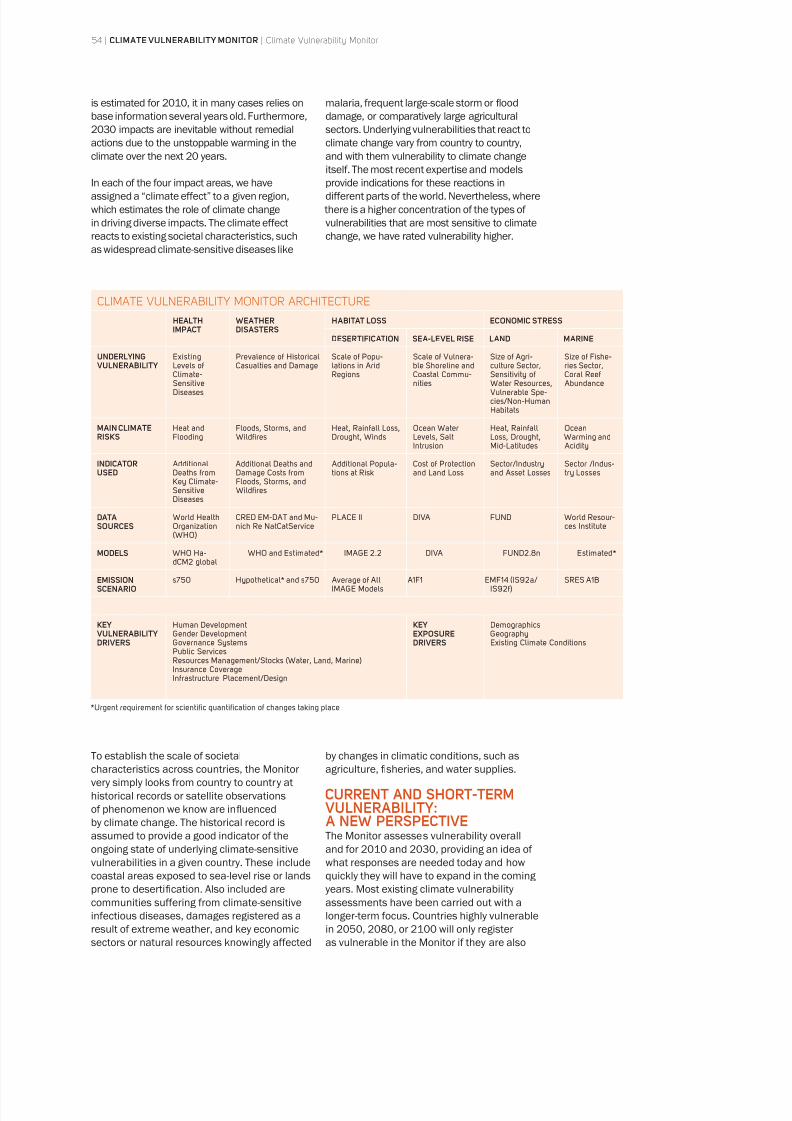
8/8/2019 Climate Vulnerability Monitor 2010: The State of the Climate Crisis
http://slidepdf.com/reader/full/climate-vulnerability-monitor-2010-the-state-of-the-climate-crisis 56/291
54 | CLIMATE VULNERABILITY MONITOR | Climate Vulnerability Monitor
is estimated for 2010, it in many cases relies on
base information several years old. Furthermore,
2030 impacts are inevitable without remedial
actions due to the unstoppable warming in the
climate over the next 20 years.
In each of the four impact areas, we have
assigned a “climate effect” to a given region,
which estimates the role of climate change
in driving diverse impacts. The climate effect
reacts to existing societal characteristics, such
as widespread climate-sensitive diseases like
malaria, frequent large-scale storm or flood
damage, or comparatively large agricultural
sectors. Underlying vulnerabilities that react to
climate change vary from country to country,
and with them vulnerability to climate change
itself. The most recent expertise and models
provide indications for these reactions in
different parts of the world. Nevertheless, where
there is a higher concentration of the types of
vulnerabilities that are most sensitive to climate
change, we have rated vulnerability higher.
To establish the scale of societal
characteristics across countries, the Monitor
very simply looks from country to country at
historical records or satellite observations
of phenomenon we know are influenced
by climate change. The historical record is
assumed to provide a good indicator of the
ongoing state of underlying climate-sensitive
vulnerabilities in a given country. These include
coastal areas exposed to sea-level rise or lands
prone to desertification. Also included arecommunities suffering from climate-sensitive
infectious diseases, damages registered as a
result of extreme weather, and key economic
sectors or natural resources knowingly affected
by changes in climatic conditions, such as
agriculture, fisheries, and water supplies.
CURRENT AND SHORT-TERM VULNERABILITY: A NEW PERSPECTIVEThe Monitor assesses vulnerability overall
and for 2010 and 2030, providing an idea of
what responses are needed today and how
quickly they will have to expand in the coming
years. Most existing climate vulnerabilityassessments have been carried out with a
longer-term focus. Countries highly vulnerable
in 2050, 2080, or 2100 will only register
as vulnerable in the Monitor if they are also
CLIMATE VULNERABILITY MONITOR ARCHITECTURE
HEALTHIMPACT
WEATHERDISASTERS
HABITAT LOSS ECONOMIC STRESS
DESERTIFICATION SEA-LEVEL RISE LAND MARINE
UNDERLYING VULNERABILITY
ExistingLevels ofClimate-SensitiveDiseases
Prevalence of HistoricalCasualties and Damage
Scale of Popu-lations in AridRegions
Scale of Vulnera-ble Shoreline andCoastal Commu-nities
Size of Agri-culture Sector,Sensitivity of Water Resources, Vulnerable Spe-cies/Non-HumanHabitats
Size of Fishe-ries Sector,Coral Reef Abundance
MAIN CLIMATERISKS
Heat andFlooding
Floods, Storms, and Wildfires
Heat, Rainfall Loss,Drought, Winds
Ocean WaterLevels, SaltIntrusion
Heat, RainfallLoss, Drought,Mid-Latitudes
Ocean Warming and Acidity
INDICATORUSED
AdditionalDeaths fromKey Climate-SensitiveDiseases
Additional Deaths andDamage Costs fromFloods, Storms, and Wildfires
Additional Popula-tions at Risk
Cost of Protectionand Land Loss
Sector/Industryand Asset Losses
Sector /Indus-try Losses
DATASOURCES
World HealthOrganization
(WHO)
CRED EM-DAT and Mu-nich Re NatCatService
PLACE II DIVA FUND World Resour-ces Institute
MODELS WHO Ha-dCM2 global
WHO and Estimated* IMAGE 2.2 DIVA FUND2.8n Estimated*
EMISSIONSCENARIO
s750 Hypothetical* and s750 Average of AllIMAGE Models
A1F1 EMF14 (IS92a/IS92f)
SRES A1B
KEY VULNERABILITYDRIVERS
Human DevelopmentGender DevelopmentGovernance SystemsPublic ServicesResources Management/Stocks (Water, Land, Marine)Insurance CoverageInfrastructure Placement/Design
KEYEXPOSUREDRIVERS
DemographicsGeographyExisting Climate Conditions
*Urgent requirement for scientific quantification of changes taking place
8/8/2019 Climate Vulnerability Monitor 2010: The State of the Climate Crisis
http://slidepdf.com/reader/full/climate-vulnerability-monitor-2010-the-state-of-the-climate-crisis 57/291
Climate Vulnerability Monitor | CLIMATE VULNERABILITY MONITOR | 55
expected to be exposed to climate shocks
in the very near term. Since many countries
have already begun to familiarize themselves
with their own vulnerabilities on the basis of
longer time scales, they may well be surprised
when viewing that vulnerability on a much
shorter time horizon. Some parts of Africa
and the Americas, for example, may benefi t
from increased rainfall in the short term.10 In
other instances, countries that would have
high vulnerability at the end of the twenty-first
century are not the same as those countries
with a high vulnerability today. Sea-level rise,
for instance, is now slightly more than 3mm,
or a fraction of an inch every year. Over 20
years, that would amount to about 7cm or 3
inches. This compares to worst scenarios of
some 200cm or 80 inches of possible sea- level
rise by the end of the century, with radically
different vulnerability and climate impactoutcomes as a result.11
Impacts have been estimated in either
economic terms, for example, as a share of
costs from, say, flood damage or losses/gains
in productive output. Or they are expressed
in human terms, such as populations under
stress due to desertification, or mortality as a
result of more severe weather or disease. The
same methodology is applied to all countries,
so the level of vulnerability ascertained is
roughly comparable from one place to another.
If some steps have already been taken to
adapt to changes -- such as disaster-reduction
measures in Bangladesh that have greatly
reduced fatalities during major storms -- a
lower vulnerability will be registered. The longer
in the past any such actions were taken and
continuously maintained, the more likely they
are to have an effect on the vulnerability factor
of the country concerned.
Not taken into account is the level of domestic/
international resources available to a country
to deal with these challenges. And so the
United States, for example, registers similarvulnerability levels to Gabon or Tonga, despite
fundamentally different degrees of capacity
available for confronting these vulnerabilities.
EFFECTS CAN ALSO BE POSITIVEClimate change does not only have a negative
impact. Agriculture, for instance, is an industry
highly vulnerable to harmful effects of climate
change. It is also an industry susceptible
to the positive influences of that change, at
least in the medium term, and depending on
a country’s location and other key variables.
Many countries, for example, near the equator,who receive less rain and have rocketing
heat stress, are seeing crop and livestock
productivity decline. Whereas countries farther
north or south, that are receiving more rainfall
and experiencing longer growing seasons are
likely already reaping benefi ts of improved
productivity.
In all cases, the possible negative and positive
effects are weighed together and given an
impact level, either negative or positive. A
vulnerability factor is then derived for each
impact area based on the relative level of
impacts ascertained for different countries.The factors themselves are created via a
statistical normalization.
Higher factors of vulnerability are further
away from the value where no harmful climate
effect at all is perceptible. A factor of Acute
+ generally equates to three orders removed
-- or mean average deviations -- from the
baseline of no climate impacts.12 A factor of
Low means no perceptible vulnerability to the
negative impacts of climate change. But many
countries with a factor of Low vulnerability
may well be reaping net benefi
ts in certainareas. The degree of benefi ts is not recognized
by the vulnerability factor, because from the
moment impacts are neutral or positive they
are no longer a vulnerability concern. Impact
levels across the different indicators -- be they
additional deaths or otherwise -- are given at
the global and regional level and at national
levels in various points, in particular in the
country profiles also found in this report.
Countries with higher vulnerability factors do
exhibit higher levels of impacts and typically
require correspondingly greater attention in
order to reduce those impacts. A country with afactor of Low will typically require no measures,
since no negative effects are registered. A
country with a factor of Moderate will typically
require that certain measures be taken in order
not to receive a negative impact. A factor of
Acute may require many more times the scale
of measures in order to prevent orders
MANY COUNTRIES HAVE ALREADY BEGUN TOFAMILIARIZE THEMSELVES WITH THEIR OWNVULNERABILITIES ON THE BASIS OF LONGERTIME SCALES, THEY MAY WELL BE SURPRISEDWHEN VIEWING THAT VULNERABILITY ON AMUCH SHORTER TIME HORIZON
THE UNITED STATES, FOR EXAMPLE,REGISTERS SIMILAR VULNERABILITYLEVELS TO GABON OR TONGA,DESPITE FUNDAMENTALLY DIFFERENTDEGREES OF CAPACITY AVAILABLE FORCONFRONTING THESE VULNERABILITIES
8/8/2019 Climate Vulnerability Monitor 2010: The State of the Climate Crisis
http://slidepdf.com/reader/full/climate-vulnerability-monitor-2010-the-state-of-the-climate-crisis 58/291
56 | CLIMATE VULNERABILITY MONITOR | Climate Vulnerability Monitor
of magnitude of impacts several times higher
than for lower factors of vulnerability. Any
country with a factor above Moderate is dealing
with an unacceptable level of vulnerability,
since cost-effective measures exist to reduce
negative climate impacts and therefore
minimize the vulnerability also.
Cost-effective measures are listed in the
Adaptation Performance Review in this report
and give an idea of the relationship between
preventative investments and the losses
indicated in the Monitor, which they aim to
minimize. Measures aimed at reducing loss of
life due to health impacts of climate change
are particularly cost effective. Measures aimed
at reducing impacts to human habitats and
economic stresses are, on average, more
costly to implement but still carry high benefi ts
in many cases.
UNCERTAINTY AND RESPONSEThe accuracy of the Monitor does have its
limitations. Estimates of impacts can be
higher or lower, and the figures included
here should be considered a robust set of
possible outcomes around which planning
and responses can be developed. Given clear
indications of danger, responses cannot be
delayed any longer because of an absence of
complete scientific certainty.
In reality, these uncertainties mean, forexample, that a country could easily have
one full factor of vulnerability higher or lower
than stated here. So a country with a factor of
Severe could quite possibly have either a factor
of Acute or High. That would be well within the
margins of error involved in this work. While the
Monitor bases itself to the extent possible on
recent historical records of impact, all 2010
and 2030 values are estimates.
Within the uncertainty however, it is very
unlikely that a country with a factor of Acute
or Severe could in reality have a factor of
Moderate or Low. Countries should, therefore,
at a minimum be prepared for a level of impact
corresponding to its assigned factor. But
prudent planning would dictate a response
commensurate to one factor higher than
that assigned here, particularly if there is a
probability of lives being at stake. Countries
with the highest factor of Acute require specialattention, since they most likely exceed by
far any acceptable level of vulnerability and
will necessitate correspondingly extreme
measures in order to minimize harm done.
In the different impact areas, for the factors
of High, Severe, and Acute we have also used
two sub-factors “+” or “-”, so, for example,
“Acute+” or “Acute-”. This indicates whether
a country is in the first/bottom or second/
top half within a given factor. “+” factors are
more likely to fall into a higher category than
“-” factors, and vice versa. Since the Monitor’sfocus is to offer guidance on the countries
that are facing serious impacts, Moderate and
Low vulnerability factors have not been given
sub-factors.
The Methodology section in the end matter of
this report provides a fuller explanation of all
aspects of the Monitor and its many indicators.
ANY COUNTRY WITH A FACTORABOVE MODERATE IS DEALINGWITH AN UNACCEPTABLE LEVEL OFVULNERABILITY, SINCE COST-EFFECTIVE
MEASURES EXIST TO REDUCENEGATIVE CLIMATE IMPACTS
THE NATION-STATE UNIT OF
ANALYSIS SHOULD NOT DETRACTFROM THE MONITOR’S INSISTENCEON PEOPLE AND COMMUNITIES ASAN ORGANIZING CONCEPT
LIMITATIONS
Aside from basic uncertainties, limitations
are evident in a number of other respects. For
one, climate and nation state rarely match
up. Desertification or sea-level rise may only
be felt in one small part of a country. Or some
highland areas could benefi t from longer
growing seasons or more rainfall, while other
parts of a country are scorched or parched.
These effects are, of course, averaged across the Monitor, which uses countries as its unit
of analysis because of data availability (health
statistics, for instance, are mainly national)
and because governments are expected
to lead much of the response to climate
change. However, the nation-state unit of
analysis should not detract from the Monitor’s
insistence on people and communities as an
8/8/2019 Climate Vulnerability Monitor 2010: The State of the Climate Crisis
http://slidepdf.com/reader/full/climate-vulnerability-monitor-2010-the-state-of-the-climate-crisis 59/291
Climate Vulnerability Monitor | CLIMATE VULNERABILITY MONITOR | 57
MANY YEARS WORTH OFIMPACTS COULD OCCURIN LESS THAN 24 HOURS
organizing concept that takes its cue from the
2009 Global Humanitarian Forum publication,
The Anatomy of A Silent Crisis, which
strongly articulated the underappreciated
human dimensions of climate change and
vulnerability to it.13
In many cases, such as for extreme weather,
this report relies on estimates based on
observational increases in storms or floods.
But a five-percent increase in weather may
be all the difference between a disaster and
none at all -- i f, for example, the capacity
of a community to withstand the impact is
overwhelmed by the seemingly small additional
increase. In the areas of extreme weather,
fisheries, and other fields not included here,
such as infection rates for key climate-sensitive
diseases, there is yet to be any sound scientific
attribution quantifying a possible aggravating effect due to climate change. Despite the
dif ficulties of establishing detailed climate
role attributions, these are nevertheless vital
to the development of any sound responses
to possible impacts and are urgent research
demands requiring much greater attention.
A number of decisions have been made to
exclude indicators so that assessment of
vulnerability is as consistent as possible from
one country to another. Indications of mortality
due to health problems or extreme weather are
relied on, for example, but rates of infection,people in need of assistance (“affected”),
people displaced, and people injured are not.
Reporting of the excluded indicators varies
widely around the world and might lead to
underestimating the comparative vulnerability
of some countries. But mortality only gives a
proxy for the true extent of the health impact,
where tens of thousands of people might be
infected. Likewise, the number of deaths due
to a storm or flood give no clear indication
of how many people – sometimes millions –
might be in need of assistance or temporary or
permanent housing.
In the same way, since the Monitor gives scales
of impacts averaged over the course of one
year, it does not provide an idea of how a large
problem might have been in a very short space
of time. This is less of a problem when we
look at generalized economic stresses, losses
in human habitat, or certain health effects.
The numbers could be quite misleading with
respect to extreme weather, when many years
worth of impacts could occur in less than 24
hours. Or impacts that the Monitor provides
as averages per year may not even occur in a
given country during one year or even severalyears. For this reason, a series of Peak Impacts
are given within each of the main Monitor
impact area sections. While there is no clear
indication or inference that these events are
attributable to climate change to any degree,
they do provide an indication of how severe
some climate-related phenomenon can
become.
While the impact areas included in the Monitor
were chosen for their ability to capture a wide
picture of vulnerability. Many effects have not
been touched on here, primarily because little
research was available to draw upon in order to
quantify a meaningful relationship with climate
change. Impacts on sectors of the economy
other than agriculture, for example, such as
the tourism or transportation industries, have
not been taken into account. Climate-related
displacement or migration is only dealt with
indirectly in relation to sea-level rise and
desertification. Conflict and security issues
are not touched on at all because of the very
preliminary nature of that debate, despite the fact that almost all ongoing conflicts are
occurring in countries highly vulnerable to
climate change, and the fact that fragile states
dominate the ranks of the most vulnerable.14
A more detailed account of research gaps that
affect the accuracy and breadth of this report
and the Monitor is included in the end matter.
It is primarily for this reason that we believe the
Monitor most likely underestimates the scale
of the impact of climate change on human
society.
The chosen data can also be an issue.Venezuela, for example, registers 30,000
deaths in the main global disaster database
for the 1999 Vargas flood tragedy. But a
recent study estimates that the death toll
could not have been more than 700. Since
the Monitor assumes past scales of impact
can provide one facet of an indication of
future scales of impact, where climate change
will play a small aggravating role, such a
discrepancy would artificially inflate the
climate vulnerability of a country.
Finally, the climate models used to support
the Monitor have been chosen for closecomparability, but not all follow precisely the
same future emissions or climate scenario and
the base years used by models also varies.
Some of these issues are minimized by the fact
that the Monitor only assesses vulnerability
for 2010 and 2030. On longer time horizons,
different emission and climate scenarios could
have wildly dissimilar results.
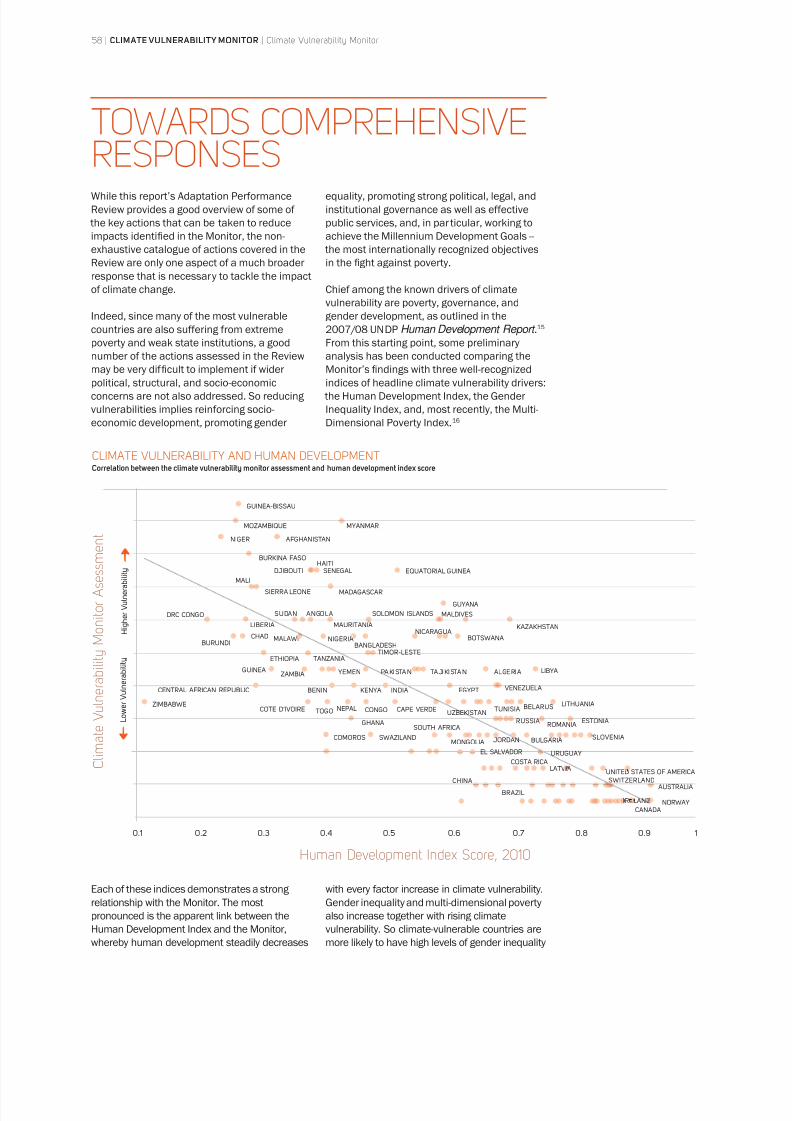
8/8/2019 Climate Vulnerability Monitor 2010: The State of the Climate Crisis
http://slidepdf.com/reader/full/climate-vulnerability-monitor-2010-the-state-of-the-climate-crisis 60/291
58 | CLIMATE VULNERABILITY MONITOR | Climate Vulnerability Monitor
While this report’s Adaptation Performance
Review provides a good overview of some of
the key actions that can be taken to reduce
impacts identified in the Monitor, the non-
exhaustive catalogue of actions covered in the
Review are only one aspect of a much broader
response that is necessary to tackle the impact
of climate change.
Indeed, since many of the most vulnerable
countries are also suffering from extreme
poverty and weak state institutions, a good
number of the actions assessed in the Reviewmay be very dif ficult to implement if wider
political, structural, and socio-economic
concerns are not also addressed. So reducing
vulnerabilities implies reinforcing socio-
economic development, promoting gender
equality, promoting strong political, legal, and
institutional governance as well as effective
public services, and, in par ticular, working to
achieve the Millennium Development Goals --
the most internationally recognized objectives
in the fight against poverty.
Chief among the known drivers of climate
vulnerability are poverty, governance, and
gender development, as outlined in the
2007/08 UNDP Human Development Report .15
From this starting point, some preliminary
analysis has been conducted comparing theMonitor’s findings with three well-recognized
indices of headline climate vulnerability drivers:
the Human Development Index, the Gender
Inequality Index, and, most recently, the Multi-
Dimensional Poverty Index.16
TOWARDS COMPREHENSIVERESPONSES
0.1
H i g h e r V u l n e r a b i l i t y
L o w
e r V u l n e r a b i l i t y
C l i m a t e V u
l n e r a b i l i t y M o n i t o r A s e s s m e n t
GUINEA-BISSAU
MOZAMBIQUE
NIGER AFGHANISTAN
BURKINA FASOHAITI
SENEGAL EQUATORIAL GUINEADJIBOUTI
MALI
SIERRA LEONE MADAGASCAR
GUYANA
KAZAKHSTAN
BOTSWANA
NICARAGUA
SUDAN ANGOLA
MAURITANIALIBERIA
BURUNDI
CENTRAL AFRICAN REPUBLIC
COTE D’IVOIRE
ETHIOPIA
GUINEAZAMBIA YEMEN
INDIAKENYA
NEPAL CONGO
GHANA
COMOROS
EL SALVADOR
COSTA RICA
LATVIA
BRAZIL
CHINA
SWAZILANDMONGOLIA JORDAN
CAPE VERDE
SOUTH AFRICA
BENIN
TOGO
PAKISTAN TAJIKISTAN ALGERIA
TUNISIA BELARUSLITHUANIA
ESTONIA
SLOVENIA
URUGUAY
SWITZERLAND
AUSTRALIA
NORWAY
CANADA
IRELAND
RUSSIA
BULGARIA
ROMANIA
VENEZUELAEGYPT
UZBEKISTAN
LIBYA
UNITED STATES OF AMERICA
TANZANIA
CHAD MALAWI NIGERIA
BANGLADESH
TIMOR-LESTE
DRC CONGO
ZIMBABWE
SOLOMON ISLANDS MALDIVES
MYANMAR
I
I
0.2 0.3 0.4 0.5 0.6 0.7
Human Development Index Score, 2010
0.8 0.9 1
Each of these indices demonstrates a strong relationship with the Monitor. The most
pronounced is the apparent link between the
Human Development Index and the Monitor,
whereby human development steadily decreases
with every factor increase in climate vulnerability.Gender inequality and multi-dimensional poverty
also increase together with rising climate
vulnerability. So climate-vulnerable countries are
more likely to have high levels of gender inequality
CLIMATE VULNERABILITY AND HUMAN DEVELOPMENTCorrelation between the climate vulnerability monitor assessment and human development index score
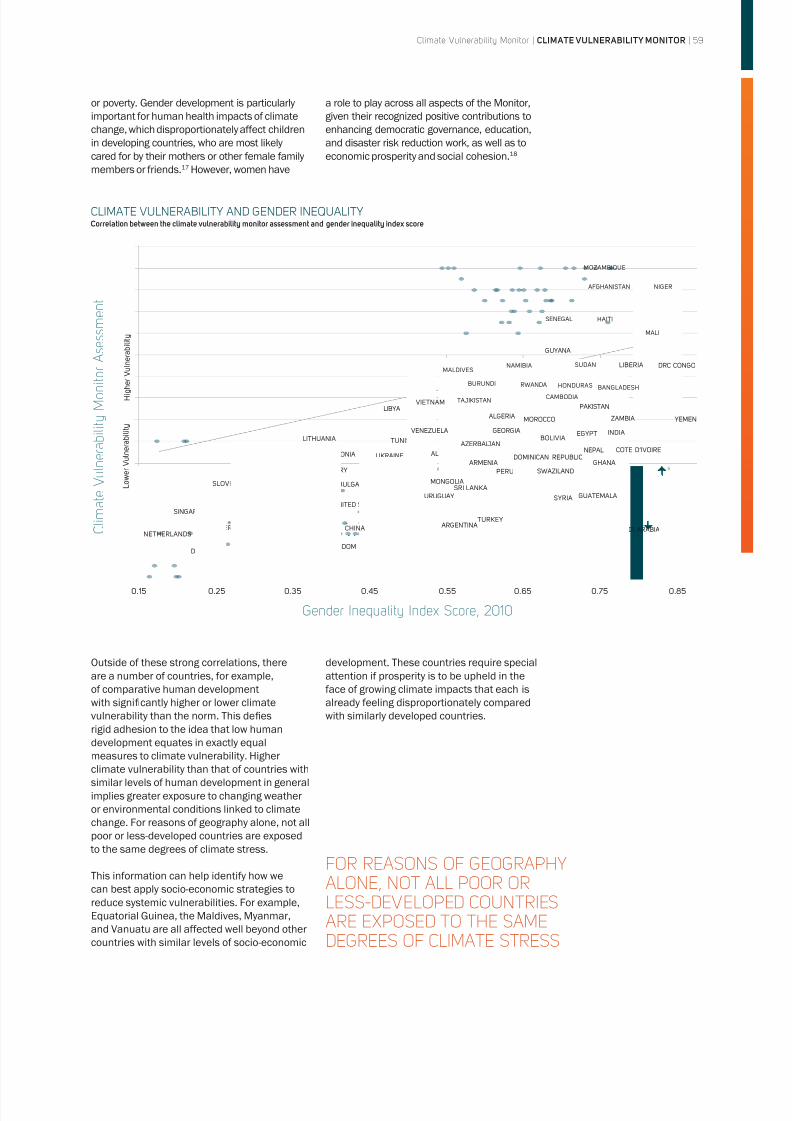
8/8/2019 Climate Vulnerability Monitor 2010: The State of the Climate Crisis
http://slidepdf.com/reader/full/climate-vulnerability-monitor-2010-the-state-of-the-climate-crisis 61/291
Climate Vulnerability Monitor | CLIMATE VULNERABILITY MONITOR | 59
C l i m a t e V u l n e r a b i l i t y M o n i t o r A s e s s m e n t
SINGAPORE
NETHERLANDS
DENMARK JAPAN
AUSTRALIASWITZERLAND
LATVIA
SLOVENIA POLAND SLOVAKIABULGARIA
UNITED STATES OF AMERICA
HUNGARY
CROATIA
ESTONIA
RUSSIA
UKRAINE
TUNISIA
ROMANIA
ALBANIA
LITHUANIA
CANADA
UNITED KINGDOM
KUWAIT
SAUDI ARABIAQATAR
IRAN
SYRIA
SWAZILAND
GUATEMALA
TURKEY ARGENTINA
URUGUAY
MONGOLIA
SRI LANKA
PERU
CHINA
VENEZUELA
LIBYA
VIETNAM TAJIKISTAN
BURUNDI
NAMIBIA
RWANDA
CAMBODIA
BANGLADESH
DRC CONGO
GUYANA
SUDAN LIBERIA
MALI
HAITISENEGAL
AFGHANISTAN
MOZAMBIQUE
NIGER
MALDIVES
AZERBAIJAN
ARMENIA
GEORGIA
MOROCCO ALGERIA
DOMINICAN REPUBLICGHANA
ZAMBIA YEMEN
HONDURAS
NEPAL
BOLIVIA
COTE D’IVOIRE
EGYPT INDIA
PAKISTAN
0.15 0.25 0.35 0.45 0.55 0.65 0.75 0.85
Gender Inequality Index Score, 2010
H i g h e r V u l n e r a b i l i t y
L o w e r V u l n e r a b i l i t y
Outside of these strong correlations, there
are a number of countries, for example,
of comparative human development
with significantly higher or lower climate
vulnerability than the norm. This defiesrigid adhesion to the idea that low human
development equates in exactly equal
measures to climate vulnerability. Higher
climate vulnerability than that of countries with
similar levels of human development in general
implies greater exposure to changing weather
or environmental conditions linked to climate
change. For reasons of geography alone, not all
poor or less-developed countries are exposed
to the same degrees of climate stress.
This information can help identify how we
can best apply socio-economic strategies toreduce systemic vulnerabilities. For example,
Equatorial Guinea, the Maldives, Myanmar,
and Vanuatu are all affected well beyond other
countries with similar levels of socio-economic
development. These countries require special
attention if prosperity is to be upheld in the
face of growing climate impacts that each is
already feeling disproportionately compared
with similarly developed countries.
FOR REASONS OF GEOGRAPHY
ALONE, NOT ALL POOR ORLESS-DEVELOPED COUNTRIESARE EXPOSED TO THE SAMEDEGREES OF CLIMATE STRESS
or poverty. Gender development is particularly
important for human health impacts of climate
change, which disproportionately affect children
in developing countries, who are most likely
cared for by their mothers or other female family
members or friends.17 However, women have
a role to play across all aspects of the Monitor,
given their recognized positive contributions to
enhancing democratic governance, education,
and disaster risk reduction work, as well as to
economic prosperity and social cohesion.18
CLIMATE VULNERABILITY AND GENDER INEQUALITYCorrelation between the climate vulnerability monitor assessment and gender inequality index score
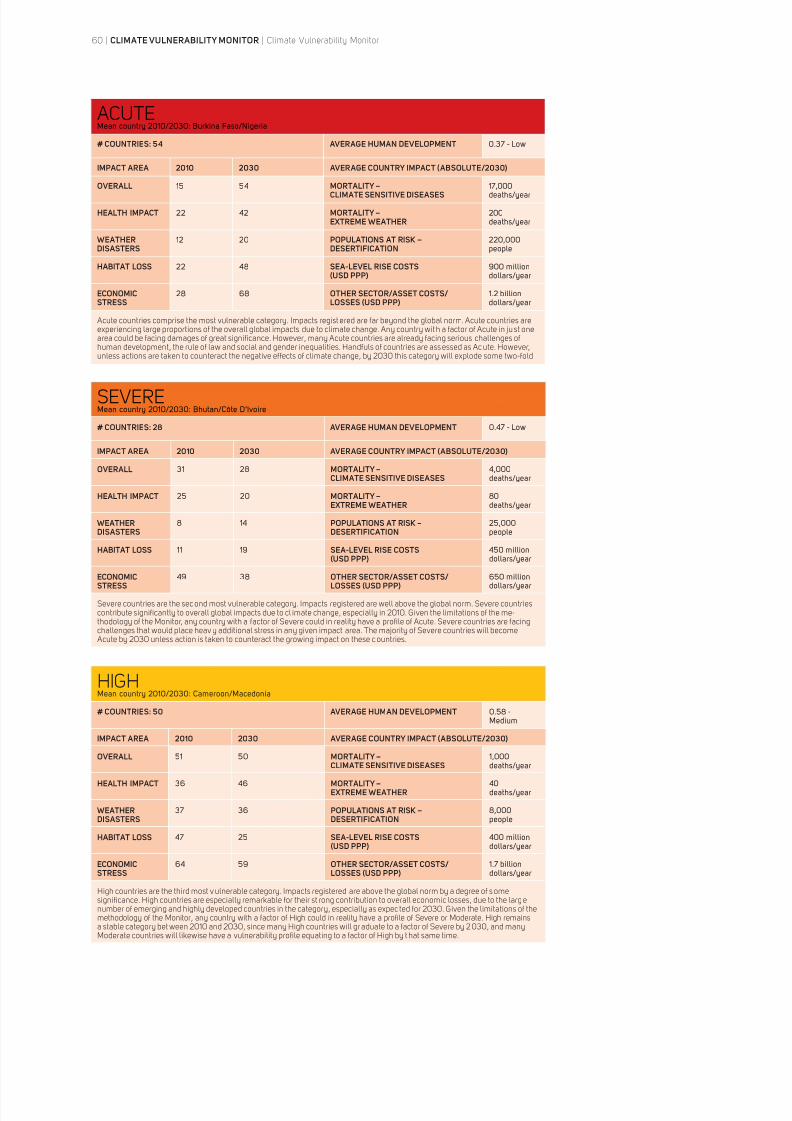
8/8/2019 Climate Vulnerability Monitor 2010: The State of the Climate Crisis
http://slidepdf.com/reader/full/climate-vulnerability-monitor-2010-the-state-of-the-climate-crisis 62/291
60 | CLIMATE VULNERABILITY MONITOR | Climate Vulnerability Monitor
ACUTE Mean country 2010/2030: Burkina Faso/Nigeria
# COUNTRIES: 54 AVERAGE HUMAN DEVELOPMENT 0.37 - Low
IMPACT AREA 2010 2030 AVERAGE COUNTRY IMPACT (ABSOLUTE/2030)
OVERALL 15 54 MORTALITY –CLIMATE SENSITIVE DISEASES
17,000deaths/year
HEALTH IMPACT 22 42 MORTALITY –EXTREME WEATHER
200deaths/year
WEATHERDISASTERS
12 20 POPULATIONS AT RISK –DESERTIFICATION
220,000people
HABITAT LOSS 22 48 SEA-LEVEL RISE COSTS(USD PPP)
900 milliondollars/year
ECONOMICSTRESS
28 68 OTHER SECTOR/ASSET COSTS/LOSSES (USD PPP)
1.2 billiondollars/year
Acute countries comprise the most vulnerable category. Impacts regist ered are far beyond the global norm. Acute countries areexperiencing large proportions of the overall global impacts due to climate change. Any country wit h a factor of Acute in ju st onearea could be facing damages of great significance. However, many Acute countries are already facing serious challenges ofhuman development, the rule of law and social and gender inequalities. Handfuls of countries are ass essed as Ac ute. However,
unless actions are taken to counteract the negative effects of climate change, by 2030 this category will explode some two-fold.
SEVERE Mean country 2010/2030: Bhutan/Côte D’Ivoire
# COUNTRIES: 28 AVERAGE HUMAN DEVELOPMENT 0.47 - Low
IMPACT AREA 2010 2030 AVERAGE COUNTRY IMPACT (ABSOLUTE/2030)
OVERALL 31 28 MORTALITY –CLIMATE SENSITIVE DISEASES
4,000deaths/year
HEALTH IMPACT 25 20 MORTALITY –EXTREME WEATHER
80deaths/year
WEATHER
DISASTERS
8 14 POPULATIONS AT RISK –
DESERTIFICATION
25,000
people
HABITAT LOSS 11 19 SEA-LEVEL RISE COSTS(USD PPP)
450 milliondollars/year
ECONOMICSTRESS
49 38 OTHER SECTOR/ASSET COSTS/LOSSES (USD PPP)
650 milliondollars/year
Severe countries are the sec ond most vulnerable category. Impacts registered are well above the global norm. Severe countriescontribute significantly to overall global impacts due to cl imate change, especially in 2010. Given the limitations of the me-thodology of the Monitor, any country with a factor of Severe could in reality have a profile of Acute. Severe countries are facingchallenges that would place heav y additional stress in any given impact area. The majority of Severe countries will becomeAcute by 2030 unless action is taken to counteract the growing impact on these c ountries.
HIGH Mean country 2010/2030: Cameroon/Macedonia
# COUNTRIES: 50 AVERAGE HUMAN DEVELOPMENT 0.58 -Medium
IMPACT AREA 2010 2030 AVERAGE COUNTRY IMPACT (ABSOLUTE/2030)
OVERALL 51 50 MORTALITY –CLIMATE SENSITIVE DISEASES
1,000deaths/year
HEALTH IMPACT 36 46 MORTALITY –EXTREME WEATHER
40deaths/year
WEATHERDISASTERS
37 36 POPULATIONS AT RISK –DESERTIFICATION
8,000people
HABITAT LOSS 47 25 SEA-LEVEL RISE COSTS(USD PPP)
400 milliondollars/year
ECONOMICSTRESS
64 59 OTHER SECTOR/ASSET COSTS/LOSSES (USD PPP)
1.7 billiondollars/year
High countries are the third most v ulnerable category. Impacts registered are above the global norm by a degree of s omesignificance. High countries are especially remarkable for their st rong contribution to overall economic losses, due to the larg enumber of emerging and highly developed countries in the category, especially as expec ted for 2030. Given the limitations of themethodology of the Monitor, any country with a factor of High could in reality have a profile of Severe or Moderate. High remainsa stable category bet ween 2010 and 2030, since many High countries will gr aduate to a factor of Severe by 2 030, and manyModerate countries will likewise have a vulnerability profile equating to a factor of High by t hat same time.
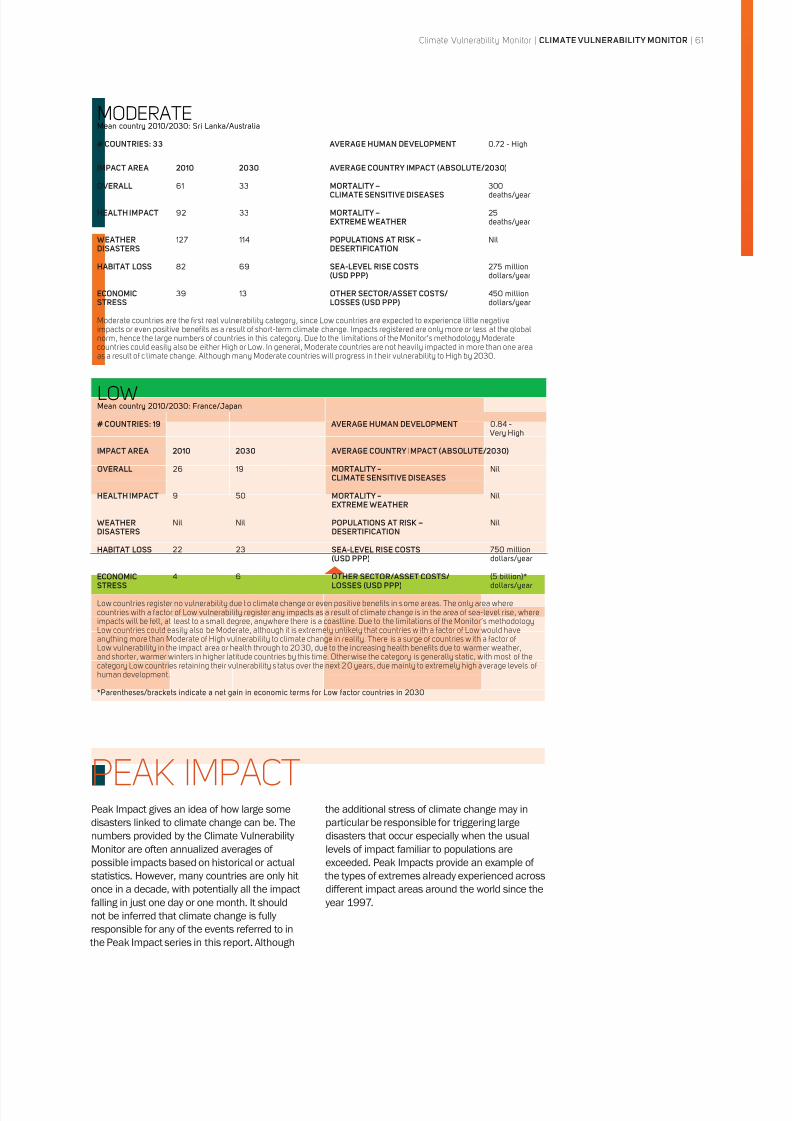
8/8/2019 Climate Vulnerability Monitor 2010: The State of the Climate Crisis
http://slidepdf.com/reader/full/climate-vulnerability-monitor-2010-the-state-of-the-climate-crisis 63/291
Climate Vulnerability Monitor | CLIMATE VULNERABILITY MONITOR | 61
MODERATE Mean country 2010/2030: Sri Lanka/Australia
# COUNTRIES: 33 AVERAGE HUMAN DEVELOPMENT 0.72 - High
IMPACT AREA 2010 2030 AVERAGE COUNTRY IMPACT (ABSOLUTE/2030)
OVERALL 61 33 MORTALITY –CLIMATE SENSITIVE DISEASES
300deaths/year
HEALTH IMPACT 92 33 MORTALITY –EXTREME WEATHER
25deaths/year
WEATHERDISASTERS
127 114 POPULATIONS AT RISK –DESERTIFICATION
Nil
HABITAT LOSS 82 69 SEA-LEVEL RISE COSTS(USD PPP)
275 milliondollars/year
ECONOMICSTRESS
39 13 OTHER SECTOR/ASSET COSTS/LOSSES (USD PPP)
450 milliondollars/year
Moderate countries are the first real vulnerability category, since Low countries are expected to experience little negativeimpacts or even positive benefits as a result of short-term climate change. Impacts registered are only more or less at the globalnorm, hence the large numbers of countries in this category. Due to the limitations of the Monitor’s methodology Moderatecountries could easily also be either High or Low. In general, Moderate countries are not heavily impacted in more than one area
as a result of c limate change. Although many Moderate countries will progress in t heir vulnerability to High by 2030.
LOW Mean country 2010/2030: France/Japan
# COUNTRIES: 19 AVERAGE HUMAN DEVELOPMENT 0.84 - Very High
IMPACT AREA 2010 2030 AVERAGE COUNTRY IMPACT (ABSOLUTE/2030)
OVERALL 26 19 MORTALITY –CLIMATE SENSITIVE DISEASES
Nil
HEALTH IMPACT 9 50 MORTALITY –EXTREME WEATHER
Nil
WEATHER
DISASTERS
Nil Nil POPULATIONS AT RISK –
DESERTIFICATION
Nil
HABITAT LOSS 22 23 SEA-LEVEL RISE COSTS(USD PPP)
750 milliondollars/year
ECONOMICSTRESS
4 6 OTHER SECTOR/ASSET COSTS/LOSSES (USD PPP)
(5 billion)*dollars/year
Low countries register no vulnerability due t o climate change or even positive benefits in s ome areas. The only area wherecountries with a factor of Low vulnerability register any impacts as a result of climate change is in the area of sea-level rise, whereimpacts will be felt, at least to a small degree, anywhere there is a coastline. Due to the limitations of the Monitor’s methodologyLow countries could easily also be Moderate, although it is extremely unlikely that countries w ith a factor of Low would haveanything more than Moderate of High vulnerability to climate change in reality. There is a surge of countries w ith a factor ofLow vulnerability in the impact area or health through to 20 30, due to the increasing health benefits due to warmer weather,and shorter, warmer winters in higher latitude countries by this time. Other wise the category is generally static, with most of thecategory Low countries retaining their vulnerability s tatus over the next 2 0 years, due mainly to extremely high average levels ofhuman development.
*Parentheses/brackets indicate a net gain in economic terms for Low factor countries in 2030
PEAK IMPACTPeak Impact gives an idea of how large some
disasters linked to climate change can be. The
numbers provided by the Climate Vulnerability
Monitor are often annualized averages of
possible impacts based on historical or actual
statistics. However, many countries are only hit
once in a decade, with potentially all the impactfalling in just one day or one month. It should
not be inferred that climate change is fully
responsible for any of the events referred to in
the Peak Impact series in this report. Although
the additional stress of climate change may in
particular be responsible for triggering large
disasters that occur especially when the usual
levels of impact familiar to populations are
exceeded. Peak Impacts provide an example of
the types of extremes already experienced across
different impact areas around the world since theyear 1997.
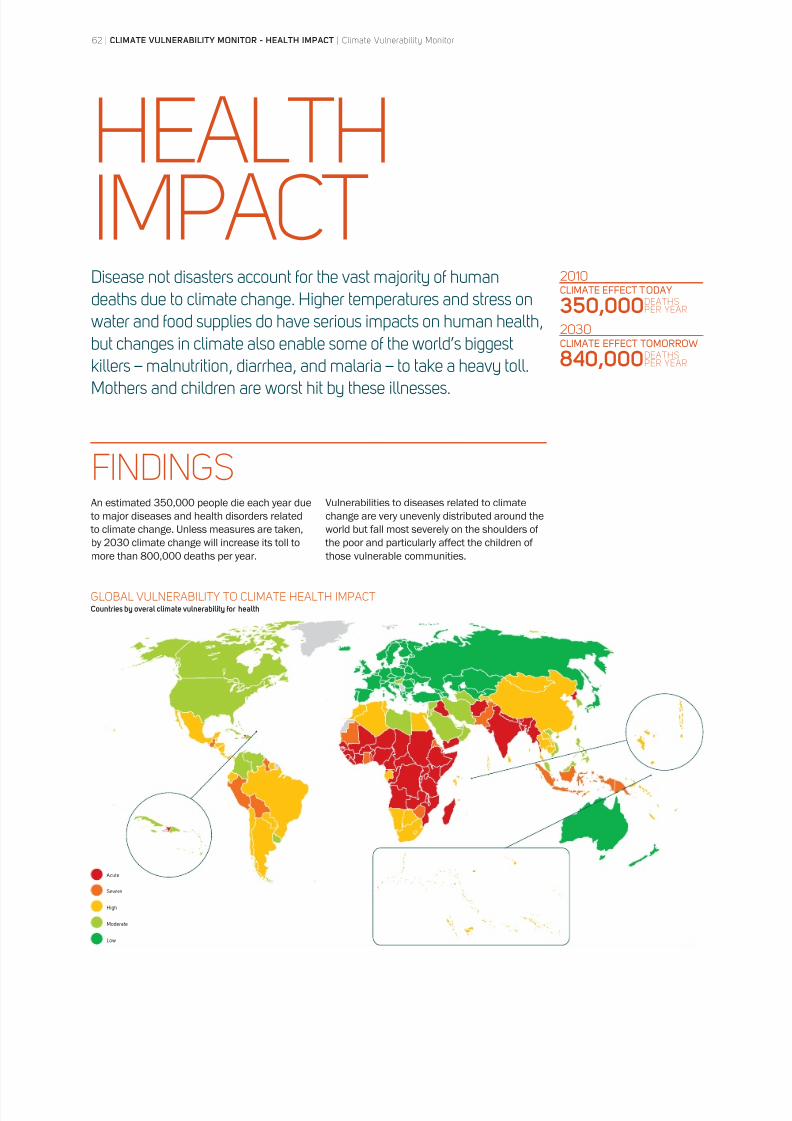
8/8/2019 Climate Vulnerability Monitor 2010: The State of the Climate Crisis
http://slidepdf.com/reader/full/climate-vulnerability-monitor-2010-the-state-of-the-climate-crisis 64/291
62 | CLIMATE VULNERABILITY MONITOR - HEALTH IMPACT | Climate Vulnerability Monitor
HEALTHIMPACTDisease not disasters account for the vast majority of humandeaths due to climate change. Higher temperatures and stress onwater and food supplies do have serious impacts on human health,but changes in climate also enable some of the world’s biggestkillers – malnutrition, diarrhea, and malaria – to take a heavy toll.Mothers and children are worst hit by these illnesses.
An estimated 350,000 people die each year due
to major diseases and health disorders related
to climate change. Unless measures are taken,by 2030 climate change will increase its toll to
more than 800,000 deaths per year.
Vulnerabilities to diseases related to climate
change are very unevenly distributed around the
world but fall most severely on the shoulders of the poor and particularly affect the children of
those vulnerable communities.
FINDINGS
CLIMATE EFFECT TODAY 350,000
CLIMATE EFFECT TOMORROW
840,000
2010
2030
DEATHSPER YEAR
DEATHSPER YEAR
GLOBAL VULNERABILITY TO CLIMATE HEALTH IMPACTCountries by overal climate vulnerability for health
Acute
Severe
High
Moderate
Low
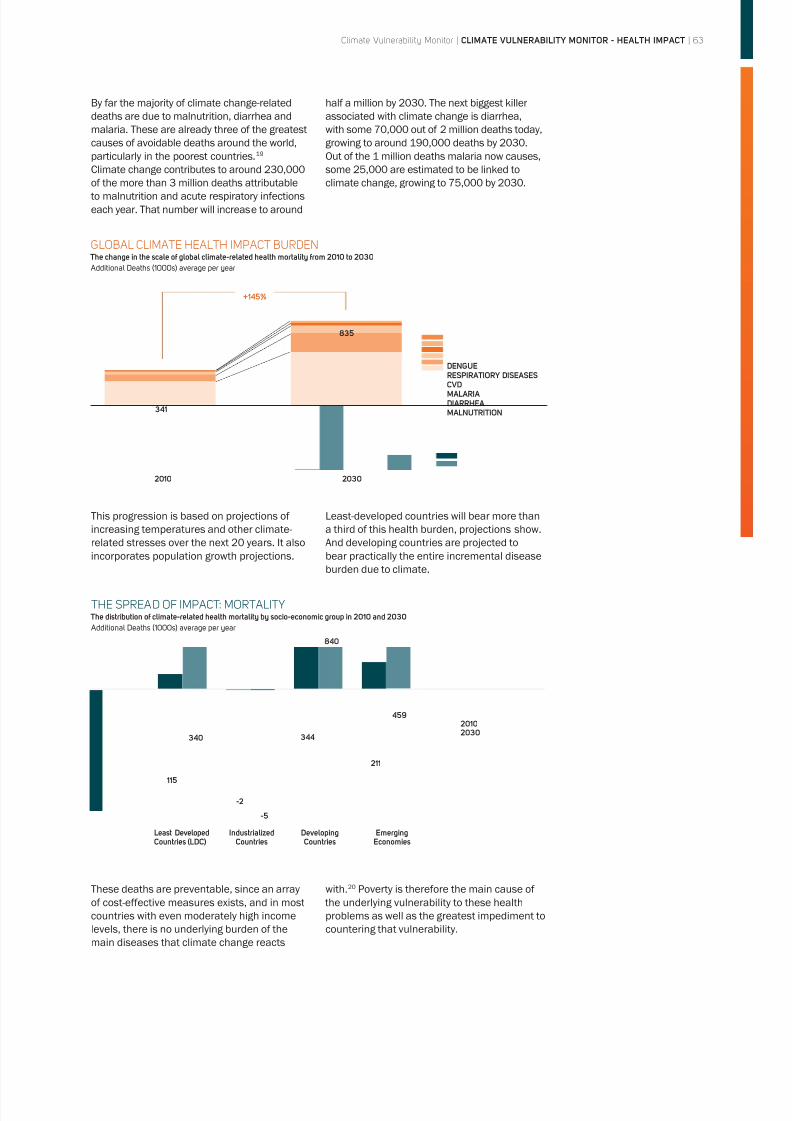
8/8/2019 Climate Vulnerability Monitor 2010: The State of the Climate Crisis
http://slidepdf.com/reader/full/climate-vulnerability-monitor-2010-the-state-of-the-climate-crisis 65/291
Climate Vulnerability Monitor | CLIMATE VULNERABILITY MONITOR - HEALTH IMPACT | 63
By far the majority of climate change-related
deaths are due to malnutrition, diarrhea and
malaria. These are already three of the greatest
causes of avoidable deaths around the world,
particularly in the poorest countries.19
Climate change contributes to around 230,000
of the more than 3 million deaths attributable
to malnutrition and acute respiratory infections
each year. That number will increase to around
half a million by 2030. The next biggest killer
associated with climate change is diarrhea,
with some 70,000 out of 2 million deaths today,
growing to around 190,000 deaths by 2030.
Out of the 1 million deaths malaria now causes,
some 25,000 are estimated to be linked to
climate change, growing to 75,000 by 2030.
This progression is based on projections of
increasing temperatures and other climate-related stresses over the next 20 years. It also
incorporates population growth projections.
Least-developed countries will bear more than
a third of this health burden, projections show.And developing countries are projected to
bear practically the entire incremental disease
burden due to climate.
These deaths are preventable, since an arrayof cost-effective measures exists, and in most
countries with even moderately high income
levels, there is no underlying burden of the
main diseases that climate change reacts
with.20
Poverty is therefore the main cause of the underlying vulnerability to these health
problems as well as the greatest impediment to
countering that vulnerability.
GLOBAL CLIMATE HEALTH IMPACT BURDEN The change in the scale of global climate-related health mortality from 2010 to 2030 Additional Deaths (1000s) average per year
341
835
DENGUERESPIRATIORY DISEASESCVDMALARIADIARRHEAMALNUTRITION
2010 2030
+145%
THE SPREAD OF IMPACT: MORTALITY The distribution of climate-related health mortality by socio-economic group in 2010 and 2030 Additional Deaths (1000s) average per year
115
340
-2
-5
344
840
211
45920102030
Least DevelopedCountries (LDC)
IndustrializedCountries
DevelopingCountries
EmergingEconomies
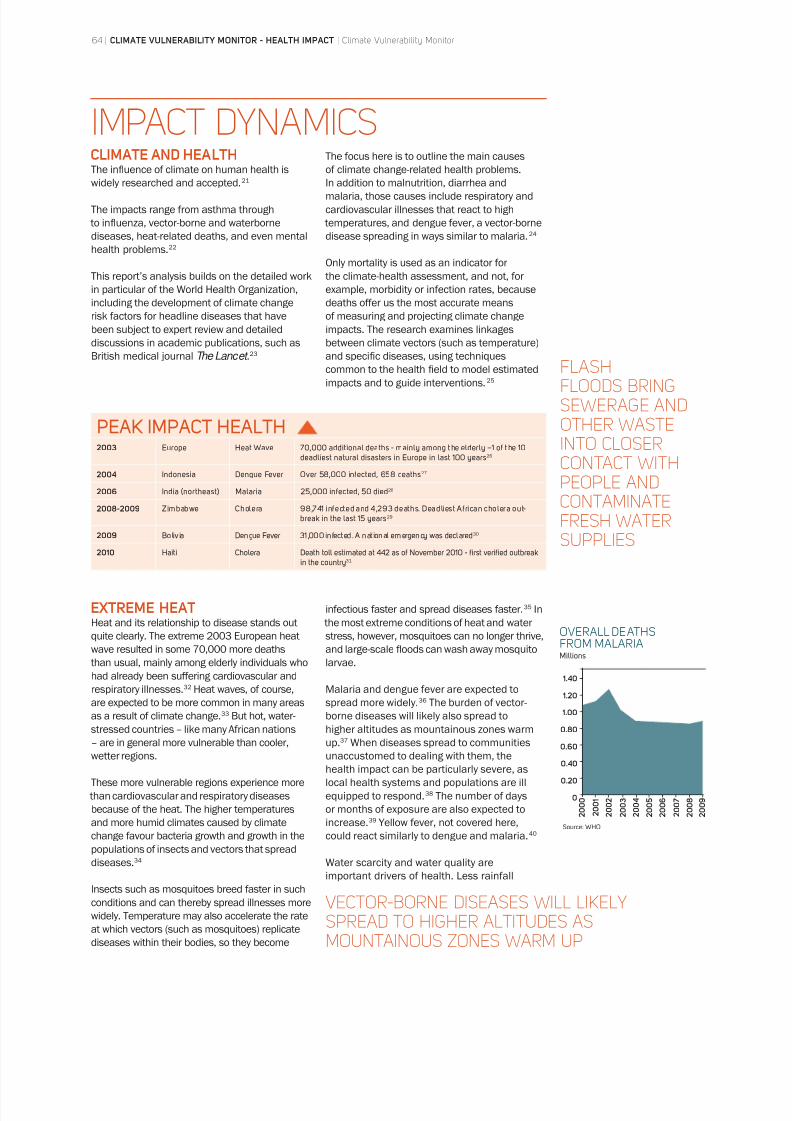
8/8/2019 Climate Vulnerability Monitor 2010: The State of the Climate Crisis
http://slidepdf.com/reader/full/climate-vulnerability-monitor-2010-the-state-of-the-climate-crisis 66/291
VECTOR-BORNE DISEASES WILL LIKELYSPREAD TO HIGHER ALTITUDES ASMOUNTAINOUS ZONES WARM UP
FLASHFLOODS BRINGSEWERAGE ANDOTHER WASTEINTO CLOSERCONTACT WITHPEOPLE ANDCONTAMINATEFRESH WATER
SUPPLIES
IMPACT DYNAMICSCLIMATE AND HEALTHThe influence of climate on human health is
widely researched and accepted.21
The impacts range from asthma through
to influenza, vector-borne and waterborne
diseases, heat-related deaths, and even mental
health problems.22
This report’s analysis builds on the detailed work
in particular of the World Health Organization,
including the development of climate change
risk factors for headline diseases that have
been subject to expert review and detailed
discussions in academic publications, such as
British medical journal The Lancet .23
The focus here is to outline the main causes
of climate change-related health problems.
In addition to malnutrition, diarrhea and
malaria, those causes include respiratory and
cardiovascular illnesses that react to high
temperatures, and dengue fever, a vector-borne
disease spreading in ways similar to malaria.24
Only mortality is used as an indicator for
the climate-health assessment, and not, for
example, morbidity or infection rates, because
deaths offer us the most accurate means
of measuring and projecting climate change
impacts. The research examines linkages
between climate vectors (such as temperature)
and specific diseases, using techniquescommon to the health field to model estimated
impacts and to guide interventions.25
PEAK IMPACT HEALTH2003 Europe Heat Wave 70,000 additional deaths - mainly among t he elderly –1 of t he 10
deadliest natural disasters in Europe in last 100 years26
2004 Indonesia Dengue Fever Over 58,000 infected, 658 deaths27
2006 India (northeast) Malaria 25,000 infected, 50 died28
2008-2009 Zimbabwe Cholera 98,741 infected and 4,293 deaths. Deadliest African cholera out-break in the last 15 years29
2009 Boliv ia Dengue Fever 31 ,000 infected. A nat ional emergency was declared30
2010 Haiti Cholera Death toll estimated at 442 as of November 2010 - first verified outbreakin the country31
EXTREME HEATHeat and its relationship to disease stands out
quite clearly. The extreme 2003 European heat
wave resulted in some 70,000 more deaths
than usual, mainly among elderly individuals who
had already been suffering cardiovascular and
respiratory illnesses.32 Heat waves, of course,
are expected to be more common in many areas
as a result of climate change.33 But hot, water-stressed countries – like many African nations
– are in general more vulnerable than cooler,
wetter regions.
These more vulnerable regions experience more
than cardiovascular and respiratory diseases
because of the heat. The higher temperatures
and more humid climates caused by climate
change favour bacteria growth and growth in the
populations of insects and vectors that spread
diseases.34
Insects such as mosquitoes breed faster in suchconditions and can thereby spread illnesses more
widely. Temperature may also accelerate the rate
at which vectors (such as mosquitoes) replicate
diseases within their bodies, so they become
infectious faster and spread diseases faster.35 In
the most extreme conditions of heat and water
stress, however, mosquitoes can no longer thrive,
and large-scale floods can wash away mosquito
larvae.
Malaria and dengue fever are expected to
spread more widely.36 The burden of vector-
borne diseases will likely also spread tohigher altitudes as mountainous zones warm
up.37 When diseases spread to communities
unaccustomed to dealing with them, the
health impact can be particularly severe, as
local health systems and populations are ill
equipped to respond.38 The number of days
or months of exposure are also expected to
increase.39 Yellow fever, not covered here,
could react similarly to dengue and malaria.40
Water scarcity and water quality are
important drivers of health. Less rainfall
Source: WHO
OVERALL DEATHSFROM MALARIAMillions
1.40
1.20
1.00
0.80
0.60
0.40
0.20
0
2 0 0 0
2 0 0 1
2 0 0 5
2 0 0 3
2 0 0 7
2 0 0 2
2 0 0 6
2 0 0 4
2 0 0 8
2 0 0 9
64 | CLIMATE VULNERABILITY MONITOR - HEALTH IMPACT | Climate Vulnerability Monitor
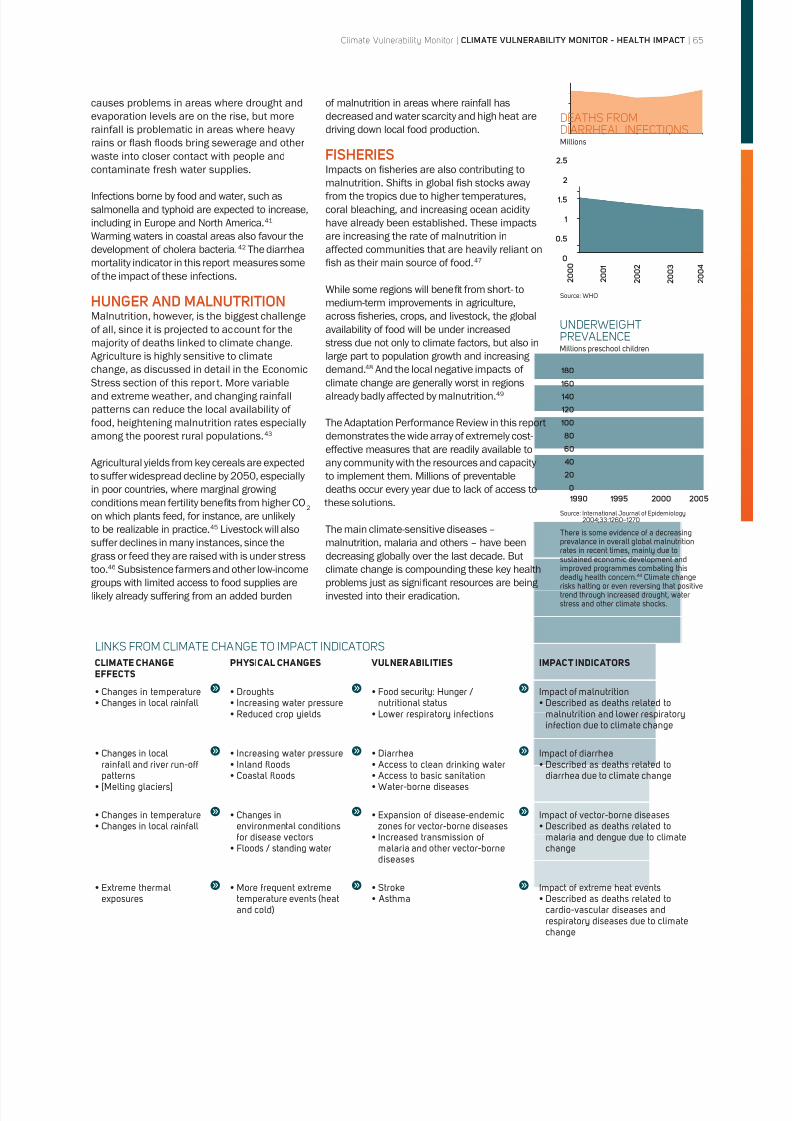
8/8/2019 Climate Vulnerability Monitor 2010: The State of the Climate Crisis
http://slidepdf.com/reader/full/climate-vulnerability-monitor-2010-the-state-of-the-climate-crisis 67/291
causes problems in areas where drought and
evaporation levels are on the rise, but more
rainfall is problematic in areas where heavy
rains or flash floods bring sewerage and other
waste into closer contact with people and
contaminate fresh water supplies.
Infections borne by food and water, such as
salmonella and typhoid are expected to increase,
including in Europe and North America.41
Warming waters in coastal areas also favour the
development of cholera bacteria.42 The diarrhea
mortality indicator in this report measures some
of the impact of these infections.
HUNGER AND MALNUTRITIONMalnutrition, however, is the biggest challenge
of all, since it is projected to account for the
majority of deaths linked to climate change.
Agriculture is highly sensitive to climatechange, as discussed in detail in the Economic
Stress section of this report. More variable
and extreme weather, and changing rainfall
patterns can reduce the local availability of
food, heightening malnutrition rates especially
among the poorest rural populations.43
Agricultural yields from key cereals are expected
to suffer widespread decline by 2050, especially
in poor countries, where marginal growing
conditions mean fertility benefi ts from higher CO2
on which plants feed, for instance, are unlikely
to be realizable in practice.
45
Livestock will alsosuffer declines in many instances, since the
grass or feed they are raised with is under stress
too.46 Subsistence farmers and other low-income
groups with limited access to food supplies are
likely already suffering from an added burden
of malnutrition in areas where rainfall has
decreased and water scarcity and high heat are
driving down local food production.
FISHERIESImpacts on fisheries are also contributing to
malnutrition. Shifts in global fish stocks away
from the tropics due to higher temperatures,
coral bleaching, and increasing ocean acidity
have already been established. These impacts
are increasing the rate of malnutrition in
affected communities that are heavily reliant on
fish as their main source of food.47
While some regions will benefi t from short- to
medium-term improvements in agriculture,
across fisheries, crops, and livestock, the global
availability of food will be under increased
stress due not only to climate factors, but also in
large part to population growth and increasing demand.48 And the local negative impacts of
climate change are generally worst in regions
already badly affected by malnutrition.49
The Adaptation Performance Review in this report
demonstrates the wide array of extremely cost-
effective measures that are readily available to
any community with the resources and capacity
to implement them. Millions of preventable
deaths occur every year due to lack of access to
these solutions.
The main climate-sensitive diseases –malnutrition, malaria and others – have been
decreasing globally over the last decade. But
climate change is compounding these key health
problems just as significant resources are being
invested into their eradication.
DEATHS FROMDIARRHEAL INFECTIONSMillions
2 0 0 0
2 0 0 1
2 0 0 2
2 0 0 3
2 0 0 4
2.5
2
1.5
1
0.5
0
Source: WHO
Source: International Journal of Epidemiology2004;33:1260–1270
UNDERWEIGHTPREVALENCEMillions preschool children
1990 1995 2000 2005
180
160
140
120
100
80
60
40
20
0
LINKS FROM CLIMATE CHANGE TO IMPACT INDICATORS
CLIMATE CHANGEEFFECTS
PHYSICAL CHANGES VULNERABILITIES IMPACT INDICATORS
nutritional status
Impact of malnutrition
malnutrition and lower respiratoryinfection due to climate change
rainfall and river run-offpatterns
Impact of diarrhea
diarrhea due to climate change
environmental conditionsfor disease vectors
zones for vector-borne diseases
malaria and other vector-bornediseases
Impact of vector-borne diseases
malaria and dengue due to climatechange
temperature events (heatand cold)
cardio-vascular diseases andrespiratory diseases due to climatechange
There is some evidence of a decreasingprevalance in overall global malnutritionrates in recent times, mainly due tosustained economic development andimproved programmes combating thisdeadly health concern.44 Climate changerisks halting or even reversing that positivetrend through increased drought, waterstress and other climate shocks.
Climate Vulnerability Monitor | CLIMATE VULNERABILITY MONITOR - HEALTH IMPACT | 65
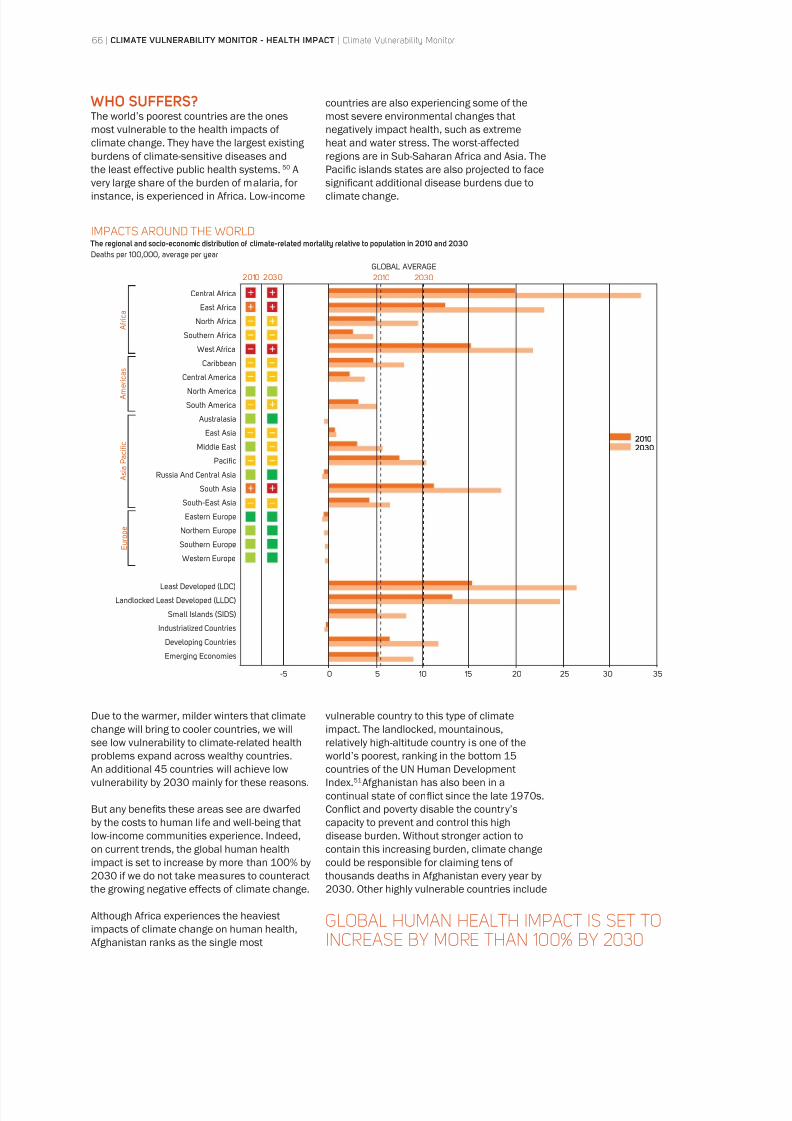
8/8/2019 Climate Vulnerability Monitor 2010: The State of the Climate Crisis
http://slidepdf.com/reader/full/climate-vulnerability-monitor-2010-the-state-of-the-climate-crisis 68/291
IMPACTS AROUND THE WORLD The regional and socio-economic distribution of climate-related mortality relative to population in 2010 and 2030Deaths per 100,000, average per year
Central Africa
East Africa
North Africa
Southern Africa
West Africa
Caribbean
Central America
North America
South America
Australasia
East Asia
Middle East
Pacific
Russia And Central Asia
South Asia
South-East Asia
Eastern Europe
Northern EuropeSouthern Europe
Western Europe
Least Developed (LDC)
Landlocked Least Developed (LLDC)
Small Islands (SIDS)
Industrialized Countries
Developing Countries
Emerging Economies
-5 0 5 10 20 25 3015
2010 2030
A f r i c a
A m e r i c a s
A s i a P a c i fi c
E u r o p
e
35
20102030
2010
GLOBAL AVERAGE
2030
WHO SUFFERS?The world’s poorest countries are the ones
most vulnerable to the health impacts of
climate change. They have the largest existing
burdens of climate-sensitive diseases and
the least effective public health systems.50 A
very large share of the burden of malaria, for
instance, is experienced in Africa. Low-income
countries are also experiencing some of the
most severe environmental changes that
negatively impact health, such as extreme
heat and water stress. The worst-affected
regions are in Sub-Saharan Africa and Asia. The
Pacific islands states are also projected to face
significant additional disease burdens due to
climate change.
Due to the warmer, milder winters that climatechange will bring to cooler countries, we will
see low vulnerability to climate-related health
problems expand across wealthy countries.
An additional 45 countries will achieve low
vulnerability by 2030 mainly for these reasons.
But any benefi ts these areas see are dwarfed
by the costs to human life and well-being that
low-income communities experience. Indeed,
on current trends, the global human health
impact is set to increase by more than 100% by
2030 if we do not take measures to counteract
the growing negative effects of climate change.
Although Africa experiences the heaviest
impacts of climate change on human health,
Afghanistan ranks as the single most
vulnerable country to this type of climateimpact. The landlocked, mountainous,
relatively high-altitude country is one of the
world’s poorest, ranking in the bottom 15
countries of the UN Human Development
Index.51Afghanistan has also been in a
continual state of conflict since the late 1970s.
Conflict and poverty disable the country’s
capacity to prevent and control this high
disease burden. Without stronger action to
contain this increasing burden, climate change
could be responsible for claiming tens of
thousands deaths in Afghanistan every year by
2030. Other highly vulnerable countries include
GLOBAL HUMAN HEALTH IMPACT IS SET TOINCREASE BY MORE THAN 100% BY 2030
66 | CLIMATE VULNERABILITY MONITOR - HEALTH IMPACT | Climate Vulnerability Monitor
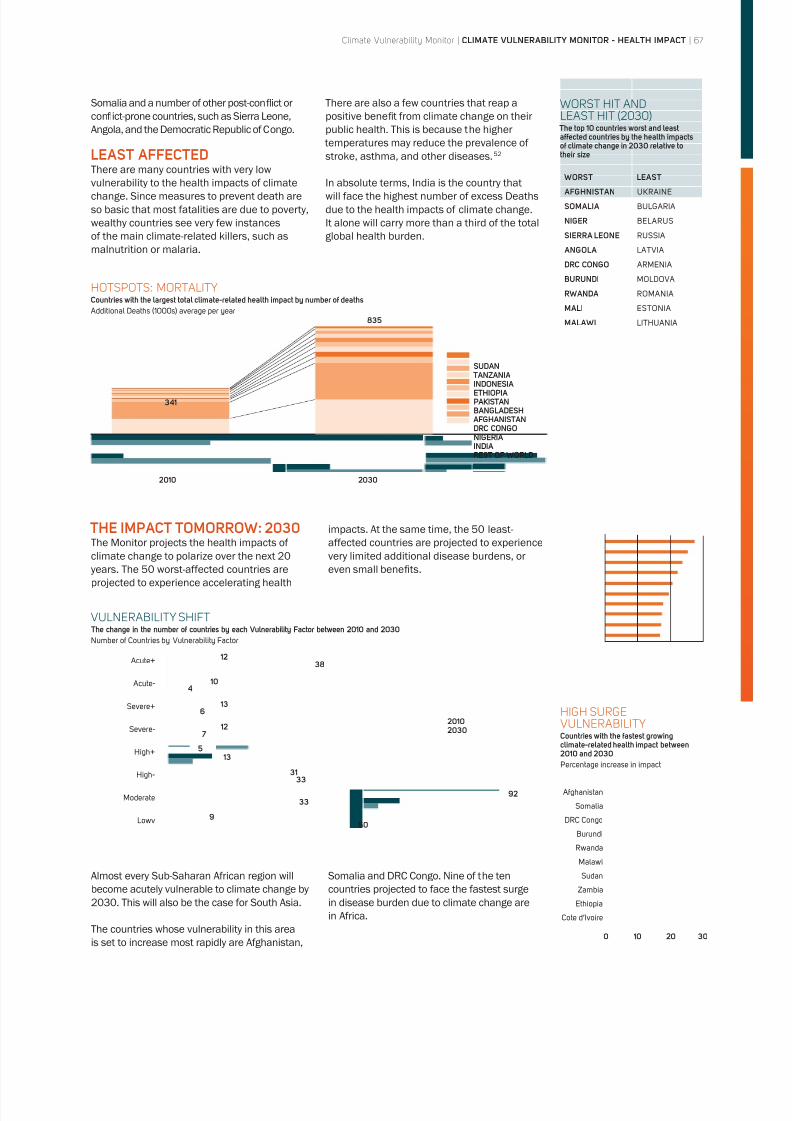
8/8/2019 Climate Vulnerability Monitor 2010: The State of the Climate Crisis
http://slidepdf.com/reader/full/climate-vulnerability-monitor-2010-the-state-of-the-climate-crisis 69/291
Somalia and a number of other post-conflict or
conflict-prone countries, such as Sierra Leone,
Angola, and the Democratic Republic of Congo.
LEAST AFFECTEDThere are many countries with very low
vulnerability to the health impacts of climate
change. Since measures to prevent death are
so basic that most fatalities are due to poverty,
wealthy countries see very few instances
of the main climate-related killers, such as
malnutrition or malaria.
There are also a few countries that reap a
positive benefi t from climate change on their
public health. This is because the higher
temperatures may reduce the prevalence of
stroke, asthma, and other diseases.52
In absolute terms, India is the country that
will face the highest number of excess Deaths
due to the health impacts of climate change.
It alone will carry more than a third of the total
global health burden.
WORST HIT ANDLEAST HIT (2030)
The top 10 countries worst and leastaffected countries by the health impactsof climate change in 2030 relative totheir size
WORST LEAST AFGHNISTAN UKRAINE
SOMALIA BULGARIA
NIGER BELARUS
SIERRA LEONE RUSSIA
ANGOLA LATVIA
DRC CONGO ARMENIA
BURUNDI MOLDOVA
RWANDA ROMANIA
MALI ESTONIA
MALAWI LITHUANIA
HOTSPOTS: MORTALITYCountries with the largest total climate-related health impact by number of deaths Additional Deaths (1000s) average per year
2010 2030
SUDAN TANZANIAINDONESIAETHIOPIAPAKISTANBANGLADESH
AFGHANISTANDRC CONGONIGERIAINDIAREST OF WORLD
341
835
THE IMPACT TOMORROW: 2030The Monitor projects the health impacts of
climate change to polarize over the next 20
years. The 50 worst-affected countries are
projected to experience accelerating health
impacts. At the same time, the 50 least-affected countries are projected to experience
very limited additional disease burdens, or
even small benefi ts.
Almost every Sub-Saharan African region will
become acutely vulnerable to climate change by2030. This will also be the case for South Asia.
The countries whose vulnerability in this area
is set to increase most rapidly are Afghanistan,
Somalia and DRC Congo. Nine of the ten
countries projected to face the fastest surgein disease burden due to climate change are
in Africa.
VULNERABILITY SHIFT The change in the number of countries by each Vulnerability Factor between 2010 and 2030Number of Countries by Vulnerability Factor
Acute+
Acute-
Severe+
Severe-
High+
High-
Moderate
Lowv
1238
104
13
6 12
7
5 13
3133
33
950
92
20102030
HIGH SURGEVULNERABILITYCountries with the fastest growingclimate-related health impact between2010 and 2030Percentage increase in impact
Afghanistan
Somalia
DRC Congo
Burundi
Rwanda
Malawi
Sudan
ZambiaEthiopia
Cote d’Ivoire
0 10 20 30
Climate Vulnerability Monitor | CLIMATE VULNERABILITY MONITOR - HEALTH IMPACT | 67
8/8/2019 Climate Vulnerability Monitor 2010: The State of the Climate Crisis
http://slidepdf.com/reader/full/climate-vulnerability-monitor-2010-the-state-of-the-climate-crisis 70/291
SPOTLIGHT: DIARRHEAL INFECTIONS
another one of the biggest killers in developing countriestoday, responsible for around 2 million deaths per year. Aswith malnutrition, it almost never causes fatalities in wealthycountries. Diarrhea is also much less prevalent in developedcountries where food and water contamination and spoilingare less common.53 Most deaths brought on by diarrhealinfections like cholera are the result of acute dehydration.Such deaths can be avoided with the simplest of treatments– a salt-water and sugar or rice-based drink called oral54
Higher temperatures foster the growth of viruses, bacteriaand parasites, which are passed on to people mainly via
food and water. Where refrigeration is limited, higher
temperatures also increases the rate at which food spoils,forcing more people to eat food unfit for consumption.of these problems can lead to diarrhea and death in theabsence of basic treatment.55
Climate change is therefore estimated by the WHO to causeroughly 3.5% of the burden of diarrhea in many countries.56 The 70,000 annual deaths this represents today areproper measures are taken.
THE ASSESSMENTThe Monitor assesses health impacts due to climate
change by applying a sub-regional climate change risk factor
developed by WHO to national climate-sensitive mortality
statistics from 2004. WHO risk factors have been calculated
for a range of different health concerns, such as smoking
as a risk factor for lung cancer. Risk factors assume, forexample, that climate change has a 3% role in a given burden
of fatalities from a specific disease, such as malaria.57
Regions such as Sub-Saharan Africa generally have higher
risk factors compared to, say, North America, due to climate
and other variables. But it is overwhelmingly the underlying
burden of climate-sensitive diseases that plays the greatest
determining role in whether a country is deemed to have a
higher or lower factor of vulnerability to the health impacts
of climate change. So countries where climate-sensitive
diseases are more widespread have correspondingly higher
factors of vulnerability. Mortality is assessed relative to
total population, so impacts are assessed by their relative
importance within a particular country.
There are nevertheless some surprising results from within
Sub-Saharan Africa, which has the worst general burden of
climate-sensitive diseases: Namibia (Moderate/Moderate),
South Africa (Moderate/Moderate) and Zimbabwe
(Moderate/High+) all have relatively low vulnerability,
especially in 2010. Each of these countries has a high rate
of HIV/AIDS, which can assist the spread of vector-borne
illnesses such as malaria.58 But South Africa, for example,
has almost no diarrhea, malaria, or dengue burden, and
has malnutrition rates similar to many fast-growing Asian
countries, such as Sri Lanka. Namibia also has very lowmalnutrition, diarrhea, and dengue rates, but has a higher
burden of malaria.59 While Zimbabwe registers relatively high
on diarrhea and malnutrition death rates, it has no dengue
and little malaria, and so is much less vulnerable than the
norm for the region.60
Argentina (High-/High+) -- onetime breadbasket of the
world -- receives a surprisingly high factor of vulnerability
for health compared to its peers in South America. Driving
the vulnerability is a high of number of deaths due to
malnutrition. From 1999 to 2002 Argentina experienced a
serious financial crisis with the economy contracting each
year resulting in many instances of malnutrition especially
among children in remote rural locations.61 The Monitorbases itself on the most recent globally relevant health data
available from the WHO, which was sourced for 2004, at the
tail-end of this crisis. Argentina is generally expected to have
improved its general situation since this time, minimizing a
key vulnerability flare to climate change.62
68 | CLIMATE VULNERABILITY MONITOR - HEALTH IMPACT | Climate Vulnerability Monitor
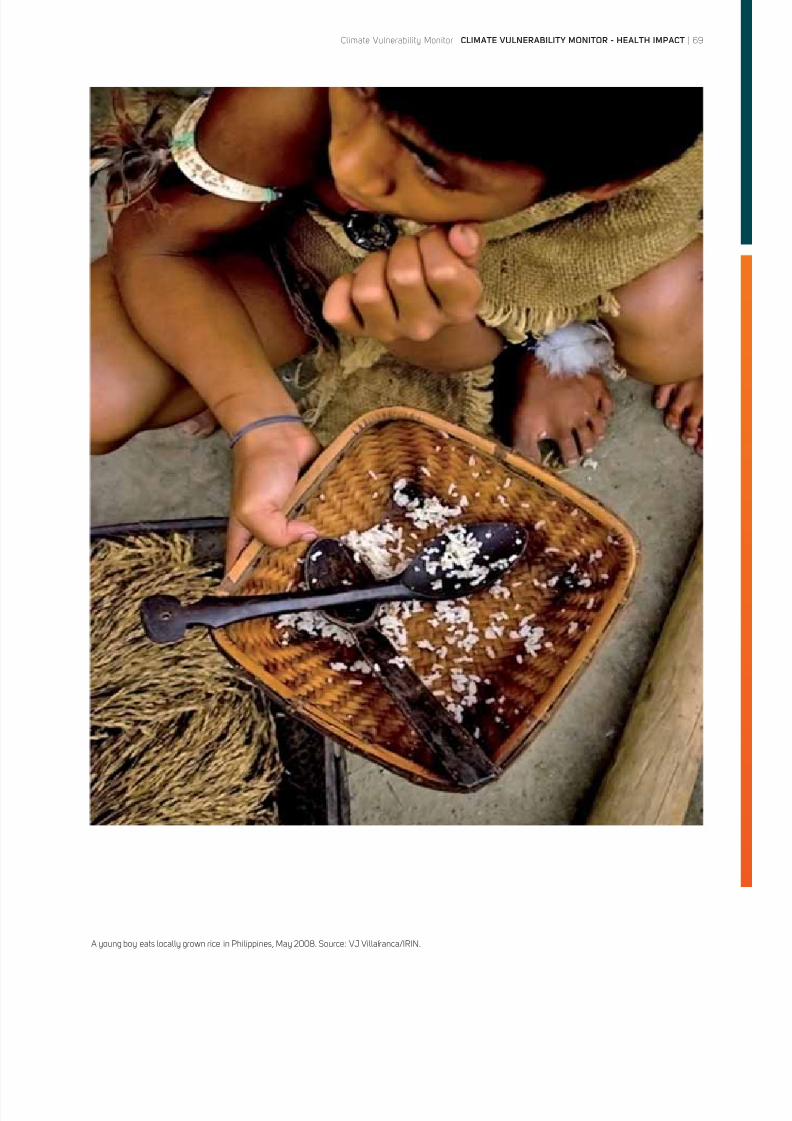
8/8/2019 Climate Vulnerability Monitor 2010: The State of the Climate Crisis
http://slidepdf.com/reader/full/climate-vulnerability-monitor-2010-the-state-of-the-climate-crisis 71/291
A young boy eats locally grown rice in Philippines, May 2008. Source: VJ Villafranca/IRIN.
Climate Vulnerability Monitor | CLIMATE VULNERABILITY MONITOR - HEALTH IMPACT | 69
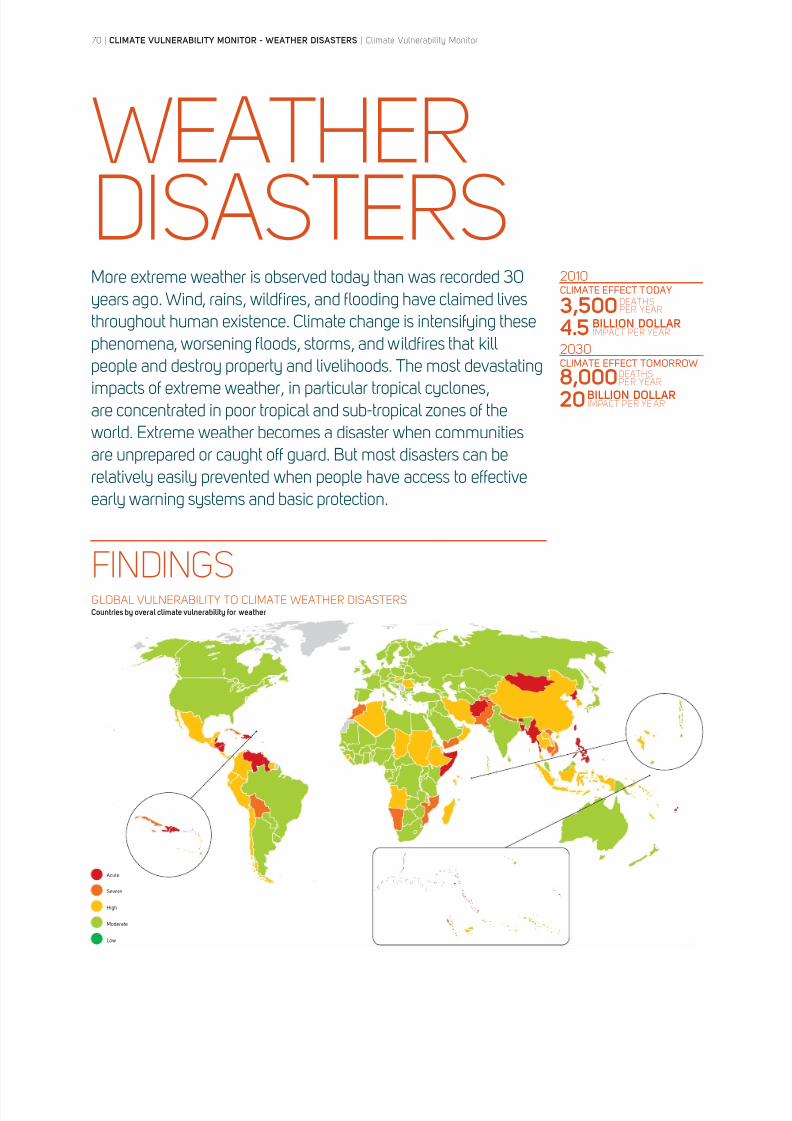
8/8/2019 Climate Vulnerability Monitor 2010: The State of the Climate Crisis
http://slidepdf.com/reader/full/climate-vulnerability-monitor-2010-the-state-of-the-climate-crisis 72/291
70 | CLIMATE VULNERABILITY MONITOR - WEATHER DISASTERS | Climate Vulnerability Monitor
WEATHERDISASTERSMore extreme weather is observed today than was recorded 30years ago. Wind, rains, wildfires, and flooding have claimed livesthroughout human existence. Climate change is intensifying thesephenomena, worsening floods, storms, and wildfires that killpeople and destroy property and livelihoods. The most devastatingimpacts of extreme weather, in particular tropical cyclones,are concentrated in poor tropical and sub-tropical zones of theworld. Extreme weather becomes a disaster when communitiesare unprepared or caught off guard. But most disasters can berelatively easily prevented when people have access to effectiveearly warning systems and basic protection.
FINDINGS
CLIMATE EFFECT TODAY 3,500
4.5
CLIMATE EFFECT TOMORROW 8,00020
2010
2030
DEATHSPER YEAR
DEATHSPER YEAR
BILLION DOLLARIMPACT PER YEAR
BILLION DOLLARIMPACT PER YEAR
Acute
Severe
High
Moderate
Low
GLOBAL VULNERABILITY TO CLIMATE WEATHER DISASTERSCountries by overal climate vulnerability for weather

8/8/2019 Climate Vulnerability Monitor 2010: The State of the Climate Crisis
http://slidepdf.com/reader/full/climate-vulnerability-monitor-2010-the-state-of-the-climate-crisis 73/291
Climate Vulnerability Monitor | CLIMATE VULNERABILITY MONITOR - WEATHER DISASTERS | 71
Climate change means more heat, warmer
oceans, more evaporation, more energy, and
either more or less rainfall. It also means
more glacial and ice melt, often occurring
more abruptly. Weather is becoming more
unpredictable, with winds, storms, and rains
changing patterns or tracks and intensities.63
The tropical cyclone belts of Asia, the
Caribbean, and the Pacific feel the worst
impacts of floods, storms, and wildfires.
Floods, storms, and wildfires have claimed an
average of 27,000 lives every year over the
past 20 years.64 Climate change is already
estimated to contribute over 3,000 deaths to
that toll each year. By 2030, climate change
is projected to be responsible for over 7,000
such deaths if measures are not taken to
reduce risks. The deadliest of these impacts
today are floods. They are already estimated to
claim 2,400 climate-driven deaths each year.
And that figure will rise to more than 5,000
by 2030. Simultaneously, damage costs from
weather disasters are projected to reach close
to USD 5 billion each year already and to grow
to USD 20 billion by 2030.
THE LARGESTABSOLUTELOSSES INECONOMIC
TERMS ARESEEN IN SOMEOF THE WORLD’SWEALTHIESTCOUNTRIES,INCLUDING THEUNITED STATESAND JAPAN
People living in poor communities in developing
countries are the most vulnerable to extreme
weather. Yet some of the largest absolute
losses in economic terms are seen in some of
the world’s wealthiest countries, including the
United States and Japan.
IMPACT DYNAMICSWarmer atmospheric and ocean temperatures
are being observed.65 At the same time,
observations of weather, especially via
satellite, reveal an increase in flood events
and suggest that tropical cyclones are
increasing in intensity.66
GLOBAL CLIMATE WEATHER DISASTERS IMPACT BURDEN: MORTALITY The change in the scale of global climate-related weather disaster mortality from 2010 to 2030 Additional Deaths average per year
3,362
7,933
FLOODSSTORMS + WILDFIRES
2010 2030
+136%
GLOBAL CLIMATE WEATHER DISASTERS IMPACT BURDEN: DAMAGE COSTS The change in the scale of global climate-related weather disaster damage costs from 2010 to 2030 Additional damage cost (million USD PPP) average per year
2010 2030
4,567
20,029
+339%
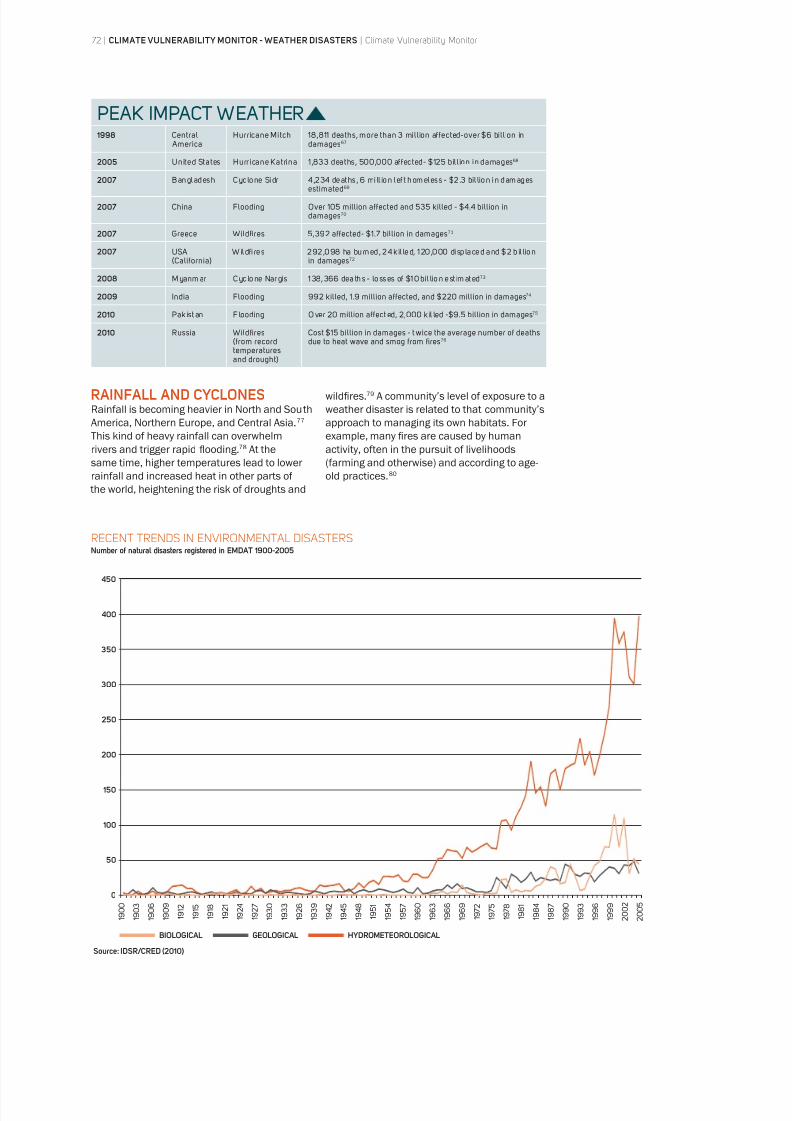
8/8/2019 Climate Vulnerability Monitor 2010: The State of the Climate Crisis
http://slidepdf.com/reader/full/climate-vulnerability-monitor-2010-the-state-of-the-climate-crisis 74/291
PEAK IMPACT WEATHER 1998 Central
AmericaHurricane Mitch 18,811 deaths, more than 3 million affected-over $6 billion in
damages67
2005 United States Hurricane Katrina 1,833 deaths, 500,000 affected- $125 bill ion in damages68
2007 Bangladesh Cyc lone Sidr 4 ,234 deaths , 6 mi ll ion lef t homeless - $2 .3 bil lion i n damagesestimated69
2007 China Flooding Over 105 million affected and 535 killed - $4.4 billion indamages70
2007 Greece Wildfires 5,392 affected- $1.7 billion in damages71
2007 USA(California)
Wildfires 292,098 ha bu rned, 24 k il led, 120 ,000 di sp laced and $2 b il lionin damages72
2008 M yanmar C yc lone Nar gis 1 38, 366 dea th s - lo ss es of $1 0 bil lion e st imat ed73
2009 India Flooding 992 killed, 1.9 million affected, and $220 million in damages74
2010 Pak ist an F looding O ver 20 million affect ed, 2,000 k il led -$9.5 billion in damages75
2010 Russia Wildfires(from recordtemperaturesand drought)
Cost $15 billion in damages - t wice the average number of deathsdue to heat wave and smog from fires76
RAINFALL AND CYCLONESRainfall is becoming heavier in North and South
America, Northern Europe, and Central Asia.77
This kind of heavy rainfall can overwhelm
rivers and trigger rapid flooding.78 At the
same time, higher temperatures lead to lower
rainfall and increased heat in other parts of
the world, heightening the risk of droughts and
wildfires.79 A community’s level of exposure to a
weather disaster is related to that community’s
approach to managing its own habitats. For
example, many fires are caused by human
activity, often in the pursuit of livelihoods
(farming and otherwise) and according to age-
old practices.80
RECENT TRENDS IN ENVIRONMENTAL DISASTERSNumber of natural disasters registered in EMDAT 1900-2005
450
400
350
300
250
200
150
100
50
0
1 9 0 0
1 9 0 3
1 9 0 6
1 9 0 9
1 9 1 2
1 9 1 5
1 9 1 8
1 9 2 1
1 9 2 4
1 9 2 7
1 9 3 0
1 9 3 3
1 9 2 6
1 9 3 9
1 9 4 2
1 9 4 5
1 9 4 8
1 9 5 1
1 9 5 4
1 9 5 7
1 9 6 0
1 9 6 3
1 9 6 6
1 9 6 9
1 9 7 2
1 9 7 5
1 9 7 8
1 9 8 1
1 9 8 4
1 9 8 7
1 9 9 0
1 9 9 3
1 9 9 6
1 9 9 9
2 0 0 2
2 0 0 5
BIOLOGICAL
Source: IDSR/CRED (2010)
GEOLOGICAL HYDROMETEOROLOGICAL
72 | CLIMATE VULNERABILITY MONITOR - WEATHER DISASTERS | Climate Vulnerability Monitor
8/8/2019 Climate Vulnerability Monitor 2010: The State of the Climate Crisis
http://slidepdf.com/reader/full/climate-vulnerability-monitor-2010-the-state-of-the-climate-crisis 75/291
Cyclones have often been considered a
hallmark characteristic of climate change. It
is easy to understand that logic – warming
seas and air cause more water to evaporate,
sending more moisture and energy into the
air, which then fuels strong rains and winds.
The idea that cyclone activity is increasing as
a result of climate change is actually one of
the most contested areas of climate science.81
Still, there is evidence to support the assertion.
In 2007, the world’s leading scientific body
in this field, the IPCC, concluded that climate
change was causing an increase in tropical
cyclone activity in the North Atlantic, although it
cited only limited evidence for other regions.82
And at the same time, worldwide data collected
by reinsurance company Munich Re showed
a 30% rise in the number of flood and storm
insurance loss events over the last 30 years.83
FLOODSIncreased flooding is mainly attributed
to localized rainfall, often in the context
of storms. But flooding also results from
accelerated glacial- and ice-melt from alpine
or Arctic-fed rivers.84 Storms and floods can
cause significant casualties and destruction
to affected communities. Drownings, physical
injuries, and disease are all part of the human
toll of such events. Complex emergencies
can emerge within days of a major weather
disaster, crippling communities that are not
equipped to handle them.
85
For communities forced to evacuate disaster
zones, the impacts of such weather events
may be especially severe and long-term.
Storms and floods displace several million
people every year by destroying homes and
infrastructure.86 Recent weather disasters
have displaced millions of people in Myanmar,
Mozambique, and Pakistan.87 The most severe
weather can cause catastrophic damage to
infrastructure – roads, bridges communication
lines, commercial premises, houses, and
other buildings. It can also damage land and
agricultural assets, in particular by destroying crops, decimating livestock, and contaminating
soils with salt. Spring floods and autumn
cyclones can be particularly damaging if they
immediately precede or coincide with calving or
harvest time.
The human toll is worst in the poorest and least
resilient communities. Developing countries
experience more than 90 percent of the
fatalities caused by weather disasters. It’s
important to note that damage to infrastructure
and other assets in poorer countries can
be completely debilitating due to a lack of insurance coverage. Samoa lost 37% of its GDP
to one cyclone.88
WILDFIRESWildfires exact much less of a human toll. Their
economic toll, however, while less than 3% of
the total impacts of weather-related disasters,
can have long-lasting effects. When fires
approach populated areas, the impact can be
devastating. Recent major fires in Australia,
Greece, Spain, and Russia have caused
significant casualties and damage.89
We cannot, with any confidence, blame any
single storm, flood, or wildfire solely on climate
change. But there is a plausible link between
these events and what has been predicted bya number of climate change scenarios. Even
if natural weather events are aggravated by
climate change to a degree of only 5 or 10
percent, on a global scale that added stress
could be immense. Like the straw that broke
the camel’s back, the added pressure of more
frequent or higher intensity weather can make
all the difference between a community that
copes and a community in disaster. Given
that highly effective measures exist to reduce
disaster risk, policy makers have every reason
to prepare for these new scenarios.
The number of documented fatalities from
weather disasters surged in the 1990s (a
rise that was at least partly due to improved
reporting of casualties) but has fallen again
since the start of the new millennium.90 If
Cyclone Nargis is removed from the 2000-
2009 data, the last decade accounts for
fewer than 100,000 such deaths. The drop
in fatalities is mainly linked to improvements
in disaster risk reduction introduced over
this period. This means that fatalities are
no longer a good stand-alone indicator of
damage suffered by communities around the
world. Hence this report also uses damagecosts as a means of measuring impacts. Still,
climate change does stress even good disaster
reduction measures with its added risks.
Statistics covering weather-related economic
damages are quite limited, so we have no
universally useful record of damage costs
DEVELOPING COUNTRIES EXPERIENCE MORETHAN 90 PERCENT OF THE FATALITIES CAUSEDBY WEATHER DISASTERS
EVEN IF NATURAL WEATHEREVENTS ARE AGGRAVATED BYCLIMATE CHANGE TO A DEGREEOF ONLY 5 OR 10 PERCENT, ONA GLOBAL SCALE THAT ADDEDSTRESS COULD BE IMMENSE
Climate Vulnerability Monitor | CLIMATE VULNERABILITY MONITOR - WEATHER DISASTERS | 73
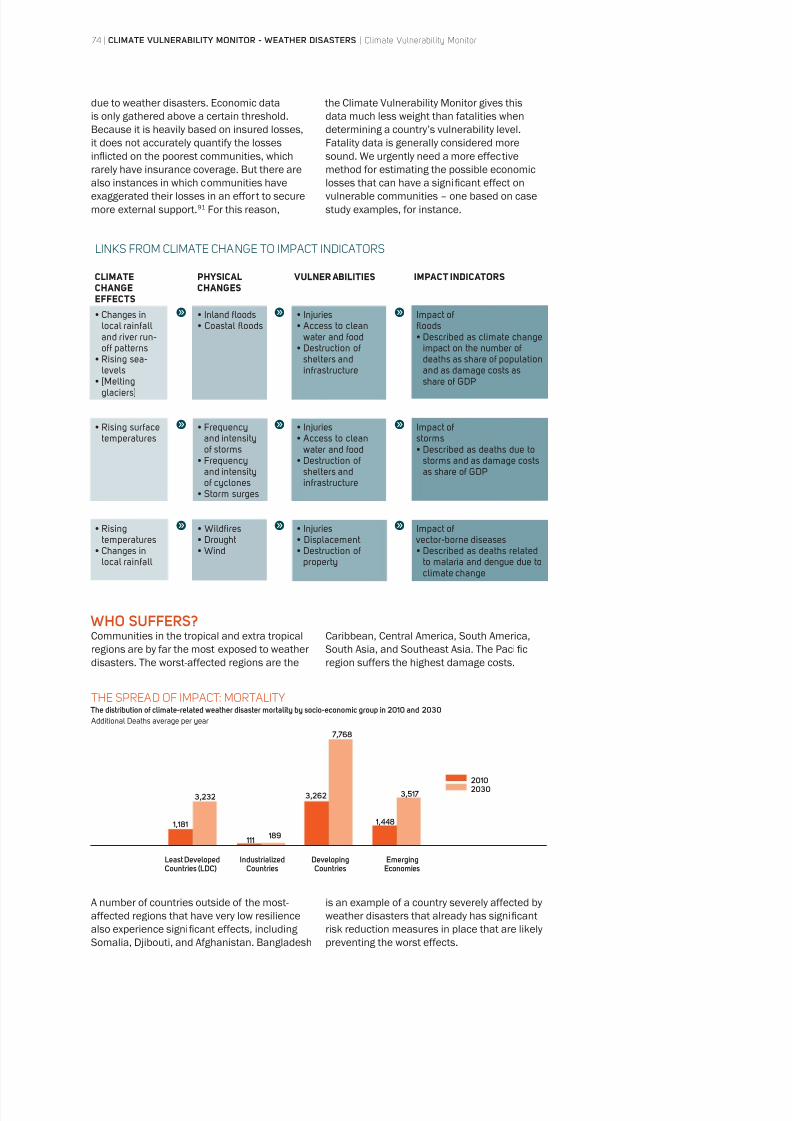
8/8/2019 Climate Vulnerability Monitor 2010: The State of the Climate Crisis
http://slidepdf.com/reader/full/climate-vulnerability-monitor-2010-the-state-of-the-climate-crisis 76/291
due to weather disasters. Economic data
is only gathered above a certain threshold.
Because it is heavily based on insured losses,
it does not accurately quantify the losses
inflicted on the poorest communities, which
rarely have insurance coverage. But there are
also instances in which communities have
exaggerated their losses in an effort to secure
more external support.91 For this reason,
the Climate Vulnerability Monitor gives this
data much less weight than fatalities when
determining a country’s vulnerability level.
Fatality data is generally considered more
sound. We urgently need a more effective
method for estimating the possible economic
losses that can have a significant effect on
vulnerable communities – one based on case
study examples, for instance.
A number of countries outside of the most-
affected regions that have very low resilience
also experience significant effects, including
Somalia, Djibouti, and Afghanistan. Bangladesh
is an example of a country severely affected by
weather disasters that already has significant
risk reduction measures in place that are likely
preventing the worst effects.
LINKS FROM CLIMATE CHANGE TO IMPACT INDICATORS
CLIMATECHANGEEFFECTS
PHYSICALCHANGES
VULNER ABILITIES IMPACT INDICATORS
local rainfalland river run-off patterns
levels
glaciers]
water and food
shelters andinfrastructure
Impact of
impact on the number of
deaths as share of populationand as damage costs asshare of GDP
temperatures
and intensityof storms
and intensityof cyclones
water and food
shelters andinfrastructure
Impact ofstorms
storms and as damage costsas share of GDP
temperatures
local rainfall
property
Impact of vector-borne diseases
to malaria and dengue due toclimate change
WHO SUFFERS?Communities in the tropical and extra tropical
regions are by far the most exposed to weather
disasters. The worst-affected regions are the
Caribbean, Central America, South America,
South Asia, and Southeast Asia. The Pacific
region suffers the highest damage costs.
THE SPREAD OF IMPACT: MORTALITY
The distribution of climate-related weather disaster mortality by socio-economic group in 2010 and 2030 Additional Deaths average per year
1,181
3,232
111 189
3,262
7,768
1,448
3,517
20102030
Least DevelopedCountries (LDC)
IndustrializedCountries
DevelopingCountries
EmergingEconomies
74 | CLIMATE VULNERABILITY MONITOR - WEATHER DISASTERS | Climate Vulnerability Monitor
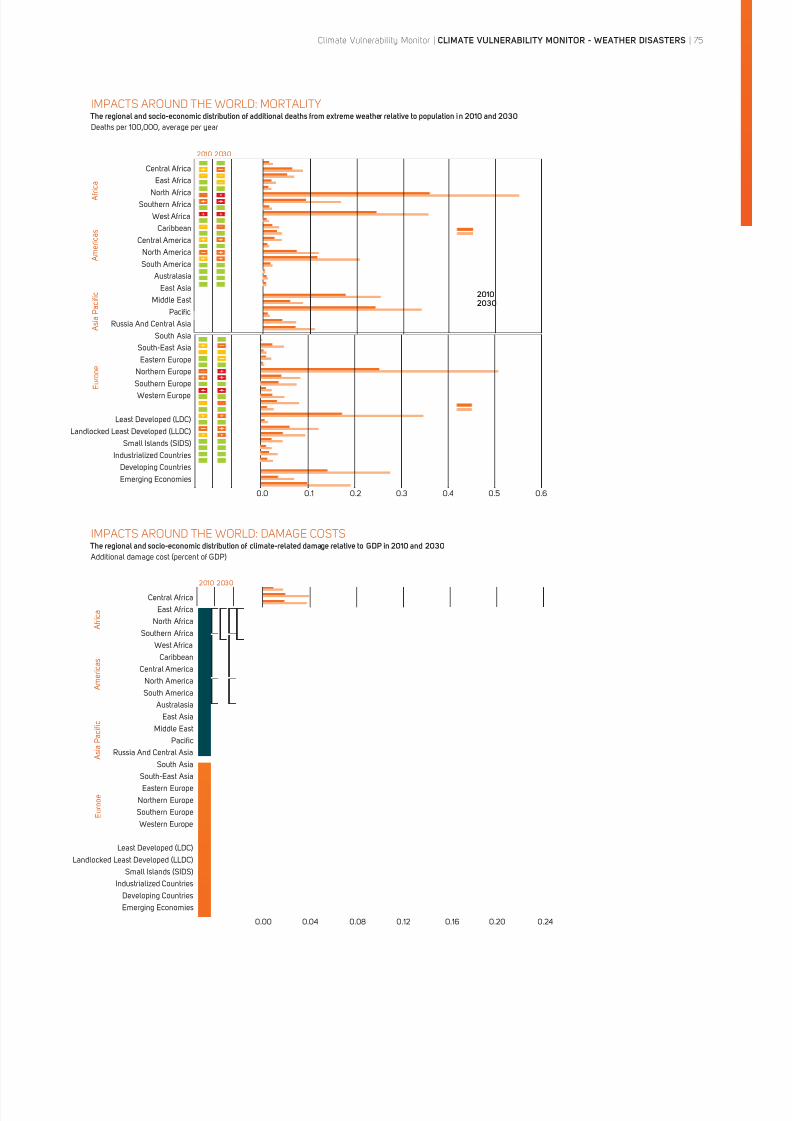
8/8/2019 Climate Vulnerability Monitor 2010: The State of the Climate Crisis
http://slidepdf.com/reader/full/climate-vulnerability-monitor-2010-the-state-of-the-climate-crisis 77/291
IMPACTS AROUND THE WORLD: MORTALITY The regional and socio-economic distribution of additional deaths from extreme weather relative to population in 2010 and 2030Deaths per 100,000, average per year
Central Africa
East Africa
North Africa
Southern Africa
West Africa
Caribbean
Central America
North America
South America
Australasia
East Asia
Middle East
Pacific
Russia And Central Asia
South Asia
South-East Asia
Eastern Europe
Northern Europe
Southern Europe
Western Europe
Least Developed (LDC)
Landlocked Least Developed (LLDC)
Small Islands (SIDS)
Industrialized Countries
Developing Countries
Emerging Economies
2010 2030
A f r i c a
A m e r i c a s
A s i a P a c i fi c
E u r o p e
0.0 0.1 0.2 0.4 0.50.3 0.6
20102030
IMPACTS AROUND THE WORLD: DAMAGE COSTS The regional and socio-economic distribution of climate-related damage relative to GDP in 2010 and 2030 Additional damage cost (percent of GDP)
Central Africa
East Africa
North Africa
Southern Africa
West Africa
Caribbean
Central America
North America
South America
Australasia
East Asia
Middle East
Pacific
Russia And Central Asia
South Asia
South-East Asia
Eastern Europe
Northern Europe
Southern Europe
Western Europe
Least Developed (LDC)
Landlocked Least Developed (LLDC)
Small Islands (SIDS)
Industrialized Countries
Developing Countries
Emerging Economies
2010 2030
A f r i c a
A m e r i c a s
A s i a P a c i fi c
E u r o p e
0.00
20102030
0.04 0.08 0.12 0.16 0.20 0.24
Climate Vulnerability Monitor | CLIMATE VULNERABILITY MONITOR - WEATHER DISASTERS | 75
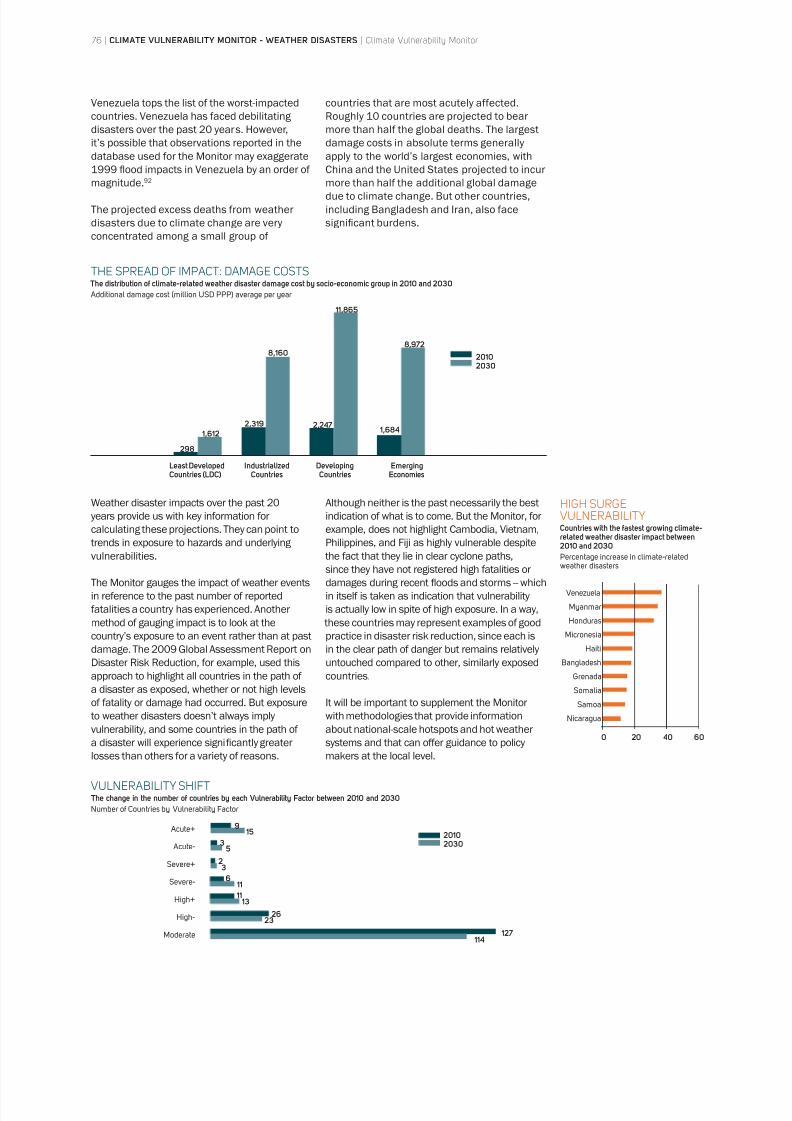
8/8/2019 Climate Vulnerability Monitor 2010: The State of the Climate Crisis
http://slidepdf.com/reader/full/climate-vulnerability-monitor-2010-the-state-of-the-climate-crisis 78/291
Venezuela tops the list of the worst-impacted
countries. Venezuela has faced debilitating
disasters over the past 20 years. However,
it’s possible that observations reported in the
database used for the Monitor may exaggerate
1999 flood impacts in Venezuela by an order of
magnitude.92
The projected excess deaths from weather
disasters due to climate change are very
concentrated among a small group of
countries that are most acutely affected.
Roughly 10 countries are projected to bear
more than half the global deaths. The largest
damage costs in absolute terms generally
apply to the world’s largest economies, with
China and the United States projected to incur
more than half the additional global damage
due to climate change. But other countries,
including Bangladesh and Iran, also face
significant burdens.
Weather disaster impacts over the past 20
years provide us with key information for
calculating these projections. They can point to trends in exposure to hazards and underlying
vulnerabilities.
The Monitor gauges the impact of weather events
in reference to the past number of reported
fatalities a country has experienced. Another
method of gauging impact is to look at the
country’s exposure to an event rather than at past
damage. The 2009 Global Assessment Report on
Disaster Risk Reduction, for example, used this
approach to highlight all countries in the path of
a disaster as exposed, whether or not high levels
of fatality or damage had occurred. But exposure
to weather disasters doesn’t always implyvulnerability, and some countries in the path of
a disaster will experience significantly greater
losses than others for a variety of reasons.
Although neither is the past necessarily the best
indication of what is to come. But the Monitor, for
example, does not highlight Cambodia, Vietnam,Philippines, and Fiji as highly vulnerable despite
the fact that they lie in clear cyclone paths,
since they have not registered high fatalities or
damages during recent floods and storms -- which
in itself is taken as indication that vulnerability
is actually low in spite of high exposure. In a way,
these countries may represent examples of good
practice in disaster risk reduction, since each is
in the clear path of danger but remains relatively
untouched compared to other, similarly exposed
countries.
It will be important to supplement the Monitor
with methodologies that provide informationabout national-scale hotspots and hot weather
systems and that can offer guidance to policy
makers at the local level.
THE SPREAD OF IMPACT: DAMAGE COSTS The distribution of climate-related weather disaster damage cost by socio-economic group in 2010 and 2030 Additional damage cost (million USD PPP) average per year
20102030
298
1,6122,319
8,160
2,247
11,865
1,684
8,972
Least DevelopedCountries (LDC)
IndustrializedCountries
DevelopingCountries
EmergingEconomies
VULNERABILITY SHIFT The change in the number of countries by each Vulnerability Factor between 2010 and 2030Number of Countries by Vulnerability Factor
Acute+
Acute-
Severe+
Severe-
High+
High-
Moderate
9 15
35
236
11 11
13
2623
127 114
20102030
HIGH SURGEVULNERABILITYCountries with the fastest growing climate-related weather disaster impact between2010 and 2030Percentage increase in climate-relatedweather disasters
Venezuela
Myanmar
Honduras
Micronesia
Haiti
Bangladesh
Grenada
Somalia
Samoa
Nicaragua
0 20 40 60
76 | CLIMATE VULNERABILITY MONITOR - WEATHER DISASTERS | Climate Vulnerability Monitor
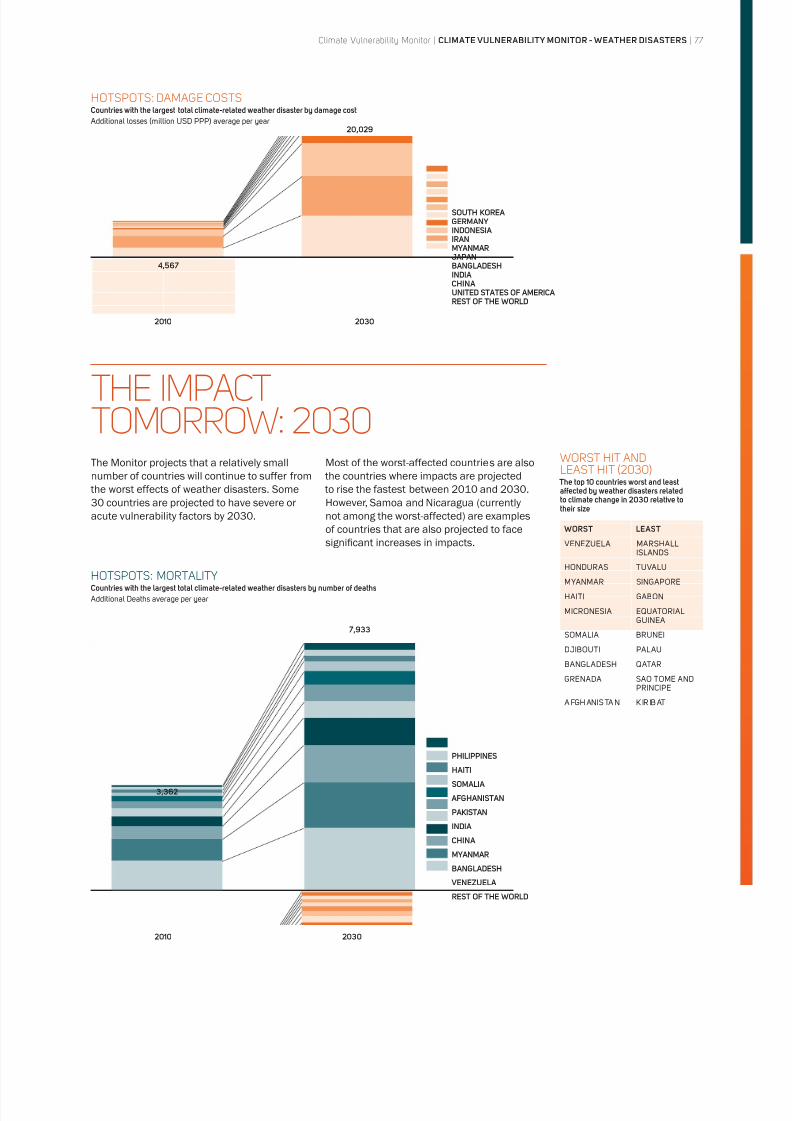
8/8/2019 Climate Vulnerability Monitor 2010: The State of the Climate Crisis
http://slidepdf.com/reader/full/climate-vulnerability-monitor-2010-the-state-of-the-climate-crisis 79/291
The Monitor projects that a relatively small
number of countries will continue to suffer from
the worst effects of weather disasters. Some
30 countries are projected to have severe or
acute vulnerability factors by 2030.
Most of the worst-affected countries are also
the countries where impacts are projected
to rise the fastest between 2010 and 2030.
However, Samoa and Nicaragua (currently
not among the worst-affected) are examples
of countries that are also projected to facesignificant increases in impacts.
THE IMPACTTOMORROW: 2030
WORST HIT ANDLEAST HIT (2030)
The top 10 countries worst and leastaffected by weather disasters relatedto climate change in 2030 relative totheir size
WORST LEAST
VENEZUELA MARSHALLISLANDS
HONDURAS TUVALU
MYANMAR SINGAPORE
HAITI GABON
MICRONESIA EQUATORIALGUINEA
SOMALIA BRUNEI
DJIBOUTI PALAU
BANGLADESH QATAR
GRENADA SAO TOME ANDPRINCIPE
A FGHANIS TA N K IR IB AT I
HOTSPOTS: MORTALITYCountries with the largest total climate-related weather disasters by number of deaths Additional Deaths average per year
2010 2030
PHILIPPINES
HAITI
SOMALIA
AFGHANISTAN
PAKISTAN
INDIA
CHINA
MYANMAR
BANGLADESH
VENEZUELA
REST OF THE WORLD
3,362
7,933
HOTSPOTS: DAMAGE COSTSCountries with the largest total climate-related weather disaster by damage cost Additional losses (million USD PPP) average per year
2010 2030
SOUTH KOREAGERMANYINDONESIAIRANMYANMARJAPANBANGLADESHINDIACHINAUNITED STATES OF AMERICAREST OF THE WORLD
4,567
20,029
Climate Vulnerability Monitor | CLIMATE VULNERABILITY MONITOR - WEATHER DISASTERS | 77
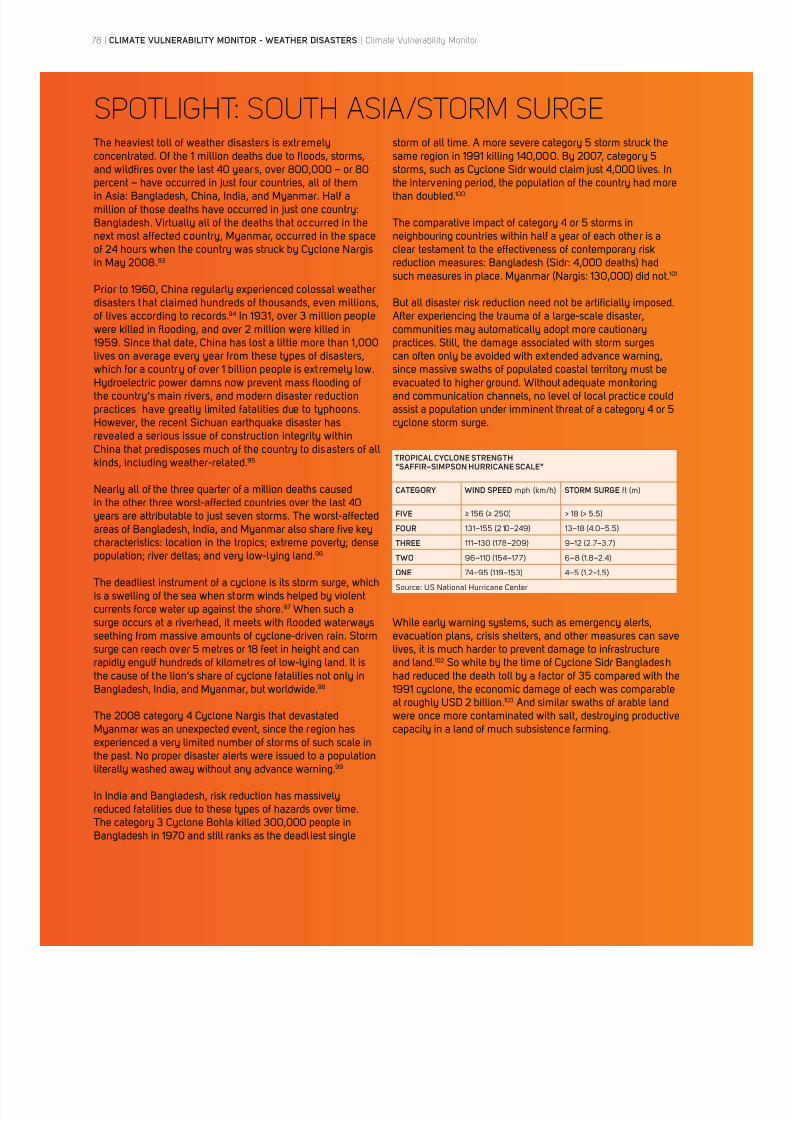
8/8/2019 Climate Vulnerability Monitor 2010: The State of the Climate Crisis
http://slidepdf.com/reader/full/climate-vulnerability-monitor-2010-the-state-of-the-climate-crisis 80/291
SPOTLIGHT: SOUTH ASIA/STORM SURGEThe heaviest toll of weather disasters is extremelyand wildfires over the last 40 years, over 800,000 – or 80in Asia: Bangladesh, China, India, and Myanmar. Half aBangladesh. Virtually all of the deaths that occurred in thenext most affected country, Myanmar, occurred in the spaceof 24 hours when the country was struck by Cyclone Nargisin May 2008.93
Prior to 1960, China regularly experienced colossal weatherdisasters that claimed hundreds of thousands, even millions,of lives according to records.94 In 1931, over 3 million people1959. Since that date, China has lost a little more than 1,000
lives on average every year from these types of disasters,which for a country of over 1 billion people is extremely low.the country’s main rivers, and modern disaster reductionpractices have greatly limited fatalities due to typhoons.revealed a serious issue of construction integrity withinChina that predisposes much of the country to disasters of allkinds, including weather-related.95
in the other three worst-affected countries over the last 40
areas of Bangladesh, India, and Myanmar also share five keycharacteristics: location in the tropics; extreme poverty; densepopulation; river deltas; and very low-lying land.96
The deadliest instrument of a cyclone is its storm surge, whichis a swelling of the sea when storm winds helped by violentcurrents force water up against the shore.97 When such aseething from massive amounts of cyclone-driven rain. Stormsurge can reach over 5 metres or 18 feet in height and canrapidly engulf hundreds of kilometres of low-lying land. It isthe cause of the lion’s share of cyclone fatalities not only inBangladesh, India, and Myanmar, but worldwide.98
The 2008 category 4 Cyclone Nargis that devastatedMyanmar was an unexpected event, since the region hasexperienced a very limited number of storms of such scale inthe past. No proper disaster alerts were issued to a populationliterally washed away without any advance warning.99
In India and Bangladesh, risk reduction has massivelyreduced fatalities due to these types of hazards over time.The category 3 Cyclone Bohla killed 300,000 people inBangladesh in 1970 and still ranks as the deadliest single
storm of all time. A more severe category 5 storm struck thesame region in 1991 killing 140,000. By 2007, category 5
the intervening period, the population of the country had morethan doubled.100
The comparative impact of category 4 or 5 storms inneighbouring countries within half a year of each other is aclear testament to the effectiveness of contemporary riskreduction measures: Bangladesh (Sidr: 4,000 deaths) hadsuch measures in place. Myanmar (Nargis: 130,000) did not.101
But all disaster risk reduction need not be artificially imposed. After experiencing the trauma of a large-scale disaster,communities may automatically adopt more cautionarypractices. Still, the damage associated with storm surges
can often only be avoided with extended advance warning,since massive swaths of populated coastal territory must beand communication channels, no level of local practice couldassist a population under imminent threat of a category 4 or 5cyclone storm surge.
While early warning systems, such as emergency alerts,evacuation plans, crisis shelters, and other measures can savelives, it is much harder to prevent damage to infrastructureand land.102 So while by the time of Cyclone Sidr Bangladeshhad reduced the death toll by a factor of 35 compared with the1991 cyclone, the economic damage of each was comparableat roughly USD 2 billion.103 And similar swaths of arable land
were once more contaminated with salt, destroying productivecapacity in a land of much subsistence farming.
TROPICAL CYCLONE STRENGTH“SAFFIR–SIMPSON HURRICANE SCALE”
CATEGORY WIND SPEED mph (km/h) STORM SURGE ft (m)
FIVE ≥ 156 (≥ 250) > 18 (> 5.5)
FOUR 131–155 (2 10–249) 13–18 (4.0–5.5)
THREE 111–130 (178–209) 9–12 (2.7–3.7)
TWO 96–110 (154–177) 6–8 (1.8–2.4)
ONE 74–95 (119–153) 4–5 (1.2–1.5)
Source: US National Hurricane Center
78 | CLIMATE VULNERABILITY MONITOR - WEATHER DISASTERS | Climate Vulnerability Monitor
8/8/2019 Climate Vulnerability Monitor 2010: The State of the Climate Crisis
http://slidepdf.com/reader/full/climate-vulnerability-monitor-2010-the-state-of-the-climate-crisis 81/291
THE ASSESSMENTThe Monitor assesses vulnerability to weather disasters by
applying climate change risk factors for floods developed by
the WHO, and storms and wildfires to historical (1990-2009)
national statistics of mortality (80% weighting) and relative
damage costs (20% weighting). The climate risk factor for
floods is higher than for storms or wildfires, reflecting a stronger
scientific link between climate change and heavy rainfall and
other flooding triggers.104 The low weighting for damage costs
reflects the lower quality and coverage of the base information.
The number of people affected or in need of aid as a result
of disasters is not included as an indicator, because each
country and extreme event is likely to come up with a different
definition of “affected”. Only those countries with a historical
record of deaths and damage from floods, storms, and wildfires
will register as vulnerable to any degree. Countries with higher
registered impacts to such phenomena over the last 20 yearswill register higher factors of vulnerability, as past impact is
deemed an accurate indicator of future impact, capturing
both exposure to floods, storms, and wildfires, and the level of
protection or underlying vulnerabilities. Mortality is assessed
relative to total population, and damage costs are assessed
relative to total GDP, so that vulnerability factors take into
account the relative burden of impacts within a given country.
The methodology for assessing vulnerability to extreme
weather is less robust than for the Health Impact section of
the Monitor. This is mainly because the reporting quality of
economic damage is poor across the board. But also because
mortality in extreme weather has been signifi
cantly reduced inmodern times and is therefore no longer the best indicator of
generalized vulnerability. However, those most vulnerable to
weather disasters still register high levels of mortality, and so
the Monitor is accurate in identifying these highly vulnerable
countries. The few countries with factors of Acute or Severe
have all experienced significant loss of life as a result of
extreme weather in recent years. Yet since mortality profiles
are quite similar and low across the board, many countries
register similar factors of vulnerability. Countries with
significant economic damages as a result of floods, storms,
and wildfires, however, will also have their higher vulnerability
recognized by the Monitor despite having low levels of
mortality in many cases.
Mexico (Moderate/Moderate) stands out in particular as a
country whose vulnerability appears to be underestimated.
On closer inspection, though, Mexico is a large country with a
demonstrated ability to minimize loss of human life even in the
most severe weather conditions. Mexico is located in the main
tropical cyclone pathway of the southern Caribbean and has
suffered dozens of devastating hurricanes in recent history. In
2005, the category 1 Hurricane Stan affected some 2 million
people, killing 36, with unprecedented torrential rain that
caused USD 2.5 billion in damage. A few weeks later, category
5 Hurricane Wilma, the most intense cyclone ever recorded
in the Atlantic, affected 1 million people and claimed USD 5
billion in damage but only 7 lives. Over the last 10 years, 29major tropical cyclones have claimed just 174 lives out of a total
population of over 110 million people. The billions of dollars
in damage caused is only a fraction of a trillion-dollar-a-year
economy.105 Mexico is a good example of how communities
under heavy environmental and climate stresses can minimize
impacts, in particular the loss of human life, even when millions
of people are affected. While the damage to infrastructure
caused by extreme weather is still high, financial risks can be
covered through insurance, enabling affected communities to
bounce back quickly from severe storms and flooding.
The United States (Moderate/Moderate) is another country
with surprisingly low vulnerability to extreme weather in the
Monitor. As with Mexico, this is mainly due to the sheer size of
the country and its economy. But, again, it is also due to the
minimal human casualties caused by major storms, which is
the main base measure for the Monitor. The US has three times
the population of Mexico and ten times its economy, so even
the most expensive tropical storm in history (Hurricane Katrinacaused USD 125 billion in damage) and the deadliest of recent
US history (with over 1800 deaths) is simply dwarfed by the
country’s sheer size. Many of the most serious storms that have
affected the US in recent years, such as hurricanes Charley,
Dennis, Ida, Jeanne, and Rita have all claimed less than 10
lives each. Exceptionally deadly hurricanes by US standards,
such as Allison (41 casualties), Ike (82), Ivan (52), Frances (47),
and Gustav (43), are nevertheless significantly less deadly than
weather disasters occurring in acutely vulnerable countries
such as Bangladesh or Myanmar, which have claimed tens of
thousands of lives.106
A series of small island states residing in known cyclone pathsalso find themselves with relatively low vulnerability factors of
Moderate/Moderate; they include Barbados, French Polynesia,
Kiribati, Marshall Islands, Mauritius, New Caledonia, Saint
Lucia, Trinidad and Tobago, and Tuvalu. But all these countries
combined have registered only 29 deaths from all storms and
floods since 1990, demonstrating low vulnerability to loss of life
from extreme weather. Mauritius aside, all combined recorded
storms and floods over that time cost the other eight countries
just USD 125 million (or about USD 700,000 per country, per
year if averaged). Mauritius lost around USD 150 million in each
of two major storms in the 1990s, but this was less than 2% of
a USD 8 billion economy. Antigua and Barbuda (High-/Severe+),
on the other hand, lost USD 400 million to Hurricane Luis in
1995, or almost two thirds of its annual GDP at the time.107
Venezuela (Acute+/Acute+) received the highest factor of
vulnerability because the Vargas flood disaster of 1999 is
recorded to have claimed 30,000 lives in a country of some
25 million people. However, a recent study has revealed that
the reported death toll was inaccurate and that the actual
death toll was likely not more than 700, which would result
in a much lower factor of vulnerability for Venezuela. Since
the Monitor’s climate risk factor for floods is higher than for
storms or wildfires, the Venezuelan Vargas flood anomaly
has had a greater impact on its overall vulnerability factor.
The example illustrates that the Monitor is highly dependent
on historical data and relies on key data that varies widely in terms of quality.108
Climate Vulnerability Monitor | CLIMATE VULNERABILITY MONITOR - WEATHER DISASTERS | 79
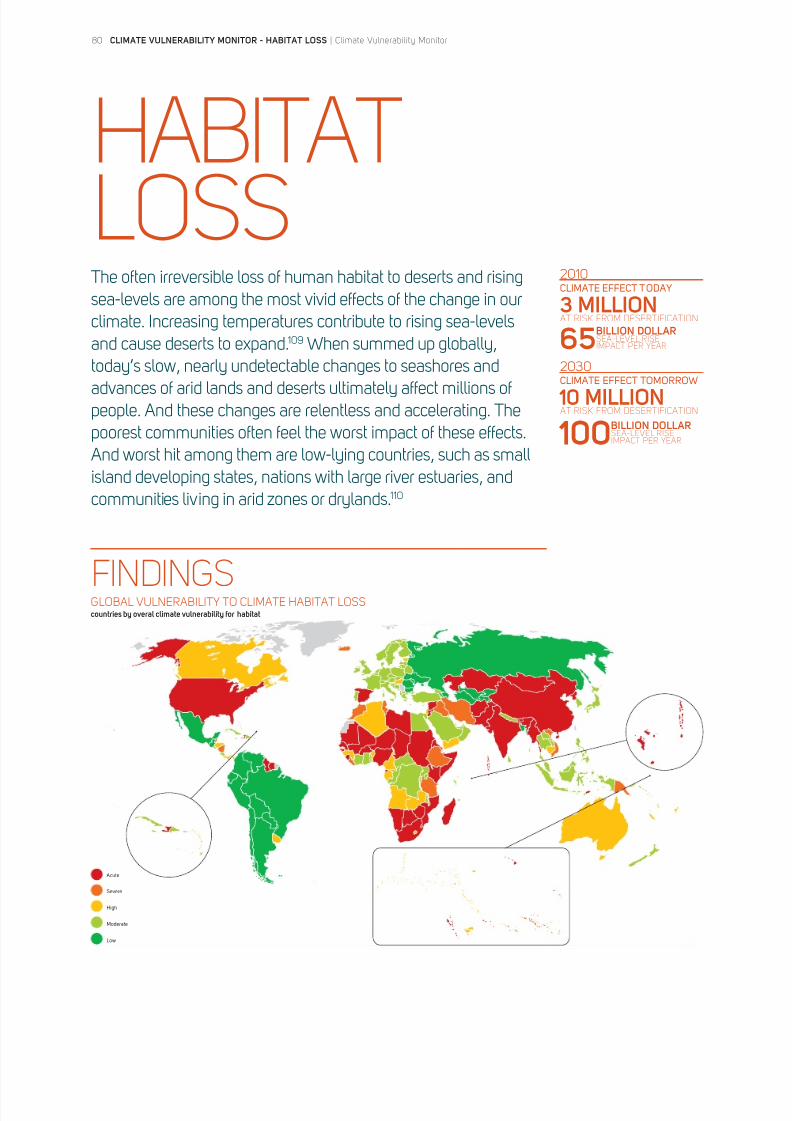
8/8/2019 Climate Vulnerability Monitor 2010: The State of the Climate Crisis
http://slidepdf.com/reader/full/climate-vulnerability-monitor-2010-the-state-of-the-climate-crisis 82/291
80 | CLIMATE VULNERABILITY MONITOR - HABITAT LOSS | Climate Vulnerability Monitor
HABITATLOSSThe often irreversible loss of human habitat to deserts and risingsea-levels are among the most vivid effects of the change in ourclimate. Increasing temperatures contribute to rising sea-levelsand cause deserts to expand.109 When summed up globally,today’s slow, nearly undetectable changes to seashores andadvances of arid lands and deserts ultimately affect millions ofpeople. And these changes are relentless and accelerating. Thepoorest communities often feel the worst impact of these effects.And worst hit among them are low-lying countries, such as smallisland developing states, nations with large river estuaries, andcommunities living in arid zones or drylands.110
FINDINGS
CLIMATE EFFECT TODAY 3 MILLION
CLIMATE EFFECT TOMORROW 10 MILLION
2010
2030
AT RISK FROM DESERTIFICATION
AT RISK FROM DESERTIFICATION
BILLION DOLLARSEA-LEVEL RISEIMPACT PER YEAR65
100BILLION DOLLARSEA-LEVEL RISEIMPACT PER YEAR
GLOBAL VULNERABILITY TO CLIMATE HABITAT LOSScountries by overal climate vulnerability for habitat
Acute
Severe
High
Moderate
Low
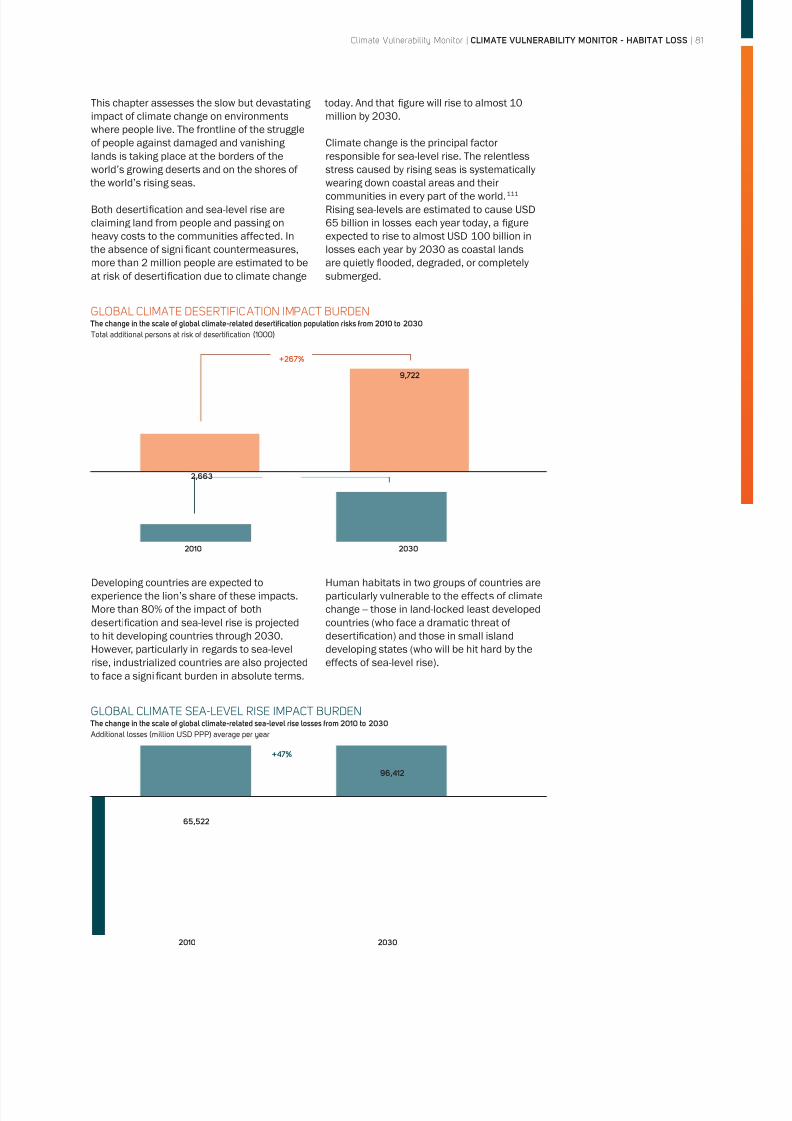
8/8/2019 Climate Vulnerability Monitor 2010: The State of the Climate Crisis
http://slidepdf.com/reader/full/climate-vulnerability-monitor-2010-the-state-of-the-climate-crisis 83/291
Climate Vulnerability Monitor | CLIMATE VULNERABILITY MONITOR - HABITAT LOSS | 81
This chapter assesses the slow but devastating
impact of climate change on environments
where people live. The frontline of the struggle
of people against damaged and vanishing
lands is taking place at the borders of the
world’s growing deserts and on the shores of
the world’s rising seas.
Both desertification and sea-level rise are
claiming land from people and passing on
heavy costs to the communities affected. In
the absence of significant countermeasures,
more than 2 million people are estimated to be
at risk of desertification due to climate change
today. And that figure will rise to almost 10
million by 2030.
Climate change is the principal factor
responsible for sea-level rise. The relentless
stress caused by rising seas is systematically
wearing down coastal areas and their
communities in every part of the world.111
Rising sea-levels are estimated to cause USD
65 billion in losses each year today, a figure
expected to rise to almost USD 100 billion in
losses each year by 2030 as coastal lands
are quietly flooded, degraded, or completely
submerged.
Developing countries are expected to
experience the lion’s share of these impacts.
More than 80% of the impact of both
desertification and sea-level rise is projected
to hit developing countries through 2030.
However, particularly in regards to sea-level
rise, industrialized countries are also projected
to face a significant burden in absolute terms.
Human habitats in two groups of countries are
particularly vulnerable to the effects of climate
change -- those in land-locked least developed
countries (who face a dramatic threat of
desertification) and those in small island
developing states (who will be hit hard by the
effects of sea-level rise).
GLOBAL CLIMATE DESERTIFICATION IMPACT BURDEN The change in the scale of global climate-related desertification population risks from 2010 to 2030Total additional persons at risk of desertification (1000)
2,663
9,722
2010 2030
+267%
GLOBAL CLIMATE SEA-LEVEL RISE IMPACT BURDEN The change in the scale of global climate-related sea-level rise losses from 2010 to 2030 Additional losses (million USD PPP) average per year
2010 2030
65,522
96,412
+47%
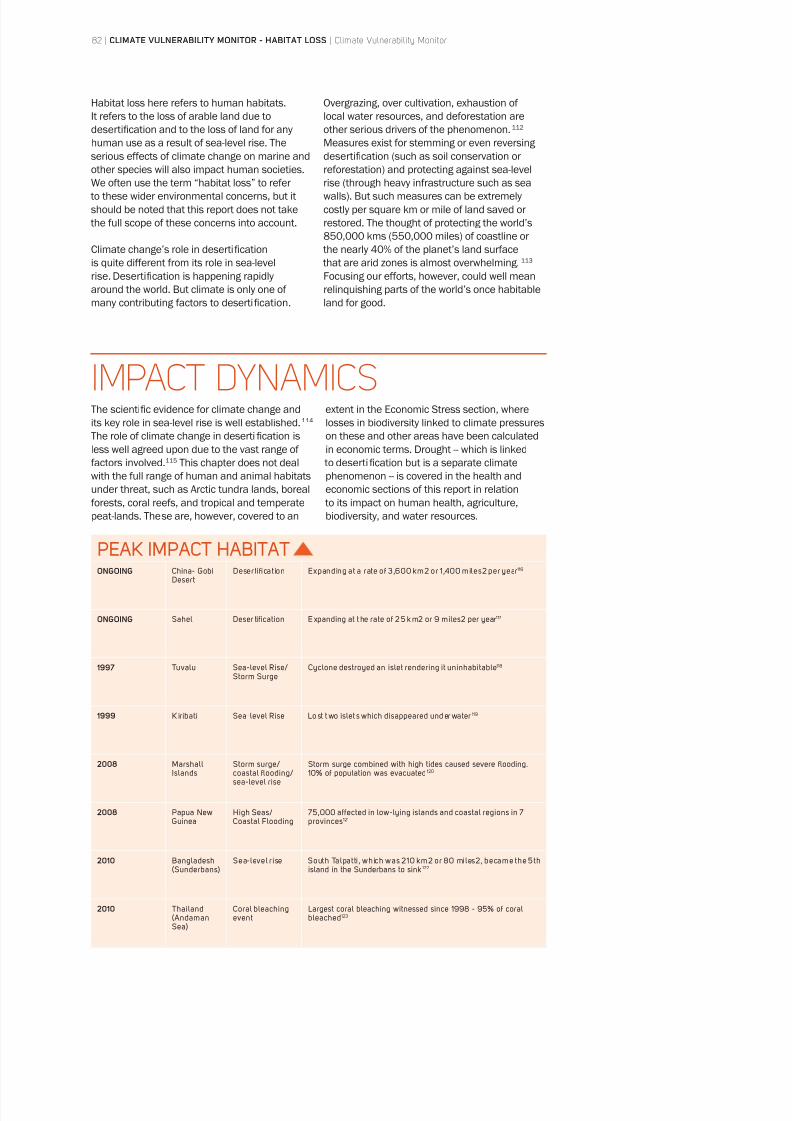
8/8/2019 Climate Vulnerability Monitor 2010: The State of the Climate Crisis
http://slidepdf.com/reader/full/climate-vulnerability-monitor-2010-the-state-of-the-climate-crisis 84/291
Habitat loss here refers to human habitats.
It refers to the loss of arable land due to
desertification and to the loss of land for any
human use as a result of sea-level rise. The
serious effects of climate change on marine and
other species will also impact human societies.
We often use the term “habitat loss” to refer
to these wider environmental concerns, but it
should be noted that this report does not take
the full scope of these concerns into account.
Climate change’s role in desertification
is quite different from its role in sea-level
rise. Desertification is happening rapidly
around the world. But climate is only one of
many contributing factors to desertification.
Overgrazing, over cultivation, exhaustion of
local water resources, and deforestation are
other serious drivers of the phenomenon.112
Measures exist for stemming or even reversing
desertification (such as soil conservation or
reforestation) and protecting against sea-level
rise (through heavy infrastructure such as sea
walls). But such measures can be extremely
costly per square km or mile of land saved or
restored. The thought of protecting the world’s
850,000 kms (550,000 miles) of coastline or
the nearly 40% of the planet’s land surface
that are arid zones is almost overwhelming.113
Focusing our efforts, however, could well mean
relinquishing parts of the world’s once habitable
land for good.
IMPACT DYNAMICSThe scientific evidence for climate change and
its key role in sea-level rise is well established.114
The role of climate change in desertification is
less well agreed upon due to the vast range of
factors involved.115 This chapter does not deal
with the full range of human and animal habitats
under threat, such as Arctic tundra lands, boreal
forests, coral reefs, and tropical and temperate
peat-lands. These are, however, covered to an
extent in the Economic Stress section, where
losses in biodiversity linked to climate pressures
on these and other areas have been calculated
in economic terms. Drought -- which is linked
to desertification but is a separate climate
phenomenon -- is covered in the health and
economic sections of this report in relation
to its impact on human health, agriculture,
biodiversity, and water resources.
PEAK IMPACT HABITATONGOING China- Gobi
DesertDesertification Expanding at a rate of 3,600 km2 or 1,400 miles2 per year 116
ONGOING Sahel Deser tification E xpanding at t he rate of 2 5 k m2 or 9 miles2 per year117
1997 Tuvalu Sea-level Rise/Storm Surge
Cyclone destroyed an islet rendering it uninhabitable118
1999 K iribati Sea-level Rise Lo st t wo islet s which disappeared und er water 119
2008 MarshallIslands
Storm surge/coastal flooding/sea-level rise
Storm surge combined with high tides caused severe flooding.10% of population was evacuated 120
2008 Papua NewGuinea
High Seas/Coastal Flooding
75,000 affected in low-lying islands and coastal regions in 7provinces121
2010 Bangladesh(Sunderbans)
Sea-level rise South Talpatti , which was 210 km2 or 80 miles2, became the 5thisland in the Sunderbans to sink 122
2010 Thailand(AndamanSea)
Coral bleachingevent
Largest coral bleaching witnessed since 1998 - 95% of coralbleached123
82 | CLIMATE VULNERABILITY MONITOR - HABITAT LOSS | Climate Vulnerability Monitor
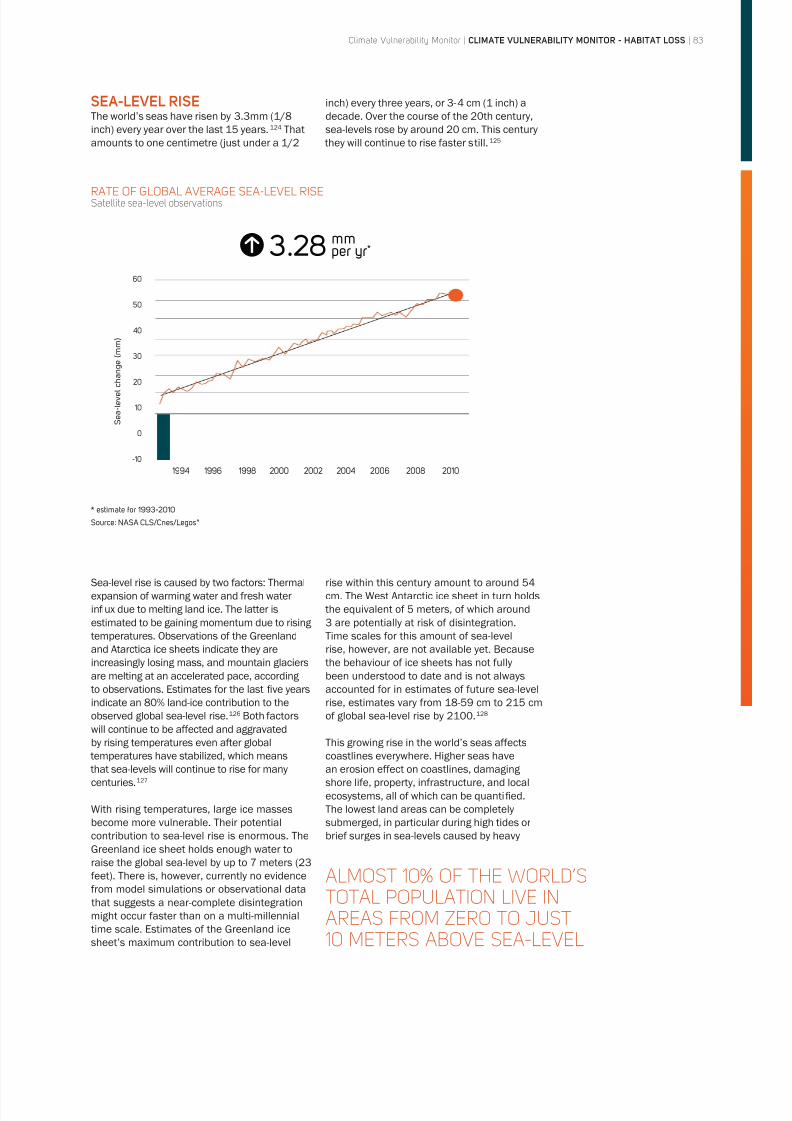
8/8/2019 Climate Vulnerability Monitor 2010: The State of the Climate Crisis
http://slidepdf.com/reader/full/climate-vulnerability-monitor-2010-the-state-of-the-climate-crisis 85/291
SEA-LEVEL RISEThe world’s seas have risen by 3.3mm (1/8
inch) every year over the last 15 years.124 That
amounts to one centimetre (just under a 1/2
inch) every three years, or 3-4 cm (1 inch) a
decade. Over the course of the 20th century,
sea-levels rose by around 20 cm. This century
they will continue to rise faster still.125
Sea-level rise is caused by two factors: Thermal
expansion of warming water and fresh water
influx due to melting land ice. The latter is
estimated to be gaining momentum due to rising
temperatures. Observations of the Greenland
and Atarctica ice sheets indicate they are
increasingly losing mass, and mountain glaciers
are melting at an accelerated pace, according
to observations. Estimates for the last five years
indicate an 80% land-ice contribution to the
observed global sea-level rise.126 Both factorswill continue to be affected and aggravated
by rising temperatures even after global
temperatures have stabilized, which means
that sea-levels will continue to rise for many
centuries.127
With rising temperatures, large ice masses
become more vulnerable. Their potential
contribution to sea-level rise is enormous. The
Greenland ice sheet holds enough water to
raise the global sea-level by up to 7 meters (23
feet). There is, however, currently no evidence
from model simulations or observational data that suggests a near-complete disintegration
might occur faster than on a multi-millennial
time scale. Estimates of the Greenland ice
sheet’s maximum contribution to sea-level
rise within this century amount to around 54
cm. The West Antarctic ice sheet in turn holds
the equivalent of 5 meters, of which around
3 are potentially at risk of disintegration.
Time scales for this amount of sea-level
rise, however, are not available yet. Because
the behaviour of ice sheets has not fully
been understood to date and is not always
accounted for in estimates of future sea-level
rise, estimates vary from 18-59 cm to 215 cm
of global sea-level rise by 2100.128
This growing rise in the world’s seas affects
coastlines everywhere. Higher seas have
an erosion effect on coastlines, damaging
shore life, property, infrastructure, and local
ecosystems, all of which can be quantified.
The lowest land areas can be completely
submerged, in particular during high tides or
brief surges in sea-levels caused by heavy
RATE OF GLOBAL AVERAGE SEA-LEVEL RISESatellite sea-level observations
* estimate for 1993-2010
3.28 mmper yr*
60
50
40
30
20
10
0
-10
1994 1996 1998 2000 2002 2004 2006 2008 2010
S e a - l e v e l c h a n g e ( m m )
Source: NASA CLS/Cnes/Legos”
ALMOST 10% OF THE WORLD’S
TOTAL POPULATION LIVE INAREAS FROM ZERO TO JUST10 METERS ABOVE SEA-LEVEL
Climate Vulnerability Monitor | CLIMATE VULNERABILITY MONITOR - HABITAT LOSS | 83
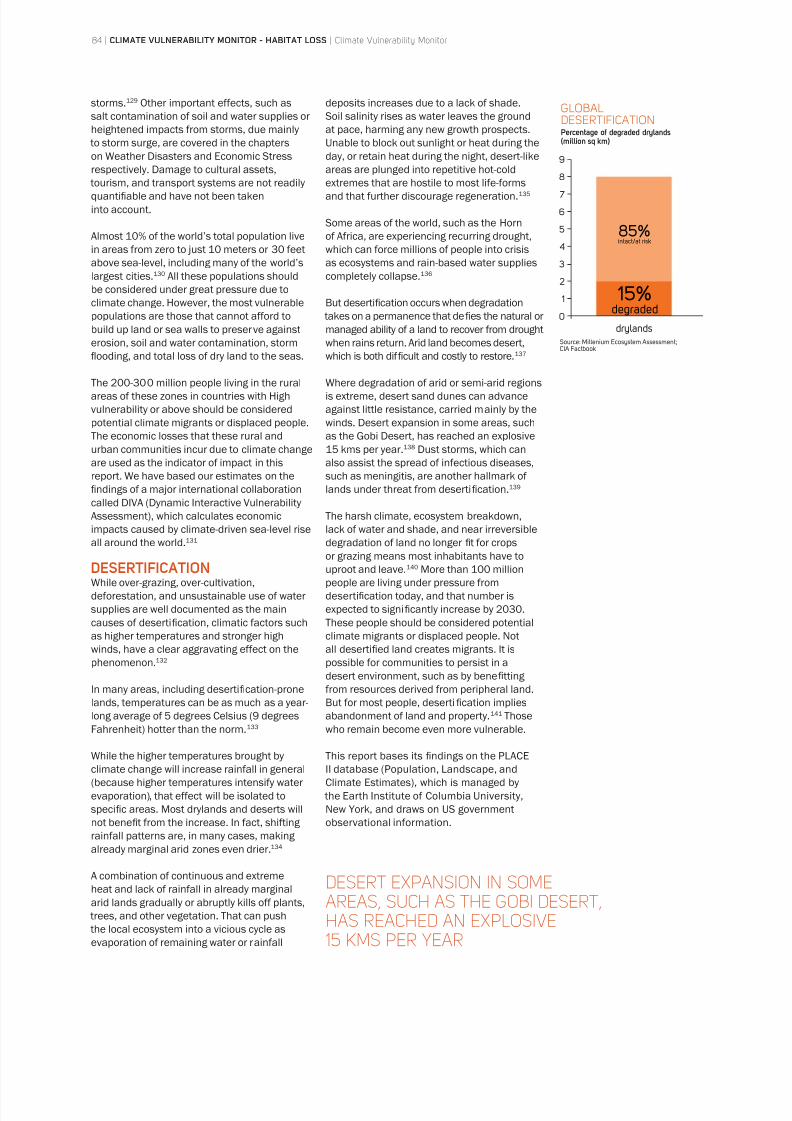
8/8/2019 Climate Vulnerability Monitor 2010: The State of the Climate Crisis
http://slidepdf.com/reader/full/climate-vulnerability-monitor-2010-the-state-of-the-climate-crisis 86/291
storms.129 Other important effects, such as
salt contamination of soil and water supplies or
heightened impacts from storms, due mainly
to storm surge, are covered in the chapters
on Weather Disasters and Economic Stress
respectively. Damage to cultural assets,
tourism, and transport systems are not readily
quantifiable and have not been taken
into account.
Almost 10% of the world’s total population live
in areas from zero to just 10 meters or 30 feet
above sea-level, including many of the world’s
largest cities.130 All these populations should
be considered under great pressure due to
climate change. However, the most vulnerable
populations are those that cannot afford to
build up land or sea walls to preserve against
erosion, soil and water contamination, storm
flooding, and total loss of dry land to the seas.
The 200-300 million people living in the rural
areas of these zones in countries with High
vulnerability or above should be considered
potential climate migrants or displaced people.
The economic losses that these rural and
urban communities incur due to climate change
are used as the indicator of impact in this
report. We have based our estimates on the
findings of a major international collaboration
called DIVA (Dynamic Interactive Vulnerability
Assessment), which calculates economic
impacts caused by climate-driven sea-level riseall around the world.131
DESERTIFICATIONWhile over-grazing, over-cultivation,
deforestation, and unsustainable use of water
supplies are well documented as the main
causes of desertification, climatic factors such
as higher temperatures and stronger high
winds, have a clear aggravating effect on the
phenomenon.132
In many areas, including desertification-prone
lands, temperatures can be as much as a year-
long average of 5 degrees Celsius (9 degreesFahrenheit) hotter than the norm.133
While the higher temperatures brought by
climate change will increase rainfall in general
(because higher temperatures intensify water
evaporation), that effect will be isolated to
specific areas. Most drylands and deserts will
not benefi t from the increase. In fact, shifting
rainfall patterns are, in many cases, making
already marginal arid zones even drier.134
A combination of continuous and extreme
heat and lack of rainfall in already marginalarid lands gradually or abruptly kills off plants,
trees, and other vegetation. That can push
the local ecosystem into a vicious cycle as
evaporation of remaining water or rainfall
deposits increases due to a lack of shade.
Soil salinity rises as water leaves the ground
at pace, harming any new growth prospects.
Unable to block out sunlight or heat during the
day, or retain heat during the night, desert-like
areas are plunged into repetitive hot-cold
extremes that are hostile to most life-forms
and that further discourage regeneration.135
Some areas of the world, such as the Horn
of Africa, are experiencing recurring drought,
which can force millions of people into crisis
as ecosystems and rain-based water supplies
completely collapse.136
But desertification occurs when degradation
takes on a permanence that defies the natural or
managed ability of a land to recover from drought
when rains return. Arid land becomes desert,
which is both dif ficult and costly to restore.137
Where degradation of arid or semi-arid regions
is extreme, desert sand dunes can advance
against little resistance, carried mainly by the
winds. Desert expansion in some areas, such
as the Gobi Desert, has reached an explosive
15 kms per year.138 Dust storms, which can
also assist the spread of infectious diseases,
such as meningitis, are another hallmark of
lands under threat from desertification.139
The harsh climate, ecosystem breakdown,
lack of water and shade, and near irreversibledegradation of land no longer fi t for crops
or grazing means most inhabitants have to
uproot and leave.140 More than 100 million
people are living under pressure from
desertification today, and that number is
expected to significantly increase by 2030.
These people should be considered potential
climate migrants or displaced people. Not
all desertified land creates migrants. It is
possible for communities to persist in a
desert environment, such as by benefi tting
from resources derived from peripheral land.
But for most people, desertification implies
abandonment of land and property.141 Thosewho remain become even more vulnerable.
This report bases its findings on the PLACE
II database (Population, Landscape, and
Climate Estimates), which is managed by
the Earth Institute of Columbia University,
New York, and draws on US government
observational information.
GLOBALDESERTIFICATIONPercentage of degraded drylands(million sq km)
85%intact/at risk
15%degraded
drylands
9
8
7
6
5
4
3
2
1
0
Source: Millenium Ecosystem Assessment;CIA Factbook
DESERT EXPANSION IN SOMEAREAS, SUCH AS THE GOBI DESERT,HAS REACHED AN EXPLOSIVE15 KMS PER YEAR
84 | CLIMATE VULNERABILITY MONITOR - HABITAT LOSS | Climate Vulnerability Monitor
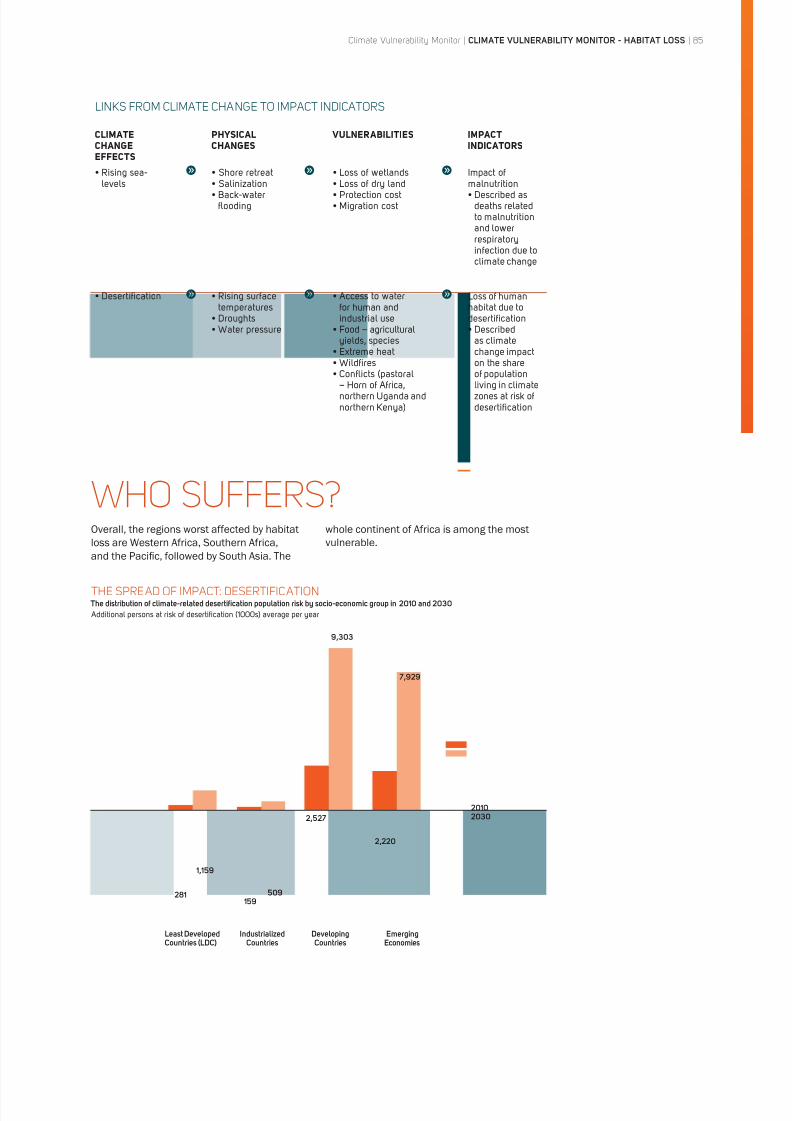
8/8/2019 Climate Vulnerability Monitor 2010: The State of the Climate Crisis
http://slidepdf.com/reader/full/climate-vulnerability-monitor-2010-the-state-of-the-climate-crisis 87/291
LINKS FROM CLIMATE CHANGE TO IMPACT INDICATORS
CLIMATECHANGEEFFECTS
PHYSICALCHANGES
VULNERABILITIES IMPACTINDICATORS
levels
flooding
Impact ofmalnutrition
deaths relatedto malnutritionand lowerrespiratoryinfection due toclimate change
temperatures
for human andindustrial use
yields, species
northern Uganda andnorthern Kenya)
Loss of humanhabitat due todesertification
as climate
change impacton the shareof populationliving in climatedesertification
WHO SUFFERS?Overall, the regions worst affected by habitatloss are Western Africa, Southern Africa,
and the Pacific, followed by South Asia. The
whole continent of Africa is among the mostvulnerable.
THE SPREAD OF IMPACT: DESERTIFICATION The distribution of climate-related desertification population risk by socio-economic group in 2010 and 2030 Additional persons at risk of desertification (1000s) average per year
281
1,159
159509
2,527
9,303
2,220
7,929
20102030
Least DevelopedCountries (LDC)
IndustrializedCountries
DevelopingCountries
EmergingEconomies
Climate Vulnerability Monitor | CLIMATE VULNERABILITY MONITOR - HABITAT LOSS | 85
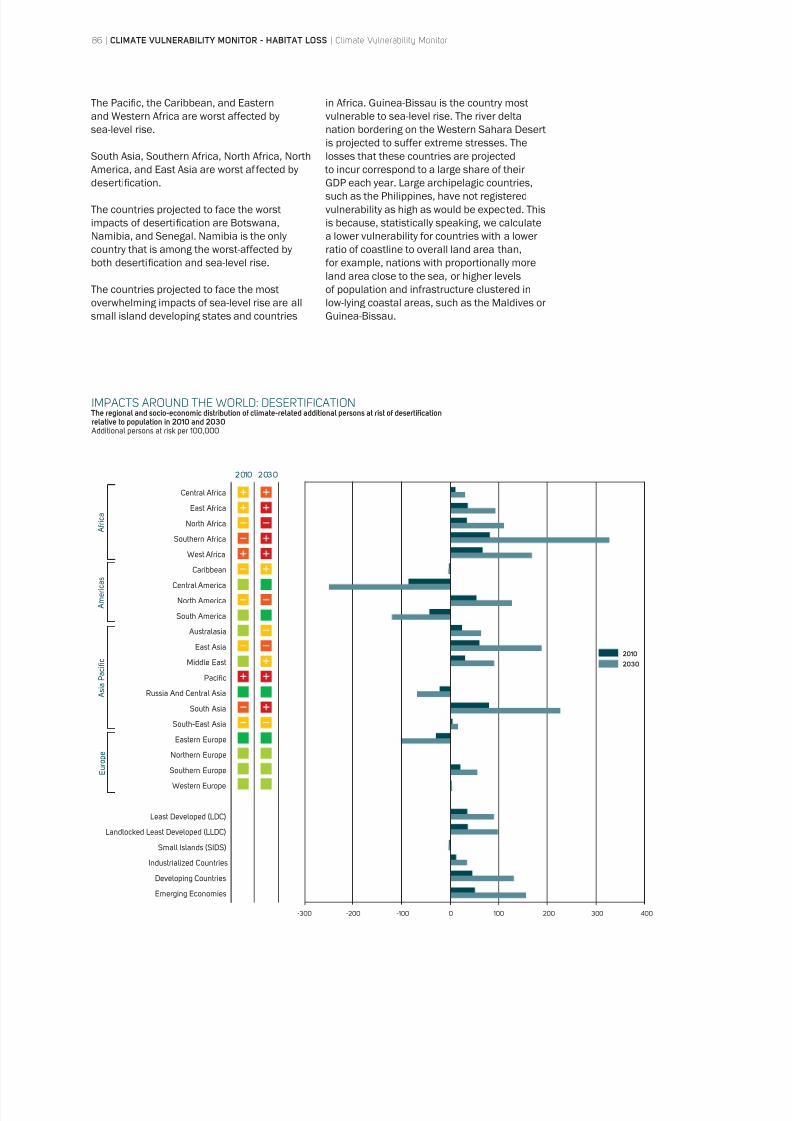
8/8/2019 Climate Vulnerability Monitor 2010: The State of the Climate Crisis
http://slidepdf.com/reader/full/climate-vulnerability-monitor-2010-the-state-of-the-climate-crisis 88/291
The Pacific, the Caribbean, and Eastern
and Western Africa are worst affected by
sea-level rise.
South Asia, Southern Africa, North Africa, North
America, and East Asia are worst affected by
desertification.
The countries projected to face the worst
impacts of desertification are Botswana,
Namibia, and Senegal. Namibia is the only
country that is among the worst-affected by
both desertification and sea-level rise.
The countries projected to face the most
overwhelming impacts of sea-level rise are all
small island developing states and countries
in Africa. Guinea-Bissau is the country most
vulnerable to sea-level rise. The river delta
nation bordering on the Western Sahara Desert
is projected to suffer extreme stresses. The
losses that these countries are projected
to incur correspond to a large share of their
GDP each year. Large archipelagic countries,
such as the Philippines, have not registered
vulnerability as high as would be expected. This
is because, statistically speaking, we calculate
a lower vulnerability for countries with a lower
ratio of coastline to overall land area than,
for example, nations with proportionally more
land area close to the sea, or higher levels
of population and infrastructure clustered in
low-lying coastal areas, such as the Maldives or
Guinea-Bissau.
IMPACTS AROUND THE WORLD: DESERTIFICATION The regional and socio-economic distribution of climate-related additional persons at rist of desertificationrelative to population in 2010 and 2030 Additional persons at risk per 100,000
Central Africa
East Africa
North Africa
Southern Africa
West Africa
Caribbean
Central America
North America
South America
Australasia
East Asia
Middle East
Pacific
Russia And Central Asia
South AsiaSouth-East Asia
Eastern Europe
Northern Europe
Southern Europe
Western Europe
Least Developed (LDC)
Landlocked Least Developed (LLDC)
Small Islands (SIDS)
Developing Countries
Emerging Economies
2010 2030
A f r i c a
A m e r i c a s
A s i a P a c i fi c
E u r o p e
0
2010
2030
100-100-200-300 200 300 400
86 | CLIMATE VULNERABILITY MONITOR - HABITAT LOSS | Climate Vulnerability Monitor
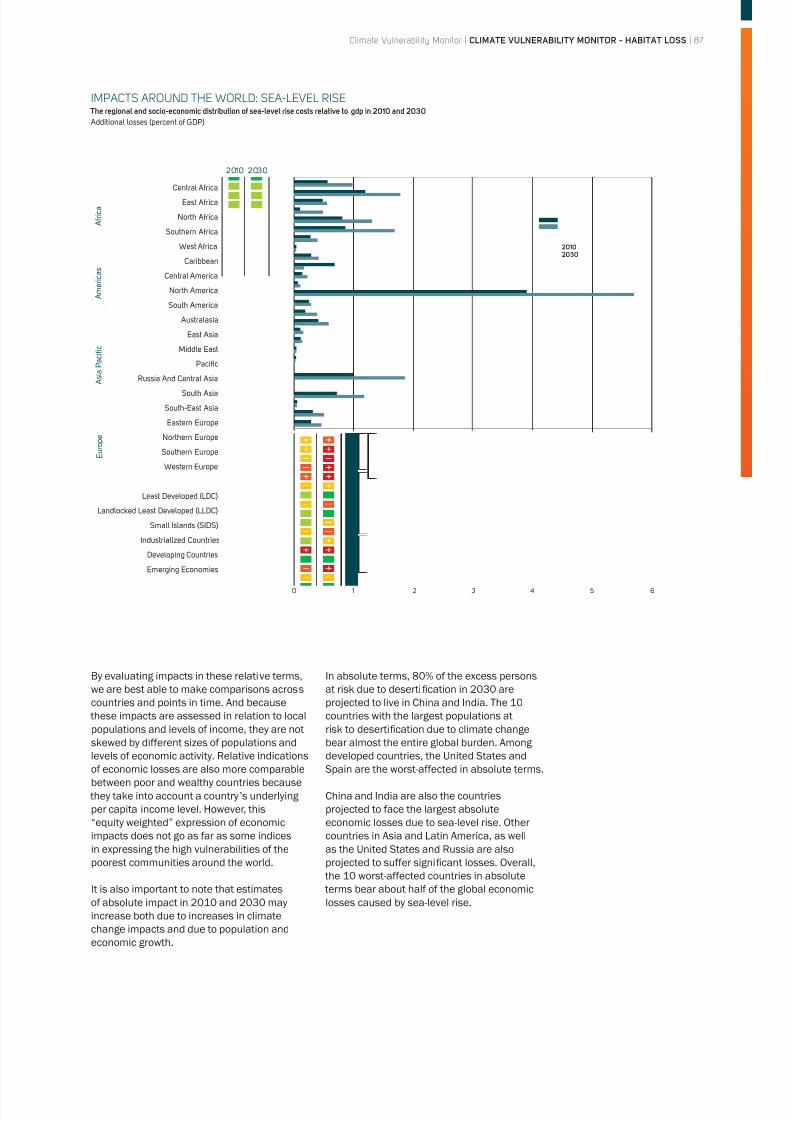
8/8/2019 Climate Vulnerability Monitor 2010: The State of the Climate Crisis
http://slidepdf.com/reader/full/climate-vulnerability-monitor-2010-the-state-of-the-climate-crisis 89/291
By evaluating impacts in these relative terms,
we are best able to make comparisons across
countries and points in time. And because
these impacts are assessed in relation to localpopulations and levels of income, they are not
skewed by different sizes of populations and
levels of economic activity. Relative indications
of economic losses are also more comparable
between poor and wealthy countries because
they take into account a country’s underlying
per capita income level. However, this
“equity weighted” expression of economic
impacts does not go as far as some indices
in expressing the high vulnerabilities of the
poorest communities around the world.
It is also important to note that estimatesof absolute impact in 2010 and 2030 may
increase both due to increases in climate
change impacts and due to population and
economic growth.
In absolute terms, 80% of the excess persons
at risk due to desertification in 2030 are
projected to live in China and India. The 10
countries with the largest populations atrisk to desertification due to climate change
bear almost the entire global burden. Among
developed countries, the United States and
Spain are the worst-affected in absolute terms.
China and India are also the countries
projected to face the largest absolute
economic losses due to sea-level rise. Other
countries in Asia and Latin America, as well
as the United States and Russia are also
projected to suffer significant losses. Overall,
the 10 worst-affected countries in absolute
terms bear about half of the global economiclosses caused by sea-level rise.
IMPACTS AROUND THE WORLD: SEA-LEVEL RISE The regional and socio-economic distribution of sea-level rise costs relative to gdp in 2010 and 2030 Additional losses (percent of GDP)
Central Africa
East Africa
North Africa
Southern Africa
West Africa
Caribbean
Central America
North America
South America
Australasia
East Asia
Middle East
Pacific
Russia And Central Asia
South Asia
South-East Asia
Eastern Europe
Northern Europe
Southern Europe
Western Europe
Least Developed (LDC)
Landlocked Least Developed (LLDC)
Small Islands (SIDS)
Developing Countries
Emerging Economies
2010 2030
A f r i c a
A m e r i c a s
A s i a P a c i fi c
E u r o p e
0
20102030
1 2 3 4 5 6
Climate Vulnerability Monitor | CLIMATE VULNERABILITY MONITOR - HABITAT LOSS | 87
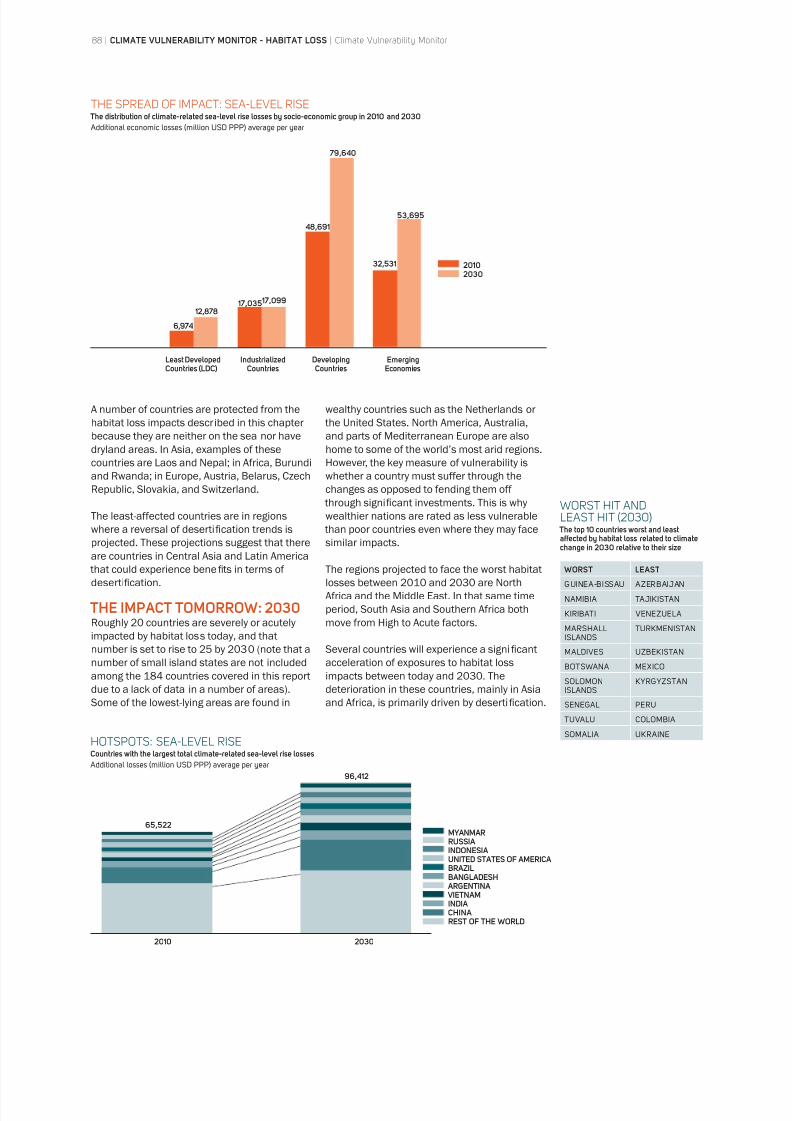
8/8/2019 Climate Vulnerability Monitor 2010: The State of the Climate Crisis
http://slidepdf.com/reader/full/climate-vulnerability-monitor-2010-the-state-of-the-climate-crisis 90/291
20102030
THE SPREAD OF IMPACT: SEA-LEVEL RISE The distribution of climate-related sea-level rise losses by socio-economic group in 2010 and 2030 Additional economic losses (million USD PPP) average per year
6,974
12,878 17,035 17,099
48,691
79,640
32,531
53,695
Least DevelopedCountries (LDC)
IndustrializedCountries
DevelopingCountries
EmergingEconomies
WORST HIT ANDLEAST HIT (2030)
The top 10 countries worst and leastaffected by habitat loss related to climatechange in 2030 relative to their size
WORST LEAST
GUINEA-BISSAU AZERBAIJAN
NAMIBIA TAJIKISTAN
KIRIBATI VENEZUELA
MARSHALLISLANDS
TURKMENISTAN
MALDIVES UZBEKISTAN
BOTSWANA MEXICO
SOLOMONISLANDS
KYRGYZSTAN
SENEGAL PERU
TUVALU COLOMBIA
SOMALIA UKRAINE
A number of countries are protected from the
habitat loss impacts described in this chapter
because they are neither on the sea nor have
dryland areas. In Asia, examples of these
countries are Laos and Nepal; in Africa, Burundi
and Rwanda; in Europe, Austria, Belarus, Czech
Republic, Slovakia, and Switzerland.
The least-affected countries are in regions
where a reversal of desertifi
cation trends isprojected. These projections suggest that there
are countries in Central Asia and Latin America
that could experience benefi ts in terms of
desertification.
THE IMPACT TOMORROW: 2030Roughly 20 countries are severely or acutely
impacted by habitat loss today, and that
number is set to rise to 25 by 2030 (note that a
number of small island states are not included
among the 184 countries covered in this report
due to a lack of data in a number of areas).
Some of the lowest-lying areas are found in
wealthy countries such as the Netherlands or
the United States. North America, Australia,
and parts of Mediterranean Europe are also
home to some of the world’s most arid regions.
However, the key measure of vulnerability is
whether a country must suffer through the
changes as opposed to fending them off
through significant investments. This is why
wealthier nations are rated as less vulnerable
than poor countries even where they may facesimilar impacts.
The regions projected to face the worst habitat
losses between 2010 and 2030 are North
Africa and the Middle East. In that same time
period, South Asia and Southern Africa both
move from High to Acute factors.
Several countries will experience a significant
acceleration of exposures to habitat loss
impacts between today and 2030. The
deterioration in these countries, mainly in Asia
and Africa, is primarily driven by desertification.
HOTSPOTS: SEA-LEVEL RISECountries with the largest total climate-related sea-level rise losses Additional losses (million USD PPP) average per year
2010 2030
MYANMARRUSSIAINDONESIAUNITED STATES OF AMERICABRAZILBANGLADESH
ARGENTINA VIETNAMINDIACHINAREST OF THE WORLD
96,412
65,522
88 | CLIMATE VULNERABILITY MONITOR - HABITAT LOSS | Climate Vulnerability Monitor
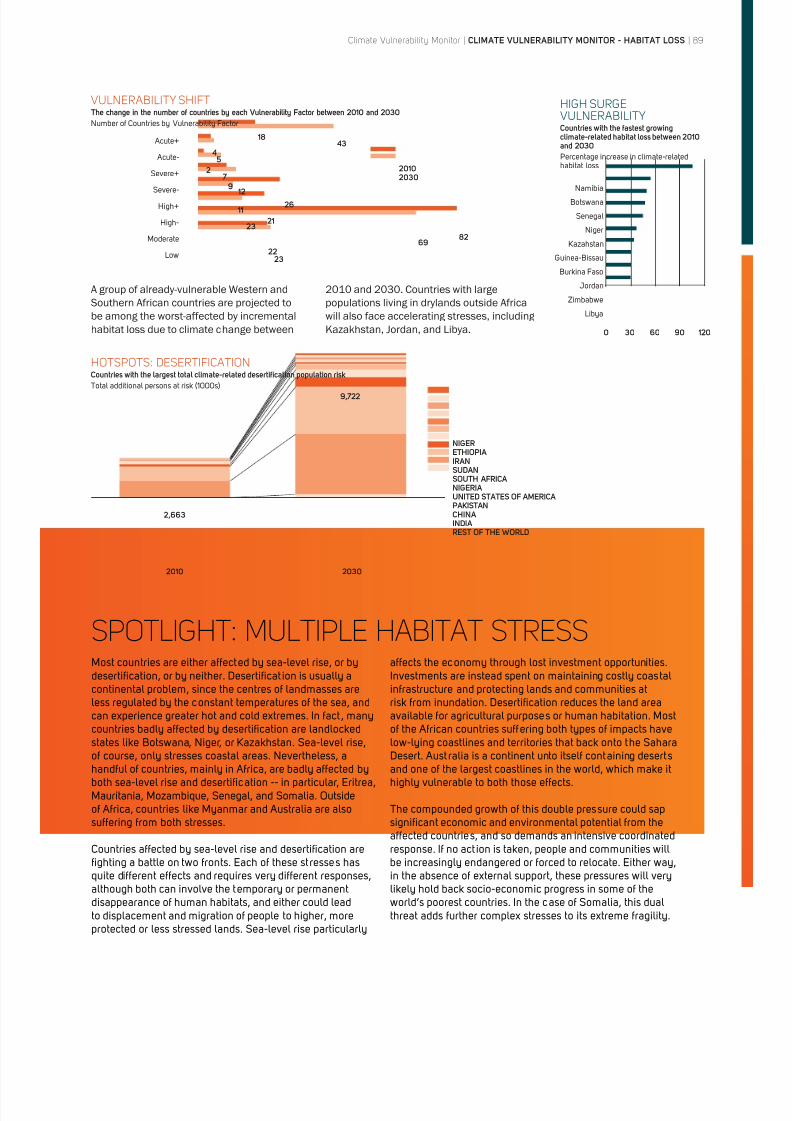
8/8/2019 Climate Vulnerability Monitor 2010: The State of the Climate Crisis
http://slidepdf.com/reader/full/climate-vulnerability-monitor-2010-the-state-of-the-climate-crisis 91/291
SPOTLIGHT: MULTIPLE HABITAT STRESSMost countries are either affected by sea-level rise, or bydesertification, or by neither. Desertificat ion is usually acontinental problem, since the centres of landmasses areless regulated by the constant temperatures of the sea, and
can experience greater hot and cold extremes. In fact , manycountries badly affected by desertification are landlockedof course, only stresses coastal areas. Nevertheless, ahandful of countries, mainly in Africa, are badly affected byboth sea-level rise and desertification -- in particular, Eritrea,of Africa, countries like Myanmar and Australia are alsosuffering from both stresses.
Countries affected by sea-level rise and desertification arefighting a battle on two fronts. Each of these stresses has
although both can involve the temporary or permanentdisappearance of human habitats, and either could leadto displacement and migration of people to higher, moreprotected or less stressed lands. Sea-level rise particularly
affects the economy through lost investment opportunities.Investments are instead spent on maintaining costly coastalinfrastructure and protecting lands and communities atrisk from inundation. Desertification reduces the land area
available for agricultural purposes or human habitation. Mostof the African countries suffering both types of impacts havelow-lying coastlines and territories that back onto the SaharaDesert. Aust ralia is a continent unto itself containing desertsand one of the largest coastlines in the world, which make ithighly vulnerable to both those effects.
The compounded growth of this double pressure could sapsignificant economic and environmental potential from theaffected countries, and so demands an intensive coordinatedresponse. If no act ion is taken, people and communities willbe increasingly endangered or forced to relocate. Either way,in the absence of external support, these pressures will very
likely hold back socio-economic progress in some of theworld’s poorest countries. In the case of Somalia, this dualthreat adds further complex stresses to its extreme fragility.
HOTSPOTS: DESERTIFICATIONCountries with the largest total climate-related desertification population riskTotal additional persons at risk (1000s)
NIGERETHIOPIAIRANSUDANSOUTH AFRICANIGERIAUNITED STATES OF AMERICAPAKISTANCHINAINDIA
REST OF THE WORLD
2010 2030
9,722
2,663
A group of already-vulnerable Western and
Southern African countries are projected to
be among the worst-affected by incremental
habitat loss due to climate change between
2010 and 2030. Countries with large
populations living in drylands outside Africa
will also face accelerating stresses, including
Kazakhstan, Jordan, and Libya.
VULNERABILITY SHIFT The change in the number of countries by each Vulnerability Factor between 2010 and 2030Number of Countries by Vulnerability Factor
Acute+
Acute-
Severe+
Severe-
High+
High-
Moderate
Low
2010
2030
1843
45
2
79 12
26 11
2123
8269
2223
HIGH SURGEVULNERABILITYCountries with the fastest growingclimate-related habitat loss between 2010and 2030Percentage increase in climate-relatedhabitat loss
Namibia
Botswana
Senegal
Niger
Guinea-Bissau
Burkina Faso
Jordan
Zimbabwe
Libya
0 30 60 90 120
Climate Vulnerability Monitor | CLIMATE VULNERABILITY MONITOR - HABITAT LOSS | 89
8/8/2019 Climate Vulnerability Monitor 2010: The State of the Climate Crisis
http://slidepdf.com/reader/full/climate-vulnerability-monitor-2010-the-state-of-the-climate-crisis 92/291
THE ASSESSMENTThe Monitor assesses loss of human habitat through climate-
change driven desertification, or the degradation of dryland
areas, via satellite-based mapping of land degradation evident
(from the PLACE II database)142 and a climate model (called
IMAGE) that ascertains a likely aggravating role of climate
change.143 The indicator used is the population at risk from
desertification. The indicator is fairly robust, since countries
with a high factor of vulnerability will all have relatively large
land-degradation problems verified by satellite imagery, and we
can assess where this degradation appears to be worsening
due to the effects of climate change. The Monitor assesses
populations at risk relative to total population and assesses
economic costs of sea-level rise proportional to total GDP to
take into account the relative importance of these impacts for
a given country.
The Monitor assesses loss of human habitat through sea-level
rise via a complex global satellite-based model, DIVA, that
calculates the cost burden on communities in coastal areas
around the world.144 Since it is based on satellite imagery, the
indicator is fairly robust in conveying physical vulnerabilities.
The model then weighs in the scale of exposure and costs of
ongoing stress to communities in different coastal areas as lost
GDP potential.
Despite its robustness, some results are surprising. Countries
of the Arabian Peninsula, for example, such as Kuwait, Oman,
Qatar, Saudi Arabia, United Arab Emirates, and Yemen, allshare Moderate factors of vulnerability. None are deemed to
be suffering impacts of desertification, since their environment
is either already classed as desert or as urban or otherwise,
but not as dryland-facing-degradation. Neither do any of these
countries register any significant sea-level rise vulnerabilities.
Bangladesh (Moderate/Moderate) is well known for its
populous, low-lying coastal delta, but it is far less vulnerable
than many other countries for reasons of scale. Bangladesh’s
coastline is just 580 kilometres or 360 miles long. Less than
15% of the country’s population of more than 160 million
people live in coastal areas below 5 metres (16 ft) altitude.145
This compares with 100% for more vulnerable countries like
Kiribati, Maldives, and Tuvalu. Bangladesh is also almost 500 times larger than Maldives in terms of total land area, with most
of its territory well inland from the sea.146 Similar rules apply
to the Philippines (Moderate/Moderate). Despite having the
fifth largest coastline on the planet, the Philippines has much
less of its population in coastal areas below 5m/16ft than
Bangladesh. Meanwhile, Canada (Moderate/Moderate) has
similar vulnerability to Bangladesh and Philippines by virtue of
possessing by far the largest coastline in the world (some 30
times that of the Philippines or more than 15,000 times that of
Bangladesh), despite the fact that it has minimal populations
living in low-elevation coastal zones.147
Scale also plays a role in comparative vulnerability todesertification. So when a compact country like Bhutan (High+/
Acute+), which is roughly the size of Switzerland, suffers from
growing degradation of its savannah and steppe-type lands,
proportional pressure on its inhabitants is much higher than
in huge countries like Algeria (Moderate/Moderate), where
populations are far less concentrated around at-risk areas.
In Africa, the Central African Republic (Moderate/Moderate) has
already suffered limited desertification but does not suffer from
water stress extremes and should continue to receive more
rainfall as a result of climate change (as will much of Central
Africa).148 Neighbouring Cameroon (Moderate/High-), however,
is worse off, particularly where its northern border once met
the now almost completely vanished Lake Chad. And heavily-
populated Sudan (High+/Acute+) is set to suffer increasing
degradation of its dryland regions along the margins of the
Sahara Desert as temperatures continue to rise.
Four highly-developed countries register high factors
of vulnerability to habitat loss: Australia, due mainly to
desertification; Iceland, due to sea-level rise alone; Spain, due
exclusively to desertification; and the United States, also due
in particular to desertification. Iceland (High-/High+) has quite
a small population (around 300,000) but a long coastline,
similar in size to Argentina’s. Almost all of its inhabitants live
within 100 kilometres (60 miles) of the sea, which amplifies
socio-economic vulnerabilities to growing coastal stress. In
Spain (High-/Acute+), existing stresses on water supplies run
headlong into less rain and more heat brought by climate
change. While Australia (Moderate/High+) and the United
States (High-/Acute-) are home to some of the largest drylandareas on the planet, both of which are becoming hotter and
dryer as the planet warms up. Parts of the US, in particular, key
areas of Southern Florida, are of very low elevation, so local
vulnerability to rising seas is high. Nationwide, however, the
US does not suffer sea-level rise impacts compared to those
experienced by island nations or countries like Guinea-Bissau
whose geographies are dominated by large river deltas.
Netherlands (Moderate/Moderate), one of the lowest lying
countries in the world -- Half of the country lies below 1 meter
(3ft) above sea-levels including one eighth of the country lying
below sea-level -- has a surprisingly low levels of vulnerability
to habitat loss /sea-level rise. Netherlands, however, is also
one of the best prepared countries in the world in dealing with sea-level rise through robust protective measures such
as dams, polders, dykes and dunes. The low-lying geography
of the Netherlands has long dominated the country’s
development, with key infrastructure already long in place to
allow for the productive use of below-sea-level coastal zones.
The Netherlands does therefore not have to yet react to the
same degree to protect its resources from coastal erosion or
the dangers of sea-level rise to any significant extent when
compared with other seriously affected countries. Adaptation
to sea-level rise for the Netherlands may only imply in most
cases an incremental reinforcement of existing infrastructure.
Nevertheless, the total costs of this adaptation can be very
large in absolute terms, but are small in size when comparedwith the overall scale of the Dutch economy -- one of the 20
largest economies in the world.
90 | CLIMATE VULNERABILITY MONITOR - HABITAT LOSS | Climate Vulnerability Monitor
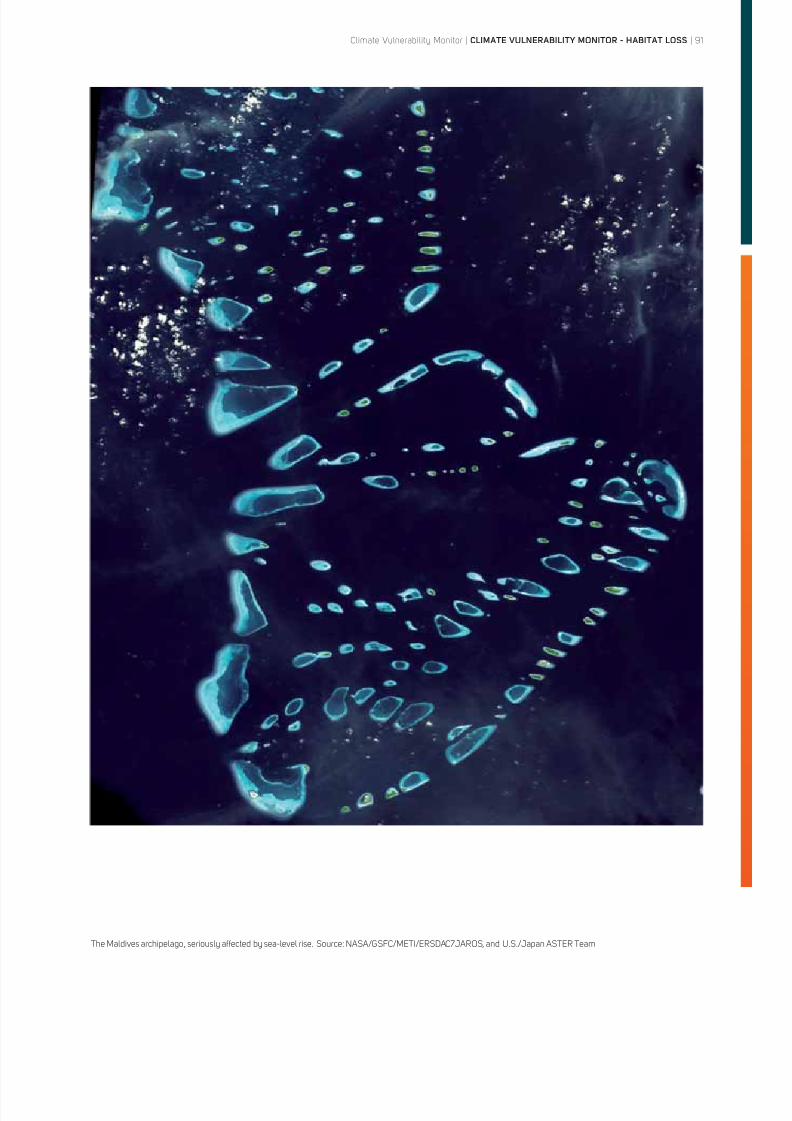
8/8/2019 Climate Vulnerability Monitor 2010: The State of the Climate Crisis
http://slidepdf.com/reader/full/climate-vulnerability-monitor-2010-the-state-of-the-climate-crisis 93/291
The Maldives archipelago, seriously affected by sea-level rise. Source: NASA/GSFC/METI/ERSDAC7JAROS, and U.S./Japan ASTER Team
Climate Vulnerability Monitor | CLIMATE VULNERABILITY MONITOR - HABITAT LOSS | 91
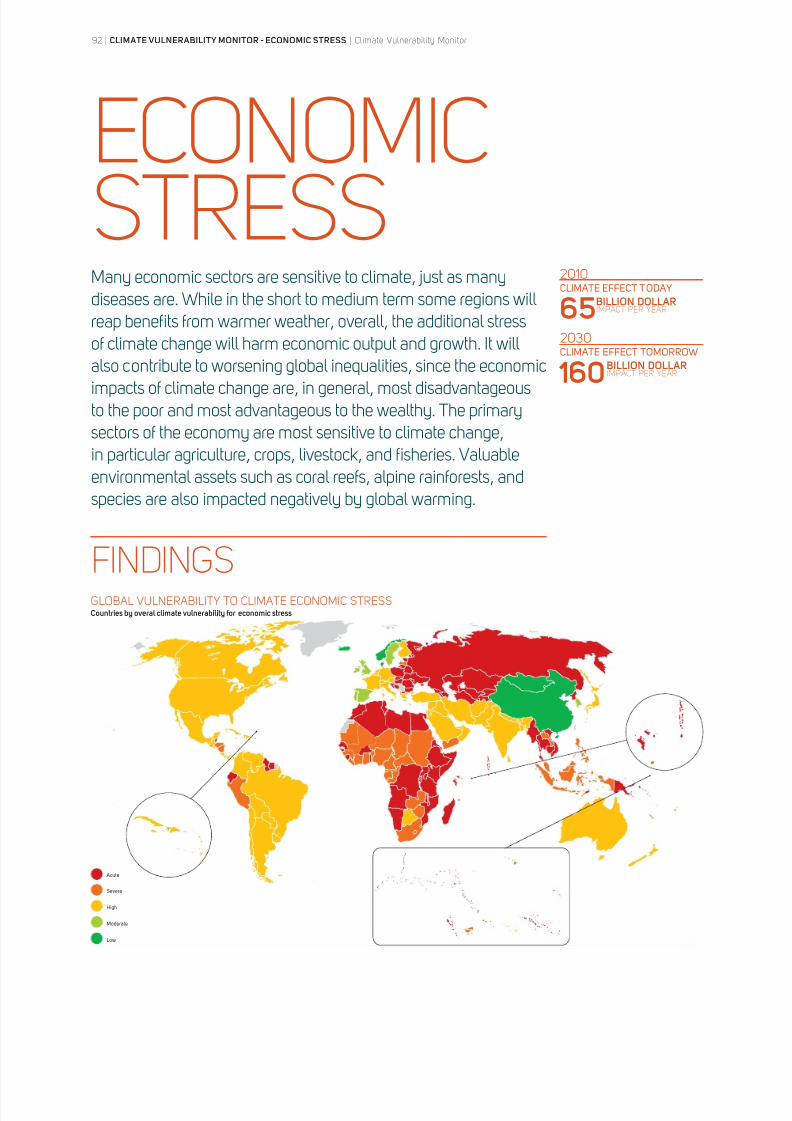
8/8/2019 Climate Vulnerability Monitor 2010: The State of the Climate Crisis
http://slidepdf.com/reader/full/climate-vulnerability-monitor-2010-the-state-of-the-climate-crisis 94/291
92 | CLIMATE VULNERABILITY MONITOR - ECONOMIC STRESS | Climate Vulnerability Monitor
ECONOMICSTRESSMany economic sectors are sensitive to climate, just as manydiseases are. While in the short to medium term some regions willreap benefits from warmer weather, overall, the additional stressof climate change will harm economic output and growth. It willalso contribute to worsening global inequalities, since the economicimpacts of climate change are, in general, most disadvantageousto the poor and most advantageous to the wealthy. The primarysectors of the economy are most sensitive to climate change,in particular agriculture, crops, livestock, and fisheries. Valuableenvironmental assets such as coral reefs, alpine rainforests, andspecies are also impacted negatively by global warming.
FINDINGS
CLIMATE EFFECT TODAY
CLIMATE EFFECT TOMORROW
2010
2030
BILLION DOLLARIMPACT PER YEAR
BILLION DOLLARIMPACT PER YEAR
65
160
Acute
Severe
High
Moderate
Low
GLOBAL VULNERABILITY TO CLIMATE ECONOMIC STRESSCountries by overal climate vulnerability for economic stress
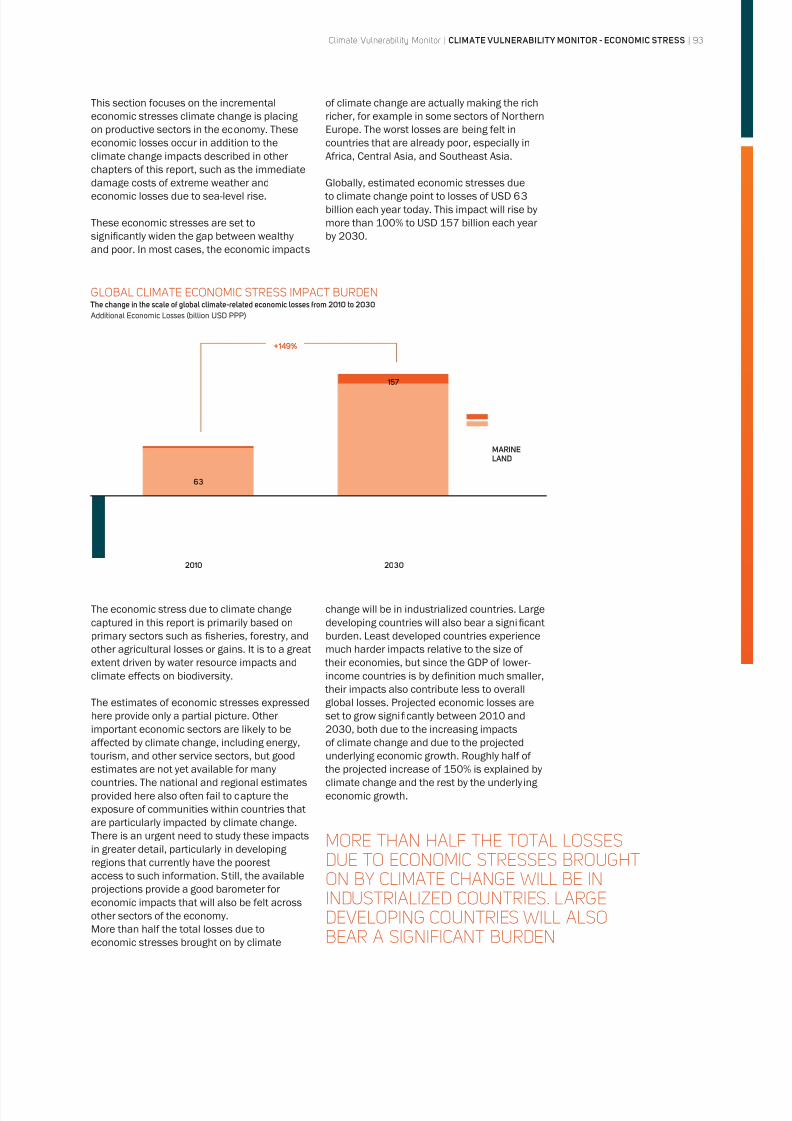
8/8/2019 Climate Vulnerability Monitor 2010: The State of the Climate Crisis
http://slidepdf.com/reader/full/climate-vulnerability-monitor-2010-the-state-of-the-climate-crisis 95/291
Climate Vulnerability Monitor | CLIMATE VULNERABILITY MONITOR - ECONOMIC STRESS | 93
This section focuses on the incremental
economic stresses climate change is placing
on productive sectors in the economy. These
economic losses occur in addition to the
climate change impacts described in other
chapters of this report, such as the immediate
damage costs of extreme weather and
economic losses due to sea-level rise.
These economic stresses are set to
significantly widen the gap between wealthy
and poor. In most cases, the economic impacts
of climate change are actually making the rich
richer, for example in some sectors of Northern
Europe. The worst losses are being felt in
countries that are already poor, especially in
Africa, Central Asia, and Southeast Asia.
Globally, estimated economic stresses due
to climate change point to losses of USD 63
billion each year today. This impact will rise by
more than 100% to USD 157 billion each year
by 2030.
The economic stress due to climate change
captured in this report is primarily based on
primary sectors such as fisheries, forestry, and
other agricultural losses or gains. It is to a great
extent driven by water resource impacts and
climate effects on biodiversity.
The estimates of economic stresses expressed
here provide only a partial picture. Otherimportant economic sectors are likely to be
affected by climate change, including energy,
tourism, and other service sectors, but good
estimates are not yet available for many
countries. The national and regional estimates
provided here also often fail to capture the
exposure of communities within countries that
are particularly impacted by climate change.
There is an urgent need to study these impacts
in greater detail, particularly in developing
regions that currently have the poorest
access to such information. Still, the available
projections provide a good barometer foreconomic impacts that will also be felt across
other sectors of the economy.
More than half the total losses due to
economic stresses brought on by climate
change will be in industrialized countries. Large
developing countries will also bear a significant
burden. Least developed countries experience
much harder impacts relative to the size of
their economies, but since the GDP of lower-
income countries is by definition much smaller,
their impacts also contribute less to overall
global losses. Projected economic losses are
set to grow significantly between 2010 and2030, both due to the increasing impacts
of climate change and due to the projected
underlying economic growth. Roughly half of
the projected increase of 150% is explained by
climate change and the rest by the underlying
economic growth.
GLOBAL CLIMATE ECONOMIC STRESS IMPACT BURDEN The change in the scale of global climate-related economic losses from 2010 to 2030 Additional Economic Losses (billion USD PPP)
63
157
2010 2030
+149%
MARINELAND
MORE THAN HALF THE TOTAL LOSSESDUE TO ECONOMIC STRESSES BROUGHTON BY CLIMATE CHANGE WILL BE ININDUSTRIALIZED COUNTRIES. LARGEDEVELOPING COUNTRIES WILL ALSOBEAR A SIGNIFICANT BURDEN
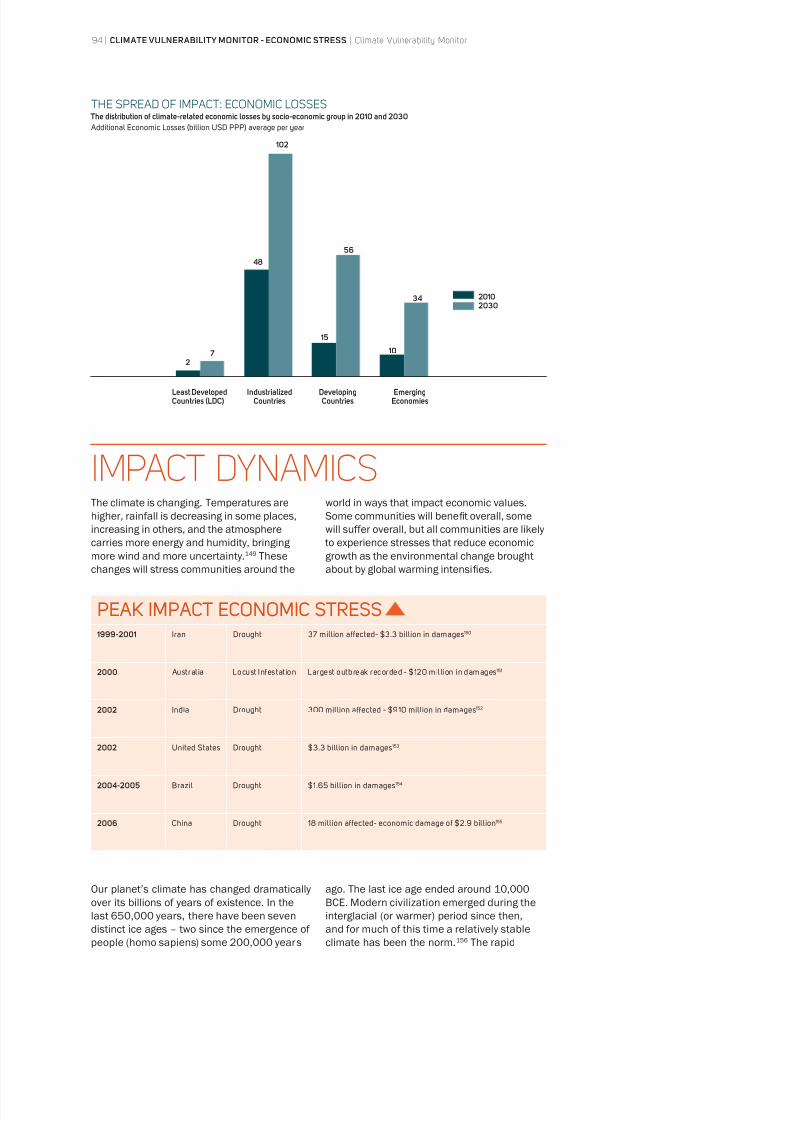
8/8/2019 Climate Vulnerability Monitor 2010: The State of the Climate Crisis
http://slidepdf.com/reader/full/climate-vulnerability-monitor-2010-the-state-of-the-climate-crisis 96/291
THE SPREAD OF IMPACT: ECONOMIC LOSSES The distribution of climate-related economic losses by socio-economic group in 2010 and 2030 Additional Economic Losses (billion USD PPP) average per year
2 7
48
102
15
56
10
34 20102030
Least DevelopedCountries (LDC)
IndustrializedCountries
DevelopingCountries
EmergingEconomies
IMPACT DYNAMICSThe climate is changing. Temperatures are
higher, rainfall is decreasing in some places,
increasing in others, and the atmospherecarries more energy and humidity, bringing
more wind and more uncertainty.149 These
changes will stress communities around the
world in ways that impact economic values.
Some communities will benefi t overall, some
will suffer overall, but all communities are likely to experience stresses that reduce economic
growth as the environmental change brought
about by global warming intensifies.
Our planet’s climate has changed dramaticallyover its billions of years of existence. In the
last 650,000 years, there have been seven
distinct ice ages – two since the emergence of
people (homo sapiens) some 200,000 years
ago. The last ice age ended around 10,000BCE. Modern civilization emerged during the
interglacial (or warmer) period since then,
and for much of this time a relatively stable
climate has been the norm.156 The rapid
PEAK IMPACT ECONOMIC STRESS 1999-2001 Iran Drought 37 million affected- $3.3 billion in damages150
2000 Austral ia Locust Infestat ion Largest outbreak recorded - $120 mil lion in damages 151
2002 India Drought 300 million affected - $910 million in damages152
2002 United States Drought $3.3 billion in damages153
2004-2005 Brazil Drought $1.65 billion in damages154
2006 China Drought 18 million affected- economic damage of $2.9 billion155
94 | CLIMATE VULNERABILITY MONITOR - ECONOMIC STRESS | Climate Vulnerability Monitor
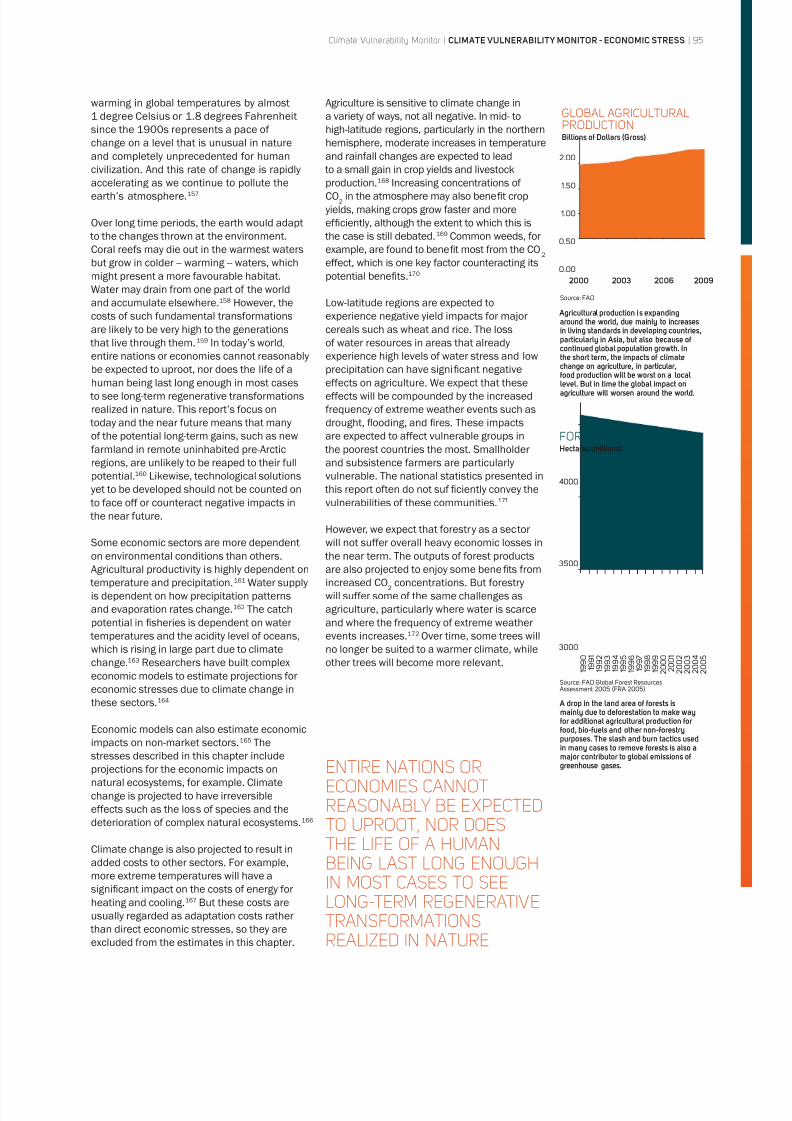
8/8/2019 Climate Vulnerability Monitor 2010: The State of the Climate Crisis
http://slidepdf.com/reader/full/climate-vulnerability-monitor-2010-the-state-of-the-climate-crisis 97/291
warming in global temperatures by almost
1 degree Celsius or 1.8 degrees Fahrenheit
since the 1900s represents a pace of
change on a level that is unusual in nature
and completely unprecedented for human
civilization. And this rate of change is rapidly
accelerating as we continue to pollute the
earth’s atmosphere.157
Over long time periods, the earth would adapt
to the changes thrown at the environment.
Coral reefs may die out in the warmest waters
but grow in colder -- warming -- waters, which
might present a more favourable habitat.
Water may drain from one part of the world
and accumulate elsewhere.158 However, the
costs of such fundamental transformations
are likely to be very high to the generations
that live through them.159 In today’s world,
entire nations or economies cannot reasonablybe expected to uproot, nor does the life of a
human being last long enough in most cases
to see long-term regenerative transformations
realized in nature. This report’s focus on
today and the near future means that many
of the potential long-term gains, such as new
farmland in remote uninhabited pre-Arctic
regions, are unlikely to be reaped to their full
potential.160 Likewise, technological solutions
yet to be developed should not be counted on
to face off or counteract negative impacts in
the near future.
Some economic sectors are more dependent
on environmental conditions than others.
Agricultural productivity is highly dependent on
temperature and precipitation.161 Water supply
is dependent on how precipitation patterns
and evaporation rates change.162 The catch
potential in fisheries is dependent on water
temperatures and the acidity level of oceans,
which is rising in large part due to climate
change.163 Researchers have built complex
economic models to estimate projections for
economic stresses due to climate change in
these sectors.164
Economic models can also estimate economic
impacts on non-market sectors.165 The
stresses described in this chapter include
projections for the economic impacts on
natural ecosystems, for example. Climate
change is projected to have irreversible
effects such as the loss of species and the
deterioration of complex natural ecosystems.166
Climate change is also projected to result in
added costs to other sectors. For example,
more extreme temperatures will have a
significant impact on the costs of energy forheating and cooling.167 But these costs are
usually regarded as adaptation costs rather
than direct economic stresses, so they are
excluded from the estimates in this chapter.
Agriculture is sensitive to climate change in
a variety of ways, not all negative. In mid- to
high-latitude regions, particularly in the northern
hemisphere, moderate increases in temperature
and rainfall changes are expected to lead
to a small gain in crop yields and livestock
production.168 Increasing concentrations of
CO2
in the atmosphere may also benefi t crop
yields, making crops grow faster and more
ef ficiently, although the extent to which this is
the case is still debated.169 Common weeds, for
example, are found to benefi t most from the CO2
effect, which is one key factor counteracting its
potential benefi ts.170
Low-latitude regions are expected to
experience negative yield impacts for major
cereals such as wheat and rice. The loss
of water resources in areas that already
experience high levels of water stress and lowprecipitation can have significant negative
effects on agriculture. We expect that these
effects will be compounded by the increased
frequency of extreme weather events such as
drought, flooding, and fires. These impacts
are expected to affect vulnerable groups in
the poorest countries the most. Smallholder
and subsistence farmers are particularly
vulnerable. The national statistics presented in
this report often do not suf ficiently convey the
vulnerabilities of these communities.171
However, we expect that forestry as a sectorwill not suffer overall heavy economic losses in
the near term. The outputs of forest products
are also projected to enjoy some benefi ts from
increased CO2
concentrations. But forestry
will suffer some of the same challenges as
agriculture, particularly where water is scarce
and where the frequency of extreme weather
events increases.172 Over time, some trees will
no longer be suited to a warmer climate, while
other trees will become more relevant.
ENTIRE NATIONS ORECONOMIES CANNOTREASONABLY BE EXPECTEDTO UPROOT, NOR DOESTHE LIFE OF A HUMANBEING LAST LONG ENOUGH
IN MOST CASES TO SEELONG-TERM REGENERATIVETRANSFORMATIONSREALIZED IN NATURE
2.00
1.50
1.00
0.50
0.00
2000 2003 2006 2009
GLOBAL AGRICULTURALPRODUCTIONBillions of Dollars (Gross)
Source: FAO
Agricultural production i s expandingaround the world, due mainly to increasesin living standards in developing countries,particularly in Asia, but also because ofcontinued global population growth. In
the short term, the impacts of climatechange on agriculture, in particular,food production will be worst on a locallevel. But in time the global impact onagriculture will worsen around the world.
A drop in the land area of forests is
mainly due to deforestation to make wayfor additional agricultural production forfood, bio-fuels and other non-forestrypurposes. The slash and burn tactics usedin many cases to remove forests is also amajor contributor to global emissions ofgreenhouse gases.
3000
FORESTSHectares (millions)
Source: FAO Global Forest Resources Assessment 2005 (FRA 2005)
1 9 9 0
1 9 9 1
1 9 9 2
1 9 9 3
1 9 9 4
1 9 9 5
1 9 9 6
1 9 9 7
1 9 9 8
1 9 9 9
2 0 0 0
2 0 0 1
2 0 0 2
2 0 0 3
2 0 0 4
2 0 0 5
4000
3500
Climate Vulnerability Monitor | CLIMATE VULNERABILITY MONITOR - ECONOMIC STRESS | 95
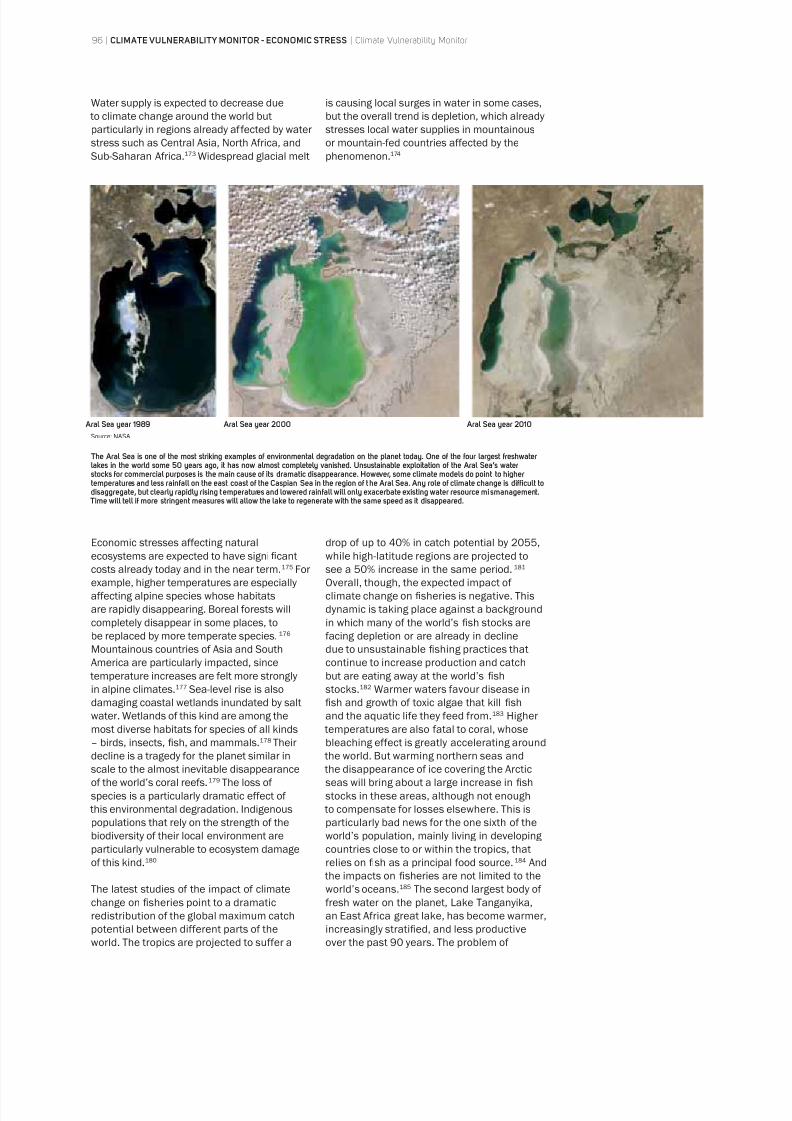
8/8/2019 Climate Vulnerability Monitor 2010: The State of the Climate Crisis
http://slidepdf.com/reader/full/climate-vulnerability-monitor-2010-the-state-of-the-climate-crisis 98/291
Water supply is expected to decrease due
to climate change around the world but
particularly in regions already affected by water
stress such as Central Asia, North Africa, and
Sub-Saharan Africa.173 Widespread glacial melt
is causing local surges in water in some cases,
but the overall trend is depletion, which already
stresses local water supplies in mountainous
or mountain-fed countries affected by the
phenomenon.174
Economic stresses affecting natural
ecosystems are expected to have significant
costs already today and in the near term.175 For
example, higher temperatures are especially
affecting alpine species whose habitats
are rapidly disappearing. Boreal forests will
completely disappear in some places, to
be replaced by more temperate species.176
Mountainous countries of Asia and South
America are particularly impacted, since
temperature increases are felt more strongly
in alpine climates.177 Sea-level rise is also
damaging coastal wetlands inundated by salt
water. Wetlands of this kind are among themost diverse habitats for species of all kinds
– birds, insects, fish, and mammals.178 Their
decline is a tragedy for the planet similar in
scale to the almost inevitable disappearance
of the world’s coral reefs.179 The loss of
species is a particularly dramatic effect of
this environmental degradation. Indigenous
populations that rely on the strength of the
biodiversity of their local environment are
particularly vulnerable to ecosystem damage
of this kind.180
The latest studies of the impact of climatechange on fisheries point to a dramatic
redistribution of the global maximum catch
potential between different parts of the
world. The tropics are projected to suffer a
drop of up to 40% in catch potential by 2055,
while high-latitude regions are projected to
see a 50% increase in the same period.181
Overall, though, the expected impact of
climate change on fisheries is negative. This
dynamic is taking place against a background
in which many of the world’s fish stocks are
facing depletion or are already in decline
due to unsustainable fishing practices that
continue to increase production and catch
but are eating away at the world’s fish
stocks.182 Warmer waters favour disease in
fish and growth of toxic algae that kill fish
and the aquatic life they feed from.183 Higher temperatures are also fatal to coral, whose
bleaching effect is greatly accelerating around
the world. But warming northern seas and
the disappearance of ice covering the Arctic
seas will bring about a large increase in fish
stocks in these areas, although not enough
to compensate for losses elsewhere. This is
particularly bad news for the one sixth of the
world’s population, mainly living in developing
countries close to or within the tropics, that
relies on fish as a principal food source.184 And
the impacts on fisheries are not limited to the
world’s oceans.185
The second largest body of fresh water on the planet, Lake Tanganyika,
an East Africa great lake, has become warmer,
increasingly stratified, and less productive
over the past 90 years. The problem of
Aral Sea year 1989 Aral Sea year 2000 Aral Sea year 2010
The Aral Sea is one of the most striking examples of environmental degradation on the planet today. One of the four largest freshwaterlakes in the world some 50 years ago, it has now almost completely vanished. Unsustainable exploitation of the Aral Sea’s waterstocks for commercial purposes is the main cause of its dramatic disappearance. However, some climate models do point to highertemperatures and less rainfall on the east coast of the Caspian Sea in the region of the Aral Sea. Any role of climate change is difficult todisaggregate, but clearly rapidly rising temperatures and lowered rainfall will only exacerbate existing water resource mismanagement.
Time will tell if more stringent measures will allow the lake to regenerate with the same speed as it disappeared.
Source: NASA
96 | CLIMATE VULNERABILITY MONITOR - ECONOMIC STRESS | Climate Vulnerability Monitor
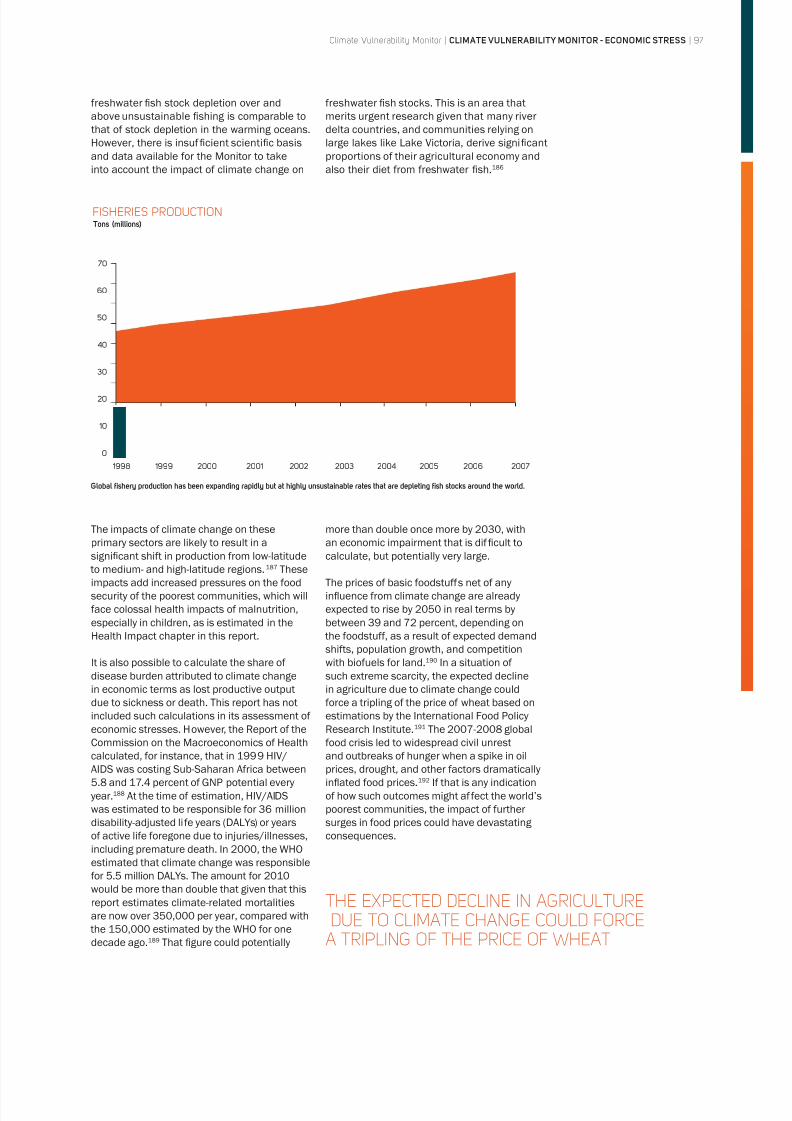
8/8/2019 Climate Vulnerability Monitor 2010: The State of the Climate Crisis
http://slidepdf.com/reader/full/climate-vulnerability-monitor-2010-the-state-of-the-climate-crisis 99/291
The impacts of climate change on theseprimary sectors are likely to result in a
significant shift in production from low-latitude
to medium- and high-latitude regions.187 These
impacts add increased pressures on the food
security of the poorest communities, which will
face colossal health impacts of malnutrition,
especially in children, as is estimated in the
Health Impact chapter in this report.
It is also possible to calculate the share of
disease burden attributed to climate change
in economic terms as lost productive output
due to sickness or death. This report has not
included such calculations in its assessment of economic stresses. However, the Report of the
Commission on the Macroeconomics of Health
calculated, for instance, that in 1999 HIV/
AIDS was costing Sub-Saharan Africa between
5.8 and 17.4 percent of GNP potential every
year.188 At the time of estimation, HIV/AIDS
was estimated to be responsible for 36 million
disability-adjusted life years (DALYs) or years
of active life foregone due to injuries/illnesses,
including premature death. In 2000, the WHO
estimated that climate change was responsible
for 5.5 million DALYs. The amount for 2010
would be more than double that given that thisreport estimates climate-related mortalities
are now over 350,000 per year, compared with
the 150,000 estimated by the WHO for one
decade ago.189 That figure could potentially
more than double once more by 2030, withan economic impairment that is dif ficult to
calculate, but potentially very large.
The prices of basic foodstuffs net of any
influence from climate change are already
expected to rise by 2050 in real terms by
between 39 and 72 percent, depending on
the foodstuff, as a result of expected demand
shifts, population growth, and competition
with biofuels for land.190 In a situation of
such extreme scarcity, the expected decline
in agriculture due to climate change could
force a tripling of the price of wheat based on
estimations by the International Food PolicyResearch Institute.191 The 2007-2008 global
food crisis led to widespread civil unrest
and outbreaks of hunger when a spike in oil
prices, drought, and other factors dramatically
inflated food prices.192 If that is any indication
of how such outcomes might affect the world’s
poorest communities, the impact of further
surges in food prices could have devastating
consequences.
Global fishery production has been expanding rapidly but at highly unsustainable rates that are depleting fish stocks around the world.
70
60
50
40
30
20
10
0
1998 1999 2000 2001 2002 2003 2004 2005 2006 2007
FISHERIES PRODUCTION Tons (millions)
THE EXPECTED DECLINE IN AGRICULTUREDUE TO CLIMATE CHANGE COULD FORCEA TRIPLING OF THE PRICE OF WHEAT
freshwater fish stock depletion over and
above unsustainable fishing is comparable to
that of stock depletion in the warming oceans.
However, there is insuf ficient scientific basis
and data available for the Monitor to take
into account the impact of climate change on
freshwater fish stocks. This is an area that
merits urgent research given that many river
delta countries, and communities relying on
large lakes like Lake Victoria, derive significant
proportions of their agricultural economy and
also their diet from freshwater fish.186
Climate Vulnerability Monitor | CLIMATE VULNERABILITY MONITOR - ECONOMIC STRESS | 97
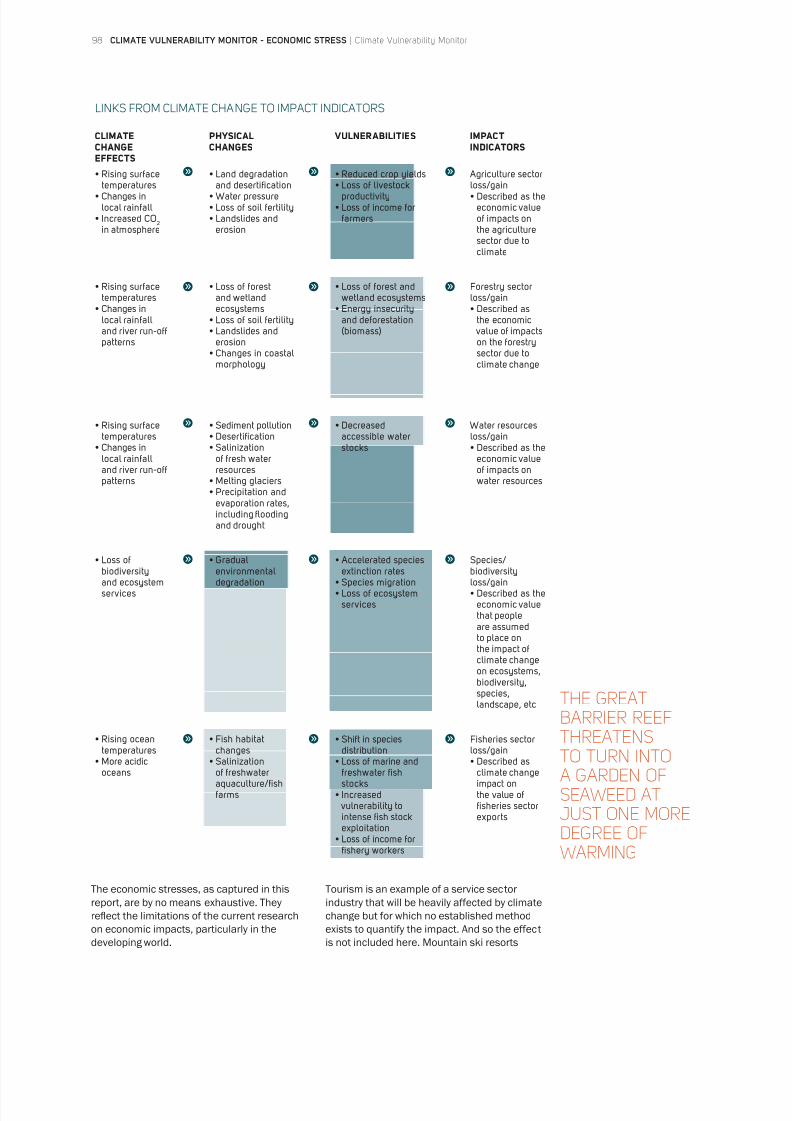
8/8/2019 Climate Vulnerability Monitor 2010: The State of the Climate Crisis
http://slidepdf.com/reader/full/climate-vulnerability-monitor-2010-the-state-of-the-climate-crisis 100/291
LINKS FROM CLIMATE CHANGE TO IMPACT INDICATORS
CLIMATECHANGEEFFECTS
PHYSICALCHANGES
VULNERABILITIES IMPACTINDICATORS
temperatures
local rainfall
2
in atmosphere
and desertification
erosion
productivity
farmers
Agriculture sectorloss/gain
economic valueof impacts onthe agriculturesector due toclimate
temperatures
local rainfalland river run-offpatterns
and wetlandecosystems
erosion
morphology
wetland ecosystems
and deforestation(biomass)
Forestry sectorloss/gain
the economic value of impactson the forestry
sector due toclimate change
temperatures
local rainfalland river run-offpatterns
of fresh waterresources
evaporation rates,including floodingand drought
accessible waterstocks
Water resourcesloss/gain
economic valueof impacts onwater resources
biodiversityand ecosystemservices
environmentaldegradation
extinction rates
services
Species/biodiversityloss/gain
economic valuethat peopleare assumedto place onthe impact ofclimate changeon ecosystems,biodiversity,species,landscape, etc
temperatures
oceans
changes
of freshwateraquaculture/fishfarms
distribution
freshwater fishstocks
vulnerability tointense fish stockexploitation
fishery workers
Fisheries sectorloss/gain
climate changeimpact onthe value offisheries sectorexports
The economic stresses, as captured in thisreport, are by no means exhaustive. They
reflect the limitations of the current research
on economic impacts, particularly in the
developing world.
Tourism is an example of a service sectorindustry that will be heavily affected by climate
change but for which no established method
exists to quantify the impact. And so the effect
is not included here. Mountain ski resorts
THE GREAT
BARRIER REEFTHREATENSTO TURN INTOA GARDEN OFSEAWEED ATJUST ONE MOREDEGREE OFWARMING
98 | CLIMATE VULNERABILITY MONITOR - ECONOMIC STRESS | Climate Vulnerability Monitor
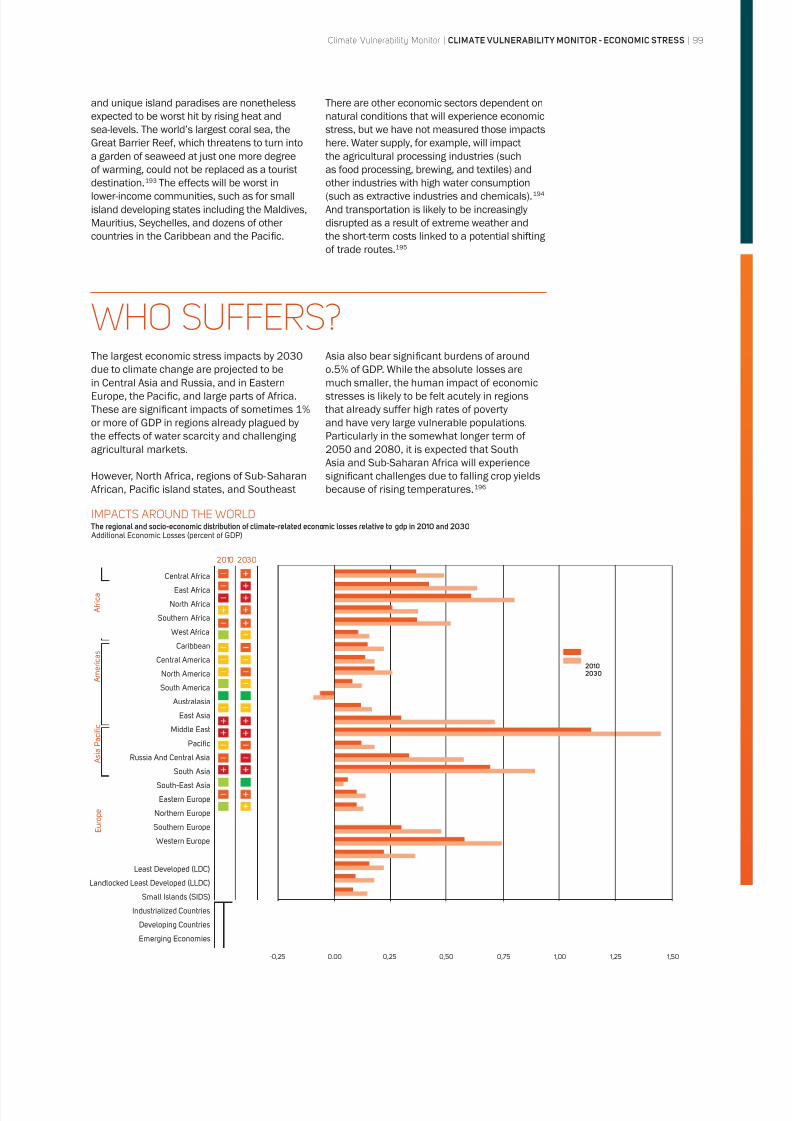
8/8/2019 Climate Vulnerability Monitor 2010: The State of the Climate Crisis
http://slidepdf.com/reader/full/climate-vulnerability-monitor-2010-the-state-of-the-climate-crisis 101/291
and unique island paradises are nonetheless
expected to be worst hit by rising heat and
sea-levels. The world’s largest coral sea, the
Great Barrier Reef, which threatens to turn into
a garden of seaweed at just one more degree
of warming, could not be replaced as a tourist
destination.193 The effects will be worst in
lower-income communities, such as for small
island developing states including the Maldives,
Mauritius, Seychelles, and dozens of other
countries in the Caribbean and the Pacific.
There are other economic sectors dependent on
natural conditions that will experience economic
stress, but we have not measured those impacts
here. Water supply, for example, will impact
the agricultural processing industries (such
as food processing, brewing, and textiles) and
other industries with high water consumption
(such as extractive industries and chemicals).194
And transportation is likely to be increasingly
disrupted as a result of extreme weather and
the short-term costs linked to a potential shifting
of trade routes.195
The largest economic stress impacts by 2030due to climate change are projected to be
in Central Asia and Russia, and in Eastern
Europe, the Pacific, and large parts of Africa.
These are significant impacts of sometimes 1%
or more of GDP in regions already plagued by
the effects of water scarcity and challenging
agricultural markets.
However, North Africa, regions of Sub-Saharan
African, Pacific island states, and Southeast
Asia also bear significant burdens of aroundo.5% of GDP. While the absolute losses are
much smaller, the human impact of economic
stresses is likely to be felt acutely in regions
that already suffer high rates of poverty
and have very large vulnerable populations.
Particularly in the somewhat longer term of
2050 and 2080, it is expected that South
Asia and Sub-Saharan Africa will experience
significant challenges due to falling crop yields
because of rising temperatures.196
WHO SUFFERS?
IMPACTS AROUND THE WORLD The regional and socio-economic distribution of climate-related economic losses relative to gdp in 2010 and 2030
Additional Economic Losses (percent of GDP)
Central Africa
East Africa
North Africa
Southern Africa
West Africa
Caribbean
Central America
North America
South America
Australasia
East Asia
Middle East
Pacific
Russia And Central Asia
South Asia
South-East Asia
Eastern Europe
Northern Europe
Southern Europe
Western Europe
Least Developed (LDC)
Landlocked Least Developed (LLDC)
Small Islands (SIDS)
Industrialized Countries
Developing Countries
Emerging Economies
2010 2030
A f r i c a
A m e r i c a s
A s i a P a c i fi c
E u r o p e
0.00
20102030
0,25-0,25 0,50 0,75 1,00 1,25 1,50
Climate Vulnerability Monitor | CLIMATE VULNERABILITY MONITOR - ECONOMIC STRESS | 99
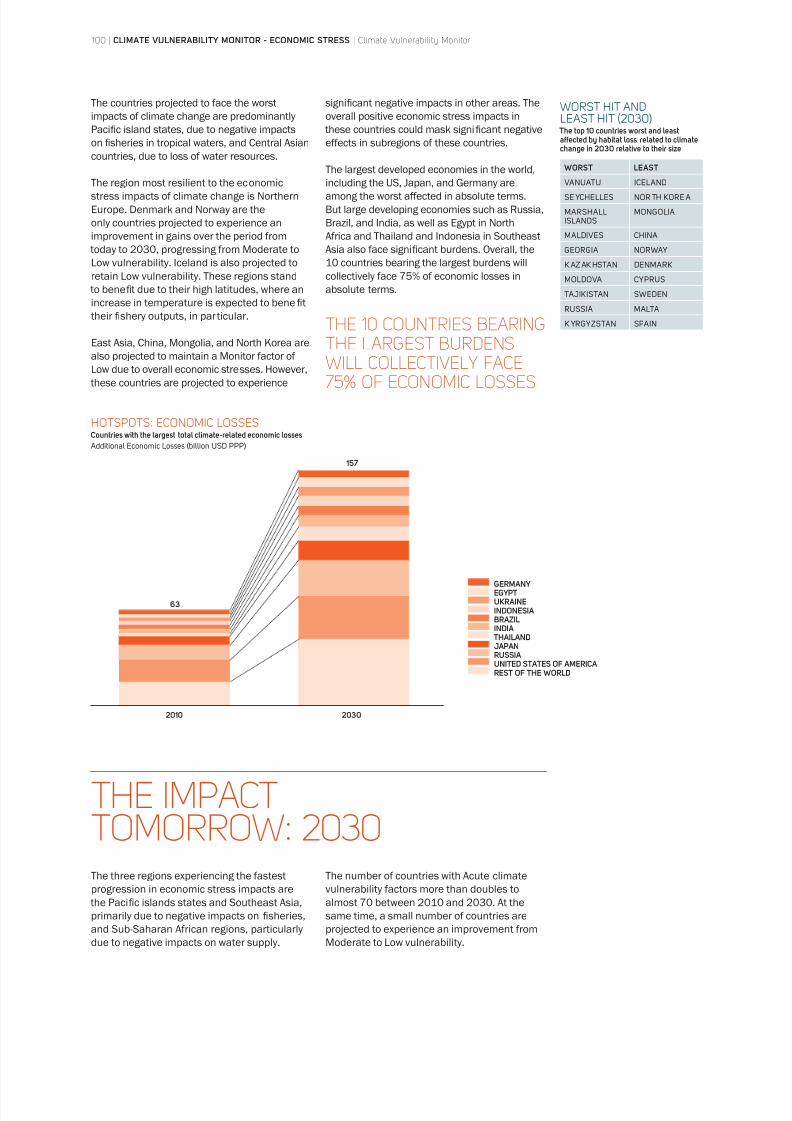
8/8/2019 Climate Vulnerability Monitor 2010: The State of the Climate Crisis
http://slidepdf.com/reader/full/climate-vulnerability-monitor-2010-the-state-of-the-climate-crisis 102/291
The countries projected to face the worst
impacts of climate change are predominantly
Pacific island states, due to negative impacts
on fisheries in tropical waters, and Central Asian
countries, due to loss of water resources.
The region most resilient to the economic
stress impacts of climate change is Northern
Europe. Denmark and Norway are the
only countries projected to experience an
improvement in gains over the period from
today to 2030, progressing from Moderate to
Low vulnerability. Iceland is also projected to
retain Low vulnerability. These regions stand
to benefi t due to their high latitudes, where an
increase in temperature is expected to benefi t
their fishery outputs, in particular.
East Asia, China, Mongolia, and North Korea are
also projected to maintain a Monitor factor of Low due to overall economic stresses. However,
these countries are projected to experience
significant negative impacts in other areas. The
overall positive economic stress impacts in
these countries could mask significant negative
effects in subregions of these countries.
The largest developed economies in the world,
including the US, Japan, and Germany are
among the worst affected in absolute terms.
But large developing economies such as Russia,
Brazil, and India, as well as Egypt in North
Africa and Thailand and Indonesia in Southeast
Asia also face significant burdens. Overall, the
10 countries bearing the largest burdens will
collectively face 75% of economic losses in
absolute terms.
WORST HIT ANDLEAST HIT (2030)
The top 10 countries worst and leastaffected by habitat loss related to climatechange in 2030 relative to their size
WORST LEAST
VANUATU ICELAND
SE YCHELLES NOR TH KORE A
MARSHALLISLANDS
MONGOLIA
MALDIVES CHINA
GEORGIA NORWAY
K AZ AK HSTAN DENMARK
MOLDOVA CYPRUS
TAJIKISTAN SWEDEN
RUSSIA MALTA
K YRGYZSTAN SPAIN
HOTSPOTS: ECONOMIC LOSSESCountries with the largest total climate-related economic losses Additional Economic Losses (billion USD PPP)
GERMANYEGYPTUKRAINEINDONESIABRAZILINDIA
THAILANDJAPANRUSSIAUNITED STATES OF AMERICAREST OF THE WORLD
2010 2030
157
63
2,663
THE 10 COUNTRIES BEARINGTHE LARGEST BURDENSWILL COLLECTIVELY FACE75% OF ECONOMIC LOSSES
THE IMPACTTOMORROW: 2030The three regions experiencing the fastest
progression in economic stress impacts are the Pacific islands states and Southeast Asia,
primarily due to negative impacts on fisheries,
and Sub-Saharan African regions, particularly
due to negative impacts on water supply.
The number of countries with Acute climate
vulnerability factors more than doubles toalmost 70 between 2010 and 2030. At the
same time, a small number of countries are
projected to experience an improvement from
Moderate to Low vulnerability.
100 | CLIMATE VULNERABILITY MONITOR - ECONOMIC STRESS | Climate Vulnerability Monitor

8/8/2019 Climate Vulnerability Monitor 2010: The State of the Climate Crisis
http://slidepdf.com/reader/full/climate-vulnerability-monitor-2010-the-state-of-the-climate-crisis 103/291
SPOTLIGHT: SUPER DROUGHTMany of the worst types of climate change impacts come
from the synergistic interaction between existing degradationor depletion of natural resources and shifts in climate thatreinforce these. Depleted water stocks, rainfall changes,heat, drought, and the agricultural and human consequencesof these combined effects form danger-prone environmentin poorer communities where resource managementis insufficient. Northern India, for example, is generallybecoming drier due to shifts in the Indian monsoon in areaswhere water resources are increasingly scarce as a result ofnon-sustainable pumping of groundwater.197 The combinationof unsustainable resource use and climate stress on theresource could lead to super-droughts with potentiallycatastrophic human and ecosystem impacts for the region.
India is home to about 16% of the global population but hasonly 4% of the total water resources, with the irrigationsector consuming 83% of India’s. The main water source of
water replenishment in India consists of precipitation within
Indian territory.198
In 2009, the poor monsoon season caused severedrought impacts in 40% of districts. The northwestern andnortheastern parts of the country were worst affected amidone of the weakest monsoon seasons for almost 40 years.199
Between August 2002 and October 2008, three northwestIndian states lost a volume of water from undergroundsupplies equal to more than twice the capacity of Lake Mead(1 1/4 trillion cubic feet of water), the US’s largest reservoir.200 Evidence points to the pumping of water from wells forirrigation as highly damaging to India’s resources. Without
measures to curb demand, further climate stresses ondwindling groundwater supplies could cause serious drinking-water shortages and erode crop production in a regioninhabited by over 100 million people.201
Small island developing states like Maldives,
Marshall Islands, Seychelles, and Vanuatu allface fast progressions in economic losses. This
is also the case for Vietnam in Southeast Asia
and for Namibia in Southern Africa. Negative
impacts on fisheries play an important role in the acceleration of negative impacts for these
countries between 2010 and 2030.
VULNERABILITY SHIFT The change in the number of countries by each Vulnerability Factor between 2010 and 2030Number of Countries by Vulnerability Factor
Acute+
Acute-
Severe+
Severe-
High+
High-
Moderate
Low
20102030
1748
1120
2023
29 15
22 11
4248
39 13
46
HIGH SURGE VULNERABILITYCountries with the fastest growing climate-related economic losses between 2010 and 2030Percentage increase in climate-related economic losses
Vanuatu
Seychelles
Marshall Islands
Maldives
Guyana
Solomon Islands
Vietnam
Namibia
Kiribati
Belize
0 40 80 120
Climate Vulnerability Monitor | CLIMATE VULNERABILITY MONITOR - ECONOMIC STRESS | 101
8/8/2019 Climate Vulnerability Monitor 2010: The State of the Climate Crisis
http://slidepdf.com/reader/full/climate-vulnerability-monitor-2010-the-state-of-the-climate-crisis 104/291
THE ASSESSMENTThe Economic Stress impact area is calculated by using a
set of variables indicating the projected economic losses in
different sectors as a share of GDP due to climate change.
Estimates for four economic sectors are based on the FUND
(2.8n) model.202 The model links exogenous population
and per capita income scenarios with simple models of
technology, economics, emissions, atmospheric chemistry,
climate and sea-levels in order to estimate impacts such
as migration, disease burdens and economic effects on a
sector basis.
In addition to reliance of FUND, economic losses in fisheries
are calculated using Cheung et al. 2010 estimates.203
Cheung et al. estimate the change in maximum catch
potential due to climate change.
FUND offers national level economic loss estimates but
many of its parameters are at the level of 16 regions
meaning country effects encapsulate the average effect
across a sub-region leading to inaccurate assessment
results. For instance, Spain (High-/High-) is an example of a
country that we expect to be worse impacted than Western
Europe -- its model home sub-region, one also incorporating
Northern Europe. Spain is affected in relation to water
resources, an anticipated increase in temperatures (and
plant evapotranspiration) and a decrease in rainfall, by
5%-10% to up to 20%-22% by the end of the 21st century.204
Northern Europe on the other hand may be set to gain inagricultural production due to climate change.205
The Baltic states (Acute+/Acute+) are examples of countries
that we expect to be less impacted than countries from the
former Soviet Union on average.
The key variable driving the findings on economic stress are
water resources. A large part of the water resources impact
concerns the agricultural sector, although other key sectors
drawing heavily on water are also concerned.
The finding that stands out from the model is that Central
Asia, Russia and Eastern Europe face significant water
resources impacts.206 This includes for example Russia(Acute+/Acute+), Kazakhstan (Acute+/Acute+) and Poland
(Severe+/Acute-). The key explanation for this is that these
regions have continental climates (as opposed to coastal).
They are projected to face high temperature rises and their
water resources are sensitive to the changes (particularly
due to “evapotranspiration”).
Countries in South Asia on the other hand stand out
for relatively low vulnerability, for example Afghanistan
(Moderate/High-), India (High-/High-) and Pakistan (High-/
High-) regardless of expected continued high temperatures.
These countries bear a high health burden among children
due to causes related to nutrition and water access. They
are also projected to be among the hardest-hit by declining
crop yields in the longer term.207
The key to understanding why the Economic Stress assesses
only a Moderate/High factor to the South Asian countries
is that the worst impacts globally in the near term (our
2010/2030) are related to water resources rather than
temperature. The majority of South Asia is not expected
to suffer significant water stresses as a result of climatechange -- although major water stress issues prevail for
other reasons. Shifts in precipitation/evaporation/river
flows drive the “early” results, while projected temperature
impacts on yields follow by 2050/2080, since water impacts
have a proportionally higher impact on agricultural yields for
instance than higher temperatures. This is why Central Asia/
Russia and North Africa experience impacts sooner than
South Asia.208
A number of Small Island States, such as the Maldives
(Severe-/Severe+), the Marshall Islands (Acute-/Acute+) and
other Pacific countries are to be found near the top of the list
due tofi
sheries impacts, in particular related to the expecteddestruction of coral reefs, which are much more moderate
for instance for the rest of South Asia.
102 | CLIMATE VULNERABILITY MONITOR - ECONOMIC STRESS | Climate Vulnerability Monitor
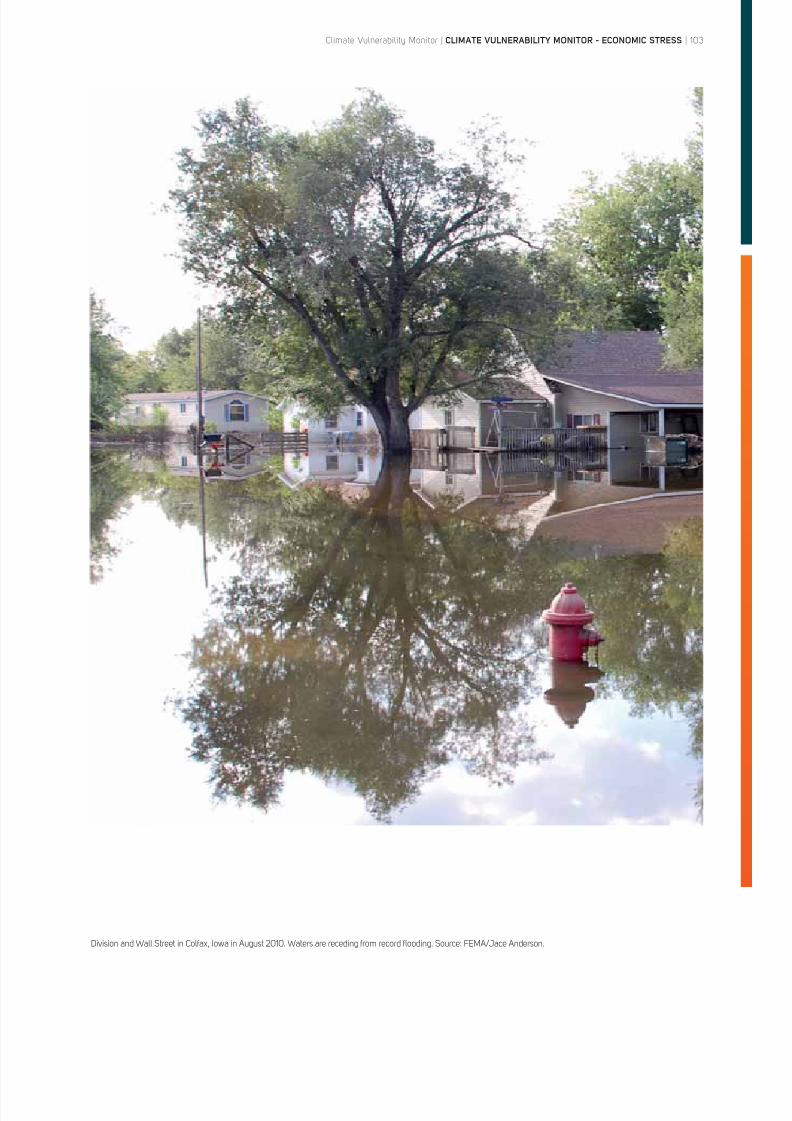
8/8/2019 Climate Vulnerability Monitor 2010: The State of the Climate Crisis
http://slidepdf.com/reader/full/climate-vulnerability-monitor-2010-the-state-of-the-climate-crisis 105/291
Division and Wall Street in Colfax, Iowa in August 2010. Waters are receding from record flooding. Source: FEMA/Jace Anderson.
Climate Vulnerability Monitor | CLIMATE VULNERABILITY MONITOR - ECONOMIC STRESS | 103
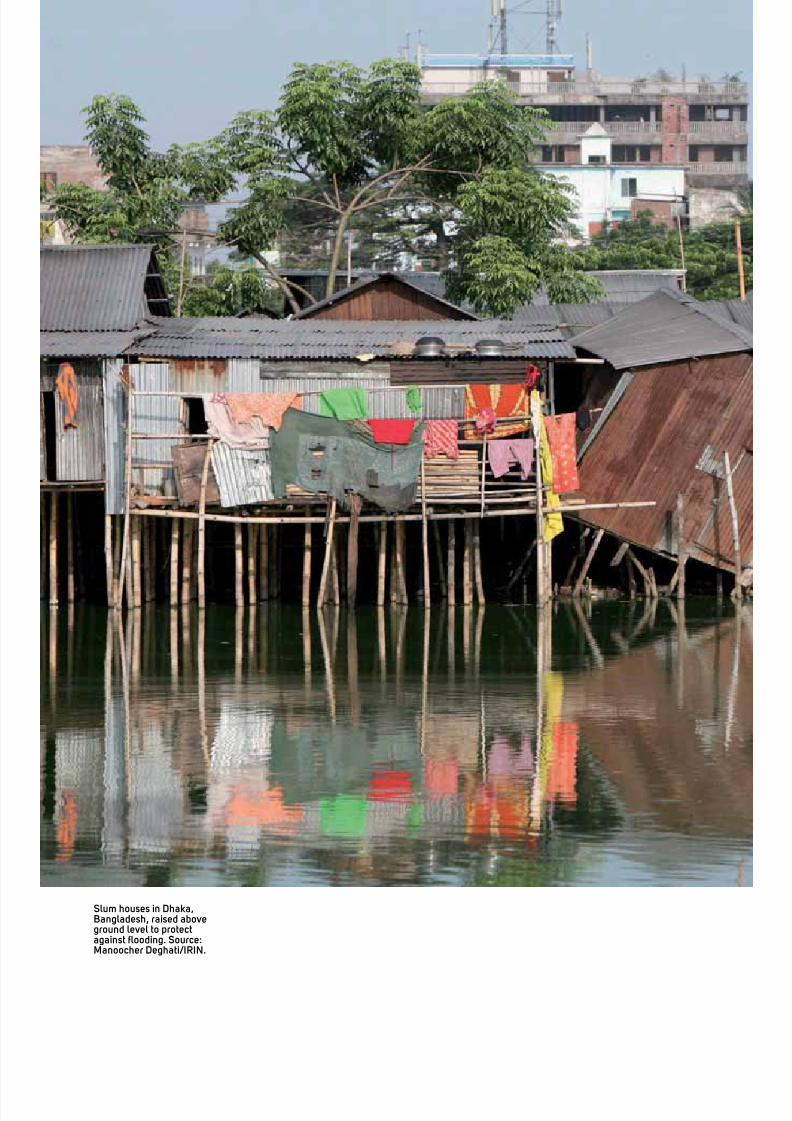
8/8/2019 Climate Vulnerability Monitor 2010: The State of the Climate Crisis
http://slidepdf.com/reader/full/climate-vulnerability-monitor-2010-the-state-of-the-climate-crisis 106/291
Slum houses in Dhaka,Bangladesh, raised aboveground level to protectagainst flooding. Source:Manoocher Deghati/IRIN.
8/8/2019 Climate Vulnerability Monitor 2010: The State of the Climate Crisis
http://slidepdf.com/reader/full/climate-vulnerability-monitor-2010-the-state-of-the-climate-crisis 107/291
ADAPTATIONPERFORMANCE
REVIEW
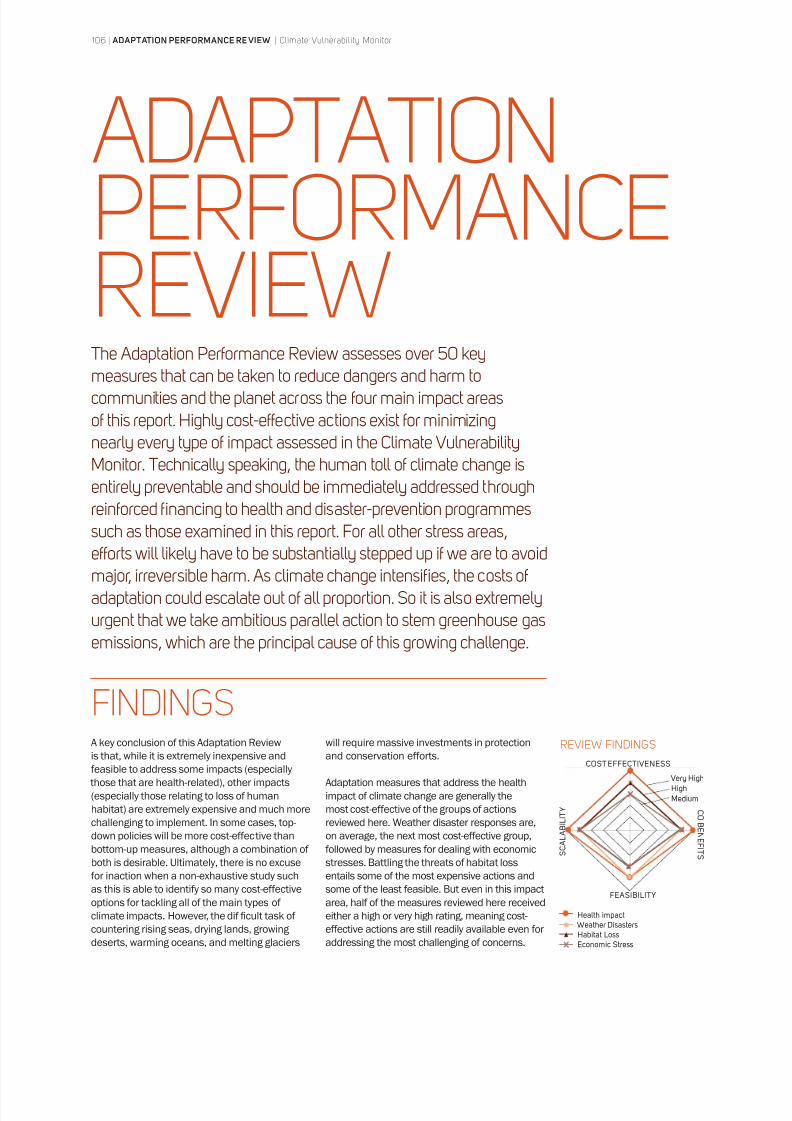
8/8/2019 Climate Vulnerability Monitor 2010: The State of the Climate Crisis
http://slidepdf.com/reader/full/climate-vulnerability-monitor-2010-the-state-of-the-climate-crisis 108/291
A key conclusion of this Adaptation Review
is that, while it is extremely inexpensive and
feasible to address some impacts (especially
those that are health-related), other impacts
(especially those relating to loss of human
habitat) are extremely expensive and much more
challenging to implement. In some cases, top-
down policies will be more cost-effective than
bottom-up measures, although a combination of
both is desirable. Ultimately, there is no excuse
for inaction when a non-exhaustive study such
as this is able to identify so many cost-effectiveoptions for tackling all of the main types of
climate impacts. However, the dif ficult task of
countering rising seas, drying lands, growing
deserts, warming oceans, and melting glaciers
will require massive investments in protection
and conservation efforts.
Adaptation measures that address the health
impact of climate change are generally the
most cost-effective of the groups of actions
reviewed here. Weather disaster responses are,
on average, the next most cost-effective group,
followed by measures for dealing with economic
stresses. Battling the threats of habitat loss
entails some of the most expensive actions and
some of the least feasible. But even in this impactarea, half of the measures reviewed here received
either a high or very high rating, meaning cost-
effective actions are still readily available even for
addressing the most challenging of concerns.
106 | ADAPTATION PERFORMANCE RE VIEW | Climate Vulnerability Monitor
ADAPTATIONPERFORMANCEREVIEWThe Adaptation Performance Review assesses over 50 keymeasures that can be taken to reduce dangers and harm tocommunities and the planet across the four main impact areasof this report. Highly cost-effective actions exist for minimizingnearly every type of impact assessed in the Climate VulnerabilityMonitor. Technically speaking, the human toll of climate change isentirely preventable and should be immediately addressed throughreinforced financing to health and disaster-prevention programmes
such as those examined in this report. For all other stress areas,efforts will likely have to be substantially stepped up if we are to avoidmajor, irreversible harm. As climate change intensifies, the costs ofadaptation could escalate out of all proportion. So it is also extremelyurgent that we take ambitious parallel action to stem greenhouse gasemissions, which are the principal cause of this growing challenge.
FINDINGSREVIEW FINDINGS
Health impact Weather DisastersHabitat LossEconomic Stress
COST EFFECTIVENESS
S C A L A B I L I T Y C
O B E N E F I T S
FEASIBILITY
Very High
High
Medium
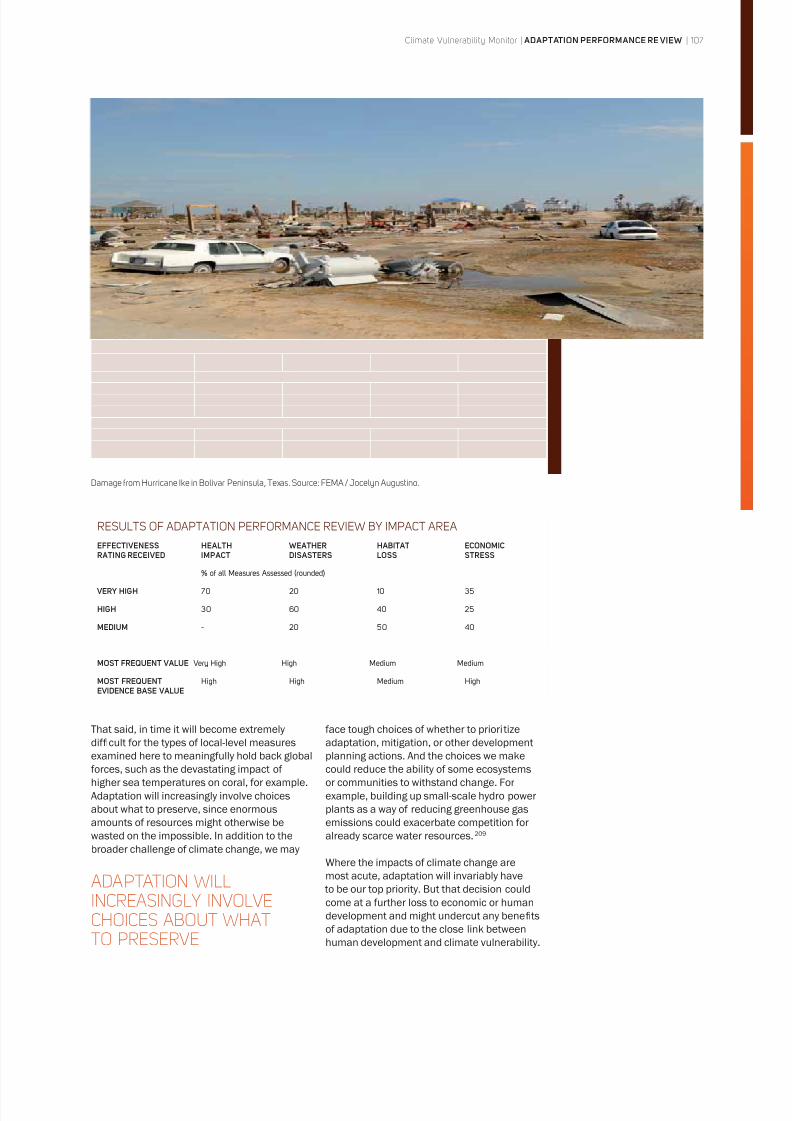
8/8/2019 Climate Vulnerability Monitor 2010: The State of the Climate Crisis
http://slidepdf.com/reader/full/climate-vulnerability-monitor-2010-the-state-of-the-climate-crisis 109/291
Climate Vulnerability Monitor | ADAPTATION PERFORMANCE RE VIEW | 107
RESULTS OF ADAPTATION PERFORMANCE REVIEW BY IMPACT AREA
EFFECTIVENESSRATING RECEIVED
HEALTHIMPACT
WEATHERDISASTERS
HABITATLOSS
ECONOMICSTRESS
% of all Measures Assessed (rounded)
VERY HIGH 70 20 10 35
HIGH 30 60 40 25
MEDIUM - 20 50 40
MOST FREQUENT VALUE Very High High Medium Medium
MOST FREQUENTEVIDENCE BASE VALUE
High High Medium High
That said, in time it will become extremely
dif ficult for the types of local-level measures
examined here to meaningfully hold back global
forces, such as the devastating impact of
higher sea temperatures on coral, for example.
Adaptation will increasingly involve choices
about what to preserve, since enormous
amounts of resources might otherwise be
wasted on the impossible. In addition to the
broader challenge of climate change, we may
face tough choices of whether to prioritize
adaptation, mitigation, or other development
planning actions. And the choices we make
could reduce the ability of some ecosystems
or communities to withstand change. For
example, building up small-scale hydro power
plants as a way of reducing greenhouse gas
emissions could exacerbate competition for
already scarce water resources.209
Where the impacts of climate change are
most acute, adaptation will invariably have
to be our top priority. But that decision couldcome at a further loss to economic or human
development and might undercut any benefi ts
of adaptation due to the close link between
human development and climate vulnerability.
ADAPTATION WILLINCREASINGLY INVOLVECHOICES ABOUT WHATTO PRESERVE
Damage from Hurricane Ike in Bolivar Peninsula, Texas. Source: FEMA / Jocelyn Augustino.
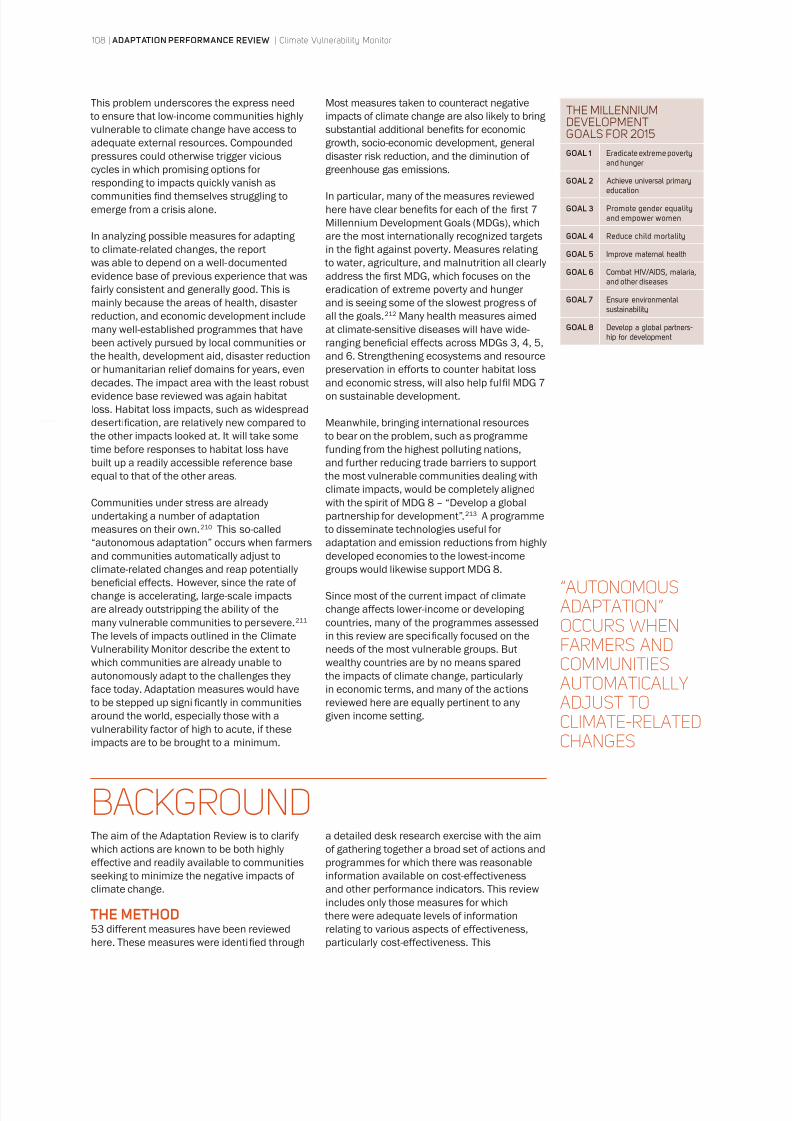
8/8/2019 Climate Vulnerability Monitor 2010: The State of the Climate Crisis
http://slidepdf.com/reader/full/climate-vulnerability-monitor-2010-the-state-of-the-climate-crisis 110/291
108 | ADAPTATION PERFORMANCE REVIEW | Climate Vulnerability Monitor
THE MILLENNIUMDEVELOPMENTGOALS FOR 2015
GOAL 1 Eradicate extreme povertyand hunger
GOAL 2 Achieve universal primaryeducation
GOAL 3 Promote gender equalityand empower women
GOAL 4 Reduce child mortality
GOAL 5 Improve maternal health
GOAL 6 Combat HIV/AIDS, malaria,and other diseases
GOAL 7 Ensure environmentalsustainability
GOAL 8 Develop a global partners-hip for development
This problem underscores the express need
to ensure that low-income communities highly
vulnerable to climate change have access to
adequate external resources. Compounded
pressures could otherwise trigger vicious
cycles in which promising options for
responding to impacts quickly vanish as
communities find themselves struggling to
emerge from a crisis alone.
In analyzing possible measures for adapting
to climate-related changes, the report
was able to depend on a well-documented
evidence base of previous experience that was
fairly consistent and generally good. This is
mainly because the areas of health, disaster
reduction, and economic development include
many well-established programmes that have
been actively pursued by local communities or
the health, development aid, disaster reductionor humanitarian relief domains for years, even
decades. The impact area with the least robust
evidence base reviewed was again habitat
loss. Habitat loss impacts, such as widespread
desertification, are relatively new compared to
the other impacts looked at. It will take some
time before responses to habitat loss have
built up a readily accessible reference base
equal to that of the other areas.
Communities under stress are already
undertaking a number of adaptation
measures on their own.
210
This so-called“autonomous adaptation” occurs when farmers
and communities automatically adjust to
climate-related changes and reap potentially
beneficial effects. However, since the rate of
change is accelerating, large-scale impacts
are already outstripping the ability of the
many vulnerable communities to persevere.211
The levels of impacts outlined in the Climate
Vulnerability Monitor describe the extent to
which communities are already unable to
autonomously adapt to the challenges they
face today. Adaptation measures would have
to be stepped up significantly in communities
around the world, especially those with avulnerability factor of high to acute, if these
impacts are to be brought to a minimum.
Most measures taken to counteract negative
impacts of climate change are also likely to bring
substantial additional benefi ts for economic
growth, socio-economic development, general
disaster risk reduction, and the diminution of
greenhouse gas emissions.
In particular, many of the measures reviewed
here have clear benefi ts for each of the first 7
Millennium Development Goals (MDGs), which
are the most internationally recognized targets
in the fight against poverty. Measures relating
to water, agriculture, and malnutrition all clearly
address the first MDG, which focuses on the
eradication of extreme poverty and hunger
and is seeing some of the slowest progress of
all the goals.212 Many health measures aimed
at climate-sensitive diseases will have wide-
ranging beneficial effects across MDGs 3, 4, 5,
and 6. Strengthening ecosystems and resourcepreservation in efforts to counter habitat loss
and economic stress, will also help fulfil MDG 7
on sustainable development.
Meanwhile, bringing international resources
to bear on the problem, such as programme
funding from the highest polluting nations,
and further reducing trade barriers to support
the most vulnerable communities dealing with
climate impacts, would be completely aligned
with the spirit of MDG 8 – “Develop a global
partnership for development”.213 A programme
to disseminate technologies useful foradaptation and emission reductions from highly
developed economies to the lowest-income
groups would likewise support MDG 8.
Since most of the current impact of climate
change affects lower-income or developing
countries, many of the programmes assessed
in this review are specifically focused on the
needs of the most vulnerable groups. But
wealthy countries are by no means spared
the impacts of climate change, particularly
in economic terms, and many of the actions
reviewed here are equally pertinent to any
given income setting.
The aim of the Adaptation Review is to clarify
which actions are known to be both highly
effective and readily available to communities
seeking to minimize the negative impacts of
climate change.
THE METHOD53 different measures have been reviewed
here. These measures were identified through
a detailed desk research exercise with the aim
of gathering together a broad set of actions and
programmes for which there was reasonable
information available on cost-effectiveness
and other performance indicators. This reviewincludes only those measures for which
there were adequate levels of information
relating to various aspects of effectiveness,
particularly cost-effectiveness. This
“AUTONOMOUSADAPTATION”OCCURS WHENFARMERS ANDCOMMUNITIESAUTOMATICALLYADJUST TOCLIMATE-RELATEDCHANGES
BACKGROUND
8/8/2019 Climate Vulnerability Monitor 2010: The State of the Climate Crisis
http://slidepdf.com/reader/full/climate-vulnerability-monitor-2010-the-state-of-the-climate-crisis 111/291
Climate Vulnerability Monitor | ADAPTATION PERFORMANCE RE VIEW | 109
information mainly stems from development
or specialist literature or National Adaptation
Programmes for Actions (NAPAs) and varies
in quality from one impact area or measure
to another. In some cases, the unsatisfactory
levels of information on specific types of
actions revealed a major gap in our toolset
for measuring the success of adaptation
measures and policy-making – a gap that
must be addressed if we are to improve our
understanding of the climate challenge.
The actions included here are those that relate
to the impact areas covered in the Monitor,
so they are not comprehensive. Also, certain
climate-related impacts, such as permafrost
thawing, for example, are not taken into
account either here or in the Monitor.
Neither are the actions highlighted herenecessarily what would be considered
“adaptation policies”, since they have only
been framed in relation to Monitor impacts and
consist of just individual projects in most cases.
This catalogue clearly represents just a subset
of all possible effective adaptation responses,
but it still provides a good indication of the
different types of options available.
All measures are rated in terms of their relative
effectiveness in reducing a given impact as
identified in the Monitor. So, for example, a
measure may be rated as benefi
cial in reducing mortality rates resulting from diarrhea, or in
countering lost income due to low agricultural
yields in water stressed areas. Beyond
cost-effectiveness (“Cost-Effectiveness”),
each action has also been reviewed for its co-
benefi ts in supporting other positive changes
in society and its ability to equitably benefi t
wide-ranging groups of people, especially the
poor (“Co-Benefi ts”); for its ability to be easily
implemented, bearing in mind uncontrollable
risks (“Feasibility”); and for its ability to
be easily reproduced in different places
(“Scalability”). The assessment methodology
we used is explained in more detail in the endmatter of this report.
The various action sheets that follow in
this section of the report detail each of the
measures reviewed. They include information
about the effect (“Immediate”, “Short-Term”,
and “Long-Term”) that an action will have in
terms of reducing impacts. They also detail
whether the measure can be rolled out quickly
(“Quick Start”) or, if not, how long it might take
(“Implementation Lapse”). If measures are
tied to a programme cycle, such as a school
year, the typical timeframe length is also given.Finally, where measures clearly contribute to
one or more of the Millennium Development
Goals, the specific goal number is a listed
under “MDG Boost”.
LIMITATIONS AND STRENGTHSThe Review does have clear limitations. For
example, most health measures – and several
other types of measures – will be significantly
cheaper to implement in poorer countries
than in highly developed economies. Actions
might vary significantly in implementation
from one country to another depending on a
country’s particular situation. For this reason,
some implementations could see risks or
scalability issues beyond what we have been
able to capture in the Review. It is dif ficult
also to compare measures that save human
lives to measures that reduce an economic
impact within an industry. Nevertheless,
each measure does give a fair indication of
cost in relation to other types of measures
within its own impact area. And The Review
makes clear the cost differences between
an infrastructure-type response and, say, thepromotion of breastfeeding programmes.
So interesting insights nevertheless emerge
and provide a good indication of the varying
options and cost burdens that could apply to
a given country depending on its vulnerability
profile. Countries should find health impacts,
for instance, cheaper in general to combat than
desertification or sea-level rise impacts.
Since the Review was organized specifically
to verify effectiveness in reducing negative
impacts, it has not focused on a number
of common adaptation concepts, suchas prevention (or the avoidance of harm),
adaptive capacity (the ability to deal with
change) in the face of long-term climate
stresses, or resilience (the ability to recover
from a shock) in the face of extreme weather,
drought, or other disasters. Nevertheless, the
actions assessed here invariably reinforce
both adaptive capacity and resilience, such
as through coral conservation and re-growth,
mangrove planting, or hurricane-resistant
housing. They may also help to prevent harm
from occurring in the first place through
effective flood control, for example.
The Review does, however, have an in-built
bias towards concrete practical measures,
project-based responses, and infrastructure
programmes, since the costs, and sometimes
benefi ts, of such measures are quite clear.
Such measures have also largely been the
focus of international spending on adaptation
and related areas until now.214
The Review only takes limited account of
external factors that will play a considerable
role in the implementation of the actions
assessed here, such as underlying governance,legislation, local capacities, policy frameworks,
and other factors that will have a critical
effect on a country’s ability to take adaptation
measures. Nor does the Review take into
8/8/2019 Climate Vulnerability Monitor 2010: The State of the Climate Crisis
http://slidepdf.com/reader/full/climate-vulnerability-monitor-2010-the-state-of-the-climate-crisis 112/291
110 | ADAPTATION PERFORMANCE RE VIEW | Climate Vulnerability Monitor
account financial instruments, such as
highly effective private sector strategies of
risk transfer through insurance. These are
the subjects of numerous other excellent
publications of late.215
LINKS TO BROADER STRATEGIESBroader development strategies and policy and
legislation responses not captured here also
play a critical role in any effective response to
the impacts of climate change. For example,
the Review only hints at how sustainable
governance and management of natural
resources such as water, forests, and fisheries
are necessary to marine conservation or
reforestation programmes.
Diminishing water stocks due, in many cases,
to over-extraction or unsustainable usage are
just one example of a major natural resourcesuffering accelerated depletion in areas
receiving less rainfall or experiencing more
drought as a result of climate change. The
impact of climate change on water is also
one of the main drivers of economic losses
in the Monitor. Rationing or conserving water
at the individual or community level such as
through rainwater harvesting or micro-irrigation
measures mentioned in this Review are
examples of how water resources can be better
conserved at a grassroots level.
However, bottom-up measures will likelybe inadequate if pursued in isolation from
top-down policies and efforts. Government
intervention through legislation or other policies
may be necessary to restrict or manage ongoing
extraction or access to water resources in order
to avoid total depletion. Ideally, such legislation
would in turn encourage wider adoption of
the types of water conservation or rationing
practices in the Review, which could well
become widespread as a result.
Just as many of the actions in the Review
reinforce the MDGs, so too broader human
development strategies can play a pivotal role
in supporting responses to climate change.
Gender development strategies, for instance,
have been shown to have a major positive
effect on child health – and children are a
demographic group heavily impacted by climate
change.216 The creation and maintenance of
social safety nets and other non-monetized
services that strengthen communities can alsoreduce vulnerability to climate change.217
Many of these types of broader responses
rely on adequate governance or robust public
services and depend on strong legal systems
and institutions capable of implementing
and enforcing laws that protect or encourage
positive social or individual behavioural
changes. In fact, many of the cost-effective
actions covered in this Review cannot be
implemented in situations with inadequate
public services or legal and governance
structures. Reinforcing these public services is therefore also critical to a successful response
to the impacts of climate change. This also
partly explains why so many fragile states are
among the most acutely vulnerable to climate
change. And for these reasons, communities
with both high factors of vulnerability and low
human development should be singled out for
specific attention.
REINFORCING PUBLICSERVICES IS CRITICALTO A SUCCESSFULRESPONSE TO THE IMPACTS
OF CLIMATE CHANGE
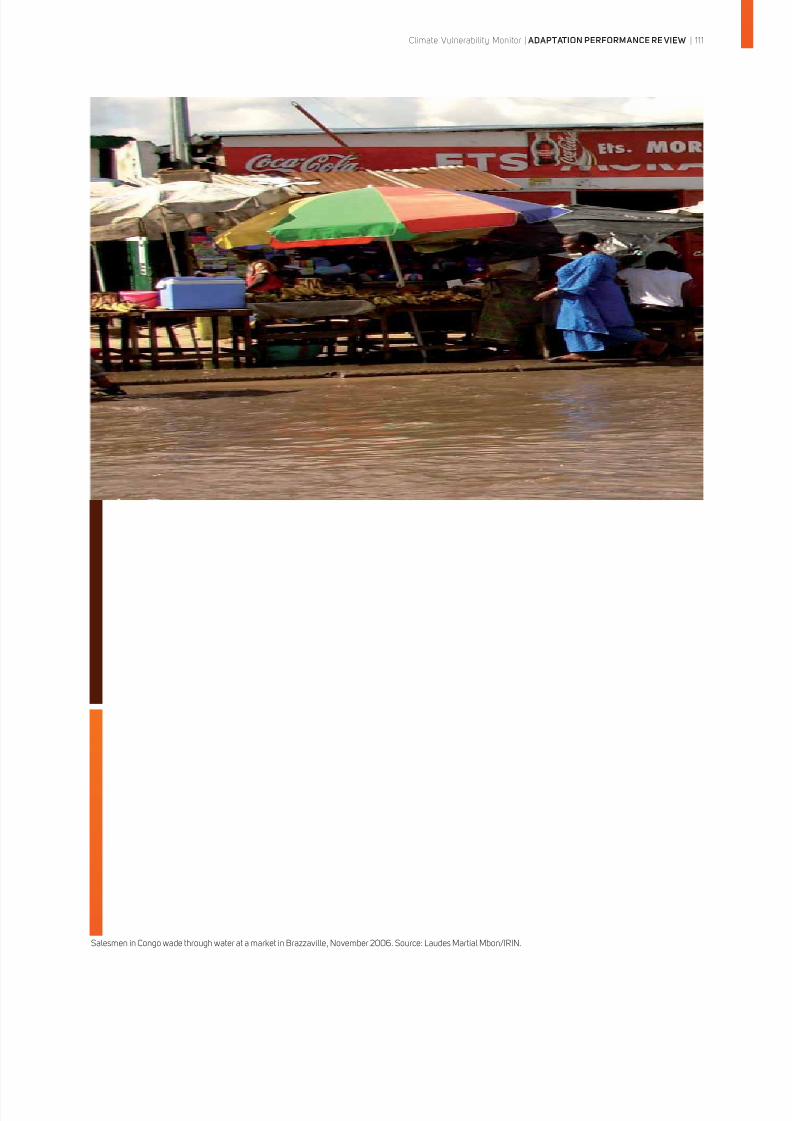
8/8/2019 Climate Vulnerability Monitor 2010: The State of the Climate Crisis
http://slidepdf.com/reader/full/climate-vulnerability-monitor-2010-the-state-of-the-climate-crisis 113/291
Climate Vulnerability Monitor | ADAPTATION PERFORMANCE RE VIEW | 111
Salesmen in Congo wade through water at a market in Brazzaville, November 2006. Source: Laudes Martial Mbon/IRIN.
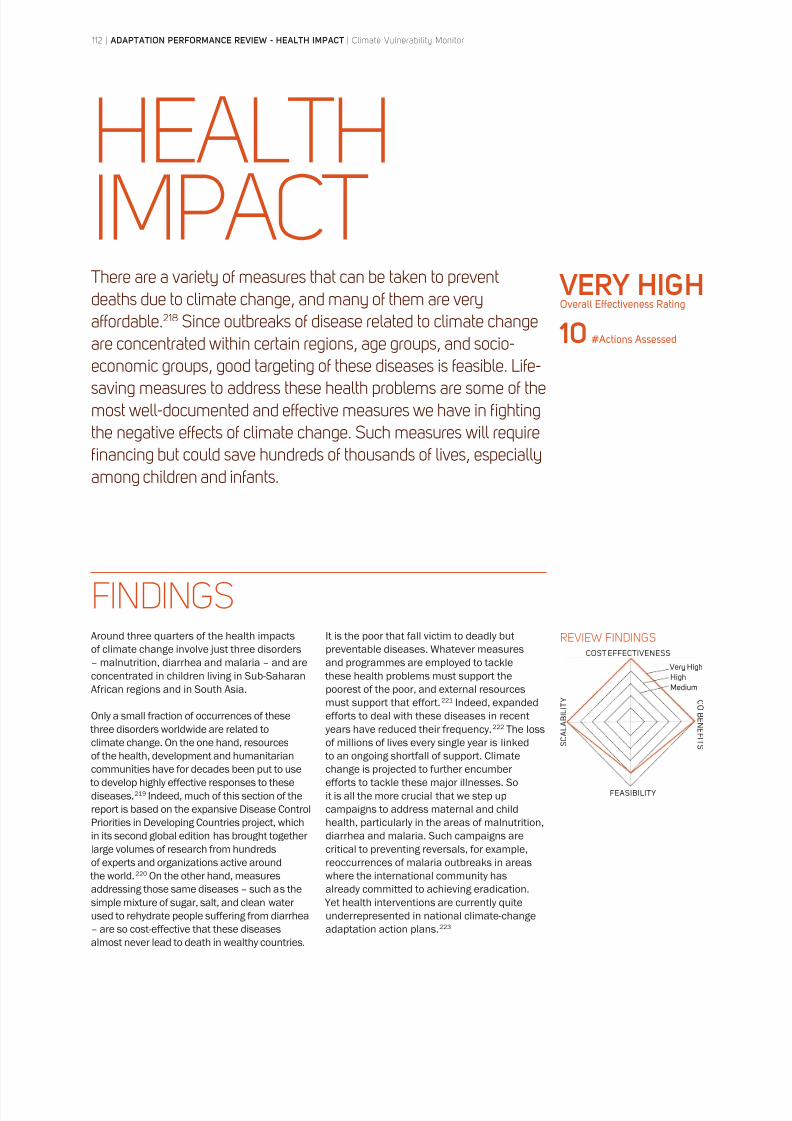
8/8/2019 Climate Vulnerability Monitor 2010: The State of the Climate Crisis
http://slidepdf.com/reader/full/climate-vulnerability-monitor-2010-the-state-of-the-climate-crisis 114/291
112 | ADAPTATION PERFORMANCE REVIEW - HEALTH IMPACT | Climate Vulnerability Monitor
HEALTHIMPACTThere are a variety of measures that can be taken to preventdeaths due to climate change, and many of them are veryaffordable.218 Since outbreaks of disease related to climate changeare concentrated within certain regions, age groups, and socio-economic groups, good targeting of these diseases is feasible. Life-saving measures to address these health problems are some of themost well-documented and effective measures we have in fightingthe negative effects of climate change. Such measures will requirefinancing but could save hundreds of thousands of lives, especiallyamong children and infants.
Around three quarters of the health impacts
of climate change involve just three disorders
– malnutrition, diarrhea and malaria – and are
concentrated in children living in Sub-Saharan
African regions and in South Asia.
Only a small fraction of occurrences of these three disorders worldwide are related to
climate change. On the one hand, resources
of the health, development and humanitarian
communities have for decades been put to use
to develop highly effective responses to these
diseases.219 Indeed, much of this section of the
report is based on the expansive Disease Control
Priorities in Developing Countries project, which
in its second global edition has brought together
large volumes of research from hundreds
of experts and organizations active around
the world.220 On the other hand, measures
addressing those same diseases – such as thesimple mixture of sugar, salt, and clean water
used to rehydrate people suffering from diarrhea
– are so cost-effective that these diseases
almost never lead to death in wealthy countries.
It is the poor that fall victim to deadly but
preventable diseases. Whatever measures
and programmes are employed to tackle
these health problems must support the
poorest of the poor, and external resources
must support that effort.221 Indeed, expanded
efforts to deal with these diseases in recentyears have reduced their frequency.222 The loss
of millions of lives every single year is linked
to an ongoing shortfall of support. Climate
change is projected to further encumber
efforts to tackle these major illnesses. So
it is all the more crucial that we step up
campaigns to address maternal and child
health, particularly in the areas of malnutrition,
diarrhea and malaria. Such campaigns are
critical to preventing reversals, for example,
reoccurrences of malaria outbreaks in areas
where the international community has
already committed to achieving eradication. Yet health interventions are currently quite
underrepresented in national climate-change
adaptation action plans.223
FINDINGSREVIEW FINDINGS
VERY HIGH Overall Effectiveness Rating
10 #Actions Assessed
COST EFFECTIVENESS
S C A L A B I L
I T Y C
O
B E N E F I T S
FEASIBILITY
Very High
High
Medium
8/8/2019 Climate Vulnerability Monitor 2010: The State of the Climate Crisis
http://slidepdf.com/reader/full/climate-vulnerability-monitor-2010-the-state-of-the-climate-crisis 115/291
Climate Vulnerability Monitor | ADAPTATION PERFORMANCE REVIEW - HEALTH IMPACT | 113
All the health measures assessed in this report
registered high levels of effectiveness in limiting
the negative effects of climate on health.
For each health concern there is a
corresponding array of immediate, medium-
and long-term measures that are effective for
various age groups and for various urban and
rural settings.
All of the health-related interventions included
in this report are cost-effective, and several
are highly cost-effective, requiring less than
USD 500 to prevent one year’s ill health (which
the health community refers to as Disability
Adjusted Life Years).
In almost every case, the measures that could
be taken to reduce health problems also
have clear socio-economic benefi ts or other
advantages. For instance, in-school feeding
programmes also yield educational advantages,
and improved water and sanitation facilities help
foster wider economic activities.224
There is generally a highly comprehensive
body of accumulated evidence and empirical
and case-study research available to rate the
effectiveness of various health measures
and to support decisions on how to go about
implementing those measures. Guidelines and
training programmes are also readily available
for all measures suitable to the worst-affected
populations, which include lowest-income
and conflict-stricken communities as well
as communities experiencing emergency
situations. In cases where rising temperatures
are enabling diseases like malaria and dengue
fever to spread to populations in higher
altitudes, for instance, existing measures
(such as the distribution of insecticide-treated
bed nets) can be implemented in the newly
effected zones.
The factor most likely to hinder implementation
of specific measures to combat climate-change
related health problems is feasibility. Improving
water supplies is possible, for example, only
if a reliable source of water is available. And a
range of factors – among them climate change
itself – make finding reliable water sources
increasingly dif ficult.225 Similarly, construction
and maintenance of adequate sanitation
facilities in rural or island communities require
local expertise and resources that are not
always on hand.226
THE REVIEW
A phased approach is critical to effectively
addressing the health impacts of climate
change, and rolling back the burden of
climate-sensitive diseases in general, as is the
international community’s established goal.
A number of measures can have an almost
immediate effect and, in some instances,can reliably avert death in the large majority
of cases. Bed nets and in-door insecticide
spraying, for example, offer immediate
protection for families located in malaria-
endemic areas by keeping disease-carrying
mosquitoes away.227 Oral rehydration
therapies, such as use of water-based sugar-
salt solutions, can prevent death and help
patients recover from dehydration.228 None of
these interventions permanently reverses the
course of disease.
Some illnesses can be tackled at the rootof their cause. For instance, Rotavirus A,
which causes 90% of infectious diarrhea
cases, is passed from person to person via
contaminated faecal particles introduced into
the body via the mouth.229 Improved water and
sanitation facilities limit transmission of the
disease. Immunization can also help prevent
the virus from making children sick.
Almost all health measures included in this
report fall into the immediate or short-term
(impact within one year) categories. Excessiveheat notification and response systems, for
example, will really only have an effect when a
heat wave occurs.230
TIMEFRAME CONCERNS
IN ALMOST EVERY CASE, THE MEASURESTHAT COULD BE TAKEN TO REDUCE HEALTHPROBLEMS ALSO HAVE CLEAR SOCIO-ECONOMICBENEFITS OR OTHER ADVANTAGES
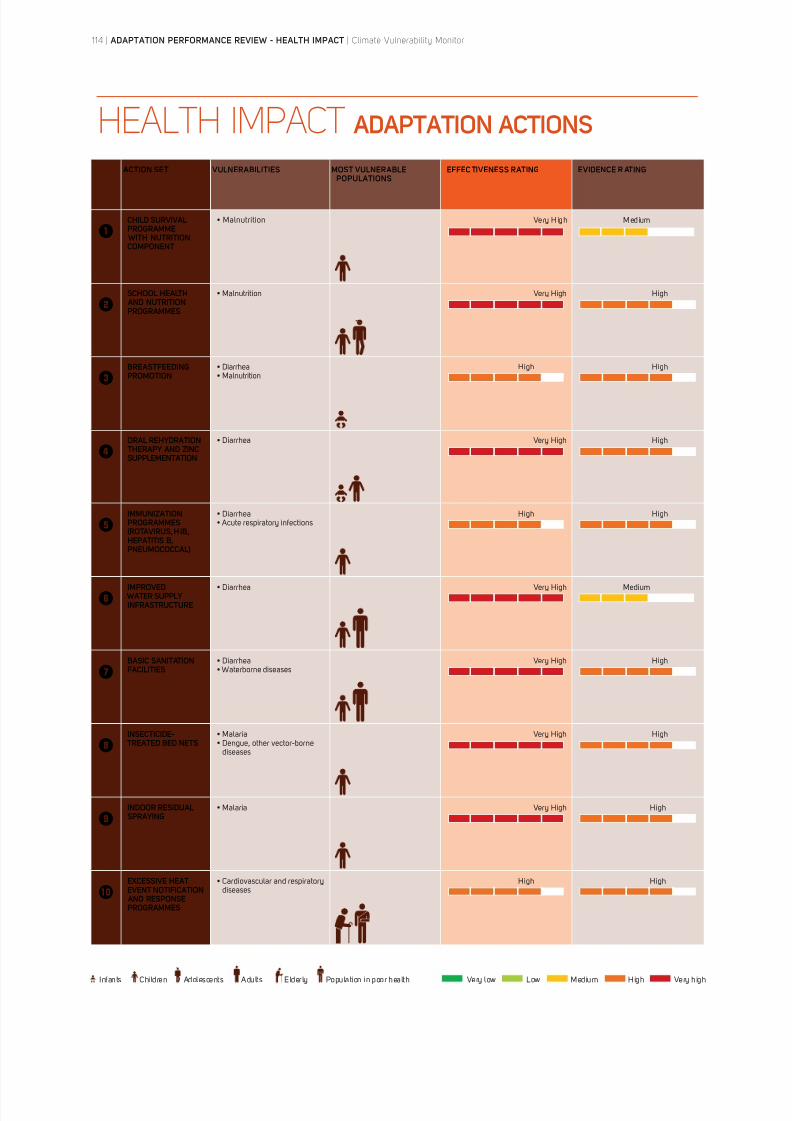
8/8/2019 Climate Vulnerability Monitor 2010: The State of the Climate Crisis
http://slidepdf.com/reader/full/climate-vulnerability-monitor-2010-the-state-of-the-climate-crisis 116/291
HEALTH IMPACT ADAPTATION ACTIONS
ACTION SET VULNERABILITIES MOST VULNERABLE
POPULATIONS
EFFEC TIVENESS RATING EVIDENCE R ATING
CHILD SURVIVALPROGRAMME
WITH NUTRITIONCOMPONENT
Very High Medium
SCHOOL HEALTH
AND NUTRITIONPROGRAMMES
Malnutrition Very High High
BREASTFEEDINGPROMOTION
DiarrheaMalnutrition
High High
ORAL REHYDRATION
THERAPY AND ZINCSUPPLEMENTATION
Diarrhea Very High High
IMMUNIZATIONPROGRAMMES
(ROTAVIRUS, HIB,HEPATITIS B,PNEUMOCOCCAL)
Diarrhea Acute respiratory infections
High High
IMPROVED
WATER SUPPLYINFRASTRUCTURE
Diarrhea Very High Medium
BASIC SANITATIONFACILITIES
Diarrhea Waterborne diseases
Very High High
INSECTICIDE-
TREATED BED NETSMalariaDengue, other vector-borne
diseases
Very High High
INDOOR RESIDUALSPRAYING
Malaria Very High High
EXCESSIVE HEAT
EVENT NOTIFICATION AND RESPONSEPROGRAMMES
Cardiovascular and respiratory
diseases
High High
Infants Children Adolescents Adults Elderly Population in poor health Very low Low Medium High Very high
114 | ADAPTATION PERFORMANCE REVIEW - HEALTH IMPACT | Climate Vulnerability Monitor
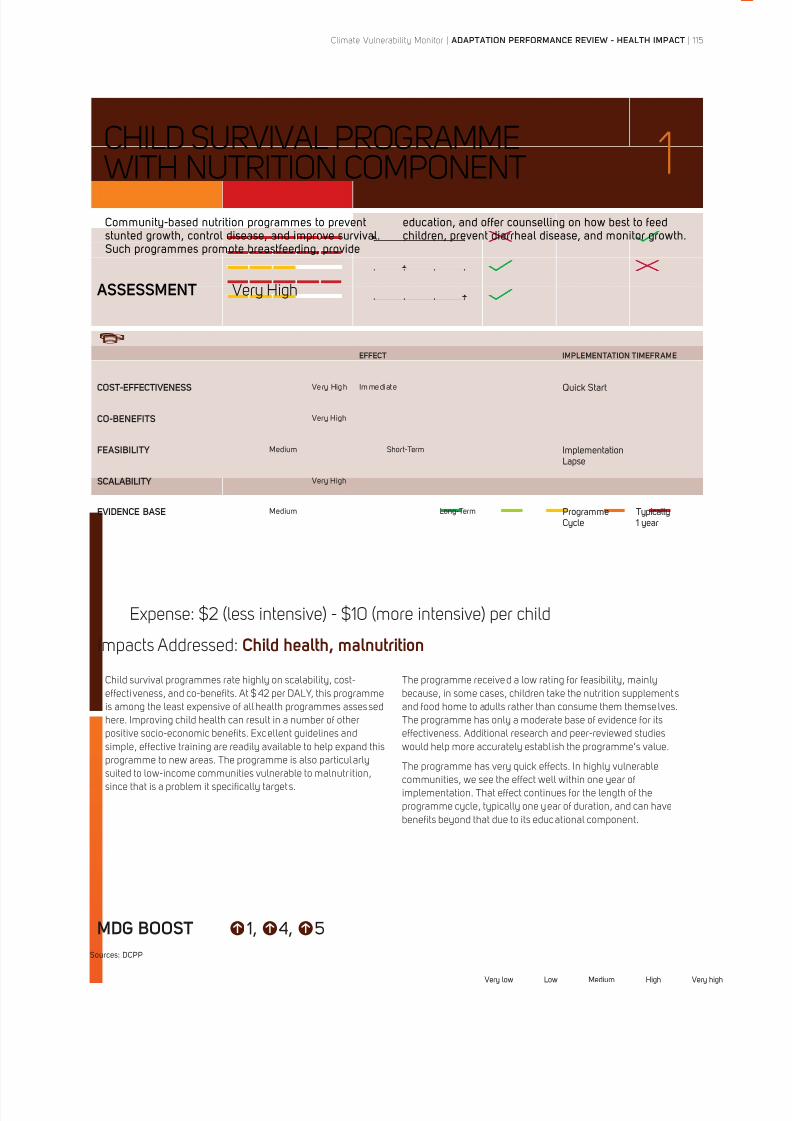
8/8/2019 Climate Vulnerability Monitor 2010: The State of the Climate Crisis
http://slidepdf.com/reader/full/climate-vulnerability-monitor-2010-the-state-of-the-climate-crisis 117/291
CHILD SURVIVAL PROGRAMME
WITH NUTRITION COMPONENT 1
ASSESSMENT Very High
EFFECT IMPLEMENTATION TIMEFRAME
COST-EFFECTIVENESS Very High Immediate Quick Start
CO-BENEFITS Very High
FEASIBILITY Medium Short-Term ImplementationLapse
SCALABILITY Very High
EVIDENCE BASE Medium Long-Term ProgrammeCycle
Typically1 year
Expense: $2 (less intensive) - $10 (more intensive) per child
Impacts Addressed: Child health, malnutrition
MDG BOOST 1, 4, 5
Sources: DCPP
Community-based nutrition programmes to preventstunted growth, control disease, and improve survival.Such programmes promote breastfeeding, provide
education, and offer counselling on how best to feedchildren, prevent diarrheal disease, and monitor growth.
Child survival programmes rate highly on scalability, cost-
effectiveness, and co-benefits. At $42 per DALY, this programme
is among the least expensive of all health programmes asses sed
here. Improving child health can result in a number of other
positive socio-economic benefits. Excellent guidelines and
simple, effective training are readily available to help expand this
programme to new areas. The programme is also particularly
suited to low-income communities vulnerable to malnutr ition,
since that is a problem it specifically targets.
The programme received a low rating for feasibility, mainly
because, in some cases, children take the nutrition supplements
and food home to adults rather than consume them themselves.
The programme has only a moderate base of evidence for its
effectiveness. Additional research and peer-reviewed studies
would help more accurately establ ish the programme’s value.
The programme has very quick effects. In highly vulnerable
communities, we see the effect well within one year of
implementation. That effect continues for the length of the
programme cycle, typically one year of duration, and can have
benefits beyond that due to its educational component.
Very low Low Medium High Very high
Climate Vulnerability Monitor | ADAPTATION PERFORMANCE REVIEW - HEALTH IMPACT | 115
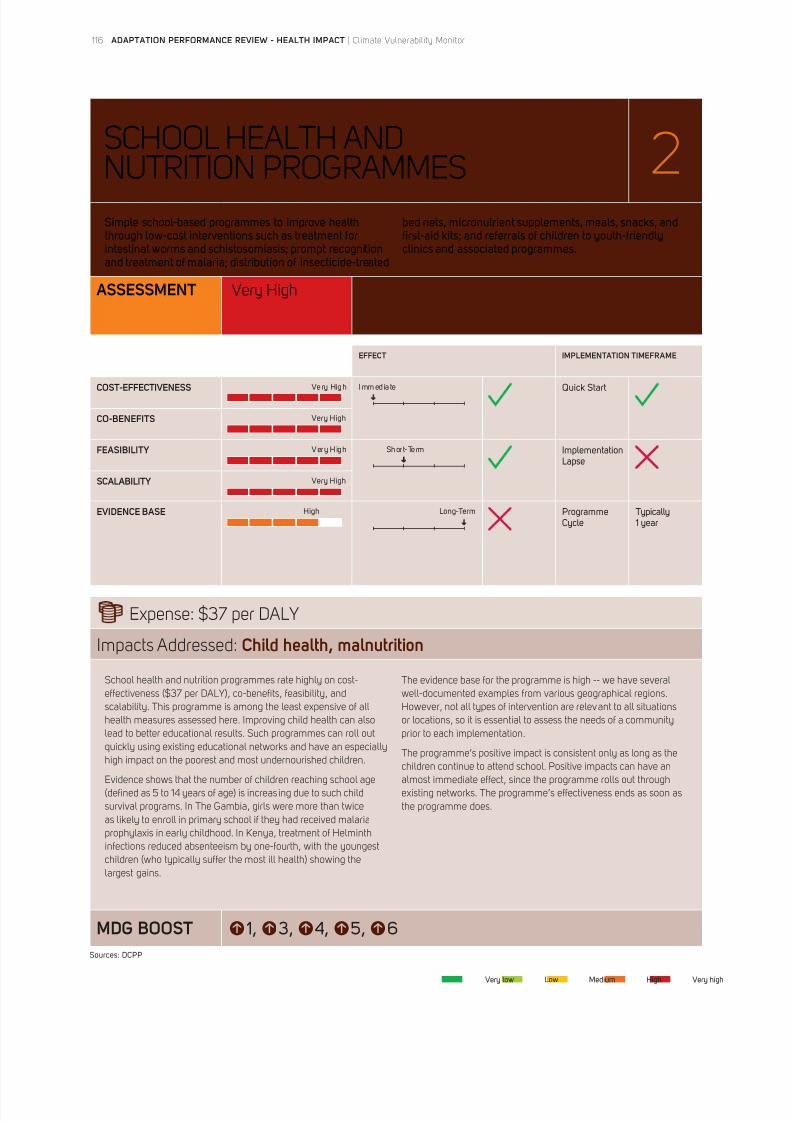
8/8/2019 Climate Vulnerability Monitor 2010: The State of the Climate Crisis
http://slidepdf.com/reader/full/climate-vulnerability-monitor-2010-the-state-of-the-climate-crisis 118/291
SCHOOL HEALTH AND
NUTRITION PROGRAMMES 2
ASSESSMENT Very High
EFFECT IMPLEMENTATION TIMEFRAME
COST-EFFECTIVENESS Very High Immedia te Quick Start
CO-BENEFITS Very High
FEASIBILITY Very High Short-Term ImplementationLapse
SCALABILITY Very High
EVIDENCE BASE High Long-Term ProgrammeCycle
Typically1 year
Expense: $37 per DALY
Impacts Addressed: Child health, malnutrition
MDG BOOST 1, 3, 4, 5, 6
Sources: DCPP
Simple school-based programmes to improve healththrough low-cost interventions such as treatment forintestinal worms and schistosomiasis; prompt recognitionand treatment of malaria; distribution of insecticide-treated
bed nets, micronutrient supplements, meals, snacks, andfirst-aid kits; and referrals of children to youth-friendlyclinics and associated programmes.
School health and nutrition programmes rate highly on cost-
effectiveness ($37 per DALY), co-benefits, feasibility, and
scalability. This programme is among the least expensive of all
health measures assessed here. Improving child health can also
lead to better educational results. Such programmes can roll out
quickly using existing educational networks and have an especially
high impact on the poorest and most undernourished children.
Evidence shows that the number of children reaching school age
(defined as 5 to 14 years of age) is increasing due to such child
survival programs. In The Gambia, girls were more than twice
as likely to enroll in primary school if they had received malaria
prophylaxis in early childhood. In Kenya, treatment of Helminth
infections reduced absenteeism by one-fourth, with the youngest
children (who typically suffer the most ill health) showing the
largest gains.
The evidence base for the programme is high -- we have several
well-documented examples from various geographical regions.
However, not all types of intervention are relevant to all situations
or locations, so it is essential to assess the needs of a community
prior to each implementation.
The programme’s positive impact is consistent only as long as the
children continue to attend school. Positive impacts can have an
almost immediate effect, since the programme rolls out through
existing networks. The programme’s effectiveness ends as soon as
the programme does.
Very low Low Medium High Very high
116 | ADAPTATION PERFORMANCE REVIEW - HEALTH IMPACT | Climate Vulnerability Monitor
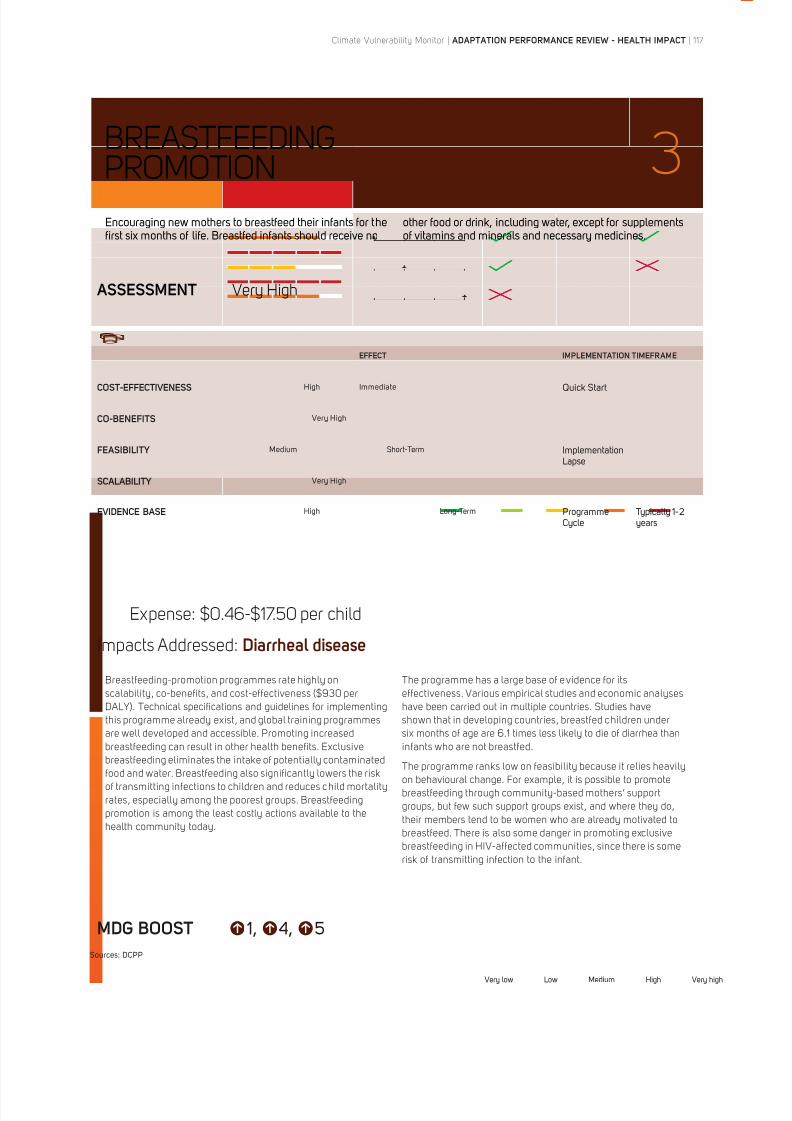
8/8/2019 Climate Vulnerability Monitor 2010: The State of the Climate Crisis
http://slidepdf.com/reader/full/climate-vulnerability-monitor-2010-the-state-of-the-climate-crisis 119/291
BREASTFEEDING
PROMOTION 3
ASSESSMENT Very High
EFFECT IMPLEMENTATION TIMEFRAME
COST-EFFECTIVENESS High Immediate Quick Start
CO-BENEFITS Very High
FEASIBILITY Medium Short-Term ImplementationLapse
SCALABILITY Very High
EVIDENCE BASE High Long-Term ProgrammeCycle
Typically 1-2years
Expense: $0.46-$17.50 per child
Impacts Addressed: Diarrheal disease
MDG BOOST 1, 4, 5
Sources: DCPP
Encouraging new mothers to breastfeed their infants for thefirst six months of life. Breastfed infants should receive no
other food or drink, including water, except for supplementsof vitamins and minerals and necessary medicines.
Breastfeeding-promotion programmes rate highly on
scalability, co-benefits, and cost-effectiveness ($930 per
DALY). Technical specifications and guidelines for implementing
this programme already exist, and global training programmes
are well developed and accessible. Promoting increased
breastfeeding can result in other health benefits. Exclusive
breastfeeding eliminates the intake of potentially contaminated
food and water. Breastfeeding also significantly lowers the risk
of transmitting infections to children and reduces child mortality
rates, especially among the poorest groups. Breastfeeding
promotion is among the least costly actions available to the
health community today.
The programme has a large base of evidence for its
effectiveness. Various empirical studies and economic analyses
have been carried out in multiple countries. Studies have
shown that in developing countries, breastfed children under
six months of age are 6.1 times less likely to die of diarrhea than
infants who are not breastfed.
The programme ranks low on feasibility because it relies heavily
on behavioural change. For example, it is possible to promote
breastfeeding through community-based mothers’ support
groups, but few such support groups exist, and where they do,
their members tend to be women who are already motivated to
breastfeed. There is also some danger in promoting exclusive
breastfeeding in HIV-affected communities, since there is some
risk of transmitting infection to the infant.
Very low Low Medium High Very high
Climate Vulnerability Monitor | ADAPTATION PERFORMANCE REVIEW - HEALTH IMPACT | 117
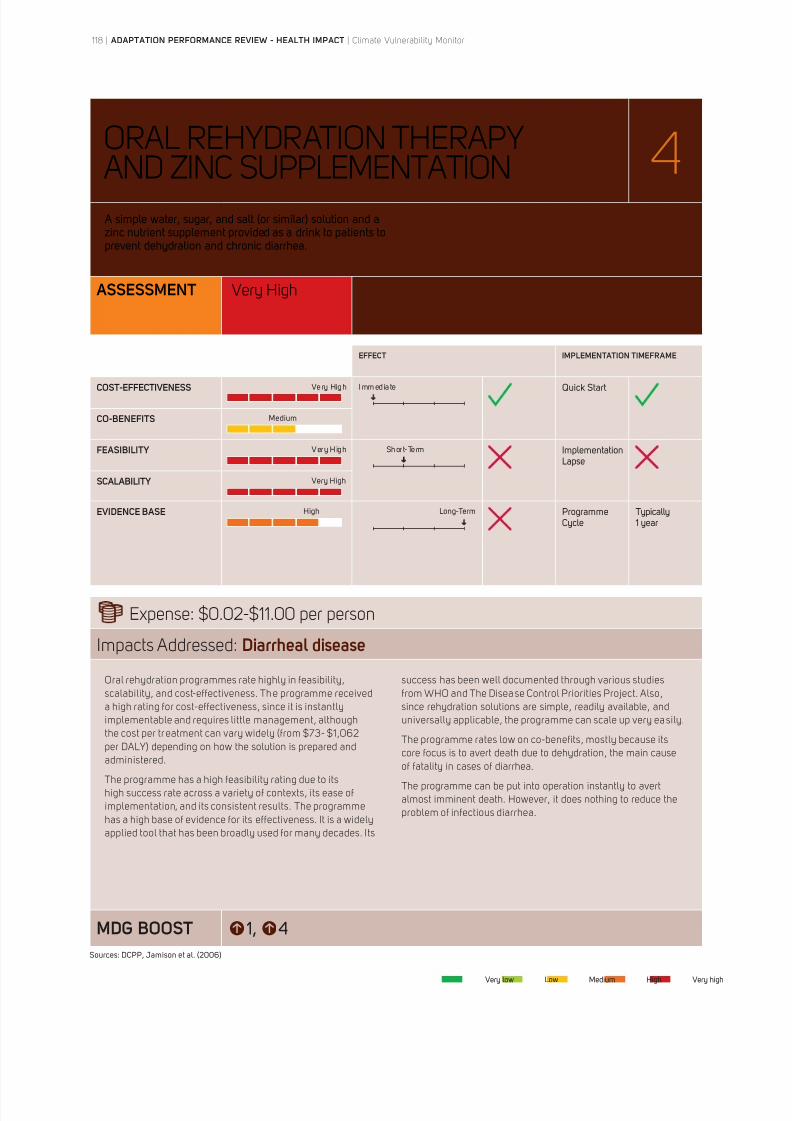
8/8/2019 Climate Vulnerability Monitor 2010: The State of the Climate Crisis
http://slidepdf.com/reader/full/climate-vulnerability-monitor-2010-the-state-of-the-climate-crisis 120/291
ORAL REHYDRATION THERAPY
AND ZINC SUPPLEMENTATION 4
ASSESSMENT Very High
EFFECT IMPLEMENTATION TIMEFRAME
COST-EFFECTIVENESS Very High Immedia te Quick Start
CO-BENEFITS Medium
FEASIBILITY Very High Short-Term ImplementationLapse
SCALABILITY Very High
EVIDENCE BASE High Long-Term ProgrammeCycle
Typically1 year
Expense: $0.02-$11.00 per person
Impacts Addressed: Diarrheal disease
MDG BOOST 1, 4
Sources: DCPP, Jamison et al. (2006)
A simple water, sugar, and salt (or similar) solution and azinc nutrient supplement provided as a drink to patients toprevent dehydration and chronic diarrhea.
Oral rehydration programmes rate highly in feasibility,
scalability, and cost-effectiveness. The programme received
a high rating for cost-effectiveness, since it is instantly
implementable and requires little management, although
the cost per tr eatment can vary widely (from $73- $1,062
per DALY) depending on how the solution is prepared and
administered.
The programme has a high feasibility rating due to its
high success rate across a variety of contexts, its ease of
implementation, and its consistent results. The programme
has a high base of evidence for its effectiveness. It is a widely
applied tool that has been broadly used for many decades. Its
success has been well documented through various studies
from WHO and The Disea se Control Priorities Project. Also,
since rehydration solutions are simple, readily available, and
universally applicable, the programme can scale up very ea sily.
The programme rates low on co-benefits, mostly because its
core focus is to avert death due to dehydration, the main cause
of fatality in cases of diarrhea.
The programme can be put into operation instantly to avert
almost imminent death. However, it does nothing to reduce the
problem of infectious diarrhea.
Very low Low Medium High Very high
118 | ADAPTATION PERFORMANCE REVIEW - HEALTH IMPACT | Climate Vulnerability Monitor
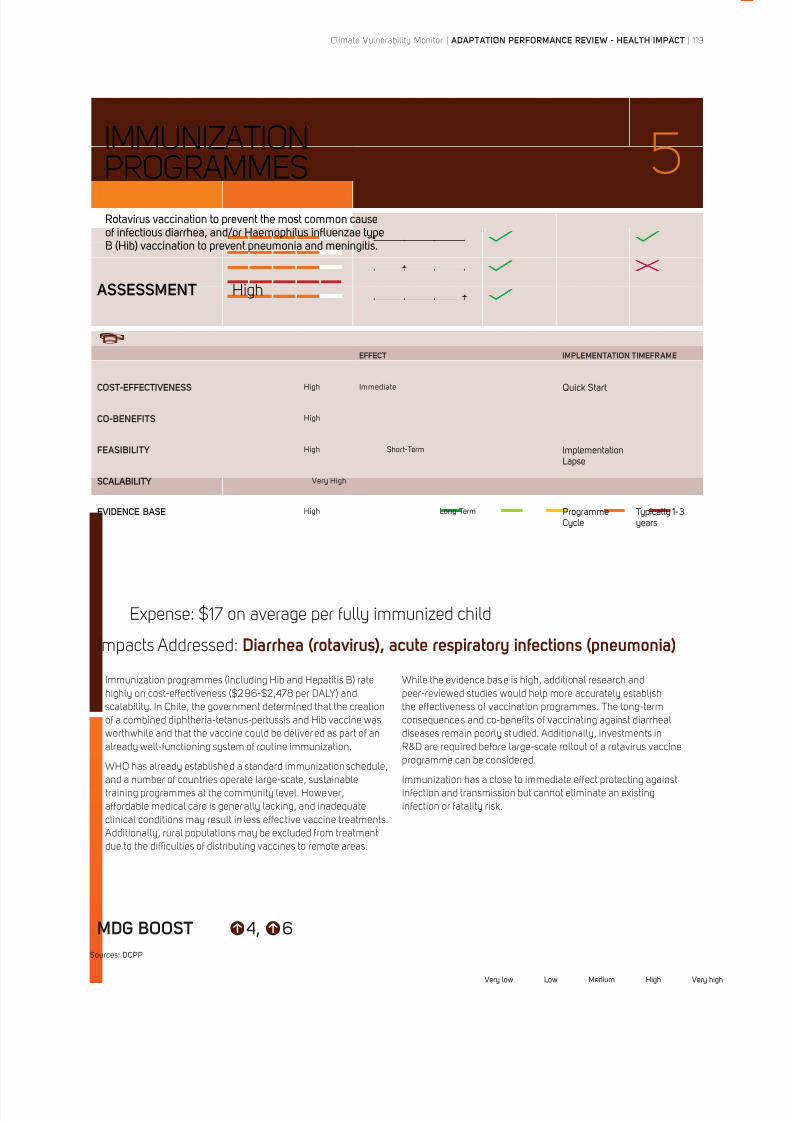
8/8/2019 Climate Vulnerability Monitor 2010: The State of the Climate Crisis
http://slidepdf.com/reader/full/climate-vulnerability-monitor-2010-the-state-of-the-climate-crisis 121/291
IMMUNIZATION
PROGRAMMES 5
ASSESSMENT High
EFFECT IMPLEMENTATION TIMEFRAME
COST-EFFECTIVENESS High Immediate Quick Start
CO-BENEFITS High
FEASIBILITY High Short-Term ImplementationLapse
SCALABILITY Very High
EVIDENCE BASE High Long-Term ProgrammeCycle
Typically 1-3years
Expense: $17 on average per fully immunized child
Impacts Addressed: Diarrhea (rotavirus), acute respiratory infections (pneumonia)
MDG BOOST 4, 6
Sources: DCPP
Rotavirus vaccination to prevent the most common causeof infectious diarrhea, and/or Haemophilus influenzae typeB (Hib) vaccination to prevent pneumonia and meningitis.
Immunization programmes (including Hib and Hepatitis B) rate
highly on cost-effectiveness ($296-$2,478 per DALY) and
scalability. In Chile, the government determined that the creation
of a combined diphtheria-tetanus-pertussis and Hib vaccine was
worthwhile and that the vaccine could be delivered as part of an
already well-functioning system of routine immunization.
WHO has already established a standard immunization schedule,
and a number of countries operate large-scale, sustainable
training programmes at the community level. However,
affordable medical care is generally lacking, and inadequate
clinical conditions may result in less effective vaccine treatments.
Additionally, rural populations may be excluded from treatment
due to the difficulties of distributing vaccines to remote areas.
While the evidence base is high, additional research and
peer-reviewed studies would help more accurately establish
the effectiveness of vaccination programmes. The long-term
consequences and co-benefits of vaccinating against diarrheal
diseases remain poorly studied. Additionally, investments in
R&D are required before large-scale rollout of a rotavirus vaccine
programme can be considered.
Immunization has a close to immediate effect protecting against
infection and transmission but cannot eliminate an existing
infection or fatality risk.
Very low Low Medium High Very high
Climate Vulnerability Monitor | ADAPTATION PERFORMANCE REVIEW - HEALTH IMPACT | 119

8/8/2019 Climate Vulnerability Monitor 2010: The State of the Climate Crisis
http://slidepdf.com/reader/full/climate-vulnerability-monitor-2010-the-state-of-the-climate-crisis 122/291
IMPROVED WATER SUPPLY
INFRASTRUCTURE 6
ASSESSMENT High
EFFECT IMPLEMENTATION TIMEFRAME
COST-EFFECTIVENESS Very High Immedia te Quick Start
CO-BENEFITS Very High
FEASIBILITY Medium Short-Term ImplementationLapse
SCALABILITY High
EVIDENCE BASE Medium Long-Term ProgrammeCycle
Typically 1-3years
Expense: $17 (borehole) - $144 (house connection) per person
Impacts Addressed: Drinking water, diarrheal disease
MDG BOOST 2, 3, 4, 6
Sources: DCPP, Jamison et al. (2006)
Installation of hand water pump, standpost, or houseconnection in areas where clean water supply is limitedand no plumbing infrastructure exists.
Improved water supply infrastructure programmes rate particularly
highly on co-benefits and cost-effectiveness ($159 per DALY).
Dozens of viruses, bacteria, protozoa, and helminths cause
diarrheal and other diseases. They are generally picked up through
fecal-oral transmission, often by drinking contaminated water or
eating unwashed foods in areas lacking a clean water supply.
The programme’s costs are consistently low, although they may
differ in urban and rural environments. The programme improves
living conditions and prevents a wide range of contaminants from
entering the body. It also has various indirect effects, including
time saving (an Indian national survey for UNICEF found that
women spent an average of 2.2 hours per day collecting water)
and nutritional benefits (if poor households spend less money on
water, they will have more funds for food).
The programme rates lowest on feasibility, since it demands
ongoing investment and cannot succeed in areas where water
is in very short supply. However, the programme has shown
that, once implemented, it delivers consistent results. Technical
specifications and guidelines are extensively available and fully
tested, and many good case examples exis t of the programme’s
success in low-income communities.
Installation is quick, and its effect on halting the spread of
disease and bacteria due to unclean water and food is virtually
immediate. If the infrastructure is maintained, the programme
yields long-term benefits.
Very low Low Medium High Very high
120 | ADAPTATION PERFORMANCE REVIEW - HEALTH IMPACT | Climate Vulnerability Monitor
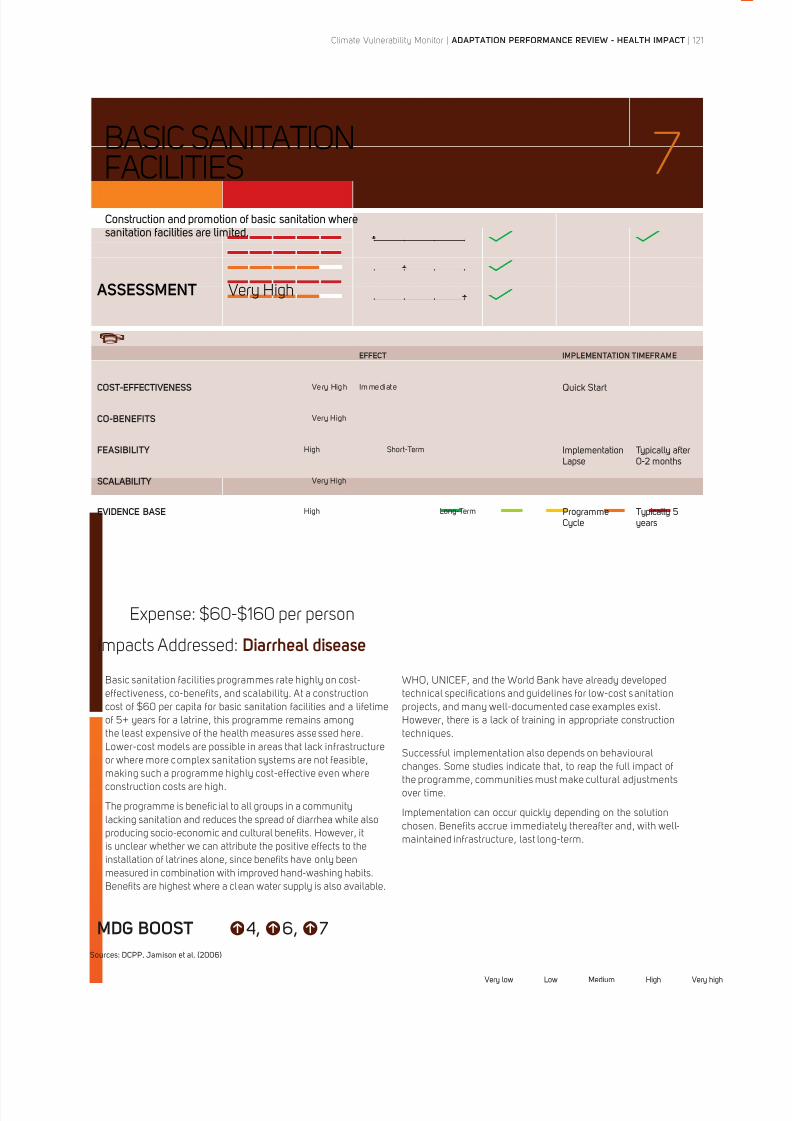
8/8/2019 Climate Vulnerability Monitor 2010: The State of the Climate Crisis
http://slidepdf.com/reader/full/climate-vulnerability-monitor-2010-the-state-of-the-climate-crisis 123/291
BASIC SANITATION
FACILITIES 7
ASSESSMENT Very High
EFFECT IMPLEMENTATION TIMEFRAME
COST-EFFECTIVENESS Very High Immediate Quick Start
CO-BENEFITS Very High
FEASIBILITY High Short-Term ImplementationLapse
Typically after0-2 months
SCALABILITY Very High
EVIDENCE BASE High Long-Term ProgrammeCycle
Typically 5years
Expense: $60-$160 per person
Impacts Addressed: Diarrheal disease
MDG BOOST 4, 6, 7
Sources: DCPP, Jamison et al. (2006)
Construction and promotion of basic sanitation wheresanitation facilities are limited.
Basic sanitation facilities programmes rate highly on cost-
effectiveness, co-benefits, and scalability. At a construction
cost of $60 per capita for basic sanitation facilities and a lifetime
of 5+ years for a latrine, this programme remains among
the least expensive of the health measures assessed here.
Lower-cost models are possible in areas that lack infrastructure
or where more complex sanitation systems are not feasible,
making such a programme highly cost-effective even where
construction costs are high.
The programme is beneficial to all groups in a community
lacking sanitation and reduces the spread of diarrhea while also
producing socio-economic and cultural benefits. However, it
is unclear whether we can attribute the positive effects to the
installation of latrines alone, since benefits have only been
measured in combination with improved hand-washing habits.
Benefits are highest where a clean water supply is also available.
WHO, UNICEF, and the World Bank have already developed
technical specifications and guidelines for low-cost s anitation
projects, and many well-documented case examples exist.
However, there is a lack of training in appropriate construction
techniques.
Successful implementation also depends on behavioural
changes. Some studies indicate that, to reap the full impact of
the programme, communities must make cultural adjustments
over time.
Implementation can occur quickly depending on the solution
chosen. Benefits accrue immediately thereafter and, with well-
maintained infrastructure, last long-term.
Very low Low Medium High Very high
Climate Vulnerability Monitor | ADAPTATION PERFORMANCE REVIEW - HEALTH IMPACT | 121

8/8/2019 Climate Vulnerability Monitor 2010: The State of the Climate Crisis
http://slidepdf.com/reader/full/climate-vulnerability-monitor-2010-the-state-of-the-climate-crisis 124/291
INSECTICIDE-TREATED
BED NETS 8
ASSESSMENT Very High
EFFECT IMPLEMENTATION TIMEFRAME
COST-EFFECTIVENESS Very High Immedia te Quick Start
CO-BENEFITS Very High
FEASIBILITY High Short-Term ImplementationLapse
SCALABILITY High
EVIDENCE BASE High Long-Term ProgrammeCycle
Typically 5years
Expense: $5 per bed net
Impacts Addressed: Malaria
MDG BOOST 4, 5, 6
Sources: DCPP, Jamison et al. (2006), WHO (2006)
Treatment of purchased or subsidized bed nets withinsecticides.
Bed nets rate very highly on cost-effectiveness ($5-17 per DALY)
and co-benefits. Use of insecticide-treated bed nets provides
personal protection by killing or repelling mosquitoes and is a very
effective strategy for controlling malaria. This action is among the
least expensive of all known health measures. Bed nets are easy
to distribute through subsidies or other programmes, and costs are
consistent in Sub-Saharan Africa (the area where malaria is most
prevalent). The programme is applicable and relevant to all groups
in a community.
Recent cross-country comparisons of economic growth indicate
that eliminating malaria can have a strong positive impact on
economic development. Currently, bed nets must be treated
semi-annually; however, new technology should eliminate this
requirement. When bed net users receive basic training in how
to use the net, the programme’s success rate is high. Protection
is only during sleeping hours, but that is a high-risk period, which
is why over 20 studies in Africa and Asia have demonstrated a
protective success rate of over 50 percent for individual net users.
Training programmes should be culturally sensitive and adapted to
local customs. More operational experience is necessary before it
is possible to inform national initiatives on how to scale up use. Bed
nets function immediately, can be distributed extremely quickly,
and the latest models have a lasting effect for many years if well
maintained (in particular through the repair of holes).
Very low Low Medium High Very high
122 | ADAPTATION PERFORMANCE REVIEW - HEALTH IMPACT | Climate Vulnerability Monitor
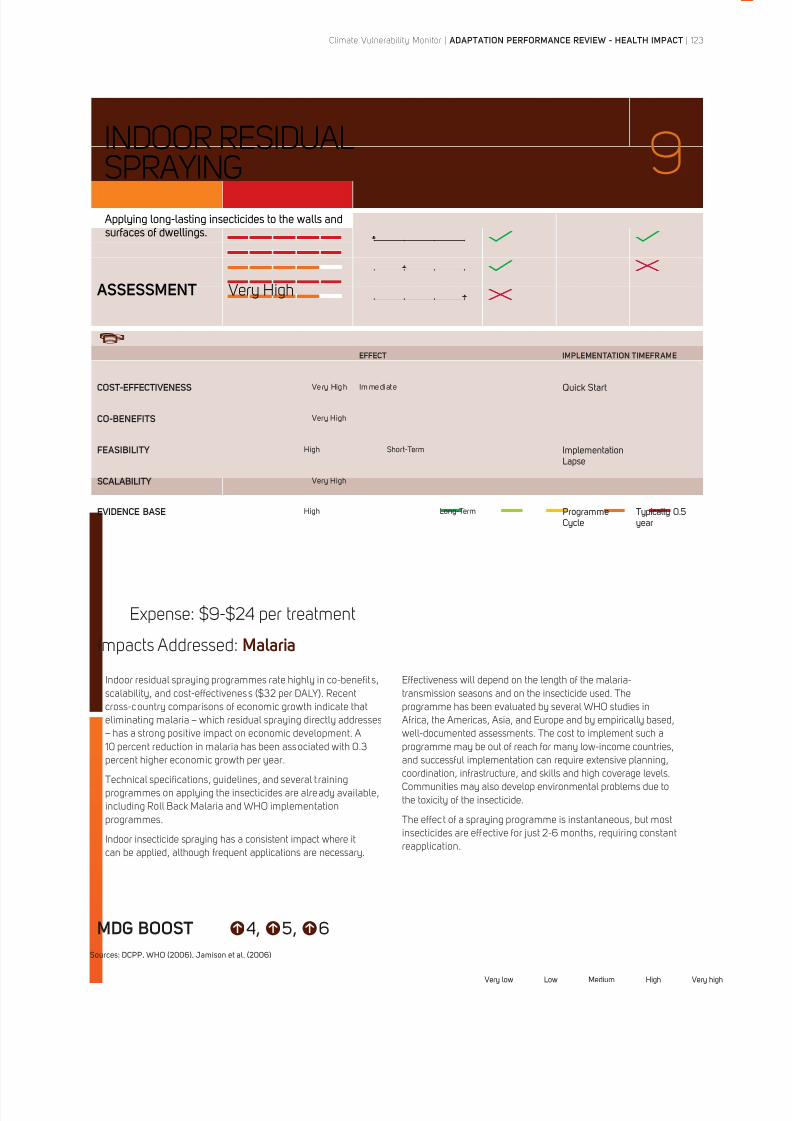
8/8/2019 Climate Vulnerability Monitor 2010: The State of the Climate Crisis
http://slidepdf.com/reader/full/climate-vulnerability-monitor-2010-the-state-of-the-climate-crisis 125/291
INDOOR RESIDUAL
SPRAYING 9
ASSESSMENT Very High
EFFECT IMPLEMENTATION TIMEFRAME
COST-EFFECTIVENESS Very High Immediate Quick Start
CO-BENEFITS Very High
FEASIBILITY High Short-Term ImplementationLapse
SCALABILITY Very High
EVIDENCE BASE High Long-Term ProgrammeCycle
Typically 0.5year
Expense: $9-$24 per treatment
Impacts Addressed: Malaria
MDG BOOST 4, 5, 6
Sources: DCPP, WHO (2006), Jamison et al. (2006)
Applying long-lasting insecticides to the walls andsurfaces of dwellings.
Indoor residual spraying programmes rate highly in co-benefits,
scalability, and cost-effectivenes s ($32 per DALY). Recent
cross-country comparisons of economic growth indicate that
eliminating malaria – which residual spraying directly addresses
– has a strong positive impact on economic development. A
10 percent reduction in malaria has been associated with 0.3
percent higher economic growth per year.
Technical specifications, guidelines, and several t raining
programmes on applying the insecticides are already available,
including Roll Back Malaria and WHO implementation
programmes.
Indoor insecticide spraying has a consistent impact where it
can be applied, although frequent applications are necessary.
Effectiveness will depend on the length of the malaria-
transmission seasons and on the insecticide used. The
programme has been evaluated by several WHO studies in
Africa, the Americas, Asia, and Europe and by empirically based,
well-documented assessments. The cost to implement such a
programme may be out of reach for many low-income countries,
and successful implementation can require extensive planning,
coordination, infrastructure, and skills and high coverage levels.
Communities may also develop environmental problems due to
the toxicity of the insecticide.
The effect of a spraying programme is instantaneous, but most
insecticides are effective for just 2-6 months, requiring constant
reapplication.
Very low Low Medium High Very high
Climate Vulnerability Monitor | ADAPTATION PERFORMANCE REVIEW - HEALTH IMPACT | 123

8/8/2019 Climate Vulnerability Monitor 2010: The State of the Climate Crisis
http://slidepdf.com/reader/full/climate-vulnerability-monitor-2010-the-state-of-the-climate-crisis 126/291
EXCESSIVE HEAT EVENT
NOTIFICATION AND RESPONSE 10
ASSESSMENT High
EFFECT IMPLEMENTATION TIMEFRAME
COST-EFFECTIVENESS High Immediate Quick Start
CO-BENEFITS High
FEASIBILITY High Short-Term ImplementationLapse
Typically after6 months
SCALABILITY High
EVIDENCE BASE High Long-Term ProgrammeCycle
Typically 2-5years
Expense: $200,000
Impacts Addressed: Cardiovascular and respiratory diseases
MDG BOOST 4, 5
Sources: Kovats & Ebi (2006), U.S. Environmental Protection Agency (2006), Ebi et al. (2004)
Programmes combining meteorological forecasts andother data to trigger public health interventions to reduceheat-wave illnesses and deaths.
Excessive heat event notification and response programmes rate
highest on co-benefits. The programme can be cost-effective
and easily implemented where advanced public health and
meteorological systems are in place, which is the case for many
of the worst affected areas, such as Europe and North America.
The programme demands reliable meteorological data and
established communication channels that may not always
be available or adequate in low-income settings, particularly
in remote communities. It is also difficult to guarantee that
communications will reach the appropriate groups/persons.
While clear technical specifications and guidelines exist, the
programme has lower relevance for low-income countries, since
heat waves cause most damage in regions where extremely
hot weather is relatively infrequent. Local coping methods are
already common in areas that regularly experience high heat,
such as many low-income countries in Africa and Asia.
Several peer-reviewed studies exist on the subject . However,
there is no standard way to estimate the impact in different
countries. It can take weeks to more than a year to implement
such a system. Once established, such programmes are easily
maintained into the long-term, provided supportive public and
other services are also functioning.
Very low Low Medium High Very high
124 | ADAPTATION PERFORMANCE REVIEW - HEALTH IMPACT | Climate Vulnerability Monitor
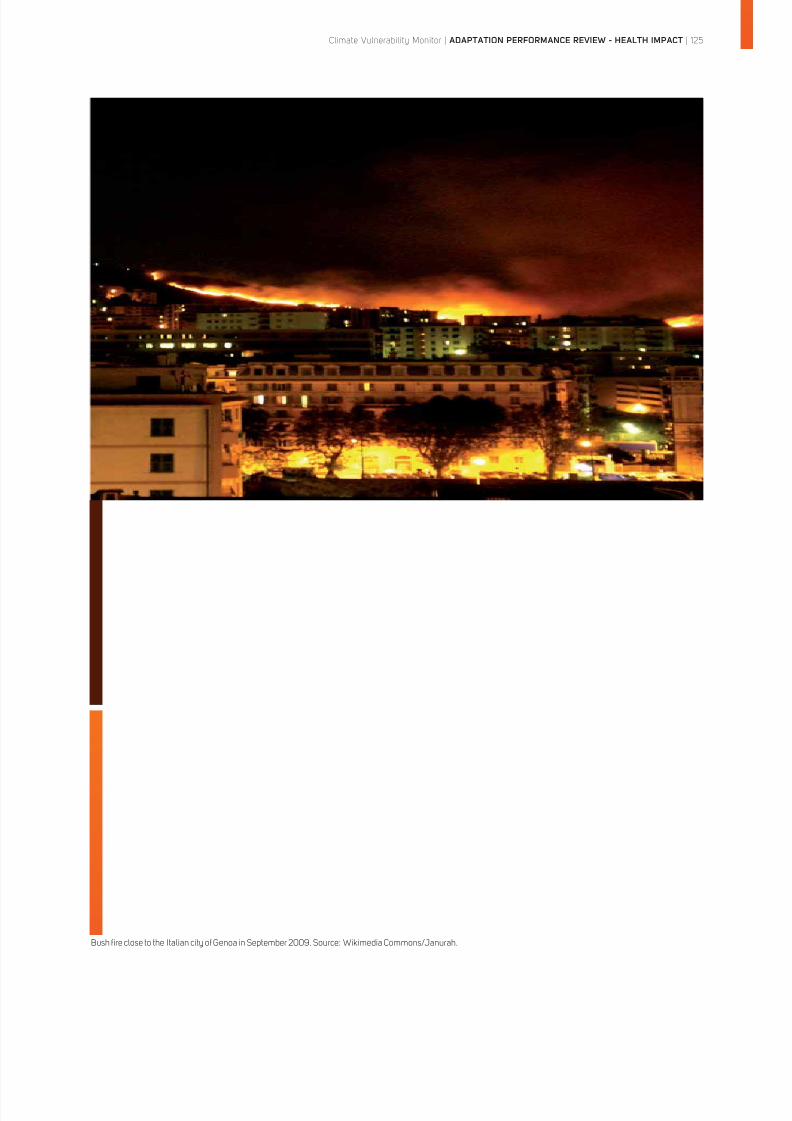
8/8/2019 Climate Vulnerability Monitor 2010: The State of the Climate Crisis
http://slidepdf.com/reader/full/climate-vulnerability-monitor-2010-the-state-of-the-climate-crisis 127/291
Bush fire close to the Italian city of Genoa in September 2009. Source: Wikimedia Commons/Janurah.
Climate Vulnerability Monitor | ADAPTATION PERFORMANCE REVIEW - HEALTH IMPACT | 125
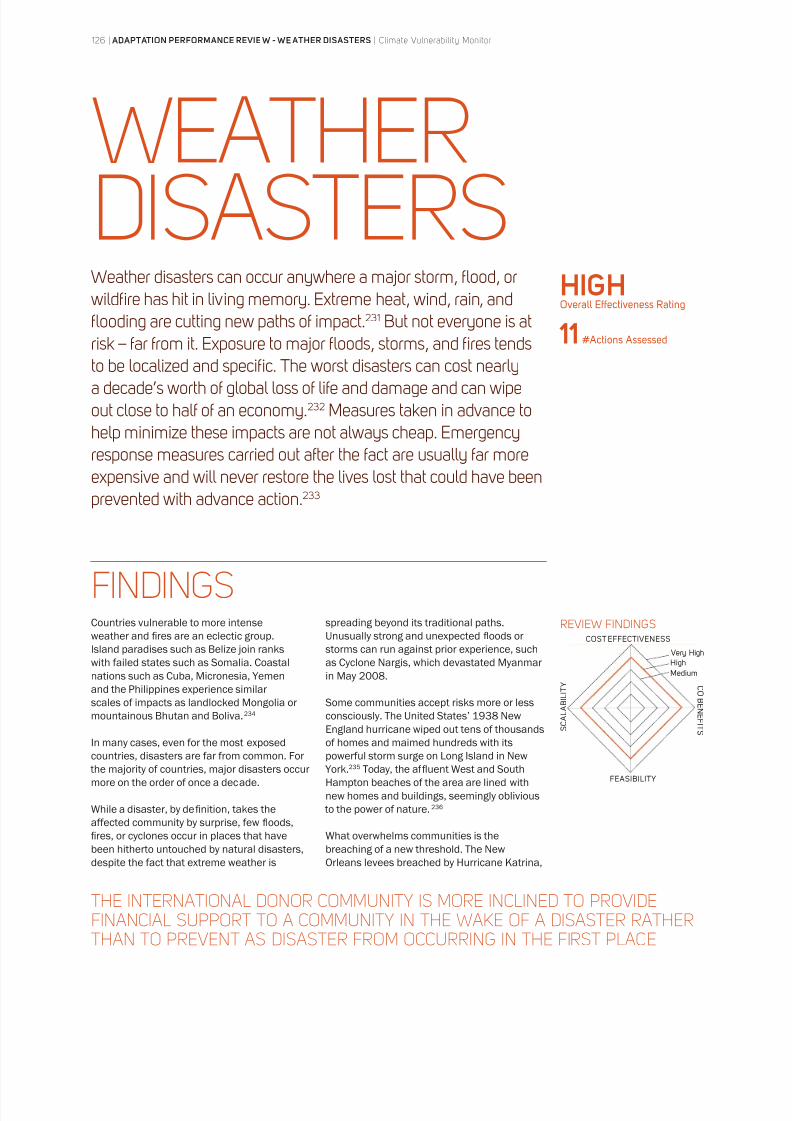
8/8/2019 Climate Vulnerability Monitor 2010: The State of the Climate Crisis
http://slidepdf.com/reader/full/climate-vulnerability-monitor-2010-the-state-of-the-climate-crisis 128/291
126 | ADAPTATION PERFORMANCE REVIE W - WE ATHER DISASTERS | Climate Vulnerability Monitor
WEATHERDISASTERSWeather disasters can occur anywhere a major storm, flood, orwildfire has hit in living memory. Extreme heat, wind, rain, andflooding are cutting new paths of impact.231 But not everyone is atrisk – far from it. Exposure to major floods, storms, and fires tendsto be localized and specific. The worst disasters can cost nearlya decade’s worth of global loss of life and damage and can wipeout close to half of an economy.232 Measures taken in advance tohelp minimize these impacts are not always cheap. Emergencyresponse measures carried out after the fact are usually far moreexpensive and will never restore the lives lost that could have beenprevented with advance action.233
Countries vulnerable to more intense
weather and fires are an eclectic group.
Island paradises such as Belize join ranks
with failed states such as Somalia. Coastal
nations such as Cuba, Micronesia, Yemen
and the Philippines experience similar
scales of impacts as landlocked Mongolia or
mountainous Bhutan and Boliva.234
In many cases, even for the most exposed
countries, disasters are far from common. For
the majority of countries, major disasters occur
more on the order of once a decade.
While a disaster, by definition, takes the
affected community by surprise, few floods,
fires, or cyclones occur in places that have
been hitherto untouched by natural disasters,
despite the fact that extreme weather is
spreading beyond its traditional paths.
Unusually strong and unexpected floods or
storms can run against prior experience, such
as Cyclone Nargis, which devastated Myanmar
in May 2008.
Some communities accept risks more or less
consciously. The United States’ 1938 NewEngland hurricane wiped out tens of thousands
of homes and maimed hundreds with its
powerful storm surge on Long Island in New
York.235 Today, the af fluent West and South
Hampton beaches of the area are lined with
new homes and buildings, seemingly oblivious
to the power of nature.236
What overwhelms communities is the
breaching of a new threshold. The New
Orleans levees breached by Hurricane Katrina,
FINDINGSREVIEW FINDINGS
COST EFFECTIVENESS
S C A L A B I L I T Y C
O B E
N E F I T S
FEASIBILITY
Very HighHigh
Medium
HIGH Overall Effectiveness Rating
11 #Actions Assessed
THE INTERNATIONAL DONOR COMMUNITY IS MORE INCLINED TO PROVIDEFINANCIAL SUPPORT TO A COMMUNITY IN THE WAKE OF A DISASTER RATHERTHAN TO PREVENT AS DISASTER FROM OCCURRING IN THE FIRST PLACE
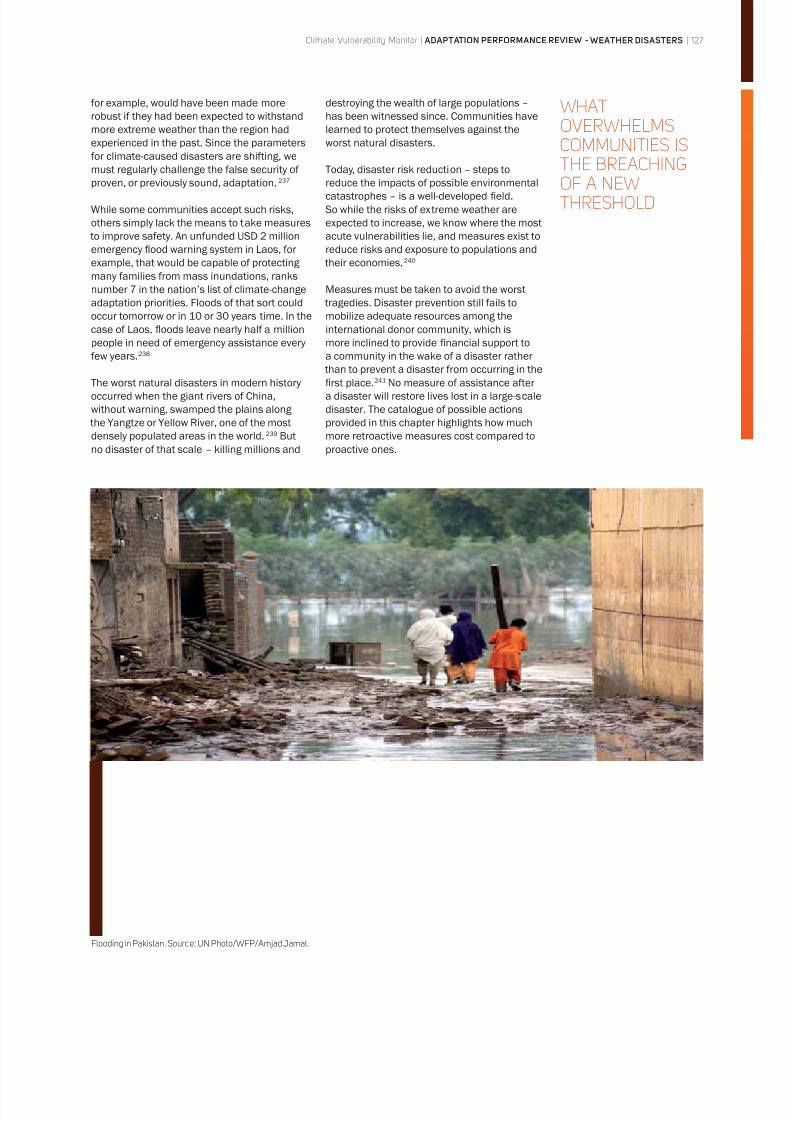
8/8/2019 Climate Vulnerability Monitor 2010: The State of the Climate Crisis
http://slidepdf.com/reader/full/climate-vulnerability-monitor-2010-the-state-of-the-climate-crisis 129/291
Climate Vulnerability Monitor | ADAPTATION PERFORMANCE REVIEW - WEATHER DISASTERS | 127
for example, would have been made more
robust if they had been expected to withstand
more extreme weather than the region had
experienced in the past. Since the parameters
for climate-caused disasters are shifting, we
must regularly challenge the false security of
proven, or previously sound, adaptation.237
While some communities accept such risks,
others simply lack the means to take measures
to improve safety. An unfunded USD 2 million
emergency flood warning system in Laos, for
example, that would be capable of protecting
many families from mass inundations, ranks
number 7 in the nation’s list of climate-change
adaptation priorities. Floods of that sort could
occur tomorrow or in 10 or 30 years time. In the
case of Laos, floods leave nearly half a million
people in need of emergency assistance every
few years.238
The worst natural disasters in modern history
occurred when the giant rivers of China,
without warning, swamped the plains along
the Yangtze or Yellow River, one of the most
densely populated areas in the world.239 But
no disaster of that scale – killing millions and
destroying the wealth of large populations –
has been witnessed since. Communities have
learned to protect themselves against the
worst natural disasters.
Today, disaster risk reduction – steps to
reduce the impacts of possible environmental
catastrophes – is a well-developed field.
So while the risks of extreme weather are
expected to increase, we know where the most
acute vulnerabilities lie, and measures exist to
reduce risks and exposure to populations and
their economies.240
Measures must be taken to avoid the worst
tragedies. Disaster prevention still fails to
mobilize adequate resources among the
international donor community, which is
more inclined to provide financial support to
a community in the wake of a disaster rather than to prevent a disaster from occurring in the
first place.241 No measure of assistance after
a disaster will restore lives lost in a large-scale
disaster. The catalogue of possible actions
provided in this chapter highlights how much
more retroactive measures cost compared to
proactive ones.
WHATOVERWHELMSCOMMUNITIES ISTHE BREACHING
OF A NEWTHRESHOLD
Flooding in Pakistan. Source: UN Photo/WFP/Amjad Jamal.
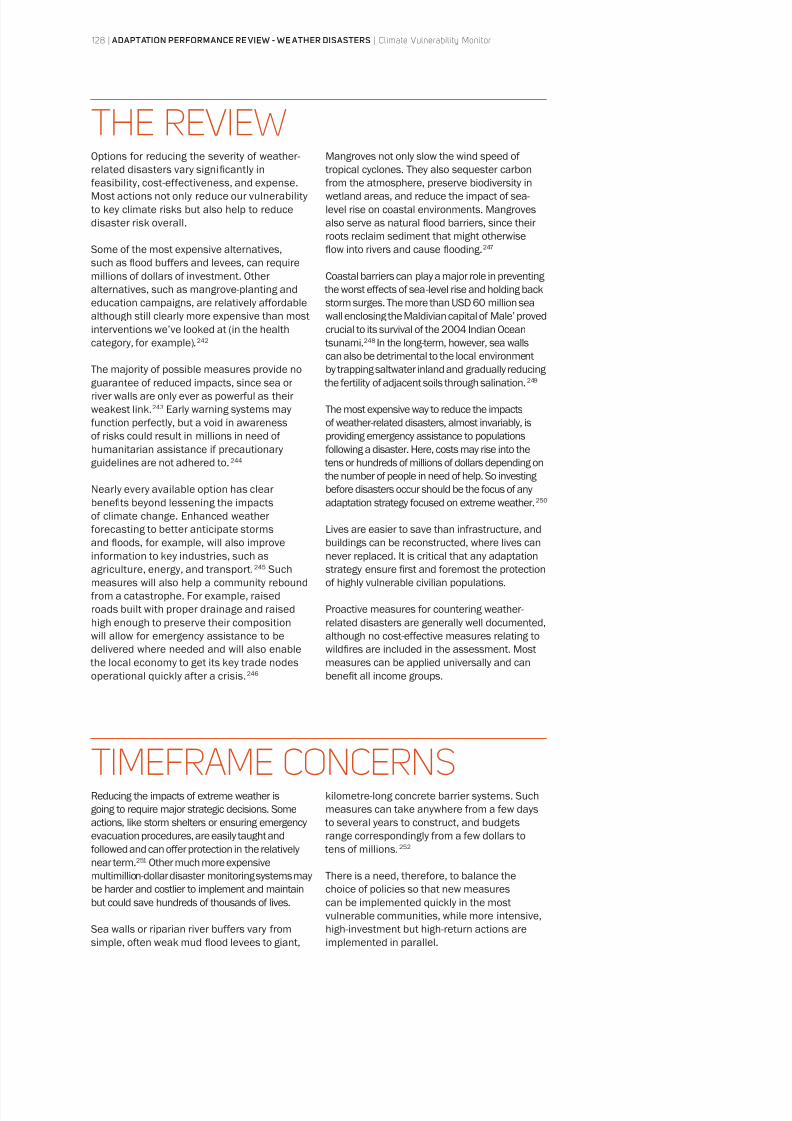
8/8/2019 Climate Vulnerability Monitor 2010: The State of the Climate Crisis
http://slidepdf.com/reader/full/climate-vulnerability-monitor-2010-the-state-of-the-climate-crisis 130/291
Options for reducing the severity of weather-
related disasters vary significantly in
feasibility, cost-effectiveness, and expense.
Most actions not only reduce our vulnerability
to key climate risks but also help to reduce
disaster risk overall.
Some of the most expensive alternatives,
such as flood buffers and levees, can require
millions of dollars of investment. Other
alternatives, such as mangrove-planting and
education campaigns, are relatively affordable
although still clearly more expensive than most
interventions we’ve looked at (in the health
category, for example).242
The majority of possible measures provide no
guarantee of reduced impacts, since sea or
river walls are only ever as powerful as their
weakest link.243 Early warning systems may
function perfectly, but a void in awareness
of risks could result in millions in need of
humanitarian assistance if precautionary
guidelines are not adhered to.244
Nearly every available option has clear
benefi ts beyond lessening the impacts
of climate change. Enhanced weather
forecasting to better anticipate stormsand floods, for example, will also improve
information to key industries, such as
agriculture, energy, and transport.245 Such
measures will also help a community rebound
from a catastrophe. For example, raised
roads built with proper drainage and raised
high enough to preserve their composition
will allow for emergency assistance to be
delivered where needed and will also enable
the local economy to get its key trade nodes
operational quickly after a crisis.246
Mangroves not only slow the wind speed of
tropical cyclones. They also sequester carbon
from the atmosphere, preserve biodiversity in
wetland areas, and reduce the impact of sea-
level rise on coastal environments. Mangroves
also serve as natural flood barriers, since their
roots reclaim sediment that might otherwise
flow into rivers and cause flooding.247
Coastal barriers can play a major role in preventing
the worst effects of sea-level rise and holding back
storm surges. The more than USD 60 million sea
wall enclosing the Maldivian capital of Male’ proved
crucial to its survival of the 2004 Indian Ocean
tsunami.248 In the long-term, however, sea walls
can also be detrimental to the local environmentby trapping saltwater inland and gradually reducing
the fertility of adjacent soils through salination.249
The most expensive way to reduce the impacts
of weather-related disasters, almost invariably, is
providing emergency assistance to populations
following a disaster. Here, costs may rise into the
tens or hundreds of millions of dollars depending on
the number of people in need of help. So investing
before disasters occur should be the focus of any
adaptation strategy focused on extreme weather.250
Lives are easier to save than infrastructure, andbuildings can be reconstructed, where lives can
never replaced. It is critical that any adaptation
strategy ensure first and foremost the protection
of highly vulnerable civilian populations.
Proactive measures for countering weather-
related disasters are generally well documented,
although no cost-effective measures relating to
wildfires are included in the assessment. Most
measures can be applied universally and can
benefi t all income groups.
Reducing the impacts of extreme weather is
going to require major strategic decisions. Some
actions, like storm shelters or ensuring emergency
evacuation procedures, are easily taught and
followed and can offer protection in the relatively
near term.251 Other much more expensive
multimillion-dollar disaster monitoring systems may
be harder and costlier to implement and maintainbut could save hundreds of thousands of lives.
Sea walls or riparian river buffers vary from
simple, often weak mud flood levees to giant,
kilometre-long concrete barrier systems. Such
measures can take anywhere from a few days
to several years to construct, and budgets
range correspondingly from a few dollars to
tens of millions.252
There is a need, therefore, to balance the
choice of policies so that new measurescan be implemented quickly in the most
vulnerable communities, while more intensive,
high-investment but high-return actions are
implemented in parallel.
THE REVIEW
TIMEFRAME CONCERNS
128 | ADAPTATION PERFORMANCE RE VIEW - WE ATHER DISASTERS | Climate Vulnerability Monitor
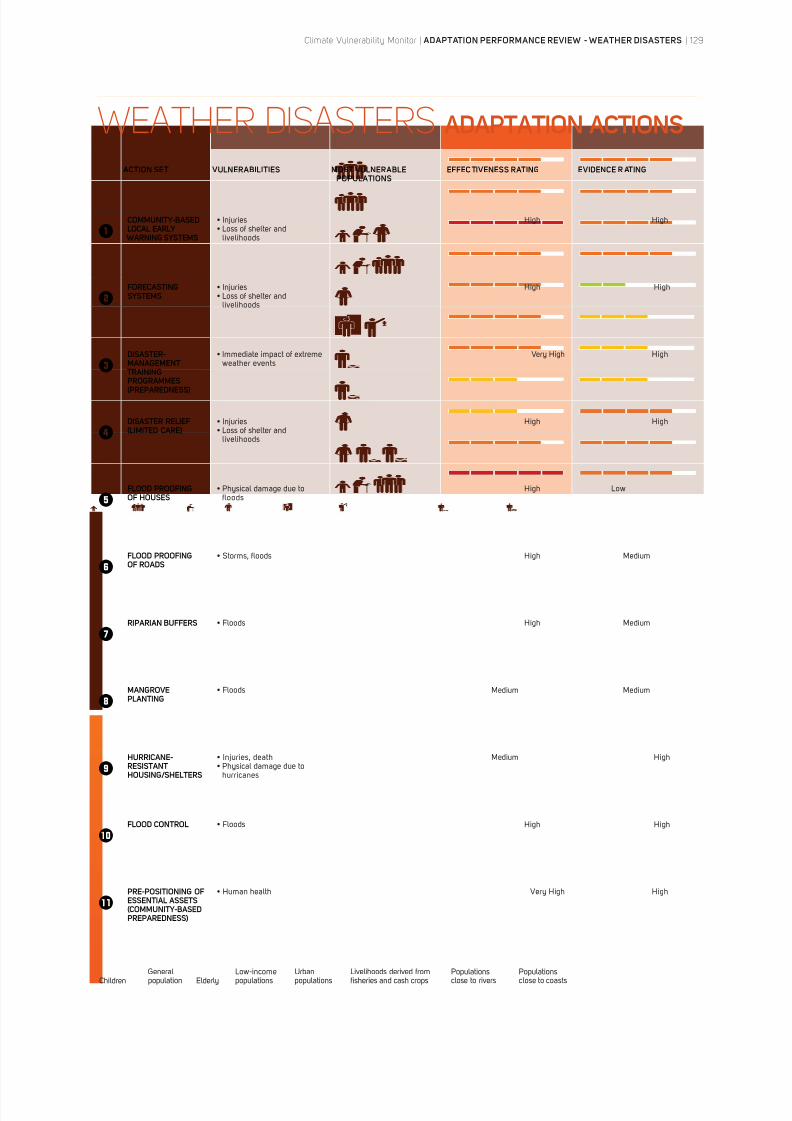
8/8/2019 Climate Vulnerability Monitor 2010: The State of the Climate Crisis
http://slidepdf.com/reader/full/climate-vulnerability-monitor-2010-the-state-of-the-climate-crisis 131/291
WEATHER DISASTERS ADAPTATION ACTIONS
ACTION SET VULNERABILITIES MOST VULNERABLE
POPULATIONS
EFFEC TIVENESS RATING EVIDENCE R ATING
COMMUNITY-BASEDLOCAL EARLY
WARNING SYSTEMS
livelihoods
High High
FORECASTINGSYSTEMS
livelihoods
High High
DISASTER-MANAGEMENT
TRAININGPROGRAMMES(PREPAREDNESS)
weather events Very High High
DISASTER RELIEF(LIMITED CARE)
livelihoods
High High
FLOOD PROOFINGOF HOUSES
floods
High Low
FLOOD PROOFINGOF ROADS
High Medium
RIPARIAN BUFFERS High Medium
MANGROVEPLANTING
Medium Medium
HURRICANE-RESISTANTHOUSING/SHELTERS
hurricanes
Medium High
FLOOD CONTROL High High
PRE-POSITIONING OFESSENTIAL ASSETS(COMMUNITY-BASEDPREPAREDNESS)
Very High High
Children ElderlyGeneral
Low-income
Urban
Livelihoods derived from
close to rivers
close to coasts
Climate Vulnerability Monitor | ADAPTATION PERFORMANCE REVIEW - WEATHER DISASTERS | 129
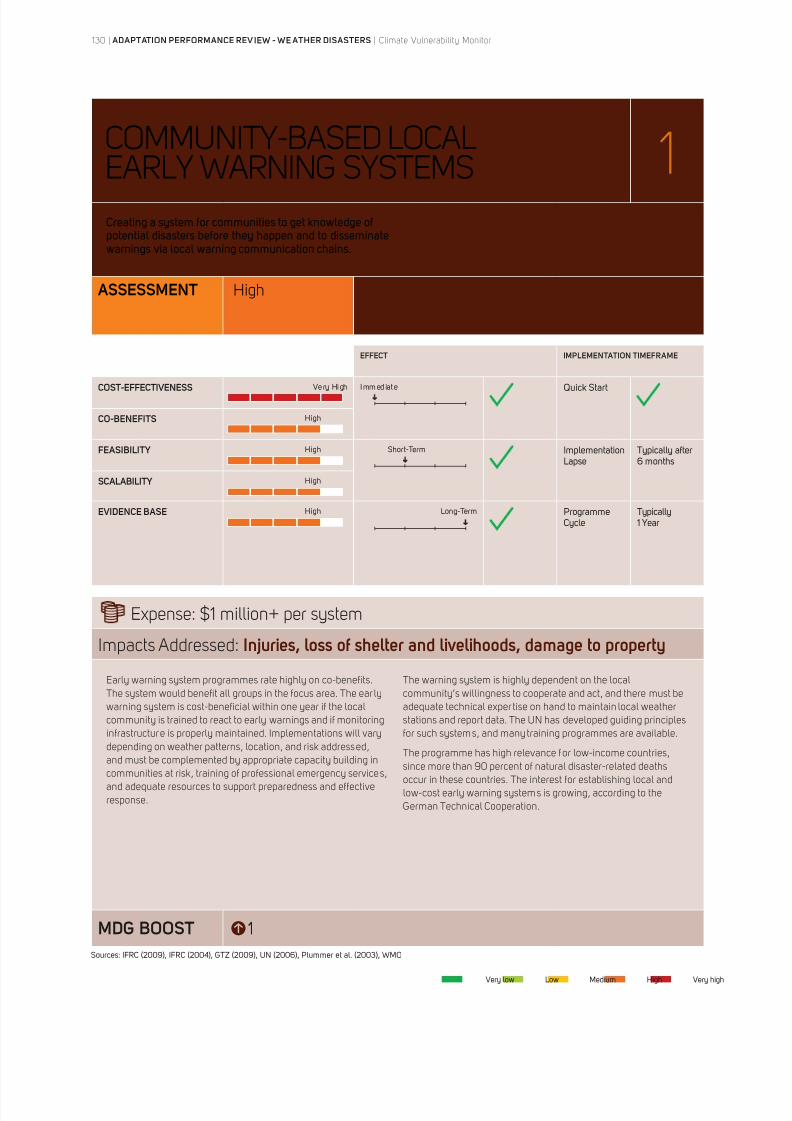
8/8/2019 Climate Vulnerability Monitor 2010: The State of the Climate Crisis
http://slidepdf.com/reader/full/climate-vulnerability-monitor-2010-the-state-of-the-climate-crisis 132/291
COMMUNITY-BASED LOCAL
EARLY WARNING SYSTEMS 1
ASSESSMENT High
EFFECT IMPLEMENTATION TIMEFRAME
COST-EFFECTIVENESS Very High Immediate Quick Start
CO-BENEFITS High
FEASIBILITY High Short-Term
6 months
SCALABILITY High
EVIDENCE BASE High Long-Term Cycle
1 Year
Expense: $1 million+ per system
Impacts Addressed: Injuries, loss of shelter and livelihoods, damage to property
MDG BOOST 1
Creating a system for communities to get knowledge of
Early warning system programmes rate highly on co-benefits.
The system would benefit all groups in the focus area. The ear ly
warning system is cost-beneficial within one year if the local
community is trained to react to early warnings and if monitoring
infrastructure is properly maintained. Implementations will vary
depending on weather patterns, location, and risk addressed,
and must be complemented by appropriate capacity building in
communities at risk, training of professional emergency services,
and adequate resources to support preparedness and effective
response.
The warning system is highly dependent on the local
community’s willingness to cooperate and act, and there must be
adequate technical exper tise on hand to maintain local weather
stations and report data. The UN has developed guiding principles
for such systems, and many training programmes are available.
The programme has high relevance for low-income countries,
since more than 90 percent of natural disaster-related deaths
occur in these countries. The interest for establishing local and
low-cost early warning systems is growing, according to the
German Technical Cooperation.
Very low Low Medium High Very high
130 | ADAPTATION PERFORMANCE REV IEW - WE ATHER DISASTERS | Climate Vulnerability Monitor
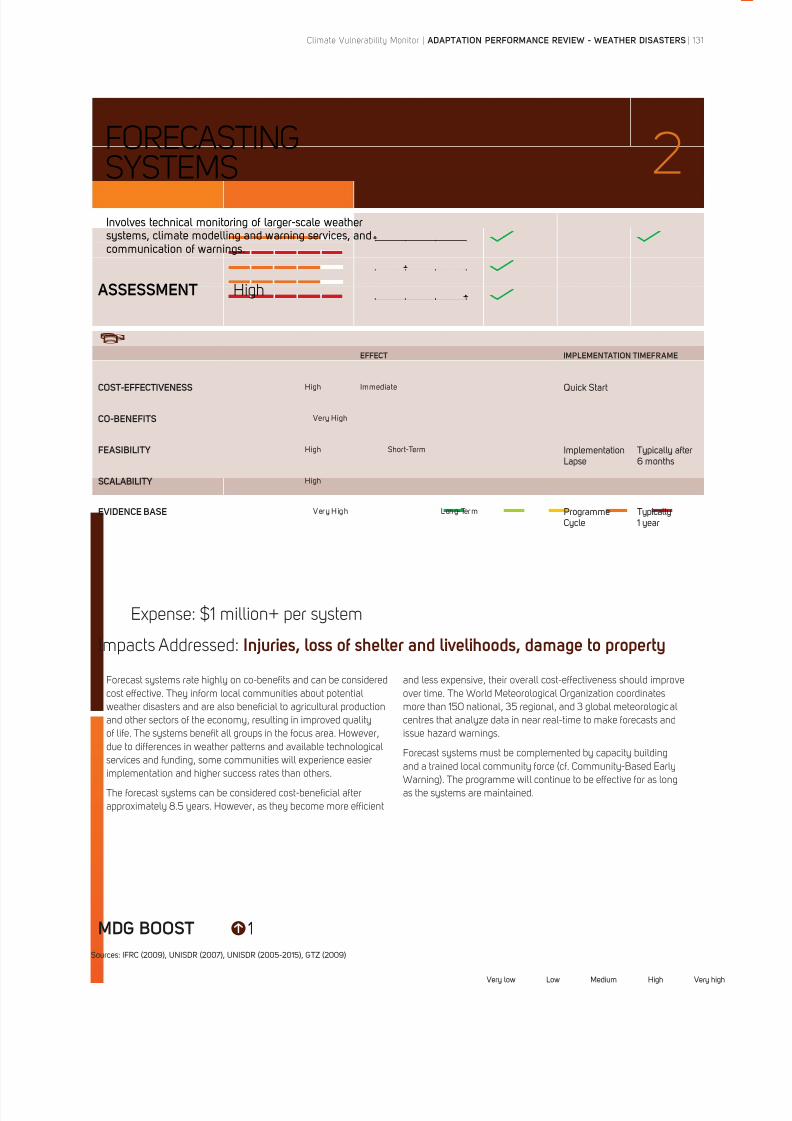
8/8/2019 Climate Vulnerability Monitor 2010: The State of the Climate Crisis
http://slidepdf.com/reader/full/climate-vulnerability-monitor-2010-the-state-of-the-climate-crisis 133/291
FORECASTING
SYSTEMS 2
ASSESSMENT High
EFFECT IMPLEMENTATION TIMEFRAME
COST-EFFECTIVENESS High Immediate Quick Start
CO-BENEFITS Very High
FEASIBILITY High Short-Term
6 months
SCALABILITY High
EVIDENCE BASE Very High Long-Term Cycle
1 year
Expense: $1 million+ per system
Impacts Addressed: Injuries, loss of shelter and livelihoods, damage to property
MDG BOOST 1
Involves technical monitoring of larger-scale weather
Forecast systems rate highly on co-benefits and can be considered
cost effective. They inform local communities about potential
weather disasters and are also beneficial to agricultural production
and other sectors of the economy, resulting in improved quality
of life. The systems benefit all groups in the focus area. However,
due to differences in weather patterns and available technological
services and funding, some communities will experience easier
implementation and higher success rates than others.
The forecast systems can be considered cost-beneficial after
approximately 8.5 years. However, as they become more efficient
and less expensive, their overall cost-effectiveness should improve
over time. The World Meteorological Organization coordinates
more than 150 national, 35 regional, and 3 global meteorological
centres that analyze data in near real-time to make forecasts and
issue hazard warnings.
Forecast systems must be complemented by capacity building
and a trained local community force (cf. Community-Based Early
Warning). The programme will continue to be effective for as long
as the systems are maintained.
Very low Low Medium High Very high
Climate Vulnerability Monitor | ADAPTATION PERFORMANCE REVIEW - WEATHER DISASTERS | 131
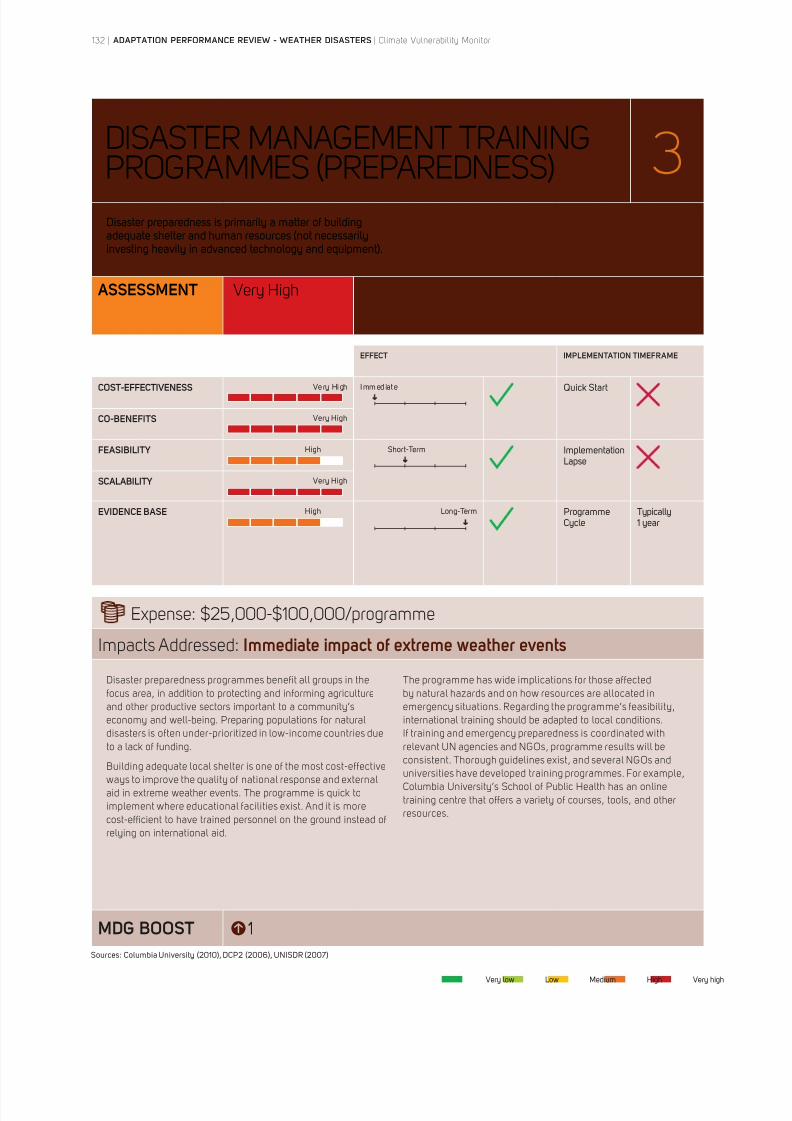
8/8/2019 Climate Vulnerability Monitor 2010: The State of the Climate Crisis
http://slidepdf.com/reader/full/climate-vulnerability-monitor-2010-the-state-of-the-climate-crisis 134/291
DISASTER MANAGEMENT TRAINING
PROGRAMMES (PREPAREDNESS) 3
ASSESSMENT Very High
EFFECT IMPLEMENTATION TIMEFRAME
COST-EFFECTIVENESS Very High Immediate Quick Start
CO-BENEFITS Very High
FEASIBILITY High Short-Term
SCALABILITY Very High
EVIDENCE BASE High Long-Term Cycle
1 year
Expense: $25,000-$100,000/programme
Impacts Addressed: Immediate impact of extreme weather events
MDG BOOST 1
adequate shelter and human resources (not necessarily
Disaster preparedness programmes benefit all groups in the
focus area, in addition to protecting and informing agriculture
and other productive sectors important to a community’s
economy and well-being. Preparing populations for natural
disasters is often under-prioritized in low-income countries due
to a lack of funding.
Building adequate local shelter is one of the most cost-effective
ways to improve the quality of national response and external
aid in extreme weather events. The programme is quick to
implement where educational facilities exist. And it is more
cost-efficient to have trained personnel on the ground instead of
relying on international aid.
The programme has wide implications for those affected
by natural hazards and on how resources are allocated in
emergency situations. Regarding the programme’s feasibility,
international training should be adapted to local conditions.
If training and emergency preparedness is coordinated with
relevant UN agencies and NGOs, programme results will be
consistent. Thorough guidelines exist, and several NGOs and
universities have developed training programmes. For example,
Columbia University’s School of Public Health has an online
training centre that offers a variety of courses, tools, and other
resources.
Very low Low Medium High Very high
132 | ADAPTATION PERFORMANCE REVIEW - WEATHER DISASTERS | Climate Vulnerability Monitor
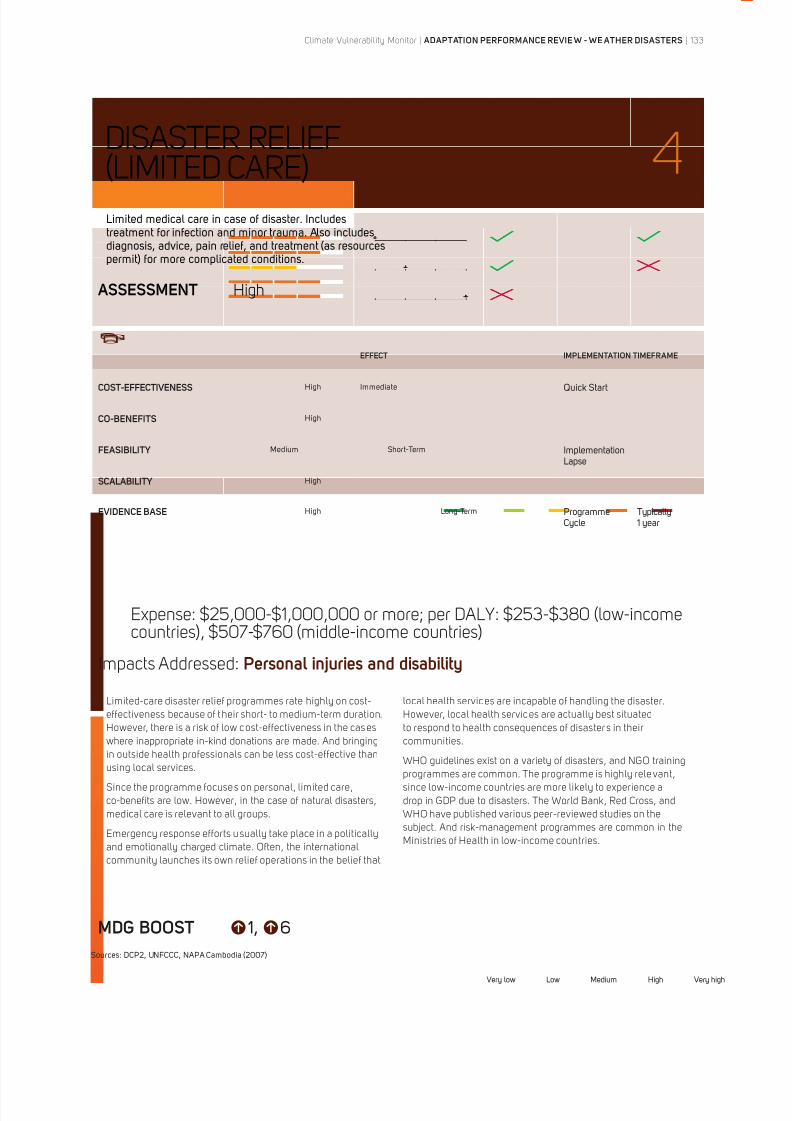
8/8/2019 Climate Vulnerability Monitor 2010: The State of the Climate Crisis
http://slidepdf.com/reader/full/climate-vulnerability-monitor-2010-the-state-of-the-climate-crisis 135/291
DISASTER RELIEF
(LIMITED CARE) 4
ASSESSMENT High
EFFECT IMPLEMENTATION TIMEFRAME
COST-EFFECTIVENESS High Immediate Quick Start
CO-BENEFITS High
FEASIBILITY Medium Short-Term
SCALABILITY High
EVIDENCE BASE High Long-Term Cycle
1 year
Expense: $25,000-$1,000,000 or more; per DALY: $253-$380 (low-incomecountries), $507-$760 (middle-income countries)
Impacts Addressed: Personal injuries and disability
MDG BOOST 6
Limited-care disaster relief programmes rate highly on cost-
effectiveness because of t heir short- to medium-term duration.However, there is a risk of low cost-effectiveness in the cas es
where inappropriate in-kind donations are made. And bringing
in outside health professionals can be less cost-effective than
using local services.
Since the programme focuses on personal, limited care,
co-benefits are low. However, in the case of natural disasters,
medical care is relevant to all groups.
Emergency response efforts u sually take place in a politically
and emotionally charged climate. Often, the international
community launches its own relief operations in the belief that
local health services are incapable of handling the disaster.
However, local health services are actually best situatedto respond to health consequences of disaster s in their
communities.
WHO guidelines exist on a variety of disasters, and NGO training
programmes are common. The programme is highly relevant,
since low-income countries are more likely to experience a
drop in GDP due to disasters. The World Bank, Red Cross, and
WHO have published various peer-reviewed studies on the
subject. And risk-management programmes are common in the
Ministries of Health in low-income countries.
Very low Low Medium High Very high
Climate Vulnerability Monitor | ADAPTATION PERFORMANCE REVIE W - WE ATHER DISASTERS | 133

8/8/2019 Climate Vulnerability Monitor 2010: The State of the Climate Crisis
http://slidepdf.com/reader/full/climate-vulnerability-monitor-2010-the-state-of-the-climate-crisis 136/291
FLOOD PROOFING
OF HOUSES 5
ASSESSMENT High
EFFECT IMPLEMENTATION TIMEFRAME
COST-EFFECTIVENESS High Immediate Quick Start
CO-BENEFITS Very High
FEASIBILITY High Short-Term
SCALABILITY Very High
EVIDENCE BASE Medium Long-Term Cycle
years
Expense: $144-244 per house
Impacts Addressed: Physical damage due to floods, human health
MDG BOOST
Programmes to promote the flood proofing of houses rate
highly on co-benefits and scalability. Livelihoods and houses
are improved and protected as a result of the programme. It is
highly relevant to vulnerable groups in low-income countries and
promotes consistent benefits for all households. Many UNFCCC
and other case examples are available on the subject.
A flood-proofing programme is funded and rolled out over several
years and can take 25 years to fully implement. However, it
is relatively cost-effective over time, and after four years, the
benefits exceed the costs. Also, results are consistent as long
as the implementation is designed to fit local needs. If the
programme is established correctly, results are consistent.
Policymakers currently show little interest in the programme,and peer-reviewed studies on the subject are limited. However,
such programmes have been common in Bangladesh, where
flood proofing by way of raising houses and other infrastructure
is part of traditional practice. A house raising option programme
in Bangladesh’s main river char lands will provide raised
households to some 2.5 million people.
Very low Low Medium High Very high
134 | ADAPTATION PERFORMANCE REVIE W - WE ATHER DISASTERS | Climate Vulnerability Monitor
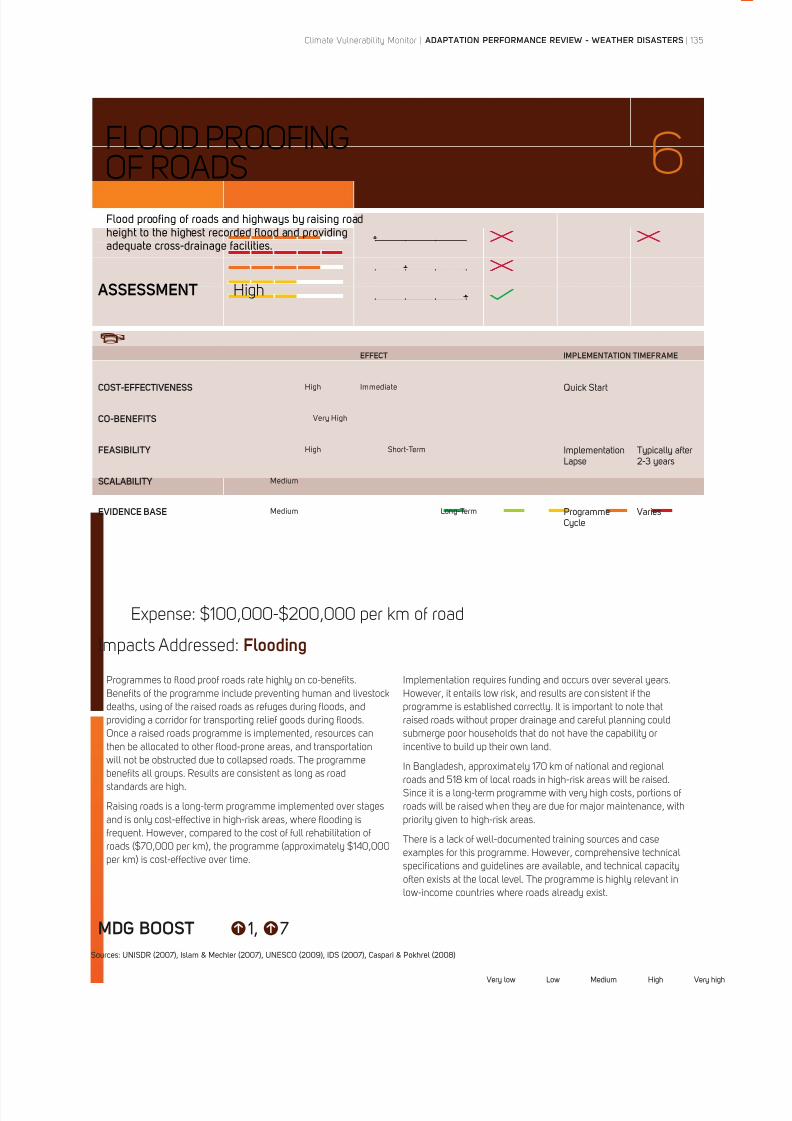
8/8/2019 Climate Vulnerability Monitor 2010: The State of the Climate Crisis
http://slidepdf.com/reader/full/climate-vulnerability-monitor-2010-the-state-of-the-climate-crisis 137/291
FLOOD PROOFING
OF ROADS 6
ASSESSMENT High
EFFECT IMPLEMENTATION TIMEFRAME
COST-EFFECTIVENESS High Immediate Quick Start
CO-BENEFITS Very High
FEASIBILITY High Short-Term
SCALABILITY Medium
EVIDENCE BASE Medium Long-Term Cycle
Varies
Expense: $100,000-$200,000 per km of road
Impacts Addressed: Flooding
MDG BOOST
Programmes to flood proof roads rate highly on co-benefits.
Benefits of the programme include preventing human and livestock
deaths, using of the raised roads as refuges during floods, and
providing a corridor for transporting relief goods during floods.
Once a raised roads programme is implemented, resources can
then be allocated to other flood-prone areas, and transportation
will not be obstructed due to collapsed roads. The programme
benefits all groups. Results are consistent as long as road
standards are high.
Raising roads is a long-term programme implemented over stages
and is only cost-effective in high-risk areas, where flooding is
frequent. However, compared to the cost of full rehabilitation of
roads ($70,000 per km), the programme (approximately $140,000
per km) is cost-effective over time.
Implementation requires funding and occurs over several years.
However, it entails low risk, and results are consistent if the
programme is established correctly. It is important to note that
raised roads without proper drainage and careful planning could
submerge poor households that do not have the capability or
incentive to build up their own land.
In Bangladesh, approximately 170 km of national and regional
roads and 518 km of local roads in high-risk areas will be raised.
Since it is a long-term programme with very high costs, portions of
roads will be raised when they are due for major maintenance, with
priority given to high-risk areas.
There is a lack of well-documented training sources and case
examples for this programme. However, comprehensive technical
specifications and guidelines are available, and technical capacity
often exists at the local level. The programme is highly relevant in
low-income countries where roads already exist.
Very low Low Medium High Very high
Climate Vulnerability Monitor | ADAPTATION PERFORMANCE REVIEW - WEATHER DISASTERS | 135
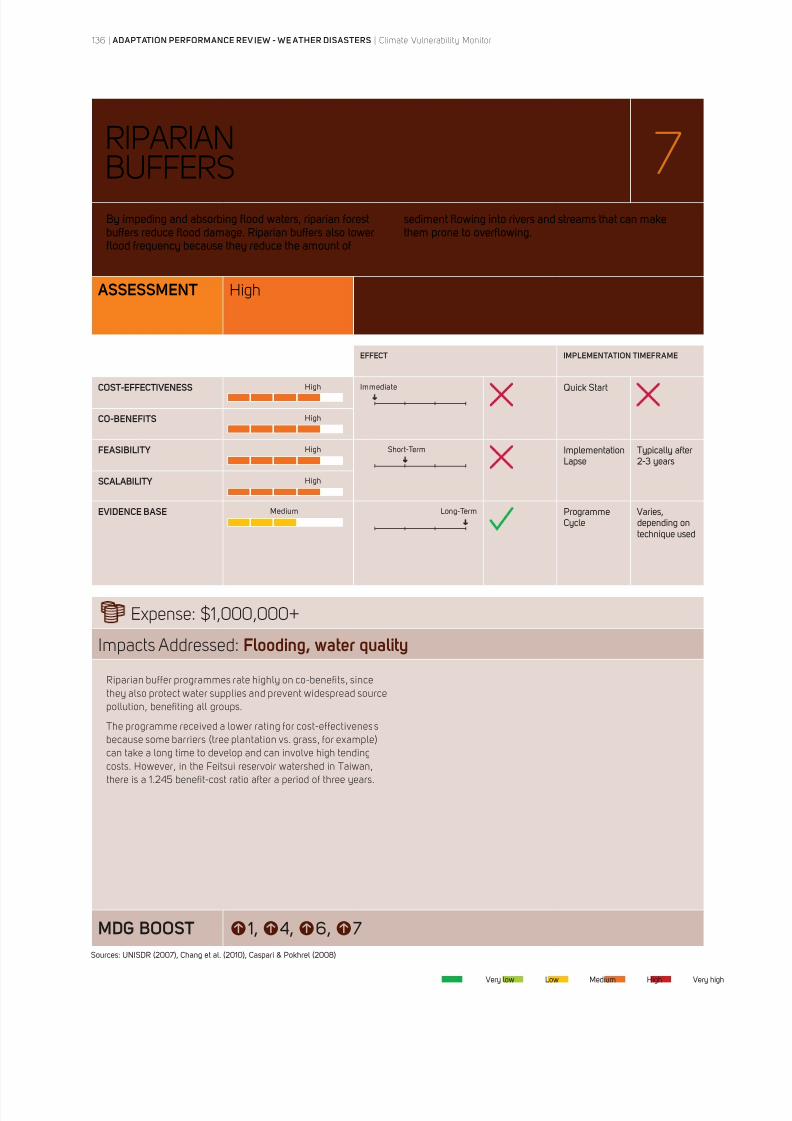
8/8/2019 Climate Vulnerability Monitor 2010: The State of the Climate Crisis
http://slidepdf.com/reader/full/climate-vulnerability-monitor-2010-the-state-of-the-climate-crisis 138/291
RIPARIAN
BUFFERS 7
ASSESSMENT High
EFFECT IMPLEMENTATION TIMEFRAME
COST-EFFECTIVENESS High Immediate Quick Start
CO-BENEFITS High
FEASIBILITY High Short-Term
SCALABILITY High
EVIDENCE BASE Medium Long-Term Cycle
technique used
Expense: $1,000,000+
Impacts Addressed: Flooding, water quality
MDG BOOST
flood frequency because they reduce the amount of
sediment flowing into rivers and streams that can make
Riparian buffer programmes rate highly on co-benefits, since
they also protect water supplies and prevent widespread source
pollution, benefiting all groups.
The programme received a lower rating for cost-effectivenes s
because some barriers (tree plantation vs. grass, for example)
can take a long time to develop and can involve high tending
costs. However, in the Feitsui reservoir watershed in Taiwan,
there is a 1.245 benefit-cost ratio after a period of three years.
Very low Low Medium High Very high
136 | ADAPTATION PERFORMANCE REV IEW - WE ATHER DISASTERS | Climate Vulnerability Monitor
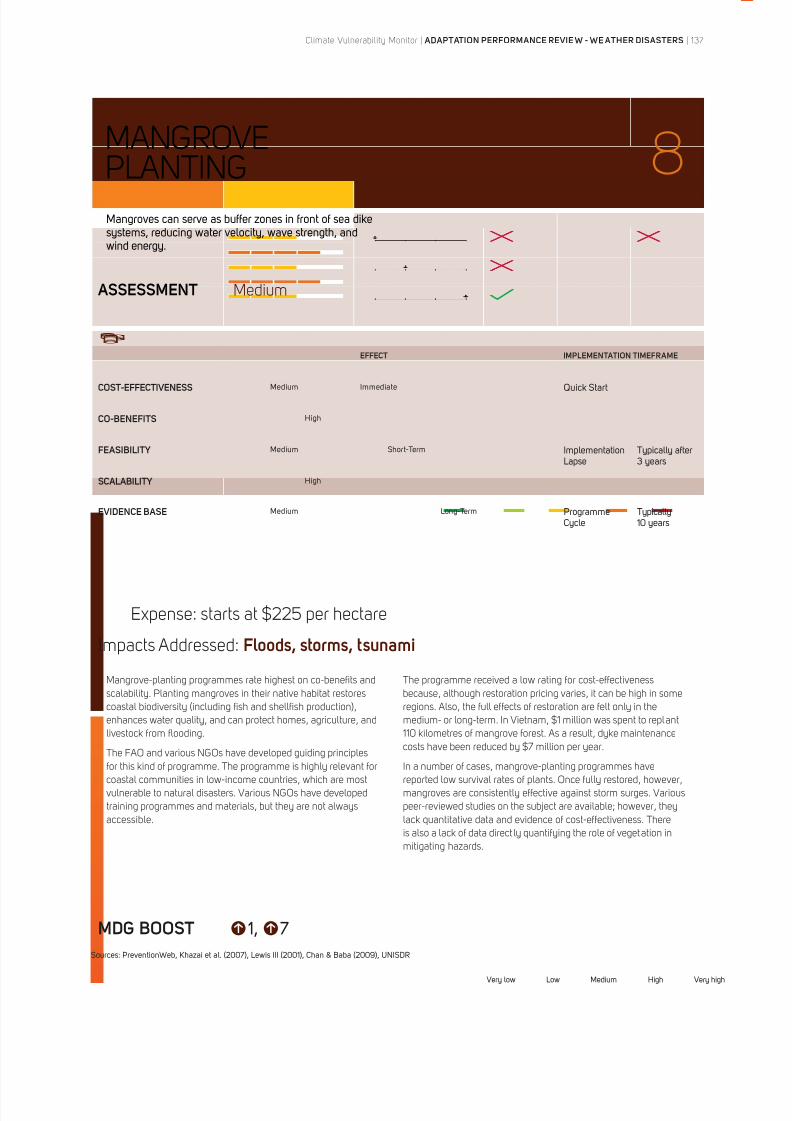
8/8/2019 Climate Vulnerability Monitor 2010: The State of the Climate Crisis
http://slidepdf.com/reader/full/climate-vulnerability-monitor-2010-the-state-of-the-climate-crisis 139/291
MANGROVE
PLANTING 8
ASSESSMENT Medium
EFFECT IMPLEMENTATION TIMEFRAME
COST-EFFECTIVENESS Medium Immediate Quick Start
CO-BENEFITS High
FEASIBILITY Medium Short-Term
SCALABILITY High
EVIDENCE BASE Medium Long-Term Cycle
10 years
Expense: starts at $225 per hectare
Impacts Addressed: Floods, storms, tsunami
MDG BOOST
Mangrove-planting programmes rate highest on co-benefits and
scalability. Planting mangroves in their native habitat restores
coastal biodiversity (including fish and shellfish production),
enhances water quality, and can protect homes, agriculture, and
livestock from flooding.
The FAO and various NGOs have developed guiding principles
for this kind of programme. The programme is highly relevant for
coastal communities in low-income countries, which are most
vulnerable to natural disasters. Various NGOs have developed
training programmes and materials, but they are not always
accessible.
The programme received a low rating for cost-effectiveness
because, although restoration pricing varies, it can be high in some
regions. Also, the full effects of restoration are felt only in the
medium- or long-term. In Vietnam, $1 million was spent to replant
110 kilometres of mangrove forest. As a result, dyke maintenance
costs have been reduced by $7 million per year.
In a number of cases, mangrove-planting programmes have
reported low survival rates of plants. Once fully restored, however,
mangroves are consistently effective against storm surges. Various
peer-reviewed studies on the subject are available; however, they
lack quantitative data and evidence of cost-effectiveness. There
is also a lack of data direct ly quantifying the role of vegetation in
mitigating hazards.
Very low Low Medium High Very high
Climate Vulnerability Monitor | ADAPTATION PERFORMANCE REVIE W - WE ATHER DISASTERS | 137
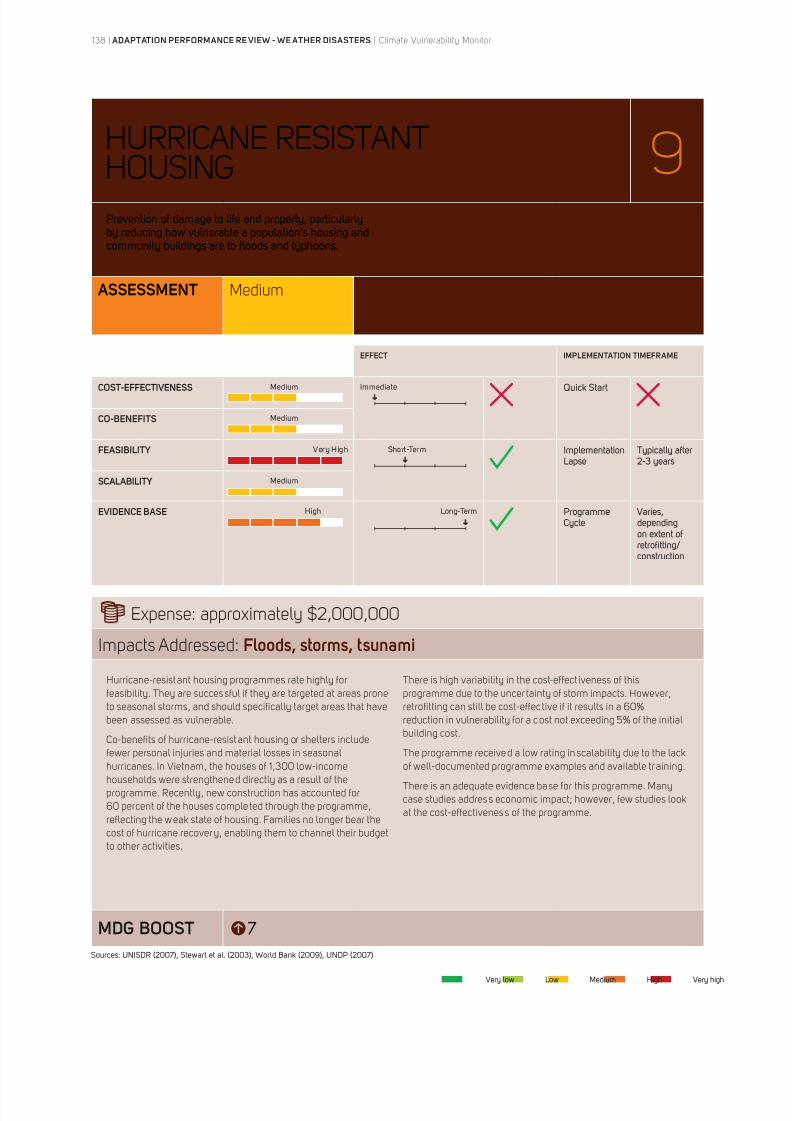
8/8/2019 Climate Vulnerability Monitor 2010: The State of the Climate Crisis
http://slidepdf.com/reader/full/climate-vulnerability-monitor-2010-the-state-of-the-climate-crisis 140/291
HURRICANE RESISTANT
HOUSING 9
ASSESSMENT Medium
EFFECT IMPLEMENTATION TIMEFRAME
COST-EFFECTIVENESS Medium Immediate Quick Start
CO-BENEFITS Medium
FEASIBILITY Very High Short-Term
SCALABILITY Medium
EVIDENCE BASE High Long-Term Cycle
retrofitting/construction
Expense: approximately $2,000,000
Impacts Addressed: Floods, storms, tsunami
MDG BOOST
Hurricane-resistant housing programmes rate highly for
feasibility. They are succes sful if they are targeted at areas prone
to seasonal storms, and should specifically target areas that have
been assessed as vulnerable.
Co-benefits of hurricane-resistant housing or shelters include
fewer personal injuries and material losses in seasonal
hurricanes. In Vietnam, the houses of 1,300 low-income
households were strengthened directly as a result of the
programme. Recently, new construction has accounted for
60 percent of the houses completed through the programme,
reflecting the weak state of housing. Families no longer bear the
cost of hurricane recovery, enabling them to channel their budget
to other activities.
There is high variability in the cost-effect iveness of this
programme due to the uncer tainty of storm impacts. However,
retrofitting can still be cost-effective if it results in a 60%
reduction in vulnerability for a cost not exceeding 5% of the initial
building cost.
The programme received a low rating in scalability due to the lack
of well-documented programme examples and available training.
There is an adequate evidence base for this programme. Many
case studies addres s economic impact; however, few studies look
at the cost-effectivenes s of the programme.
Very low Low Medium High Very high
138 | ADAPTATION PERFORMANCE RE VIEW - WE ATHER DISASTERS | Climate Vulnerability Monitor
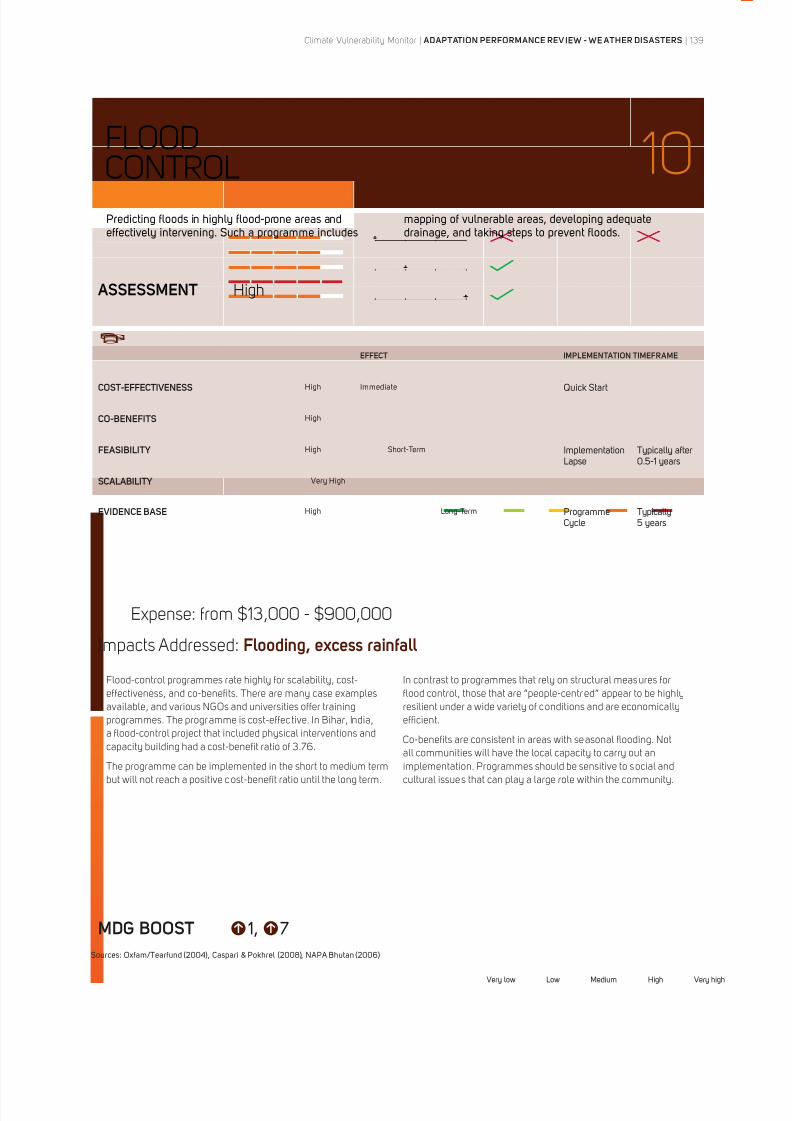
8/8/2019 Climate Vulnerability Monitor 2010: The State of the Climate Crisis
http://slidepdf.com/reader/full/climate-vulnerability-monitor-2010-the-state-of-the-climate-crisis 141/291
FLOOD
CONTROL 10
ASSESSMENT High
EFFECT IMPLEMENTATION TIMEFRAME
COST-EFFECTIVENESS High Immediate Quick Start
CO-BENEFITS High
FEASIBILITY High Short-Term
SCALABILITY Very High
EVIDENCE BASE High Long-Term Cycle
Expense: from $13,000 - $900,000
Impacts Addressed: Flooding, excess rainfall
MDG BOOST
Flood-control programmes rate highly for scalability, cost-
effectiveness, and co-benefits. There are many case examples
available, and various NGOs and universities offer training
programmes. The programme is cost-effective. In Bihar, India,
a flood-control project that included physical interventions and
capacity building had a cost-benefit ratio of 3.76.
The programme can be implemented in the short to medium term
but will not reach a positive cost-benefit ratio until the long term.
In contrast to programmes that rely on structural measures for
flood control, those that are “people-centred” appear to be highly
resilient under a wide variety of conditions and are economically
efficient.
Co-benefits are consistent in areas with seasonal flooding. Not
all communities will have the local capacity to carry out an
implementation. Programmes should be sensitive to social and
cultural issues that can play a large role within the community.
Very low Low Medium High Very high
Climate Vulnerability Monitor | ADAPTATION PERFORMANCE REV IEW - WE ATHER DISASTERS | 139
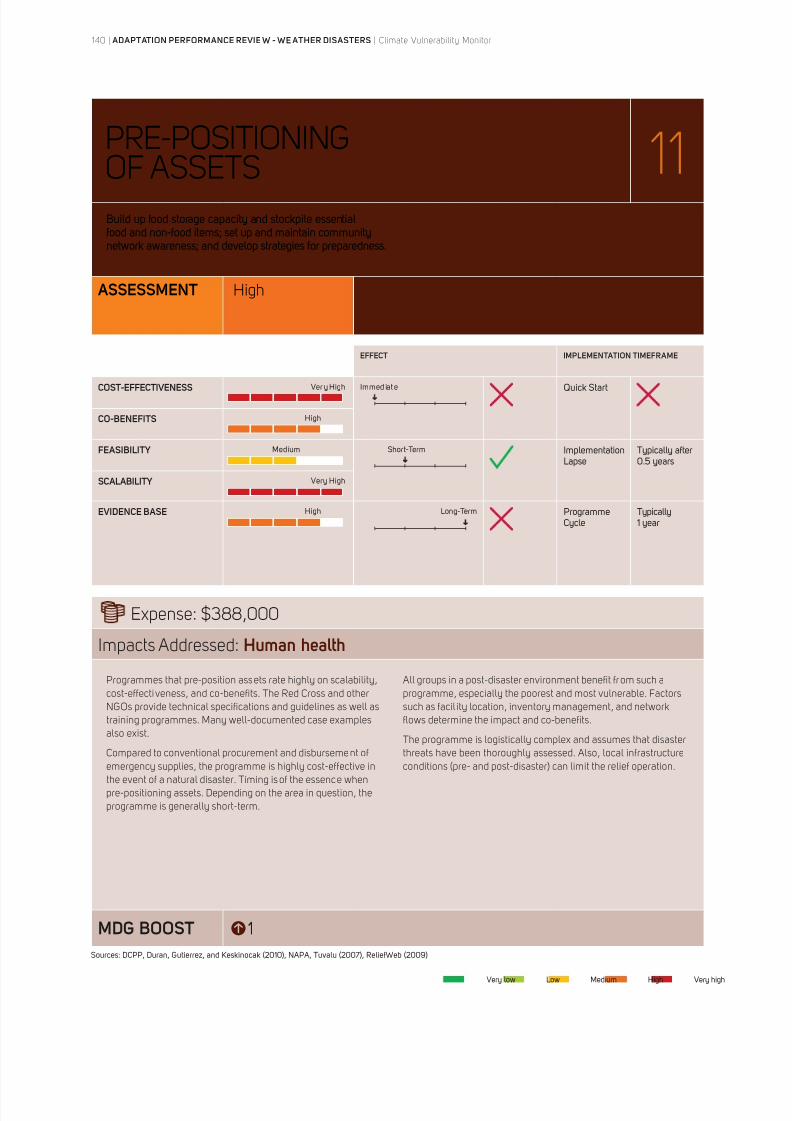
8/8/2019 Climate Vulnerability Monitor 2010: The State of the Climate Crisis
http://slidepdf.com/reader/full/climate-vulnerability-monitor-2010-the-state-of-the-climate-crisis 142/291
PRE-POSITIONING
OF ASSETS 11
ASSESSMENT High
EFFECT IMPLEMENTATION TIMEFRAME
COST-EFFECTIVENESS Ver y High Immed iat e Quick Start
CO-BENEFITS High
FEASIBILITY Medium Short-Term
SCALABILITY Very High
EVIDENCE BASE High Long-Term Cycle
1 year
Expense: $388,000
Impacts Addressed: Human health
MDG BOOST 1
Programmes that pre-position assets rate highly on scalability,
cost-effectiveness, and co-benefits. The Red Cross and other
NGOs provide technical specifications and guidelines as well as
training programmes. Many well-documented case examples
also exist.
Compared to conventional procurement and disbursement of
emergency supplies, the programme is highly cost-effective in
the event of a natural disaster. Timing is of the essence when
pre-positioning assets. Depending on the area in question, the
programme is generally short-term.
All groups in a post-disaster environment benefit from such a
programme, especially the poorest and most vulnerable. Factors
such as facil ity location, inventory management, and network
flows determine the impact and co-benefits.
The programme is logistically complex and assumes that disaster
threats have been thoroughly assessed. Also, local infrastructure
conditions (pre- and post-disaster) can limit the relief operation.
Very low Low Medium High Very high
140 | ADAPTATION PERFORMANCE REVIE W - WE ATHER DISASTERS | Climate Vulnerability Monitor

8/8/2019 Climate Vulnerability Monitor 2010: The State of the Climate Crisis
http://slidepdf.com/reader/full/climate-vulnerability-monitor-2010-the-state-of-the-climate-crisis 143/291
Workers construct a flood wall to protect buildings in the United States. Source: FEMA/Liz Roll.
Climate Vulnerability Monitor | ADAPTATION PERFORMANCE REVIEW - WEATHER DISASTERS | 141
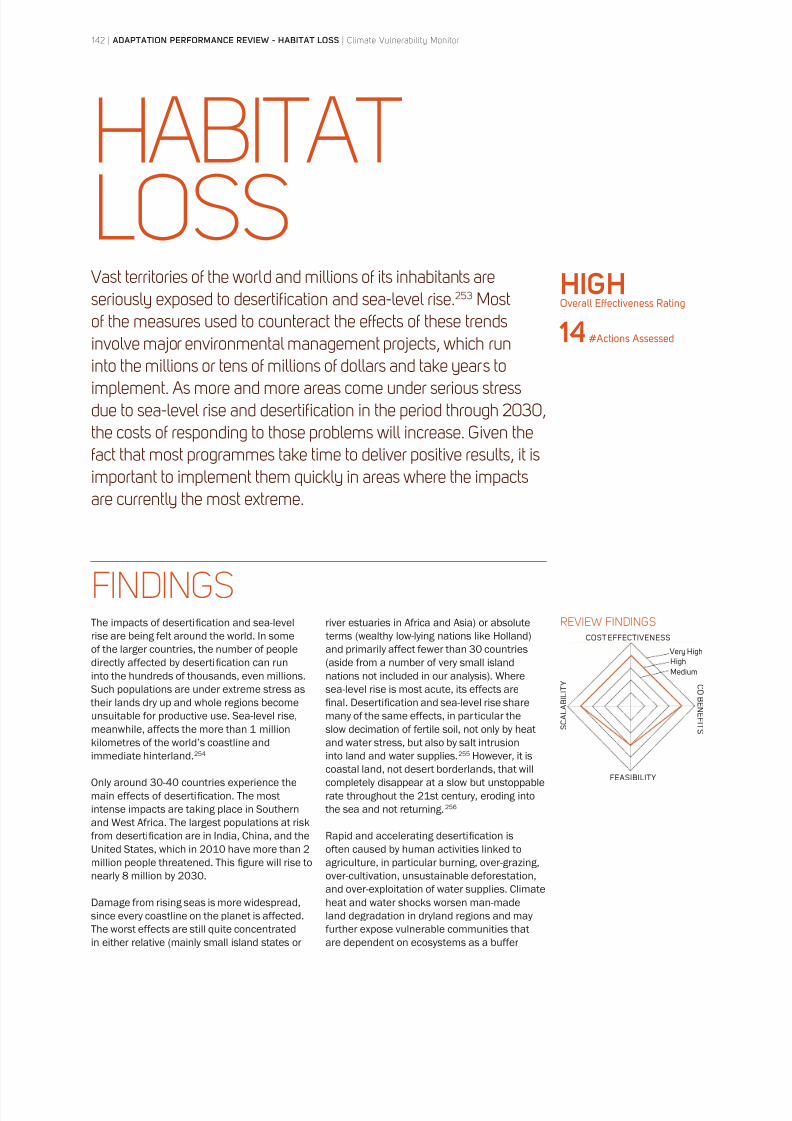
8/8/2019 Climate Vulnerability Monitor 2010: The State of the Climate Crisis
http://slidepdf.com/reader/full/climate-vulnerability-monitor-2010-the-state-of-the-climate-crisis 144/291
142 | ADAPTATION PERFORMANCE REVIEW - HABITAT LOSS | Climate Vulnerability Monitor
HABITATLOSSVast territories of the world and millions of its inhabitants areseriously exposed to desertification and sea-level rise.253 Mostof the measures used to counteract the effects of these trendsinvolve major environmental management projects, which runinto the millions or tens of millions of dollars and take years toimplement. As more and more areas come under serious stressdue to sea-level rise and desertification in the period through 2030,the costs of responding to those problems will increase. Given thefact that most programmes take time to deliver positive results, it isimportant to implement them quickly in areas where the impactsare currently the most extreme.
The impacts of desertification and sea-level
rise are being felt around the world. In some
of the larger countries, the number of people
directly affected by desertification can run
into the hundreds of thousands, even millions.
Such populations are under extreme stress as
their lands dry up and whole regions become
unsuitable for productive use. Sea-level rise,meanwhile, affects the more than 1 million
kilometres of the world’s coastline and
immediate hinterland.254
Only around 30-40 countries experience the
main effects of desertification. The most
intense impacts are taking place in Southern
and West Africa. The largest populations at risk
from desertification are in India, China, and the
United States, which in 2010 have more than 2
million people threatened. This figure will rise to
nearly 8 million by 2030.
Damage from rising seas is more widespread,
since every coastline on the planet is affected.
The worst effects are still quite concentrated
in either relative (mainly small island states or
river estuaries in Africa and Asia) or absolute
terms (wealthy low-lying nations like Holland)
and primarily affect fewer than 30 countries
(aside from a number of very small island
nations not included in our analysis). Where
sea-level rise is most acute, its effects are
final. Desertification and sea-level rise share
many of the same effects, in particular theslow decimation of fertile soil, not only by heat
and water stress, but also by salt intrusion
into land and water supplies.255 However, it is
coastal land, not desert borderlands, that will
completely disappear at a slow but unstoppable
rate throughout the 21st century, eroding into
the sea and not returning.256
Rapid and accelerating desertification is
often caused by human activities linked to
agriculture, in particular burning, over-grazing,
over-cultivation, unsustainable deforestation,
and over-exploitation of water supplies. Climateheat and water shocks worsen man-made
land degradation in dryland regions and may
further expose vulnerable communities that
are dependent on ecosystems as a buffer
FINDINGS
HIGH Overall Effectiveness Rating
14 #Actions Assessed
REVIEW FINDINGSCOST EFFECTIVENESS
S C A L
A B I L I T Y C
O B E N E F I T S
FEASIBILITY
Very HighHigh
Medium
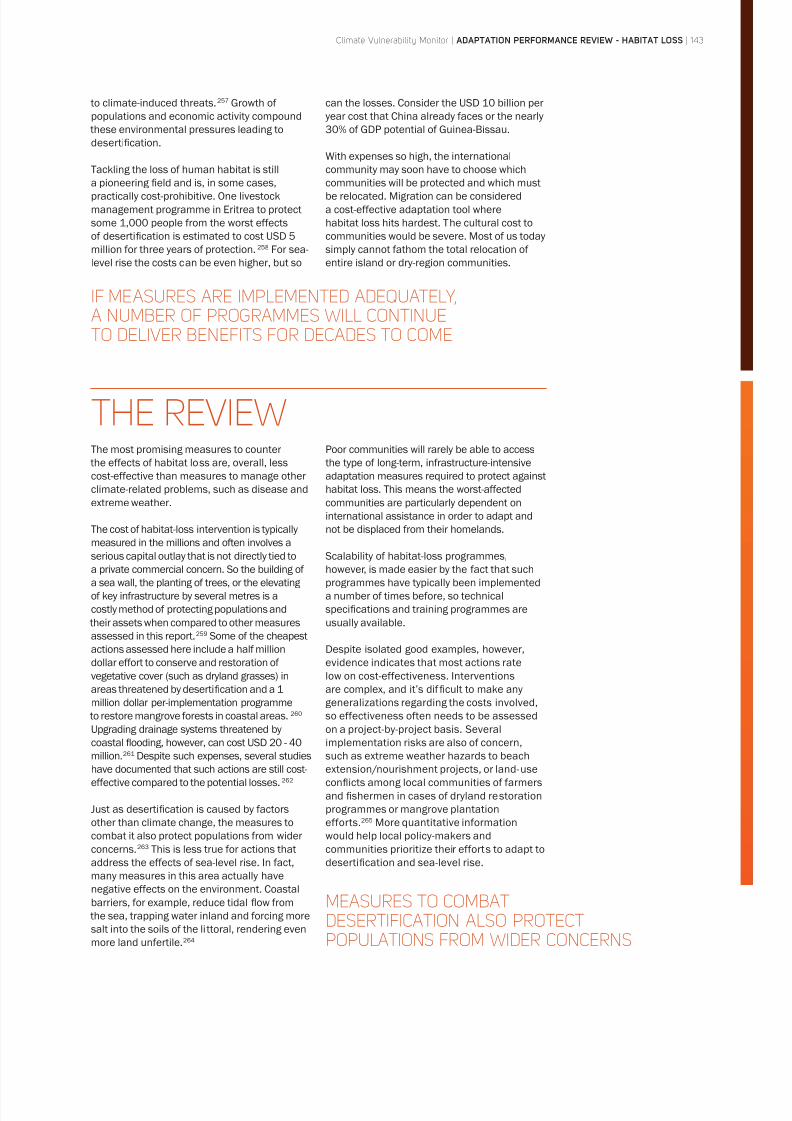
8/8/2019 Climate Vulnerability Monitor 2010: The State of the Climate Crisis
http://slidepdf.com/reader/full/climate-vulnerability-monitor-2010-the-state-of-the-climate-crisis 145/291
Climate Vulnerability Monitor | ADAPTATION PERFORMANCE REVIEW - HABITAT LOSS | 143
to climate-induced threats.257 Growth of
populations and economic activity compound
these environmental pressures leading to
desertification.
Tackling the loss of human habitat is still
a pioneering field and is, in some cases,
practically cost-prohibitive. One livestock
management programme in Eritrea to protect
some 1,000 people from the worst effects
of desertification is estimated to cost USD 5
million for three years of protection.258 For sea-
level rise the costs can be even higher, but so
can the losses. Consider the USD 10 billion per
year cost that China already faces or the nearly
30% of GDP potential of Guinea-Bissau.
With expenses so high, the international
community may soon have to choose which
communities will be protected and which must
be relocated. Migration can be considered
a cost-effective adaptation tool where
habitat loss hits hardest. The cultural cost to
communities would be severe. Most of us today
simply cannot fathom the total relocation of
entire island or dry-region communities.
The most promising measures to counter
the effects of habitat loss are, overall, less
cost-effective than measures to manage other
climate-related problems, such as disease and
extreme weather.
The cost of habitat-loss intervention is typicallymeasured in the millions and often involves a
serious capital outlay that is not directly tied to
a private commercial concern. So the building of
a sea wall, the planting of trees, or the elevating
of key infrastructure by several metres is a
costly method of protecting populations and
their assets when compared to other measures
assessed in this report.259 Some of the cheapest
actions assessed here include a half million
dollar effort to conserve and restoration of
vegetative cover (such as dryland grasses) in
areas threatened by desertification and a 1
million dollar per-implementation programme
to restore mangrove forests in coastal areas.260 Upgrading drainage systems threatened by
coastal flooding, however, can cost USD 20 - 40
million.261 Despite such expenses, several studies
have documented that such actions are still cost-
effective compared to the potential losses.262
Just as desertification is caused by factors
other than climate change, the measures to
combat it also protect populations from wider
concerns.263 This is less true for actions that
address the effects of sea-level rise. In fact,
many measures in this area actually have
negative effects on the environment. Coastalbarriers, for example, reduce tidal flow from
the sea, trapping water inland and forcing more
salt into the soils of the littoral, rendering even
more land unfertile.264
Poor communities will rarely be able to access
the type of long-term, infrastructure-intensive
adaptation measures required to protect against
habitat loss. This means the worst-affected
communities are particularly dependent on
international assistance in order to adapt and
not be displaced from their homelands.
Scalability of habitat-loss programmes,
however, is made easier by the fact that such
programmes have typically been implemented
a number of times before, so technical
specifications and training programmes are
usually available.
Despite isolated good examples, however,
evidence indicates that most actions rate
low on cost-effectiveness. Interventions
are complex, and it’s dif ficult to make any
generalizations regarding the costs involved,
so effectiveness often needs to be assessedon a project-by-project basis. Several
implementation risks are also of concern,
such as extreme weather hazards to beach
extension/nourishment projects, or land-use
conflicts among local communities of farmers
and fishermen in cases of dryland restoration
programmes or mangrove plantation
efforts.265 More quantitative information
would help local policy-makers and
communities prioritize their efforts to adapt to
desertification and sea-level rise.
THE REVIEW
IF MEASURES ARE IMPLEMENTED ADEQUATELY,A NUMBER OF PROGRAMMES WILL CONTINUETO DELIVER BENEFITS FOR DECADES TO COME
MEASURES TO COMBATDESERTIFICATION ALSO PROTECTPOPULATIONS FROM WIDER CONCERNS
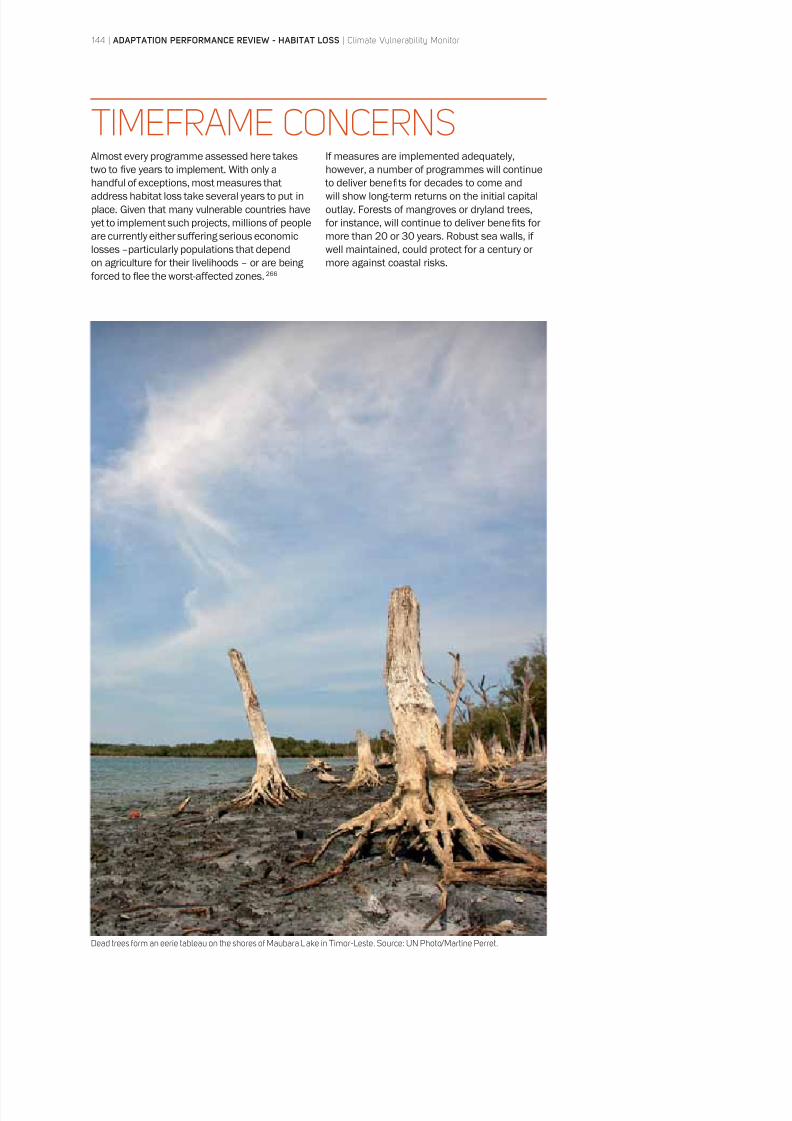
8/8/2019 Climate Vulnerability Monitor 2010: The State of the Climate Crisis
http://slidepdf.com/reader/full/climate-vulnerability-monitor-2010-the-state-of-the-climate-crisis 146/291
Almost every programme assessed here takes
two to five years to implement. With only a
handful of exceptions, most measures that
address habitat loss take several years to put in
place. Given that many vulnerable countries have
yet to implement such projects, millions of people
are currently either suffering serious economic
losses –particularly populations that depend
on agriculture for their livelihoods – or are being
forced to flee the worst-affected zones.266
If measures are implemented adequately,
however, a number of programmes will continue
to deliver benefi ts for decades to come and
will show long-term returns on the initial capital
outlay. Forests of mangroves or dryland trees,
for instance, will continue to deliver benefi ts for
more than 20 or 30 years. Robust sea walls, if
well maintained, could protect for a century or
more against coastal risks.
TIMEFRAME CONCERNS
Dead trees form an eerie tableau on the shores of Maubara Lake in Timor-Leste. Source: UN Photo/Martine Perret.
144 | ADAPTATION PERFORMANCE REVIEW - HABITAT LOSS | Climate Vulnerability Monitor
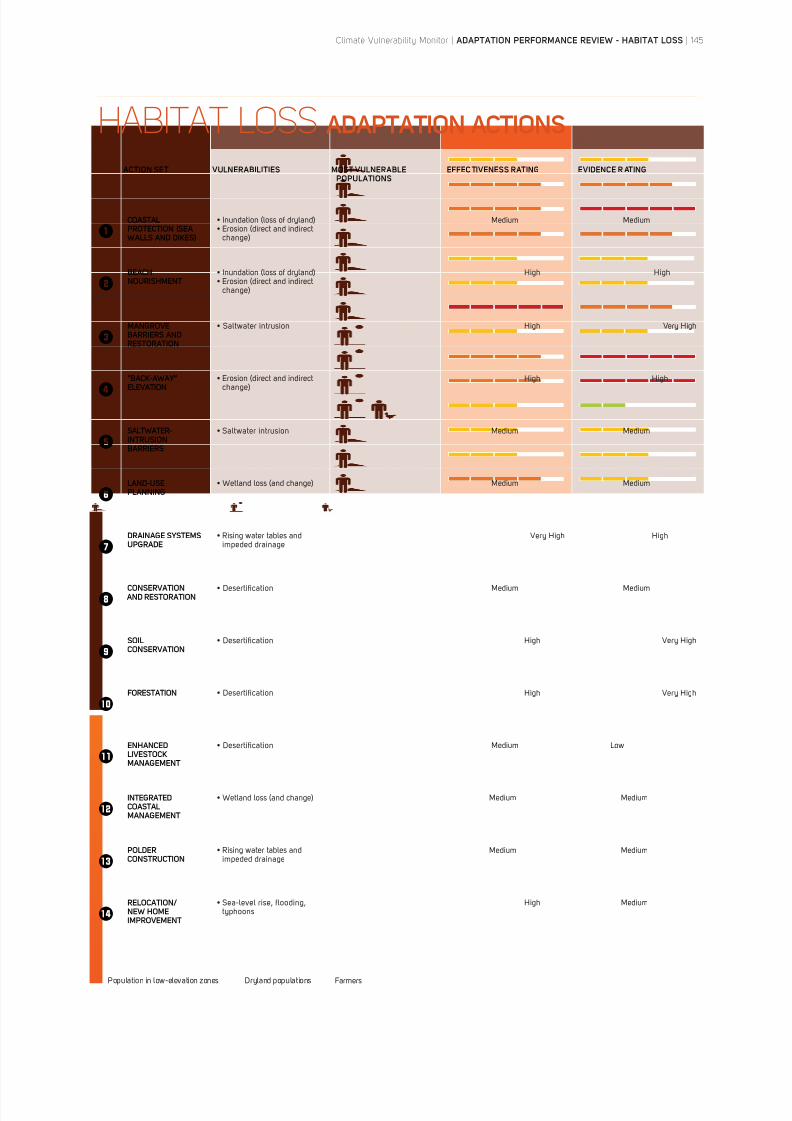
8/8/2019 Climate Vulnerability Monitor 2010: The State of the Climate Crisis
http://slidepdf.com/reader/full/climate-vulnerability-monitor-2010-the-state-of-the-climate-crisis 147/291
HABITAT LOSS ADAPTATION ACTIONS
ACTION SET VULNERABILITIES MOST VULNERABLE
POPULATIONS
EFFEC TIVENESS RATING EVIDENCE R ATING
COASTALPROTECTION (SEA
WALLS AND DIKES)
Medium Medium
BEACHNOURISHMENT
High High
MANGROVEBARRIERS ANDRESTORATION
High Very High
”BACK-AWAY”ELEVATION
High High
SALTWATER-INTRUSIONBARRIERS
Medium Medium
LAND-USEPLANNING
Medium Medium
DRAINAGE SYSTEMSUPGRADE
impeded drainage
Very High High
CONSERVATION
AND RESTORATION Medium Medium
SOILCONSERVATION
High Very High
FORESTATION High Very High
ENHANCEDLIVESTOCKMANAGEMENT
Medium
INTEGRATEDCOASTALMANAGEMENT
Medium Medium
POLDERCONSTRUCTION
impeded drainage
Medium Medium
RELOCATION/NEW HOMEIMPROVEMENT
typhoons
High Medium
Farmers
Climate Vulnerability Monitor | ADAPTATION PERFORMANCE REVIEW - HABITAT LOSS | 145
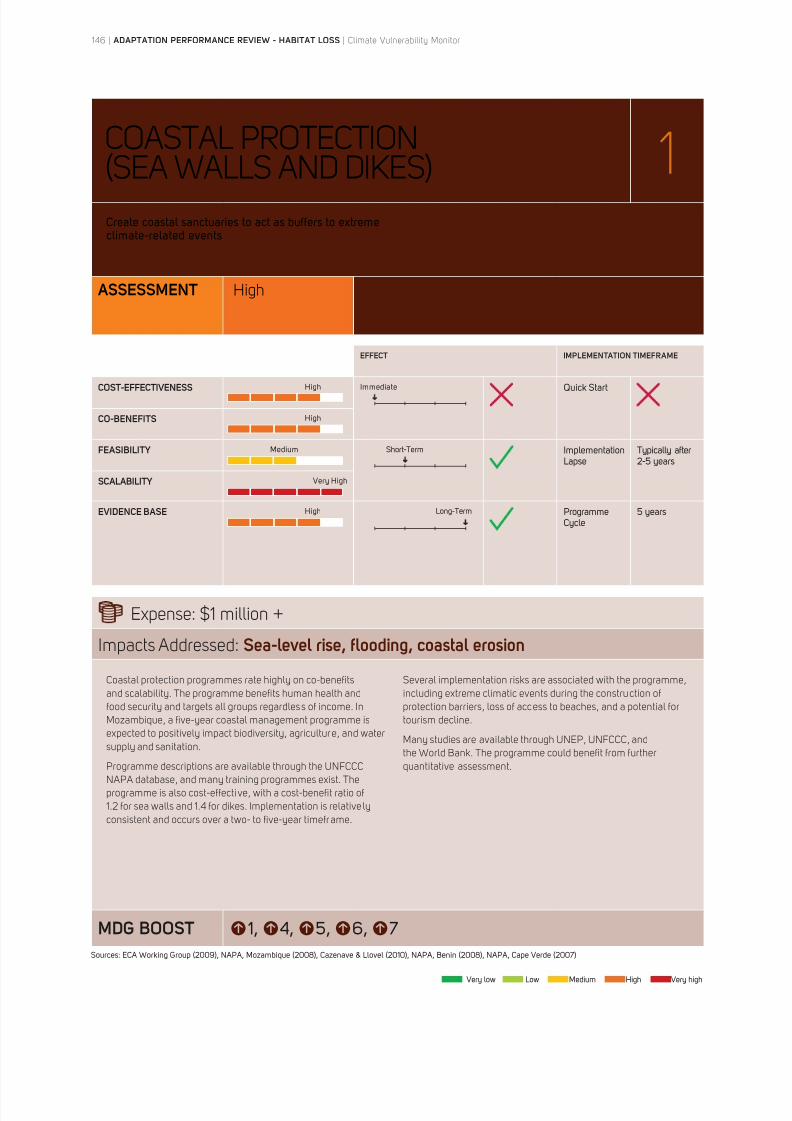
8/8/2019 Climate Vulnerability Monitor 2010: The State of the Climate Crisis
http://slidepdf.com/reader/full/climate-vulnerability-monitor-2010-the-state-of-the-climate-crisis 148/291
COASTAL PROTECTION
(SEA WALLS AND DIKES) 1
ASSESSMENT High
EFFECT IMPLEMENTATION TIMEFRAME
COST-EFFECTIVENESS High Immediate Quick Start
CO-BENEFITS High
FEASIBILITY Medium ImplementationLapse
Typically after
SCALABILITY Very High
EVIDENCE BASE High ProgrammeCycle
Expense: $1 million +
Impacts Addressed: Sea-level rise, flooding, coastal erosion
MDG BOOST 7
Coastal protection programmes rate highly on co-benefits
and scalability. The programme benefits human health and
food security and targets all groups regardless of income. In
Mozambique, a five-year coastal management programme is
expected to positively impact biodiversity, agriculture, and water
supply and sanitation.
Programme descriptions are available through the UNFCCC
NAPA database, and many training programmes exist. The
programme is also cost-effective, with a cost-benefit ratio of
1.2 for sea walls and 1.4 for dikes. Implementation is relative ly
consistent and occurs over a two- to five-year timeframe.
Several implementation risks are associated with the programme,
including extreme climatic events during the construction of
protection barriers, loss of access to beaches, and a potential for
tourism decline.
Many studies are available through UNEP, UNFCCC, and
the World Bank. The programme could benefit from further
quantitative assessment.
146 | ADAPTATION PERFORMANCE REVIEW - HABITAT LOSS | Climate Vulnerability Monitor
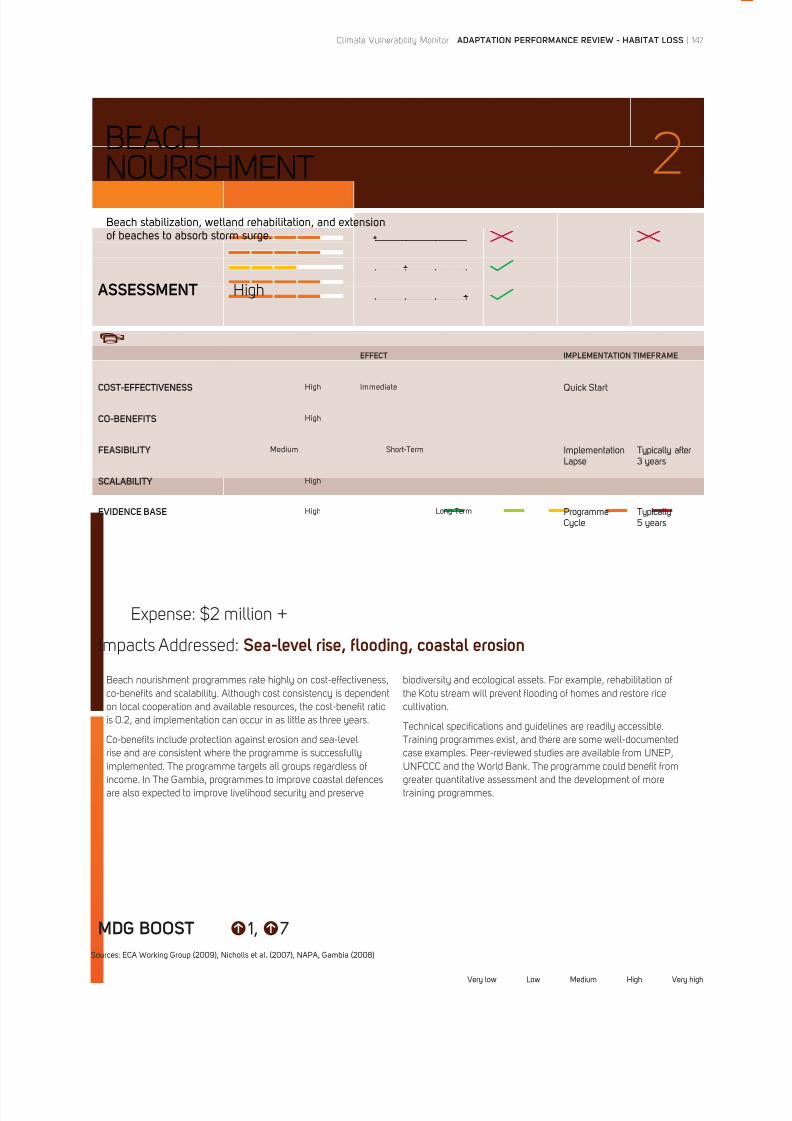
8/8/2019 Climate Vulnerability Monitor 2010: The State of the Climate Crisis
http://slidepdf.com/reader/full/climate-vulnerability-monitor-2010-the-state-of-the-climate-crisis 149/291
BEACH
NOURISHMENT 2
ASSESSMENT High
EFFECT IMPLEMENTATION TIMEFRAME
COST-EFFECTIVENESS High Immediate Quick Start
CO-BENEFITS High
FEASIBILITY Medium ImplementationLapse
Typically after3 years
SCALABILITY High
EVIDENCE BASE High ProgrammeCycle
Typically
Expense: $2 million +
Impacts Addressed: Sea-level rise, flooding, coastal erosion
MDG BOOST 7
Beach nourishment programmes rate highly on cost-effectiveness,
co-benefits and scalability. Although cost consistency is dependent
on local cooperation and available resources, the cost-benefit ratio
is 0.2, and implementation can occur in as little as three years.
Co-benefits include protection against erosion and sea-level
rise and are consistent where the programme is successfully
implemented. The programme targets all groups regardless of
income. In The Gambia, programmes to improve coastal defences
are also expected to improve livelihood security and preserve
biodiversity and ecological assets. For example, rehabilitation of
the Kotu stream will prevent flooding of homes and restore rice
cultivation.
Technical specifications and guidelines are readily accessible.
Training programmes exist, and there are some well-documented
case examples. Peer-reviewed studies are available from UNEP,
UNFCCC and the World Bank. The programme could benefit from
greater quantitative assessment and the development of more
training programmes.
Climate Vulnerability Monitor | ADAPTATION PERFORMANCE REVIEW - HABITAT LOSS | 147
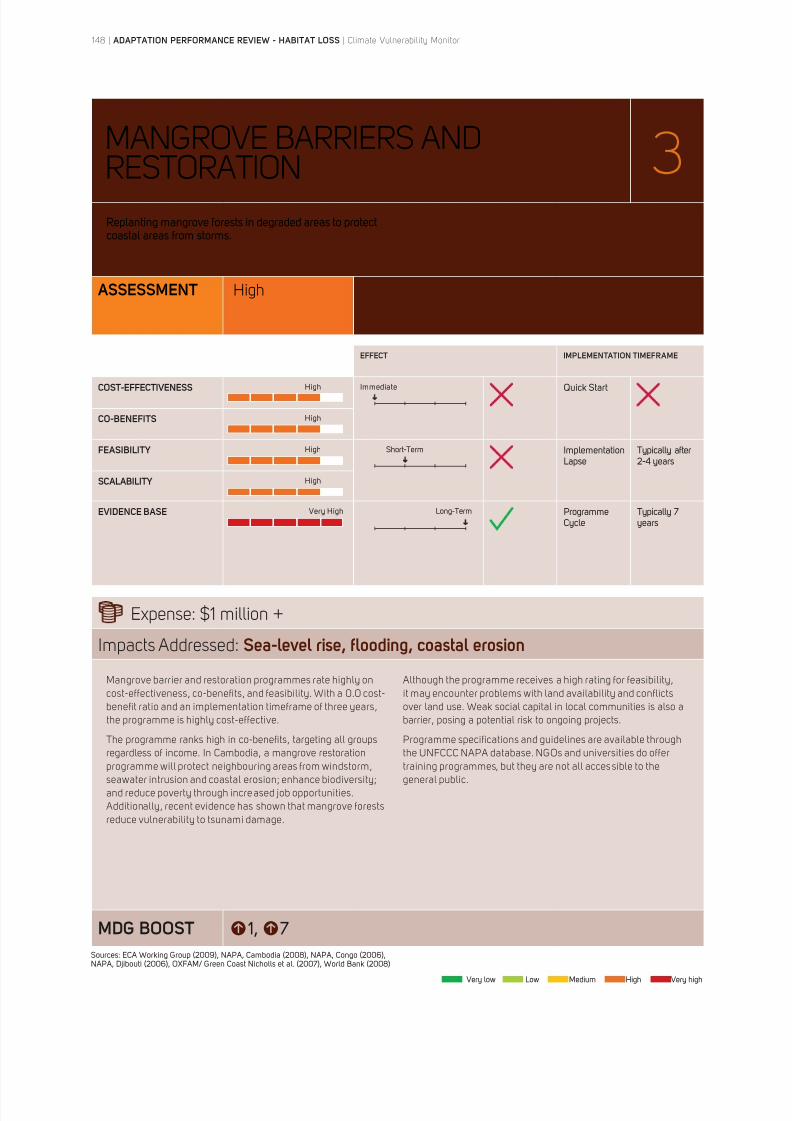
8/8/2019 Climate Vulnerability Monitor 2010: The State of the Climate Crisis
http://slidepdf.com/reader/full/climate-vulnerability-monitor-2010-the-state-of-the-climate-crisis 150/291
MANGROVE BARRIERS AND
RESTORATION 3
ASSESSMENT High
EFFECT IMPLEMENTATION TIMEFRAME
COST-EFFECTIVENESS High Immediate Quick Start
CO-BENEFITS High
FEASIBILITY High ImplementationLapse
Typically after
SCALABILITY High
EVIDENCE BASE Very High ProgrammeCycle
Typically 7years
Expense: $1 million +
Impacts Addressed: Sea-level rise, flooding, coastal erosion
MDG BOOST 7
Replanting mangrove forests in degraded areas to protect
Mangrove barrier and restoration programmes rate highly on
cost-effectiveness, co-benefits, and feasibility. With a 0.0 cost-
benefit ratio and an implementation timeframe of three years,
the programme is highly cost-effective.
The programme ranks high in co-benefits, targeting all groups
regardless of income. In Cambodia, a mangrove restoration
programme will protect neighbouring areas from windstorm,
seawater intrusion and coastal erosion; enhance biodiversity;
and reduce poverty through increased job opportunities.
Additionally, recent evidence has shown that mangrove forests
reduce vulnerability to tsunami damage.
Although the programme receives a high rating for feasibility,
it may encounter problems with land availability and conflicts
over land use. Weak social capital in local communities is also a
barrier, posing a potential risk to ongoing projects.
Programme specifications and guidelines are available through
the UNFCCC NAPA database. NGOs and universities do offer
training programmes, but they are not all acces sible to the
general public.
148 | ADAPTATION PERFORMANCE REVIEW - HABITAT LOSS | Climate Vulnerability Monitor
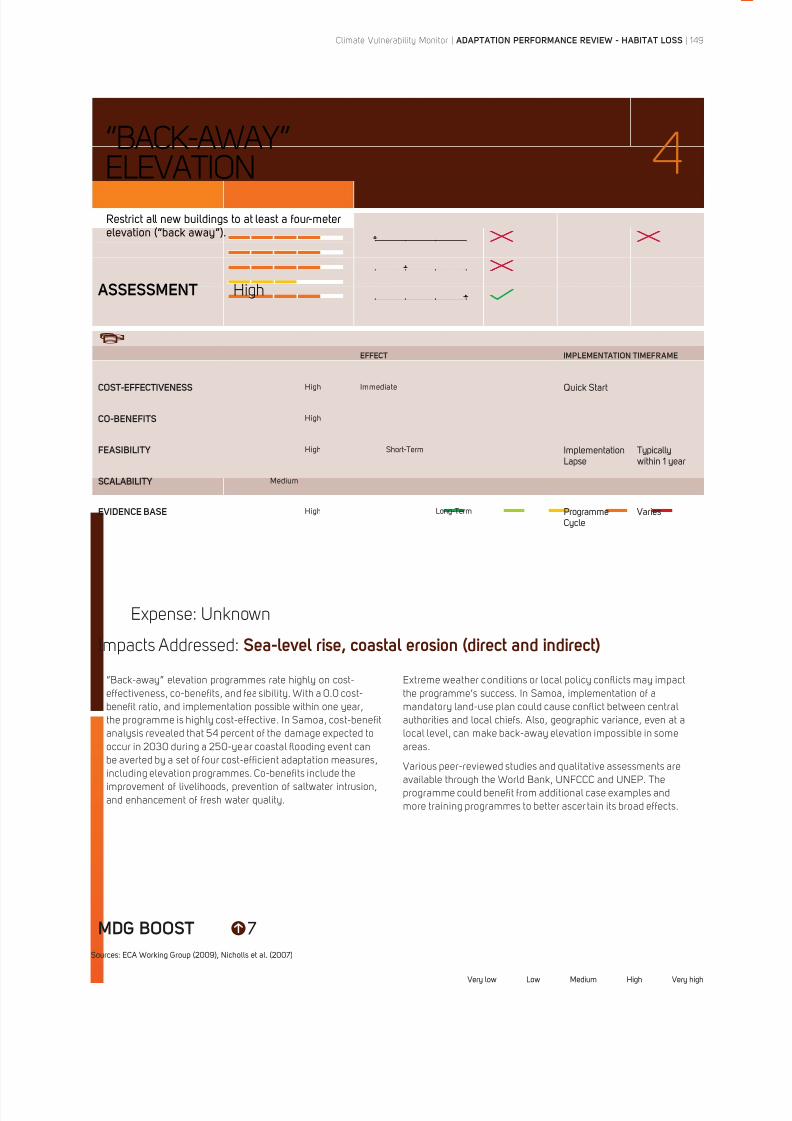
8/8/2019 Climate Vulnerability Monitor 2010: The State of the Climate Crisis
http://slidepdf.com/reader/full/climate-vulnerability-monitor-2010-the-state-of-the-climate-crisis 151/291
“BACK-AWAY”
ELEVATION 4
ASSESSMENT High
EFFECT IMPLEMENTATION TIMEFRAME
COST-EFFECTIVENESS High Immediate Quick Start
CO-BENEFITS High
FEASIBILITY High ImplementationLapse
Typically
SCALABILITY Medium
EVIDENCE BASE High ProgrammeCycle
Varies
Expense: Unknown
Impacts Addressed: Sea-level rise, coastal erosion (direct and indirect)
MDG BOOST 7
“Back-away” elevation programmes rate highly on cost-
effectiveness, co-benefits, and fea sibility. With a 0.0 cost-
benefit ratio, and implementation possible within one year,
the programme is highly cost-effective. In Samoa, cost-benefit
analysis revealed that 54 percent of the damage expected to
occur in 2030 during a 250-year coastal flooding event can
be averted by a set of four cost-efficient adaptation measures,
including elevation programmes. Co-benefits include the
improvement of livelihoods, prevention of saltwater intrusion,
and enhancement of fresh water quality.
Extreme weather conditions or local policy conflicts may impact
the programme’s success. In Samoa, implementation of a
mandatory land-use plan could cause conflict between central
authorities and local chiefs. Also, geographic variance, even at a
local level, can make back-away elevation impossible in some
areas.
Various peer-reviewed studies and qualitative assessments are
available through the World Bank, UNFCCC and UNEP. The
programme could benefit from additional case examples and
more training programmes to better ascer tain its broad effects.
Climate Vulnerability Monitor | ADAPTATION PERFORMANCE REVIEW - HABITAT LOSS | 149
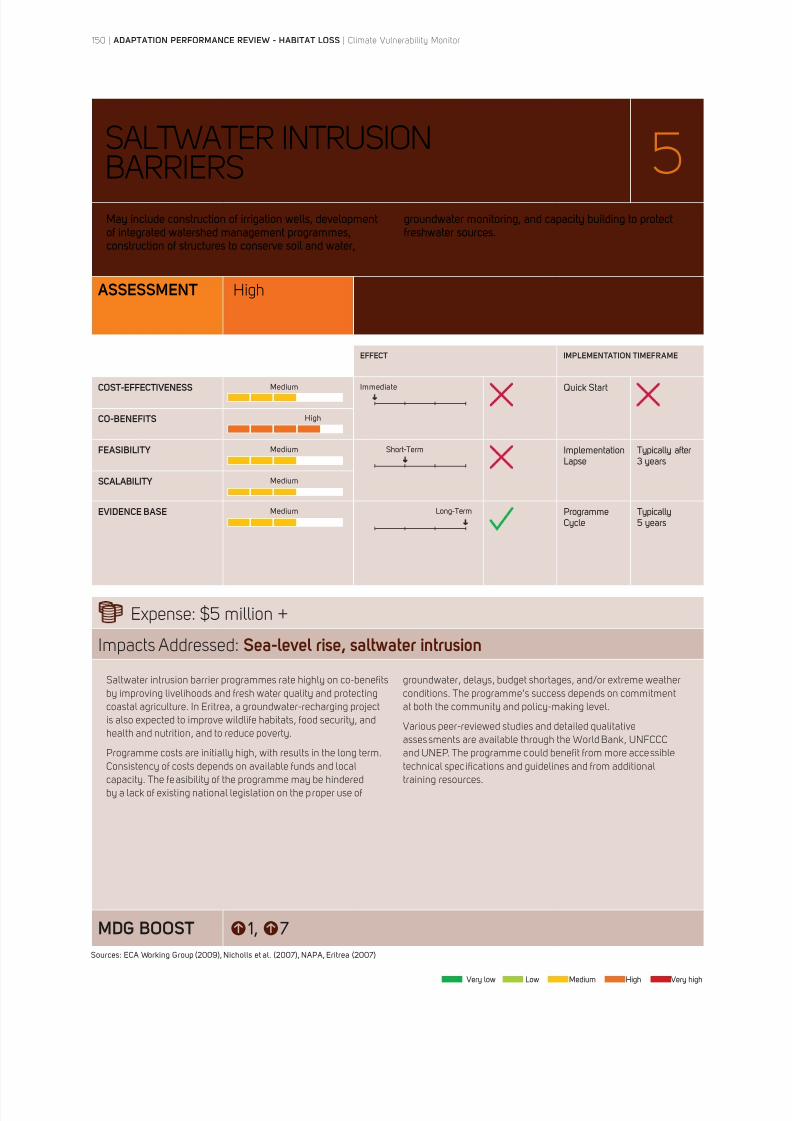
8/8/2019 Climate Vulnerability Monitor 2010: The State of the Climate Crisis
http://slidepdf.com/reader/full/climate-vulnerability-monitor-2010-the-state-of-the-climate-crisis 152/291
SALTWATER INTRUSION
BARRIERS 5
ASSESSMENT High
EFFECT IMPLEMENTATION TIMEFRAME
COST-EFFECTIVENESS Medium Immediate Quick Start
CO-BENEFITS High
FEASIBILITY Medium ImplementationLapse
Typically after3 years
SCALABILITY Medium
EVIDENCE BASE Medium ProgrammeCycle
Typically
Expense: $5 million +
Impacts Addressed: Sea-level rise, saltwater intrusion
MDG BOOST 7
Saltwater intrusion barrier programmes rate highly on co-benefits
by improving livelihoods and fresh water quality and protecting
coastal agriculture. In Eritrea, a groundwater-recharging project
is also expected to improve wildlife habitats, food security, and
health and nutrition, and to reduce poverty.
Programme costs are initially high, with results in the long term.
Consistency of costs depends on available funds and local
capacity. The feasibility of the programme may be hindered
by a lack of existing national legislation on the proper use of
groundwater, delays, budget shortages, and/or extreme weather
conditions. The programme’s success depends on commitment
at both the community and policy-making level.
Various peer-reviewed studies and detailed qualitative
asses sments are available through the World Bank, UNFCCC
and UNEP. The programme could benefit from more accessible
technical spec ifications and guidelines and from additional
training resources.
150 | ADAPTATION PERFORMANCE REVIEW - HABITAT LOSS | Climate Vulnerability Monitor
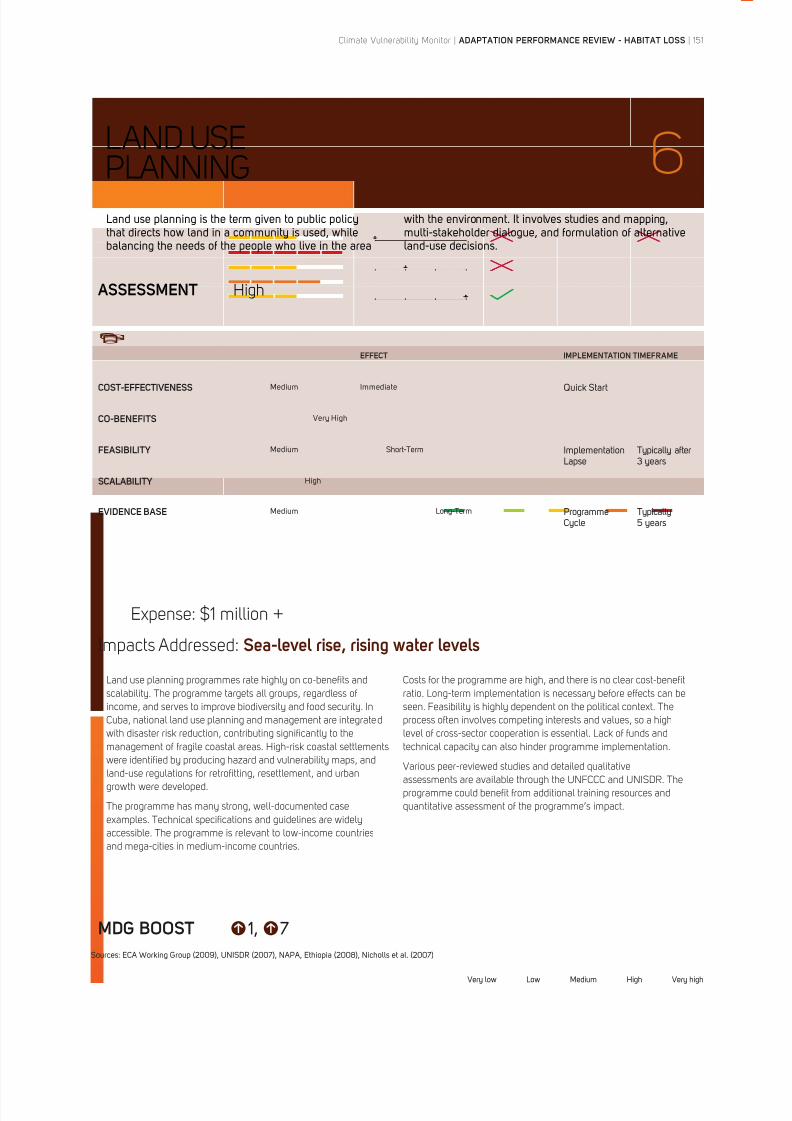
8/8/2019 Climate Vulnerability Monitor 2010: The State of the Climate Crisis
http://slidepdf.com/reader/full/climate-vulnerability-monitor-2010-the-state-of-the-climate-crisis 153/291
LAND USE
PLANNING 6
ASSESSMENT High
EFFECT IMPLEMENTATION TIMEFRAME
COST-EFFECTIVENESS Medium Immediate Quick Start
CO-BENEFITS Very High
FEASIBILITY Medium ImplementationLapse
Typically after3 years
SCALABILITY High
EVIDENCE BASE Medium ProgrammeCycle
Typically
Expense: $1 million +
Impacts Addressed: Sea-level rise, rising water levels
MDG BOOST 7
Land use planning programmes rate highly on co-benefits and
scalability. The programme targets all groups, regardless of
income, and serves to improve biodiversity and food security. In
Cuba, national land use planning and management are integrated
with disaster risk reduction, contributing significantly to the
management of fragile coastal areas. High-risk coastal settlements
were identified by producing hazard and vulnerability maps, and
land-use regulations for retrofitting, resettlement, and urban
growth were developed.
The programme has many strong, well-documented case
examples. Technical specifications and guidelines are widely
accessible. The programme is relevant to low-income countries
and mega-cities in medium-income countries.
Costs for the programme are high, and there is no clear cost-benefit
ratio. Long-term implementation is necessary before effects can be
seen. Feasibility is highly dependent on the political context. The
process often involves competing interests and values, so a high
level of cross-sector cooperation is essential. Lack of funds and
technical capacity can also hinder programme implementation.
Various peer-reviewed studies and detailed qualitative
assessments are available through the UNFCCC and UNISDR. The
programme could benefit from additional training resources and
quantitative assessment of the programme’s impact.
Climate Vulnerability Monitor | ADAPTATION PERFORMANCE REVIEW - HABITAT LOSS | 151
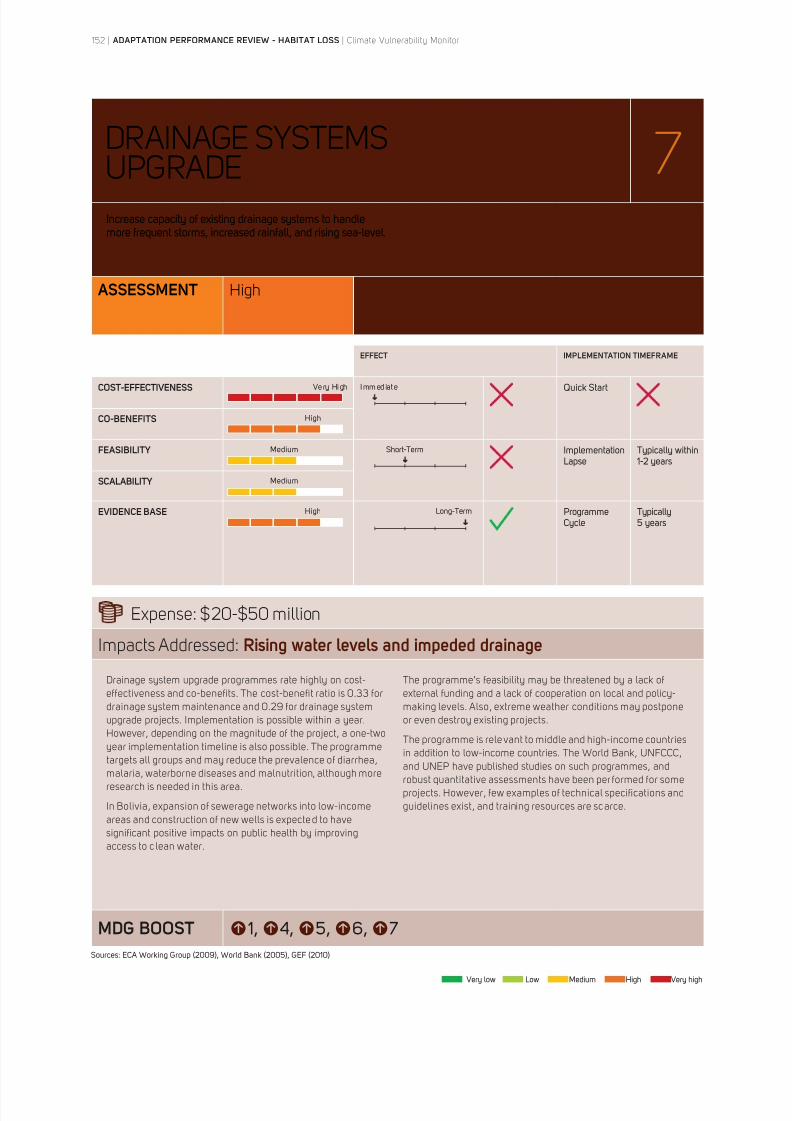
8/8/2019 Climate Vulnerability Monitor 2010: The State of the Climate Crisis
http://slidepdf.com/reader/full/climate-vulnerability-monitor-2010-the-state-of-the-climate-crisis 154/291
DRAINAGE SYSTEMS
UPGRADE 7
ASSESSMENT High
EFFECT IMPLEMENTATION TIMEFRAME
COST-EFFECTIVENESS Very High Immediate Quick Start
CO-BENEFITS High
FEASIBILITY Medium ImplementationLapse
SCALABILITY Medium
EVIDENCE BASE High ProgrammeCycle
Typically
Expense: $20-$50 million
Impacts Addressed: Rising water levels and impeded drainage
MDG BOOST 7
Drainage system upgrade programmes rate highly on cost-
effectiveness and co-benefits. The cost-benefit ratio is 0.33 for
drainage system maintenance and 0.29 for drainage system
upgrade projects. Implementation is possible within a year.
However, depending on the magnitude of the project, a one-two
year implementation timeline is also possible. The programme
targets all groups and may reduce the prevalence of diarrhea,
malaria, waterborne diseases and malnutrition, although more
research is needed in this area.
In Bolivia, expansion of sewerage networks into low-income
areas and construction of new wells is expected to have
significant positive impacts on public health by improving
access to c lean water.
The programme’s feasibility may be threatened by a lack of
external funding and a lack of cooperation on local and policy-
making levels. Also, extreme weather conditions may postpone
or even destroy existing projects.
The programme is relevant to middle and high-income countries
in addition to low-income countries. The World Bank, UNFCCC,
and UNEP have published studies on such programmes, and
robust quantitative assessments have been per formed for some
projects. However, few examples of technical specifications and
guidelines exist, and training resources are scarce.
152 | ADAPTATION PERFORMANCE REVIEW - HABITAT LOSS | Climate Vulnerability Monitor
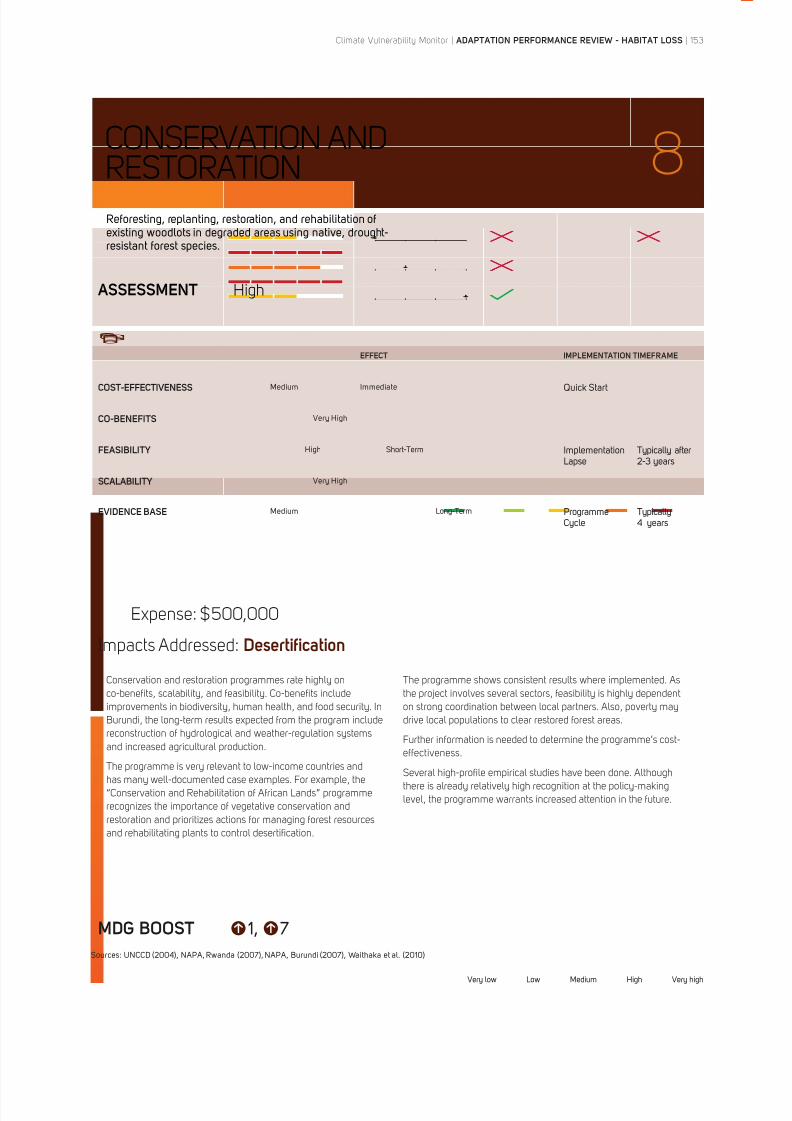
8/8/2019 Climate Vulnerability Monitor 2010: The State of the Climate Crisis
http://slidepdf.com/reader/full/climate-vulnerability-monitor-2010-the-state-of-the-climate-crisis 155/291
CONSERVATION AND
RESTORATION 8
ASSESSMENT High
EFFECT IMPLEMENTATION TIMEFRAME
COST-EFFECTIVENESS Medium Immediate Quick Start
CO-BENEFITS Very High
FEASIBILITY High ImplementationLapse
Typically after
SCALABILITY Very High
EVIDENCE BASE Medium ProgrammeCycle
Typically4 years
Expense: $500,000
Impacts Addressed: Desertification
MDG BOOST 7
Conservation and restoration programmes rate highly on
co-benefits, scalability, and feasibility. Co-benefits include
improvements in biodiversity, human health, and food security. In
Burundi, the long-term results expected from the program include
reconstruction of hydrological and weather-regulation systems
and increased agricultural production.
The programme is very relevant to low-income countries and
has many well-documented case examples. For example, the
“Conservation and Rehabilitation of African Lands” programme
recognizes the importance of vegetative conservation and
restoration and prioritizes actions for managing forest resources
and rehabilitating plants to control desertification.
The programme shows consistent results where implemented. As
the project involves several sectors, feasibility is highly dependent
on strong coordination between local partners. Also, poverty may
drive local populations to clear restored forest areas.
Further information is needed to determine the programme’s cost-
effectiveness.
Several high-profile empirical studies have been done. Although
there is already relatively high recognition at the policy-making
level, the programme warrants increased attention in the future.
Climate Vulnerability Monitor | ADAPTATION PERFORMANCE REVIEW - HABITAT LOSS | 153

8/8/2019 Climate Vulnerability Monitor 2010: The State of the Climate Crisis
http://slidepdf.com/reader/full/climate-vulnerability-monitor-2010-the-state-of-the-climate-crisis 156/291
SOIL
CONSERVATION 9
ASSESSMENT High
EFFECT IMPLEMENTATION TIMEFRAME
COST-EFFECTIVENESS High Immediate Quick Start
CO-BENEFITS High
FEASIBILITY Medium ImplementationLapse
Typically after
SCALABILITY Medium
EVIDENCE BASE Very High ProgrammeCycle
Typically
Expense: $1 million +
Impacts Addressed: Desertification
MDG BOOST 7
Soil conservation programmes rate highly on cost-effectiveness
and co-benefits.
The cost-benefit ratio of the project is -0.2. Co-benefits includeimprovement of infrastructure and protection against floods. In
Rwanda, the programme is also expected to stem migration of
populations in search of suitable land for agriculture.
The programme is highly relevant to low-income countries.
Awareness programs, education, and training in resource use
addressed to farmers, local offices, and ministries of agriculture
have been developed. A few well-documented case examples
from Sub-Saharan Africa exist.
The amount of funding and technical expert ise available
may affect the programme’s feasibility. Also, land policy,
actual land occupancy, and complex farming practices may
hinder implementation. Several high-profile empirical studies
are available, and there is relatively high recognition for the
programme, but more attention is needed in the future.
154 | ADAPTATION PERFORMANCE REVIEW - HABITAT LOSS | Climate Vulnerability Monitor
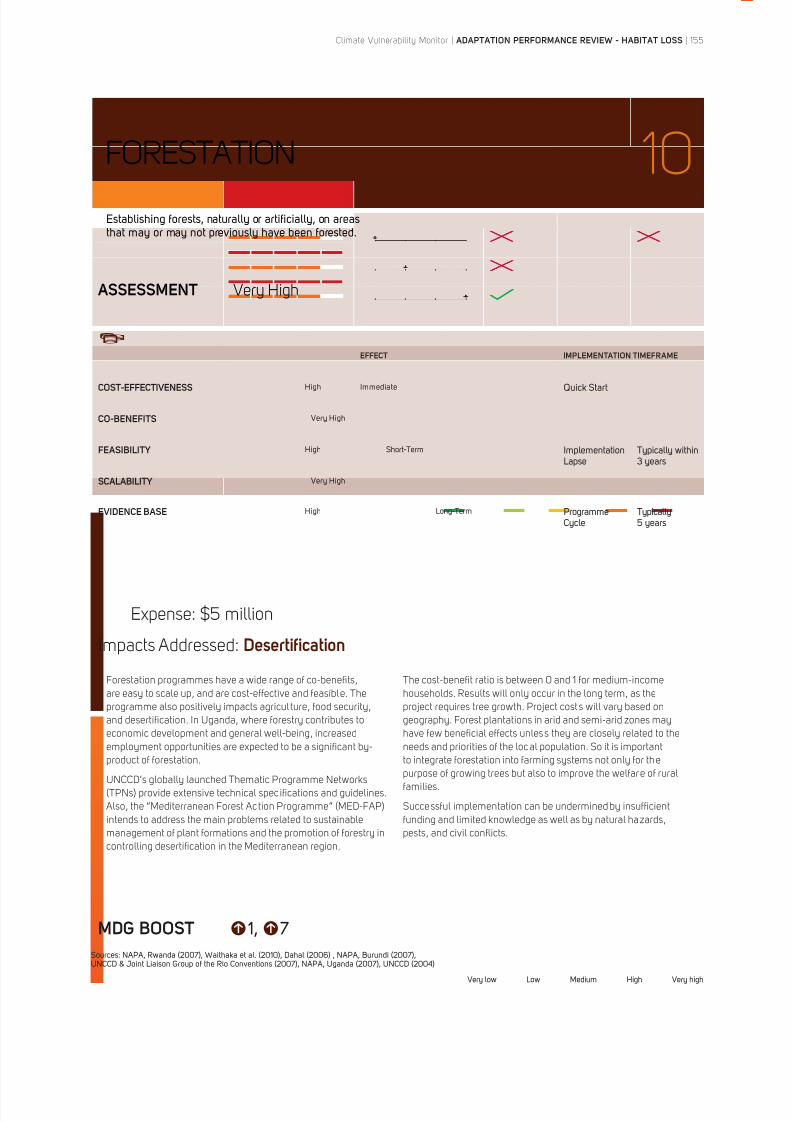
8/8/2019 Climate Vulnerability Monitor 2010: The State of the Climate Crisis
http://slidepdf.com/reader/full/climate-vulnerability-monitor-2010-the-state-of-the-climate-crisis 157/291
FORESTATION
10
ASSESSMENT Very High
EFFECT IMPLEMENTATION TIMEFRAME
COST-EFFECTIVENESS High Immediate Quick Start
CO-BENEFITS Very High
FEASIBILITY High ImplementationLapse
3 years
SCALABILITY Very High
EVIDENCE BASE High ProgrammeCycle
Typically
Expense: $5 million
Impacts Addressed: Desertification
MDG BOOST 7
Forestation programmes have a wide range of co-benefits,
are easy to scale up, and are cost-effective and feasible. The
programme also positively impacts agricul ture, food security,
and desertification. In Uganda, where forestry contributes to
economic development and general well-being, increased
employment opportunities are expected to be a significant by-
product of forestation.
UNCCD’s globally launched Thematic Programme Networks
(TPNs) provide extensive technical spec ifications and guidelines.
Also, the “Mediterranean Forest Action Programme” (MED-FAP)
intends to address the main problems related to sustainable
management of plant formations and the promotion of forestry in
controlling desertification in the Mediterranean region.
The cost-benefit ratio is between 0 and 1 for medium-income
households. Results will only occur in the long term, as the
project requires tree growth. Project costs will vary based on
geography. Forest plantations in arid and semi-arid zones may
have few beneficial effects unless they are closely related to the
needs and priorities of the local population. So it is important
to integrate forestation into farming systems not only for the
purpose of growing trees but also to improve the welfare of rural
families.
Successful implementation can be undermined by insufficient
funding and limited knowledge as well as by natural hazards,
pests, and civil conflicts.
Climate Vulnerability Monitor | ADAPTATION PERFORMANCE REVIEW - HABITAT LOSS | 155
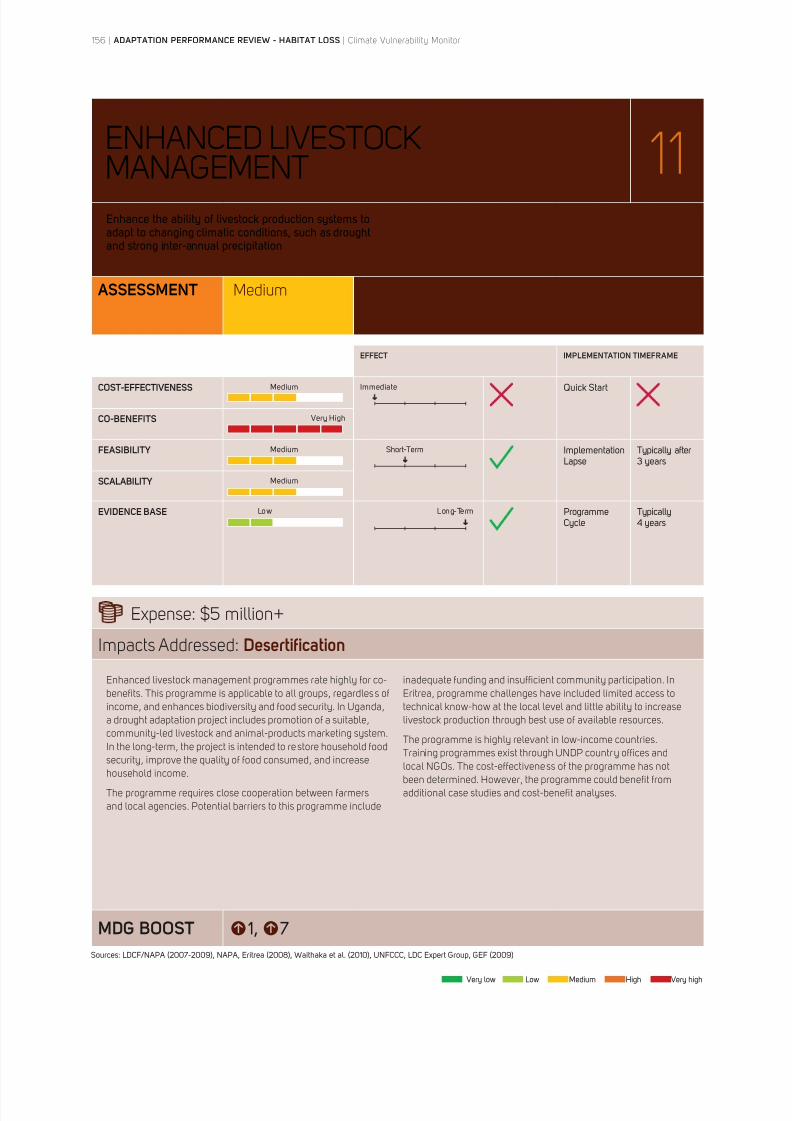
8/8/2019 Climate Vulnerability Monitor 2010: The State of the Climate Crisis
http://slidepdf.com/reader/full/climate-vulnerability-monitor-2010-the-state-of-the-climate-crisis 158/291
ENHANCED LIVESTOCK
MANAGEMENT 11
ASSESSMENT Medium
EFFECT IMPLEMENTATION TIMEFRAME
COST-EFFECTIVENESS Medium Immediate Quick Start
CO-BENEFITS Very High
FEASIBILITY Medium ImplementationLapse
Typically after3 years
SCALABILITY Medium
EVIDENCE BASE ProgrammeCycle
Typically4 years
Expense: $5 million+
Impacts Addressed: Desertification
MDG BOOST 7
Enhanced livestock management programmes rate highly for co-
benefits. This programme is applicable to all groups, regardless of
income, and enhances biodiversity and food security. In Uganda,
a drought adaptation project includes promotion of a suitable,
community-led livestock and animal-products marketing system.
In the long-term, the project is intended to restore household food
security, improve the quality of food consumed, and increase
household income.
The programme requires close cooperation between farmers
and local agencies. Potential barriers to this programme include
inadequate funding and insufficient community participation. In
Eritrea, programme challenges have included limited access to
technical know-how at the local level and little ability to increase
livestock production through best use of available resources.
The programme is highly relevant in low-income countries.
Training programmes exist through UNDP country offices and
local NGOs. The cost-effectiveness of the programme has not
been determined. However, the programme could benefit from
additional case studies and cost-benefit analyses.
156 | ADAPTATION PERFORMANCE REVIEW - HABITAT LOSS | Climate Vulnerability Monitor
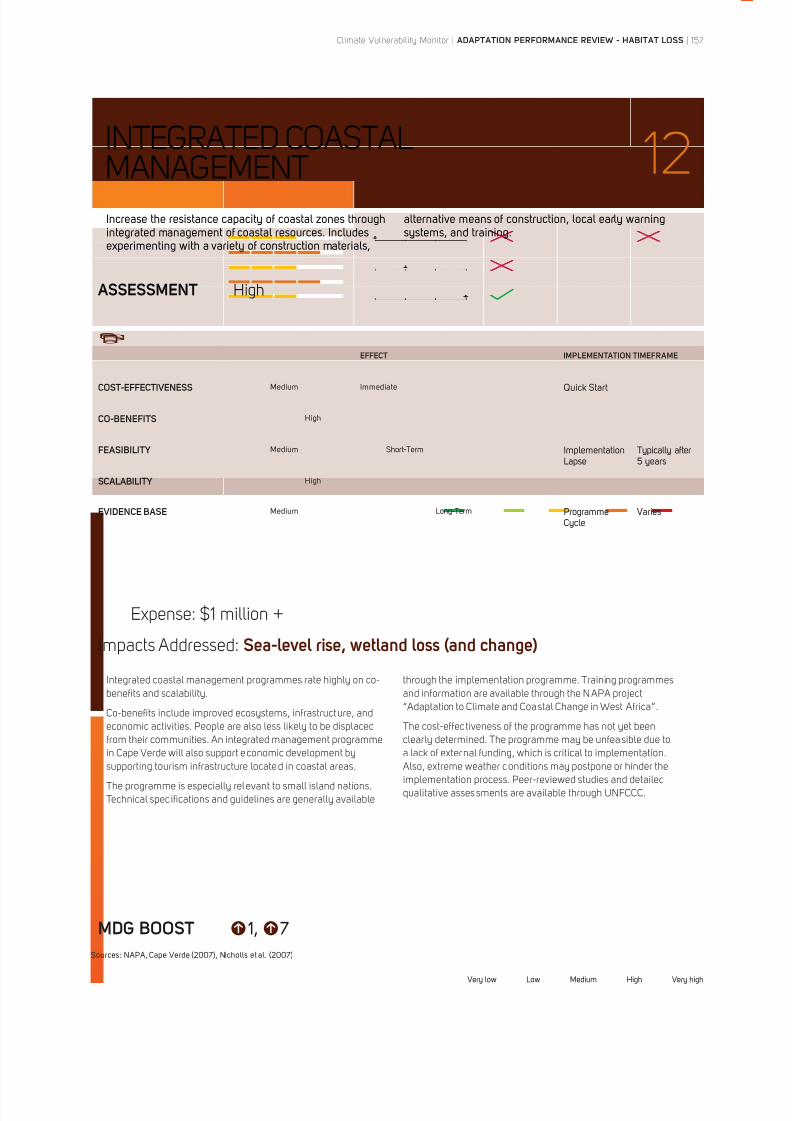
8/8/2019 Climate Vulnerability Monitor 2010: The State of the Climate Crisis
http://slidepdf.com/reader/full/climate-vulnerability-monitor-2010-the-state-of-the-climate-crisis 159/291
INTEGRATED COASTAL
MANAGEMENT 12
ASSESSMENT High
EFFECT IMPLEMENTATION TIMEFRAME
COST-EFFECTIVENESS Medium Immediate Quick Start
CO-BENEFITS High
FEASIBILITY Medium ImplementationLapse
Typically after
SCALABILITY High
EVIDENCE BASE Medium ProgrammeCycle
Varies
Expense: $1 million +
Impacts Addressed: Sea-level rise, wetland loss (and change)
MDG BOOST 7
Integrated coastal management programmes rate highly on co-
benefits and scalability.
Co-benefits include improved ecosystems, infrastructure, andeconomic activities. People are also less likely to be displaced
from their communities. An integrated management programme
in Cape Verde will also support economic development by
supporting tourism infrastructure located in coastal areas.
The programme is especially relevant to small island nations.
Technical spec ifications and guidelines are generally available
through the implementation programme. Training programmes
and information are available through the NAPA project
“Adaptation to Climate and Coastal Change in West Africa”.
The cost-effectiveness of the programme has not yet been
clearly determined. The programme may be unfeasible due to
a lack of external funding, which is critical to implementation.
Also, extreme weather conditions may postpone or hinder the
implementation process. Peer-reviewed studies and detailed
qualitative asses sments are available through UNFCCC.
Climate Vulnerability Monitor | ADAPTATION PERFORMANCE REVIEW - HABITAT LOSS | 157

8/8/2019 Climate Vulnerability Monitor 2010: The State of the Climate Crisis
http://slidepdf.com/reader/full/climate-vulnerability-monitor-2010-the-state-of-the-climate-crisis 160/291
POLDER
CONSTRUCTION 13
ASSESSMENT High
EFFECT IMPLEMENTATION TIMEFRAME
COST-EFFECTIVENESS High Immediate Quick Start
CO-BENEFITS High
FEASIBILITY Medium ImplementationLapse
Typically after3 years
SCALABILITY High
EVIDENCE BASE Medium ProgrammeCycle
Typically
Expense: $1 million +
Impacts Addressed: Rising water tables, Coastal inundation
MDG BOOST 7
Polder construction programmes rate highly on cost-
effectiveness, co-benefits and scalability. The project is
considered cost-effective and usually has a three-year
implementation timeframe. In addition to reducing flooding,
polder restoration projects improve and restore biodiversity and
human health and increase agricultural production.
Few technical guidelines are available for this programme.
Training programmes, however, are available through IPCC and
Caritas International. Roadblocks to successful programme
implementation include a lack of awareness at the community
and policy-making level and a lack of technical assistance and
tools. The programme is also sensitive to weather changes, such
as extreme sea-level rise or flooding. In Bangladesh, drainage
congestion due to sea-level rise and inundation has been
identified as a threat to polder performance.
Peer-reviewed studies and detailed qualitative assessments
are available through IPCC. The programme could benefit from
further cost-benefit analyses and increased awareness as well
as momentum to implement the programme in local and national
planning projects.
158 | ADAPTATION PERFORMANCE REVIEW - HABITAT LOSS | Climate Vulnerability Monitor
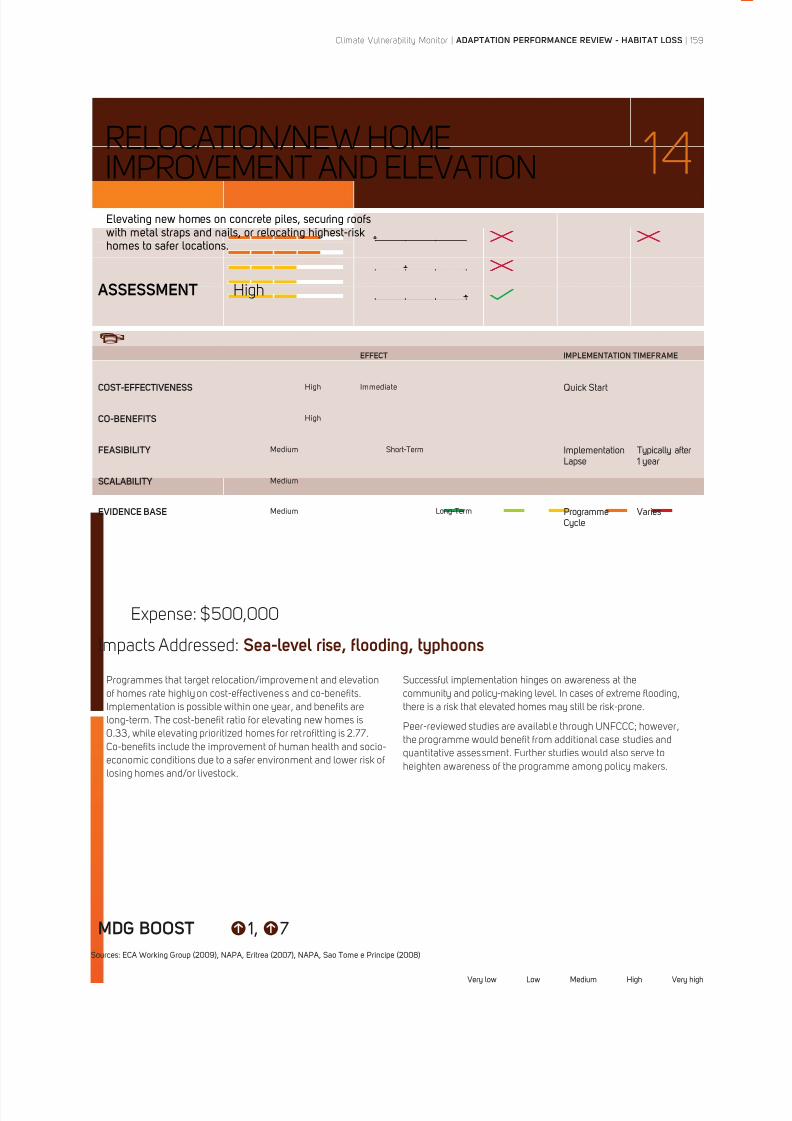
8/8/2019 Climate Vulnerability Monitor 2010: The State of the Climate Crisis
http://slidepdf.com/reader/full/climate-vulnerability-monitor-2010-the-state-of-the-climate-crisis 161/291
RELOCATION/NEW HOME
IMPROVEMENT AND ELEVATION 14
ASSESSMENT High
EFFECT IMPLEMENTATION TIMEFRAME
COST-EFFECTIVENESS High Immediate Quick Start
CO-BENEFITS High
FEASIBILITY Medium ImplementationLapse
Typically after1 year
SCALABILITY Medium
EVIDENCE BASE Medium ProgrammeCycle
Varies
Expense: $500,000
Impacts Addressed: Sea-level rise, flooding, typhoons
MDG BOOST 7
Programmes that target relocation/improvement and elevation
of homes rate highly on cost-effectivenes s and co-benefits.
Implementation is possible within one year, and benefits are
long-term. The cost-benefit ratio for elevating new homes is
0.33, while elevating prioritized homes for ret rofitting is 2.77.
Co-benefits include the improvement of human health and socio-
economic conditions due to a safer environment and lower risk of
losing homes and/or livestock.
Successful implementation hinges on awareness at the
community and policy-making level. In cases of extreme flooding,
there is a risk that elevated homes may still be risk-prone.
Peer-reviewed studies are available through UNFCCC; however,
the programme would benefit from additional case studies and
quantitative assessment. Further studies would also serve to
heighten awareness of the programme among policy makers.
Climate Vulnerability Monitor | ADAPTATION PERFORMANCE REVIEW - HABITAT LOSS | 159
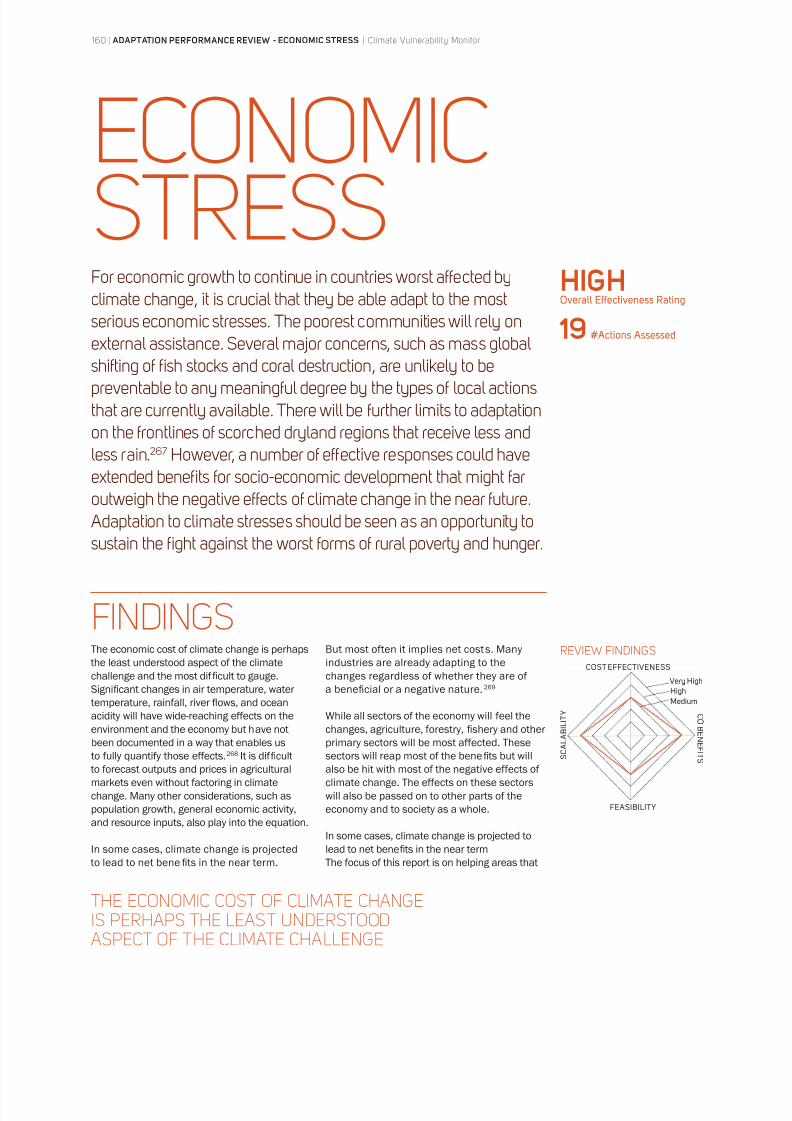
8/8/2019 Climate Vulnerability Monitor 2010: The State of the Climate Crisis
http://slidepdf.com/reader/full/climate-vulnerability-monitor-2010-the-state-of-the-climate-crisis 162/291
160 | ADAPTATION PERFORMANCE REVIEW - ECONOMIC STRESS | Climate Vulnerability Monitor
ECONOMICSTRESSFor economic growth to continue in countries worst affected byclimate change, it is crucial that they be able adapt to the mostserious economic stresses. The poorest communities will rely onexternal assistance. Several major concerns, such as mass globalshifting of fish stocks and coral destruction, are unlikely to bepreventable to any meaningful degree by the types of local actionsthat are currently available. There will be further limits to adaptationon the frontlines of scorched dryland regions that receive less andless rain.267 However, a number of effective responses could haveextended benefits for socio-economic development that might faroutweigh the negative effects of climate change in the near future.Adaptation to climate stresses should be seen as an opportunity tosustain the fight against the worst forms of rural poverty and hunger.
The economic cost of climate change is perhaps
the least understood aspect of the climate
challenge and the most dif ficult to gauge.
Significant changes in air temperature, water
temperature, rainfall, river flows, and ocean
acidity will have wide-reaching effects on theenvironment and the economy but have not
been documented in a way that enables us
to fully quantify those effects.268 It is dif ficult
to forecast outputs and prices in agricultural
markets even without factoring in climate
change. Many other considerations, such as
population growth, general economic activity,
and resource inputs, also play into the equation.
In some cases, climate change is projected
to lead to net benefi ts in the near term.
But most often it implies net costs. Many
industries are already adapting to the
changes regardless of whether they are of
a beneficial or a negative nature.269
While all sectors of the economy will feel thechanges, agriculture, forestry, fishery and other
primary sectors will be most affected. These
sectors will reap most of the benefi ts but will
also be hit with most of the negative effects of
climate change. The effects on these sectors
will also be passed on to other parts of the
economy and to society as a whole.
In some cases, climate change is projected to
lead to net benefi ts in the near term
The focus of this report is on helping areas that
FINDINGS
THE ECONOMIC COST OF CLIMATE CHANGEIS PERHAPS THE LEAST UNDERSTOODASPECT OF THE CLIMATE CHALLENGE
HIGH Overall Effectiveness Rating
19 #Actions Assessed
REVIEW FINDINGS
COST EFFECTIVENESS
S C A L A B I L I T Y
C O B E N E F I T S
FEASIBILITY
Very HighHigh
Medium
8/8/2019 Climate Vulnerability Monitor 2010: The State of the Climate Crisis
http://slidepdf.com/reader/full/climate-vulnerability-monitor-2010-the-state-of-the-climate-crisis 163/291
Climate Vulnerability Monitor | ADAPTATION PERFORMANCE REVIEW - ECONOMIC STRESS | 161
will face the negative impacts of climate change
to minimize those risks, not to advise economies
profi ting from climate change (those in the
far north or south) on how to better reap the
benefi ts. It is not within the scope of this report,
however, to document all possible responses to
all possible negative impacts. When assessing
the economic stresses caused by climate
change, the serious effects being felt by high-
altitude or high-latitude communities due to
thawing permafrost, for example, have not been
taken into account. As once permanently frozen
land thaws, all manner of infrastructure, from
roads and bridges to homes and electricity
grids, become destabilized and unsafe. The
associated adaptation costs are overwhelming
on a local basis. The cost of moving just one
small village in Alaska, for example, has been
estimated at over USD 50 million.270
The number of people suffering permafrost-
type impacts is dwarfed by the number who,
in the next 20 years, will be affected by
severe productivity drops in crop production,
livestock rearing, forestry and the fishing
industries in warmer parts of the world. This
report assesses some of the more effective
responses available to these communities.
The measures assessed in this report that
relate specifically to reducing economic
stress received generally high ratings for
effectiveness and testify to a range of
promising options already available to seriously
reduce some of the main economic impacts of
climate change.
Measures taken to help communities adapt toeconomic stress can be very costly and must
be justified in the local economic context.
Programmes generally range from around
USD 100,000, such as for a groundwater
prospecting and extraction project, to over USD
5 million for an integrated pest management
scheme.271 Governments will often have to
provide significant support to help farmers and
fisher folk adapt to these stresses.
The most options available relate to crop
and livestock based agriculture and water
stress situations. Fewer options were found
for limiting impacts to the forestry and fisherysectors, based on the research behind this
report. Even fewer options are available
to combat major threats to land-based
biodiversity, such as in rapidly warming
mountainous or Polar regions.
Changes in crop management are among
the simplest measures for fighting off heat,
drought, water scarcity or salt intrusion
in soils due to climate change. The use of
newly available drought-resistant plants or
simple changes in planting dates can improve
yields in certain circumstances.272
Coastalcommunities can also plant crops that can
be irrigated with seawater alone for the price
of a pump (or around USD 600 per acre). But
salt-resistant crops are generally only suitable
for livestock feed and yield lower returns than
other cash crops.273
The world’s poorest farmers struggle to
obtain access to high-quality fertilizers and
seeds, with many surviving on the least
productive varieties available. These plant
types will make less and less commercial
sense in the world’s most marginal regionsas a result of climate change, forcing a
switch to higher quality seeds and plant
varietals. This could ultimately bring about
a surge in agricultural productivity that well
outweighs the negative impacts of climate
change.274 Many low-income farmers will not
have resources to make the switch for the
same reasons they have been unable to gain
access to better supplies in the past.
Another cost-effective alternative for
irrigated crops is switching to drip irrigation.
This entails feeding small drops of water
through tubing directly onto plants,minimizing wastage and evaporation, but
again requiring installations over and above
the means of most worst-affected farmers,
with projects assessed here ranging from
USD 100,000 to 400,000.275
In many cases, simply upgrading services
available to farmers could help to minimize
many negative impacts of climate change. In
parts of Africa and Asia, for example, the most
basic weather-monitoring networks are often
inadequate. Additional automatic weather
stations on the ground are cheap and effectiveand can help farmers make crucial decisions
while also enabling disaster forecasting and
delivering other commercial benefi ts.276
THE SUMMARY
IN SOME CASES, CLIMATE CHANGEIS PROJECTED TO LEAD TO NETBENEFITS IN THE NEAR TERM
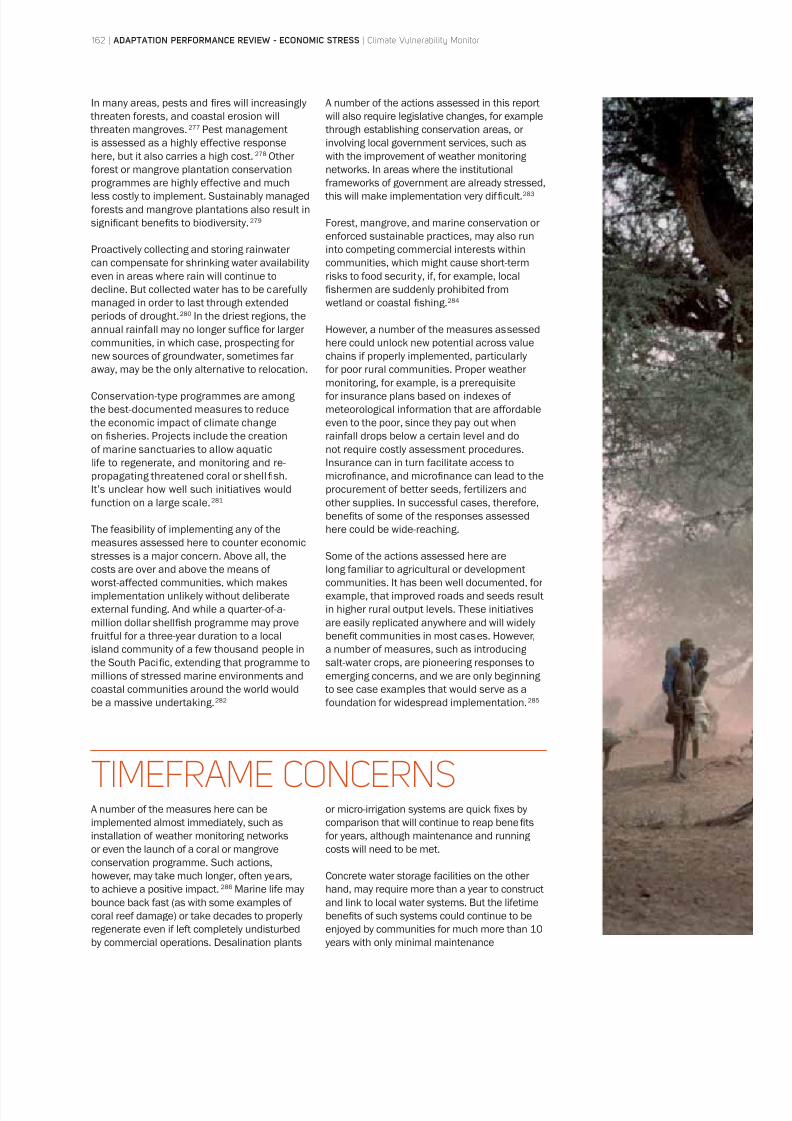
8/8/2019 Climate Vulnerability Monitor 2010: The State of the Climate Crisis
http://slidepdf.com/reader/full/climate-vulnerability-monitor-2010-the-state-of-the-climate-crisis 164/291
In many areas, pests and fires will increasingly
threaten forests, and coastal erosion will
threaten mangroves.277 Pest management
is assessed as a highly effective response
here, but it also carries a high cost.278 Other
forest or mangrove plantation conservation
programmes are highly effective and much
less costly to implement. Sustainably managed
forests and mangrove plantations also result in
significant benefi ts to biodiversity.279
Proactively collecting and storing rainwater
can compensate for shrinking water availability
even in areas where rain will continue to
decline. But collected water has to be carefully
managed in order to last through extended
periods of drought.280 In the driest regions, the
annual rainfall may no longer suf fice for larger
communities, in which case, prospecting for
new sources of groundwater, sometimes faraway, may be the only alternative to relocation.
Conservation-type programmes are among
the best-documented measures to reduce
the economic impact of climate change
on fisheries. Projects include the creation
of marine sanctuaries to allow aquatic
life to regenerate, and monitoring and re-
propagating threatened coral or shellfish.
It’s unclear how well such initiatives would
function on a large scale.281
The feasibility of implementing any of themeasures assessed here to counter economic
stresses is a major concern. Above all, the
costs are over and above the means of
worst-affected communities, which makes
implementation unlikely without deliberate
external funding. And while a quarter-of-a-
million dollar shellfish programme may prove
fruitful for a three-year duration to a local
island community of a few thousand people in
the South Pacific, extending that programme to
millions of stressed marine environments and
coastal communities around the world would
be a massive undertaking.282
A number of the actions assessed in this report
will also require legislative changes, for example
through establishing conservation areas, or
involving local government services, such as
with the improvement of weather monitoring
networks. In areas where the institutional
frameworks of government are already stressed,
this will make implementation very dif ficult.283
Forest, mangrove, and marine conservation or
enforced sustainable practices, may also run
into competing commercial interests within
communities, which might cause short-term
risks to food security, if, for example, local
fishermen are suddenly prohibited from
wetland or coastal fishing.284
However, a number of the measures assessed
here could unlock new potential across value
chains if properly implemented, particularlyfor poor rural communities. Proper weather
monitoring, for example, is a prerequisite
for insurance plans based on indexes of
meteorological information that are affordable
even to the poor, since they pay out when
rainfall drops below a certain level and do
not require costly assessment procedures.
Insurance can in turn facilitate access to
microfinance, and microfinance can lead to the
procurement of better seeds, fertilizers and
other supplies. In successful cases, therefore,
benefi ts of some of the responses assessed
here could be wide-reaching.
Some of the actions assessed here are
long familiar to agricultural or development
communities. It has been well documented, for
example, that improved roads and seeds result
in higher rural output levels. These initiatives
are easily replicated anywhere and will widely
benefi t communities in most cases. However,
a number of measures, such as introducing
salt-water crops, are pioneering responses to
emerging concerns, and we are only beginning
to see case examples that would serve as a
foundation for widespread implementation.285
A number of the measures here can be
implemented almost immediately, such as
installation of weather monitoring networks
or even the launch of a coral or mangrove
conservation programme. Such actions,
however, may take much longer, often years,
to achieve a positive impact.286
Marine life maybounce back fast (as with some examples of
coral reef damage) or take decades to properly
regenerate even if left completely undisturbed
by commercial operations. Desalination plants
or micro-irrigation systems are quick fixes by
comparison that will continue to reap benefi ts
for years, although maintenance and running
costs will need to be met.
Concrete water storage facilities on the other
hand, may require more than a year to constructand link to local water systems. But the lifetime
benefi ts of such systems could continue to be
enjoyed by communities for much more than 10
years with only minimal maintenance
TIMEFRAME CONCERNS
162 | ADAPTATION PERFORMANCE REVIEW - ECONOMIC STRESS | Climate Vulnerability Monitor
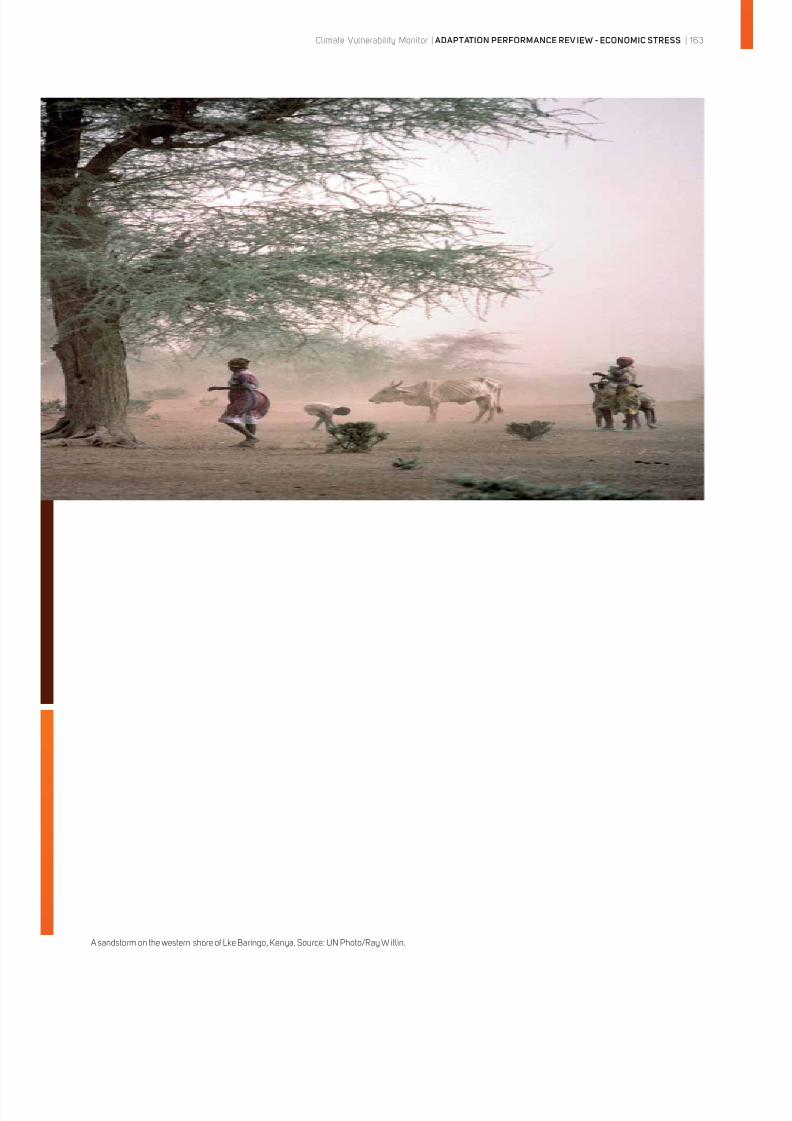
8/8/2019 Climate Vulnerability Monitor 2010: The State of the Climate Crisis
http://slidepdf.com/reader/full/climate-vulnerability-monitor-2010-the-state-of-the-climate-crisis 165/291
A sandstorm on the western shore of Lke Baringo, Kenya. Source: UN Photo/Ray Witlin.
Climate Vulnerability Monitor | ADAPTATION PERFORMANCE REV IEW - ECONOMIC STRESS | 163
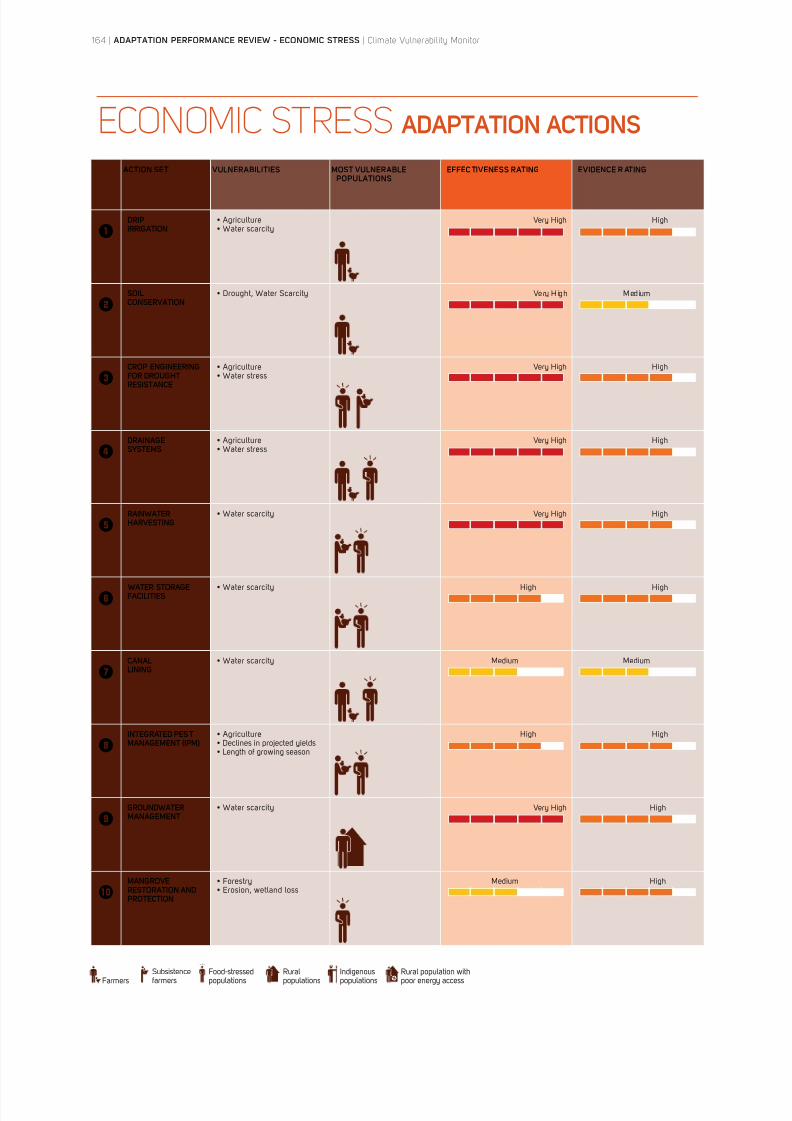
8/8/2019 Climate Vulnerability Monitor 2010: The State of the Climate Crisis
http://slidepdf.com/reader/full/climate-vulnerability-monitor-2010-the-state-of-the-climate-crisis 166/291
ECONOMIC STRESS ADAPTATION ACTIONS
ACTION SET VULNERABILITIES MOST VULNERABLE
POPULATIONS
EFFEC TIVENESS RATING EVIDENCE R ATING
DRIPIRRIGATION
Very High High
SOILCONSERVATION
Very High Medium
CROP ENGINEERINGFOR DROUGHTRESISTANCE
Very High High
DRAINAGESYSTEMS
Very High High
RAINWATERHARVESTING
Very High High
WATER STORAGEFACILITIES
High High
CANALLINING
Medium Medium
INTEGRATED PESTMANAGEMENT (IPM)
High High
GROUNDWATERMANAGEMENT
Very High High
MANGROVE
RESTORATION ANDPROTECTION
Medium High
FarmersFood-stressed
Rural
Indigenous
Subsistencefarmers
164 | ADAPTATION PERFORMANCE REVIEW - ECONOMIC STRESS | Climate Vulnerability Monitor
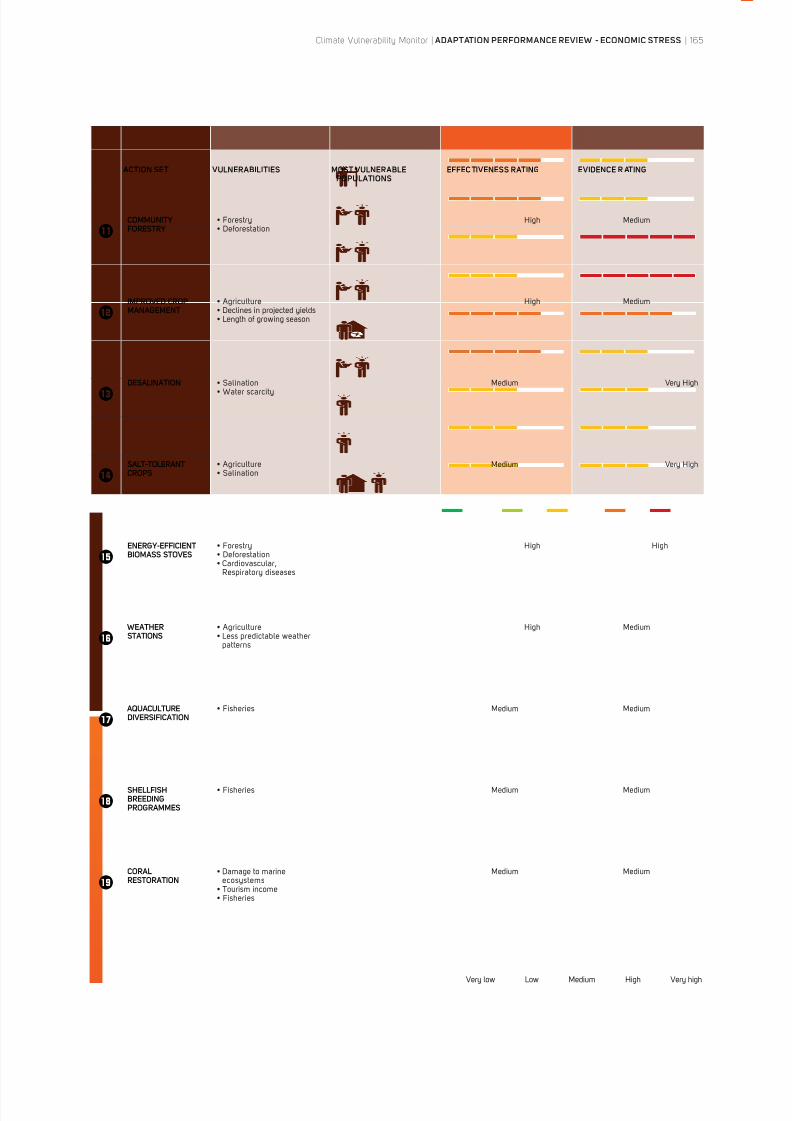
8/8/2019 Climate Vulnerability Monitor 2010: The State of the Climate Crisis
http://slidepdf.com/reader/full/climate-vulnerability-monitor-2010-the-state-of-the-climate-crisis 167/291
ACTION SET VULNERABILITIES MOST VULNERABLE
POPULATIONS
EFFEC TIVENESS RATING EVIDENCE R ATING
COMMUNITYFORESTRY
High Medium
IMPROVED CROPMANAGEMENT
High Medium
DESALINATION
Medium Very High
SALT-TOLERANTCROPS
Medium Very High
ENERGY-EFFICIENTBIOMASS STOVES
High High
WEATHERSTATIONS
High Medium
AQUACULTUREDIVERSIFICATION Medium Medium
SHELLFISHBREEDINGPROGRAMMES
Medium Medium
CORALRESTORATION
ecosystems
Medium Medium
Climate Vulnerability Monitor | ADAPTATION PERFORMANCE REVIEW - ECONOMIC STRESS | 165
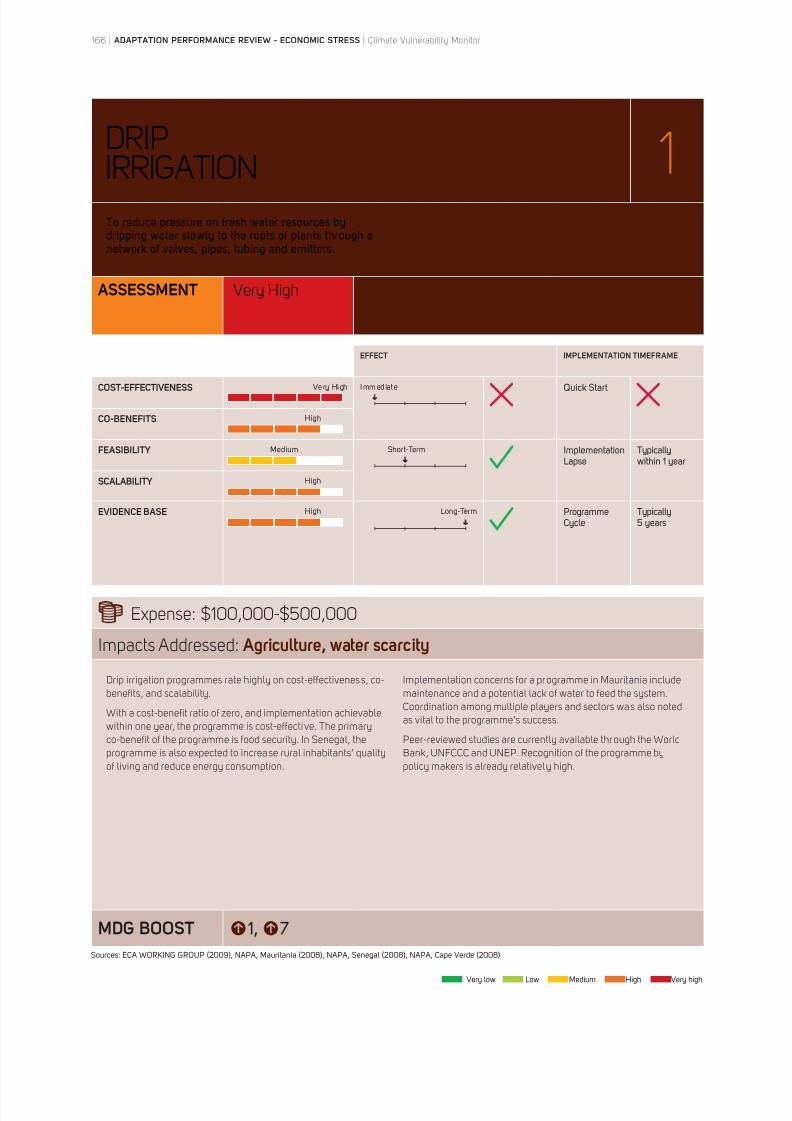
8/8/2019 Climate Vulnerability Monitor 2010: The State of the Climate Crisis
http://slidepdf.com/reader/full/climate-vulnerability-monitor-2010-the-state-of-the-climate-crisis 168/291
DRIP
IRRIGATION 1
ASSESSMENT Very High
EFFECT IMPLEMENTATION TIMEFRAME
COST-EFFECTIVENESS Very High Immediate Quick Start
CO-BENEFITS High
FEASIBILITY Medium Short-Term
SCALABILITY High
EVIDENCE BASE High Long-Term ProgrammeCycle
5 years
Expense: $100,000-$500,000
Impacts Addressed: Agriculture, water scarcity
MDG BOOST 7
Drip irrigation programmes rate highly on cost-effectiveness, co-
benefits, and scalability.
With a cost-benefit ratio of zero, and implementation achievablewithin one year, the programme is cost-effective. The primary
co-benefit of the programme is food security. In Senegal, the
programme is also expected to increase rural inhabitants’ quality
of living and reduce energy consumption.
Implementation concerns for a programme in Mauritania include
maintenance and a potential lack of water to feed the system.
Coordination among multiple players and sectors was also noted
as vital to the programme’s success.
Peer-reviewed studies are currently available through the World
Bank, UNFCCC and UNEP. Recognition of the programme by
policy makers is already relatively high.
166 | ADAPTATION PERFORMANCE REVIEW - ECONOMIC STRESS | Climate Vulnerability Monitor
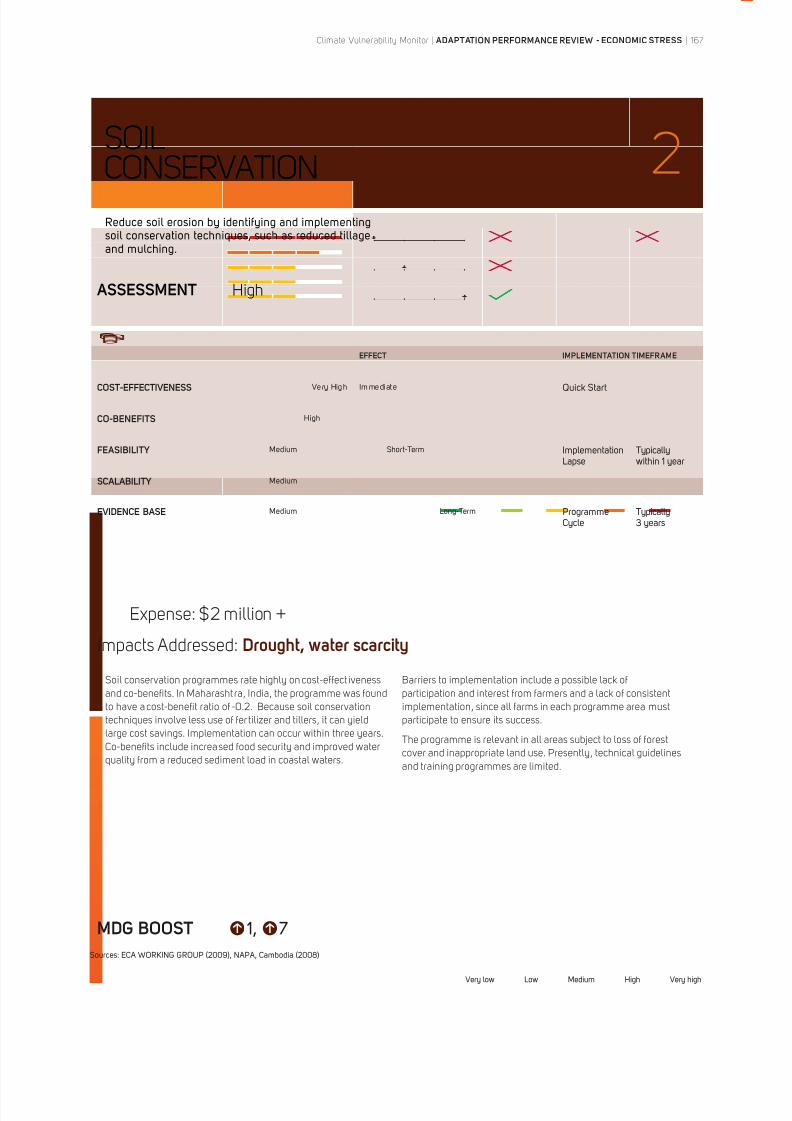
8/8/2019 Climate Vulnerability Monitor 2010: The State of the Climate Crisis
http://slidepdf.com/reader/full/climate-vulnerability-monitor-2010-the-state-of-the-climate-crisis 169/291
SOIL
CONSERVATION 2
ASSESSMENT High
EFFECT IMPLEMENTATION TIMEFRAME
COST-EFFECTIVENESS Very High Immediate Quick Start
CO-BENEFITS High
FEASIBILITY Medium Short-Term
SCALABILITY Medium
EVIDENCE BASE Medium Long-Term ProgrammeCycle
3 years
Expense: $2 million +
Impacts Addressed: Drought, water scarcity
MDG BOOST 7
Soil conservation programmes rate highly on cost-effect iveness
and co-benefits. In Maharasht ra, India, the programme was found
to have a cost-benefit ratio of -0.2. Because soil conservation
techniques involve less use of fer tilizer and tillers, it can yield
large cost savings. Implementation can occur within three years.
Co-benefits include increased food security and improved water
quality from a reduced sediment load in coastal waters.
Barriers to implementation include a possible lack of
participation and interest from farmers and a lack of consistent
implementation, since all farms in each programme area must
participate to ensure its success.
The programme is relevant in all areas subject to loss of forest
cover and inappropriate land use. Presently, technical guidelines
and training programmes are limited.
Climate Vulnerability Monitor | ADAPTATION PERFORMANCE REVIEW - ECONOMIC STRESS | 167
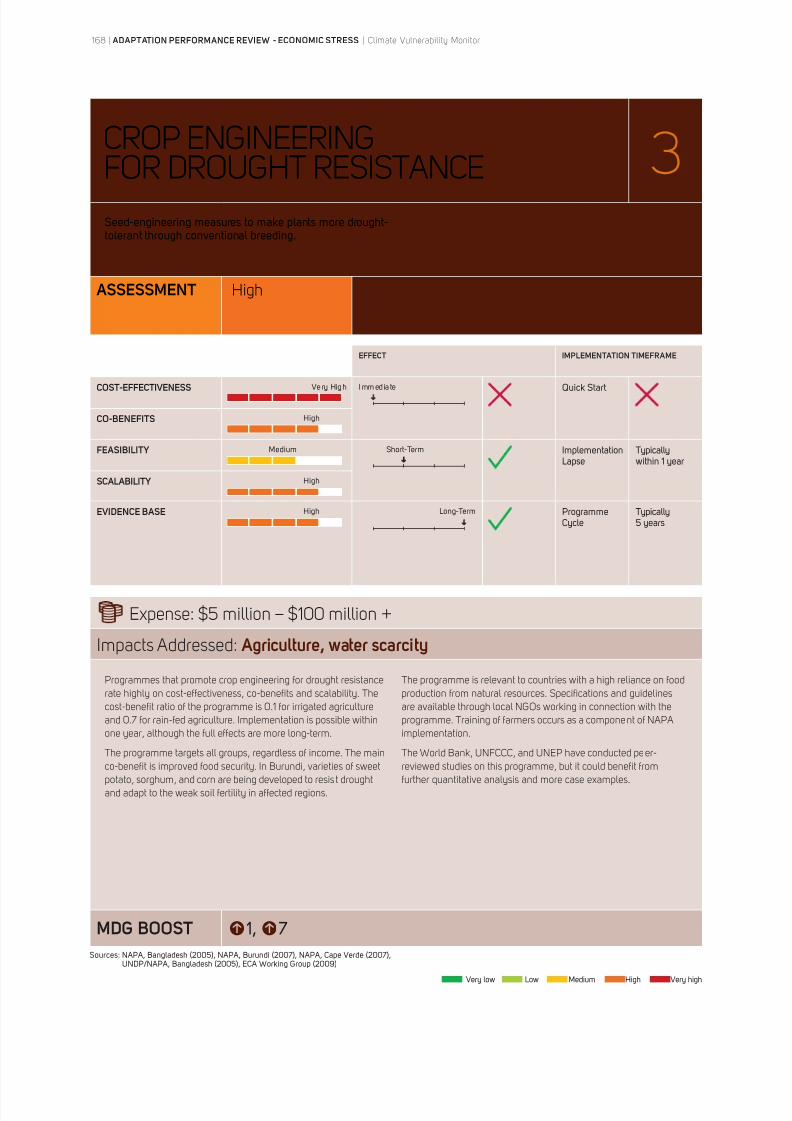
8/8/2019 Climate Vulnerability Monitor 2010: The State of the Climate Crisis
http://slidepdf.com/reader/full/climate-vulnerability-monitor-2010-the-state-of-the-climate-crisis 170/291
CROP ENGINEERING
FOR DROUGHT RESISTANCE 3
ASSESSMENT High
EFFECT IMPLEMENTATION TIMEFRAME
COST-EFFECTIVENESS Very High Immedia te Quick Start
CO-BENEFITS High
FEASIBILITY Medium Short-Term
SCALABILITY High
EVIDENCE BASE High Long-Term ProgrammeCycle
5 years
Expense: $5 million – $100 million +
Impacts Addressed: Agriculture, water scarcity
MDG BOOST 7
Programmes that promote crop engineering for drought resistance
rate highly on cost-effectiveness, co-benefits and scalability. The
cost-benefit ratio of the programme is 0.1 for irrigated agriculture
and 0.7 for rain-fed agriculture. Implementation is possible within
one year, although the full effects are more long-term.
The programme targets all groups, regardless of income. The main
co-benefit is improved food security. In Burundi, varieties of sweet
potato, sorghum, and corn are being developed to resist drought
and adapt to the weak soil fertility in affected regions.
The programme is relevant to countries with a high reliance on food
production from natural resources. Specifications and guidelines
are available through local NGOs working in connection with the
programme. Training of farmers occurs as a component of NAPA
implementation.
The World Bank, UNFCCC, and UNEP have conducted peer-
reviewed studies on this programme, but it could benefit from
further quantitative analysis and more case examples.
168 | ADAPTATION PERFORMANCE REVIEW - ECONOMIC STRESS | Climate Vulnerability Monitor
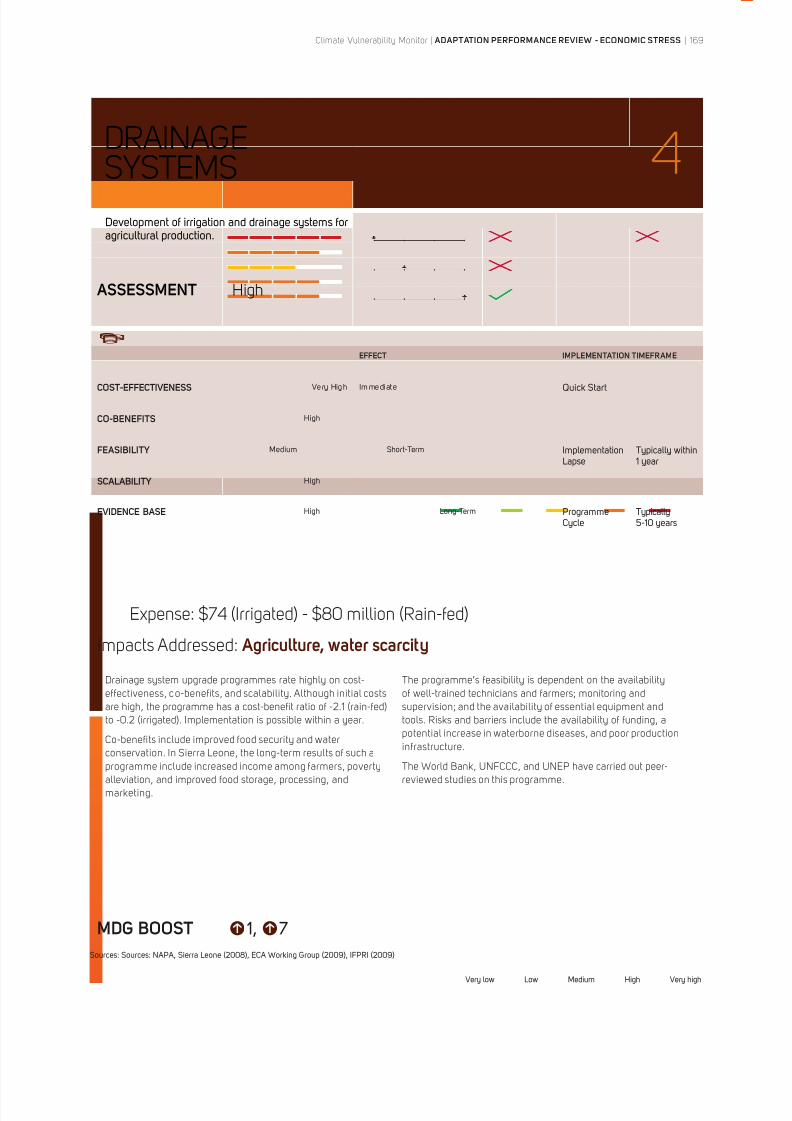
8/8/2019 Climate Vulnerability Monitor 2010: The State of the Climate Crisis
http://slidepdf.com/reader/full/climate-vulnerability-monitor-2010-the-state-of-the-climate-crisis 171/291
DRAINAGE
SYSTEMS 4
ASSESSMENT High
EFFECT IMPLEMENTATION TIMEFRAME
COST-EFFECTIVENESS Very High Immediate Quick Start
CO-BENEFITS High
FEASIBILITY Medium Short-Term
SCALABILITY High
EVIDENCE BASE High Long-Term ProgrammeCycle
Expense: $74 (Irrigated) - $80 million (Rain-fed)
Impacts Addressed: Agriculture, water scarcity
MDG BOOST 7
Drainage system upgrade programmes rate highly on cost-
effectiveness, co-benefits, and scalability. Although initial costs
are high, the programme has a cost-benefit ratio of -2.1 (rain-fed)
to -0.2 (irrigated). Implementation is possible within a year.
Co-benefits include improved food security and water
conservation. In Sierra Leone, the long-term results of such a
programme include increased income among farmers, poverty
alleviation, and improved food storage, processing, and
marketing.
The programme’s feasibility is dependent on the availability
of well-trained technicians and farmers; monitoring and
supervision; and the availability of essential equipment and
tools. Risks and barriers include the availability of funding, a
potential increase in waterborne diseases, and poor production
infrastructure.
The World Bank, UNFCCC, and UNEP have carried out peer-
reviewed studies on this programme.
Climate Vulnerability Monitor | ADAPTATION PERFORMANCE REVIEW - ECONOMIC STRESS | 169
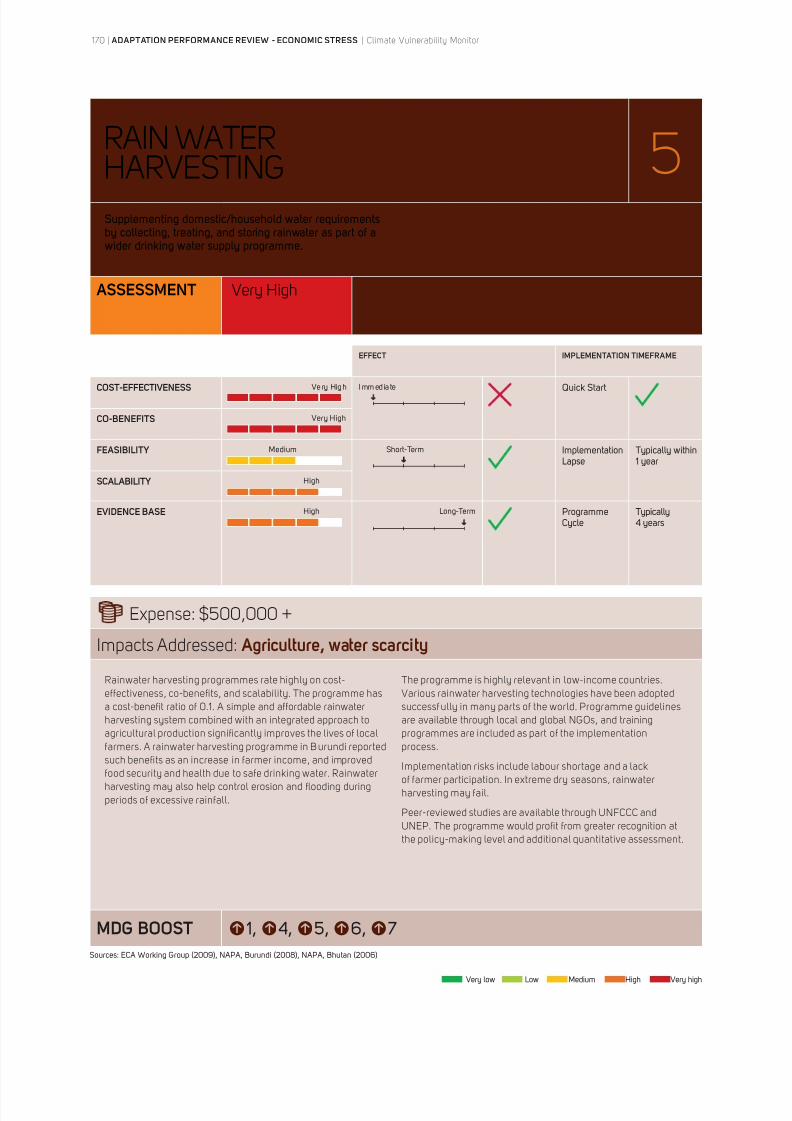
8/8/2019 Climate Vulnerability Monitor 2010: The State of the Climate Crisis
http://slidepdf.com/reader/full/climate-vulnerability-monitor-2010-the-state-of-the-climate-crisis 172/291
RAIN WATER
HARVESTING 5
ASSESSMENT Very High
EFFECT IMPLEMENTATION TIMEFRAME
COST-EFFECTIVENESS Very High Immedia te Quick Start
CO-BENEFITS Very High
FEASIBILITY Medium Short-Term
SCALABILITY High
EVIDENCE BASE High Long-Term ProgrammeCycle
4 years
Expense: $500,000 +
Impacts Addressed: Agriculture, water scarcity
MDG BOOST 7
Rainwater harvesting programmes rate highly on cost-
effectiveness, co-benefits, and scalability. The programme has
a cost-benefit ratio of 0.1. A simple and affordable rainwater
harvesting system combined with an integrated approach to
agricultural production significantly improves the lives of local
farmers. A rainwater harvesting programme in Burundi reported
such benefits as an increase in farmer income, and improved
food security and health due to safe drinking water. Rainwater
harvesting may also help control erosion and flooding during
periods of excessive rainfall.
The programme is highly relevant in low-income countries.
Various rainwater harvesting technologies have been adopted
successf ully in many parts of the world. Programme guidelines
are available through local and global NGOs, and training
programmes are included as part of the implementation
process.
Implementation risks include labour shortage and a lack
of farmer participation. In extreme dry seasons, rainwater
harvesting may fail.
Peer-reviewed studies are available through UNFCCC and
UNEP. The programme would profit from greater recognition at
the policy-making level and additional quantitative assessment.
170 | ADAPTATION PERFORMANCE REVIEW - ECONOMIC STRESS | Climate Vulnerability Monitor
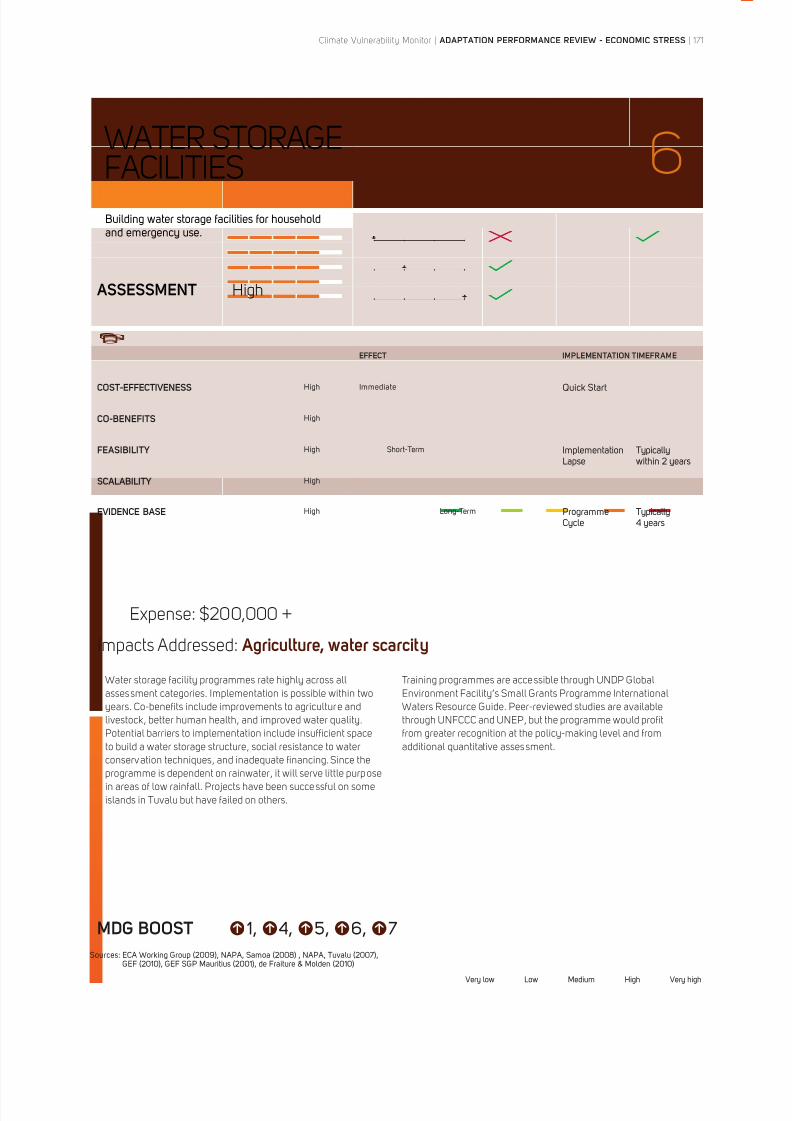
8/8/2019 Climate Vulnerability Monitor 2010: The State of the Climate Crisis
http://slidepdf.com/reader/full/climate-vulnerability-monitor-2010-the-state-of-the-climate-crisis 173/291
WATER STORAGE
FACILITIES 6
ASSESSMENT High
EFFECT IMPLEMENTATION TIMEFRAME
COST-EFFECTIVENESS High Immediate Quick Start
CO-BENEFITS High
FEASIBILITY High Short-Term
SCALABILITY High
EVIDENCE BASE High Long-Term ProgrammeCycle
4 years
Expense: $200,000 +
Impacts Addressed: Agriculture, water scarcity
MDG BOOST 7
Water storage facility programmes rate highly across all
assessment categories. Implementation is possible within two
years. Co-benefits include improvements to agriculture and
livestock, better human health, and improved water quality.
Potential barriers to implementation include insufficient space
to build a water storage structure, social resistance to water
conservation techniques, and inadequate financing. Since the
programme is dependent on rainwater, it will serve little purpose
in areas of low rainfall. Projects have been successful on some
islands in Tuvalu but have failed on others.
Training programmes are accessible through UNDP Global
Environment Facility’s Small Grants Programme International
Waters Resource Guide. Peer-reviewed studies are available
through UNFCCC and UNEP, but the programme would profit
from greater recognition at the policy-making level and from
additional quantitative assessment.
Climate Vulnerability Monitor | ADAPTATION PERFORMANCE REVIEW - ECONOMIC STRESS | 171
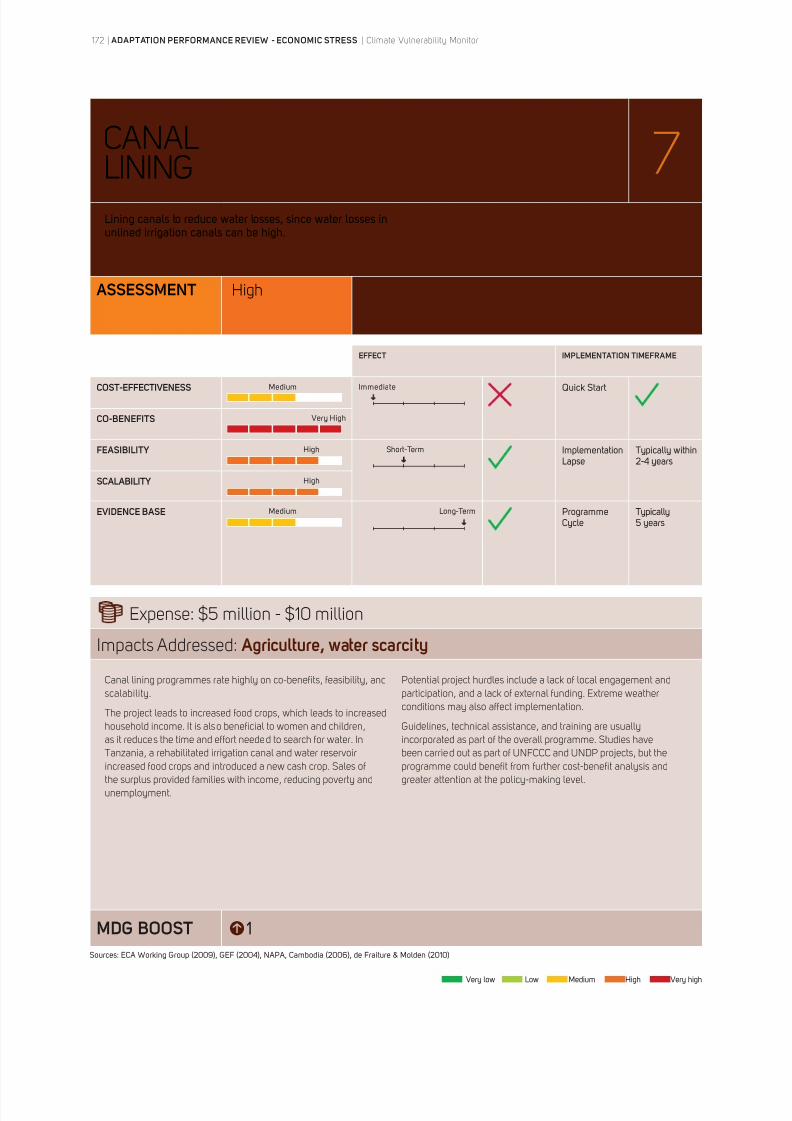
8/8/2019 Climate Vulnerability Monitor 2010: The State of the Climate Crisis
http://slidepdf.com/reader/full/climate-vulnerability-monitor-2010-the-state-of-the-climate-crisis 174/291
CANAL
LINING 7
ASSESSMENT High
EFFECT IMPLEMENTATION TIMEFRAME
COST-EFFECTIVENESS Medium Immediate Quick Start
CO-BENEFITS Very High
FEASIBILITY High Short-Term
SCALABILITY High
EVIDENCE BASE Medium Long-Term ProgrammeCycle
5 years
Expense: $5 million - $10 million
Impacts Addressed: Agriculture, water scarcity
MDG BOOST
Canal lining programmes rate highly on co-benefits, feasibility, and
scalability.
The project leads to increased food crops, which leads to increasedhousehold income. It is also beneficial to women and children,
as it reduces the time and effort needed to search for water. In
Tanzania, a rehabilitated irrigation canal and water reservoir
increased food crops and introduced a new cash crop. Sales of
the surplus provided families with income, reducing poverty and
unemployment.
Potential project hurdles include a lack of local engagement and
participation, and a lack of external funding. Extreme weather
conditions may also affect implementation.
Guidelines, technical assistance, and training are usually
incorporated as part of the overall programme. Studies have
been carried out as part of UNFCCC and UNDP projects, but the
programme could benefit from further cost-benefit analysis and
greater attention at the policy-making level.
172 | ADAPTATION PERFORMANCE REVIEW - ECONOMIC STRESS | Climate Vulnerability Monitor
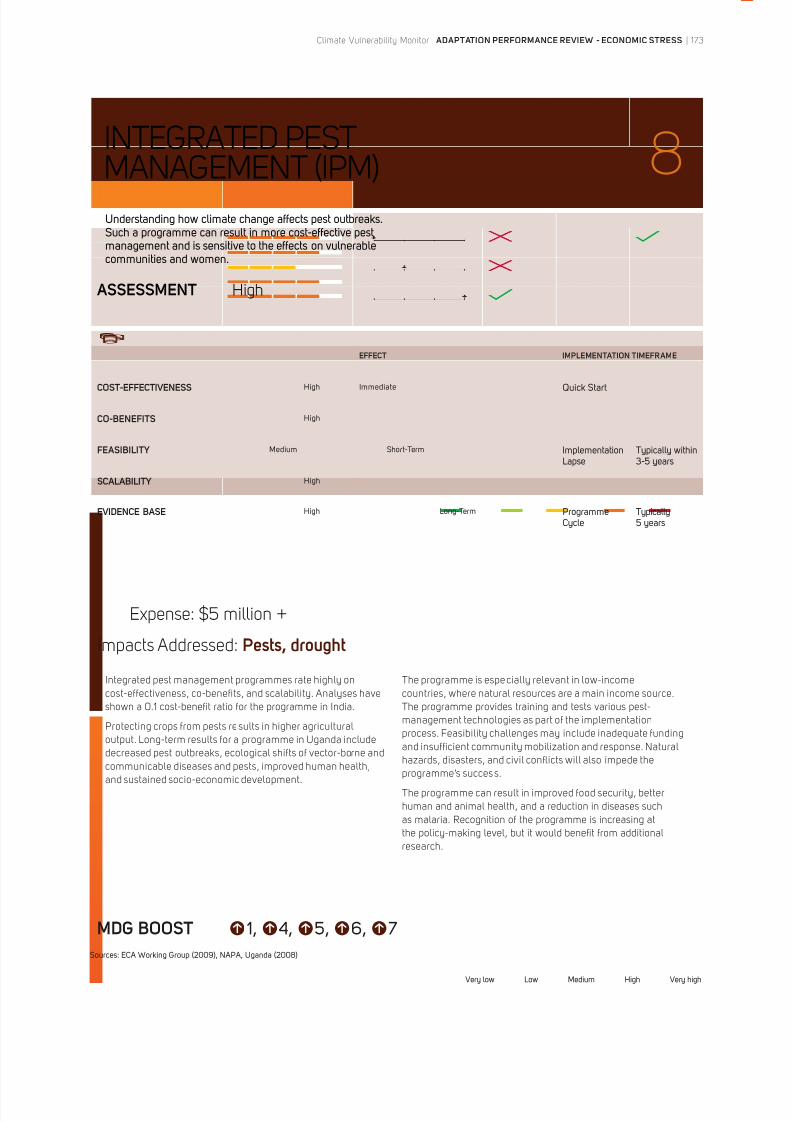
8/8/2019 Climate Vulnerability Monitor 2010: The State of the Climate Crisis
http://slidepdf.com/reader/full/climate-vulnerability-monitor-2010-the-state-of-the-climate-crisis 175/291
INTEGRATED PEST
MANAGEMENT (IPM) 8
ASSESSMENT High
EFFECT IMPLEMENTATION TIMEFRAME
COST-EFFECTIVENESS High Immediate Quick Start
CO-BENEFITS High
FEASIBILITY Medium Short-Term
3-5 years
SCALABILITY High
EVIDENCE BASE High Long-Term ProgrammeCycle
5 years
Expense: $5 million +
Impacts Addressed: Pests, drought
MDG BOOST 7
management and is sensitive to the effects on vulnerable
Integrated pest management programmes rate highly on
cost-effectiveness, co-benefits, and scalability. Analyses have
shown a 0.1 cost-benefit ratio for the programme in India.
Protecting crops from pests results in higher agricultural
output. Long-term results for a programme in Uganda include
decreased pest outbreaks, ecological shifts of vector-borne and
communicable diseases and pests, improved human health,
and sustained socio-economic development.
The programme is especially relevant in low-income
countries, where natural resources are a main income source.
The programme provides training and tests various pest-
management technologies as part of the implementation
process. Feasibility challenges may include inadequate funding
and insufficient community mobilization and response. Natural
hazards, disasters, and civil conflicts will also impede the
programme’s succes s.
The programme can result in improved food security, better
human and animal health, and a reduction in diseases such
as malaria. Recognition of the programme is increasing at
the policy-making level, but it would benefit from additional
research.
Climate Vulnerability Monitor | ADAPTATION PERFORMANCE REVIEW - ECONOMIC STRESS | 173

8/8/2019 Climate Vulnerability Monitor 2010: The State of the Climate Crisis
http://slidepdf.com/reader/full/climate-vulnerability-monitor-2010-the-state-of-the-climate-crisis 176/291
GROUNDWATER
MANAGEMENT 9
ASSESSMENT High
EFFECT IMPLEMENTATION TIMEFRAME
COST-EFFECTIVENESS Very High Immedia te Quick Start
CO-BENEFITS Very High
FEASIBILITY Medium Short-Term
3 years
SCALABILITY High
EVIDENCE BASE High Long-Term ProgrammeCycle
3 years
Expense: $100,000 +
Impacts Addressed: Agriculture, drought
MDG BOOST 7
Groundwater management programmes rate highly on cost-
effectiveness, co-benefits, and scalability. Analyses show a 0.7
cost-benefit ratio for the programme, with implementation possible
within three years. In Mauritania, the co-benefits of a groundwater
management improvement programme include more effective
cultivation methods, higher agricultural productivity, and improved
water quality.
Technical specifications and guidelines for the programme are
available through local and global NGOs. Where implemented,
local training is included as a component of NAPA projects.
Potential programme difficulties include conflicts between
governing agencies over areas of jurisdiction, training of
technicians, and obtaining equipment such as pumps. Water
sources are also sensitive to pollution and harmful effects.
Peer-reviewed studies are available through UNFCCC
programmes. The programme also complements water, sanitation,
and energy sector reform.
174 | ADAPTATION PERFORMANCE REV IEW - ECONOMIC STRESS | Climate Vulnerability Monitor
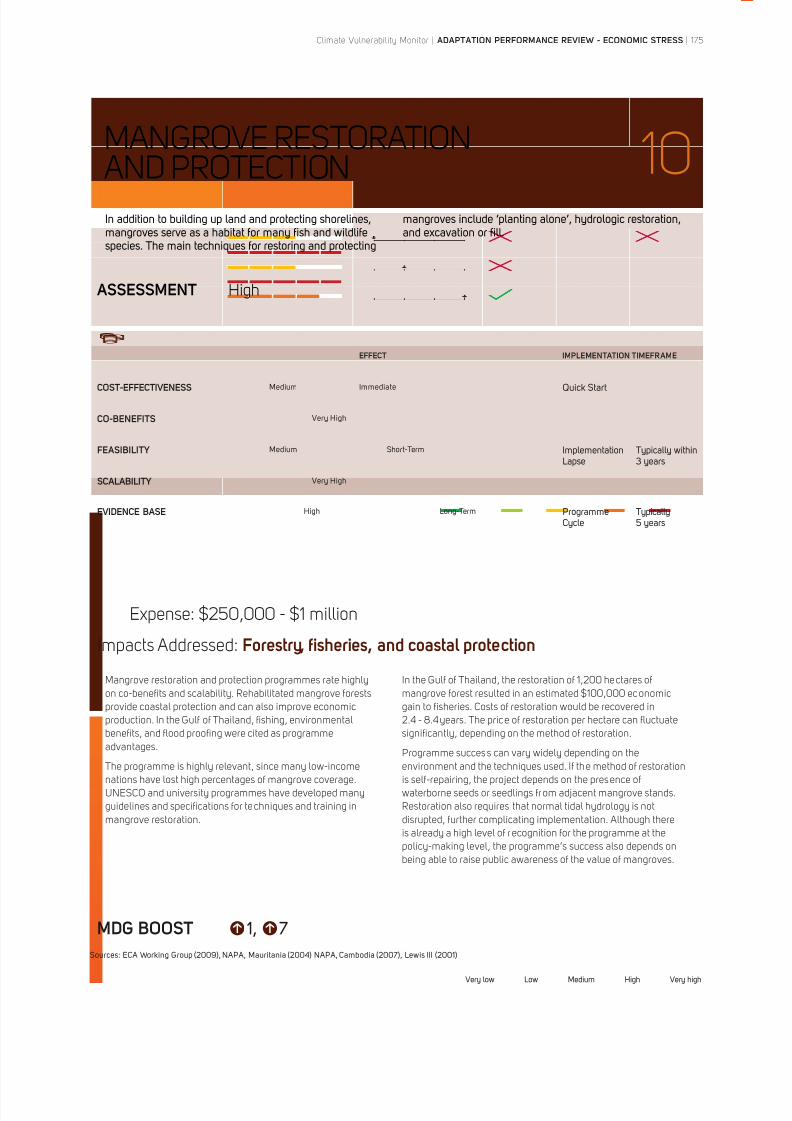
8/8/2019 Climate Vulnerability Monitor 2010: The State of the Climate Crisis
http://slidepdf.com/reader/full/climate-vulnerability-monitor-2010-the-state-of-the-climate-crisis 177/291
MANGROVE RESTORATION
AND PROTECTION 10
ASSESSMENT High
EFFECT IMPLEMENTATION TIMEFRAME
COST-EFFECTIVENESS Medium Immediate Quick Start
CO-BENEFITS Very High
FEASIBILITY Medium Short-Term
3 years
SCALABILITY Very High
EVIDENCE BASE High Long-Term ProgrammeCycle
5 years
Expense: $250,000 - $1 million
Impacts Addressed: Forestry, fisheries, and coastal protection
MDG BOOST 7
Mangrove restoration and protection programmes rate highly
on co-benefits and scalability. Rehabilitated mangrove forests
provide coastal protection and can also improve economic
production. In the Gulf of Thailand, fishing, environmental
benefits, and flood proofing were cited as programme
advantages.
The programme is highly relevant, since many low-income
nations have lost high percentages of mangrove coverage.
UNESCO and university programmes have developed many
guidelines and specifications for techniques and training in
mangrove restoration.
In the Gulf of Thailand, the restoration of 1,200 hectares of
mangrove forest resulted in an estimated $100,000 economic
gain to fisheries. Costs of restoration would be recovered in
2.4 - 8.4 years. The price of restoration per hectare can fluctuate
significantly, depending on the method of restoration.
Programme succes s can vary widely depending on the
environment and the techniques used. If the method of restoration
is self-repairing, the project depends on the presence of
waterborne seeds or seedlings from adjacent mangrove stands.
Restoration also requires that normal tidal hydrology is not
disrupted, further complicating implementation. Although there
is already a high level of recognition for the programme at the
policy-making level, the programme’s success also depends on
being able to raise public awareness of the value of mangroves.
Climate Vulnerability Monitor | ADAPTATION PERFORMANCE REVIEW - ECONOMIC STRESS | 175
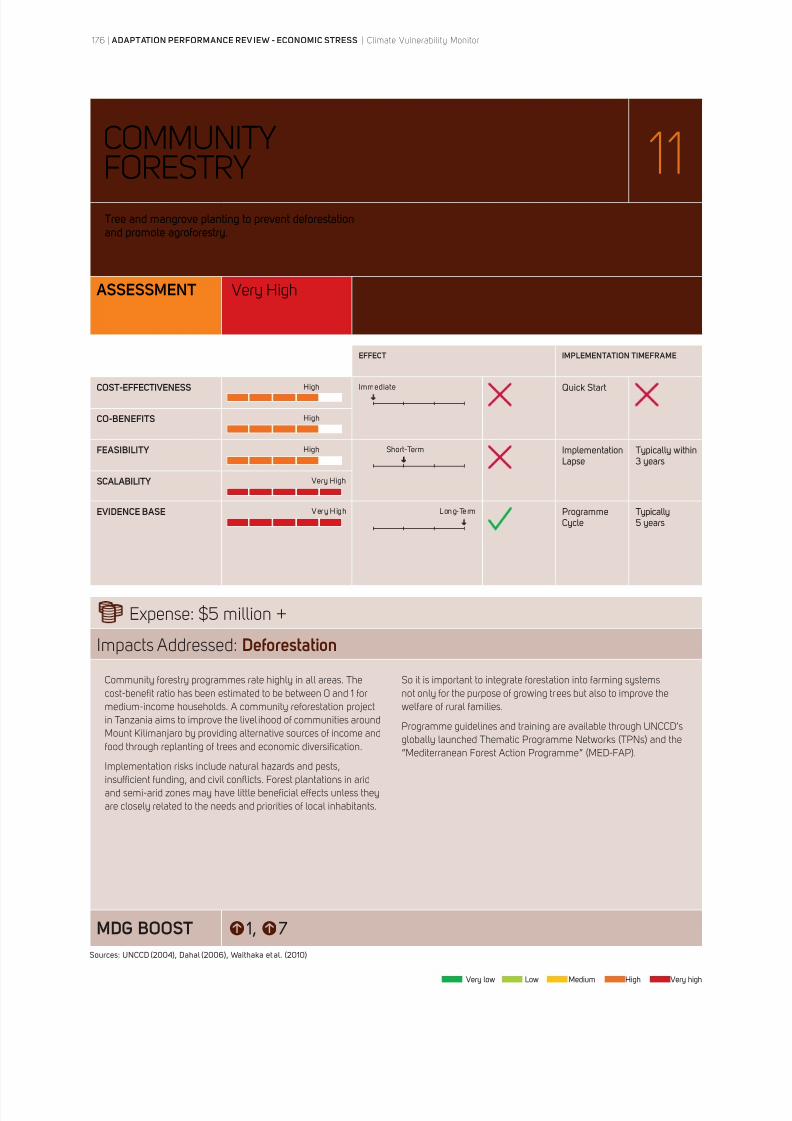
8/8/2019 Climate Vulnerability Monitor 2010: The State of the Climate Crisis
http://slidepdf.com/reader/full/climate-vulnerability-monitor-2010-the-state-of-the-climate-crisis 178/291
COMMUNITY
FORESTRY 11
ASSESSMENT Very High
EFFECT IMPLEMENTATION TIMEFRAME
COST-EFFECTIVENESS High Immediate Quick Start
CO-BENEFITS High
FEASIBILITY High Short-Term
3 years
SCALABILITY Very High
EVIDENCE BASE Very High Long-Term ProgrammeCycle
5 years
Expense: $5 million +
Impacts Addressed: Deforestation
MDG BOOST 7
Community forestry programmes rate highly in all areas. The
cost-benefit ratio has been estimated to be between 0 and 1 for
medium-income households. A community reforestation project
in Tanzania aims to improve the livel ihood of communities around
Mount Kilimanjaro by providing alternative sources of income and
food through replanting of trees and economic diversification.
Implementation risks include natural hazards and pests,
insufficient funding, and civil conflicts. Forest plantations in arid
and semi-arid zones may have little beneficial effects unless they
are closely related to the needs and priorities of local inhabitants.
So it is important to integrate forestation into farming systems
not only for the purpose of growing trees but also to improve the
welfare of rural families.
Programme guidelines and training are available through UNCCD’s
globally launched Thematic Programme Networks (TPNs) and the
“Mediterranean Forest Action Programme” (MED-FAP).
176 | ADAPTATION PERFORMANCE REV IEW - ECONOMIC STRESS | Climate Vulnerability Monitor
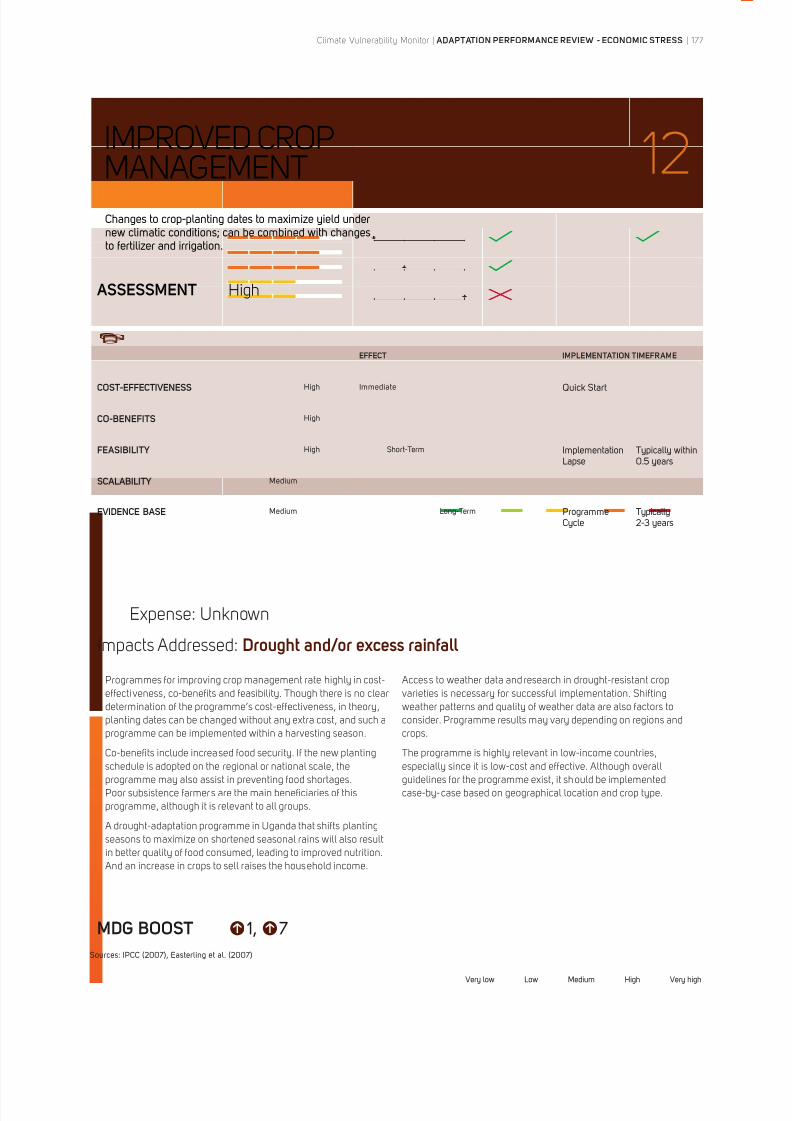
8/8/2019 Climate Vulnerability Monitor 2010: The State of the Climate Crisis
http://slidepdf.com/reader/full/climate-vulnerability-monitor-2010-the-state-of-the-climate-crisis 179/291
IMPROVED CROP
MANAGEMENT 12
ASSESSMENT High
EFFECT IMPLEMENTATION TIMEFRAME
COST-EFFECTIVENESS High Immediate Quick Start
CO-BENEFITS High
FEASIBILITY High Short-Term
SCALABILITY Medium
EVIDENCE BASE Medium Long-Term ProgrammeCycle
Expense: Unknown
Impacts Addressed: Drought and/or excess rainfall
MDG BOOST 7
Programmes for improving crop management rate highly in cost-
effectiveness, co-benefits and feasibility. Though there is no clear
determination of the programme’s cost-effectiveness, in theory,
planting dates can be changed without any extra cost, and such a
programme can be implemented within a harvesting season.
Co-benefits include increased food security. If the new planting
schedule is adopted on the regional or national scale, the
programme may also assist in preventing food shortages.
Poor subsistence farmers are the main beneficiaries of this
programme, although it is relevant to all groups.
A drought-adaptation programme in Uganda that shifts planting
seasons to maximize on shortened seasonal rains will also result
in better quality of food consumed, leading to improved nutrition.
And an increase in crops to sell raises the household income.
Access to weather data and research in drought-resistant crop
varieties is necessary for successful implementation. Shifting
weather patterns and quality of weather data are also factors to
consider. Programme results may vary depending on regions and
crops.
The programme is highly relevant in low-income countries,
especially since it is low-cost and effective. Although overall
guidelines for the programme exist, it should be implemented
case-by-case based on geographical location and crop type.
Climate Vulnerability Monitor | ADAPTATION PERFORMANCE REVIEW - ECONOMIC STRESS | 177
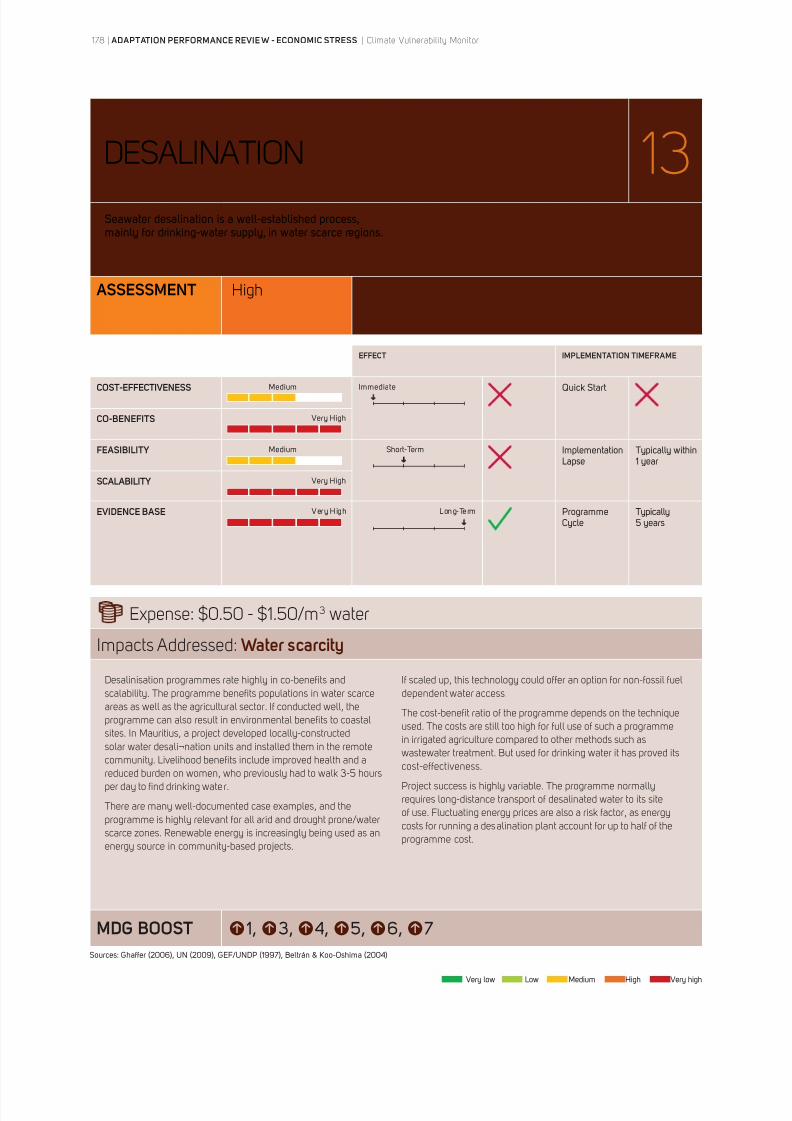
8/8/2019 Climate Vulnerability Monitor 2010: The State of the Climate Crisis
http://slidepdf.com/reader/full/climate-vulnerability-monitor-2010-the-state-of-the-climate-crisis 180/291
DESALINATION
13
ASSESSMENT High
EFFECT IMPLEMENTATION TIMEFRAME
COST-EFFECTIVENESS Medium Immediate Quick Start
CO-BENEFITS Very High
FEASIBILITY Medium Short-Term
SCALABILITY Very High
EVIDENCE BASE Very High Long-Term ProgrammeCycle
5 years
Expense: $0.50 - $1.50/m3 water
Impacts Addressed: Water scarcity
MDG BOOST 7
Desalinisation programmes rate highly in co-benefits and
scalability. The programme benefits populations in water scarce
areas as well as the agricultural sector. If conducted well, the
programme can also result in environmental benefits to coastal
sites. In Mauritius, a project developed locally-constructed
solar water desali¬nation units and installed them in the remote
community. Livelihood benefits include improved health and a
reduced burden on women, who previously had to walk 3-5 hours
per day to find drinking water.
There are many well-documented case examples, and the
programme is highly relevant for all arid and drought prone/water
scarce zones. Renewable energy is increasingly being used as an
energy source in community-based projects.
If scaled up, this technology could offer an option for non-fossil fuel
dependent water access.
The cost-benefit ratio of the programme depends on the techniqueused. The costs are still too high for full use of such a programme
in irrigated agriculture compared to other methods such as
wastewater treatment. But used for drinking water it has proved its
cost-effectiveness.
Project success is highly variable. The programme normally
requires long-distance transport of desalinated water to its site
of use. Fluctuating energy prices are also a risk factor, as energy
costs for running a desalination plant account for up to half of the
programme cost.
178 | ADAPTATION PERFORMANCE REVIE W - ECONOMIC STRESS | Climate Vulnerability Monitor
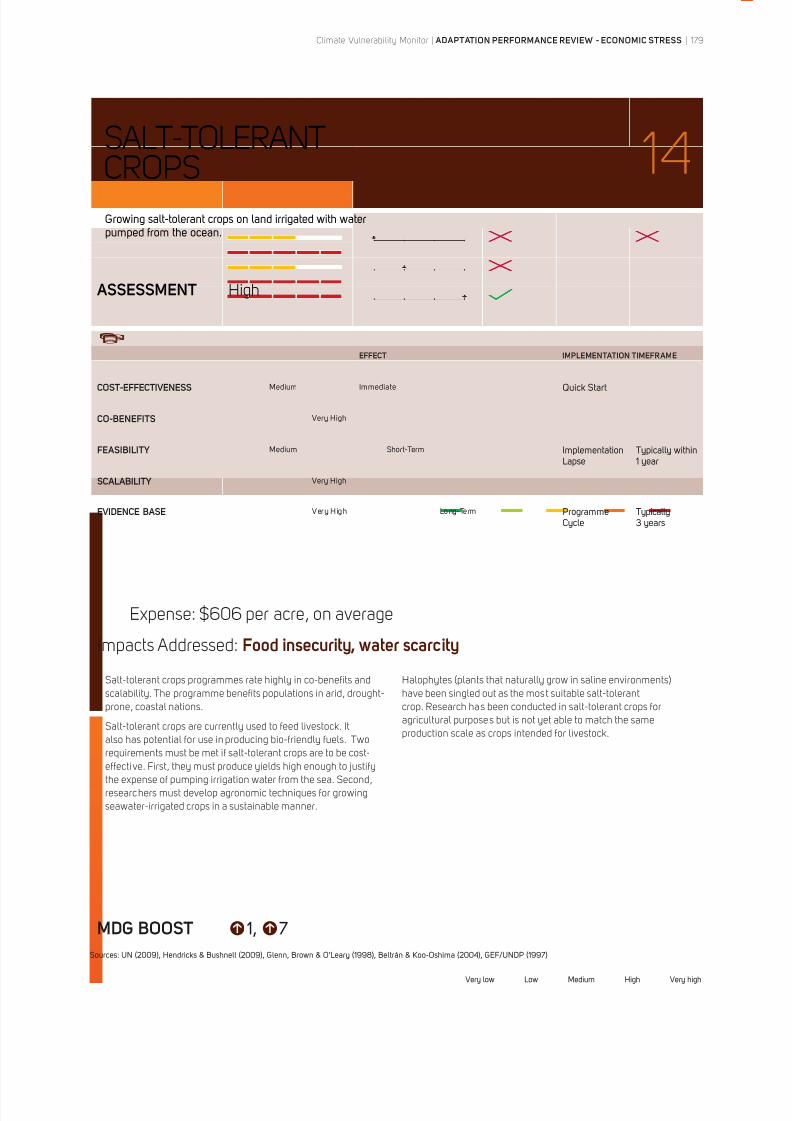
8/8/2019 Climate Vulnerability Monitor 2010: The State of the Climate Crisis
http://slidepdf.com/reader/full/climate-vulnerability-monitor-2010-the-state-of-the-climate-crisis 181/291
SALT-TOLERANT
CROPS 14
ASSESSMENT High
EFFECT IMPLEMENTATION TIMEFRAME
COST-EFFECTIVENESS Medium Immediate Quick Start
CO-BENEFITS Very High
FEASIBILITY Medium Short-Term
SCALABILITY Very High
EVIDENCE BASE Very High Long-Term ProgrammeCycle
3 years
Expense: $606 per acre, on average
Impacts Addressed: Food insecurity, water scarcity
MDG BOOST 7
Salt-tolerant crops programmes rate highly in co-benefits and
scalability. The programme benefits populations in arid, drought-
prone, coastal nations.
Salt-tolerant crops are currently used to feed livestock. It
also has potential for use in producing bio-friendly fuels. Two
requirements must be met if salt-tolerant crops are to be cost-
effective. First, they must produce yields high enough to justify
the expense of pumping irrigation water from the sea. Second,
researchers must develop agronomic techniques for growing
seawater-irrigated crops in a sustainable manner.
Halophytes (plants that naturally grow in saline environments)
have been singled out as the most suitable salt-tolerant
crop. Research has been conducted in salt-tolerant crops for
agricultural purposes but is not yet able to match the same
production scale as crops intended for livestock.
Climate Vulnerability Monitor | ADAPTATION PERFORMANCE REVIEW - ECONOMIC STRESS | 179

8/8/2019 Climate Vulnerability Monitor 2010: The State of the Climate Crisis
http://slidepdf.com/reader/full/climate-vulnerability-monitor-2010-the-state-of-the-climate-crisis 182/291
ENERGY EFFICIENT
BIOMASS STOVES 15
ASSESSMENT High
EFFECT IMPLEMENTATION TIMEFRAME
COST-EFFECTIVENESS High Immediate Quick Start
CO-BENEFITS Medium
FEASIBILITY High Short-Term
SCALABILITY High
EVIDENCE BASE High Long-Term ProgrammeCycle
3 years
Expense: $200,000
Impacts Addressed: Deforestation, respiratory illness
MDG BOOST 7
Energy-efficient biomass stove programmes rate highly on
cost-effectiveness, feasibility and scalability. Although no cost-
benefit ratio has been determined, the programme can be fully
implemented within two years.
Successful implementation depends on community awareness
and willingness to adopt new cooking and heating methods. The
programme is highly relevant in low-income countries, where
significant populations have limited access to energy. Guidelines
and training programmes are available through NAPA projects
and the World Bank. The World Bank’s “Fuel Source Module” also
contains training resources for the programme.
The programme is projected to have a large impact on human
health, biodiversity, and quality of life. Lower-income households
benefit the most, since they rely more on traditional fuels than
higher-income households do.
180 | ADAPTATION PERFORMANCE REVIEW - ECONOMIC STRESS | Climate Vulnerability Monitor
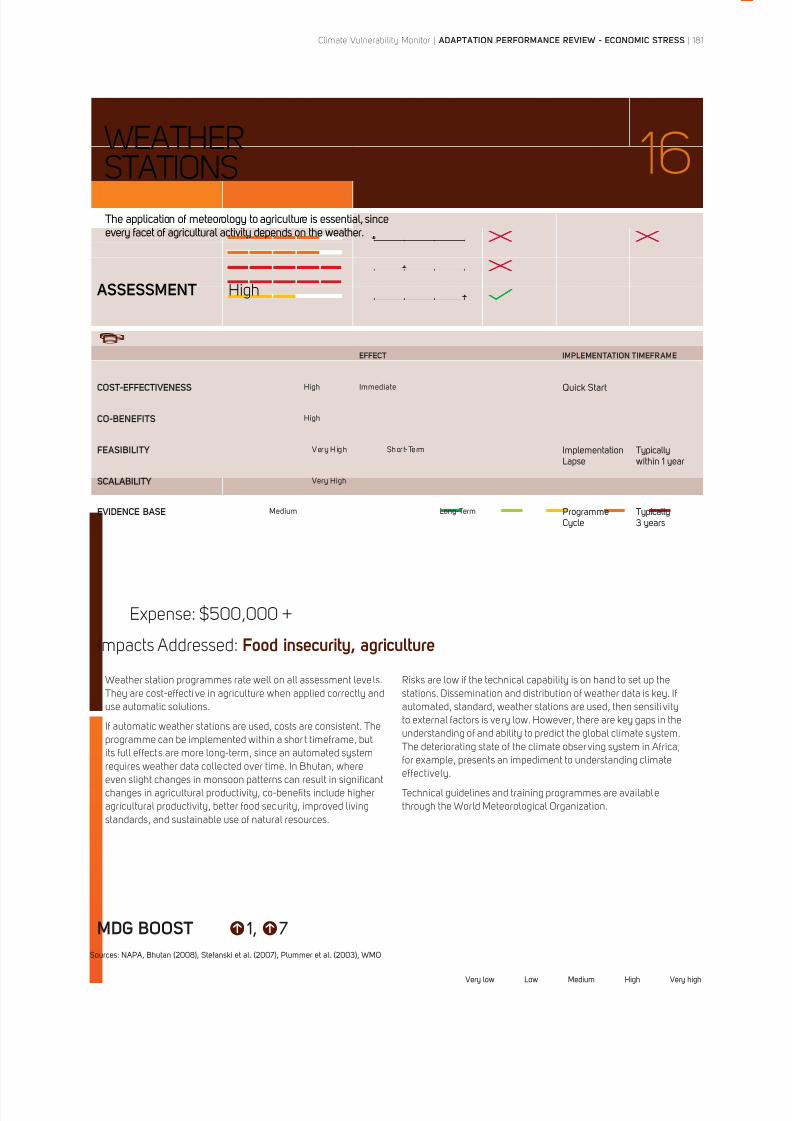
8/8/2019 Climate Vulnerability Monitor 2010: The State of the Climate Crisis
http://slidepdf.com/reader/full/climate-vulnerability-monitor-2010-the-state-of-the-climate-crisis 183/291
WEATHER
STATIONS 16
ASSESSMENT High
EFFECT IMPLEMENTATION TIMEFRAME
COST-EFFECTIVENESS High Immediate Quick Start
CO-BENEFITS High
FEASIBILITY Very High Short-Term
SCALABILITY Very High
EVIDENCE BASE Medium Long-Term ProgrammeCycle
3 years
Expense: $500,000 +
Impacts Addressed: Food insecurity, agriculture
MDG BOOST 7
Weather station programmes rate well on all assessment levels.
They are cost-effective in agriculture when applied correctly and
use automatic solutions.
If automatic weather stations are used, costs are consistent. The
programme can be implemented within a shor t timeframe, but
its full effects are more long-term, since an automated system
requires weather data collected over time. In Bhutan, where
even slight changes in monsoon patterns can result in significant
changes in agricultural productivity, co-benefits include higher
agricultural productivity, better food security, improved living
standards, and sustainable use of natural resources.
Risks are low if the technical capability is on hand to set up the
stations. Dissemination and distribution of weather data is key. If
automated, standard, weather stations are used, then sensitivity
to external factors is very low. However, there are key gaps in the
understanding of and ability to predict the global climate system.
The deteriorating state of the climate observing system in Africa,
for example, presents an impediment to understanding climate
effectively.
Technical guidelines and training programmes are available
through the World Meteorological Organization.
Climate Vulnerability Monitor | ADAPTATION PERFORMANCE REVIEW - ECONOMIC STRESS | 181
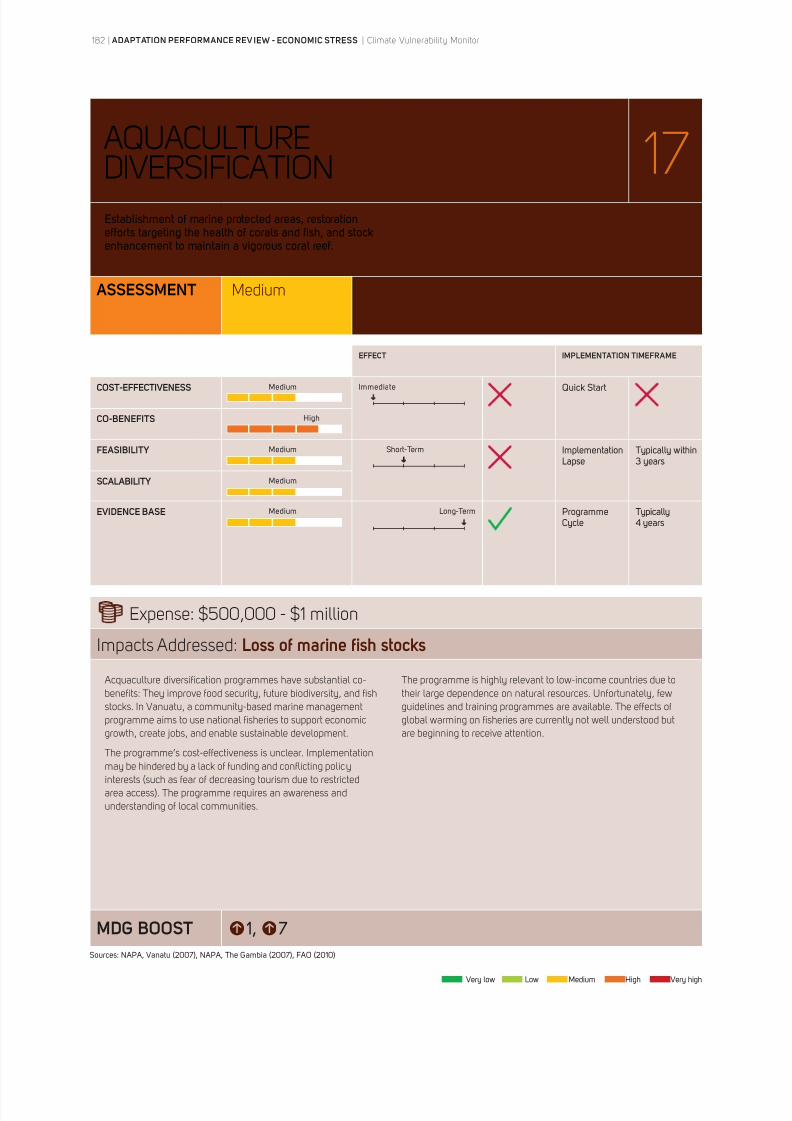
8/8/2019 Climate Vulnerability Monitor 2010: The State of the Climate Crisis
http://slidepdf.com/reader/full/climate-vulnerability-monitor-2010-the-state-of-the-climate-crisis 184/291
AQUACULTURE
DIVERSIFICATION 17
ASSESSMENT Medium
EFFECT IMPLEMENTATION TIMEFRAME
COST-EFFECTIVENESS Medium Immediate Quick Start
CO-BENEFITS High
FEASIBILITY Medium Short-Term
3 years
SCALABILITY Medium
EVIDENCE BASE Medium Long-Term ProgrammeCycle
4 years
Expense: $500,000 - $1 million
Impacts Addressed: Loss of marine fish stocks
MDG BOOST 7
Acquaculture diversification programmes have substantial co-
benefits: They improve food security, future biodiversity, and fish
stocks. In Vanuatu, a community-based marine management
programme aims to use national fisheries to support economic
growth, create jobs, and enable sustainable development.
The programme’s cost-effectiveness is unclear. Implementation
may be hindered by a lack of funding and conflicting policy
interests (such as fear of decreasing tourism due to restricted
area access). The programme requires an awareness and
understanding of local communities.
The programme is highly relevant to low-income countries due to
their large dependence on natural resources. Unfortunately, few
guidelines and training programmes are available. The effects of
global warming on fisheries are currently not well understood but
are beginning to receive attention.
182 | ADAPTATION PERFORMANCE REV IEW - ECONOMIC STRESS | Climate Vulnerability Monitor
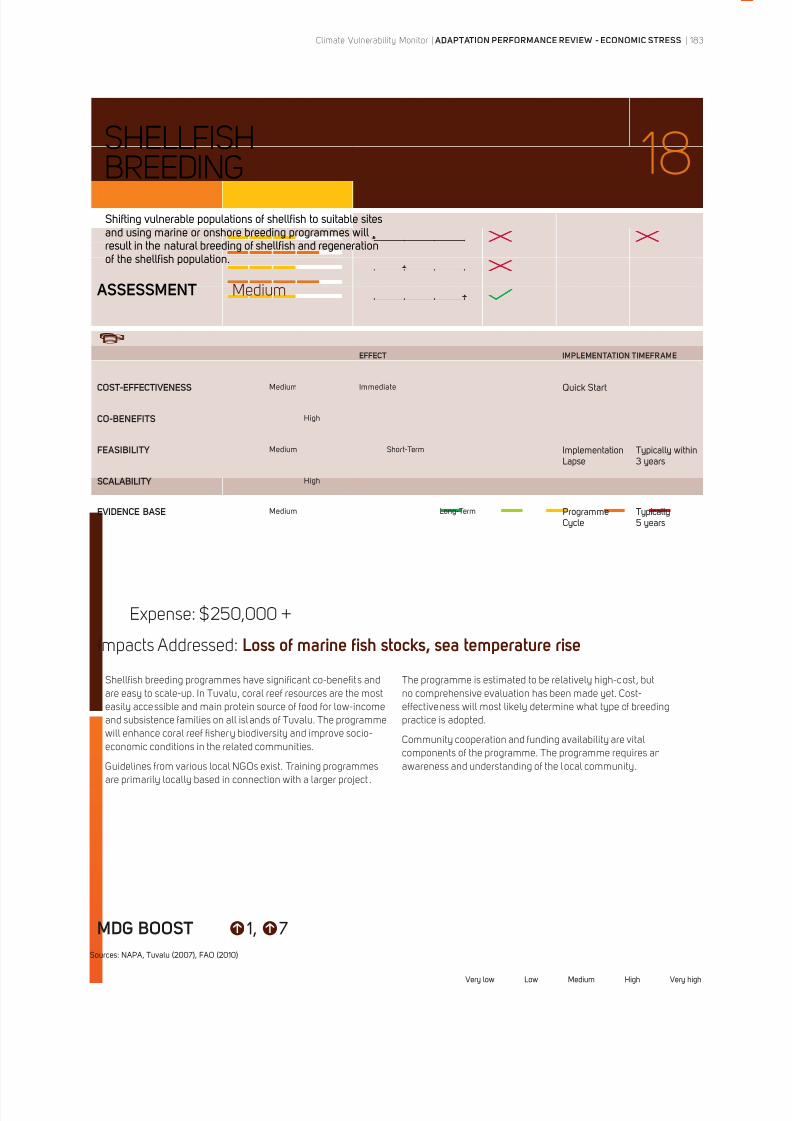
8/8/2019 Climate Vulnerability Monitor 2010: The State of the Climate Crisis
http://slidepdf.com/reader/full/climate-vulnerability-monitor-2010-the-state-of-the-climate-crisis 185/291
SHELLFISH
BREEDING 18
ASSESSMENT Medium
EFFECT IMPLEMENTATION TIMEFRAME
COST-EFFECTIVENESS Medium Immediate Quick Start
CO-BENEFITS High
FEASIBILITY Medium Short-Term
3 years
SCALABILITY High
EVIDENCE BASE Medium Long-Term ProgrammeCycle
5 years
Expense: $250,000 +
Impacts Addressed: Loss of marine fish stocks, sea temperature rise
MDG BOOST 7
result in the natural breeding of shellfish and regeneration
Shellfish breeding programmes have significant co-benefits and
are easy to scale-up. In Tuvalu, coral reef resources are the most
easily accessible and main protein source of food for low-income
and subsistence families on all islands of Tuvalu. The programme
will enhance coral reef fishery biodiversity and improve socio-
economic conditions in the related communities.
Guidelines from various local NGOs exist. Training programmes
are primarily locally based in connection with a larger project .
The programme is estimated to be relatively high-cost, but
no comprehensive evaluation has been made yet. Cost-
effectiveness will most likely determine what type of breeding
practice is adopted.
Community cooperation and funding availability are vital
components of the programme. The programme requires an
awareness and understanding of the local community.
Climate Vulnerability Monitor | ADAPTATION PERFORMANCE REVIEW - ECONOMIC STRESS | 183
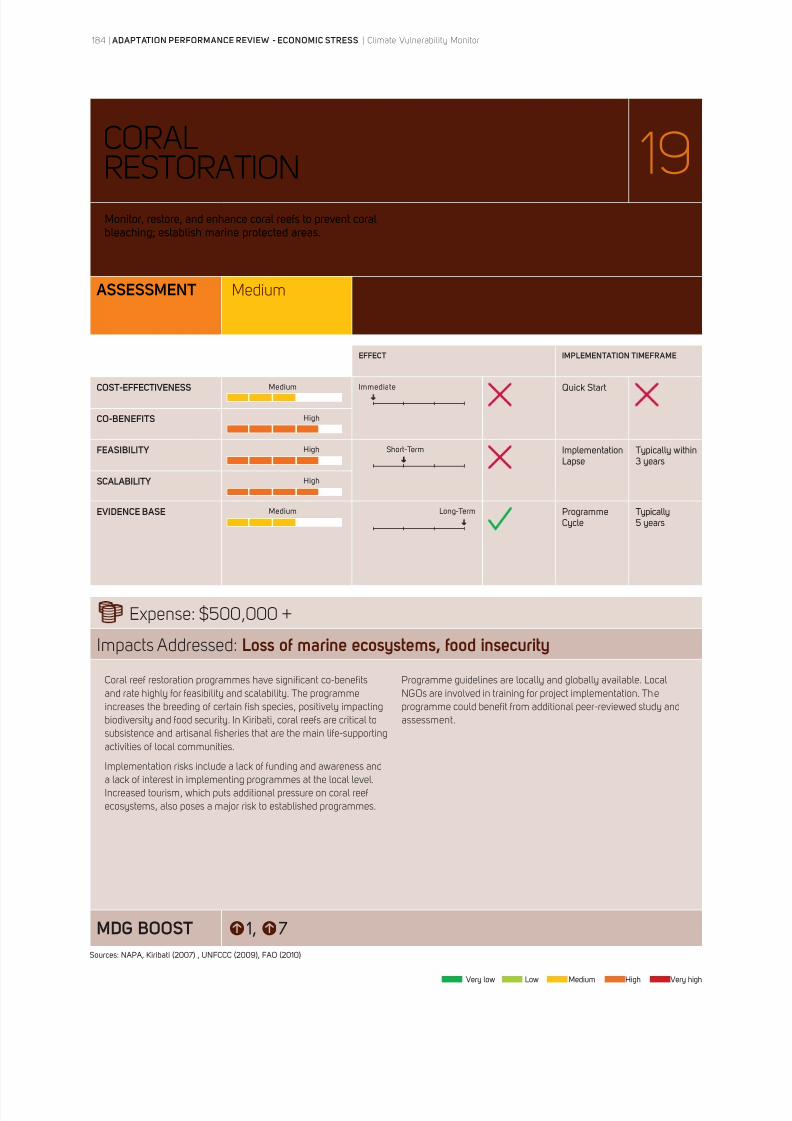
8/8/2019 Climate Vulnerability Monitor 2010: The State of the Climate Crisis
http://slidepdf.com/reader/full/climate-vulnerability-monitor-2010-the-state-of-the-climate-crisis 186/291
CORAL
RESTORATION 19
ASSESSMENT Medium
EFFECT IMPLEMENTATION TIMEFRAME
COST-EFFECTIVENESS Medium Immediate Quick Start
CO-BENEFITS High
FEASIBILITY High Short-Term
3 years
SCALABILITY High
EVIDENCE BASE Medium Long-Term ProgrammeCycle
5 years
Expense: $500,000 +
Impacts Addressed: Loss of marine ecosystems, food insecurity
MDG BOOST 7
Coral reef restoration programmes have significant co-benefits
and rate highly for feasibility and scalability. The programme
increases the breeding of certain fish species, positively impacting
biodiversity and food security. In Kiribati, coral reefs are critical to
subsistence and artisanal fisheries that are the main life-supporting
activities of local communities.
Implementation risks include a lack of funding and awareness and
a lack of interest in implementing programmes at the local level.
Increased tourism, which puts additional pressure on coral reef
ecosystems, also poses a major risk to established programmes.
Programme guidelines are locally and globally available. Local
NGOs are involved in training for project implementation. The
programme could benefit from additional peer-reviewed study and
assessment.
184 | ADAPTATION PERFORMANCE REVIEW - ECONOMIC STRESS | Climate Vulnerability Monitor
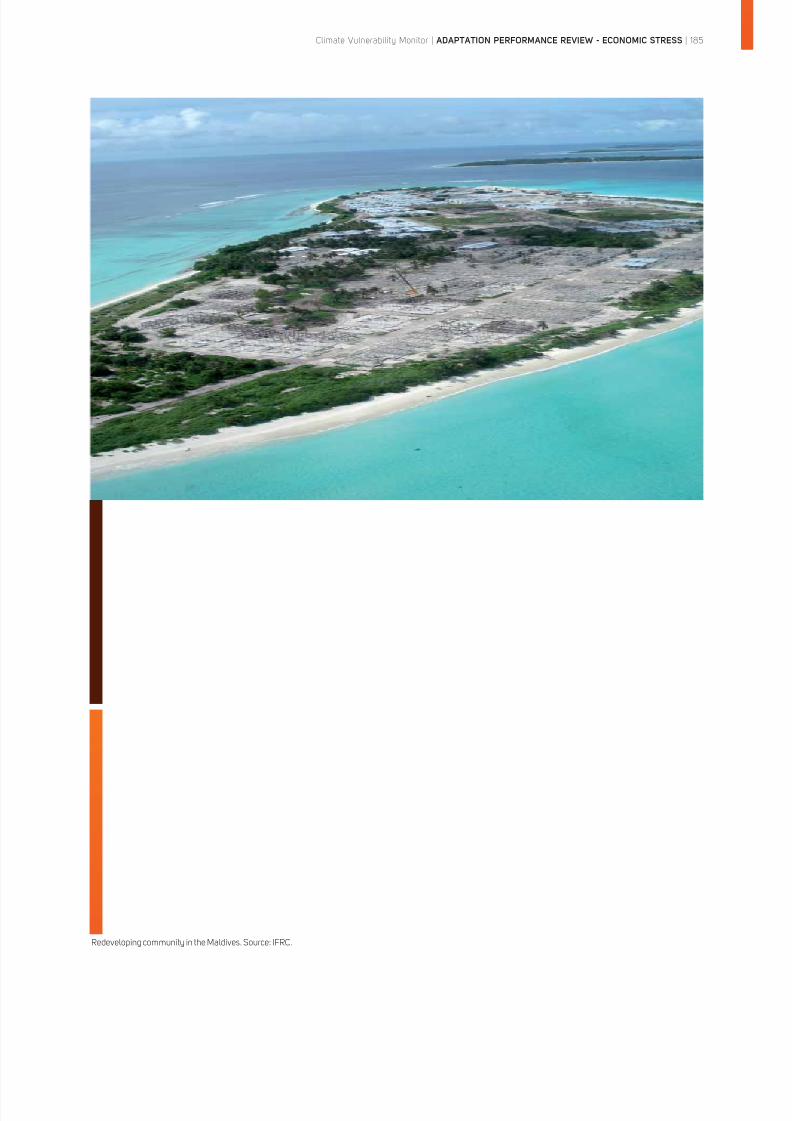
8/8/2019 Climate Vulnerability Monitor 2010: The State of the Climate Crisis
http://slidepdf.com/reader/full/climate-vulnerability-monitor-2010-the-state-of-the-climate-crisis 187/291
Redeveloping community in the Maldives. Source: IFRC.
Climate Vulnerability Monitor | ADAPTATION PERFORMANCE REVIEW - ECONOMIC STRESS | 185
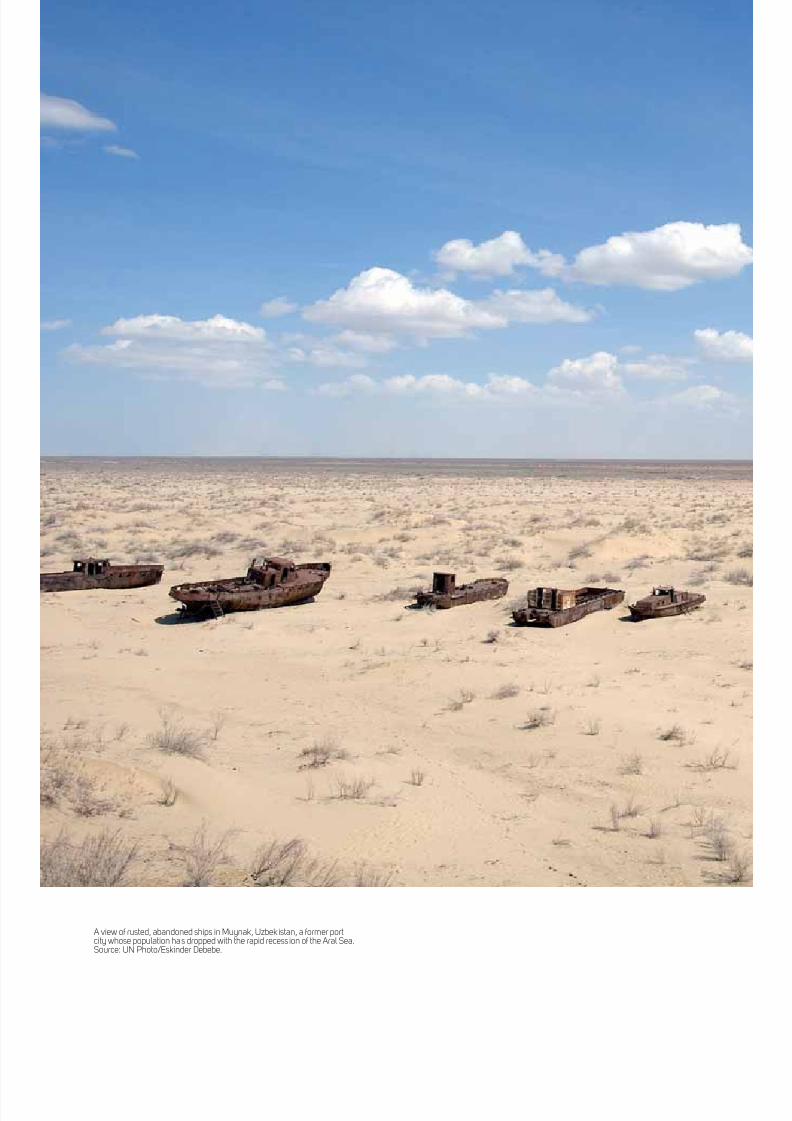
8/8/2019 Climate Vulnerability Monitor 2010: The State of the Climate Crisis
http://slidepdf.com/reader/full/climate-vulnerability-monitor-2010-the-state-of-the-climate-crisis 188/291
A view of rusted, abandoned ships in Muynak, Uzbekistan, a former portcity whose population has dropped with the rapid recession of the Aral Sea.Source: UN Photo/Eskinder Debebe.
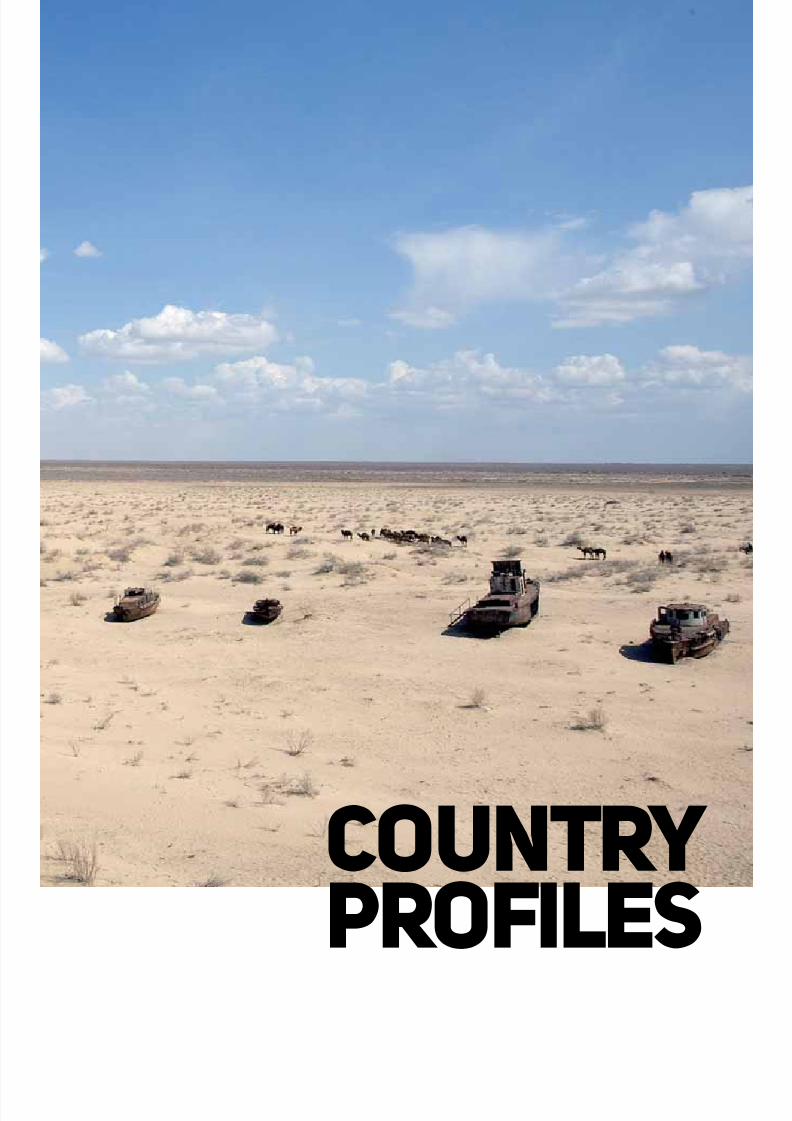
8/8/2019 Climate Vulnerability Monitor 2010: The State of the Climate Crisis
http://slidepdf.com/reader/full/climate-vulnerability-monitor-2010-the-state-of-the-climate-crisis 189/291
COUNTRY
PROFILES
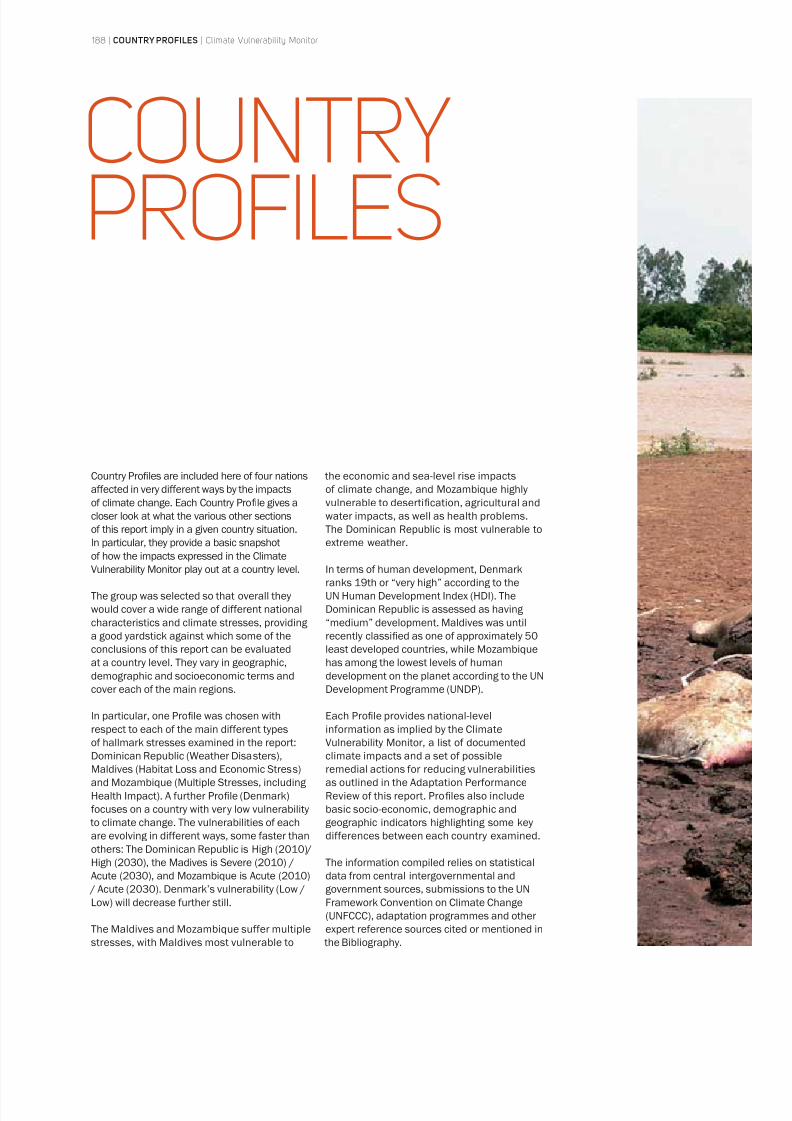
8/8/2019 Climate Vulnerability Monitor 2010: The State of the Climate Crisis
http://slidepdf.com/reader/full/climate-vulnerability-monitor-2010-the-state-of-the-climate-crisis 190/291
188 | COUNTRY PROFILES | Climate Vulnerability Monitor
COUNTRYPROFILES
Country Profiles are included here of four nations
affected in very different ways by the impacts
of climate change. Each Country Profile gives a
closer look at what the various other sections
of this report imply in a given country situation.In particular, they provide a basic snapshot
of how the impacts expressed in the Climate
Vulnerability Monitor play out at a country level.
The group was selected so that overall they
would cover a wide range of different national
characteristics and climate stresses, providing
a good yardstick against which some of the
conclusions of this report can be evaluated
at a country level. They vary in geographic,
demographic and socioeconomic terms and
cover each of the main regions.
In particular, one Profile was chosen withrespect to each of the main different types
of hallmark stresses examined in the report:
Dominican Republic (Weather Disasters),
Maldives (Habitat Loss and Economic Stress)
and Mozambique (Multiple Stresses, including
Health Impact). A further Profile (Denmark)
focuses on a country with very low vulnerability
to climate change. The vulnerabilities of each
are evolving in different ways, some faster than
others: The Dominican Republic is High (2010)/
High (2030), the Madives is Severe (2010) /
Acute (2030), and Mozambique is Acute (2010)
/ Acute (2030). Denmark’s vulnerability (Low /Low) will decrease further still.
The Maldives and Mozambique suffer multiple
stresses, with Maldives most vulnerable to
the economic and sea-level rise impacts
of climate change, and Mozambique highly
vulnerable to desertification, agricultural and
water impacts, as well as health problems.
The Dominican Republic is most vulnerable toextreme weather.
In terms of human development, Denmark
ranks 19th or “very high” according to the
UN Human Development Index (HDI). The
Dominican Republic is assessed as having
“medium” development. Maldives was until
recently classified as one of approximately 50
least developed countries, while Mozambique
has among the lowest levels of human
development on the planet according to the UN
Development Programme (UNDP).
Each Profile provides national-levelinformation as implied by the Climate
Vulnerability Monitor, a list of documented
climate impacts and a set of possible
remedial actions for reducing vulnerabilities
as outlined in the Adaptation Performance
Review of this report. Profiles also include
basic socio-economic, demographic and
geographic indicators highlighting some key
differences between each country examined.
The information compiled relies on statistical
data from central intergovernmental and
government sources, submissions to the UNFramework Convention on Climate Change
(UNFCCC), adaptation programmes and other
expert reference sources cited or mentioned in
the Bibliography.
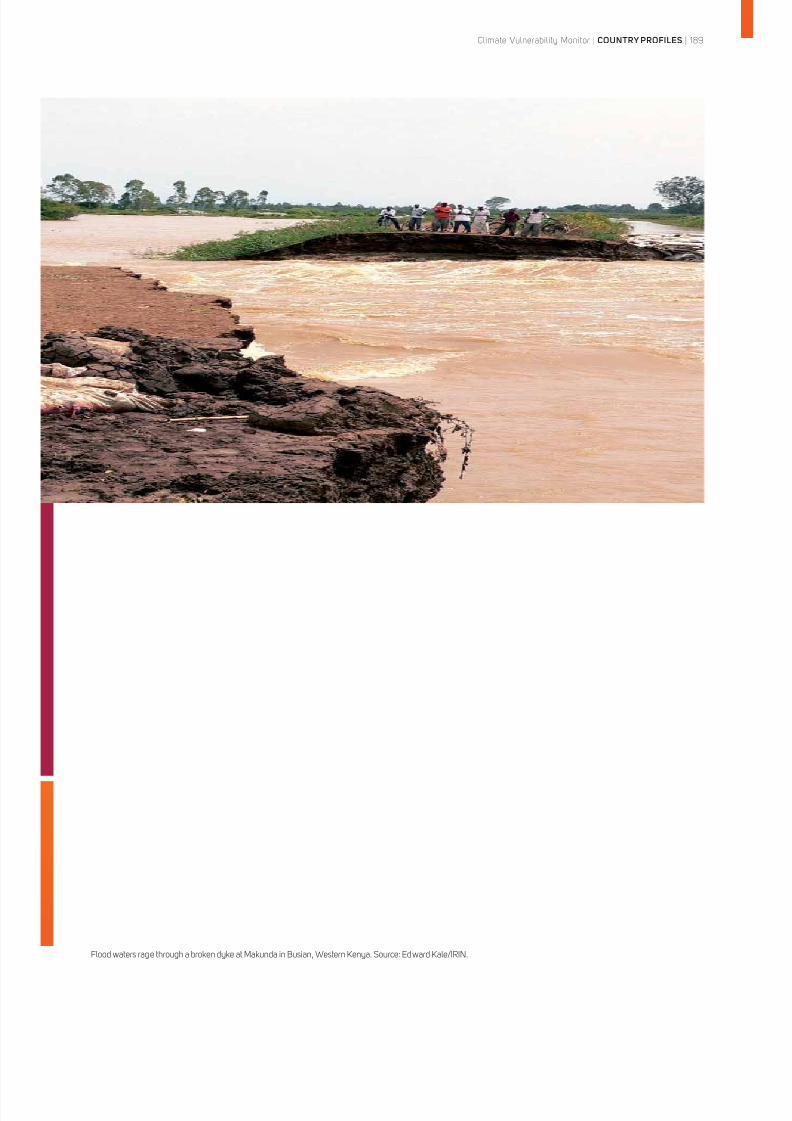
8/8/2019 Climate Vulnerability Monitor 2010: The State of the Climate Crisis
http://slidepdf.com/reader/full/climate-vulnerability-monitor-2010-the-state-of-the-climate-crisis 191/291
Climate Vulnerability Monitor | COUNTRY PROFILES | 189
Flood waters rage through a broken dyke at Makunda in Busian, Western Kenya. Source: Edward Kale/IRIN.
8/8/2019 Climate Vulnerability Monitor 2010: The State of the Climate Crisis
http://slidepdf.com/reader/full/climate-vulnerability-monitor-2010-the-state-of-the-climate-crisis 192/291
190 | COUNTRY PROFILES | Climate Vulnerability Monitor
DENMARKLOW
With its relatively small population of
5.4 million and a total area of 43,000
square km, Denmark is the smallest
country in Scandinavia, comprised by the
northward-thrusting peninsula of Jutlandand 443 named islands. The climate in
Denmark is temperate with precipitation
evenly distributed over the year and mean
annual temperatures of 7.7º Celsius
(45.9º Fahrenheit).287 More than 66% of
the country area is used for agriculture,
11% is forested, and 10% is towns, roads,
and scattered housing. The rest is natural
areas, such as lakes and watercourses.288
In relation to the impacts of climate
change, Denmark is a robust country.
Legislation prevents building in rivervalleys, along the coast, and in the
forests. Agricultural land is well drained,
and in dry periods, farmers can access
various irrigation methods. Weather
disasters are rare and carry extremely low
casualties. Systematic warning systems
function well and almost all damage
losses would be covered by insurance.
Nevertheless, since Denmark hasregistered multiple billion dollar storms
during the last 20 years, it registers a
factor of Moderate for Weather Disasters,
which may overstate the situation. Finally,
the Danish public health sector provides
medical care of high standards to all
income groups, and water sanitation
levels are high.289 Thus, the vulnerability
trends observed in Denmark as a result
of climate change differ significantly
from other case countries in this report.
In several areas, the impacts of climate
change are considered to result ineconomic gains rather than losses.
The economic stress Monitor shows a
near positive climate change impact
in Denmark 2010, and a clear positive
impact by 2030. The positive effect is
related to the fisheries sector, since
catch potential is expected to increase
due to the warming effect of theoceans. Statistics from DMI (the Danish
Meteorological Institute) show that
the mean temperature in Denmark is
approaching 8.5ºC (47.3º F); an increase
of almost 1.5º C (2.7º F) since the end
of the 19 th century.290 Following a recent
study, rising temperatures lead to large-
scale redistribution of catch potential
with an average 30-70% increase in
high-latitude regions.291 Excessive algae
blooms including toxic effects for fish
and other aquaculture especially in the
Baltic Sea, may limit some of that possibleimprovement in fish catch. Furthermore,
rising temperatures are also expected
to have positive impacts on agricultural
production, since CO2
concentrations will
SOCIO-ECONOMIC DEVELOPMENT
HUMAN DEVELOPMENT (RANK) Very High (19th)
LIFE EXPECTANCY 78.2 years
ANNUAL POPULATION GROWTH 0.10%
ILLITERACY 1%
URBAN POPULATION 85%
ACCESS TO ELECTRICITY 100%
GENDER DEVELOPMENT 12th
UNDERNOURISHED POPULATION (2002/04) <2.5%
LIVING BELOW POVERTY LINE ($2/DAY) No data
POPULATION WITHOUT IMPROVED WATER SOURCE No data
OFFICIAL DEVELOPMENT ASSISTANCE (2008) $2.8 billion (disbursed)
PUBLIC HEALTH EXPENDITURE 8%
PUBLIC EDUCATION EXPENDITURE 7%
KEY FIGURES
POPULATION 5,526,000
ECONOMY
2010 GDP PPP (US DOLLARS)
TOTAL $203.2 billion
PER CAPITA $36,336
REAL GROWTH 1.20%
GDP BY SECTOR
PRIMARY/EXTRACTIVE 1.2%
SECONDARY/PRODUCTIVE 23.8%
TERTIARY/SERVICES 74.9%
KEY INDUSTRIES Oil and gas, Clean EnergyTechnologies, Pharmaceuticals,Information Technology, ShippingEquipment, Business Services,Research and Development
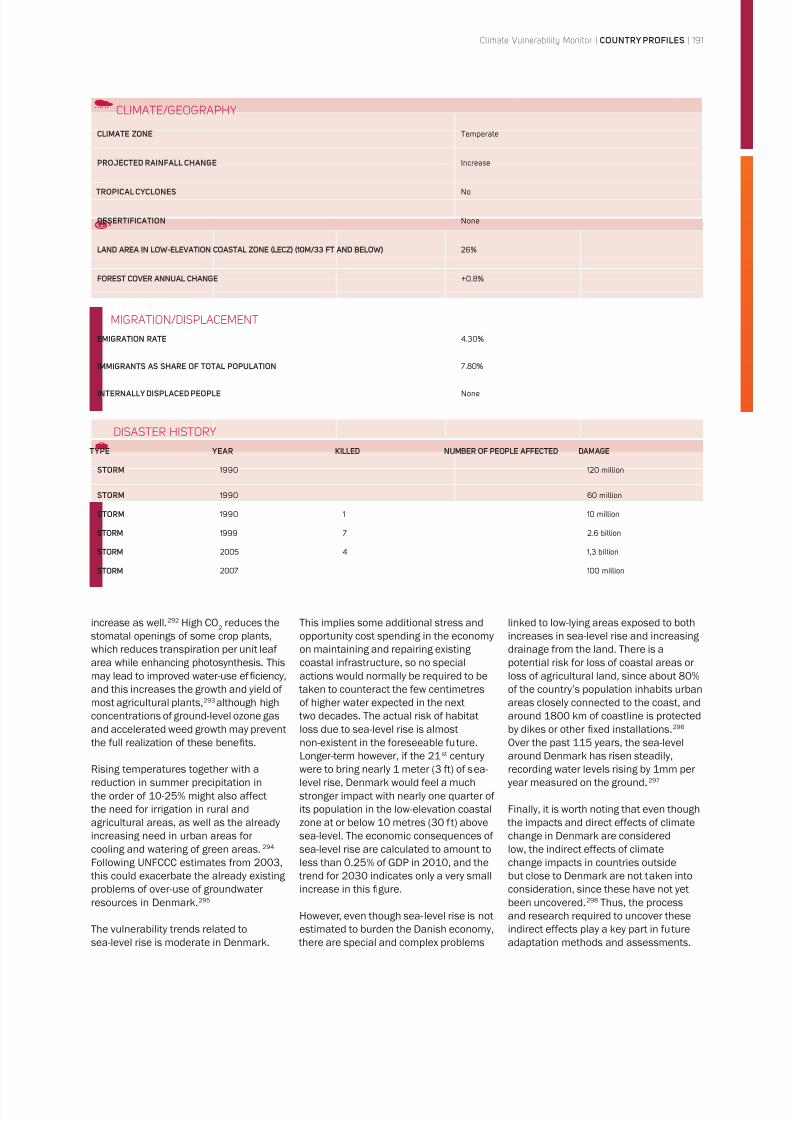
8/8/2019 Climate Vulnerability Monitor 2010: The State of the Climate Crisis
http://slidepdf.com/reader/full/climate-vulnerability-monitor-2010-the-state-of-the-climate-crisis 193/291
Climate Vulnerability Monitor | COUNTRY PROFILES | 191
increase as well.292 High CO2
reduces the
stomatal openings of some crop plants,
which reduces transpiration per unit leaf
area while enhancing photosynthesis. This
may lead to improved water-use ef ficiency,
and this increases the growth and yield of
most agricultural plants,293 although high
concentrations of ground-level ozone gasand accelerated weed growth may prevent
the full realization of these benefi ts.
Rising temperatures together with a
reduction in summer precipitation in
the order of 10-25% might also affect
the need for irrigation in rural and
agricultural areas, as well as the already
increasing need in urban areas for
cooling and watering of green areas.294
Following UNFCCC estimates from 2003,
this could exacerbate the already existing
problems of over-use of groundwaterresources in Denmark.295
The vulnerability trends related to
sea-level rise is moderate in Denmark.
This implies some additional stress and
opportunity cost spending in the economy
on maintaining and repairing existing
coastal infrastructure, so no special
actions would normally be required to be
taken to counteract the few centimetres
of higher water expected in the next
two decades. The actual risk of habitatloss due to sea-level rise is almost
non-existent in the foreseeable future.
Longer-term however, if the 21st century
were to bring nearly 1 meter (3 ft) of sea-
level rise, Denmark would feel a much
stronger impact with nearly one quarter of
its population in the low-elevation coastal
zone at or below 10 metres (30 ft) above
sea-level. The economic consequences of
sea-level rise are calculated to amount to
less than 0.25% of GDP in 2010, and the
trend for 2030 indicates only a very small
increase in this figure.
However, even though sea- level rise is not
estimated to burden the Danish economy,
there are special and complex problems
linked to low-lying areas exposed to both
increases in sea-level rise and increasing
drainage from the land. There is a
potential risk for loss of coastal areas or
loss of agricultural land, since about 80%
of the country’s population inhabits urban
areas closely connected to the coast, and
around 1800 km of coastline is protectedby dikes or other fixed installations.296
Over the past 115 years, the sea-level
around Denmark has risen steadily,
recording water levels rising by 1mm per
year measured on the ground.297
Finally, it is worth noting that even though
the impacts and direct effects of climate
change in Denmark are considered
low, the indirect effects of climate
change impacts in countries outside
but close to Denmark are not taken into
consideration, since these have not yetbeen uncovered.298 Thus, the process
and research required to uncover these
indirect effects play a key part in future
adaptation methods and assessments.
MIGRATION/DISPLACEMENT
EMIGRATION RATE 4.30%
IMMIGRANTS AS SHARE OF TOTAL POPULATION 7.80%
INTERNALLY DISPLACED PEOPLE None
CLIMATE/GEOGRAPHY
CLIMATE ZONE Temperate
PROJECTED RAINFALL CHANGE Increase
TROPICAL CYCLONES No
DESERTIFICATION None
LAND AREA IN LOW-ELEVATION COASTAL ZONE (LECZ) (10M/33 FT AND BELOW) 26%
FOREST COVER ANNUAL CHANGE +0.8%
DISASTER HISTORY
TYPE YEAR KILLED NUMBER OF PEOPLE AFFECTED DAMAGE
STORM 1990 120 million
STORM 1990 60 million
STORM 1990 1 10 million
STORM 1999 7 2.6 billion
STORM 2005 4 1,3 billion
STORM 2007 100 million
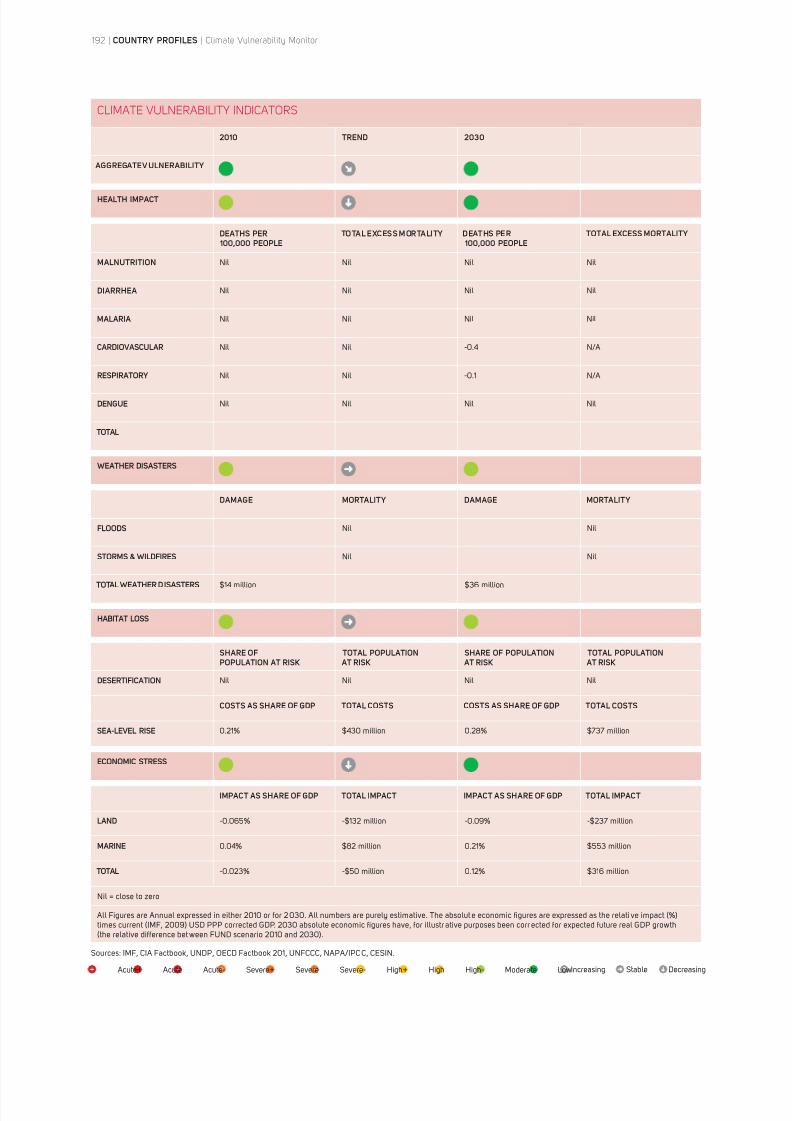
8/8/2019 Climate Vulnerability Monitor 2010: The State of the Climate Crisis
http://slidepdf.com/reader/full/climate-vulnerability-monitor-2010-the-state-of-the-climate-crisis 194/291
192 | COUNTRY PROFILES | Climate Vulnerability Monitor
CLIMATE VULNERABILITY INDICATORS
2010 TREND 2030
AGGREGATE V ULNERABILITY
HEALTH IMPACT
DEATHS PER 100,000 PEOPLE
TOTAL EXCESS MORTALITY DEATHS PER 100,000 PEOPLE
TOTAL EXCESS MORTALITY
MALNUTRITION Nil Nil Nil Nil
DIARRHEA Nil Nil Nil Nil
MALARIA Nil Nil Nil Nil
CARDIOVASCULAR Nil Nil -0.4 N/A
RESPIRATORY Nil Nil -0.1 N/A
DENGUE Nil Nil Nil Nil
TOTAL
WEATHER DISASTERS
DAMAGE MORTALITY DAMAGE MORTALITY
FLOODS Nil Nil
STORMS & WILDFIRES Nil Nil
TOTAL WEATHER DISASTERS $14 million $36 million
HABITAT LOSS
SHARE OFPOPULATION AT RISK
TOTAL POPULATION AT RISK
SHARE OF POPULATION AT RISK
TOTAL POPULATION AT RISK
DESERTIFICATION Nil Nil Nil Nil
COSTS AS SHARE OF GDP TOTAL COSTS COSTS AS SHARE OF GDP TOTAL COSTS
SEA-LEVEL RISE 0.21% $430 million 0.28% $737 million
ECONOMIC STRESS
IMPACT AS SHARE OF GDP TOTAL IMPACT IMPACT AS SHARE OF GDP TOTAL IMPACT
LAND -0.065% -$132 million -0.09% -$237 million
MARINE 0.04% $82 million 0.21% $553 million
TOTAL -0.023% -$50 million 0.12% $316 million
Nil = close to zero
All Figures are Annual expressed in either 2010 or for 2030. All numbers are purely estimative. The absolut e economic figures are expressed as the relati ve impact (%)times current (IMF, 2009) USD PPP corrected GDP. 2030 absolute economic figures have, for illustr ative purposes been corr ected for expected future real GDP growth(the relative difference bet ween FUND scenario 2010 and 2030).
Acute+ Acute Acute- Severe+ Severe Severe- High+ High High- Moderate LowIncreasing Stable Decreasing
Sources: IMF, CIA Factbook, UNDP, OECD Factbook 201, UNFCCC, NAPA/IPC C, CESIN.
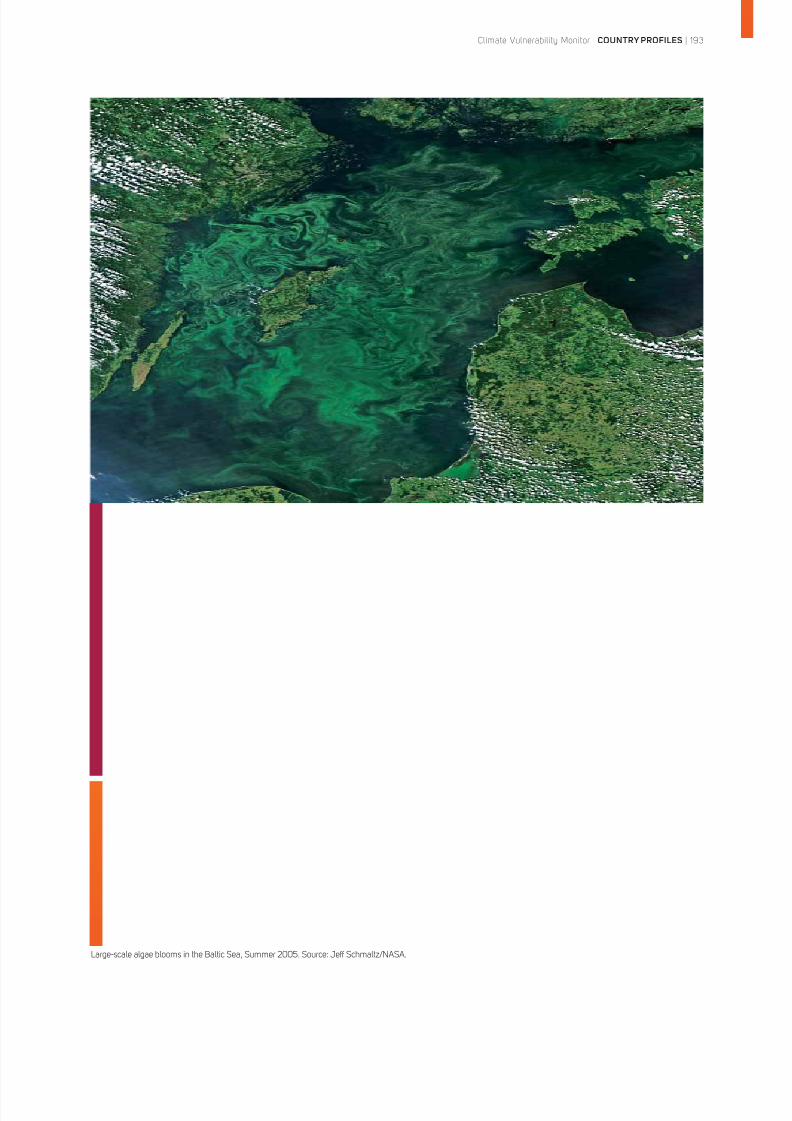
8/8/2019 Climate Vulnerability Monitor 2010: The State of the Climate Crisis
http://slidepdf.com/reader/full/climate-vulnerability-monitor-2010-the-state-of-the-climate-crisis 195/291
Climate Vulnerability Monitor | COUNTRY PROFILES | 193
Large-scale algae blooms in the Baltic Sea, Summer 2005. Source: Jeff Schmaltz/NASA.
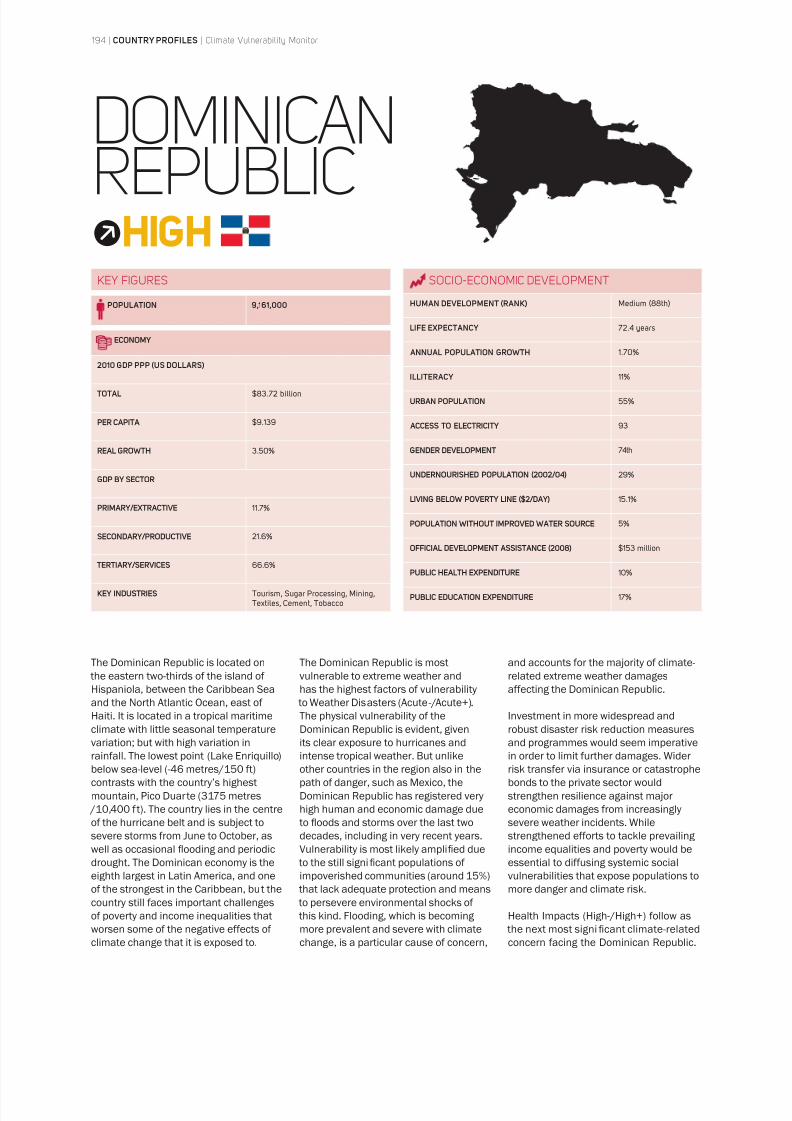
8/8/2019 Climate Vulnerability Monitor 2010: The State of the Climate Crisis
http://slidepdf.com/reader/full/climate-vulnerability-monitor-2010-the-state-of-the-climate-crisis 196/291
194 | COUNTRY PROFILES | Climate Vulnerability Monitor
DOMINICAN
The Dominican Republic is located on
the eastern two-thirds of the island of
Hispaniola, between the Caribbean Sea
and the North Atlantic Ocean, east of
Haiti. It is located in a tropical maritimeclimate with little seasonal temperature
variation; but with high variation in
rainfall. The lowest point (Lake Enriquillo)
below sea-level (-46 metres/150 ft)
contrasts with the country’s highest
mountain, Pico Duarte (3175 metres
/10,400 ft). The country lies in the centre
of the hurricane belt and is subject to
severe storms from June to October, as
well as occasional flooding and periodic
drought. The Dominican economy is the
eighth largest in Latin America, and one
of the strongest in the Caribbean, but thecountry still faces important challenges
of poverty and income inequalities that
worsen some of the negative effects of
climate change that it is exposed to.
The Dominican Republic is most
vulnerable to extreme weather and
has the highest factors of vulnerability
to Weather Disasters (Acute-/Acute+).
The physical vulnerability of theDominican Republic is evident, given
its clear exposure to hurricanes and
intense tropical weather. But unlike
other countries in the region also in the
path of danger, such as Mexico, the
Dominican Republic has registered very
high human and economic damage due
to floods and storms over the last two
decades, including in very recent years.
Vulnerability is most likely amplified due
to the still significant populations of
impoverished communities (around 15%)
that lack adequate protection and means to persevere environmental shocks of
this kind. Flooding, which is becoming
more prevalent and severe with climate
change, is a particular cause of concern,
and accounts for the majority of climate-
related extreme weather damages
affecting the Dominican Republic.
Investment in more widespread androbust disaster risk reduction measures
and programmes would seem imperative
in order to limit further damages. Wider
risk transfer via insurance or catastrophe
bonds to the private sector would
strengthen resilience against major
economic damages from increasingly
severe weather incidents. While
strengthened efforts to tackle prevailing
income equalities and poverty would be
essential to diffusing systemic social
vulnerabilities that expose populations to
more danger and climate risk.
Health Impacts (High-/High+) follow as
the next most significant climate-related
concern facing the Dominican Republic.
SOCIO-ECONOMIC DEVELOPMENT
HUMAN DEVELOPMENT (RANK) Medium (88th)
LIFE EXPECTANCY 72.4 years
ANNUAL POPULATION GROWTH 1.70%
ILLITERACY 11%
URBAN POPULATION 55%
ACCESS TO ELECTRICITY 93
GENDER DEVELOPMENT 74th
UNDERNOURISHED POPULATION (2002/04) 29%
LIVING BELOW POVERTY LINE ($2/DAY) 15.1%
POPULATION WITHOUT IMPROVED WATER SOURCE 5%
OFFICIAL DEVELOPMENT ASSISTANCE (2008) $153 million
PUBLIC HEALTH EXPENDITURE 10%
PUBLIC EDUCATION EXPENDITURE 17%
KEY FIGURES
POPULATION 9,161,000
ECONOMY
2010 GDP PPP (US DOLLARS)
TOTAL $83.72 billion
PER CAPITA $9.139
REAL GROWTH 3.50%
GDP BY SECTOR
PRIMARY/EXTRACTIVE 11.7%
SECONDARY/PRODUCTIVE 21.6%
TERTIARY/SERVICES 66.6%
KEY INDUSTRIES Tourism, Sugar Processing, Mining,Textiles, Cement, Tobacco
REPUBLICHIGH
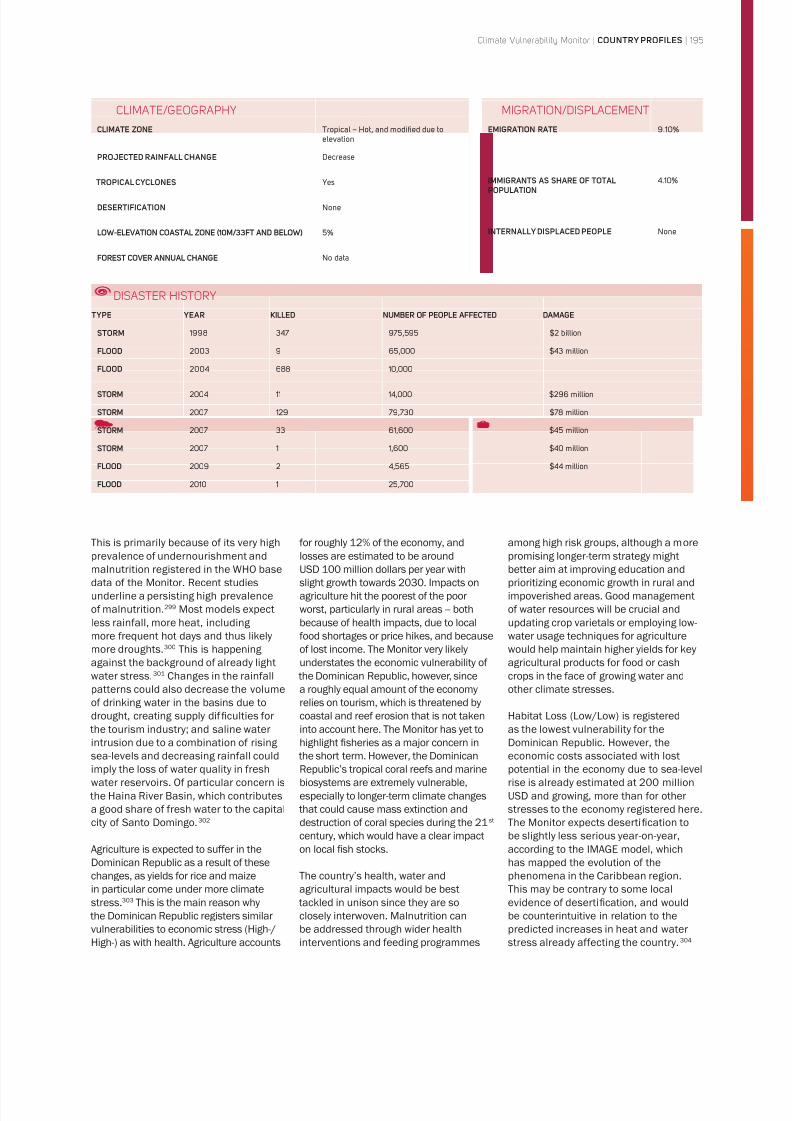
8/8/2019 Climate Vulnerability Monitor 2010: The State of the Climate Crisis
http://slidepdf.com/reader/full/climate-vulnerability-monitor-2010-the-state-of-the-climate-crisis 197/291
Climate Vulnerability Monitor | COUNTRY PROFILES | 195
This is primarily because of its very high
prevalence of undernourishment and
malnutrition registered in the WHO base
data of the Monitor. Recent studies
underline a persisting high prevalence
of malnutrition.299 Most models expect
less rainfall, more heat, including
more frequent hot days and thus likely
more droughts.300 This is happening
against the background of already light
water stress.301 Changes in the rainfall
patterns could also decrease the volume
of drinking water in the basins due to
drought, creating supply dif ficulties for the tourism industry; and saline water
intrusion due to a combination of rising
sea-levels and decreasing rainfall could
imply the loss of water quality in fresh
water reservoirs. Of particular concern is
the Haina River Basin, which contributes
a good share of fresh water to the capital
city of Santo Domingo.302
Agriculture is expected to suffer in the
Dominican Republic as a result of these
changes, as yields for rice and maize
in particular come under more climatestress.303 This is the main reason why
the Dominican Republic registers similar
vulnerabilities to economic stress (High-/
High-) as with health. Agriculture accounts
for roughly 12% of the economy, and
losses are estimated to be around
USD 100 million dollars per year with
slight growth towards 2030. Impacts on
agriculture hit the poorest of the poor
worst, particularly in rural areas -- both
because of health impacts, due to local
food shortages or price hikes, and because
of lost income. The Monitor very likely
understates the economic vulnerability of
the Dominican Republic, however, since
a roughly equal amount of the economy
relies on tourism, which is threatened by
coastal and reef erosion that is not takeninto account here. The Monitor has yet to
highlight fisheries as a major concern in
the short term. However, the Dominican
Republic’s tropical coral reefs and marine
biosystems are extremely vulnerable,
especially to longer-term climate changes
that could cause mass extinction and
destruction of coral species during the 21st
century, which would have a clear impact
on local fish stocks.
The country’s health, water and
agricultural impacts would be best tackled in unison since they are so
closely interwoven. Malnutrition can
be addressed through wider health
interventions and feeding programmes
among high risk groups, although a more
promising longer-term strategy might
better aim at improving education and
prioritizing economic growth in rural and
impoverished areas. Good management
of water resources will be crucial and
updating crop varietals or employing low-
water usage techniques for agriculture
would help maintain higher yields for key
agricultural products for food or cash
crops in the face of growing water and
other climate stresses.
Habitat Loss (Low/Low) is registeredas the lowest vulnerability for the
Dominican Republic. However, the
economic costs associated with lost
potential in the economy due to sea-level
rise is already estimated at 200 million
USD and growing, more than for other
stresses to the economy registered here.
The Monitor expects desertification to
be slightly less serious year-on-year,
according to the IMAGE model, which
has mapped the evolution of the
phenomena in the Caribbean region.
This may be contrary to some localevidence of desertification, and would
be counterintuitive in relation to the
predicted increases in heat and water
stress already affecting the country.304
MIGRATION/DISPLACEMENT
EMIGRATION RATE 9.10%
IMMIGRANTS AS SHARE OF TOTALPOPULATION
4.10%
INTERNALLY DISPLACED PEOPLE None
DISASTER HISTORY
TYPE YEAR KILLED NUMBER OF PEOPLE AFFECTED DAMAGE
STORM 1998 347 975,595 $2 billion
FLOOD 2003 9 65,000 $43 million
FLOOD 2004 688 10,000
STORM 2004 11 14,000 $296 million
STORM 2007 129 79,730 $78 million
STORM 2007 33 61,600 $45 million
STORM 2007 1 1,600 $40 million
FLOOD 2009 2 4,565 $44 million
FLOOD 2010 1 25,700
CLIMATE/GEOGRAPHY
CLIMATE ZONE Tropical – Hot, and modified due toelevation
PROJECTED RAINFALL CHANGE Decrease
TROPICAL CYCLONES Yes
DESERTIFICATION None
LOW-ELEVATION COASTAL ZONE (10M/33FT AND BELOW) 5%
FOREST COVER ANNUAL CHANGE No data
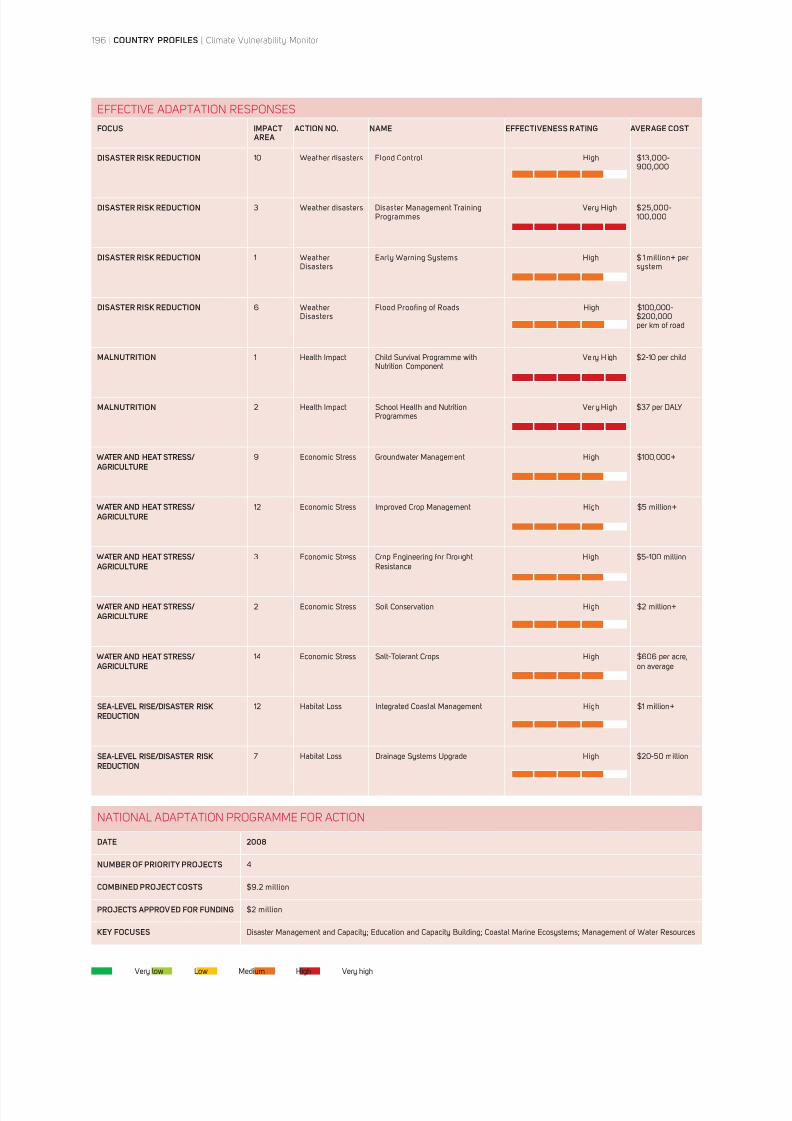
8/8/2019 Climate Vulnerability Monitor 2010: The State of the Climate Crisis
http://slidepdf.com/reader/full/climate-vulnerability-monitor-2010-the-state-of-the-climate-crisis 198/291
196 | COUNTRY PROFILES | Climate Vulnerability Monitor
NATIONAL ADAPTATION PROGRAMME FOR ACTION
DATE 2008
NUMBER OF PRIORITY PROJECTS 4
COMBINED PROJECT COSTS $9.2 million
PROJECTS APPROVED FOR FUNDING $2 million
KEY FOCUSES Disaster Management and Capacity; Education and Capacity Building; Coastal Marine Ecosystems; Management of Water Resources
EFFECTIVE ADAPTATION RESPONSES
FOCUS IMPACT AREA
ACTION NO. NAME EFFECTIVENESS RATING AVERAGE COST
DISASTER RISK REDUCTION 10 Weather disasters Flood Control High $13,000-900,000
DISASTER RISK REDUCTION 3 Weather disasters Disaster Management TrainingProgrammes
Very High $25,000-100,000
DISASTER RISK REDUCTION 1 WeatherDisasters
Early Warning Systems High $ 1 million+ persystem
DISASTER RISK REDUCTION 6 WeatherDisasters
Flood Proofing of Roads High $100,000-$200,000per km of road
MALNUTRITION 1 Health Impact Child Survival Programme withNutrition Component
Ve ry High $2-10 per child
MALNUTRITION 2 Health Impact School Health and NutritionProgrammes
Ver y High $37 per DALY
WATER AND HEAT STRESS/ AGRICULTURE
9 Economic Stress Groundwater Management High $100,000+
WATER AND HEAT STRESS/ AGRICULTURE
12 Economic Stress Improved Crop Management High $5 million+
WATER AND HEAT STRESS/ AGRICULTURE
3 Economic Stress Crop Engineering for DroughtResistance
High $5-100 million
WATER AND HEAT STRESS/ AGRICULTURE
2 Economic Stress Soil Conservation High $2 million+
WATER AND HEAT STRESS/ AGRICULTURE
14 Economic Stress Salt-Tolerant Crops High $606 per acre,on average
SEA-LEVEL RISE/DISASTER RISKREDUCTION
12 Habitat Loss Integrated Coastal Management High $1 million+
SEA-LEVEL RISE/DISASTER RISKREDUCTION
7 Habitat Loss Drainage Systems Upgrade High $20-50 million
Very low Low Medium High Very high
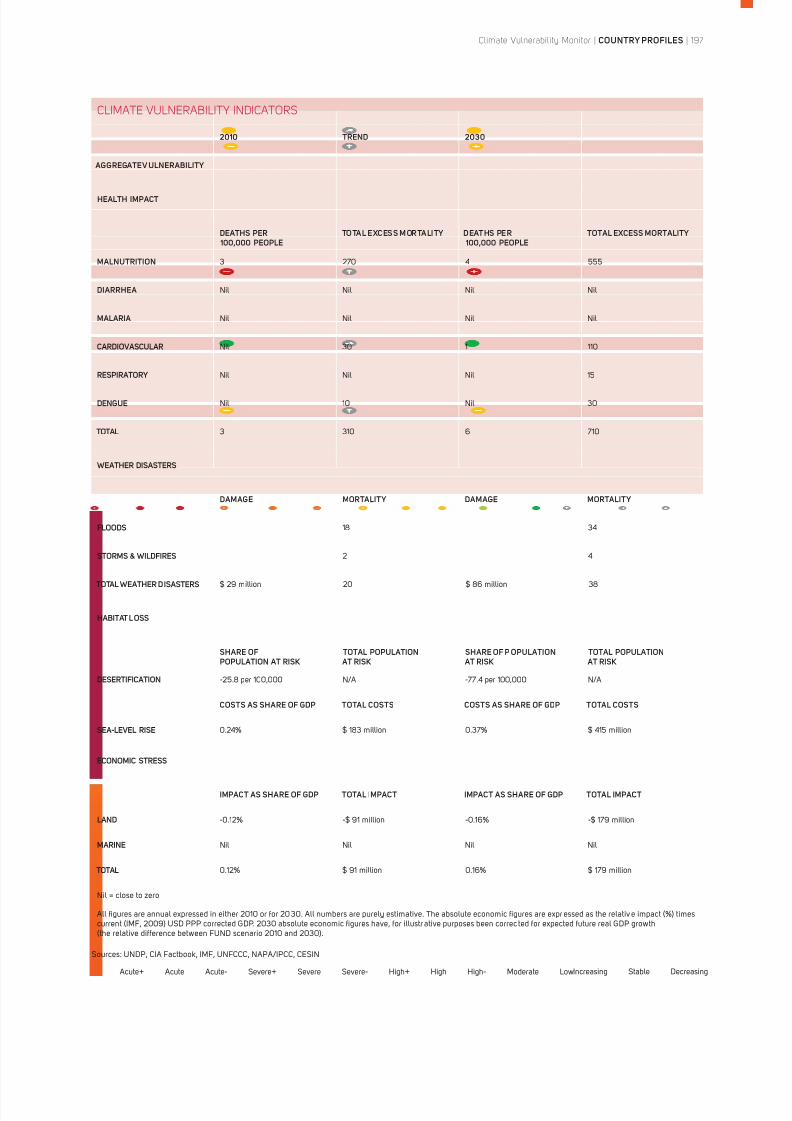
8/8/2019 Climate Vulnerability Monitor 2010: The State of the Climate Crisis
http://slidepdf.com/reader/full/climate-vulnerability-monitor-2010-the-state-of-the-climate-crisis 199/291
Climate Vulnerability Monitor | COUNTRY PROFILES | 197
CLIMATE VULNERABILITY INDICATORS
2010 TREND 2030
AGGREGATE V ULNERABILITY
HEALTH IMPACT
DEATHS PER 100,000 PEOPLE
TOTAL EXCESS MORTALITY DEATHS PER 100,000 PEOPLE
TOTAL EXCESS MORTALITY
MALNUTRITION 3 270 4 555
DIARRHEA Nil Nil Nil Nil
MALARIA Nil Nil Nil Nil
CARDIOVASCULAR Nil 30 1 110
RESPIRATORY Nil Nil Nil 15
DENGUE Nil 10 Nil 30
TOTAL 3 310 6 710
WEATHER DISASTERS
DAMAGE MORTALITY DAMAGE MORTALITY
FLOODS 18 34
STORMS & WILDFIRES 2 4
TOTAL WEATHER DISASTERS $ 29 million 20 $ 86 million 38
HABITAT LOSS
SHARE OFPOPULATION AT RISK
TOTAL POPULATION AT RISK
SHARE OF P OPULATION AT RISK
TOTAL POPULATION AT RISK
DESERTIFICATION -25.8 per 100,000 N/A -77.4 per 100,000 N/A
COSTS AS SHARE OF GDP TOTAL COSTS COSTS AS SHARE OF GDP TOTAL COSTS
SEA-LEVEL RISE 0.24% $ 183 million 0.37% $ 415 million
ECONOMIC STRESS
IMPACT AS SHARE OF GDP TOTAL IMPACT IMPACT AS SHARE OF GDP TOTAL IMPACT
LAND -0.12% -$ 91 million -0.16% -$ 179 million
MARINE Nil Nil Nil Nil
TOTAL 0.12% $ 91 million 0.16% $ 179 million
Nil = close to zero
All figures are annual expressed in either 2010 or for 20 30. All numbers are purely estimative. The absolute economic figures are expr essed as the relativ e impact (%) timescurrent (IMF, 2009) USD PPP corrected GDP. 2030 absolute economic figures have, for illustr ative purposes been correc ted for expected future real GDP growth(the relative difference between FUND scenario 2010 and 2030).
Acute+ Acute Acute- Severe+ Severe Severe- High+ High High- Moderate LowIncreasing Stable Decreasing
Sources: UNDP, CIA Factbook, IMF, UNFCCC, NAPA/IPCC, CESIN
8/8/2019 Climate Vulnerability Monitor 2010: The State of the Climate Crisis
http://slidepdf.com/reader/full/climate-vulnerability-monitor-2010-the-state-of-the-climate-crisis 200/291
198 | COUNTRY PROFILES | Climate Vulnerability Monitor
MALDIVES ACUTE
The 1,190 coral islands that form the Indian
Ocean South Asian nation of Maldives are
grouped into 26 atolls with an average
height of only 1.5 metres (4 ft/11 inches)
above sea-level. The highest point is just
2.3 metres (8 ft) above sea-level -- or 4
metres according to the country’s National
Adaptation Programme, which refers
to the height of a prominent sand dune
-- meaning the entire country falls within
the low-elevation coastal zone. 80% of the
country is actually less than 1 metre (3 ft)
above sea-level. This makes Maldives one
of the most vulnerable countries in theworld to the impacts of climate change. The
worst scenarios of warming projected by
the IPCC would see the Maldives disappear
completely under the sea well before the
end of this century. Preserving certain land
areas, such as the capital city of Male’,
may well be feasible in the medium term,
but will be dif ficult to sustain given that
sea-levels could rise 2 metres (7 ft) this
century. The vulnerability of the Maldives is
still extremely high even without taking its
complete disappearance into account.
The incremental costs associated with
protecting coastlines against erosion are
a great burden on the Maldivian economy.
Such measures are already estimated to
cost the country a colossal 16% of lost
GDP potential, and this figure will climb to
24% of today’s GDP by 2030. Between 40
and 80% of all islands in the Maldives have
already suffered severe coastal erosion,
with more than 97% of inhabited islands
reporting beach erosion in 2004, of which
64% reported severe beach erosion. The
economic output of the Maldives economy
is seriously held back by the need to divert
resources from productive investments to
efforts to protect valuable coastal property
from erosion. The Maldives economy would
see more significant growth if not weigheddown by the constant stress of coping with
this growing burden. Habitat loss is thus the
number one vulnerability for the Maldives.
Economic stress is the country’s next
highest vulnerability and mainly reflects
economic losses in the fisheries sector due
to the warming and acidifying effect of the
oceans on local fish stocks and catches.
Tuna makes up more than 70% of the
fishing industry, but sustainable catches are
said to have peaked in 2005. Agriculture
is also sensitive to growing water stresseson the Islands. Nevertheless, the Maldives’
entire primary sector -- of which fisheries
are a core part -- represents just 6-8% of
the total economy. There is a great risk that
the level of economic impacts suffered by
the Maldives are not well represented here,
in particular because the Monitor has not
taken into account effects on other sectors
of the economy. The tourism industry,
which survives on beach holidaymakers,
makes up almost one third of the Maldives
economy. Three quarters of all tourists
engage in snorkelling, and around one third
engage in scuba diving. However, since
tourism indirectly involves much of the rest
of the nation’s economy, the total impact
of the tourism sector is estimated at closer
to 67% of GDP.305 Since fishing is also a keyeconomic activity in Maldives, a full three
quarters of the country’s economy is under
extreme stress due to climate change.
Reef erosion to just one popular diving spot
was found to have cost the local industry
half a million dollars in lost revenue in just
one year. The total disappearance of the
Maldives’ coral reefs is almost inevitable
with the rate of temperature increase. As
a result, the Maldives stands to lose the
mainstay of its economy.
Health risks in the Maldives are also on the rise due to climate change. In remote,
less developed island communities,
malnutrition is still prevalent and is
exacerbated by the agricultural and fishery
SOCIO-ECONOMIC DEVELOPMENT
HUMAN DEVELOPMENT (RANK) Medium (95th)
LIFE EXPECTANCY 71.1 years
ANNUAL POPULATION GROWTH 1.40%
ILLITERACY 3%
URBAN POPULATION 26%
ACCESS TO ELECTRICITY No Data
GENDER DEVELOPMENT 77th
UNDERNOURISHED POPULATION (2002/04) 10%
LIVING BELOW POVERTY LINE ($2/DAY) No Data
POPULATION WITHOUT IMPROVED WATER SOURCE 17%
OFFICIAL DEVELOPMENT ASSISTANCE (2008) $54 million
PUBLIC HEALTH EXPENDITURE 14%
PUBLIC EDUCATION EXPENDITURE 15%
KEY FIGURES
POPULATION 345,000
ECONOMY
2010 GDP PPP (US DOLLARS)
TOTAL $1.76 billion
PER CAPITA $5,097
REAL GROWTH 3.45%
GDP BY SECTOR
PRIMARY/EXTRACTIVE 6%
SECONDARY/PRODUCTIVE 17%
TERTIARY/SERVICES 77%
KEY INDUSTRIES Tourism (30%)
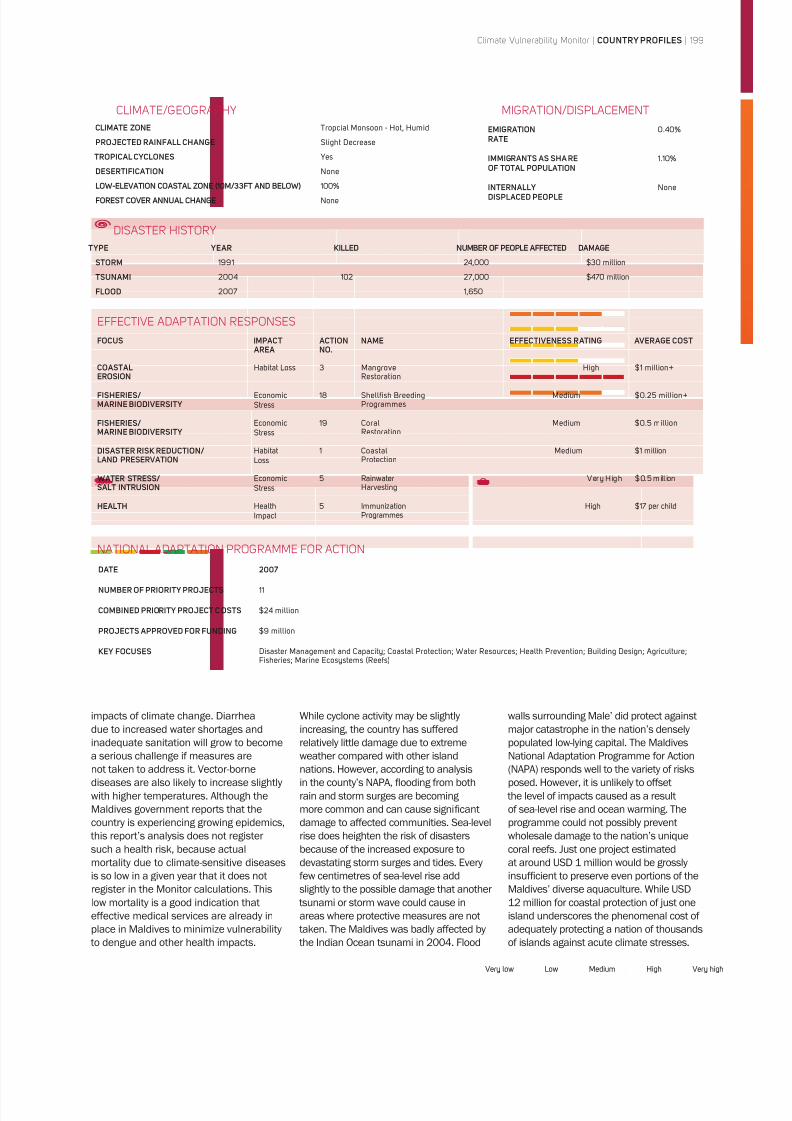
8/8/2019 Climate Vulnerability Monitor 2010: The State of the Climate Crisis
http://slidepdf.com/reader/full/climate-vulnerability-monitor-2010-the-state-of-the-climate-crisis 201/291
Climate Vulnerability Monitor | COUNTRY PROFILES | 199
impacts of climate change. Diarrheadue to increased water shortages and
inadequate sanitation will grow to become
a serious challenge if measures are
not taken to address it. Vector-borne
diseases are also likely to increase slightly
with higher temperatures. Although the
Maldives government reports that the
country is experiencing growing epidemics,
this report’s analysis does not register
such a health risk, because actual
mortality due to climate-sensitive diseases
is so low in a given year that it does not
register in the Monitor calculations. Thislow mortality is a good indication that
effective medical services are already in
place in Maldives to minimize vulnerability
to dengue and other health impacts.
While cyclone activity may be slightlyincreasing, the country has suffered
relatively little damage due to extreme
weather compared with other island
nations. However, according to analysis
in the county’s NAPA, flooding from both
rain and storm surges are becoming
more common and can cause significant
damage to affected communities. Sea-level
rise does heighten the risk of disasters
because of the increased exposure to
devastating storm surges and tides. Every
few centimetres of sea-level rise add
slightly to the possible damage that another tsunami or storm wave could cause in
areas where protective measures are not
taken. The Maldives was badly affected by
the Indian Ocean tsunami in 2004. Flood
walls surrounding Male’ did protect againstmajor catastrophe in the nation’s densely
populated low-lying capital. The Maldives
National Adaptation Programme for Action
(NAPA) responds well to the variety of risks
posed. However, it is unlikely to offset
the level of impacts caused as a result
of sea-level rise and ocean warming. The
programme could not possibly prevent
wholesale damage to the nation’s unique
coral reefs. Just one project estimated
at around USD 1 million would be grossly
insuf ficient to preserve even portions of the
Maldives’ diverse aquaculture. While USD12 million for coastal protection of just one
island underscores the phenomenal cost of
adequately protecting a nation of thousands
of islands against acute climate stresses.
Very low Low Medium High Very high
NATIONAL ADAPTATION PROGRAMME FOR ACTION
DATE 2007
NUMBER OF PRIORITY PROJECTS 11
COMBINED PRIORITY PROJECT COSTS $24 million
PROJECTS APPROVED FOR FUNDING $9 million
KEY FOCUSES Disaster Management and Capacity; Coastal Protection; Water Resources; Health Prevention; Building Design; Agriculture;Fisheries; Marine Ecosystems (Reefs)
MIGRATION/DISPLACEMENT
EMIGRATIONRATE
0.40%
IMMIGRANTS AS SHA REOF TOTAL POPULATION
1.10%
INTERNALLYDISPLACED PEOPLE
None
DISASTER HISTORY
TYPE YEAR KILLED NUMBER OF PEOPLE AFFECTED DAMAGE
STORM 1991 24,000 $30 million
TSUNAMI 2004 102 27,000 $470 million
FLOOD 2007 1,650
CLIMATE/GEOGRAPHY
CLIMATE ZONE Tropcial Monsoon - Hot, Humid
PROJECTED RAINFALL CHANGE Slight Decrease
TROPICAL CYCLONES Yes
DESERTIFICATION None
LOW-ELEVATION COASTAL ZONE (10M/33FT AND BELOW) 100%
FOREST COVER ANNUAL CHANGE None
EFFECTIVE ADAPTATION RESPONSES
FOCUS IMPACT AREA
ACTIONNO.
NAME EFFECTIVENESS RATING AVERAGE COST
COASTALEROSION
Habitat Loss 3 MangroveRestoration
High $1 million+
FISHERIES/MARINE BIODIVERSITY
EconomicStress
18 Shellfish BreedingProgrammes
Medium $0.25 million+
FISHERIES/MARINE BIODIVERSITY
EconomicStress
19 CoralRestoration
Medium $0.5 million
DISASTER RISK REDUCTION/LAND PRESERVATION
HabitatLoss
1 CoastalProtection
Medium $1 million
WATER STRESS/SALT INTRUSION
EconomicStress
5 RainwaterHarvesting
Very High $0.5 mill ion
HEALTH HealthImpact
5 ImmunizationProgrammes
High $17 per child
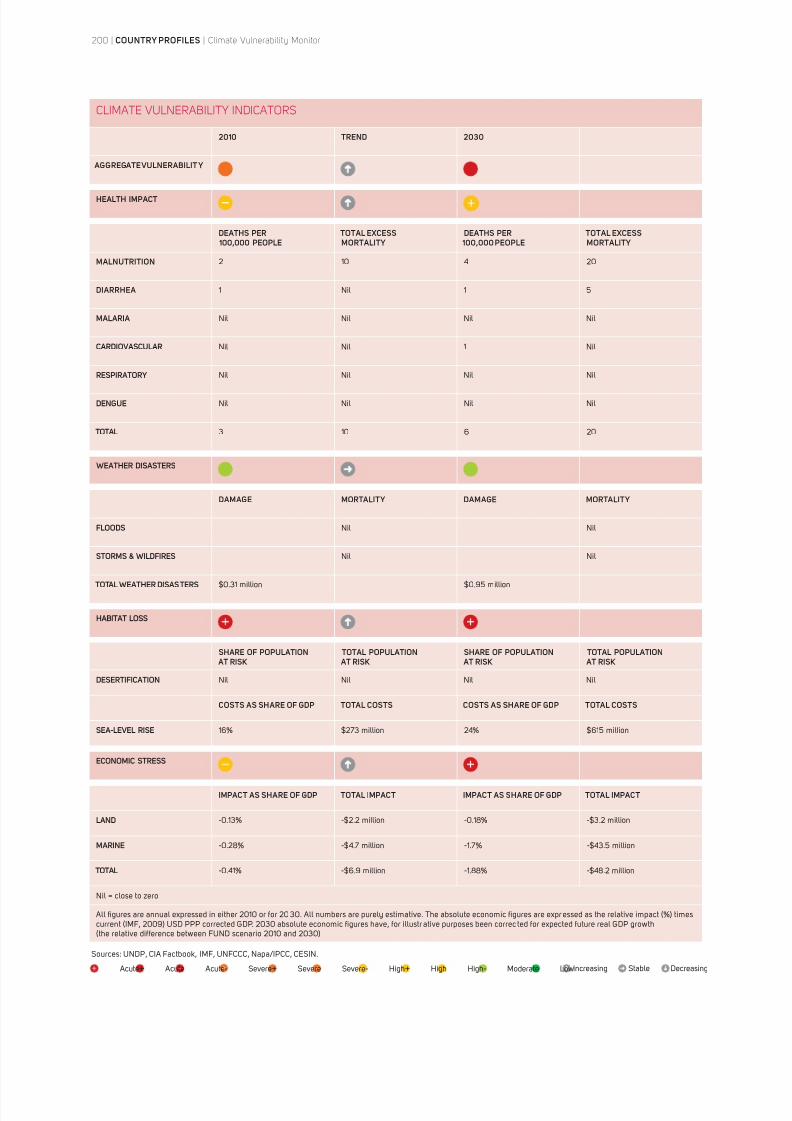
8/8/2019 Climate Vulnerability Monitor 2010: The State of the Climate Crisis
http://slidepdf.com/reader/full/climate-vulnerability-monitor-2010-the-state-of-the-climate-crisis 202/291
200 | COUNTRY PROFILES | Climate Vulnerability Monitor
CLIMATE VULNERABILITY INDICATORS
2010 TREND 2030
AGGREGATE VULNERABILIT Y
HEALTH IMPACT
DEATHS PER 100,000 PEOPLE
TOTAL EXCESSMORTALITY
DEATHS PER 100,000 PEOPLE
TOTAL EXCESSMORTALITY
MALNUTRITION 2 10 4 20
DIARRHEA 1 Nil 1 5
MALARIA Nil Nil Nil Nil
CARDIOVASCULAR Nil Nil 1 Nil
RESPIRATORY Nil Nil Nil Nil
DENGUE Nil Nil Nil Nil
TOTAL 3 10 6 20
WEATHER DISASTERS
DAMAGE MORTALITY DAMAGE MORTALITY
FLOODS Nil Nil
STORMS & WILDFIRES Nil Nil
TOTAL WEATHER DISASTERS $0.31 million $0.95 million
HABITAT LOSS
SHARE OF POPULATION AT RISK
TOTAL POPULATION AT RISK
SHARE OF POPULATION AT RISK
TOTAL POPULATION AT RISK
DESERTIFICATION Nil Nil Nil Nil
COSTS AS SHARE OF GDP TOTAL COSTS COSTS AS SHARE OF GDP TOTAL COSTS
SEA-LEVEL RISE 16% $273 million 24% $615 million
ECONOMIC STRESS
IMPACT AS SHARE OF GDP TOTAL IMPACT IMPACT AS SHARE OF GDP TOTAL IMPACT
LAND -0.13% -$2.2 million -0.18% -$3.2 million
MARINE -0.28% -$4.7 million -1.7% -$43.5 million
TOTAL -0.41% -$6.9 million -1.88% -$48.2 million
Nil = close to zero
All figures are annual expressed in either 2010 or for 20 30. All numbers are purely estimative. The absolute economic figures are expr essed as the relative impact (%) timescurrent (IMF, 2009) USD PPP corrected GDP. 2030 absolute economic figures have, for illustr ative purposes been correc ted for expected future real GDP growth(the relative difference between FUND scenario 2010 and 2030)
Acute+ Acute Acute- Severe+ Severe Severe- High+ High High- Moderate LowIncreasing Stable Decreasing
Sources: UNDP, CIA Factbook, IMF, UNFCCC, Napa/IPCC, CESIN.
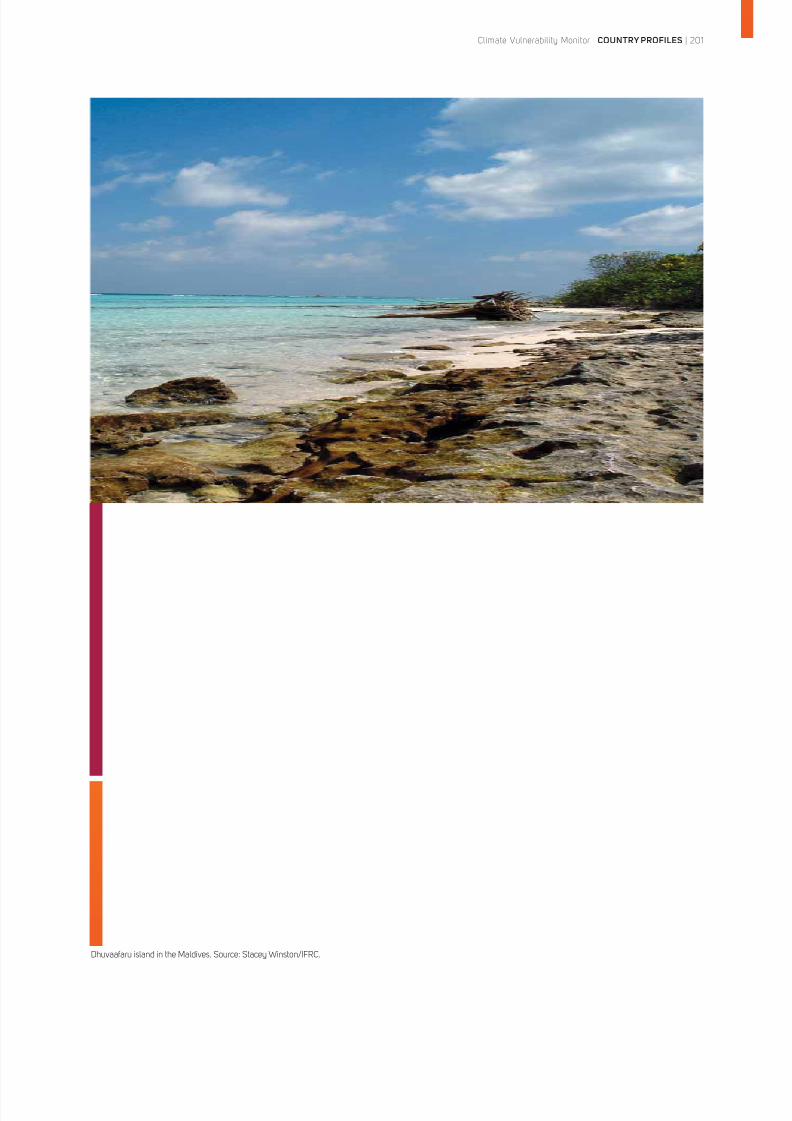
8/8/2019 Climate Vulnerability Monitor 2010: The State of the Climate Crisis
http://slidepdf.com/reader/full/climate-vulnerability-monitor-2010-the-state-of-the-climate-crisis 203/291
Climate Vulnerability Monitor | COUNTRY PROFILES | 201
Dhuvaafaru island in the Maldives. Source: Stacey Winston/IFRC.
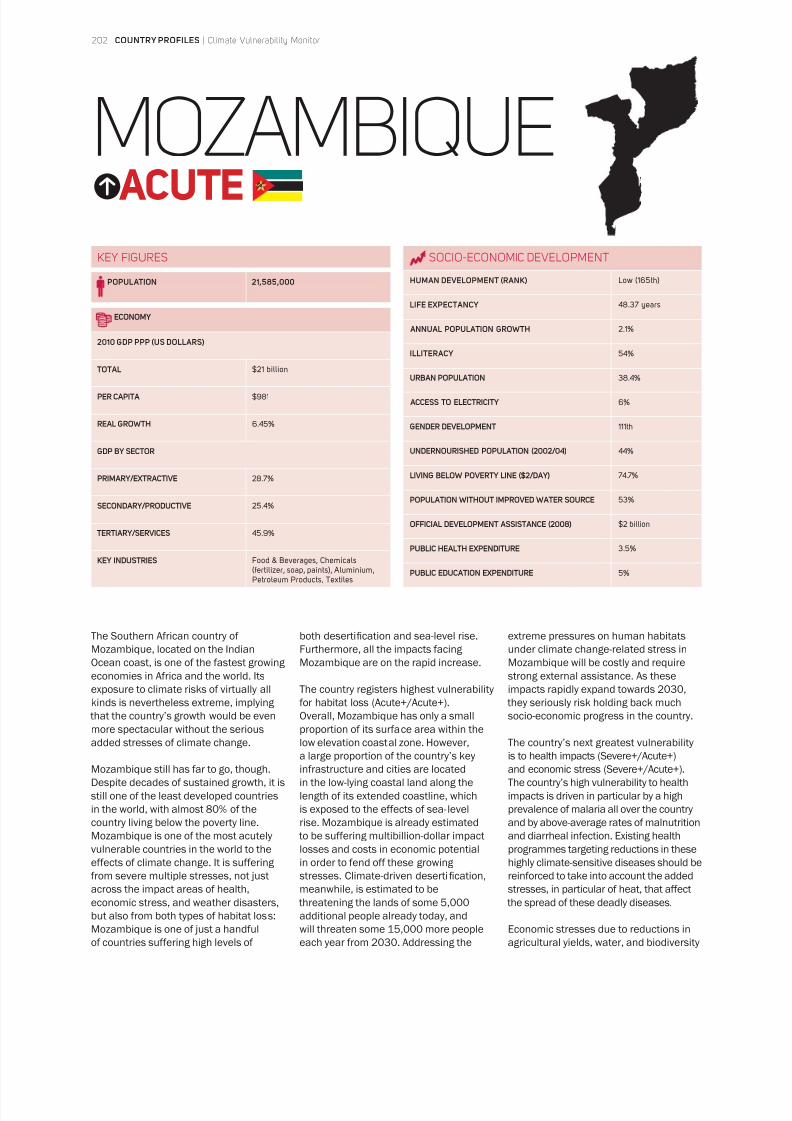
8/8/2019 Climate Vulnerability Monitor 2010: The State of the Climate Crisis
http://slidepdf.com/reader/full/climate-vulnerability-monitor-2010-the-state-of-the-climate-crisis 204/291
202 | COUNTRY PROFILES | Climate Vulnerability Monitor
MOZAMBIQUE ACUTE
The Southern African country of
Mozambique, located on the Indian
Ocean coast, is one of the fastest growing
economies in Africa and the world. Its
exposure to climate risks of virtually all
kinds is nevertheless extreme, implying
that the country’s growth would be evenmore spectacular without the serious
added stresses of climate change.
Mozambique still has far to go, though.
Despite decades of sustained growth, it is
still one of the least developed countries
in the world, with almost 80% of the
country living below the poverty line.
Mozambique is one of the most acutely
vulnerable countries in the world to the
effects of climate change. It is suffering
from severe multiple stresses, not just
across the impact areas of health,economic stress, and weather disasters,
but also from both types of habitat loss:
Mozambique is one of just a handful
of countries suffering high levels of
both desertification and sea-level rise.
Furthermore, all the impacts facing
Mozambique are on the rapid increase.
The country registers highest vulnerability
for habitat loss (Acute+/Acute+).
Overall, Mozambique has only a smallproportion of its surface area within the
low elevation coastal zone. However,
a large proportion of the country’s key
infrastructure and cities are located
in the low-lying coastal land along the
length of its extended coastline, which
is exposed to the effects of sea- level
rise. Mozambique is already estimated
to be suffering multibillion-dollar impact
losses and costs in economic potential
in order to fend off these growing
stresses. Climate-driven desertification,
meanwhile, is estimated to be threatening the lands of some 5,000
additional people already today, and
will threaten some 15,000 more people
each year from 2030. Addressing the
extreme pressures on human habitats
under climate change-related stress in
Mozambique will be costly and require
strong external assistance. As these
impacts rapidly expand towards 2030,
they seriously risk holding back much
socio-economic progress in the country.
The country’s next greatest vulnerability
is to health impacts (Severe+/Acute+)
and economic stress (Severe+/Acute+).
The country’s high vulnerability to health
impacts is driven in particular by a high
prevalence of malaria all over the country
and by above-average rates of malnutrition
and diarrheal infection. Existing health
programmes targeting reductions in these
highly climate-sensitive diseases should be
reinforced to take into account the added
stresses, in particular of heat, that affect the spread of these deadly diseases.
Economic stresses due to reductions in
agricultural yields, water, and biodiversity
SOCIO-ECONOMIC DEVELOPMENT
HUMAN DEVELOPMENT (RANK) Low (165th)
LIFE EXPECTANCY 48.37 years
ANNUAL POPULATION GROWTH 2.1%
ILLITERACY 54%
URBAN POPULATION 38.4%
ACCESS TO ELECTRICITY 6%
GENDER DEVELOPMENT 111th
UNDERNOURISHED POPULATION (2002/04) 44%
LIVING BELOW POVERTY LINE ($2/DAY) 74.7%
POPULATION WITHOUT IMPROVED WATER SOURCE 53%
OFFICIAL DEVELOPMENT ASSISTANCE (2008) $2 billion
PUBLIC HEALTH EXPENDITURE 3.5%
PUBLIC EDUCATION EXPENDITURE 5%
KEY FIGURES
POPULATION 21,585,000
ECONOMY
2010 GDP PPP (US DOLLARS)
TOTAL $21 billion
PER CAPITA $981
REAL GROWTH 6.45%
GDP BY SECTOR
PRIMARY/EXTRACTIVE 28.7%
SECONDARY/PRODUCTIVE 25.4%
TERTIARY/SERVICES 45.9%
KEY INDUSTRIES Food & Beverages, Chemicals(fertilizer, soap, paints), Aluminium,Petroleum Products, Textiles
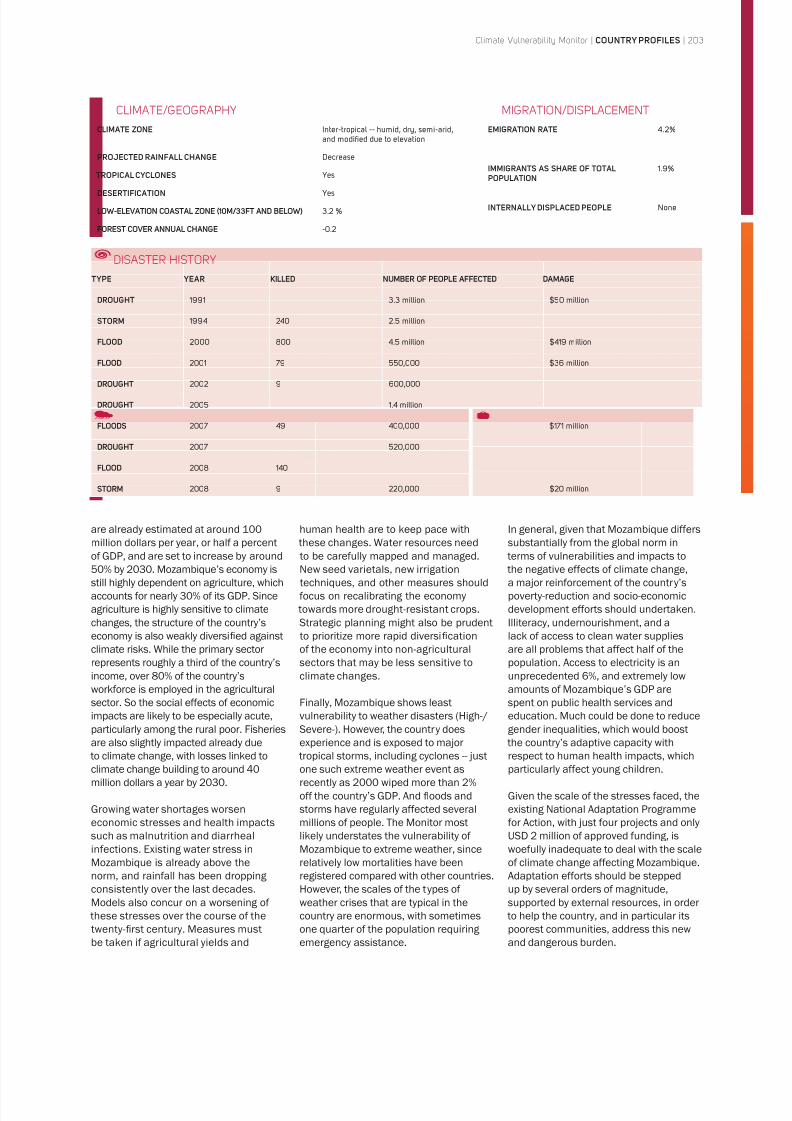
8/8/2019 Climate Vulnerability Monitor 2010: The State of the Climate Crisis
http://slidepdf.com/reader/full/climate-vulnerability-monitor-2010-the-state-of-the-climate-crisis 205/291
Climate Vulnerability Monitor | COUNTRY PROFILES | 203
are already estimated at around 100million dollars per year, or half a percent
of GDP, and are set to increase by around
50% by 2030. Mozambique’s economy is
still highly dependent on agriculture, which
accounts for nearly 30% of its GDP. Since
agriculture is highly sensitive to climate
changes, the structure of the country’s
economy is also weakly diversified against
climate risks. While the primary sector
represents roughly a third of the country’s
income, over 80% of the country’s
workforce is employed in the agricultural
sector. So the social effects of economic
impacts are likely to be especially acute,particularly among the rural poor. Fisheries
are also slightly impacted already due
to climate change, with losses linked to
climate change building to around 40
million dollars a year by 2030.
Growing water shortages worsen
economic stresses and health impacts
such as malnutrition and diarrheal
infections. Existing water stress in
Mozambique is already above the
norm, and rainfall has been dropping
consistently over the last decades.Models also concur on a worsening of
these stresses over the course of the
twenty-first century. Measures must
be taken if agricultural yields and
human health are to keep pace with these changes. Water resources need
to be carefully mapped and managed.
New seed varietals, new irrigation
techniques, and other measures should
focus on recalibrating the economy
towards more drought-resistant crops.
Strategic planning might also be prudent
to prioritize more rapid diversification
of the economy into non-agricultural
sectors that may be less sensitive to
climate changes.
Finally, Mozambique shows least
vulnerability to weather disasters (High-/Severe-). However, the country does
experience and is exposed to major
tropical storms, including cyclones -- just
one such extreme weather event as
recently as 2000 wiped more than 2%
off the country’s GDP. And floods and
storms have regularly affected several
millions of people. The Monitor most
likely understates the vulnerability of
Mozambique to extreme weather, since
relatively low mortalities have been
registered compared with other countries.
However, the scales of the types of weather crises that are typical in the
country are enormous, with sometimes
one quarter of the population requiring
emergency assistance.
In general, given that Mozambique differssubstantially from the global norm in
terms of vulnerabilities and impacts to
the negative effects of climate change,
a major reinforcement of the country’s
poverty-reduction and socio-economic
development efforts should undertaken.
Illiteracy, undernourishment, and a
lack of access to clean water supplies
are all problems that affect half of the
population. Access to electricity is an
unprecedented 6%, and extremely low
amounts of Mozambique’s GDP are
spent on public health services and
education. Much could be done to reducegender inequalities, which would boost
the country’s adaptive capacity with
respect to human health impacts, which
particularly affect young children.
Given the scale of the stresses faced, the
existing National Adaptation Programme
for Action, with just four projects and only
USD 2 million of approved funding, is
woefully inadequate to deal with the scale
of climate change affecting Mozambique.
Adaptation efforts should be stepped
up by several orders of magnitude,supported by external resources, in order
to help the country, and in particular its
poorest communities, address this new
and dangerous burden.
MIGRATION/DISPLACEMENT
EMIGRATION RATE 4.2%
IMMIGRANTS AS SHARE OF TOTAL
POPULATION
1.9%
INTERNALLY DISPLACED PEOPLE None
DISASTER HISTORY
TYPE YEAR KILLED NUMBER OF PEOPLE AFFECTED DAMAGE
DROUGHT 1991 3.3 million $50 million
STORM 1994 240 2.5 million
FLOOD 2000 800 4.5 million $419 million
FLOOD 2001 79 550,000 $36 million
DROUGHT 2002 9 600,000
DROUGHT 2005 1.4 million
FLOODS 2007 49 400,000 $171 million
DROUGHT 2007 520,000
FLOOD 2008 140
STORM 2008 9 220,000 $20 million
CLIMATE/GEOGRAPHY
CLIMATE ZONE Inter-tropical -- humid, dry, semi-arid,and modified due to elevation
PROJECTED RAINFALL CHANGE Decrease
TROPICAL CYCLONES Yes
DESERTIFICATION Yes
LOW-ELEVATION COASTAL ZONE (10M/33FT AND BELOW) 3.2 %
FOREST COVER ANNUAL CHANGE -0.2
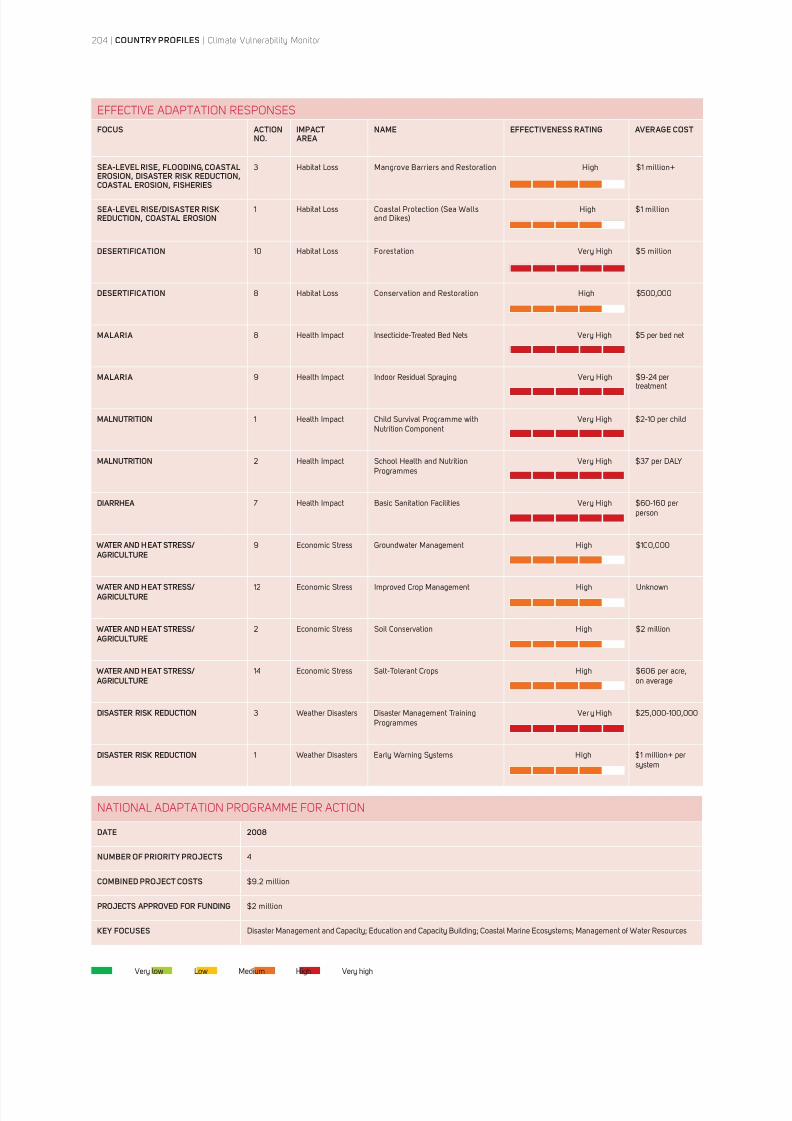
8/8/2019 Climate Vulnerability Monitor 2010: The State of the Climate Crisis
http://slidepdf.com/reader/full/climate-vulnerability-monitor-2010-the-state-of-the-climate-crisis 206/291
204 | COUNTRY PROFILES | Climate Vulnerability Monitor
NATIONAL ADAPTATION PROGRAMME FOR ACTION
DATE 2008
NUMBER OF PRIORITY PROJECTS 4
COMBINED PROJECT COSTS $9.2 million
PROJECTS APPROVED FOR FUNDING $2 million
KEY FOCUSES Disaster Management and Capacity; Education and Capacity Building; Coastal Marine Ecosystems; Management of Water Resources
EFFECTIVE ADAPTATION RESPONSES
FOCUS ACTIONNO.
IMPACT AREA
NAME EFFECTIVENESS RATING AVERAGE COST
SEA-LEVEL RISE, FLOODING, COASTAL
EROSION, DISASTER RISK REDUCTION,COASTAL EROSION, FISHERIES
3 Habitat Loss Mangrove Barriers and Restoration High $1 million+
SEA-LEVEL RISE/DISASTER RISKREDUCTION, COASTAL EROSION
1 Habitat Loss Coastal Protection (Sea Wallsand Dikes)
High $1 million
DESERTIFICATION 10 Habitat Loss Forestation Very High $5 million
DESERTIFICATION 8 Habitat Loss Conservation and Restoration High $500,000
MALARIA 8 Health Impact Insecticide-Treated Bed Nets Very High $5 per bed net
MALARIA 9 Health Impact Indoor Residual Spraying Very High $9-24 pertreatment
MALNUTRITION 1 Health Impact Child Survival Programme withNutrition Component
Very High $2-10 per child
MALNUTRITION 2 Health Impact School Health and NutritionProgrammes
Very High $37 per DALY
DIARRHEA 7 Health Impact Basic Sanitation Facilities Very High $60-160 perperson
WATER AND HEAT STRESS/ AGRICULTURE
9 Economic Stress Groundwater Management High $100,000
WATER AND HEAT STRESS/ AGRICULTURE
12 Economic Stress Improved Crop Management High Unknown
WATER AND HEAT STRESS/ AGRICULTURE
2 Economic Stress Soil Conservation High $2 million
WATER AND HEAT STRESS/ AGRICULTURE
14 Economic Stress Salt-Tolerant Crops High $606 per acre,on average
DISASTER RISK REDUCTION 3 Weather Disasters Disaster Management TrainingProgrammes
Ver y High $25,000-100,000
DISASTER RISK REDUCTION 1 Weather Disasters Early Warning Systems High $1 million+ persystem
Very low Low Medium High Very high
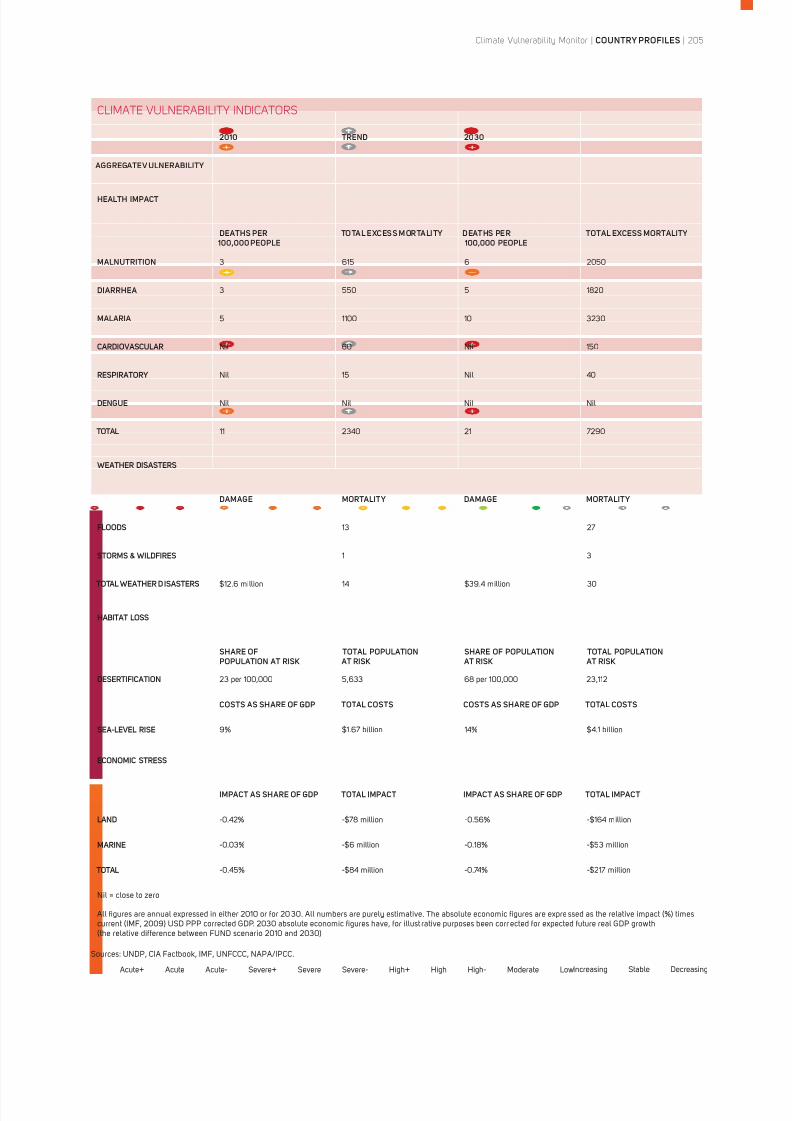
8/8/2019 Climate Vulnerability Monitor 2010: The State of the Climate Crisis
http://slidepdf.com/reader/full/climate-vulnerability-monitor-2010-the-state-of-the-climate-crisis 207/291
Climate Vulnerability Monitor | COUNTRY PROFILES | 205
Sources: UNDP, CIA Factbook, IMF, UNFCCC, NAPA/IPCC.
CLIMATE VULNERABILITY INDICATORS
2010 TREND 2030
AGGREGATE V ULNERABILITY
HEALTH IMPACT
DEATHS PER 100,000 PEOPLE
TOTAL EXCESS MORTALITY DEATHS PER 100,000 PEOPLE
TOTAL EXCESS MORTALITY
MALNUTRITION 3 615 6 2050
DIARRHEA 3 550 5 1820
MALARIA 5 1100 10 3230
CARDIOVASCULAR Nil 60 Nil 150
RESPIRATORY Nil 15 Nil 40
DENGUE Nil Nil Nil Nil
TOTAL 11 2340 21 7290
WEATHER DISASTERS
DAMAGE MORTALITY DAMAGE MORTALITY
FLOODS 13 27
STORMS & WILDFIRES 1 3
TOTAL WEATHER DISASTERS $12.6 million 14 $39.4 million 30
HABITAT LOSS
SHARE OFPOPULATION AT RISK
TOTAL POPULATION AT RISK
SHARE OF POPULATION AT RISK
TOTAL POPULATION AT RISK
DESERTIFICATION 23 per 100,000 5,633 68 per 100,000 23,112
COSTS AS SHARE OF GDP TOTAL COSTS COSTS AS SHARE OF GDP TOTAL COSTS
SEA-LEVEL RISE 9% $1.67 billion 14% $4.1 billion
ECONOMIC STRESS
IMPACT AS SHARE OF GDP TOTAL IMPACT IMPACT AS SHARE OF GDP TOTAL IMPACT
LAND -0.42% -$78 million -0.56% -$164 million
MARINE -0.03% -$6 million -0.18% -$53 million
TOTAL -0.45% -$84 million -0.74% -$217 million
Nil = close to zero
All figures are annual expressed in either 2010 or for 20 30. All numbers are purely estimative. The absolute economic figures are expre ssed as the relative impact (%) timescurrent (IMF, 2009) USD PPP corrected GDP. 2030 absolute economic figures have, for illust rative purposes been corr ected for expected future real GDP growth(the relative difference between FUND scenario 2010 and 2030)
Acute+ Acute Acute- Severe+ Severe Severe- High+ High High- Moderate LowIncreasing Stable Decreasing
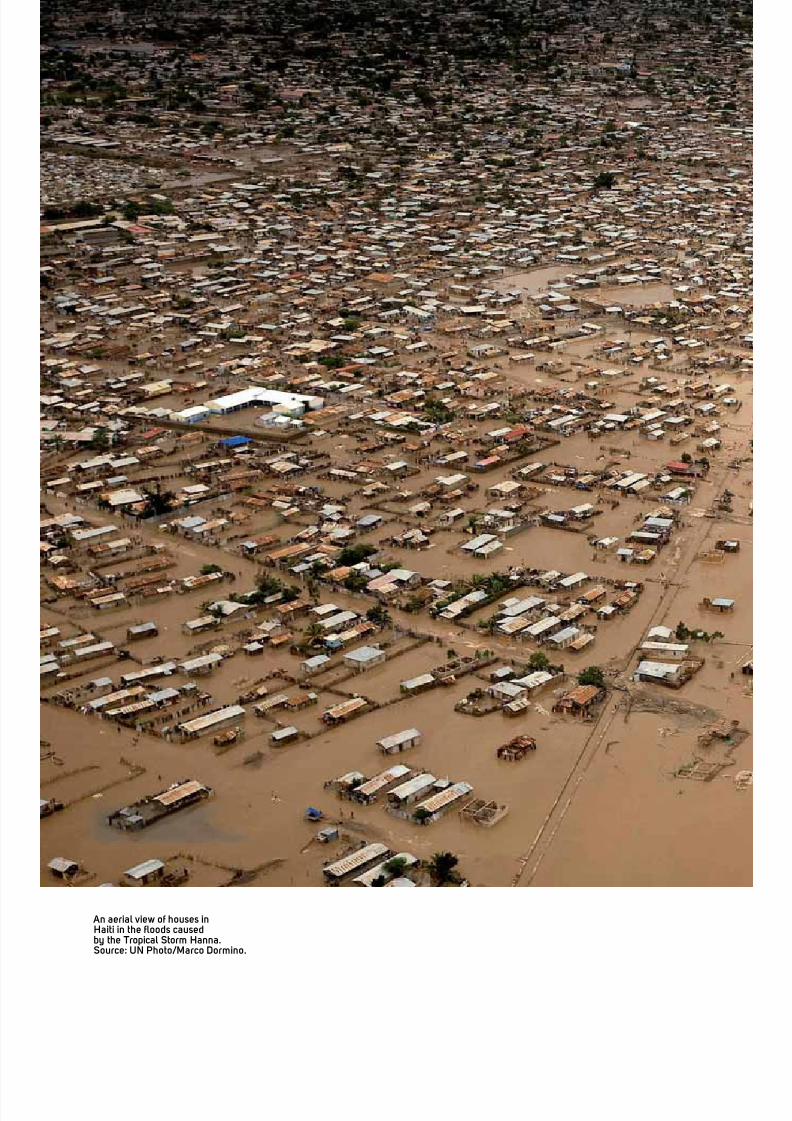
8/8/2019 Climate Vulnerability Monitor 2010: The State of the Climate Crisis
http://slidepdf.com/reader/full/climate-vulnerability-monitor-2010-the-state-of-the-climate-crisis 208/291
An aerial view of houses inHaiti in the floods causedby the Tropical Storm Hanna.Source: UN Photo/Marco Dormino.
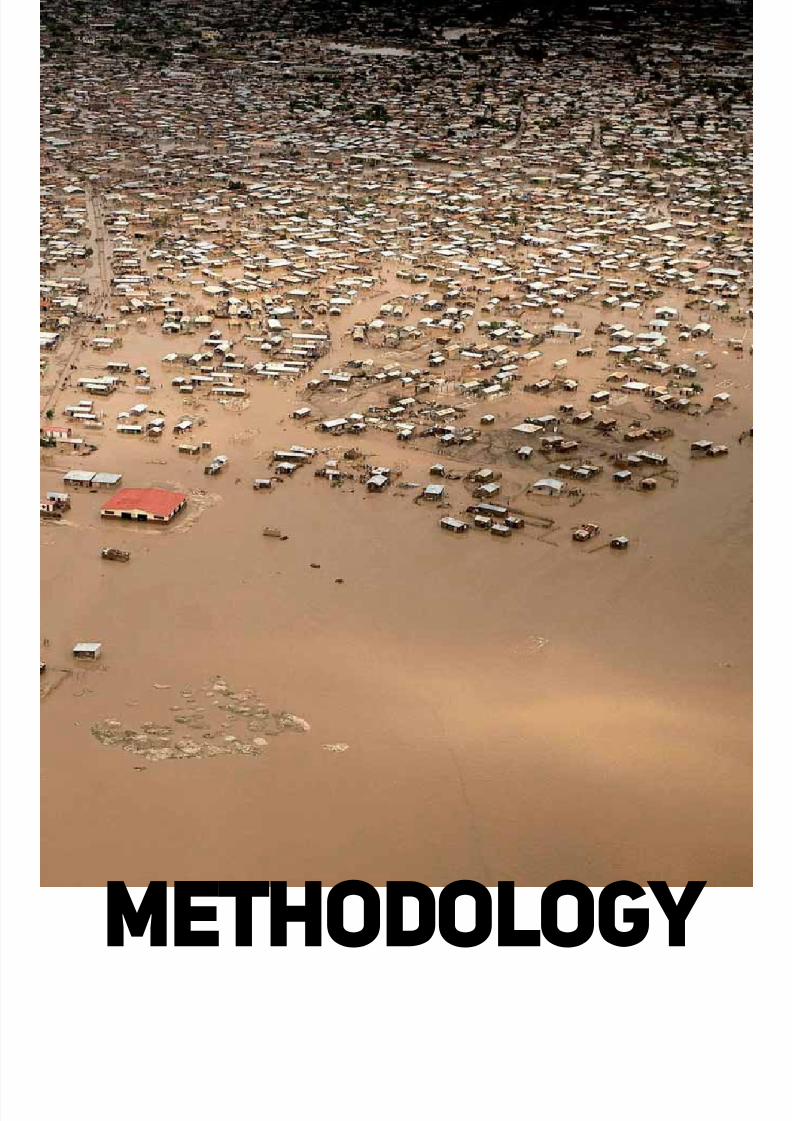
8/8/2019 Climate Vulnerability Monitor 2010: The State of the Climate Crisis
http://slidepdf.com/reader/full/climate-vulnerability-monitor-2010-the-state-of-the-climate-crisis 209/291
METHODOLOGY
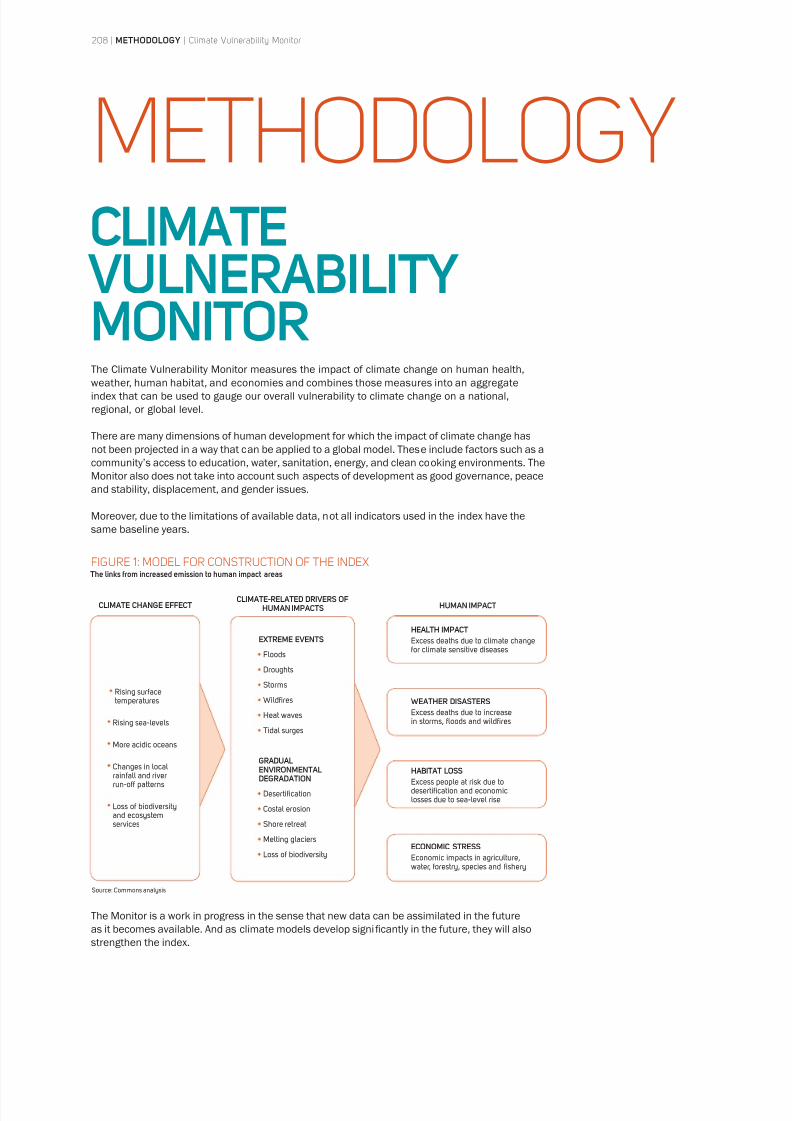
8/8/2019 Climate Vulnerability Monitor 2010: The State of the Climate Crisis
http://slidepdf.com/reader/full/climate-vulnerability-monitor-2010-the-state-of-the-climate-crisis 210/291
208 | METHODOLOGY | Climate Vulnerability Monitor
METHODOLOGYCLIMATE VULNERABILITYMONITORThe Climate Vulnerability Monitor measures the impact of climate change on human health,
weather, human habitat, and economies and combines those measures into an aggregate
index that can be used to gauge our overall vulnerability to climate change on a national,
regional, or global level.
There are many dimensions of human development for which the impact of climate change has
not been projected in a way that can be applied to a global model. These include factors such as a
community’s access to education, water, sanitation, energy, and clean cooking environments. The
Monitor also does not take into account such aspects of development as good governance, peace
and stability, displacement, and gender issues.
Moreover, due to the limitations of available data, not all indicators used in the index have the
same baseline years.
The Monitor is a work in progress in the sense that new data can be assimilated in the future
as it becomes available. And as climate models develop significantly in the future, they will also
strengthen the index.
FIGURE 1: MODEL FOR CONSTRUCTION OF THE INDEX The links from increased emission to human impact areas
CLIMATE CHANGE EFFECT
Rising surfacetemperatures
Rising sea-levels
More acidic oceans
Changes in localrainfall and riverrun-off patterns
Loss of biodiversityand ecosystemservices
CLIMATE-RELATED DRIVERS OFHUMAN IMPACTS
EXTREME EVENTS
Floods
Droughts
Storms
Wildfires
Heat waves
Tidal surges
GRADUALENVIRONMENTALDEGRADATION
Desertification
Costal erosion
Shore retreat
Melting glaciers
Loss of biodiversity
HUMAN IMPACT
HEALTH IMPACTExcess deaths due to climate changefor climate sensitive diseases
WEATHER DISASTERS
Excess deaths due to increasein storms, floods and wildfires
HABITAT LOSSExcess people at risk due todesertification and economiclosses due to sea-level rise
ECONOMIC STRESSEconomic impacts in agriculture,water, forestry, species and fishery
Source: Commons analysis
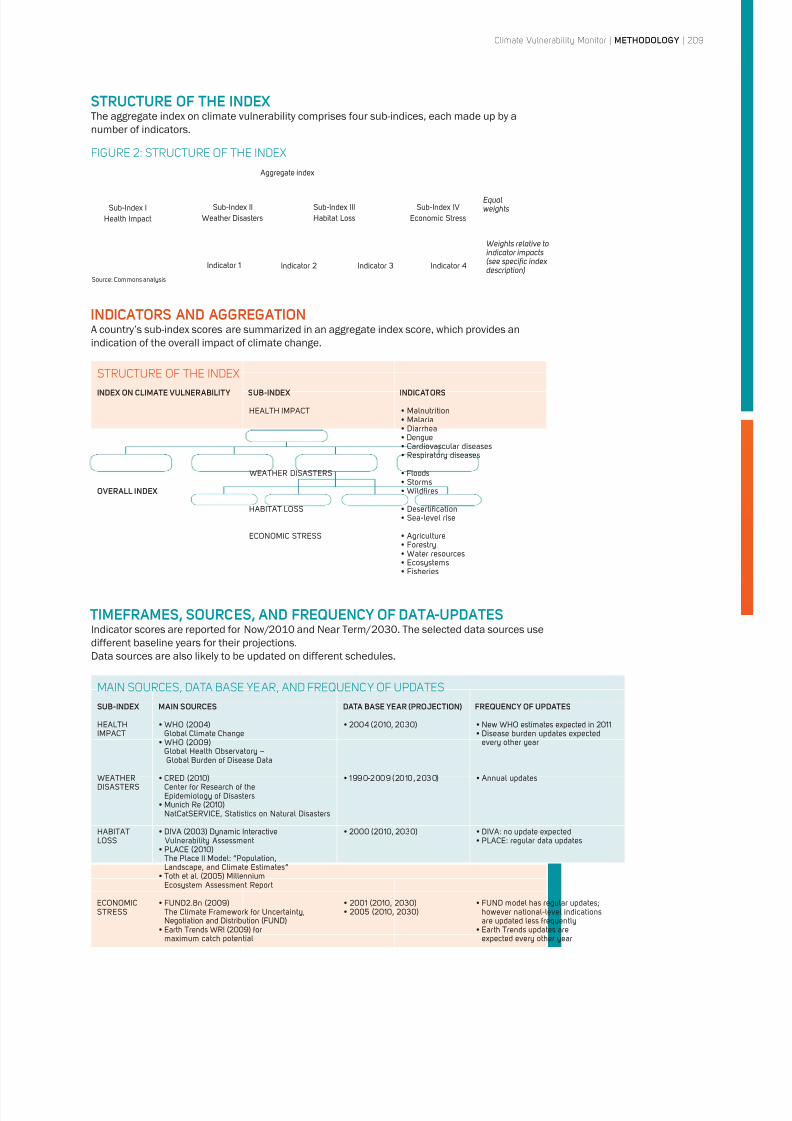
8/8/2019 Climate Vulnerability Monitor 2010: The State of the Climate Crisis
http://slidepdf.com/reader/full/climate-vulnerability-monitor-2010-the-state-of-the-climate-crisis 211/291
Climate Vulnerability Monitor | METHODOLOGY | 209
STRUCTURE OF THE INDEX The aggregate index on climate vulnerability comprises four sub-indices, each made up by a
number of indicators.
INDICATORS AND AGGREGATIONA country’s sub-index scores are summarized in an aggregate index score, which provides an
indication of the overall impact of climate change.
TIMEFRAMES, SOURCES, AND FREQUENCY OF DATA-UPDATESIndicator scores are reported for Now/2010 and Near Term/2030. The selected data sources use
different baseline years for their projections.
Data sources are also likely to be updated on different schedules.
STRUCTURE OF THE INDEX
INDEX ON CLIMATE VULNERABILITY SUB-INDEX INDICATORS
OVERALL INDEX
HEALTH IMPACT
WEATHER DISASTERS
HABITAT LOSS
ECONOMIC STRESS
FIGURE 2: STRUCTURE OF THE INDEX
Source: Commons analysis
Aggregate index
Sub-Index I
Health Impact
Sub-Index III
Habitat Loss
Sub-Index II
Weather Disasters
Sub-Index IV
Economic Stress
Equalweights
Weights relative toindicator impacts (see specific index description)
Indicator 1 Indicator 2 Indicator 3 Indicator 4
MAIN SOURCES, DATA BASE YEAR, AND FREQUENCY OF UPDATES
SUB-INDEX MAIN SOURCES DATA BASE YEAR (PROJECTION) FREQUENCY OF UPDATES
HEALTHIMPACT
Global Climate Change
Global Health Observatory –Global Burden of Disease Data
every other year
WEATHERDISASTERS
Center for Research of theEpidemiology of Disasters
NatCatSERVICE, Statistics on Natural Disasters
HABITATLOSS
Vulnerability Assessment
The Place II Model: “Population,Landscape, and Climate Estimates”
Ecosystem Assessment Report
DIVA: no update expected PLACE: regular data updates
ECONOMICSTRESS
The Climate Framework for Uncertainty,
maximum catch potential
FUND model has regular updates;however national-level indicationsare updated less frequently
Earth Trends updates areexpected every other year
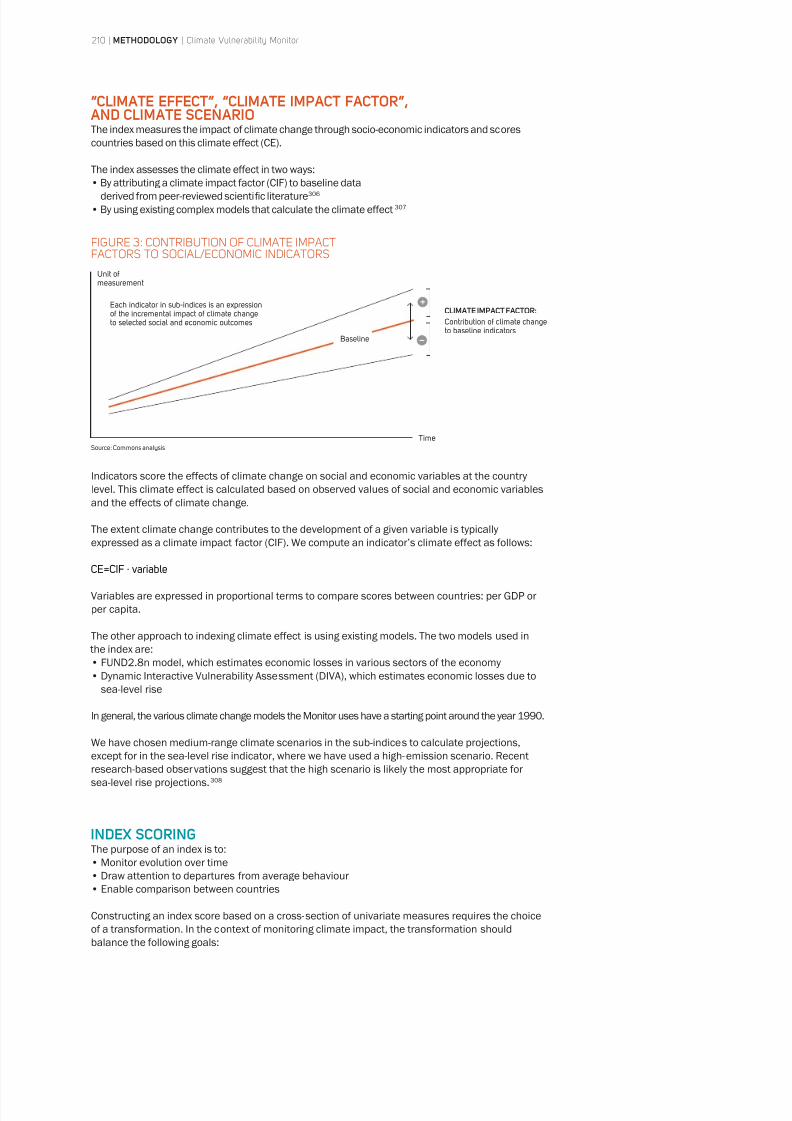
8/8/2019 Climate Vulnerability Monitor 2010: The State of the Climate Crisis
http://slidepdf.com/reader/full/climate-vulnerability-monitor-2010-the-state-of-the-climate-crisis 212/291
210 | METHODOLOGY | Climate Vulnerability Monitor
“CLIMATE EFFECT”, “CLIMATE IMPACT FACTOR”, AND CLIMATE SCENARIOThe index measures the impact of climate change through socio-economic indicators and scores
countries based on this climate effect (CE).
The index assesses the climate effect in two ways:
• By attributing a climate impact factor (CIF) to baseline data
derived from peer-reviewed scientific literature306
• By using existing complex models that calculate the climate effect307
INDEX SCORINGThe purpose of an index is to:
• Monitor evolution over time
• Draw attention to departures from average behaviour
• Enable comparison between countries
Constructing an index score based on a cross-section of univariate measures requires the choice
of a transformation. In the context of monitoring climate impact, the transformation should
balance the following goals:
Indicators score the effects of climate change on social and economic variables at the country
level. This climate effect is calculated based on observed values of social and economic variables
and the effects of climate change.
The extent climate change contributes to the development of a given variable is typicallyexpressed as a climate impact factor (CIF). We compute an indicator’s climate effect as follows:
CE=CIF · variable
Variables are expressed in proportional terms to compare scores between countries: per GDP or
per capita.
The other approach to indexing climate effect is using existing models. The two models used in
the index are:
• FUND2.8n model, which estimates economic losses in various sectors of the economy
• Dynamic Interactive Vulnerability Assessment (DIVA), which estimates economic losses due to
sea-level rise
In general, the various climate change models the Monitor uses have a starting point around the year 1990.
We have chosen medium-range climate scenarios in the sub-indices to calculate projections,
except for in the sea-level rise indicator, where we have used a high-emission scenario. Recent
research-based observations suggest that the high scenario is likely the most appropriate for
sea-level rise projections.308
FIGURE 3: CONTRIBUTION OF CLIMATE IMPACTFACTORS TO SOCIAL/ECONOMIC INDICATORS
Unit ofmeasurement
Each indicator in sub-indices is an expressionof the incremental impact of climate changeto selected social and economic outcomes
CLIMATE IMPACT FACTOR:Contribution of climate changeto baseline indicators
Time
Baseline
Source: Commons analysis
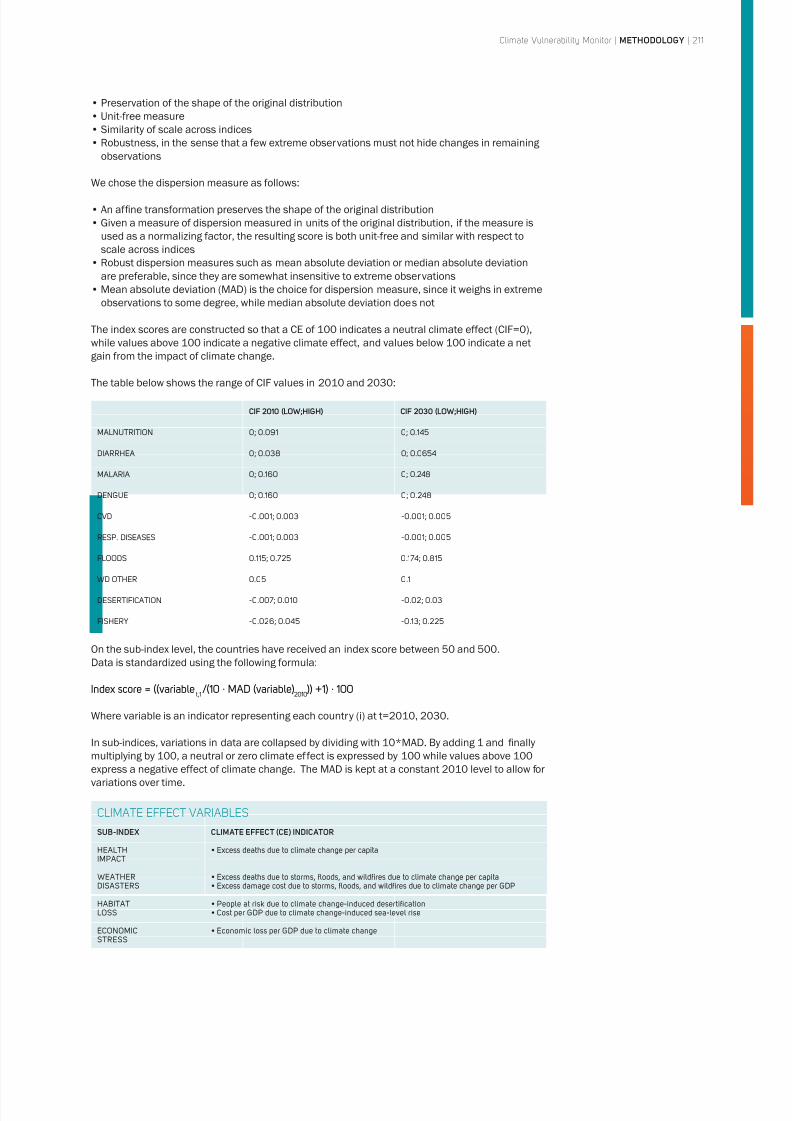
8/8/2019 Climate Vulnerability Monitor 2010: The State of the Climate Crisis
http://slidepdf.com/reader/full/climate-vulnerability-monitor-2010-the-state-of-the-climate-crisis 213/291
Climate Vulnerability Monitor | METHODOLOGY | 211
• Preservation of the shape of the original distribution
• Unit-free measure
• Similarity of scale across indices
• Robustness, in the sense that a few extreme observations must not hide changes in remaining
observations
We chose the dispersion measure as follows:
• An af fine transformation preserves the shape of the original distribution
• Given a measure of dispersion measured in units of the original distribution, if the measure is
used as a normalizing factor, the resulting score is both unit-free and similar with respect to
scale across indices
• Robust dispersion measures such as mean absolute deviation or median absolute deviation
are preferable, since they are somewhat insensitive to extreme observations
• Mean absolute deviation (MAD) is the choice for dispersion measure, since it weighs in extreme
observations to some degree, while median absolute deviation does not
The index scores are constructed so that a CE of 100 indicates a neutral climate effect (CIF=0),
while values above 100 indicate a negative climate effect, and values below 100 indicate a net
gain from the impact of climate change.
The table below shows the range of CIF values in 2010 and 2030:
On the sub-index level, the countries have received an index score between 50 and 500.
Data is standardized using the following formula:
t,1
Where variable is an indicator representing each country (i) at t=2010, 2030.
In sub-indices, variations in data are collapsed by dividing with 10*MAD. By adding 1 and finally
multiplying by 100, a neutral or zero climate effect is expressed by 100 while values above 100
express a negative effect of climate change. The MAD is kept at a constant 2010 level to allow for
variations over time.
CIF 2010 (LOW;HIGH) CIF 2030 (LOW;HIGH)
MALNUTRITION
DIARRHEA
MALARIA
DENGUE
CVD
RESP. DISEASES
FLOODS
WD OTHER
DESERTIFICATION
FISHERY
CLIMATE EFFECT VARIABLES
SUB-INDEX CLIMATE EFFECT (CE) INDICATOR
HEALTHIMPACT
WEATHERDISASTERS
HABITATLOSS
People at risk due to climate change-induced desertification Cost per GDP due to climate change-induced sea-level rise
ECONOMICSTRESS
Economic loss per GDP due to climate change
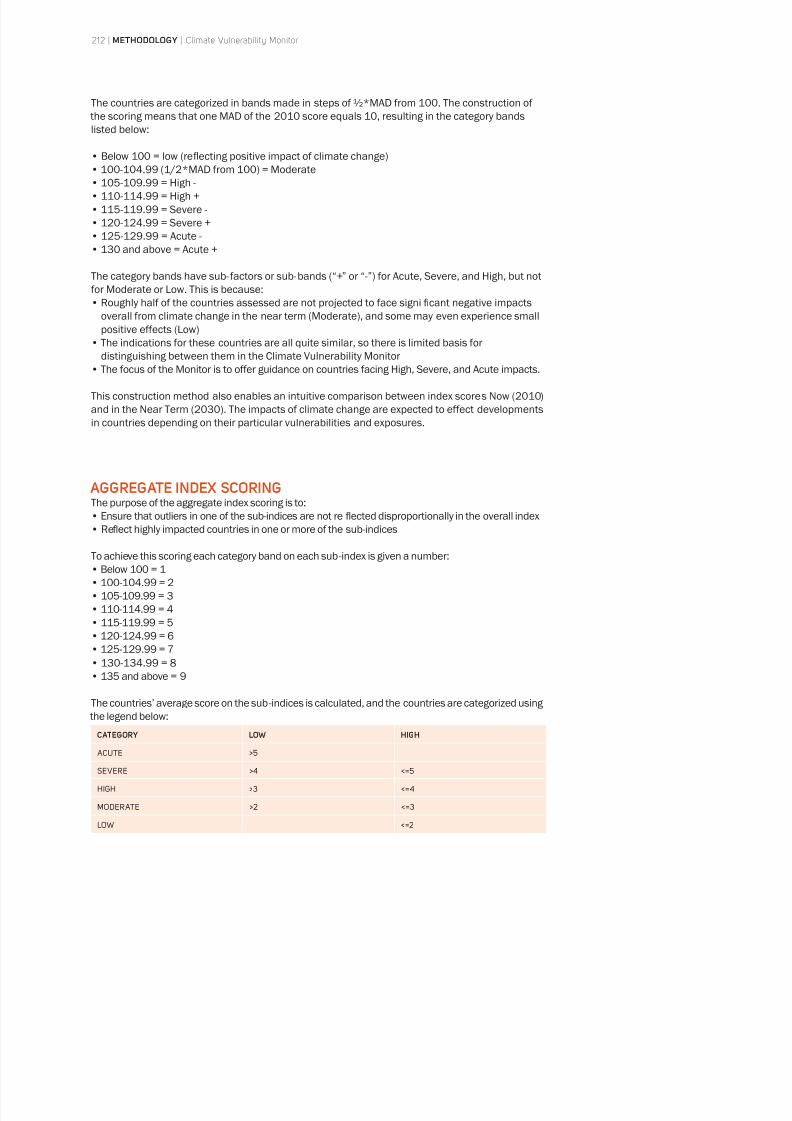
8/8/2019 Climate Vulnerability Monitor 2010: The State of the Climate Crisis
http://slidepdf.com/reader/full/climate-vulnerability-monitor-2010-the-state-of-the-climate-crisis 214/291
212 | METHODOLOGY | Climate Vulnerability Monitor
The countries are categorized in bands made in steps of ½*MAD from 100. The construction of
the scoring means that one MAD of the 2010 score equals 10, resulting in the category bands
listed below:
• Below 100 = low (reflecting positive impact of climate change)
• 100-104.99 (1/2*MAD from 100) = Moderate
• 105-109.99 = High -
• 110-114.99 = High +
• 115-119.99 = Severe -
• 120-124.99 = Severe +
• 125-129.99 = Acute -
• 130 and above = Acute +
The category bands have sub-factors or sub-bands (“+” or “-”) for Acute, Severe, and High, but not
for Moderate or Low. This is because:
• Roughly half of the countries assessed are not projected to face significant negative impacts
overall from climate change in the near term (Moderate), and some may even experience small
positive effects (Low)
• The indications for these countries are all quite similar, so there is limited basis for
distinguishing between them in the Climate Vulnerability Monitor• The focus of the Monitor is to offer guidance on countries facing High, Severe, and Acute impacts.
This construction method also enables an intuitive comparison between index scores Now (2010)
and in the Near Term (2030). The impacts of climate change are expected to effect developments
in countries depending on their particular vulnerabilities and exposures.
AGGREGATE INDEX SCORINGThe purpose of the aggregate index scoring is to:
• Ensure that outliers in one of the sub-indices are not reflected disproportionally in the overall index
• Refl
ect highly impacted countries in one or more of the sub-indices
To achieve this scoring each category band on each sub-index is given a number:
• Below 100 = 1
• 100-104.99 = 2
• 105-109.99 = 3
• 110-114.99 = 4
• 115-119.99 = 5
• 120-124.99 = 6
• 125-129.99 = 7
• 130-134.99 = 8
• 135 and above = 9
The countries’ average score on the sub-indices is calculated, and the countries are categorized using
the legend below:
CATEGORY LOW HIGH
ACUTE
SEVERE >4
HIGH >3 <=4
MODERATE >2 <=3
LOW <=2
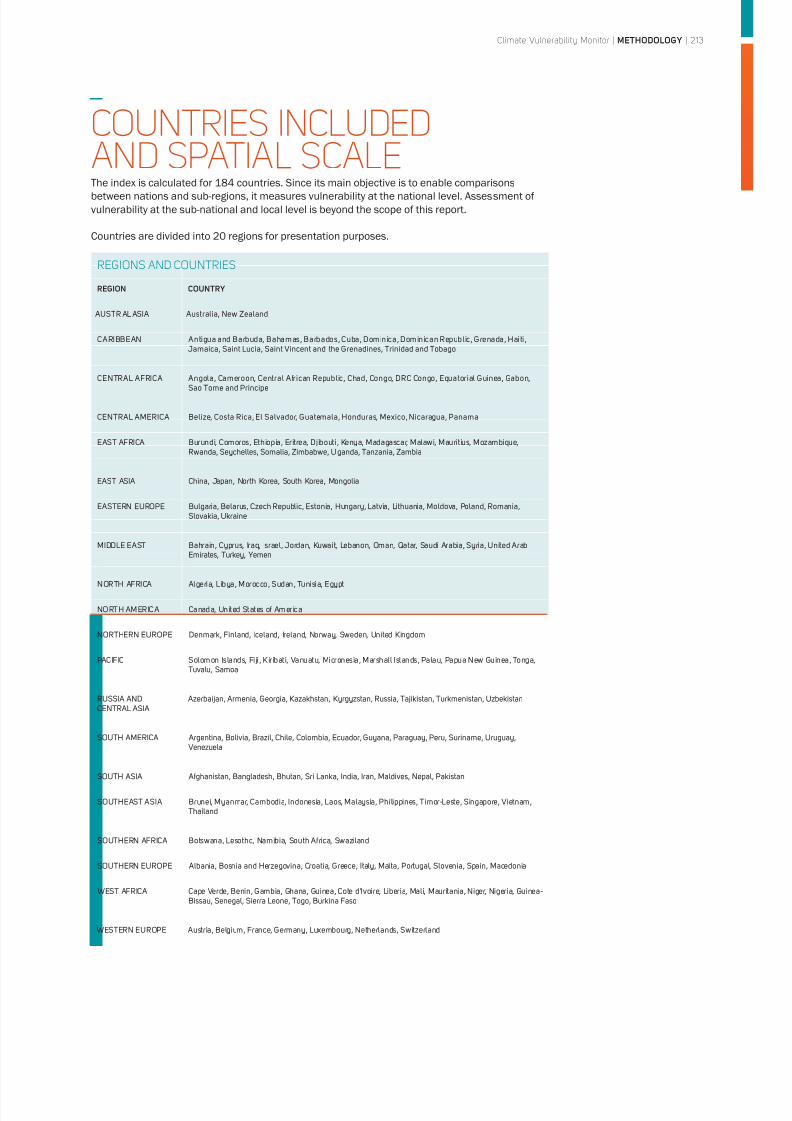
8/8/2019 Climate Vulnerability Monitor 2010: The State of the Climate Crisis
http://slidepdf.com/reader/full/climate-vulnerability-monitor-2010-the-state-of-the-climate-crisis 215/291
Climate Vulnerability Monitor | METHODOLOGY | 213
The index is calculated for 184 countries. Since its main objective is to enable comparisons
between nations and sub-regions, it measures vulnerability at the national level. Assessment of
vulnerability at the sub-national and local level is beyond the scope of this report.
Countries are divided into 20 regions for presentation purposes.
COUNTRIES INCLUDEDAND SPATIAL SCALE
REGIONS AND COUNTRIES
REGION COUNTRY
AUSTR AL ASIA Australia, New Zealand
CARIBBEAN Antigua and Barbuda, Bahamas, Barbados, Cuba, Dominica, Dominican Republic, Grenada, Haiti , Jamaica, Saint Lucia, Saint Vincent and the Grenadines, Trinidad and Tobago
CENTRAL AFRICA Angola, Cameroon, Central African Republic, Chad, Congo, DRC Congo, Equatorial Guinea, Gabon,Sao Tome and Principe
CENTRAL AMERICA Belize, Costa Rica, El Salvador, Guatemala, Honduras, Mexico, Nicaragua, Panama
EAST AFRICA Burundi, Comoros, Ethiopia, Eritrea, Djibouti, Kenya, Madagascar, Malawi, Mauritius, Mozambique,Rwanda, Seychelles, Somalia, Zimbabwe, Uganda, Tanzania, Zambia
EAST ASIA China, Japan, North Korea, South Korea, Mongolia
EASTERN EUROPE Bulgaria, Belarus, Czech Republic, Estonia, Hungary, Latvia, Lithuania, Moldova, Poland, Romania,Slovakia, Ukraine
MIDDLE EAST Bahrain, Cyprus, Iraq, Israel, Jordan, Kuwait, Lebanon, Oman, Qatar, Saudi Arabia, Syria, United ArabEmirates, Turkey, Yemen
NORTH AFRICA Algeria, Libya, Morocco, Sudan, Tunisia, Egypt
NORTH AMERICA Canada, United States of America
NORTHERN EUROPE Denmark, Finland, Iceland, Ireland, Norway, Sweden, United Kingdom
PACIFIC Solomon Islands, Fi ji , Kiribati, Vanuatu, Micronesia, Marshall Islands, Palau, Papua New Guinea, Tonga,Tuvalu, Samoa
RUSSIA AND
CENTRAL ASIA
Azerbaijan, Armenia, Georgia, Kazakhstan, Kyrgyzstan, Russia, Tajikistan, Turkmenistan, Uzbekistan
SOUTH AMERICA Argentina, Bolivia, Brazil, Chile, Colombia, Ecuador, Guyana, Paraguay, Peru, Suriname, Uruguay, Venezuela
SOUTH ASIA Afghanistan, Bangladesh, Bhutan, Sri Lanka, India, Iran, Maldives, Nepal, Pakistan
SOUTHEAST ASIA Brunei, Myanmar, Cambodia, Indonesia, Laos, Malaysia, Philippines, Timor-Leste, Singapore, Vietnam,Thailand
SOUTHERN AFRICA Botswana, Lesotho, Namibia, South Africa, Swaziland
SOUTHERN EUROPE Albania, Bosnia and Herzegovina, Croatia, Greece, Italy, Malta, Portugal, Slovenia, Spain, Macedonia
WEST AFRICA Cape Verde, Benin, Gambia, Ghana, Guinea, Cote d'Ivoire, Liberia, Mali, Mauritania, Niger, Nigeria, Guinea-Bissau, Senegal, Sierra Leone, Togo, Burkina Faso
WESTERN EUROPE Austria, Belgium, France, Germany, Luxembourg, Netherlands, Switzerland
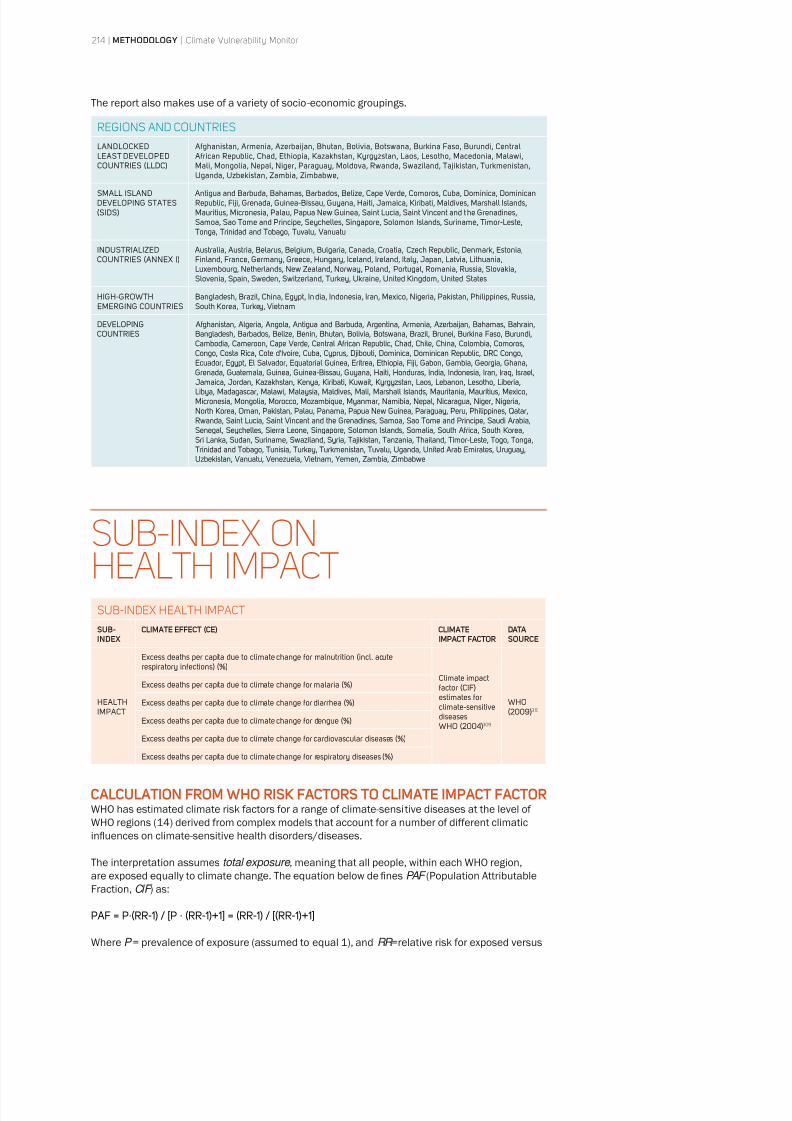
8/8/2019 Climate Vulnerability Monitor 2010: The State of the Climate Crisis
http://slidepdf.com/reader/full/climate-vulnerability-monitor-2010-the-state-of-the-climate-crisis 216/291
214 | METHODOLOGY | Climate Vulnerability Monitor
The report also makes use of a variety of socio-economic groupings.
REGIONS AND COUNTRIES
LANDLOCKEDLEAST DEVELOPED
Afghanistan, Armenia, Azerbaijan, Bhutan, Bolivia, Botswana, Burkina Faso, Burundi, Central African Republic, Chad, Ethiopia, Kazakhstan, Kyrgyzstan, Laos, Lesotho, Macedonia, Malawi,Mali, Mongolia, Nepal, Niger, Paraguay, Moldova, Rwanda, Swaziland, Tajikistan, Turkmenistan,
Uganda, Uzbekistan, Zambia, Zimbabwe,
SMALL ISLANDDEVELOPING STATES
Antigua and Barbuda, Bahamas, Barbados, Belize, Cape Verde, Comoros, Cuba, Dominica, DominicanRepublic, Fiji, Grenada, Guinea-Bissau, Guyana, Haiti, Jamaica, Kiribati, Maldives, Marshall Islands,Mauritius, Micronesia, Palau, Papua New Guinea, Saint Lucia, Saint Vincent and the Grenadines,Samoa, Sao Tome and Principe, Seychelles, Singapore, Solomon Islands, Suriname, Timor-Leste,Tonga, Trinidad and Tobago, Tuvalu, Vanuatu
INDUSTRIALIZED
Australia, Austria, Belarus, Belgium, Bulgaria, Canada, Croatia, Czech Republic, Denmark, Estonia,Finland, France, Germany, Greece, Hungary, Iceland, Ireland, Italy, Japan, Latvia, Lithuania,Luxembourg, Netherlands, New Zealand, Norway, Poland, Portugal, Romania, Russia, Slovakia,Slovenia, Spain, Sweden, Switzerland, Turkey, Ukraine, United Kingdom, United States
HIGH-GROWTHEMERGING COUNTRIES
Bangladesh, Brazil, China, Egypt, India, Indonesia, Iran, Mexico, Nigeria, Pakistan, Philippines, Russia,South Korea, Turkey, Vietnam
DEVELOPINGCOUNTRIES
Afghanistan, Algeria, Angola, Antigua and Barbuda, Argentina, Armenia, Azerbaijan, Bahamas, Bahrain,Bangladesh, Barbados, Belize, Benin, Bhutan, Bolivia, Botswana, Brazil, Brunei, Burkina Faso, Burundi,Cambodia, Cameroon, Cape Verde, Central African Republic, Chad, Chile, China, Colombia, Comoros,
Congo, Costa Rica, Cote d'Ivoire, Cuba, Cyprus, Djibouti, Dominica, Dominican Republic, DRC Congo,Ecuador, Egypt, El Salvador, Equatorial Guinea, Eritrea, Ethiopia, Fiji, Gabon, Gambia, Georgia, Ghana,Grenada, Guatemala, Guinea, Guinea-Bissau, Guyana, Haiti, Honduras, India, Indonesia, Iran, Iraq, Israel, Jamaica, Jordan, Kazakhstan, Kenya, Kiribati, Kuwait, Kyrgyzstan, Laos, Lebanon, Lesotho, Liberia,Libya, Madagascar, Malawi, Malaysia, Maldives, Mali, Marshall Islands, Mauritania, Mauritius, Mexico,Micronesia, Mongolia, Morocco, Mozambique, Myanmar, Namibia, Nepal, Nicaragua, Niger, Nigeria,North Korea, Oman, Pakistan, Palau, Panama, Papua New Guinea, Paraguay, Peru, Philippines, Qatar,Rwanda, Saint Lucia, Saint Vincent and the Grenadines, Samoa, Sao Tome and Principe, Saudi Arabia,Senegal, Seychelles, Sierra Leone, Singapore, Solomon Islands, Somalia, South Africa, South Korea,Sri Lanka, Sudan, Suriname, Swaziland, Syria, Tajikistan, Tanzania, Thailand, Timor-Leste, Togo, Tonga,Trinidad and Tobago, Tunisia, Turkey, Turkmenistan, Tuvalu, Uganda, United Arab Emirates, Uruguay,Uzbekistan, Vanuatu, Venezuela, Vietnam, Yemen, Zambia, Zimbabwe
CALCULATION FROM WHO RISK FACTORS TO CLIMATE IMPACT FACTORWHO has estimated climate risk factors for a range of climate-sensitive diseases at the level of
WHO regions (14) derived from complex models that account for a number of different climatic
influences on climate-sensitive health disorders/diseases.
The interpretation assumes total exposure , meaning that all people, within each WHO region,
are exposed equally to climate change. The equation below defines PAF (Population Attributable
Fraction, CIF ) as:
Where P = prevalence of exposure (assumed to equal 1), and RR =relative risk for exposed versus
SUB-INDEX ONHEALTH IMPACTSUB-INDEX HEALTH IMPACT
SUB-INDEX
CLIMATE EFFECT (CE) CLIMATEIMPACT FACTOR
DATASOURCE
HEALTH
IMPACT
Climate impactestimates forclimate-sensitivediseases
309
WHO
310
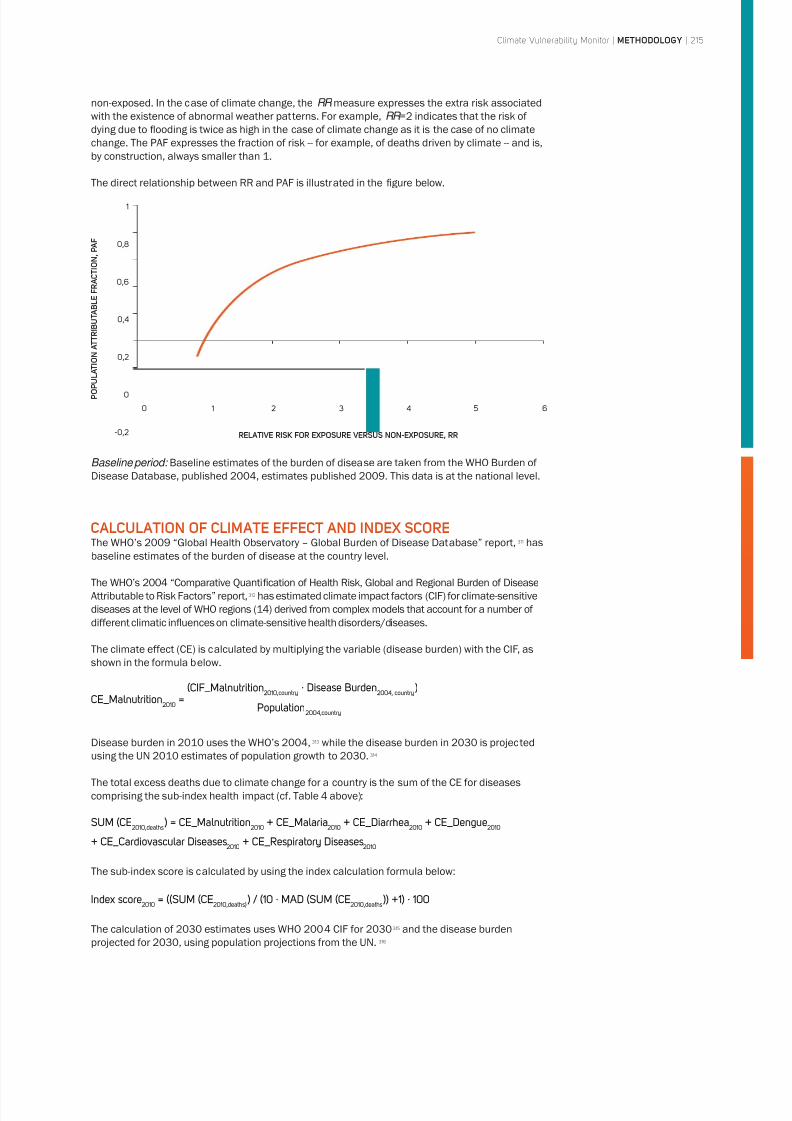
8/8/2019 Climate Vulnerability Monitor 2010: The State of the Climate Crisis
http://slidepdf.com/reader/full/climate-vulnerability-monitor-2010-the-state-of-the-climate-crisis 217/291
Climate Vulnerability Monitor | METHODOLOGY | 215
Baseline period: Baseline estimates of the burden of disease are taken from the WHO Burden of
Disease Database, published 2004, estimates published 2009. This data is at the national level.
CALCULATION OF CLIMATE EFFECT AND INDEX SCOREThe WHO’s 2009 “Global Health Observatory – Global Burden of Disease Database” report,311 has
baseline estimates of the burden of disease at the country level.
The WHO’s 2004 “Comparative Quantification of Health Risk, Global and Regional Burden of Disease
Attributable to Risk Factors” report,312 has estimated climate impact factors (CIF) for climate-sensitive
diseases at the level of WHO regions (14) derived from complex models that account for a number of
different climatic influences on climate-sensitive health disorders/diseases.
The climate effect (CE) is calculated by multiplying the variable (disease burden) with the CIF, as
shown in the formula below.
CE_Malnutrition
=
· Disease Burden
Disease burden in 2010 uses the WHO’s 2004, 313 while the disease burden in 2030 is projected
using the UN 2010 estimates of population growth to 2030.314
The total excess deaths due to climate change for a country is the sum of the CE for diseases
comprising the sub-index health impact (cf. Table 4 above):
g
The sub-index score is calculated by using the index calculation formula below:
Index score
The calculation of 2030 estimates uses WHO 2004 CIF for 2030315 and the disease burden
projected for 2030, using population projections from the UN. 316
P O P U L A T I O N
A T T R I B U T A B L E F R A C T I O N , P A F
RELATIVE RISK FOR EXPOSURE VERSUS NON-EXPOSURE, RR
1
1 2 3 4
Population
non-exposed. In the case of climate change, the RR measure expresses the extra risk associated
with the existence of abnormal weather patterns. For example, RR =2 indicates that the risk of
dying due to flooding is twice as high in the case of climate change as it is the case of no climate
change. The PAF expresses the fraction of risk -- for example, of deaths driven by climate -- and is,
by construction, always smaller than 1.
The direct relationship between RR and PAF is illustrated in the figure below.
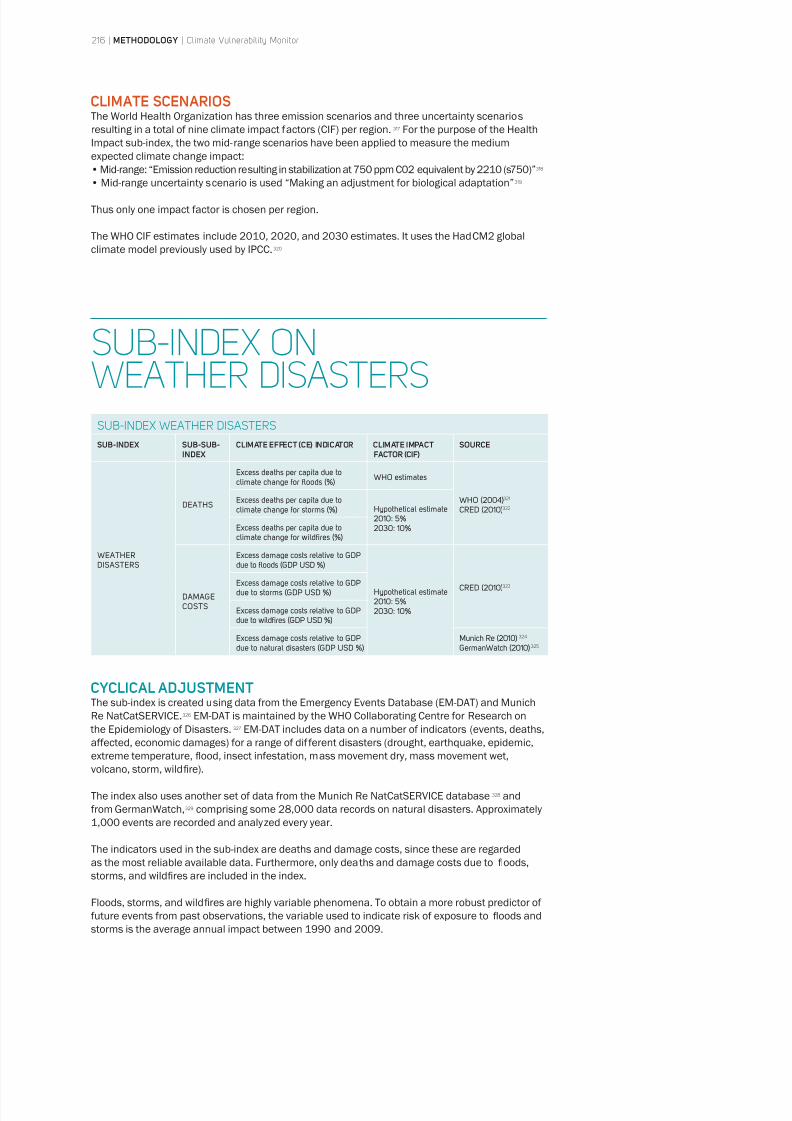
8/8/2019 Climate Vulnerability Monitor 2010: The State of the Climate Crisis
http://slidepdf.com/reader/full/climate-vulnerability-monitor-2010-the-state-of-the-climate-crisis 218/291
216 | METHODOLOGY | Climate Vulnerability Monitor
CLIMATE SCENARIOSThe World Health Organization has three emission scenarios and three uncertainty scenarios
resulting in a total of nine climate impact factors (CIF) per region.317 For the purpose of the Health
Impact sub-index, the two mid-range scenarios have been applied to measure the medium
expected climate change impact:
• Mid-range: “Emission reduction resulting in stabilization at 750 ppm C02 equivalent by 2210 (s750)”318
• Mid-range uncertainty scenario is used “Making an adjustment for biological adaptation”319
Thus only one impact factor is chosen per region.
The WHO CIF estimates include 2010, 2020, and 2030 estimates. It uses the HadCM2 global
climate model previously used by IPCC.320
CYCLICAL ADJUSTMENTThe sub-index is created using data from the Emergency Events Database (EM-DAT) and Munich
Re NatCatSERVICE.326 EM-DAT is maintained by the WHO Collaborating Centre for Research on the Epidemiology of Disasters. 327 EM-DAT includes data on a number of indicators (events, deaths,
affected, economic damages) for a range of dif ferent disasters (drought, earthquake, epidemic,
extreme temperature, flood, insect infestation, mass movement dry, mass movement wet,
volcano, storm, wildfire).
The index also uses another set of data from the Munich Re NatCatSERVICE database328 and
from GermanWatch,329 comprising some 28,000 data records on natural disasters. Approximately
1,000 events are recorded and analyzed every year.
The indicators used in the sub-index are deaths and damage costs, since these are regarded
as the most reliable available data. Furthermore, only deaths and damage costs due to floods,
storms, and wildfires are included in the index.
Floods, storms, and wildfires are highly variable phenomena. To obtain a more robust predictor of
future events from past observations, the variable used to indicate risk of exposure to floods and
storms is the average annual impact between 1990 and 2009.
SUB-INDEX ONWEATHER DISASTERSSUB-INDEX WEATHER DISASTERS
SUB-INDEX SUB-SUB-INDEX
CLIMATE EFFECT (CE) INDICATOR CLIMATE IMPACTFACTOR (CIF)
SOURCE
WEATHERDISASTERS
DEATHS
Excess deaths per capita due to
WHO estimates
321
322
Excess deaths per capita due to Hypothetical estimate
Excess deaths per capita due to
DAMAGECOSTS
Excess damage costs relative to GDP
Hypothetical estimate
323Excess damage costs relative to GDP
Excess damage costs relative to GDP
Excess damage costs relative to GDP
324
325
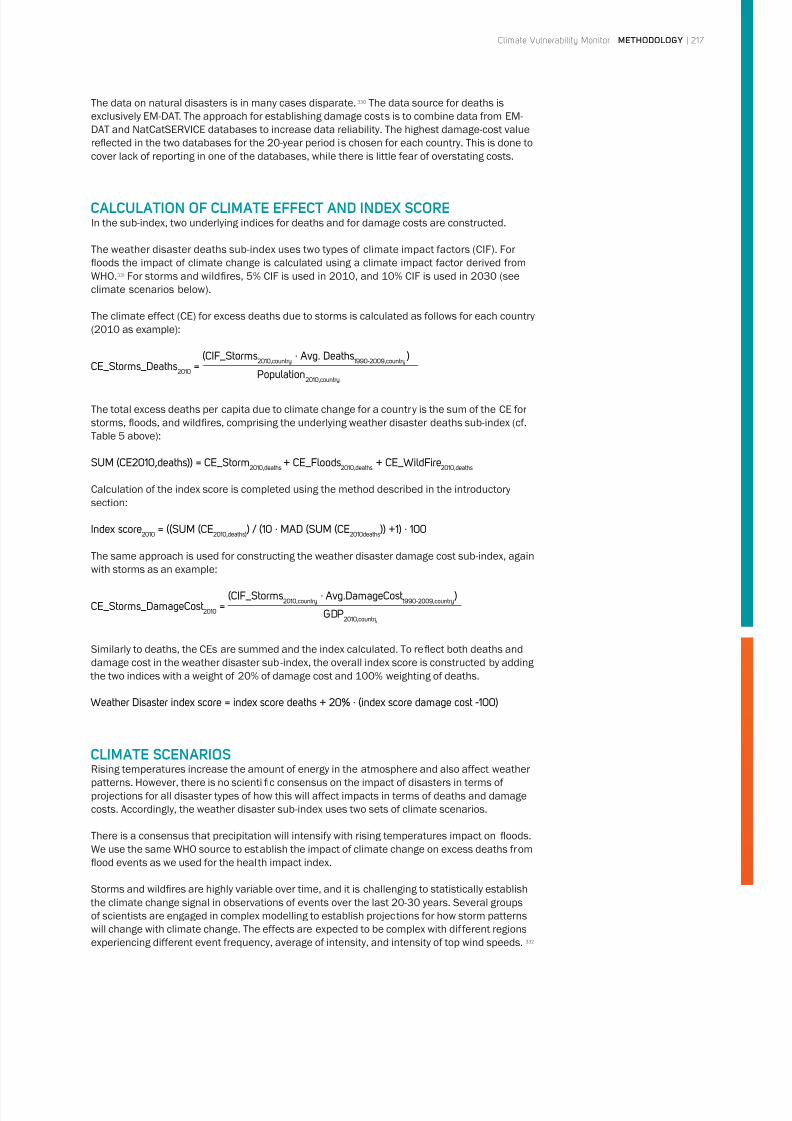
8/8/2019 Climate Vulnerability Monitor 2010: The State of the Climate Crisis
http://slidepdf.com/reader/full/climate-vulnerability-monitor-2010-the-state-of-the-climate-crisis 219/291
Climate Vulnerability Monitor | METHODOLOGY | 217
The data on natural disasters is in many cases disparate.330 The data source for deaths is
exclusively EM-DAT. The approach for establishing damage costs is to combine data from EM-
DAT and NatCatSERVICE databases to increase data reliability. The highest damage-cost value
reflected in the two databases for the 20-year period is chosen for each country. This is done to
cover lack of reporting in one of the databases, while there is little fear of overstating costs.
CALCULATION OF CLIMATE EFFECT AND INDEX SCOREIn the sub-index, two underlying indices for deaths and for damage costs are constructed.
The weather disaster deaths sub-index uses two types of climate impact factors (CIF). For
floods the impact of climate change is calculated using a climate impact factor derived from
WHO.331 For storms and wildfires, 5% CIF is used in 2010, and 10% CIF is used in 2030 (see
climate scenarios below).
The climate effect (CE) for excess deaths due to storms is calculated as follows for each country
(2010 as example):
CE_Storms_Deaths
= · Avg. Deaths
The total excess deaths per capita due to climate change for a country is the sum of the CE for
storms, floods, and wildfires, comprising the underlying weather disaster deaths sub-index (cf.
Table 5 above):
Calculation of the index score is completed using the method described in the introductory
section:
Index score
The same approach is used for constructing the weather disaster damage cost sub-index, again
with storms as an example:
CE_Storms_DamageCost
=
· Avg.DamageCost
Similarly to deaths, the CEs are summed and the index calculated. To reflect both deaths and
damage cost in the weather disaster sub-index, the overall index score is constructed by adding
the two indices with a weight of 20% of damage cost and 100% weighting of deaths.
CLIMATE SCENARIOSRising temperatures increase the amount of energy in the atmosphere and also affect weather
patterns. However, there is no scientific consensus on the impact of disasters in terms of
projections for all disaster types of how this will affect impacts in terms of deaths and damage
costs. Accordingly, the weather disaster sub-index uses two sets of climate scenarios.
There is a consensus that precipitation will intensify with rising temperatures impact on floods.
We use the same WHO source to establish the impact of climate change on excess deaths from
flood events as we used for the health impact index.
Storms and wildfires are highly variable over time, and it is challenging to statistically establish the climate change signal in observations of events over the last 20-30 years. Several groups
of scientists are engaged in complex modelling to establish projections for how storm patterns
will change with climate change. The effects are expected to be complex with different regions
experiencing different event frequency, average of intensity, and intensity of top wind speeds.332
Population
GDP
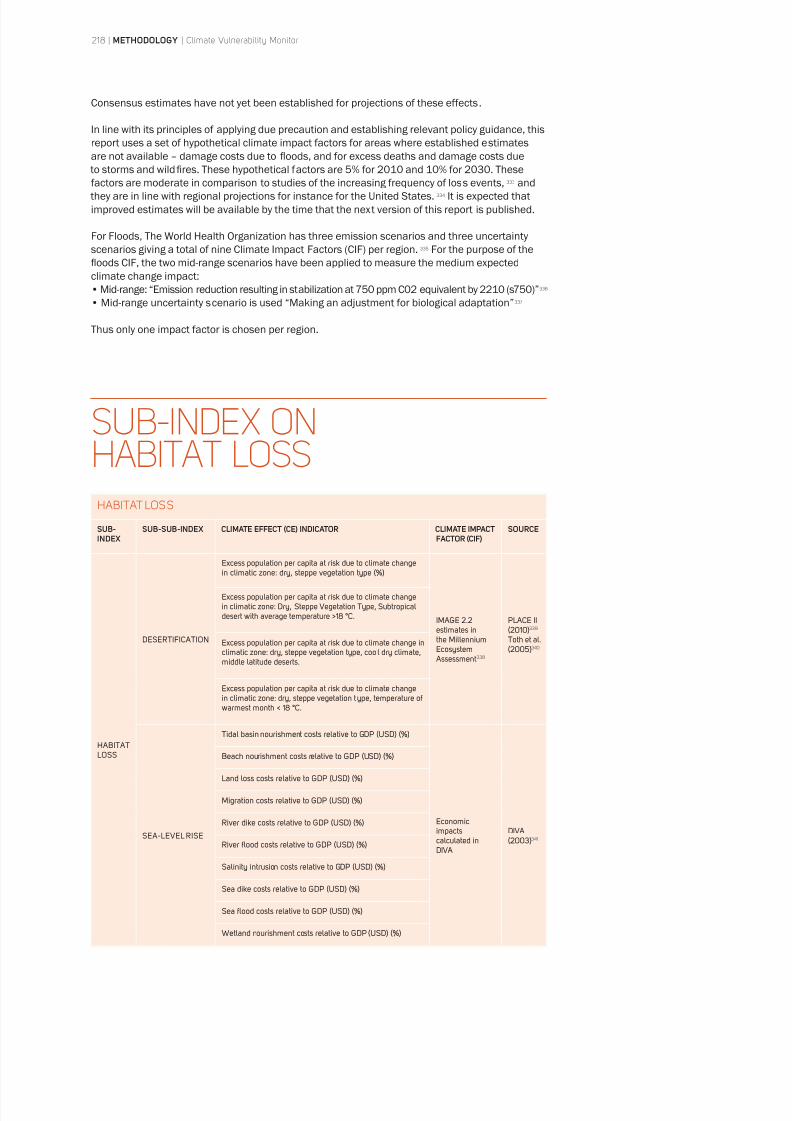
8/8/2019 Climate Vulnerability Monitor 2010: The State of the Climate Crisis
http://slidepdf.com/reader/full/climate-vulnerability-monitor-2010-the-state-of-the-climate-crisis 220/291
218 | METHODOLOGY | Climate Vulnerability Monitor
Consensus estimates have not yet been established for projections of these effects.
In line with its principles of applying due precaution and establishing relevant policy guidance, this
report uses a set of hypothetical climate impact factors for areas where established estimates
are not available – damage costs due to floods, and for excess deaths and damage costs due
to storms and wildfires. These hypothetical factors are 5% for 2010 and 10% for 2030. These
factors are moderate in comparison to studies of the increasing frequency of loss events,333 and
they are in line with regional projections for instance for the United States.334 It is expected that
improved estimates will be available by the time that the next version of this report is published.
For Floods, The World Health Organization has three emission scenarios and three uncertainty
scenarios giving a total of nine Climate Impact Factors (CIF) per region.335 For the purpose of the
floods CIF, the two mid-range scenarios have been applied to measure the medium expected
climate change impact:
• Mid-range: “Emission reduction resulting in stabilization at 750 ppm C02 equivalent by 2210 (s750)”336
• Mid-range uncertainty scenario is used “Making an adjustment for biological adaptation”337
Thus only one impact factor is chosen per region.
HABITAT LOSS
SUB-INDEX
SUB-SUB-INDEX CLIMATE EFFECT (CE) INDICATOR CLIMATE IMPACTFACTOR (CIF)
SOURCE
HABITATLOSS
DESERTIFICATION
Excess population per capita at risk due to climate change
IMAGE 2.2estimates inthe MillenniumEcosystem Assessment338
PLACE II339
Toth et al.340
Excess population per capita at risk due to climate changein climatic zone: Dry, Steppe Vegetation Type, Subtropicaldesert with average temperature >18 °C.
Excess population per capita at risk due to climate change inclimatic zone: dry, steppe vegetation type, cool dry climate,middle latitude deserts.
Excess population per capita at risk due to climate changein climatic zone: dry, steppe vegetation type, temperature ofwarmest month < 18 °C.
SEA-LEVEL RISE
Economicimpactscalculated inDIVA
DIVA341
SUB-INDEX ONHABITAT LOSS
8/8/2019 Climate Vulnerability Monitor 2010: The State of the Climate Crisis
http://slidepdf.com/reader/full/climate-vulnerability-monitor-2010-the-state-of-the-climate-crisis 221/291
Climate Vulnerability Monitor | METHODOLOGY | 219
CALCULATION OF CLIMATE EFFECTThe Sea-Level Rise Indicator in the sub-index is calculated by using a set of variables indicating
the projected economic losses as a share of GDP due to sea- level rise caused by climate change
from the Dynamic Interactive Vulnerability Assessment (DIVA) tool;342 a geographic information
system (GIS)-based tool to assess impacts and vulnerability to sea- level rise at scales from
coastal segment up to global. It comprises a database, a series of algorithms, and a graphical
user interface. In the DIVA database, the world’s coastlines are divided into 12,148 segments
with an average coastal segment length of 70km. DIVA provides a multitude of parameters for
each of the segments, including population density, frequency and height of storm surges, and
coastal wetland areas. These are used as inputs for the extended sea- level rise cost function.
DIVA also contains various data at other scales, including countries, major rivers, tidal basins, and
administrative units (states, prefectures, etc.).
The economic losses modelled in the DIVA due to sea-level rise is the cost of:
• Tidal basin nourishment (adaptation cost)
• Beach nourishment (adaptation cost)
• Land loss (losses)
• Migration (adaptation cost)
• River dike (adaptation cost)
• River flood (losses)• Salinity intrusion (losses)
• Sea dike (adaptation cost)
• Sea flood (losses)
• Wetland nourishment (adaptation cost)
Each of the cost components is derived from the DIVA model in 2010 and 2030 and the climate
effect is calculated simply by dividing the cost with GDP.
CE_Land Loss
=Cost of Land Loss
We can use the same method to calculate the sea-level rise index score as we used in the HealthImpact and Weather Disaster sections:
• Adding all CE effects
• Calculating the index score
Index score
The Desertification Indicator in the sub- index is calculated by using a variable indicating the share
of the population living in areas at risk of desertification from the PLACE II database (Population,
Landscape, and Climate Estimates).343 This data set has been released as part of SEDAC’s
National Aggregates of Geospatial Data Collection.
SEDAC, the Socioeconomic Data and Applications Center, is one of the Distributed Active Archive
Centers (DAACs) in the Earth Observing System Data and Information System (EOSDIS) of the
U.S. National Aeronautics and Space Administration. PLACE II is managed by the Center forInternational Earth Science Information Network (CIESIN) at Columbia University.344
PLACE II estimates the number of people (head counts and percentages) and the land area (square
kilometres and percentages) represented within each class of a number of demographic, physical,
biological, and climatic variables for each country around the world, for the years 1990 and 2000.345
The measure used in the sub-index is the share of populations living in areas that are at risk of
desertification (defined as population in climatic zones that is classified as dry, steppe vegetation type).
The impact of climate change on the population at risk to desertification has been derived from
the Millennium Ecosystem Assessment Report (1999) using the IMAGE model that is developed
by the IMAGE team under the authority of the Netherlands Environmental Assessment Agency
(PBL). IMAGE is used to provide regional estimates of desertification.346
Climate impact factors are assumed to follow a linear trajectory from 2000 to 2050, as suggested
by the four scenarios in the IMAGE2.2. model. Thus, scores for 2010 and 2030 can be derived by
combining the IMAGE model projections and the PLACE model baseline data from 2000.
GDP
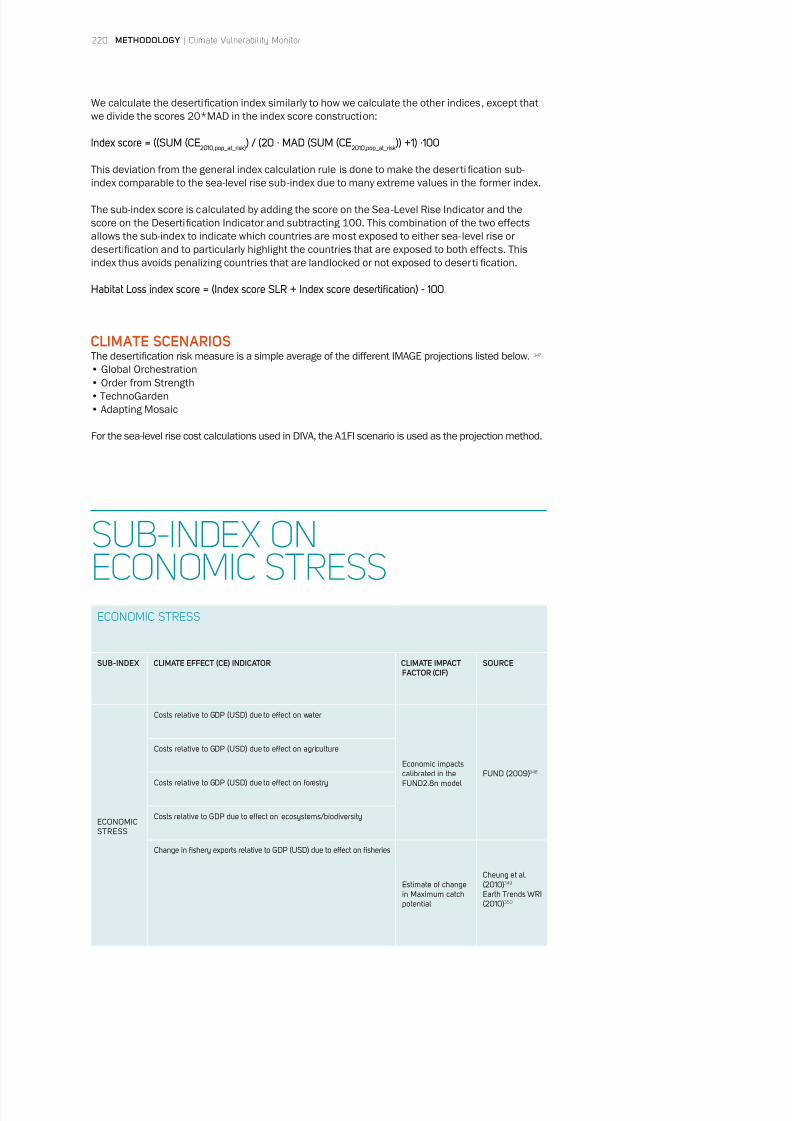
8/8/2019 Climate Vulnerability Monitor 2010: The State of the Climate Crisis
http://slidepdf.com/reader/full/climate-vulnerability-monitor-2010-the-state-of-the-climate-crisis 222/291
220 | METHODOLOGY | Climate Vulnerability Monitor
We calculate the desertification index similarly to how we calculate the other indices, except that
we divide the scores 20*MAD in the index score construction:
This deviation from the general index calculation rule is done to make the desertification sub-
index comparable to the sea-level rise sub-index due to many extreme values in the former index.
The sub-index score is calculated by adding the score on the Sea-Level Rise Indicator and the
score on the Desertification Indicator and subtracting 100. This combination of the two effects
allows the sub-index to indicate which countries are most exposed to either sea- level rise or
desertification and to particularly highlight the countries that are exposed to both effects. This
index thus avoids penalizing countries that are landlocked or not exposed to desertification.
CLIMATE SCENARIOSThe desertification risk measure is a simple average of the different IMAGE projections listed below. 347
• Global Orchestration
• Order from Strength
• TechnoGarden
• Adapting Mosaic
For the sea-level rise cost calculations used in DIVA, the A1FI scenario is used as the projection method.
SUB-INDEX ONECONOMIC STRESS
ECONOMIC STRESS
SUB-INDEX CLIMATE EFFECT (CE) INDICATOR CLIMATE IMPACTFACTOR (CIF)
SOURCE
ECONOMICSTRESS
Economic impactscalibrated in theFUND2.8n model
348
Costs relative to GDP due to effect on ecosystems/biodiversity
Estimate of changein Maximum catchpotential
Cheung et al.349
Earth Trends WRI350
8/8/2019 Climate Vulnerability Monitor 2010: The State of the Climate Crisis
http://slidepdf.com/reader/full/climate-vulnerability-monitor-2010-the-state-of-the-climate-crisis 223/291
Climate Vulnerability Monitor | METHODOLOGY | 221
CALCULATION OF CLIMATE EFFECTWe calculate the Economic Stress Sub-index using a set of variables indicating the projected
economic losses in different economic sectors as a share of GDP due to climate change.
Estimates for four economic sectors are based on the FUND 2.8n model. We calculate the
Climate Effect by use of the FUND model (Climate Framework for Uncertainty, Negotiation and
Distribution).351 FUND is an integrated assessment model of climate change. The model links
exogenous population and per capita income scenarios with simple models of technology,
economics, emissions, atmospheric chemistry, climate and sea-levels in order to estimate
impacts such as migration, disease burdens and economic effects on a sector basis. The model
runs in steps of 5 years from 1950 to 2100 and covers 207 countries. The FUND2.8n model is
based on the more sophisticated FUND2.8 model that provides annual estimates of outcomes
for 16 regions up to 2030. All estimates in the FUND model are made with 1995 US dollars as the
benchmark year.
One notable change has been made to the FUND model, namely to reduce in half the “water
resources sensitivity parameter with regard to temperature change” for the “Former Soviet Union”
region. This rationale for the change was as follows:
• Former Soviet Union water resources impact is an outlier value that overshadows the impacts
in other regions• To improve the sensitivity of the Economic sub-index to negative impacts in other regions
The sub-index combines indicators of climate change impacts on economic sectors that are
stressed by climate change.
• Land sectors (Agriculture, Forestry, Water and Biodiversity): climate change related loss or gain
in economic output in these sectors in 2010 and 2030.
• Marine sector (Fisheries): climate change related loss or gain in the economic value of exports
of the fisheries sector in 2010 and 2030
We calculate economic loss in fisheries using Cheung et al. 2010 estimates.352 Cheung et al.
estimate the change in maximum catch potential due to climate change. The higher (numerically)
the latitude, the larger the increase in maximum catch potential, and the opposite holds true forlow-latitude countries. Thus, tropical countries close to the equator face a decreasing maximum
catch potential, while especially northern countries experience gains.
Cheung et al. show specific estimates for 20 countries. These are taken directly as climate
impact factors (CIFs). The countries not listed are given general risk factors using the
specifications below:
• Countries > 55 lat = 0,3
• Countries in the tropics < 0,23 (num) = -0,2
Calculation of the index scores follows the same procedure as the other sub-indices
And
And
GDP
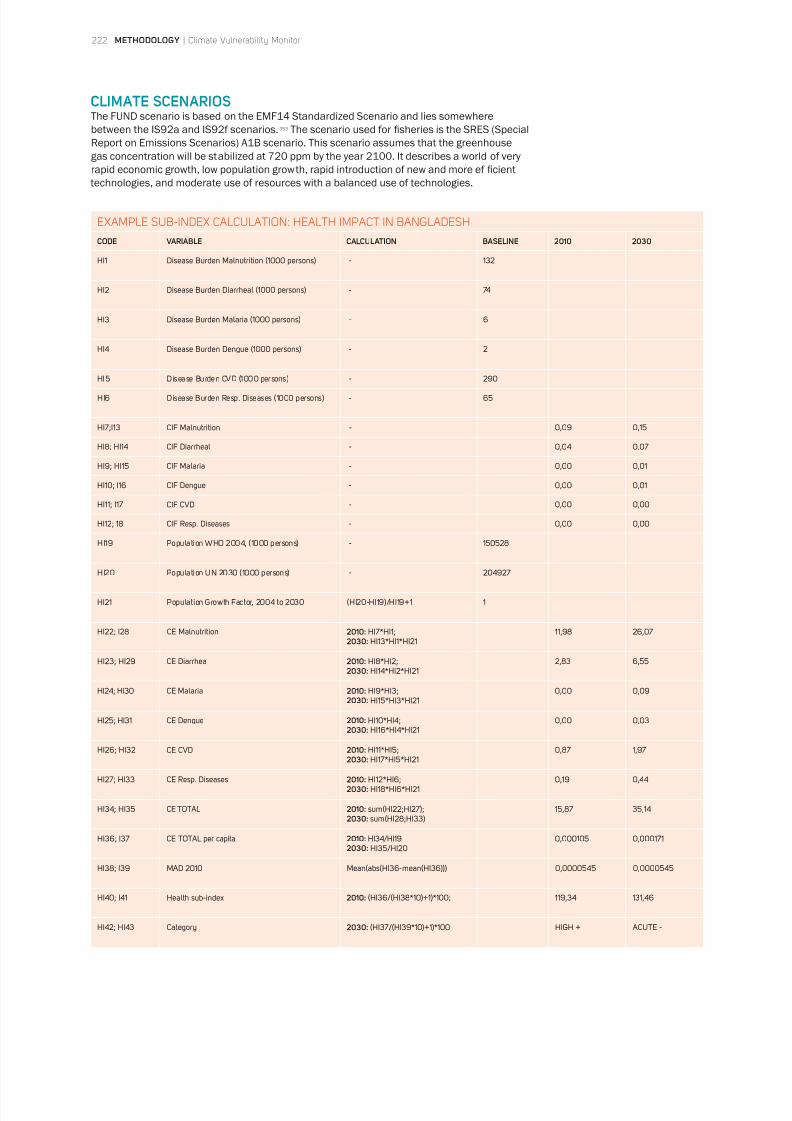
8/8/2019 Climate Vulnerability Monitor 2010: The State of the Climate Crisis
http://slidepdf.com/reader/full/climate-vulnerability-monitor-2010-the-state-of-the-climate-crisis 224/291
222 | METHODOLOGY | Climate Vulnerability Monitor
CLIMATE SCENARIOSThe FUND scenario is based on the EMF14 Standardized Scenario and lies somewhere
between the IS92a and IS92f scenarios.353 The scenario used for fisheries is the SRES (Special
Report on Emissions Scenarios) A1B scenario. This scenario assumes that the greenhouse
gas concentration will be stabilized at 720 ppm by the year 2100. It describes a world of very
rapid economic growth, low population growth, rapid introduction of new and more ef ficient
technologies, and moderate use of resources with a balanced use of technologies.
EXAMPLE SUB-INDEX CALCULATION: HEALTH IMPACT IN BANGLADESH
CODE VARIABLE CALCULATION BASELINE 2010 2030
HI1 - 132
HI2 -
HI3 -
HI4 - 2
-
-
CIF Malnutrition -
HI8; HI14 CIF Diarrheal -
CIF Malaria -
CIF Dengue -
CIF CVD -
HI12; 18 CIF Resp. Diseases -
-
-
HI21 1
HI22; I28 CE Malnutrition 2010: 2030:
CE Diarrhea 2010: 2030:
2,83
CE Malaria 2010: 2030:
CE Dengue 2010: 2030:
CE CVD 2010: 2030:
CE Resp. Diseases 2010: 2030:
CE TOTAL 2010: 2030:
CE TOTAL per capita 2010: 2030:
Health sub-index 2010:
HI42; HI43 Category 2030: ACUTE -
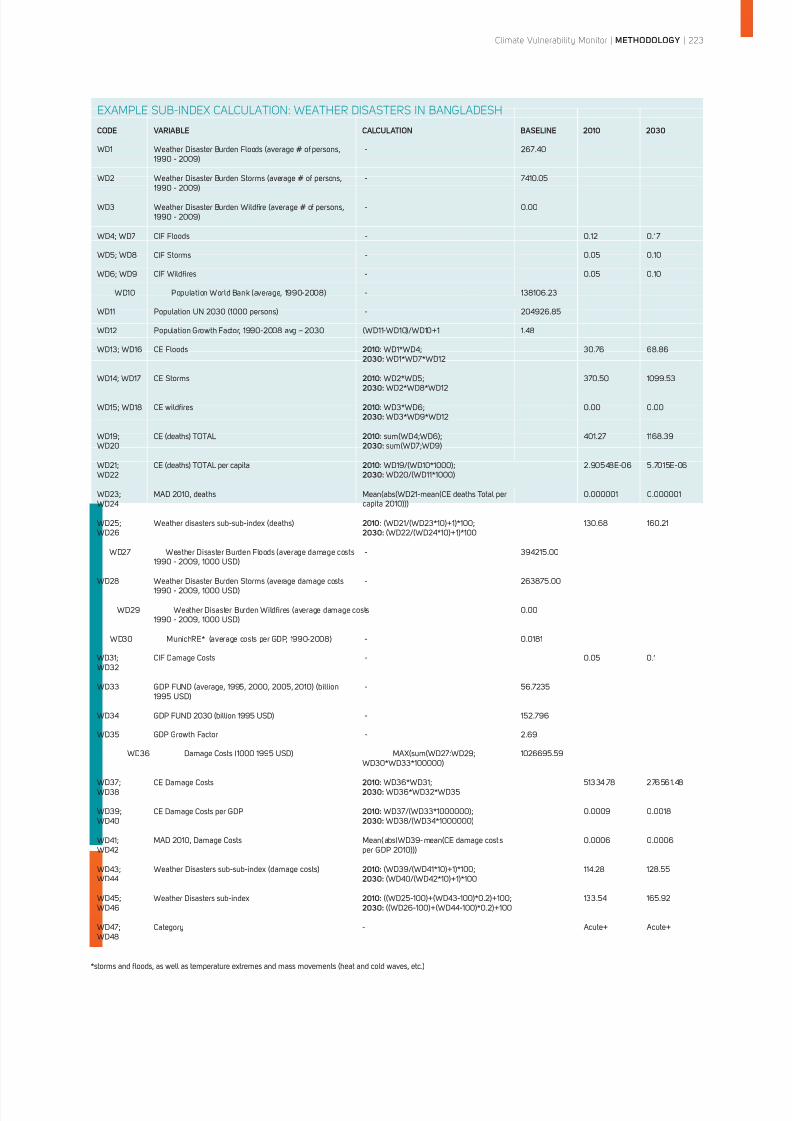
8/8/2019 Climate Vulnerability Monitor 2010: The State of the Climate Crisis
http://slidepdf.com/reader/full/climate-vulnerability-monitor-2010-the-state-of-the-climate-crisis 225/291
Climate Vulnerability Monitor | METHODOLOGY | 223
EXAMPLE SUB-INDEX CALCULATION: WEATHER DISASTERS IN BANGLADESH
CODE VARIABLE CALCULATION BASELINE 2010 2030
WD1
-
WD2
-
WD3
-
CIF Floods -
CIF Storms -
CIF Wildfires -
-
WD11 -
WD12 1.48
CE Floods 2010:
2030:
CE Storms 2010: 2030:
CE wildfires 2010: 2030:
2010: 2030:
WD21; WD22
2010: 2030:
WD23; WD24
2010
2030:
-
WD28
-
-
-
WD31; WD32
CIF Damage Costs -
WD33
-
WD34 -
GDP Growth Factor -
WD38
CE Damage Costs 2010: 2030:
CE Damage Costs per GDP 2010:2030:
WD41; WD42
WD43; WD44
2010:2030:
114.28
Weather Disasters sub-index 2010: 2030:
WD48
Category -
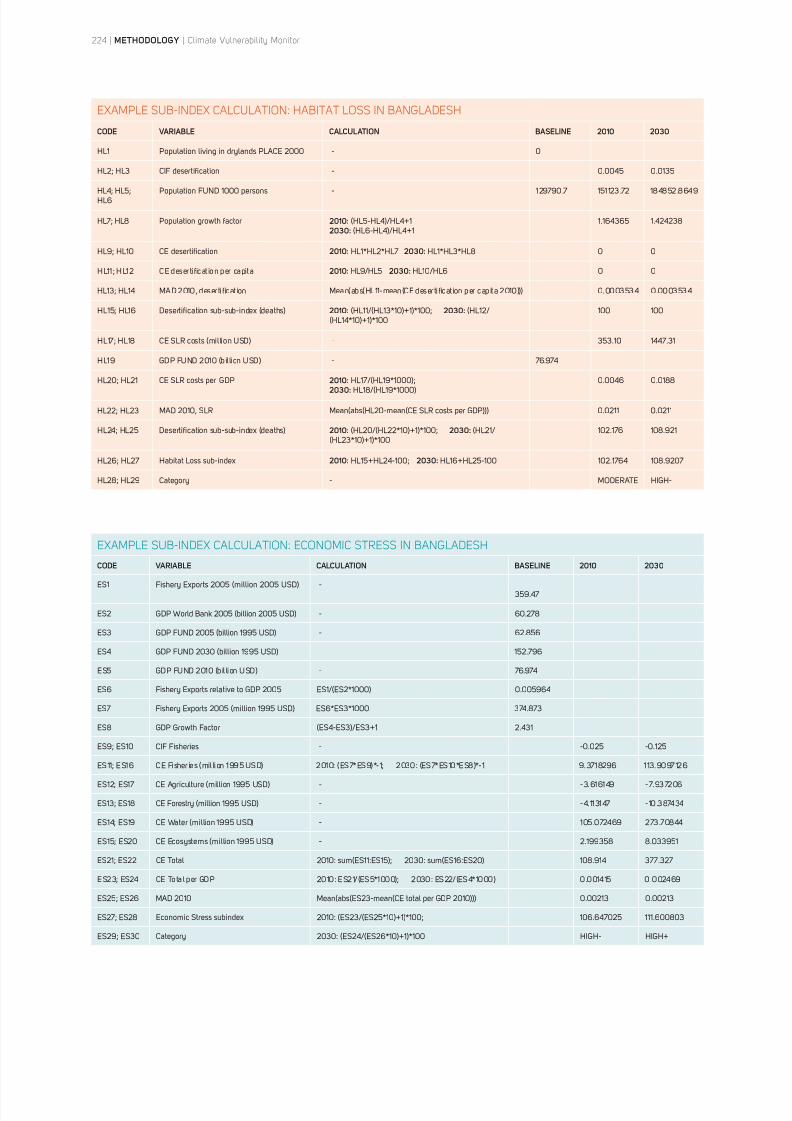
8/8/2019 Climate Vulnerability Monitor 2010: The State of the Climate Crisis
http://slidepdf.com/reader/full/climate-vulnerability-monitor-2010-the-state-of-the-climate-crisis 226/291
224 | METHODOLOGY | Climate Vulnerability Monitor
EXAMPLE SUB-INDEX CALCULATION: HABITAT LOSS IN BANGLADESH
CODE VARIABLE CALCULATION BASELINE 2010 2030
HL1 -
HL2; HL3 CIF desertification -
-
Population growth factor 2010: 2030:
1.424238
CE desertification 2010:2030:
HL11 ; HL12 CE desertificat ion per capita 2010: 2030:
HL13; HL14
2010:2030:
-
-
CE SLR costs per GDP 2010: 2030:
HL22; HL23
2010:2030:
Habitat Loss sub-index 2010:2030:
Category - MODERATE HIGH-
EXAMPLE SUB-INDEX CALCULATION: ECONOMIC STRESS IN BANGLADESH
CODE VARIABLE CALCULATION BASELINE 2010 2030
ES1 -
ES2 -
ES3 -
ES4
-
ES8 GDP Growth Factor 2.431
CIF Fisheries -
-
ES13; ES18 -
-
-
ES21; ES22 CE Total
ES23; ES24 CE Total per GDP
Economic Stress subindex
Category HIGH-
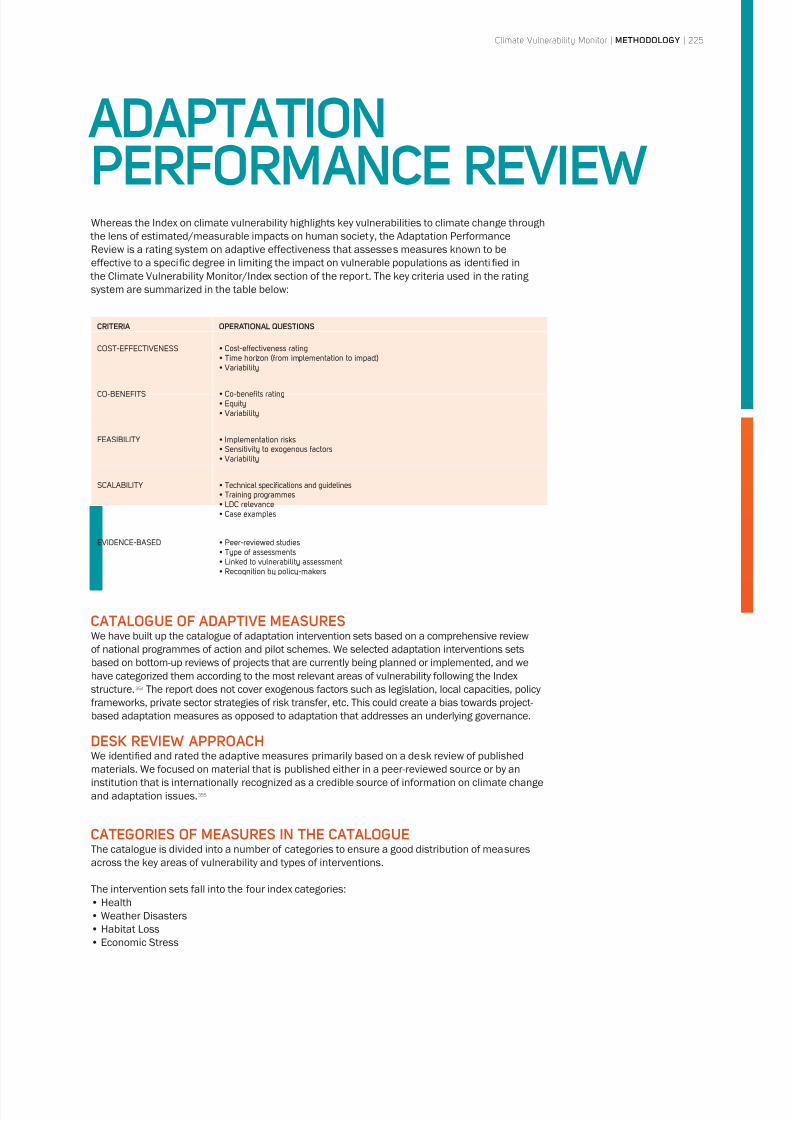
8/8/2019 Climate Vulnerability Monitor 2010: The State of the Climate Crisis
http://slidepdf.com/reader/full/climate-vulnerability-monitor-2010-the-state-of-the-climate-crisis 227/291
Climate Vulnerability Monitor | METHODOLOGY | 225
ADAPTATION
PERFORMANCE REVIEW
CRITERIA OPERATIONAL QUESTIONS
COST-EFFECTIVENESS
CO-BENEFITS
FEASIBILITY
SCALABILITY
EVIDENCE-BASED
Whereas the Index on climate vulnerability highlights key vulnerabilities to climate change through
the lens of estimated/measurable impacts on human society, the Adaptation Performance
Review is a rating system on adaptive effectiveness that assesses measures known to be
effective to a specific degree in limiting the impact on vulnerable populations as identified in
the Climate Vulnerability Monitor/Index section of the report. The key criteria used in the rating
system are summarized in the table below:
CATALOGUE OF ADAPTIVE MEASURESWe have built up the catalogue of adaptation intervention sets based on a comprehensive review
of national programmes of action and pilot schemes. We selected adaptation interventions sets
based on bottom-up reviews of projects that are currently being planned or implemented, and we
have categorized them according to the most relevant areas of vulnerability following the Index
structure.354 The report does not cover exogenous factors such as legislation, local capacities, policy
frameworks, private sector strategies of risk transfer, etc. This could create a bias towards project-
based adaptation measures as opposed to adaptation that addresses an underlying governance.
DESK REVIEW APPROACHWe identified and rated the adaptive measures primarily based on a desk review of published
materials. We focused on material that is published either in a peer-reviewed source or by an
institution that is internationally recognized as a credible source of information on climate change
and adaptation issues.355
CATEGORIES OF MEASURES IN THE CATALOGUEThe catalogue is divided into a number of categories to ensure a good distribution of measures
across the key areas of vulnerability and types of interventions.
The intervention sets fall into the four index categories:• Health
• Weather Disasters
• Habitat Loss
• Economic Stress
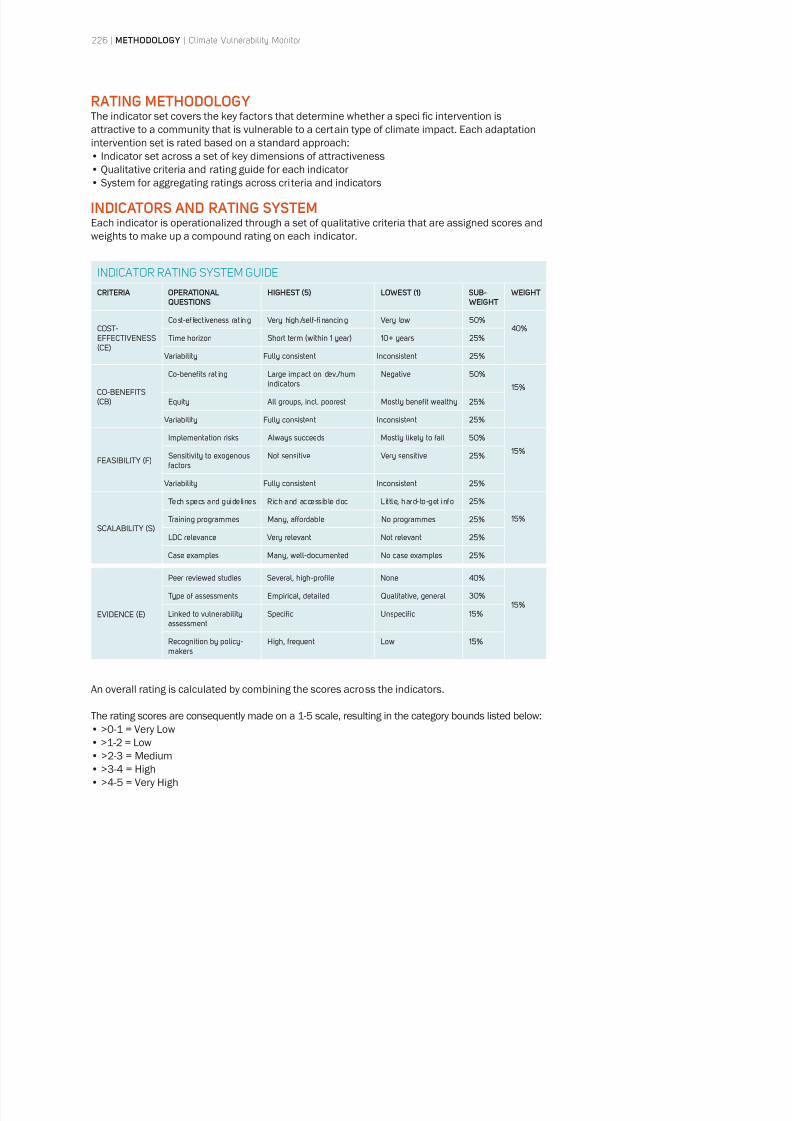
8/8/2019 Climate Vulnerability Monitor 2010: The State of the Climate Crisis
http://slidepdf.com/reader/full/climate-vulnerability-monitor-2010-the-state-of-the-climate-crisis 228/291
226 | METHODOLOGY | Climate Vulnerability Monitor
RATING METHODOLOGYThe indicator set covers the key factors that determine whether a specific intervention is
attractive to a community that is vulnerable to a certain type of climate impact. Each adaptation
intervention set is rated based on a standard approach:
• Indicator set across a set of key dimensions of attractiveness
• Qualitative criteria and rating guide for each indicator
• System for aggregating ratings across criteria and indicators
INDICATORS AND RATING SYSTEMEach indicator is operationalized through a set of qualitative criteria that are assigned scores and
weights to make up a compound rating on each indicator.
An overall rating is calculated by combining the scores across the indicators.
The rating scores are consequently made on a 1-5 scale, resulting in the category bounds listed below:• >0-1 = Very Low
• >1-2 = Low
• >2-3 = Medium
• >3-4 = High
• >4-5 = Very High
INDICATOR RATING SYSTEM GUIDE
CRITERIA OPERATIONALQUESTIONS
HIGHEST (5) LOWEST (1) SUB- WEIGHT
WEIGHT
COST-EFFECTIVENESS
Cost-ef fect iveness rat ing Very high/self-financing Very low
Time horizon
Variability Fully consistent Inconsistent
CO-BENEFITS
Co-benefits rat ing Large impact on dev./humindicators
Negative
Equity All groups, incl. poorest Mostly benefit wealthy
Variability Fully consistent Inconsistent
Implementation risks Always succeeds Mostly likely to fail
Sensitivity to exogenousfactors
Not sensitive Very sensitive
Variability Fully consistent Inconsistent
Tech specs and guidelines Rich and accessible doc Little, hard-to-get info
Training programmes Many, affordable No programmes
LDC relevance Very relevant Not relevant
Case examples Many, well-documented No case examples
Peer reviewed studies Several, high-profile None
Type of assessments Empirical, detailed Qualitative, general
Linked to vulnerabilityassessment
Specific Unspecific
Recognition by policy-makers
High, frequent Low
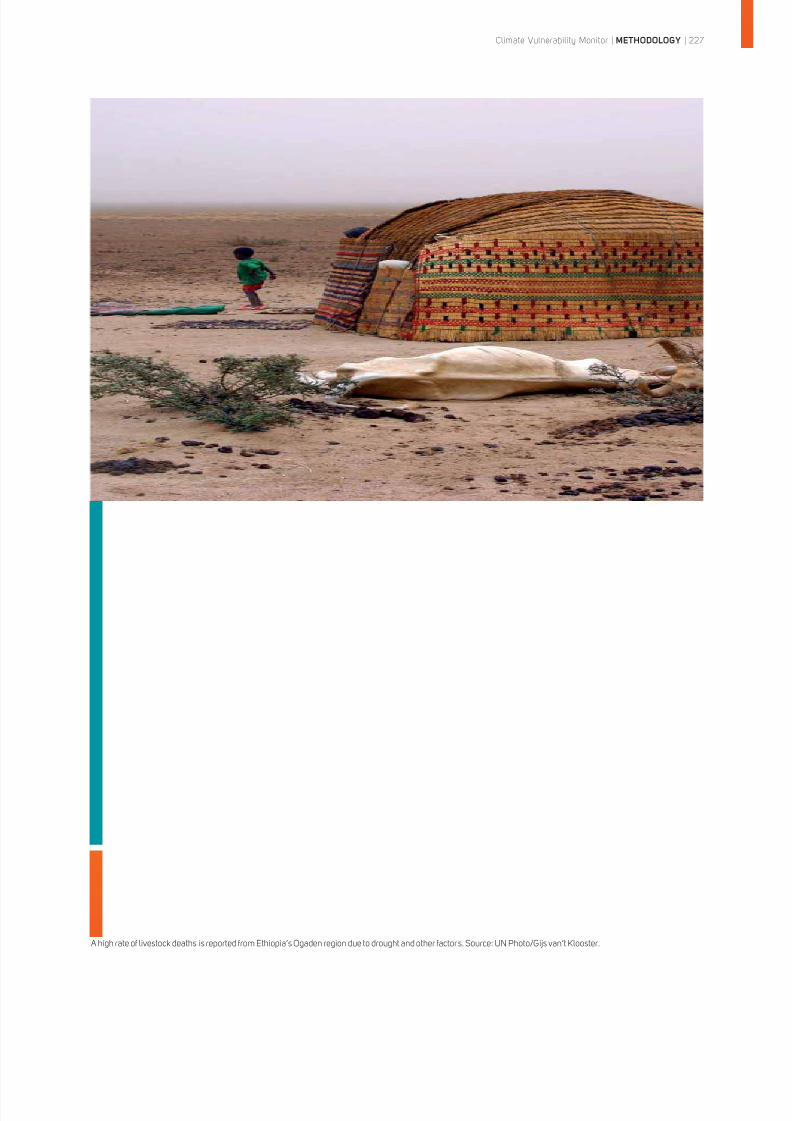
8/8/2019 Climate Vulnerability Monitor 2010: The State of the Climate Crisis
http://slidepdf.com/reader/full/climate-vulnerability-monitor-2010-the-state-of-the-climate-crisis 229/291
Climate Vulnerability Monitor | METHODOLOGY | 227
A high rate of livestock deaths is reported from Ethiopia’s Ogaden region due to drought and other factors. Source: UN Photo/Gijs van’t Klooster.
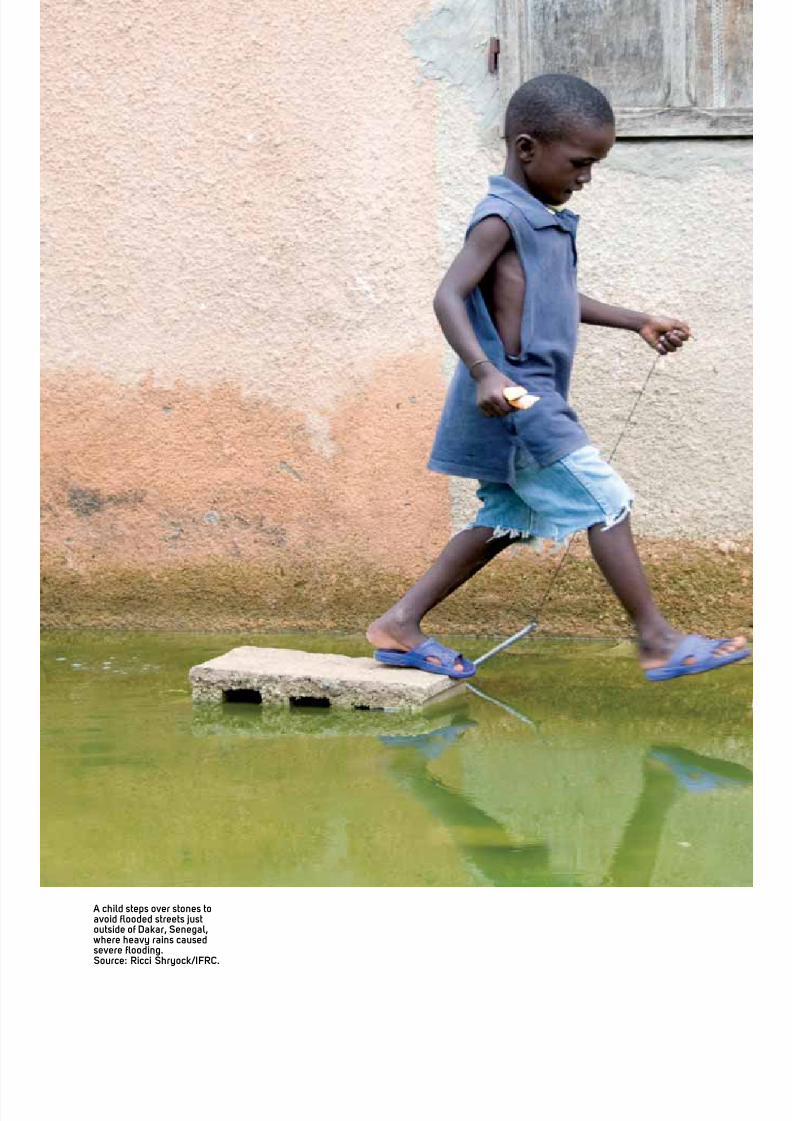
8/8/2019 Climate Vulnerability Monitor 2010: The State of the Climate Crisis
http://slidepdf.com/reader/full/climate-vulnerability-monitor-2010-the-state-of-the-climate-crisis 230/291
A child steps over stones toavoid flooded streets justoutside of Dakar, Senegal, where heavy rains causedsevere flooding.Source: Ricci Shryock/IFRC.

8/8/2019 Climate Vulnerability Monitor 2010: The State of the Climate Crisis
http://slidepdf.com/reader/full/climate-vulnerability-monitor-2010-the-state-of-the-climate-crisis 231/291
MONITOR DATA TABLES
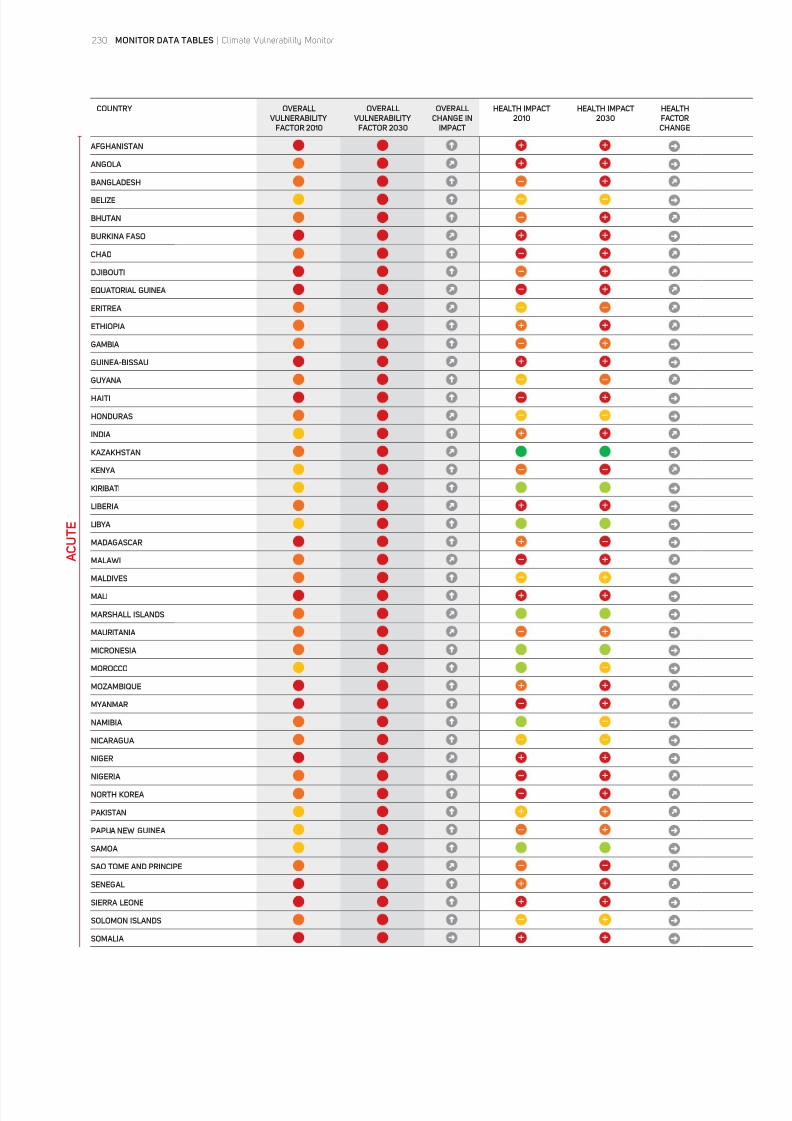
8/8/2019 Climate Vulnerability Monitor 2010: The State of the Climate Crisis
http://slidepdf.com/reader/full/climate-vulnerability-monitor-2010-the-state-of-the-climate-crisis 232/291
COUNTRY OVERALL VULNERABILITY
FACTOR 2010
OVERALL VULNERABILITY
FACTOR 2030
OVERALLCHANGE IN
IMPACT
HEALTH IMPACT2010
HEALTH IMPACT2030
HEALTHFACTORCHANGE
AFGHANISTAN
ANGOLA
BANGLADESH
BELIZE
BHUTAN
BURKINA FASO
CHAD
DJIBOUTI
EQUATORIAL GUINEA
ERITREA
ETHIOPIA
GAMBIA
GUINEA-BISSAU
GUYANA
HAITI
HONDURAS
INDIA
KAZAKHSTAN
KENYA
KIRIBATI
LIBERIA
LIBYA
MADAGASCAR
MALAWI
MALDIVES
MALI
MARSHALL ISLANDS
MAURITANIA
MICRONESIA
MOROCCO
MOZAMBIQUE
MYANMAR
NAMIBIA
NICARAGUA
NIGER
NIGERIA
NORTH KOREA
PAKISTAN
PAPUA NEW GUINEA
SAMOA
SAO TOME AND PRINCIPE
SENEGAL
SIERRA LEONE
SOLOMON ISLANDS
SOMALIA
A C U T
E
230 | MONITOR DATA TABLES | Climate Vulnerability Monitor
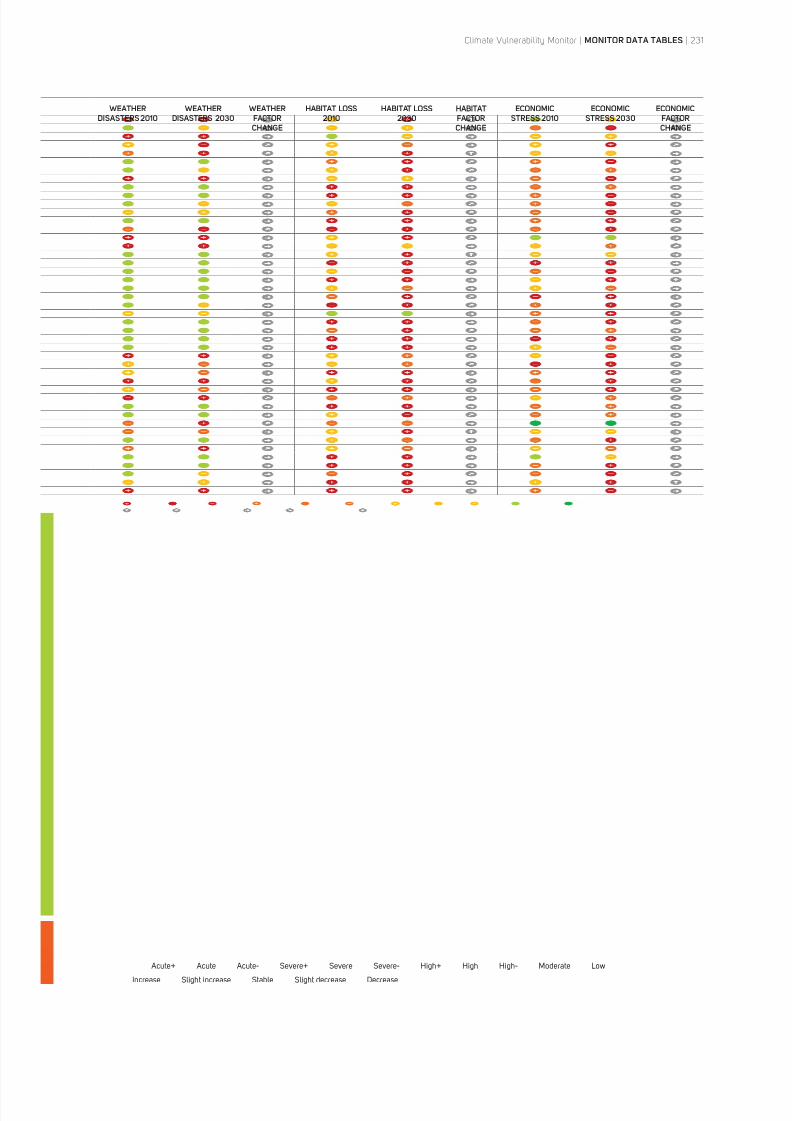
8/8/2019 Climate Vulnerability Monitor 2010: The State of the Climate Crisis
http://slidepdf.com/reader/full/climate-vulnerability-monitor-2010-the-state-of-the-climate-crisis 233/291
WEATHERDISASTERS 2010
WEATHERDISASTERS 2030
WEATHERFACTORCHANGE
HABITAT LOSS2010
HABITAT LOSS2030
HABITATFACTORCHANGE
ECONOMICSTRESS 2010
ECONOMICSTRESS 2030
ECONOMICFACTORCHANGE
Increase Slight increase Stable Slight decrease Decrease
Acute+ Acute Acute- Severe+ Severe Severe- High+ High High- Moderate Low
Climate Vulnerability Monitor | MONITOR DATA TABLES | 231
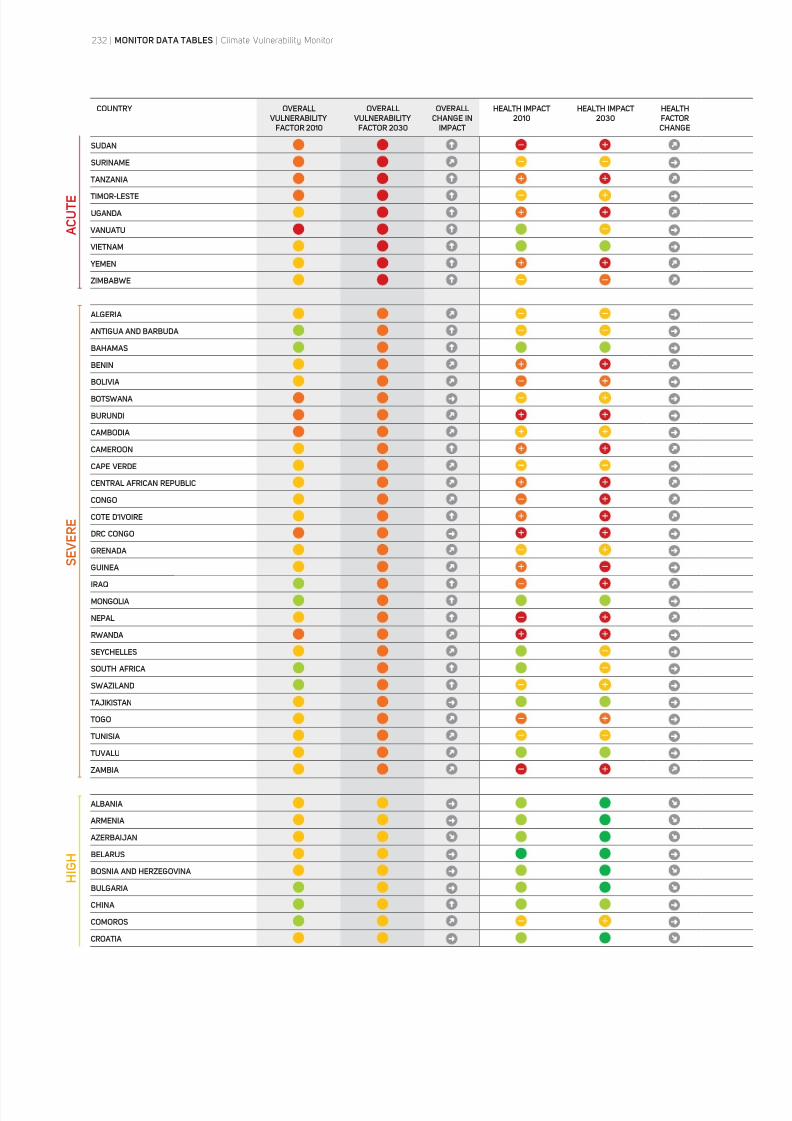
8/8/2019 Climate Vulnerability Monitor 2010: The State of the Climate Crisis
http://slidepdf.com/reader/full/climate-vulnerability-monitor-2010-the-state-of-the-climate-crisis 234/291
COUNTRY OVERALL VULNERABILITY
FACTOR 2010
OVERALL VULNERABILITY
FACTOR 2030
OVERALLCHANGE IN
IMPACT
HEALTH IMPACT2010
HEALTH IMPACT2030
HEALTHFACTORCHANGE
SUDAN
SURINAME
TANZANIA
TIMOR-LESTE
UGANDA
VANUATU
VIETNAM
YEMEN
ZIMBABWE
ALGERIA
ANTIGUA AND BARBUDA
BAHAMAS
BENIN
BOLIVIA
BOTSWANA
BURUNDI
CAMBODIA
CAMEROON
CAPE VERDE
CENTRAL AFRICAN REPUBLIC
CONGO
COTE D'IVOIRE
DRC CONGO
GRENADA
GUINEA
IRAQ
MONGOLIA
NEPAL
RWANDA
SEYCHELLES
SOUTH AFRICA
SWAZILAND
TAJIKISTAN
TOGO
TUNISIA
TUVALU
ZAMBIA
ALBANIA
ARMENIA
AZERBAIJAN
BELARUS
BOSNIA AND HERZEGOVINA
BULGARIACHINA
COMOROS
CROATIA
A C U T E
H I G H
S E V E R
E
232 | MONITOR DATA TABLES | Climate Vulnerability Monitor
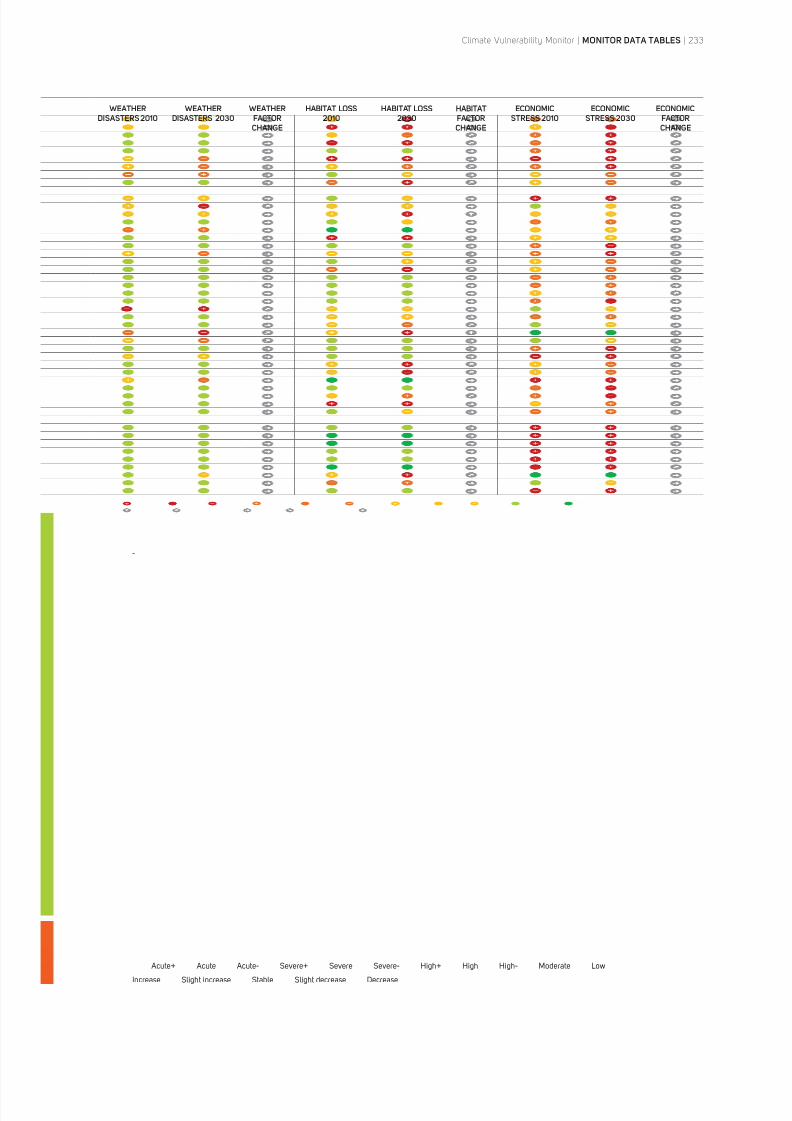
8/8/2019 Climate Vulnerability Monitor 2010: The State of the Climate Crisis
http://slidepdf.com/reader/full/climate-vulnerability-monitor-2010-the-state-of-the-climate-crisis 235/291
WEATHERDISASTERS 2010
WEATHERDISASTERS 2030
WEATHERFACTORCHANGE
HABITAT LOSS2010
HABITAT LOSS2030
HABITATFACTORCHANGE
ECONOMICSTRESS 2010
ECONOMICSTRESS 2030
ECONOMICFACTORCHANGE
-
Increase Slight increase Stable Slight decrease Decrease
Acute+ Acute Acute- Severe+ Severe Severe- High+ High High- Moderate Low
Climate Vulnerability Monitor | MONITOR DATA TABLES | 233
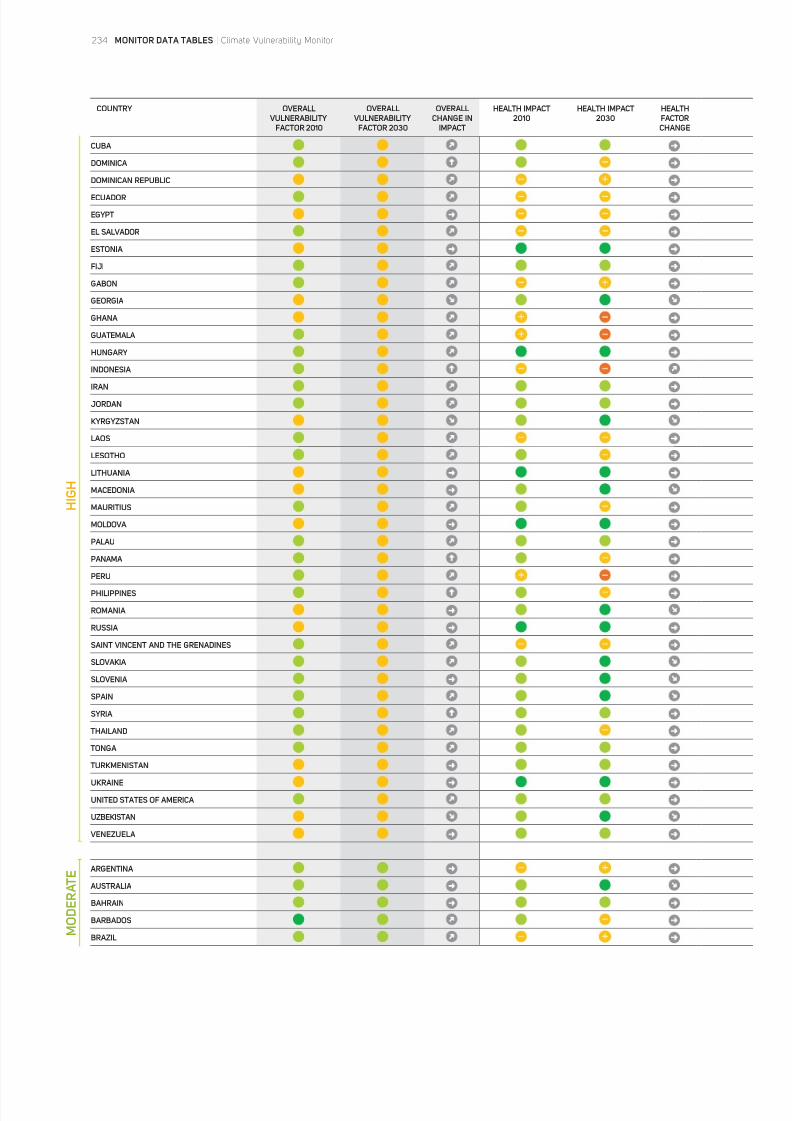
8/8/2019 Climate Vulnerability Monitor 2010: The State of the Climate Crisis
http://slidepdf.com/reader/full/climate-vulnerability-monitor-2010-the-state-of-the-climate-crisis 236/291
COUNTRY OVERALL VULNERABILITY
FACTOR 2010
OVERALL VULNERABILITY
FACTOR 2030
OVERALLCHANGE IN
IMPACT
HEALTH IMPACT2010
HEALTH IMPACT2030
HEALTHFACTORCHANGE
CUBA
DOMINICA
DOMINICAN REPUBLIC
ECUADOR
EGYPT
EL SALVADOR
ESTONIA
FIJI
GABON
GEORGIA
GHANA
GUATEMALA
HUNGARYINDONESIA
IRAN
JORDAN
KYRGYZSTAN
LAOS
LESOTHO
LITHUANIA
MACEDONIA
MAURITIUS
MOLDOVA
PALAU
PANAMA
PERU
PHILIPPINES
ROMANIA
RUSSIA
SAINT VINCENT AND THE GRENADINES
SLOVAKIA
SLOVENIA
SPAIN
SYRIA
THAILAND
TONGA
TURKMENISTAN
UKRAINE
UNITED STATES OF AMERICA
UZBEKISTAN
VENEZUELA
ARGENTINA
AUSTRALIA
BAHRAIN
BARBADOS
BRAZIL
H I G H
M O D E R A
T E
234 | MONITOR DATA TABLES | Climate Vulnerability Monitor
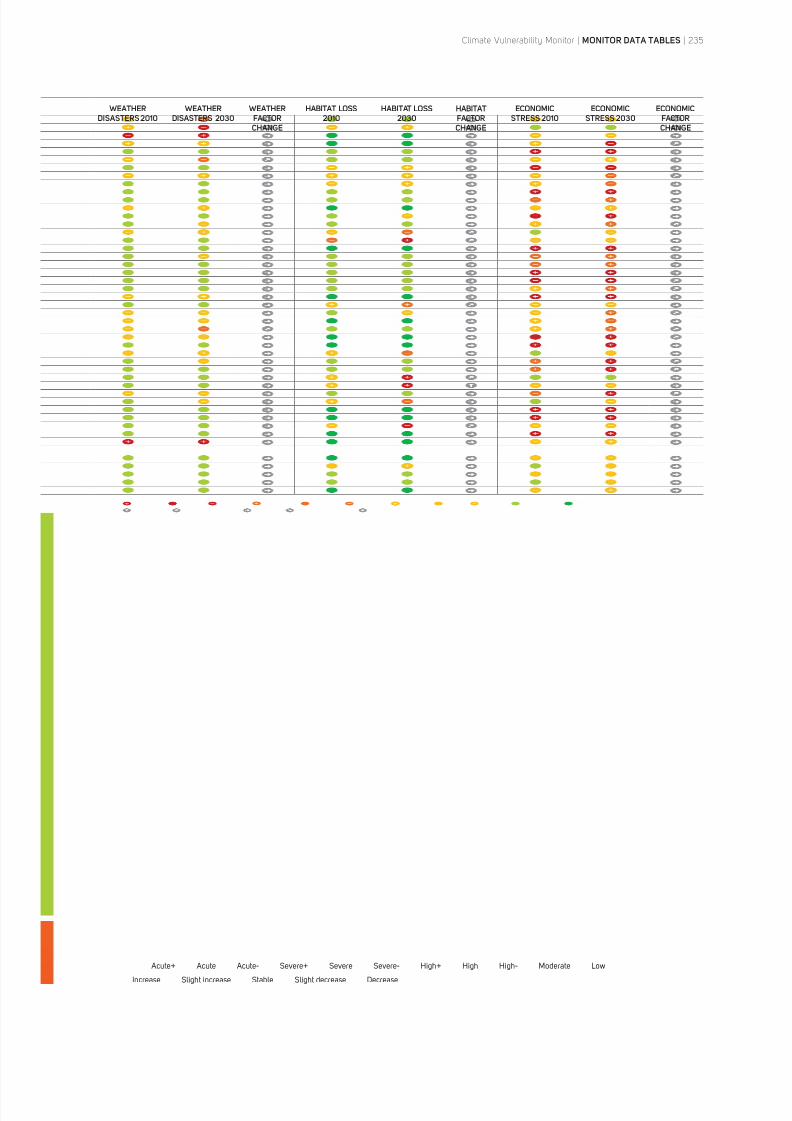
8/8/2019 Climate Vulnerability Monitor 2010: The State of the Climate Crisis
http://slidepdf.com/reader/full/climate-vulnerability-monitor-2010-the-state-of-the-climate-crisis 237/291
WEATHERDISASTERS 2010
WEATHERDISASTERS 2030
WEATHERFACTORCHANGE
HABITAT LOSS2010
HABITAT LOSS2030
HABITATFACTORCHANGE
ECONOMICSTRESS 2010
ECONOMICSTRESS 2030
ECONOMICFACTORCHANGE
Increase Slight increase Stable Slight decrease Decrease
Acute+ Acute Acute- Severe+ Severe Severe- High+ High High- Moderate Low
Climate Vulnerability Monitor | MONITOR DATA TABLES | 235
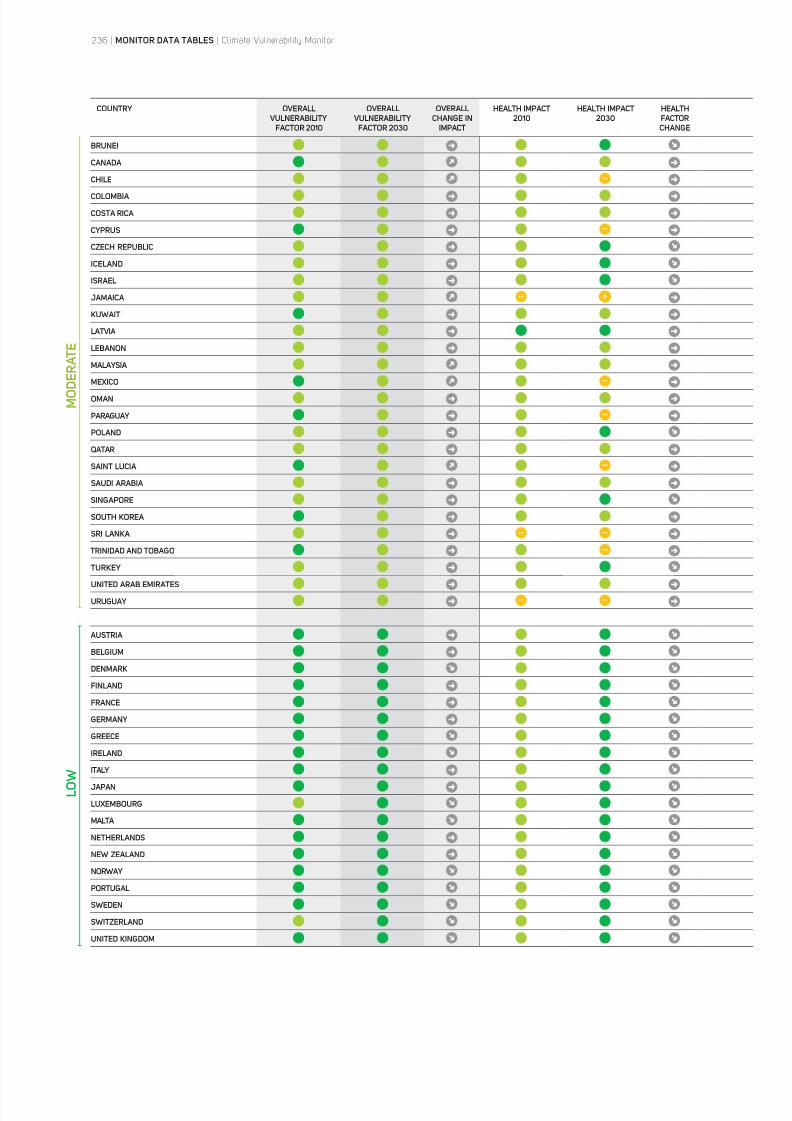
8/8/2019 Climate Vulnerability Monitor 2010: The State of the Climate Crisis
http://slidepdf.com/reader/full/climate-vulnerability-monitor-2010-the-state-of-the-climate-crisis 238/291
COUNTRY OVERALL VULNERABILITY
FACTOR 2010
OVERALL VULNERABILITY
FACTOR 2030
OVERALLCHANGE IN
IMPACT
HEALTH IMPACT2010
HEALTH IMPACT2030
HEALTHFACTORCHANGE
BRUNEI
CANADA
CHILE
COLOMBIA
COSTA RICA
CYPRUS
CZECH REPUBLIC
ICELAND
ISRAEL
JAMAICA
KUWAIT
LATVIA
LEBANON
MALAYSIA
MEXICO
OMAN
PARAGUAY
POLAND
QATAR
SAINT LUCIA
SAUDI ARABIA
SINGAPORE
SOUTH KOREA
SRI LANKA
TRINIDAD AND TOBAGO
TURKEY
UNITED ARAB EMIRATES
URUGUAY
AUSTRIA
BELGIUM
DENMARK
FINLAND
FRANCE
GERMANY
GREECE
IRELAND
ITALY
JAPAN
LUXEMBOURG
MALTA
NETHERLANDS
NEW ZEALAND
NORWAY
PORTUGALSWEDEN
SWITZERLAND
UNITED KINGDOM
M O D E R A T
E
L O W
236 | MONITOR DATA TABLES | Climate Vulnerability Monitor
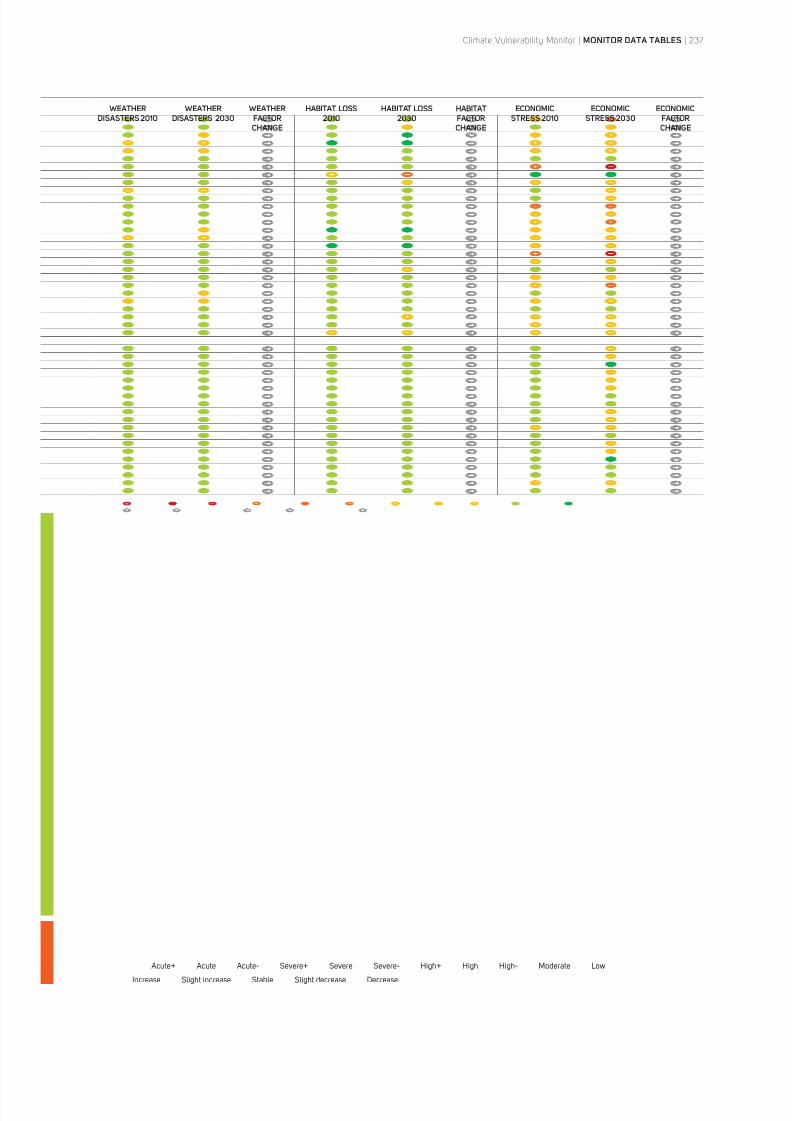
8/8/2019 Climate Vulnerability Monitor 2010: The State of the Climate Crisis
http://slidepdf.com/reader/full/climate-vulnerability-monitor-2010-the-state-of-the-climate-crisis 239/291
WEATHERDISASTERS 2010
WEATHERDISASTERS 2030
WEATHERFACTORCHANGE
HABITAT LOSS2010
HABITAT LOSS2030
HABITATFACTORCHANGE
ECONOMICSTRESS 2010
ECONOMICSTRESS 2030
ECONOMICFACTORCHANGE
Increase Slight increase Stable Slight decrease Decrease
Acute+ Acute Acute- Severe+ Severe Severe- High+ High High- Moderate Low
Climate Vulnerability Monitor | MONITOR DATA TABLES | 237
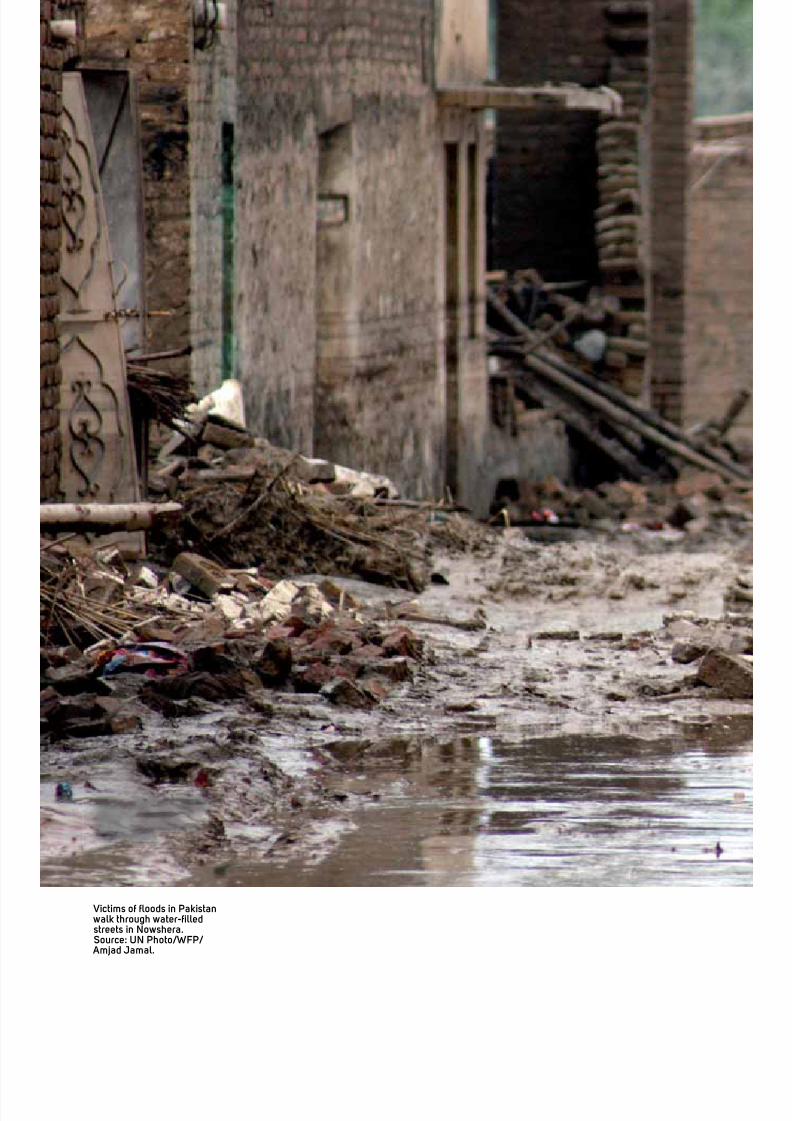
8/8/2019 Climate Vulnerability Monitor 2010: The State of the Climate Crisis
http://slidepdf.com/reader/full/climate-vulnerability-monitor-2010-the-state-of-the-climate-crisis 240/291
Victims of floods in Pakistan walk through water-filledstreets in Nowshera.Source: UN Photo/WFP/ Amjad Jamal.
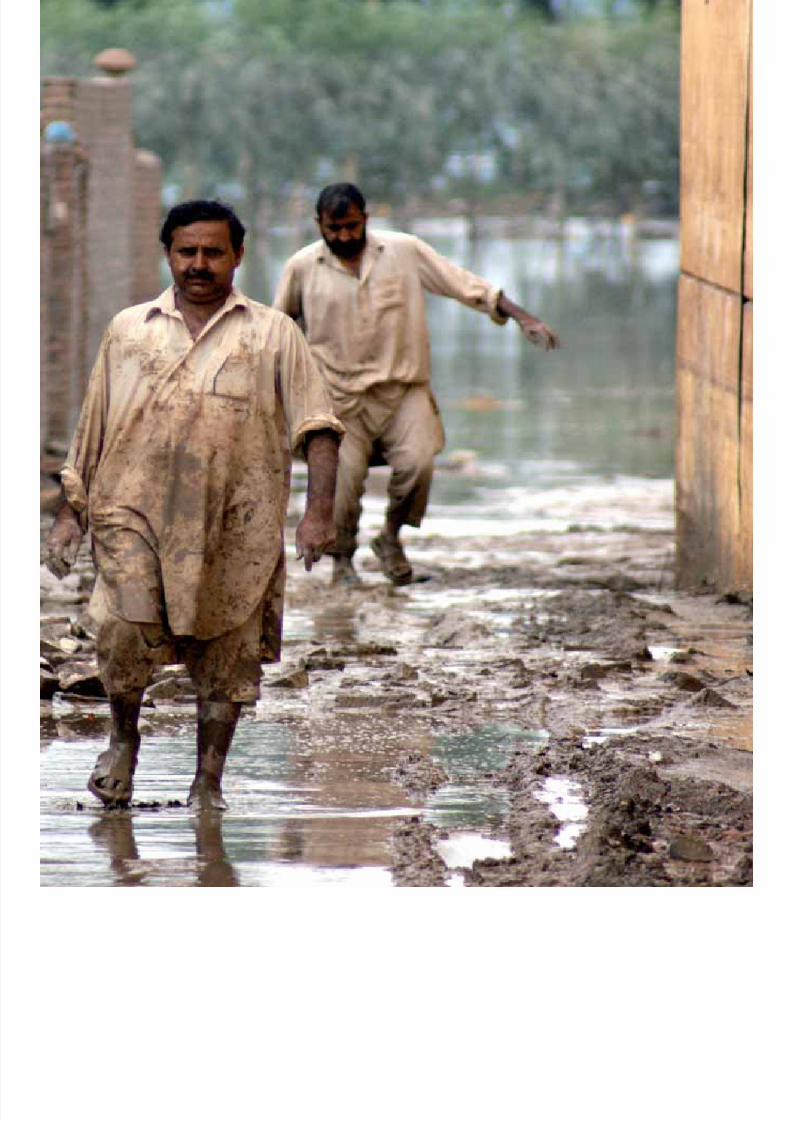
8/8/2019 Climate Vulnerability Monitor 2010: The State of the Climate Crisis
http://slidepdf.com/reader/full/climate-vulnerability-monitor-2010-the-state-of-the-climate-crisis 241/291
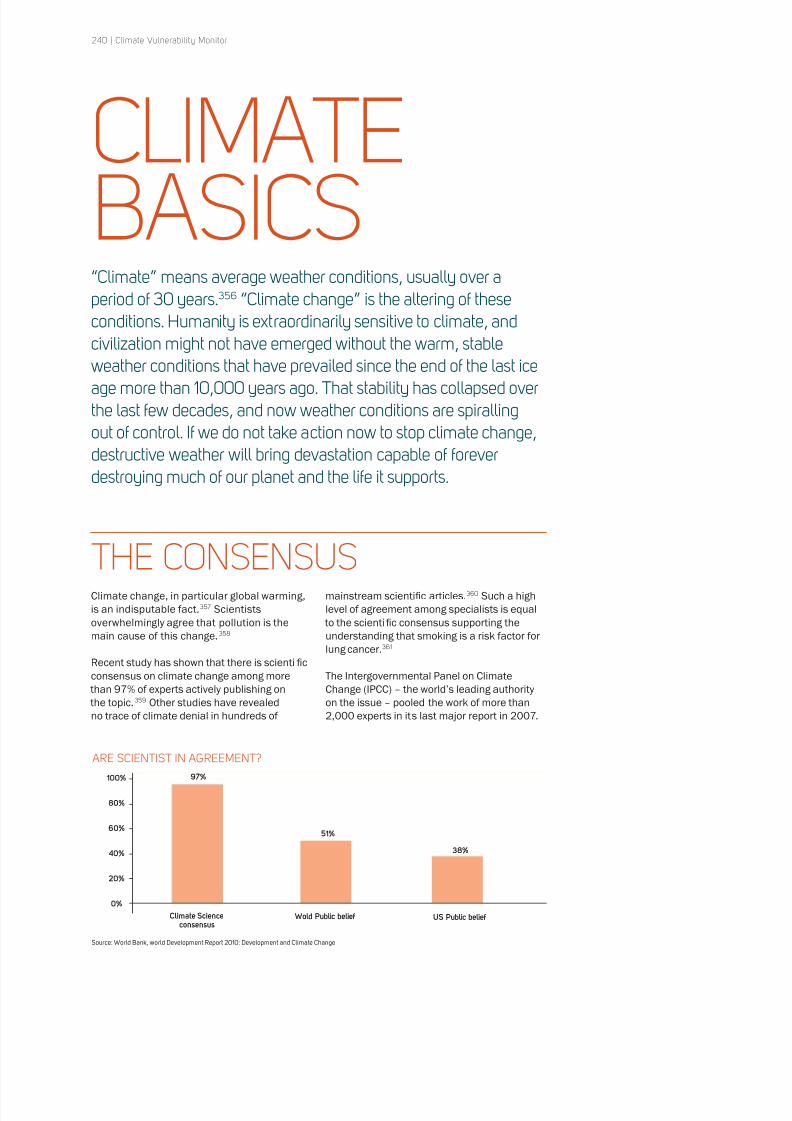
8/8/2019 Climate Vulnerability Monitor 2010: The State of the Climate Crisis
http://slidepdf.com/reader/full/climate-vulnerability-monitor-2010-the-state-of-the-climate-crisis 242/291
240 | Climate Vulnerability Monitor
CLIMATEBASICS“Climate” means average weather conditions, usually over aperiod of 30 years.356 “Climate change” is the altering of theseconditions. Humanity is extraordinarily sensitive to climate, andcivilization might not have emerged without the warm, stableweather conditions that have prevailed since the end of the last iceage more than 10,000 years ago. That stability has collapsed overthe last few decades, and now weather conditions are spirallingout of control. If we do not take action now to stop climate change,destructive weather will bring devastation capable of foreverdestroying much of our planet and the life it supports.
Climate change, in particular global warming,
is an indisputable fact.357 Scientists
overwhelmingly agree that pollution is the
main cause of this change.358
Recent study has shown that there is scientific
consensus on climate change among more
than 97% of experts actively publishing on
the topic.359 Other studies have revealed
no trace of climate denial in hundreds of
mainstream scientific articles.360 Such a high
level of agreement among specialists is equal
to the scientific consensus supporting the
understanding that smoking is a risk factor for
lung cancer.361
The Intergovernmental Panel on Climate
Change (IPCC) – the world’s leading authority
on the issue – pooled the work of more than
2,000 experts in its last major report in 2007.
THE CONSENSUS
ARE SCIENTIST IN AGREEMENT?
97% 100%
80%
60%
40%
20%
0%
51%
38%
Climate Scienceconsensus
Wold Public belief US Public belief
Source: World Bank, world Development Report 2010: Development and Climate Change
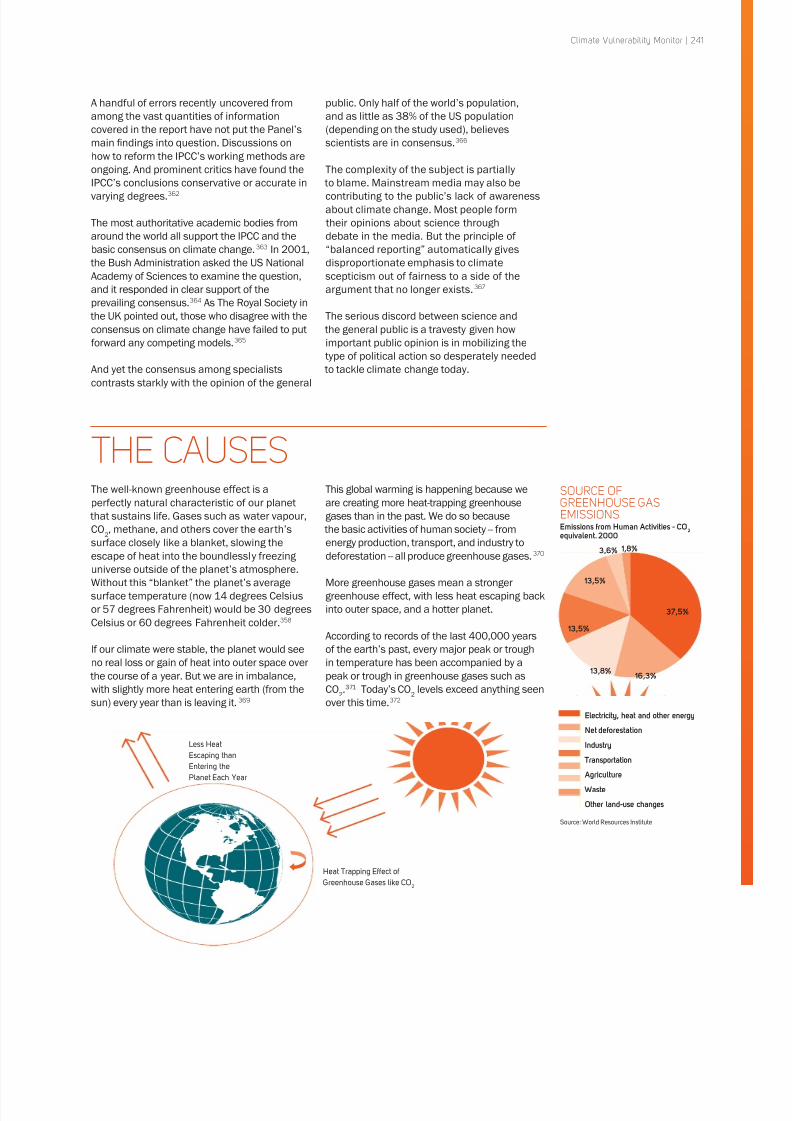
8/8/2019 Climate Vulnerability Monitor 2010: The State of the Climate Crisis
http://slidepdf.com/reader/full/climate-vulnerability-monitor-2010-the-state-of-the-climate-crisis 243/291
Climate Vulnerability Monitor | 241
THE CAUSES
A handful of errors recently uncovered from
among the vast quantities of information
covered in the report have not put the Panel’s
main findings into question. Discussions on
how to reform the IPCC’s working methods are
ongoing. And prominent critics have found the
IPCC’s conclusions conservative or accurate in
varying degrees.362
The most authoritative academic bodies from
around the world all support the IPCC and the
basic consensus on climate change.363 In 2001,
the Bush Administration asked the US National
Academy of Sciences to examine the question,
and it responded in clear support of the
prevailing consensus.364 As The Royal Society in
the UK pointed out, those who disagree with the
consensus on climate change have failed to put
forward any competing models.365
And yet the consensus among specialists
contrasts starkly with the opinion of the general
public. Only half of the world’s population,
and as little as 38% of the US population
(depending on the study used), believes
scientists are in consensus.366
The complexity of the subject is partially
to blame. Mainstream media may also be
contributing to the public’s lack of awareness
about climate change. Most people form
their opinions about science through
debate in the media. But the principle of
“balanced reporting” automatically gives
disproportionate emphasis to climate
scepticism out of fairness to a side of the
argument that no longer exists.367
The serious discord between science and
the general public is a travesty given how
important public opinion is in mobilizing the
type of political action so desperately needed to tackle climate change today.
The well-known greenhouse effect is a
perfectly natural characteristic of our planet
that sustains life. Gases such as water vapour,
CO2, methane, and others cover the earth’ssurface closely like a blanket, slowing the
escape of heat into the boundlessly freezing
universe outside of the planet’s atmosphere.
Without this “blanket” the planet’s average
surface temperature (now 14 degrees Celsius
or 57 degrees Fahrenheit) would be 30 degrees
Celsius or 60 degrees Fahrenheit colder.358
If our climate were stable, the planet would see
no real loss or gain of heat into outer space over
the course of a year. But we are in imbalance,
with slightly more heat entering earth (from the
sun) every year than is leaving it.369
This global warming is happening because we
are creating more heat-trapping greenhouse
gases than in the past. We do so because
the basic activities of human society -- fromenergy production, transport, and industry to
deforestation -- all produce greenhouse gases.370
More greenhouse gases mean a stronger
greenhouse effect, with less heat escaping back
into outer space, and a hotter planet.
According to records of the last 400,000 years
of the earth’s past, every major peak or trough
in temperature has been accompanied by a
peak or trough in greenhouse gases such as
CO2.371 Today’s CO
2levels exceed anything seen
over this time.372
Less Heat
Escaping than
Entering the
Planet Each Year
Heat Trapping Effect of
Greenhouse Gases like CO2
37,5%
16,3% 13,8%
13,5%
13,5%
3,6% 1,8%
Electricity, heat and other energy
Net deforestation
Industry
Transportation
Agriculture
Waste
Other land-use changes
SOURCE OFGREENHOUSE GASEMISSIONSEmissions from Human Activities - CO2
equivalent. 2000
Source: World Resources Institute
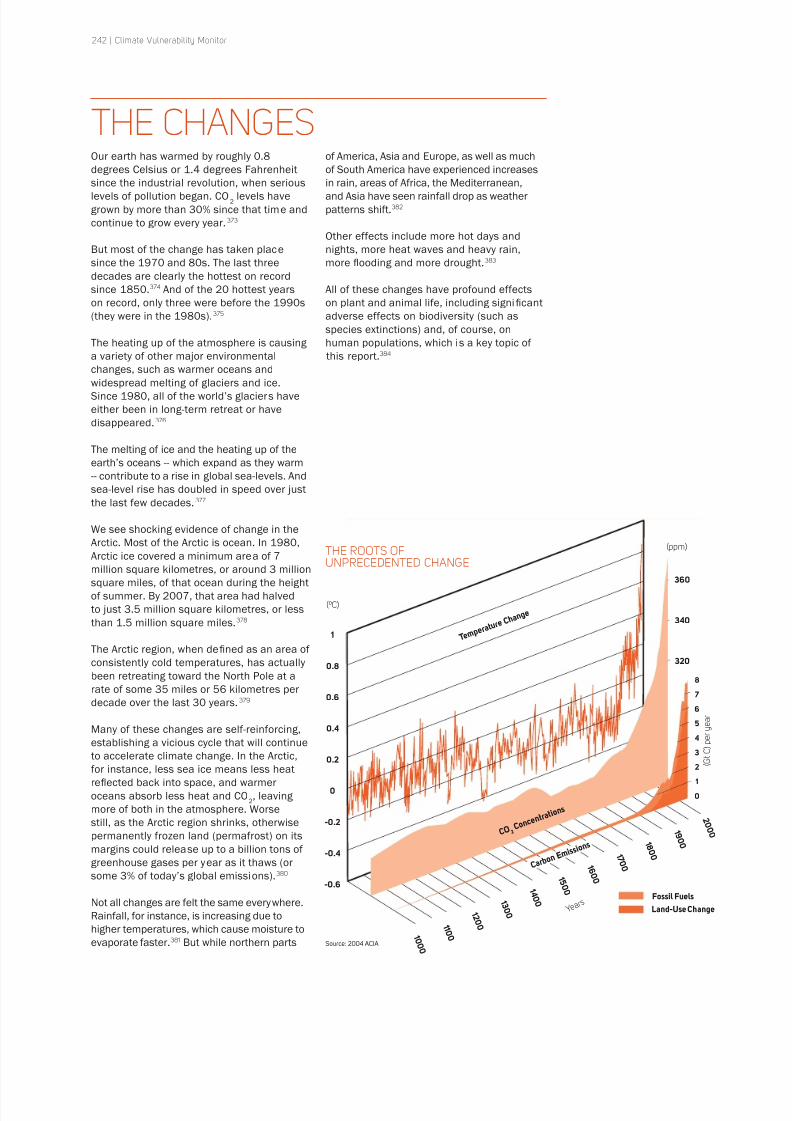
8/8/2019 Climate Vulnerability Monitor 2010: The State of the Climate Crisis
http://slidepdf.com/reader/full/climate-vulnerability-monitor-2010-the-state-of-the-climate-crisis 244/291
THE CHANGES
242 | Climate Vulnerability Monitor
THE ROOTS OFUNPRECEDENTED CHANGE
Source: 2004 ACIA
Our earth has warmed by roughly 0.8
degrees Celsius or 1.4 degrees Fahrenheit
since the industrial revolution, when serious
levels of pollution began. CO2
levels have
grown by more than 30% since that time and
continue to grow every year.373
But most of the change has taken place
since the 1970 and 80s. The last three
decades are clearly the hottest on record
since 1850.374 And of the 20 hottest years
on record, only three were before the 1990s
(they were in the 1980s).375
The heating up of the atmosphere is causing
a variety of other major environmentalchanges, such as warmer oceans and
widespread melting of glaciers and ice.
Since 1980, all of the world’s glaciers have
either been in long-term retreat or have
disappeared.376
The melting of ice and the heating up of the
earth’s oceans -- which expand as they warm
-- contribute to a rise in global sea-levels. And
sea-level rise has doubled in speed over just
the last few decades.377
We see shocking evidence of change in theArctic. Most of the Arctic is ocean. In 1980,
Arctic ice covered a minimum area of 7
million square kilometres, or around 3 million
square miles, of that ocean during the height
of summer. By 2007, that area had halved
to just 3.5 million square kilometres, or less
than 1.5 million square miles.378
The Arctic region, when defined as an area of
consistently cold temperatures, has actually
been retreating toward the North Pole at a
rate of some 35 miles or 56 kilometres per
decade over the last 30 years.379
Many of these changes are self-reinforcing,
establishing a vicious cycle that will continue
to accelerate climate change. In the Arctic,
for instance, less sea ice means less heat
reflected back into space, and warmer
oceans absorb less heat and CO2, leaving
more of both in the atmosphere. Worse
still, as the Arctic region shrinks, otherwise
permanently frozen land (permafrost) on its
margins could release up to a billion tons of
greenhouse gases per year as it thaws (or
some 3% of today’s global emissions).380
Not all changes are felt the same everywhere.
Rainfall, for instance, is increasing due to
higher temperatures, which cause moisture to
evaporate faster.381 But while northern parts
of America, Asia and Europe, as well as much
of South America have experienced increases
in rain, areas of Africa, the Mediterranean,
and Asia have seen rainfall drop as weather
patterns shift.382
Other effects include more hot days and
nights, more heat waves and heavy rain,
more flooding and more drought.383
All of these changes have profound effects
on plant and animal life, including significant
adverse effects on biodiversity (such as
species extinctions) and, of course, on
human populations, which is a key topic of
this report.384
1
0.8
0.6
0.4
0.2
0
-0.2
-0.4
-0.6
(ºC)
(ppm)
T e m p e r a
t u r e C h a
n g e
360
340
320
2 0 0 0 1 9
0 0 1 8
0 0 1 7
0 0 1 6
0 0 1 5
0 0 1 4
0 0 1 3
0 0 1 2
0 0 1 1 0
0 1 0 0 0
Fossil Fuels
Land-Use Change
( G t C ) p e r y e a r
Y e a r s
8
7
65
4
3
2
1
0
C O 2 C o n
c e n t r a t i o
n s
C a r b o n E
m i s s i o n s
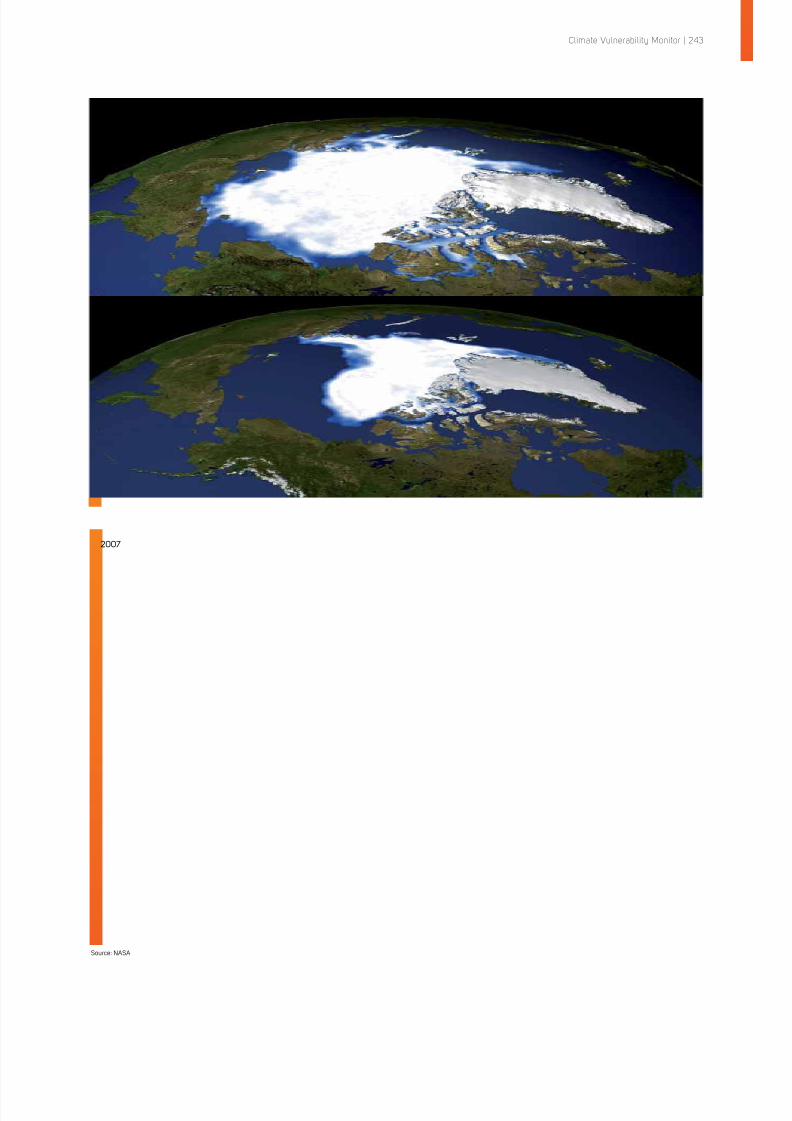
8/8/2019 Climate Vulnerability Monitor 2010: The State of the Climate Crisis
http://slidepdf.com/reader/full/climate-vulnerability-monitor-2010-the-state-of-the-climate-crisis 245/291
Climate Vulnerability Monitor | 243
Source: NASA
2007
1980
8/8/2019 Climate Vulnerability Monitor 2010: The State of the Climate Crisis
http://slidepdf.com/reader/full/climate-vulnerability-monitor-2010-the-state-of-the-climate-crisis 246/291
244 | Climate Vulnerability Monitor
THE MOMENTUM
THE WINDOW OF OPPORTUNITY
None of these changes shows any sign of
slowing. Quite the opposite: One of the largest
ever symposiums on climate science, held in
Copenhagen in March 2009, concluded that,
in most areas, change was happening at the
upper estimates or faster than foreseen by
scientists only two years earlier.385
Greenhouse gases, rises in average
temperatures and sea-levels, disappearing ice
and glaciers, and other indicators of change
far exceed anything seen over much of the last
million years of life on earth.386 And much of that
change has occurred over the last 30 years.387
Temperature fluctuations have occurred over the past millennia, but civilization emerged
during a period of relative stability in climate.388
While a stable climate has allowed life on earth
to flourish, an unstable climate can have the
opposite effect. Increasingly, rapid change is
outstripping the ability of the environment,
animal life, and human society to naturally
adapt. Plant and animal species rendered
extinct will not return. And many of the effects
of an unstable climate are compounded
by factors such as population growth and
increasing consumer consumption, whichalready strain the planet’s ability to support
some 7 billion people and counting.
It’s important to note that there is a long
delay between any increase or decrease
in greenhouse gases and a corresponding
warming or cooling effect on the planet. This is
mainly because the earth’s oceans absorb heat
but only release it back into the atmosphere
over a series of decades. So continued
production of greenhouse gases doesn’t just
mean a warmer planet today, but a continuous
heating up of our planet for years to come.
There is currently enough heat in the oceans
to cause an additional 0.6 degrees Celsius or
one degree Fahrenheit of warming over the
next decades even if we were to stop emitting
greenhouse gases today.389 That means 1.4degrees Celsius or 2.5 degrees Fahrenheit of
warming is already unavoidable and something
we must accept.390 Depending on the amount
of pollution we continue to release, we could
well reach that temperature by 2030.391 This
fact not only underscores the necessity of
acting well in advance to reduce emissions but
also compels us to prepare for the far greater
impacts of climate change that will hit us during
the coming 20 years.
The international community has agreed that
2 degrees Celsius or 3.6 degrees Fahrenheit
of warming above pre-industrial levels is
a threshold we must not exceed.392 Thereare legitimate fears that over-passing that
level could cause irreversible changes to the
earth’s climate -- termed “runaway climate
change” -- that feed back into themselves
in a self-perpetuating cycle of warming no
longer stoppable by emission reductions.393
Even at that level however, we could see the
extinction of 30% of the planet’s species,
the disappearance of the world’s coral reefs,
and severe water shortages and hunger for
hundreds of millions of people.394
Greenhouse gases are measured in partsper million (ppm). They amount to about 390
ppm today and are growing at roughly 2 ppm
per year.395 The IPCC recommends limiting
greenhouse gas concentrations to 400 ppm in
order to avoid 2-2.4 degrees Celsius or 3.6-4.3
degrees Fahrenheit of warming. That would
mean halting all emissions in a matter of just
a few years, which is unrealistic given thatemissions currently grow at a rate of around
3% per year.396
But if we delay action until after 2020, we
will be faced with having to make enormous
emission reductions of 5% per year just to
have a chance at keeping to the internationally
recognized safety threshold.397
Decisive and comprehensive action must
begin now. If not, massive costs linked both
to hasty emission reductions and/or colossal
and irreversible impacts of climate change willbe inevitable. The costs of climate change in
human, economic, and environmental terms
as outlined in this report are only a shadow of
what humanity will face in the years to come.
1.4 DEGREES
CELSIUS OR2.5 DEGREESFAHRENHEITOF WARMINGIS ALREADYUNAVOIDABLEAND SOMETHINGWE MUST ACCEPT
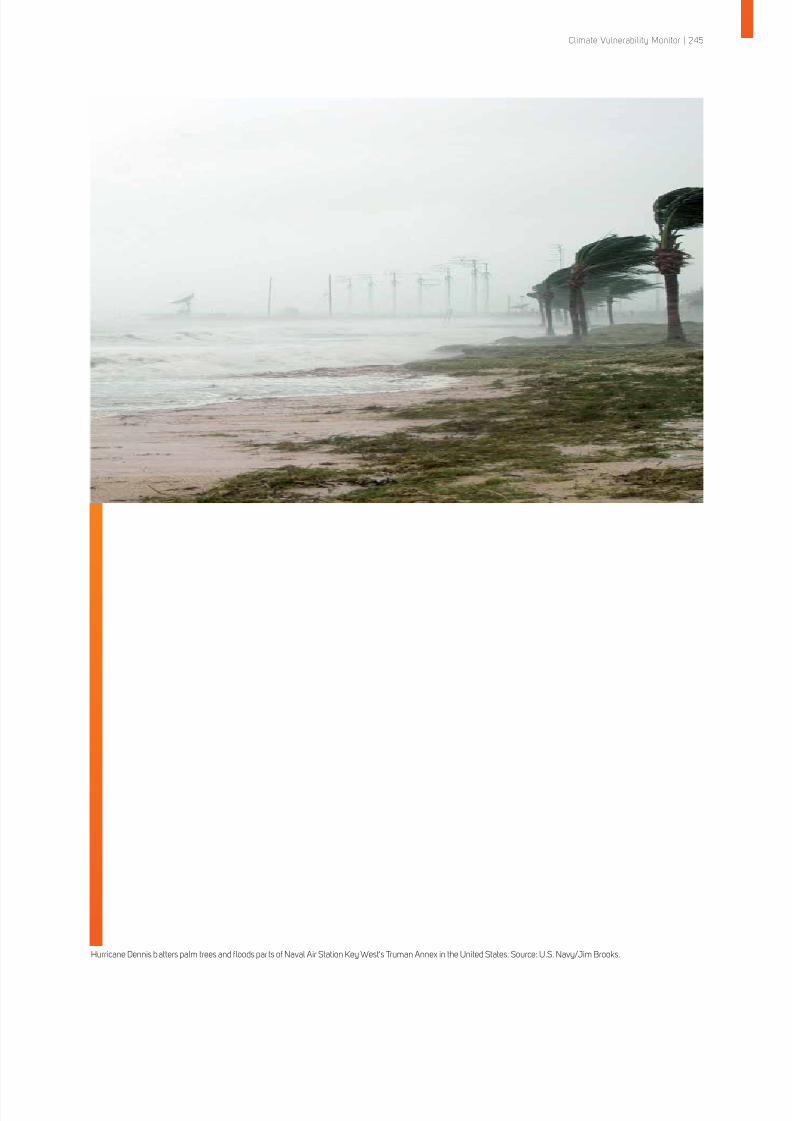
8/8/2019 Climate Vulnerability Monitor 2010: The State of the Climate Crisis
http://slidepdf.com/reader/full/climate-vulnerability-monitor-2010-the-state-of-the-climate-crisis 247/291
Climate Vulnerability Monitor | 245
Hurricane Dennis batters palm trees and floods parts of Naval Air Station Key West's Truman Annex in the United States. Source: U.S. Navy/Jim Brooks.
8/8/2019 Climate Vulnerability Monitor 2010: The State of the Climate Crisis
http://slidepdf.com/reader/full/climate-vulnerability-monitor-2010-the-state-of-the-climate-crisis 248/291
246 | Climate Vulnerability Monitor
Important research gaps limit our understanding of the impact of climate change on
human society. That equally limits the effectiveness of our response to counteractingits negative effects, as well as our understanding of the true extent of the climate crisis.Significant resources should be channelled urgently into addressing these and otherkey shortcomings in our understanding of climate vulnerability
RESEARCH GAPS
THE MONITORQUANTIFICATION/ATTRIBUTION ISSUESQuantitatively attributing impacts to climate
change will be of vital importance to preparing
any response that seeks to address the added
stresses triggered by global warming. Such
quantifications are particularly weak in the areaof extreme weather, especially tropical cyclones,
where scientists still disagree on the extent of the
observed intensification effect on major storms,
especially in the North Atlantic. Quantification
must go far beyond measures of changes in the
actual physical effects -- such as storm intensity,
frequency, or spatial occurrence variations -- to
a more comprehensive understanding of the
socio-economic and human effects that result
from such changes, in particular as relates to
possible threshold breaching or tipping-points
when communities become overwhelmed as a
result of just small excess pressures. The impactof climate change on marine fisheries is another
major area of concern lacking any clear scientific
quantification scenarios. Several other such areas
are mentioned below under “Information Gaps”.
INFORMATION GAPSInadequate understanding of the impact
dynamics of climate change on a number
of key phenomenon with known climate
sensitivities (negative and positive) require
more thorough enquiry, including:
• Freshwater fisheries
• Habitat degradation to Arctic, alpine and
high-latitude communities• The full spectrum of climate-sensitive
diseases, including in particular infection
rates/morbidity and other infection dynamics
• Hail
• Mudslides (mass movement - wet)
• In the field of development: access to
education, sanitation, and energy or school
participation rates
• International trade
• Political stability
• Conflict
• Migration and displacement
• Service or industry sectors of the economy,such as transport, tourism, textiles, energy,
brewing, plastics, and many other business
fields potentially affected especially by
pass-on effects of climate change
DATAThe Monitor relies on internationally standardized
data sets. The lack of standardized disaster and
impact accounting -- in particular, inconsistencies,
socio-economic or cultural differences in
reporting of disaster events, the number of
affected people/people in need of emergency
assistance, injuries, damage costs, and losses-- greatly limit comparability across the board.
There is an urgent need to harmonize reporting
and maintain stringent gathering and coverage
of such information according to international
standards. In other cases, data is reasonably
reliable but irregularly updated, such as the
comprehensive World Health Organization’s
Global Burden of Disease Database (WHO).
Some data in authoritative databases, such as
CRED EM-DAT have likely inaccuracies. Several
countries have been entirely excluded from the
Climate Vulnerability Monitor because of gaps
across almost every impact area, something thatparticularly affects very small countries and small
island developing states.
SPATIAL SCALEInformation on sub-national scales varies
hugely from country to country. Governments
should prioritize national assessments of
vulnerability down to the community scale,
where impacts actually play out on society.
CLIMATE INFORMATIONClimate models vary enormously in their
prediction of different mainstay climate effects,
such as changes in rainfall or temperature overall time horizons, short, medium and longer
term. More detailed information is needed
about the way in which water vapour -- the main
greenhouse gas -- behaves in the atmosphere
under external climate forcing from non-natural
sources. Further research should be devoted to
improving understanding of the behaviour of water
vapour and other key climate parameters in order
to reduce uncertainty in models and improve
advance planning. Another limitation is a major
gap in ground-level climate information in low-
income countries around the world, in particular in
Africa. Filling the persisting ground-level data gapsvia the widespread installation of meteorological/
hydrological monitoring equipment, in particular
in Africa, would be a crucial contribution to
enhancing the bases of climate information.
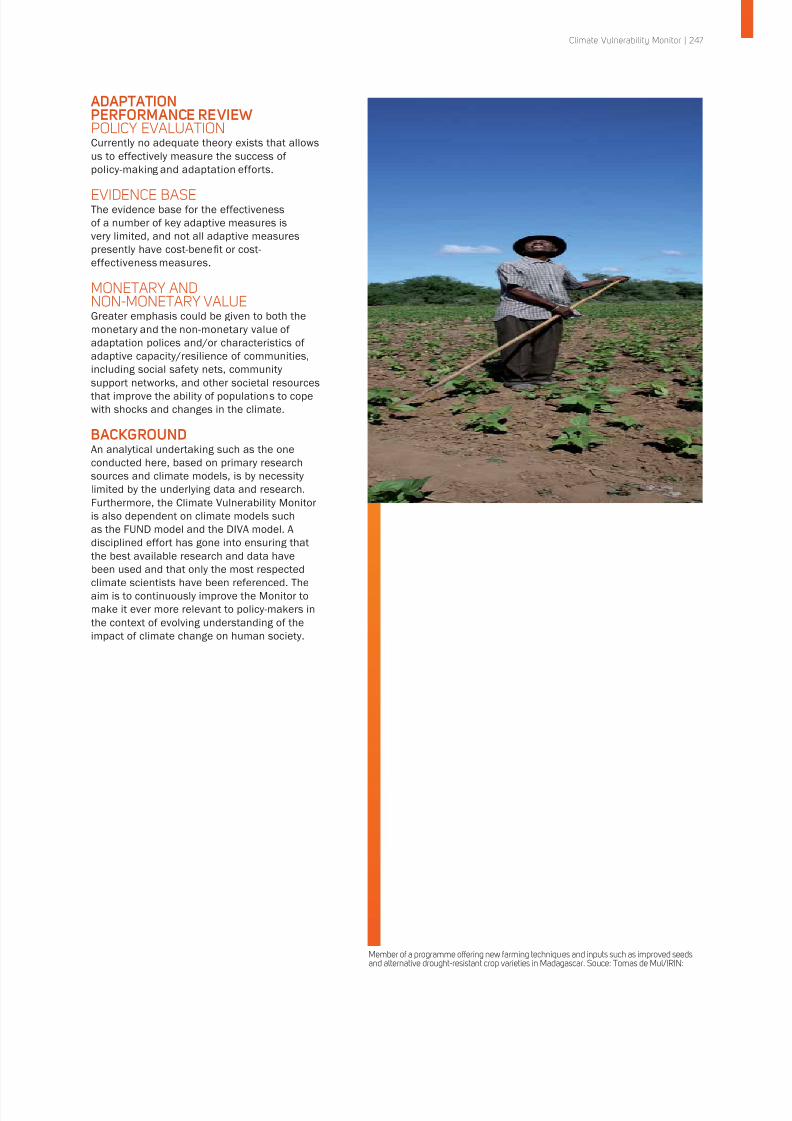
8/8/2019 Climate Vulnerability Monitor 2010: The State of the Climate Crisis
http://slidepdf.com/reader/full/climate-vulnerability-monitor-2010-the-state-of-the-climate-crisis 249/291
Climate Vulnerability Monitor | 247
ADAPTATIONPERFORMANCE REVIEWPOLICY EVALUATIONCurrently no adequate theory exists that allows
us to effectively measure the success of
policy-making and adaptation efforts.
EVIDENCE BASEThe evidence base for the effectiveness
of a number of key adaptive measures is
very limited, and not all adaptive measures
presently have cost-benefi t or cost-
effectiveness measures.
MONETARY ANDNON-MONETARY VALUEGreater emphasis could be given to both the
monetary and the non-monetary value of
adaptation polices and/or characteristics of
adaptive capacity/resilience of communities,including social safety nets, community
support networks, and other societal resources
that improve the ability of populations to cope
with shocks and changes in the climate.
BACKGROUNDAn analytical undertaking such as the one
conducted here, based on primary research
sources and climate models, is by necessity
limited by the underlying data and research.
Furthermore, the Climate Vulnerability Monitor
is also dependent on climate models such
as the FUND model and the DIVA model. Adisciplined effort has gone into ensuring that
the best available research and data have
been used and that only the most respected
climate scientists have been referenced. The
aim is to continuously improve the Monitor to
make it ever more relevant to policy-makers in
the context of evolving understanding of the
impact of climate change on human society.
Member of a programme offering new farming techniques and inputs such as improved seedsand alternative drought-resistant crop varieties in Madagascar. Souce: Tomas de Mul/IRIN:
8/8/2019 Climate Vulnerability Monitor 2010: The State of the Climate Crisis
http://slidepdf.com/reader/full/climate-vulnerability-monitor-2010-the-state-of-the-climate-crisis 250/291
248 | Climate Vulnerability Monitor
ACKNOWLEDGMENTSROSS MOUNTAIN,DIRECTOR GENERAL OF DARAI would like to express my sincere thanks on
behalf of DARA and its Board of Trustees,
in particular to the many experts and
concerned individuals without whose personal
engagement amid extremely busy schedules
this important project would not have been
brought to fruition in 2010.
The Climate Vulnerability Monitor has been
developed as a core part of the Climate
Vulnerability Initiative partnership between
DARA and the Climate Vulnerable Forum
through its founder, the Republic of theMaldives. President Mohamed Nasheed
founded the Climate Vulnerable Forum in 2009
to highlight the urgent concerns and hopes of
the most vulnerable communities around the
world. The support provided by the Maldives
has been key in providing focus guidance and
in engaging many important stakeholders in the
development of the Monitor. Our warm thanks
go to the Maldives Ministries of Foreign Affairs
and of the Environment and to the Of fice of the
President. Special thanks go to Minister Ahmed
Shaheed, Minister of State Ahmed Naseem,
Aminath Shauna, Paul Roberts, Deputy MinisterHawla Didi, Iruthisham Adam, Abdul Ghafoor
Mohamed, Thilmeeza Hussain, Ahmed Shiaan,
Amin Javed Faizal, Rose Richter, Fathimath
Inaya, and Mariyam Midhfa Naeem. We are also
most grateful to President Anote Tong of Kiribati
and Foreign Secretary Tessie Lambourne, as
well as to Foreign Secretary Mohamed Quayes,
Mohammad Khastagir, Tareq Ahmed, and Faiyaz
Murshid Kazi of Bangladesh.
Other members of the Climate Vulnerable
Forum endorsed and encouraged this effort
at their high-level meeting in New York on
19 September 2010, where it was decided the report should serve as a reference for
advocacy and promoting policy development
in the area of climate vulnerability. Attendees
to the September meeting included senior
representatives of Antigua and Barbuda,
Bangladesh, Costa Rica, Kiribati, Grenada,
Maldives, Marshall Islands, Nepal, Philippines,
St. Lucia, Solomon Islands, Timor-Leste, and
Samoa, who joined earlier signatories to the
2009 Climate Vulnerable Forum Declaration
-- Barbados, Bhutan, Ghana, Kenya, Maldives,
Rwanda, Tanzania, and Vietnam.
The guidance and insight provided by the
Advisory Panel was invaluable. Its members, Mary
Chinery-Hesse, Helen Clark, Jan Eliasson, José
María Figueres Olsen, Saleemul Huq, Yolanda
Kakabadse, Ashok Khosla, Ricardo Lagos, Loren
Legarda, Ahmed Naseem, Rajendra Pachauri,
Teresa Ribera, Johan Rockström, Hans Joachim
Schellnhuber, Klaus Töpfer, Margareta Wahlström,
and Michael Zammit Cutajar, generously contributed
ideas and insights to the report.
In a field of expertise with still many
uncertainties, the Peer Review Committee
worked to ensure that the data presented in
this document is based on a solid methodology.
The detailed and prompt feedback received
was indispensible for the robustness of the
analysis achieved, and we are indebted to its
members: Yasemin Aysan, Suruchi Bhadwal,Manuel Carballo, Diarmid Campbell-Lendrum,
Ian Christoplos, Pierre Encontre, Anne
Hammill, Juergen Kropp, Marc Levy, Bo Lim,
Urs Luterbacher, Pascal Peduzzi, Hansjoerg
Strohmeyer, and Farhana Yamin.
I would like to also thank Former UN Secretary-
General Kofi Annan whose visionary leadership,
as always, paved the way for this report by firmly
establishing the fundamental importance of
the human dimensions of climate change. We
also acknowledge the inspiration provided by
the work of Walter Fust and the teams at theGlobal Humanitarian Forum and Dalberg, which
produced The Anatomy of A Silent Crisis (Global
Humanitarian Forum, 2009).
My warm thanks also go to Mary Robinson, David
Bassiouni, Magda Ninaber, Otto Baumrucker,
Alain Dick, Robin Gwynn, Ben Llewellyn-Jones,
Adam Sambrook, Nicola Righini, Kelly Rigg,
María Elena Agüero, Matthew Hodes, Luciana
Silvestri, Emina Skroeder, Pierre Conille, Andrew
Cox, Mohamed Inaz, Robin Shelley, Mark
Lynas, Veerle Vanderweed, Jennifer Baumwoll,
Tim Scott, David Del Conte, Christina Alfirev,
Olivia Serdeczny, John Matthews, A.J. Wickel,Randolph Kent, Emma Visman, Youssef Nassef,
Annett Moehner, and IJ Partners, all of whom
gave generous assistance to the team in pulling
together this endeavour.
Mo Marshall, our copy editor, Mariano
Sarmiento, lead designer, and the team at Apex
Communications, including Pete Bowyer, James
Drewer, and Carlo Gibbs, and our printer APGISA
Aplicaciones Gráficas e Informáticas S.A.,
contributed creatively to bringing the messages
of this report to wider audiences.
Particular thanks is also owed to the
following groups.
8/8/2019 Climate Vulnerability Monitor 2010: The State of the Climate Crisis
http://slidepdf.com/reader/full/climate-vulnerability-monitor-2010-the-state-of-the-climate-crisis 251/291
Climate Vulnerability Monitor | 249
Additional scientists and experts who offered
valuable guidance and caution on the selection
of models and the construction of the Monitor:
Christian Friis Bach,Henrik Hansen, Chris Hope,
Jesper Nielsen, Martin Parry, Niels Stender and
Richard S. Tol.
Data Providers:
· World Health Organization (WHO)
· Centre for Research on the Epidemiology of
Disasters (CRED) Emergency Events Database
(EM-DAT)
· GermanWatch / MunichRe NatCatSERVICE
· Population, Landscape, and Climate Estimates
(PLACE-II) / Center for International EarthScience Information Network (CIESIN) of
Columbia University
· Dynamic and Interactive Vulnerability
Assessment (DIVA) of the Potsdam Institute for
Climate Impact Research (PIK)
· Climate Framework for Uncertainty, Negotiation
and Distribution (FUND) model of Richard S. Tol
and David Anthoff
· World Resources Institute (WRI) Database,
Fisheries Exports
· World Bank 2008 for Gross Domestic Product
(Purchasing Power Parity)
The report would not have been possible without
the analytical expertise and dedicated work
of Commons Consultants, the main research
and production partner of DARA in this effort,
a team led by Søren Peter Andreasen and
including Jakob Mathias Wichmann, Peter Utzon
Berg, Anne-Mette Steinmeier and Andreas
Clemmensen and which was responsible in
particular for developing the quantitative
foundations of the report and contributing to its
research base and substantive content.
DARA’s role as developer of the report whereby
it alone carries the ultimate responsibility for
the content of the document was carried out
together with Steering Group Co-Chair Marc
Limon of the Maldives Mission in Geneva, who
has my many thanks. Responsibility for the
editorial content of the Monitor has been skillfully
exercised by Matthew McKinnon, who is also
Coordinator of the overall Climate Vulnerability
Initiative. Lucía Fernández was also instrumental
in bringing the project to fruition. Other DARA
staff members involved at different stages
were Belén Camacho, Belén Díaz, Fiona Guy,
Daniela Mamone, Rebecca Moy, Amalia Navarro,
Riccardo Polastro, Soledad Posada, DanielaRuegenberg, Nicolai Steen, Philip Tamminga,
Geeta Uhl, Susana Vicario, and Nacho Wilhelmi.
This report could not have been realized without
the generous support of DARA’s President Diego
Hidalgo and the enthusiastic engagement of
DARA Trustee José María Figueres as well as
the wholehearted support of the other members
of DARA’s Board of Trustees, Aldo Ajello, Emma
Bonino, Jan Eliasson, Beatriz Iraburu, Juliet
Pierce, and José Manuel Romero.
8/8/2019 Climate Vulnerability Monitor 2010: The State of the Climate Crisis
http://slidepdf.com/reader/full/climate-vulnerability-monitor-2010-the-state-of-the-climate-crisis 252/291
250 | Climate Vulnerability Monitor
PARTNERS
DARADARA is an independent international
organization committed to improving the
quality and effectiveness of aid for vulnerable
populations suffering from conflict, disasters,and climate change. It carries out this mandate
through research, evaluations, and knowledge
sharing. DARA was founded with the compelling
vision of Silvia Hidalgo to enhance the impact
of international assistance for the benefi t of the
most vulnerable of the world’s groups. DARA
created the Humanitarian Response Index,
which is the premier evaluation tool for donor
effectiveness in humanitarian assistance.
BOARD OF TRUSTEESDiego Hidalgo (Chairman)
Aldo AjelloEmma Bonino
Jan Eliasson
José María Figueres
Beatriz Iraburu
Juliet Pierce
José Manuel Romero
CLIMATE VULNERABLE FORUMThe Climate Vulnerable Forum convenes
governments from Africa, Asia, the Americas, and
the Pacific, representing some of the countries
most vulnerable to the adverse impacts of climate change. The Forum first convened in
the Maldives in November 2009 and adopted a
declaration that expressed alarm at the pace of
change to the Earth caused by climate change
and committed to demonstrating leadership
aimed at tackling what for some nations is
becoming an existential challenge. The Climate
Vulnerable Forum brings to the Monitor its
strategic leadership engagement and facilitates
access to key expertise.
COMMONS CONSULTANTS
Commons Consultants are the principalresearch and production partner of the
Climate Vulnerability Initiative involved in
the development of the Monitor. Commons
Consultants is a management consulting and
research firm with expertise in policy analysis
and strategy development. Its focus industries
are energy and environment, climate change,
health, and responsible financial services.
The Climate Vulnerability Monitor benefits from the collaboration of its two lead
partners, DARA and the Climate Vulnerable Forum at the core of the ClimateVulnerability Initiative. DARA brings specialist expertise and independent objectivityto the endeavour, building on its experience as a critical evaluator of developmentand humanitarian aid effectiveness. The Climate Vulnerable Forum and its members,particularly its initiating chair (the Maldives), have contributed prescient thoughtleadership to the project, as well as expertise from inside the climate frontlines.
8/8/2019 Climate Vulnerability Monitor 2010: The State of the Climate Crisis
http://slidepdf.com/reader/full/climate-vulnerability-monitor-2010-the-state-of-the-climate-crisis 253/291
Climate Vulnerability Monitor | 251
DECLARATION OF THECLIMATE VULNERABLE FORUM
We, Heads of State, Ministers and representatives of Government from Africa, Asia,Caribbean and the Paci fi c, representing some of the countries most vulnerable to the adverse impacts of climate change:
Alarmed at the pace of change to our Earth caused by human-induced climate change,including accelerating melting and loss of ice from Antarctica, Greenland, the Himalayas,Mount Kilimanjaro and Mount Kenya,
acidi fi cation of the world’s oceans due to rising CO
2 concentrations, increasingly intense tropical
cyclones, more damaging and intense drought and fl oods, including Glacial Lakes Outburst Floods, in many regions and higher levels of sea-level rise than estimated just a few years ago, risks changing the face of the planet and threatening coastal cit ies, low lying areas,mountainous regions and vulnerable countries the world over;
Asserting that anthropogenic climate change poses an existential threat to our nations, our
cultures and to our way of life, and thereby undermines the internationally-protected human rights of our people – including the right to sustainable development, right to life, the right to self-determination and the right of a people not to be deprived of i ts own means of subsistence,as well as principles of international law that oblige all states to ensure that activities within their jurisdiction or control do not cause damage to the environment of other States or of areas beyond the limits of national jurisdiction;
Conscious that while our nations lie at the climate front-line and will disproportionately
feel the impacts of global warming, in the end climate change will threaten the sustainable development and, ultimately, the survival of all States and peoples – the fate of the most vulnerable will be the fate of the world; and convinced that our acute vulnerability not only allows us to perceive the threat of climate change more clearly than others, but also provides us with the clarity of vision to understand the steps that must be taken to protect the Earth’s climate system and the determination to see the job done;
Recalling that the UNFCCC is the primary international, intergovernmental forum for negotiating the global response to climate change;
Desirous of building upon the commitment of leaders at the recent United Nations High- Level Summit on Climate Change in New York in addressing the needs of those countries most vulnerable to the impacts of climate change as well as other political commitments,including the AOSIS Declarat ion and the African Common Position;
Underlining the urgency of concluding an ambitious, fair and ef fective global legal
agreement at COP15 in Copenhagen;
Gravely concerned at reports of a downgrading of expectations for COP15 and calling therefore for a redoubling of efforts – including through the attendance in Copenhagen, at Head of State- or Head of Government-level, of all States, and especially of major industrialised nations and all major emerging economies;
Emphasising that developed countries bear the overwhelming historic responsibility for causing anthropogenic climate change and must
therefore take the lead in responding to the challenge across all four building blocks of an enhanced international climate change regime – namely mitigation, adaption, technology and fi nance – that builds-upon the UNFCCC and it s Kyoto Protocol;
Taking account of their historic responsibility as well as the need to secure climate justice for the world’s poorest and most vulnerable communities, developed countries must commit to legally-binding and ambitious emission reduction targets consistent with limiting global average surface warming to
well below 1.5 degrees Celsius above pre- industrial levels and long-term stabilisation of atmospheric greenhouse gas concentrations at well below 350ppm, and that to achieve this the agreement at COP15 UNFCCC should include a goal of peaking global emissions by 2015 with a sharp decline thereafter towards a global reduction of 85% by 2050;
Emphasising that protecting the climate system is the common responsibilit y of all humankind, that the Earth’s climate system has a limited capacity to absorb greenhouse
gas emissions, and that action is required by all countries on the basis of common but differentiated responsibilities, respective capabilities, and the precautionary principle; Underscoring that maintaining carbon-intensive
8/8/2019 Climate Vulnerability Monitor 2010: The State of the Climate Crisis
http://slidepdf.com/reader/full/climate-vulnerability-monitor-2010-the-state-of-the-climate-crisis 254/291
252 | Climate Vulnerability Monitor
modes of production established in 19th Century Europe will incur enormous social and economic cost in the medium- and long-term,whereas shift ing to a carbon-neutral future based on green technology and low-carbon energy creates wealth, jobs, new economic opportunit ies, and local co-bene fi ts in terms of health and reduced pollution;
Convinced that those countries which take the lead in embracing this future will be the winners of the 21st Century;
Expressing our determination, as vulnerable States, to demonstrate leadership on climate change by leading the world into the low-carbon and ultimately carbon-neutral economy, but recognising that we cannot achieve this goal on our own;
Now therefore,
Declare our determination, as low-emitt ing countries that are acutely vulnerable to climate change, to show moral leadership on climate change through actions as well as words, by acting now to commence greening our economies as our contribution towards achieving carbon neutrality,
Af fi rm that this will enhance the objectives of achieving sustainable development, reducing
poverty and attaining the internationally agreed development goals including the Millennium Development Goals,
Call upon all other countries to follow the moral leadership shown by the Republic of Maldives by voluntarily committing to achieving carbon- neutrality,
Assert that the achievement of carbon neutralit y by developing countries will be extremely dif fi cult given their lack of resources and capacity and pressing adaptation challenges, without external fi nancial, technological and capability-building
support from developed countries,
Declare that, irrespective of the effectiveness of mitigation actions, signi fi cant adverse changes in the global climate are now inevitable and are already taking place, and thus Parties to the UNFCCC must also include, in the COP15 outcome document, an ambit ious agreement on adaptation fi nance which should priorit ise the needs of the most vulnerable countries,especially in the near-term,
Call upon developed countries to provide public money amounting to at least 1.5% of their gross domestic product, in addition to innovative sources of fi nance, annually by 2015 to assist developing countries make their transit ion to a climate resilient low-carbon economy. This grant- based fi nance must be predictable, sustainable,transparent, new and additional – on top of developed country commitments to deliver 0.7% of their Gross National Income as Overseas Development Assistance,
Underline that fi nancing for mitigation and adaptation, under the authority of the Conference of Parties to the UNFCCC, should be on the basis of direct access to implement country-led national Low-Carbon Development Plans and Climate Resilient Development
Strategies, and the process to allocate and deliver the fi nance must be accessible,transparent, consensual, accountable, results- orientated and should prioritise the needs of the most vulnerable countries,
Further underline that fundamental principles and issues relating to the survival of peoples and preservation of sovereign rights are non- negotiable, and should be embedded in the Copenhagen legal agreement,
Call on Parties to the UNFCCC to also consider
and address the health, human rights and security implications of climate change,including the need to prepare communities for relocation, to protect persons displaced across borders due to climate change-related impacts,and the need to create a legal framework to protect the human rights of those left stateless as a result of climate change,
Invite other vulnerable countries to endorse this Declaration,
Decide to hold a second meeting of the Climate Vulnerable Forum in Kiribati in 2010 to take
forward this initiative, to further raise awareness of the vulnerabilities and actions of vulnerable countries to combat climate change, and to amplify their voice in international negotiations.In this context, request support from the UN system to assist the most vulnerable developing countries take action in pursuit of this Declaration.
Adopted in Male', Maldives,10th November 2009
Bangladesh, Barbados, Bhutan, Ghana,Kenya, Kiribati, Maldives, Nepal, Rwanda,Tanzania, Vietnam
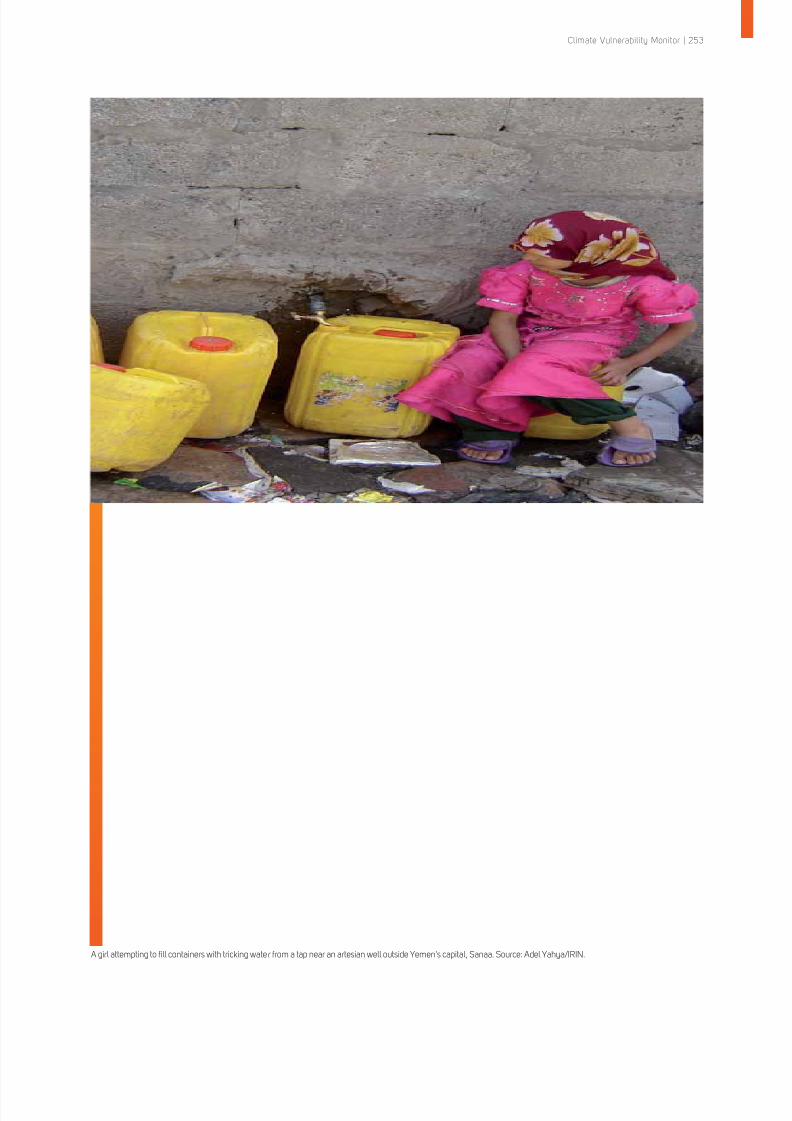
8/8/2019 Climate Vulnerability Monitor 2010: The State of the Climate Crisis
http://slidepdf.com/reader/full/climate-vulnerability-monitor-2010-the-state-of-the-climate-crisis 255/291
Climate Vulnerability Monitor | 253
A girl attempting to fill containers with tricking water from a tap near an artesian well outside Yemen's capital, Sanaa. Source: Adel Yahya/IRIN.
8/8/2019 Climate Vulnerability Monitor 2010: The State of the Climate Crisis
http://slidepdf.com/reader/full/climate-vulnerability-monitor-2010-the-state-of-the-climate-crisis 256/291
254 | Climate Vulnerability Monitor
GLOSSARY
ADAPTATIONIn this report, adaptation refers to individual or
governmental actions to reduce adverse effects
or future risks associated with climate change.The IPCC/UNFCCC defines adaptation as the
“adjustment in natural or human systems in
response to actual or expected climatic stimuli or
their effects, which moderates harm or exploits
beneficial opportunities.”
ADAPTATIONPERFORMANCE REVIEWRating system of adaptive effectiveness that
assesses measures known to be effective
to a specific degree in limiting the impact on
vulnerable populations as identified in the Climate
Vulnerability Monitor/Index section of the report.
ADAPTIVE CAPACITY The ability of a system to adjust to climate
change, variability and extremes to moderate
potential damages, to take advantage of
opportunities, or to cope with the consequences.
AFFECTED COMMUNITIES Communities that have seen their livelihoods
compromised temporarily or permanently by
climate change.
CLIMATE DISPLACED PEOPLE Persons displaced temporarily or permanentlydue to climate change and its impacts or shocks,
notably land desertification, sea-level rise and
weather-related disasters. It is almost never
possible to identify an individual as exclusively
a climate displaced person due to the range
of factors that are likely involved in forced or
voluntary movement of people. Climate change,
however, is still likely to generate additional
numbers of migrants and displaced people.
CLIMATE EFFECT Indicates the relative effects of climate change
on social and economic variables at the countrylevel. Climate effect (CE) is calculated based
on observed values of social and economic
variables and the effects of climate change.
CLIMATE IMPACT FACTOR The relative contribution of climate change to the
development of a given variable.
CLIMATE VULNERABILITY FACTORThe aggregate vulnerability factor is determined
as an evenly weighted sum of the independent
vulnerability factors across the various impact
areas. It indicates the extent to which countries
are affected by multiple stresses.
CLIMATE VULNERABILITY MONITOR The Climate Vulnerability Monitor provides
a global overview of vulnerability to climate
change. It provides fair estimates of the types
of impacts we are already facing. It also shows
where the impacts are taking place and capturesour evolving global vulnerability to climate
change.
COST-EFFECTIVENESS Refers to the relationship between the economic
input/cost of a given adaptation measure and
the degree of beneficial output.
DEVELOPMENT AID Aid to support the economic, social, and political
development of developing countries. The aim is
to alleviate poverty in the long run.
DISABILITY-ADJUSTED LIFE YEARThis time-based measure combines years of life
lost due to premature death and years of life
lost due to time lived in states of less than full
health. The DALY metric was developed in the
original Global Burden of Disease 1990 study
to assess the burden of disease consistently
across diseases, risk factors, and regions.
DISASTER RISK REDUCTION A framework for assessing various measures
for minimizing vulnerabilities and disaster risks
throughout a society, to avert (prevention) or
limit (mitigation and preparedness) the adverseimpacts of hazards within the broad context of
sustainable development.398
8/8/2019 Climate Vulnerability Monitor 2010: The State of the Climate Crisis
http://slidepdf.com/reader/full/climate-vulnerability-monitor-2010-the-state-of-the-climate-crisis 257/291
Climate Vulnerability Monitor | 255
ECONOMIC STRESS The economic stress due to climate change
captured in this report is based on fisheries,
forestry, and other agricultural losses or gains.It is, to a great extent, driven by water resource
impacts and climate effects on biodiversity.
EXPOSURE TO CLIMATE CHANGE Exposure to physical manifestations of
alterations in weather conditions and the
environment as a result of climate change. See
also “Vulnerability - Physical vulnerability to
climate change”.
FOOD SECURITYRefers to the availability of food and people’s
access to it. A household is food secure whenits occupants do not live in hunger or fear of
starvation.
HABITAT LOSS
Refers to the loss of human habitats due to
climate change impacts.
HEALTH IMPACTThe impacts of climate change that have an
effect (positive or negative) on human health.
HUMANITARIAN ASSISTANCE
Material or logistical assistance provided for
humanitarian purposes, typically in response to a humanitarian crisis. The aim is to alleviate
suffering in the short term.
MITIGATION Actions taken to lower greenhouse gas
emissions targeted at reducing the extent of
global warming. This is distinct from adaptation,
which involves taking action to minimize the
effects of global warming.
RESILIENCE The ability of a community or ecosystem to
recover from, return to equilibrium, or bounceback following a shock.
SOCIO-ECONOMIC IMPACTRefers to climate change impacts of both social
and economic character.
VULNERABILITYThe degree to which a community experiences
danger and harm from the negative effects
of climate change. Or: The degree to which
a system (community, ecosystem, economy)
is susceptible to, or unable to cope with,
adverse effects of climate change, including
climate variability and extremes. Vulnerability
is a function of the character, magnitude, and
rate of climate variation to which a system
is exposed, its sensitivity, and its adaptive
capacity (IPCC definition).
VULNERABILITY -PHYSICAL VULNERABILITYTO CLIMATE CHANGE Refers to people who live in regions that
are prone to more than one type of physical
manifestation of climate change: floods,
storms, droughts, sea-level rise, etc. (similar to
“exposure”).
VULNERABILITY -SOCIO-ECONOMIC VULNERABILITYTO CLIMATE CHANGE
Refers to the capacity of individuals,
communities, ecosystems, economies, andsocieties to adapt to climate change impacts
and avoid suffering from long-term, potentially
irreversible, losses in well-being and stability.
Also referred to as “underlying vulnerabilities”.
WEATHER-RELATED DISASTERSNatural disasters that are related to weather
patterns, such as floods, droughts, and
heat waves. Geophysical disasters such as
earthquakes are not included in this category.
8/8/2019 Climate Vulnerability Monitor 2010: The State of the Climate Crisis
http://slidepdf.com/reader/full/climate-vulnerability-monitor-2010-the-state-of-the-climate-crisis 258/291
256 | Climate Vulnerability Monitor
ABBREVIATIONSCE: Climate effect
CIF: Climate impact factor
CO 2
: Carbon dioxide
DALY: Disability-adjusted life year
DCPP:Disease Control Priorities Project
DIVA: Dynamic Interactive Vulnerability Assessment
ECA: [Working Group] Economics of Climate Adaptation Working Group
FAO: Food and Agriculture Organization
GDP: Gross domestic product
GEF: Global Environment Facility
GNP: Gross national product
GTZ: Deutsche Gesellschaft für Technische Zusammenarbeit
IFRC: The International Federation of Red Cross and Red Crescent Societies
IPCC: Intergovernmental Panel on Climate Change
MAD: Mean absolute deviation
MDGs:Millennium Development Goals
NAPA:National Adaptation Programme for Action
ORT: Oral rehydration therapy
PPP: Purchasing power parity
UNCCD: United Nations Convention to Combat Desertification
UNDP: United Nations Development Programme
UNEP: United Nations Environment Programme
UNESCO: United Nations Educational, Scientific and Cultural Organization
UNFCCC: United Nations Framework Convention on Climate Change
UNICEF: United Nations Children’s Fund
UNISDR: United Nations International Strategy for Disaster Reduction
WHO: World Health Organization
8/8/2019 Climate Vulnerability Monitor 2010: The State of the Climate Crisis
http://slidepdf.com/reader/full/climate-vulnerability-monitor-2010-the-state-of-the-climate-crisis 259/291
Climate Vulnerability Monitor | 257
REFERENCES 1. Indoor smoke from solid fuels, urban air pollution and airborne
particulates as risk factors for mortality accounted forapproximately 2.7 million deaths worldwide in 2000. Source:
WHO (2002)
2. IPCC (2007); Richardson et al (2009)
3. Infection estimated in relation to original WHO estimates of
morbidity to mortality. Source: WHO (2002)
4. Lucien Manga et al (2010)
5. Richardson et al (2009)
6. Ibid.
7. The prevailing scientific definition of vulnerability to climate
change is summarized in the text. The full meaning is as
follows: “The degree to which a system is susceptible to,
or unable to cope with, adverse effects of climate change,
including climate variability and extremes. Vulnerability isa function of the character, magnitude, and rate of climate
variation to which a system is exposed, its sensitivity, and its
adaptive capacity” IPCC (2001)
8. The UNFCCC definition of adaptation is as follows: “Adjustment
in natural or human systems in response to actual or expected
climatic stimuli or their effects, which moderates harm or
exploits beneficial opportunities.” UNFCCC (2010)
9. See a review of literature in Füssel (2009); Moss et al (2001);
Brooks et al (2005)
10. IPCC (2007)
11. Ibid.
12. The Monitor uses mean absolute standard deviations as its
distribution convention.
13. Global Humanitarian Forum (2009)
14. International Alert (2007)
15. UNDP (2007)
16. UNDP (2010)
17. WHO (2009)
18. UNDP (2008)
19. WHO (2003)
20. Ibid
21. IPCC (2007)
22. McMichael et al. (2006); Reacher et al. (2004)
23. Woodward et al. (2000); McMichael et al. (2006); Goklany
(2009); Costello et al. (2009)
24. DCPP (2006)
25. McMichael et al. (2006)
26. Robine et al (2008)
27. WHO (2010)
28. Ibid.
29. Ibid.
30. Reuters (2007)
31. CDC (2010)
32. IFRC (2004) and Robine et al. (2008)
33. IPCC (2007)
34. Jetten et al. (1997) 35. Jetten et al. (1997)
36. Rogers et al. (2000); World Bank (2010)
37. McMicheal et al. (2006)
38. WHO (2009)
39. Tanser et al. (2003)
40. WHO (2003)
41. WHO (2009)
42. Lipp et al. (2002)
43. WHO (2009); Woodward et al. (2000); IPCC (2007)
44. de Onis et al. (2004)
45. IPCC (2007); IFPRI (2009a); USDA (2008); Garnaut (2008)
46. LDCF/NAPA (2007-2009)
47. Cheung et al. (2010); McMichael et al. (2006)
48. IFPRI (2009a)
49. McMichael et al (2006); WHO (2009)
50. DCPP (2006)51. UNDP (2009)
52. McMichael et al. (2006); WHO (2004)
53. DCPP (2006)
54. Ibid.
55. UNEP (2002)
56. WHO (2002)
57. WHO (2004)
58. Waithaka et al. (2010)
59. WHO Burden of Diseases Database (2010)
60. Ibid.
61. British Medical Journal (2002)
62. Ibid.
63. IPCC (2007)
64. CRED (2010)
65. Cheung et al. (2010)
66. Emanuel (2005)
67. WHO (2010)
68. Ibid
69. Ibid.
70. Ibid.
71. Ibid.
72. Ibid.
73. Ibid.
74. Ibid.
75. Ibid.
76. Washington Post (2010)
77. IPCC (2007)
78. Ibid.
79. Cheung et al. (2010)
80. IFRC (2004)
81. Knutson et al. (2010)
82. IPCC (2007)
83. Global Humanitarian Forum (2009); Kron (2009)
84. NASA (2002)
85. Oxfam/Tearfund (2004)
86. ECA Working Group (2009)
87. IRIN (2010)
8/8/2019 Climate Vulnerability Monitor 2010: The State of the Climate Crisis
http://slidepdf.com/reader/full/climate-vulnerability-monitor-2010-the-state-of-the-climate-crisis 260/291
258 | Climate Vulnerability Monitor
88. ECA Working Group (2009)
89. UNEP (2002)
90. CRED (2010)
91. World Bank (2008)
92. UN (2009b)
93. UNISDR (2004)94. Ibid.
95. CRED (2010)
96. Ibid.
97. Mirza (2003)
98. Ibid.
99. IFRC (2008)
100. IMF (2009); CRED (2010)
101. CRED (2010); IFRC (2008)
102. IFRC (2009)
103. World Bank Development Research Group (2010)
104. IPCC (2007)
105. CRED (2010); IMF (2010)
106. Ibid.
107. Ibid.
108. Altez (2007). See also case section in the UNISDR Global
Assessment Report 2009, p. 25 (UN 2009b)
109. Earth Trends WRI (2010); World Resources Institute (2005)
110. McGranahan et al. (2007)
111. Cazaneve & Lovel (2010)
112. Millennium Ecosystem Assessment (2005)
113. World Resources Institute (2005)
114. IPCC (2007)
115. Millennium Ecosystem Assessment (2005), chap. 22
116. EPI (2003)
117. Scienceray.
118. The Guardian (2002)
119. ENN (1999)
120. Disaster News Network (2008)
121. OCHA (2008)
122. BBC (2010)
123. Bangkok Post (2010)
124. Cazenave & Llovel (2010)
125. NASA Climate (2010)
126. See Cazenave & Llovel (2010), Cazenave et al (2008) 127. Ibid.
128. Cazanave et al. (2008)
129. World Resources Institute (2005)
130. McGranahan et al. (2007)
131. DIVA (2003a)
132. WMO (2010); FAO (2010)
133. NCDC NOAA (2009)
134. IPCC (2004)
135. Millennium Ecosystem Assessment - Desertification (2005)
136. Pantuliano & Pavanello (2009)
137. UNFCCC (2009)
138. Welker (2009)
139. UNFCCC (2009)
140. World Resources Institute (2005)
141. World Bank (2009)
142. PLACE (2010)
143. Toth et al. (2005)
144. DIVA (2003a)
145. CIA Factbook (2010)
146. CIA Factbook (2010); McGranahan et al. (2007) 147. Ibid.
148. IPCC (2007)
149. Ibid.
150. WHO (2010)
151. Ibid.
152. Ibid.
153. Ibid.
154. Ibid.
155. Ibid.
156. Rapp (2009)
157. IPCC (2007)
158. Hoegh-Guldberg et al. (2007)
159. Millennium Ecosystems Assessment (2005)
160. IPCC (2007)
161. IFPRI (2010); IPCC WGII (2007)
162. IPCC (2008); IPCC (2007)
163. IPCC WG II (2007); Cheung et al. (2010)
164. Especially Tol (2002) and Stern (2006)
165. Tol (2002)
166. IPCC (2007)
167. Watkiss et. al (2005)
168. Easterling et al. (2007)
169. Environmental Protection Agency (2010)
170. Backlund et al. (2008)
171. Easterling et al. (2007)
172. Ibid.; IPCC (2007)
173. Parry et al. (2008)
174. IPCC (2001)
175. Sukhdev et al. (2008)
176. Easterling et al. (2007); Garnaut (2008)
177. Bogataj (2009)
178. EPA (2009)
179. Carnegie (2009)
180. Ash et al.(2008)
181. Cheung et al. (2010)
182. FAO (2010)
183. IPCC WG II (2007)
184. UNEP (2010)
185. Tierney et al.(2008)
186. Easterling et al. (2007)
187. IPCC WGII (2007); Cheung et al. (2010)
188. Sachs (2001)
189. WHO (2002)
190. Nelson et al. (2009)
191. Nelson et al. (2009) 192. OCHA (2010)
193. Garnaut (2008)
194. UNEP (2010)
8/8/2019 Climate Vulnerability Monitor 2010: The State of the Climate Crisis
http://slidepdf.com/reader/full/climate-vulnerability-monitor-2010-the-state-of-the-climate-crisis 261/291
Climate Vulnerability Monitor | 259
195. UNCTAD (2009)
196. IFPRI (2009a), Parry et al (2004), Cline (2007)
197. INCCA (2010); Rodell et al. (2009)
198. INCCA (2010)
199. Environment news service (2009)
200. Rodell et al (2009)
201. Rodell et al. (2009)
202. FUND (2008)
203. Cheung et al. (2010)
204. Real Instituto Elcano (2009)
205. Iberia Nature (2006)
206. Arnell (2004); Downing (1996)
207. Cline (2007)
208. Parry et. al (2004)
209. IPCC WGII (2007)
210. Ibid.
211. IPCC (2007)
212. UNDP (2010)
213. UNDP (2010)
(http://www.un.org/millenniumgoals/global.shtml)
214. GEF (2010)
215. Commission on Climate Change and Development,
Sweden (2010); ECA Working Group (2009)
216. UNDP (2008)
217. World Bank (2010)
218. Please refer to the section “Adaptation Performance
Review” of this report
219. DCPP (2006)
220. DCPP (2006)
221. WHO (2004);McMichael et al.(2006)
222. DCPP (2006)
223. WHO (2010)
224. DCPP (2006), Woodward et al.(2000)
225. UN (2009a), UNCCD (2004)
226. GEF Kiribati Adapation Project (2009)
227. DCPP (2006)
228. DCPP
229. Rheingans et al. (2006)
230. U.S. Environmental Protection Agency (2006); Ebi et al.
(2004)
231. IPCC (2007); IFRC (2009)
232. ECA Working Group (2009)
233. DCPP (2006); UN (2009); UNISDR (2005)
234. UN (2009b)
235. The Boston Globe (2010)
236. NHC 2010
237. Heerden (2007)
238. NAPA, Laos 2009; CRED (2010)
239. CRED (2010)
240. UNISDR (2005)
241. UN (2009b)
242. Lewis III (2001); DCPP (2006)
243. Cazenave & Llovel (2010)
244. IFRC (2009)
245. UN (2006)
246. Islam & Mechler (2007)
247. Gilman et al. (2006)
248. Japan National Defence Academy (2010)
249. Khazai et al. (2007); Fisheries and Oceans Canada (2001)
250. DCPP (2006); UNISDR (2005)
251. IFRC (2009); Chan & Baba (2009)
252. Chang et al. (2010)
253. IPCC (2007)
254. DIVA (2003a)
255. IPCC WG II (2007); Millennium Ecosystem Assessment -
Desertification (2005)
256. IPCC (2007)
257. UNEP (2009)
258. UNDP
259. Islam & Mechler (2007); ECA Working Group (2009)
260. NAPA, Cambodia (2007)
261. ECA Working Group (2009) 262. ECA Working Group (2009)
263. Millennium Ecosystem Assessment - Desertification (2005)
264. Khazai et al. (2007)
265. ECA Working Group (2009); UNFCCC
266. UNCCD (2009)
267. IPCC (2008)
268. IPCC (2007), especially WG I
269. IPCC (2007)
270. USDA(2008)
271. ECA Working Group (2009)
272. Parry et al. (2007); ECA Working Group (2009)
273. Glenn, Brown & O’Leary (1998)
274. IPCC WG II (2001)
275. ECA Working Group (2009)
276. Stefanski et al. (2007)
277. UNCCD (2004)
278. ECA Working Group (2009)
279. Gilman et al. (2006); UNCCD & Joint Liaison Group of the
Rio Conventions (2007)
280. ECA Working Group (2009)
281. FAO (2010)
282. NAPA, Tuvalu (2007); FAO (2010)
283. Stefanski et al. (2007)
284. FAO (2010)
285. Glenn, Brown & O’Leary (1998); GEF/UNDP Pakistan (2007)
286. Stefanski et al. (2007); Gilman et al. (2006)
287. UNFCCC (2003)
288. Ibid.
289. Ibid.
290. DMI (2010)
291. Cheung et al. (2010)
292. Parry et al. (2004)
293. Ibid.
294. UNFCCC (2003) 295. Ibid.
296. Ibid.
297. Ibid.
8/8/2019 Climate Vulnerability Monitor 2010: The State of the Climate Crisis
http://slidepdf.com/reader/full/climate-vulnerability-monitor-2010-the-state-of-the-climate-crisis 262/291
260 | Climate Vulnerability Monitor
351. FUND (2008)
352. Cheung et al. (2010)
353. Legget et al. (1992)
354. cf. Parry et al (2009); ECA Working Group (2009); DCPP
(2006); IPCC (2007)
355. cf. DCPP; UNISDR; UNCCD
356. IPCC (2007)
357. Ibid. – “Warming of the climate system is unequivocal.”
358. Ibid. – “Most of the observed increase in global average
temperatures since the mid-20th century is very likely
due to the observed increase in anthropogenic GHG
concentrations.”
359. Doran and Zimmerman (2009)
360. Oreskes (2004)
361. Campell-Lendrum et al (2010); Boykoff and Boykoff (2004)
362. Adam and Goldenberg (2010); Hansen (2007); Biello
(2007); Pielke Jr. (2007); Richardson et al. (2009)
363. Australian Academy of Sciences et al. (2001) 364. Cicerone et al (2001)
365. The Royal Society (2005)
366. World Bank (2009)
367. Boykoff and Boykoff (2004)
368. Lashof (1989)
369. Hansen et al. (2005)
370. IPCC (2007); Richardson et al. (2009)
371. Petit et al (2001)
372. IPCC (2007)
373. Richardson et al. (2009)
374. Ibid.; IPCC (2007); NASA (2010)
375. NCDC NOAA (2010)
376. NSIDC (2010); IPCC (2007)
377. Ibid.
378. NASA Climate (2010)
379. Hansen (2006)
380. Zimov et al (2006); Schuur et al (2008)
381. IPCC (2007)
382. Ibid.
383. Ibid.
384. Ibid.; Richardson et al. (2009)
385. Richardson et al. (2009)
386. IPCC (2007)
387. Richardson et al. (2009)
388. Moberg et al. (2004)
389. Hansen et al. (2005)
390. IPCC (2007)
391. Ibid.
392. Copenhagen Accord (2009)
393. Richardson et al. (2009)
394. Ibid.
395. Ibid.
396. Ibid.
397. Ibid.
398. http://www.unisdr.org/eng/library/lib-terminology-eng%20
home.htm
298. Ibid.
299. Martínez and Fernández (2008)
300. IPCC (2007)
301. IPCC (2008)
302. SEMARENA and UNDP (2009)
303. IFPRI (2009)
304. Dominican Today (2009)
305. Emerton et al (2009)
306. (e.g. WHO 2004; Toth et al.: 2005)
307. (DIVA and FUND2.)
308. Vermeer and Rahmstor (2009)
309. WHO (2004)
310. WHO (2009)
311. Ibid.
312. WHO (2004)
313. WHO (2009)
314. UN (2010)
315. WHO (2004)
316. UN (2010)
317. WHO (2004)
318. Ibid.
319. Ibid.
320. Tett et al. (1997)
321. WHO (2004)
322. CRED (2010)
323. Ibid.
324. Munich Re (2010)
325. GERMANWATCH (2010) 326. Munich Re (2010)
327. CRED (2010)
328. Munich Re (2010)
329. GERMANWATCH (2010)
330. World Bank (2008)
331. WHO (2004)
332. IPCC (2007)
333. Kron (2009)
334. ECA Working Group (2009)
335. WHO (2004)
336. Ibid.
337. Ibid.
338. Toth et al. (2005)
339. PLACE (2010)
340. Toth et al. (2005)
341. DIVA (2003a)
342. Hinkel (2005); Hinkel, Klein & Toll (2007); Nicholls et al.
(2007); Vafeidis et al. (2008)
343. PLACE (2010)
344. Ibid.
345. Ibid.
346. Toth et al. (2005)
347. Ibid.
348. FUND (2009)
349. Cheung et al. (2010)
350. Earth Trends WRI (2010)
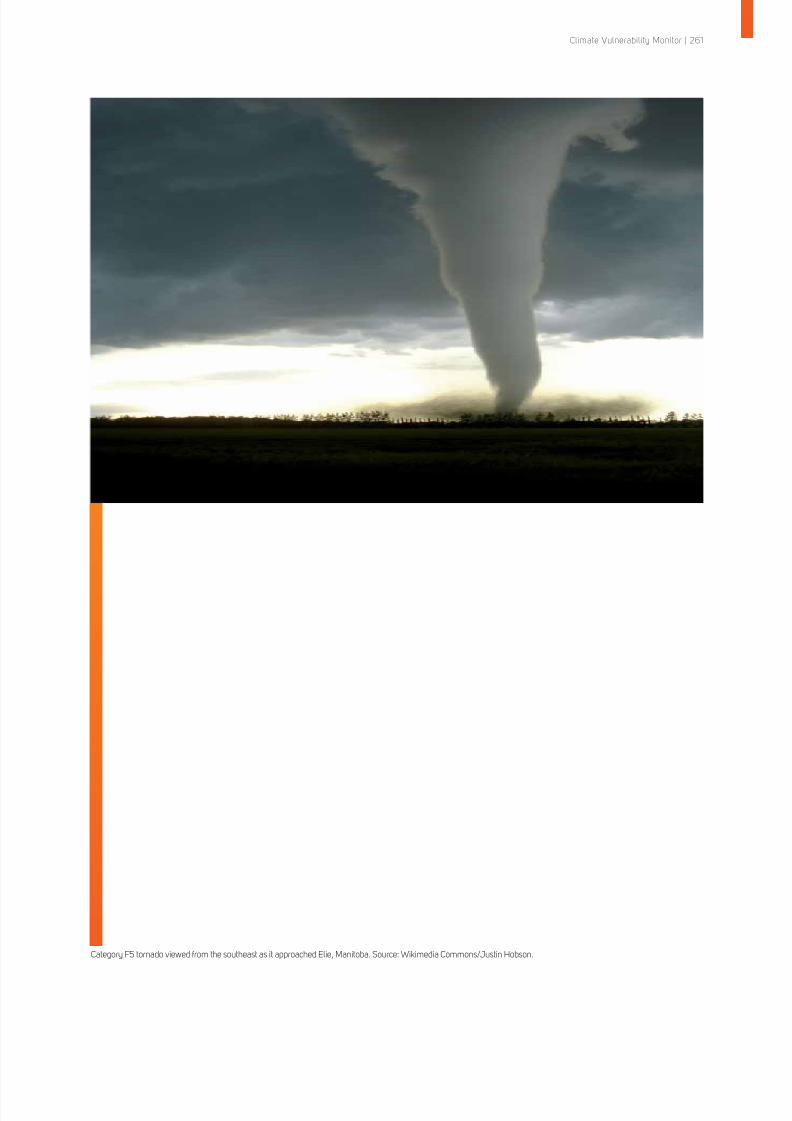
8/8/2019 Climate Vulnerability Monitor 2010: The State of the Climate Crisis
http://slidepdf.com/reader/full/climate-vulnerability-monitor-2010-the-state-of-the-climate-crisis 263/291
Climate Vulnerability Monitor | 261
Category F5 tornado viewed from the southeast as it approached Elie, Manitoba. Source: Wikimedia Commons/Justin Hobson.
8/8/2019 Climate Vulnerability Monitor 2010: The State of the Climate Crisis
http://slidepdf.com/reader/full/climate-vulnerability-monitor-2010-the-state-of-the-climate-crisis 264/291
Adam & Goldenburg (2010)David Adam & Suzanne Goldenberg (2010, February 10)
How to reform the IPCC
Guardian.co.uk http://www.guardian.co.uk/environment/2010/feb/10/ipcc-reform
ADAPTADAPT Screening Tool
Climate Change Data Portal World Bank
http://sdwebx.worldbank.org/climateportal
ADB (2002)Asian Development Bank (2002)
Handbook for Integrating Risk Analysis in the Economic Analysis of Projects Manila, Philippines: Asian Development Bank
http://www.adb.org/documents/handbooks/integrating_risk_analysis/prelims.pdf
Adger et. al (2007) Adger, W.N., S. Agrawala, M.M.Q. Mirza, C. Conde, K. O’Brien, J. Pulhin, R. Pulwarty, B.
Smit and K. Takahash (2007)
Assessment of adaptation practices, options, constraints and capacity
in: M.L. Parry, O.F. Canziani, J.P. Palutikof, P.J. van der Linden and C.E. Hanson, (Eds.):
Climate Change 2007: Impacts, Adaptation and Vulnerability. Contribution of Working Group II to the Fourth Assessment Report of the Intergovernmental Panel on Climate Change (pp. 717-743)
IPCC
Cambridge, UK: Cambridge University Press
Altez (2007)R. Altez (2007)
Muertes Bajo Sospecha: Investigación Sobre el Número de Fallecidos en el Desastre
del Estado Vargas, Venezuela, en 1999.
Cuadernos de Medicina Forense, vol. 13, numero 50, pp. 243-253
Ash et al. (2008)Neville Ash, Asghar Fazel, Yoseph Assefa, Jonathan Baillie, Mohammed Bakarr, Souvik
Bhattacharjya, Zoe Cokeliss,
Andres Guhl, Pascal Girot, Simon Hales, Leonard Hirsch, Anastasia Idrisova, Georgina
Mace, Luisa Maf fi, Sue Mainka, Elizabeth Migongo-Bake, José Gerhartz Muro, Maria
Pena, Ellen Woodley, and Kaveh Zahedi (2008)
Biodiversity. In: Environment for Development. Global Environment Outlook 4 (GEO 4)(chap. 5)
New York, US: United Nations Environment Programme (UNEP), United Nations
Asian Disaster Preparedness Center (2003)Asian Disaster Preparedness Center(2003)
Training and Education – Fifth Regional Training Course on Flood Risk Management.Retrieved October 2010: http://www.adpc.net/training/te-frm5.html
Australian Academy of Sciences et al. (2001)Australian Academy of Sciences, Royal Flemish Academy of Belgium for
Sciences and the Arts, Brazilian Academy of Sciences, Royal Society of Canada,
Caribbean Academy of
Sciences, Chinese Academy of Sciences, French Academy of Sciences, German
Academy of Natural Scientists
Leopoldina, Indian National Science Academy, Indonesian Academy of Sciences, Royal
Irish Academy,
Accademia Nazionale dei Lincei (Italy), Academy of Sciences Malaysia, Academy
Council of the Royal Society
of New Zealand, Royal Swedish Academy of Sciences, and Royal Society UK (2001)
Joint Statement:The Science of Climate Change The Royal Society
http://royalsociety.org/Report_WF.aspx?pageid=10028
B I B L I O G R A P
H Y
8/8/2019 Climate Vulnerability Monitor 2010: The State of the Climate Crisis
http://slidepdf.com/reader/full/climate-vulnerability-monitor-2010-the-state-of-the-climate-crisis 265/291
Backlund et al. (2008)Peter Backlund, Anthony Janetos, and David Schimel (2008)
The effects of climate change on agriculture, land resources, water reso urces, and biodiversity in the United States - Final Report, Synthesis and Assessment Product 4.3 Climate Change Science Program and the Subcommittee on Global Change Research
Washington D.C., U.S: Department of Agriculture (USDA)
Barnes et al. (2004)Douglas F. Barnes, Keith Openshaw, Kirk R. Smith, and Robert van der Plas (2004)
What Makes People Cook with Improved Biomass Stoves? A Comparative International
Review of Stove Programs
World Bank Working Paper 2004, no. 90
Washington D.C., US: World Bank
Beltrán & Koo-Oshima (2004)J. Martínez Beltrán and S. Koo-Oshima (2004)
Water desalination for agricultural applications
Land and Water Discussion Paper , no. 5.
Rome, Italy:FAO (Food and Agriculture Organization of the United Nations)
Bentham et al. (1995)G. Bentham, I.H Langford (1995)
Climate change and the incidence of food poisoning in England and Wales
International Journal of Biometeorology, vol. 39, pp. 81-86.
Biello (2007)David Biello (2007)
Conservative Climate: Consensus document may understate the climate change problem
Scienti fi c American, April Issue
Bogataj (2009)Lučka Kajfež Bogataj (2009)
How will the Alps respond to Climate Change? Scenarios for the future of Alpine Water
Alpine Space – Man and Environment, vol. 3: The Water Balance of the Alps (2007)
Innsbruck, Austria: Innsbruck University Press
Bouwer (2010)Laurens M. Bouwer (2010)
Have disaster losses increased due to anthropogenic climate change?
Bulleting of the American Meteorological Society, preliminary accepted version
(doi: 10.1175/2010BAMS3092.1)
Boykoff and Boykoff (2004)Maxwell Boykoff and Jules Boykoff (2004)
Balance as bias: Global warming and the US prestige press
Global Environmental Change, vol. 14, pp. 125–136
British Medical Journal (2002)Sophie Arie (2002)
Malnutrition spreads in ArgentinaBritish Medical Journal, vol. 325(7375), p.1261
http://www.ncbi.nlm.nih.gov/pmc/articles/PMC1169910/
Brooks et al. (2005)Brooks, N.; Neil Adger, W.; Mick Kelly, P. (2005)
The determinants of vulnerability and adaptive capacity at the national level and the
implications for adaptation
Global Environmental Change, Part A, vol. 15, Issue 2, pp. 151-163
Campell-Lendrum et al. (2010)Diarmid Campbell-Lendrum, Roberto Bertollini (2010)
Science, media and public perception: implications for climate and health policies
Bull World Health Organ, vol. 88, pp. 242
8/8/2019 Climate Vulnerability Monitor 2010: The State of the Climate Crisis
http://slidepdf.com/reader/full/climate-vulnerability-monitor-2010-the-state-of-the-climate-crisis 266/291
CARECARE International
Climate Change Publications http://www.careclimatechange.org/index.php?option=com_content&view=article&id
=39&Itemid=43
Carnegie (2009)Carnegie Institution for Science (2009, 11 March)
Retrieved November 2010:
http://carnegiescience.edu/news/coral_reefs_may_start_dissolving_when_
atmospheric_co2_doubles
Caspari & Pokhrel (2008)Moench, M., Caspari, E. & A. Pokhrel (eds.) (2008)
From Risk to Resilence - Evaluating Costs and Benefi ts of Flood Reduction under
Changing Climatic Conditions: Case of the Rohini River Basin, India
Provention Consortium Working Paper, no. 4
http://www.proventionconsortium.org/themes/default/pdfs/CBA/ISET_wp04_
resilience.pdf
Cazenave & Llovel (2010)Anny Cazenave and William Llovel (2010)
Contemporary Sea-level Rise
Annual Review of Marine Science, vol. 2, pp. 145-173
Cazenave et al. (2008)A. Cazenave, Dominh K., S. Guinehut, E. Berthier, W. Llovel, G.
Ramillien, M. Ablain, G. Larnicol (2008)
Sea-level budget over 2003-2008: a reevaluation from GRACE space gravimetry,
satellite altimetry and Argo.
Global and Planetary Change, vol.65, no. 1, pp. 83-88
CDC (2010)Centers for Disease Control and Prevention (2010)
The Healthy People 2010 Database Retrieved: http://wonder.cdc.gov/data2010/
CGIAR (2009)Alliance of the CGIAR Centers (December 2009)
Climate, Agriculture and Food Security: A Strategy for Change Retrieved September 2010:
http://www.cgiar.org/pdf/CCAFS_Strategy_december2009.pdf
CGIAR (2010)CGIAR (2010)
Research & Impact: CGIAR on Global Issues -CGIAR and Desertification Retrieved
September 2010:
http://www.cgiar.org/impact/global/desertification_factsheet_index.html
Chan & Baba, (2009)Chan, H.T. & Baba, S. (2009)
Manual on Guidelines for Rehabilitat ion of Coastal Forests damaged by Natural Hazards in the Asia-Paci fi c Region International Society for Mangrove Ecosystems (ISME) & International Tropical Timber
Organization (ITTO)
Chang et al. (2010)Chia-Ling Chang, Tsung-Hung Hsu, Yunn-Jiin Wang, Jen-Yang Lin, Shaw L. Yu (2010)
Planning for Implementation of Riparian Buffers in the Feitsui Reservoir Watershed
Water Resources Management, vol. 24, number 10, pp. 2339-2352
Cheung et al. (2010)William W. L. Cheung, Vicky W. Y. Lam, Jorge L. Sarmiento, Kelly Kearney, Reg Watson,
Dirk Zeller, Daniel Pauly (2010)
Large-Scale Redistribution of Maximum Fisheries Catch Potential in the Global Ocean
under ClimateGlobal Change Biology, vol. 16, issue 1, pp. 24-35
http://onlinelibrary.wiley.com/doi/10.1111/j.1365-2486.2009.01995.x/pdf
8/8/2019 Climate Vulnerability Monitor 2010: The State of the Climate Crisis
http://slidepdf.com/reader/full/climate-vulnerability-monitor-2010-the-state-of-the-climate-crisis 267/291
CI:GraspPotsdam Institute for Climate Impact Research
CI:Grasp http://cigrasp.pik-potsdam.de/
CIA Climate Factbook
CIAClimate Factbook Retrieved August-October 2010:
https://www.cia.gov/library/publications/the-world-factbook/fields/2059.html
Cicerone et al. (2001)Cicerone, R., et al.(2001)
Climate Change Science: an Analysis of Some Key Questions Proceedings of the Committee on the Science of Climate Change, Division on Earth
and Life Studies, National Research Council.
Washington D.C., US: National Academy Press
Costello et al. (2009)A. Costello, A. Abbas, M. A. Allen et al. (2009)
Managing the health effects of climate change
Lancet, vol. 373, pp.1693-1733
CRED (2010)Center for Research of the Epidemiology of Disasters (CRED)
(2010)
EM DAT - The International Disasters Database Retrieved: http://www.emdat.be/advanced-search
Dahal (2006)Mahesh Raj Dahal (2006)
Benefi t-Cost Analysis of Community Forest and Its Distributional Impact on Rural Poor
Economic Journal of Nepal, vol. 29, no. 2, pp. 93-107
DCPPWorld Bank
Disease Control Priorit ies Project and Global Burden of Disease and Risk Factors: Cost-Effective Interventions (Database)
http://www.dcp2.org/page/main/BrowseInterventions.html
DCPP (2006)World Bank (2006)
Disease Control Priorit ies in Developing Countries (2nd edition).
New York: Oxford University Press
Washington D.C., US: World Bank
de Fraiture & Molden (2010)de Fraiture, Charlotte; Molden, David; Wichelns, Dennis (2010)
Investing in water for food, ecosystems, and livelihoods: an overview of the
comprehensive assessment of water management in agricultureAgricultural Water Management, vol. 97(4), pp.495-501.
(Special issue with contributions by IWMI authors).
Retrieved September 2010: http://dx.doi.org/10.1016/j.agwat.2009.08.015
de Onis et al. (2004)de Onis M, Blössner M, Borghi E, Morris R, Frongillo E.A. (2004)
Methodology for estimating regional and global trends of child malnutrition
Internat ional Journal of Epidemiology, vol. 33, pp. 1260–1270.
DIVA (2003a)DINAS-COAST (2003)
Dynamic Interactive Vulnerability Assessment
DIVA (2003b)DINAS-COAST (2003)
DIVA: System properties type
8/8/2019 Climate Vulnerability Monitor 2010: The State of the Climate Crisis
http://slidepdf.com/reader/full/climate-vulnerability-monitor-2010-the-state-of-the-climate-crisis 268/291
DMI (2010)Danish Meteorological Institute (DMI) (2010)
http://www.dmi.dk/dmi/index/
Dominican Today (2009)Dominican Today (2009, 19 June)
Deserti fi cation affects around 5 million Dominicans Retrieved November 2010:
http://www.dominicantoday.com/dr/economy/2009/6/19/32329/Deserti fication-
affects-around-5-million-Dominicans
Doran & Zimmerman (2009)Peter T. Doran and Maggie Kendall Zimmerman(2009)
Examining the Scienti fi c Consensus on Climate Change Chicago: University of Illinois at Chicago (UIC)
Retrieved October 2010: http://tigger.uic.edu/~pdoran/012009_Doran_final.pdf
Duffy (2010)Niev Duffy (2010)
The Potential Economic Bene fi ts of Riparian Buffers Connecticut, U.S.: Eastern Economic Research, Inc.
Duran, Gutierrez, and Keskinocak (2010)Serhan Duran, Marco A. Gutierrez and Pınar Keskinocak (2010)
Pre-positioning of Emergency Items Worldwide for CARE International INFORMS Inventory Paper
Retrieved October 2010: http://www.scl.gatech.edu/research/humanitarian/files/
CAREPrepositioningofInventorypaper.pdf
Earth Trends WRI (2010)World Resources Institute (2010)
Earth Trends -The Environmental Information portal Retrieved August-October 2010:
http://earthtrends.wri.org/searchable_db/index.php?theme=1&variable_
ID=41&action=select_countries
Easterling et al. (2007)Easterling, W.E., P.K. Aggarwal, P. Batima, K.M. Brander, L. Erda, S.M. Howden, A.
Kirilenko, J. Morton, J.-F. Soussana, J. Schmidhuber and F.N. Tubiello (2007)
Food, fibre and forest products, in: M.L. Parry, O.F. Canziani, J.P. Palutikof, P.J. van
der Linden and C.E. Hanson (eds.): Climate Change 2007: Impacts, Adaptat ion and Vulnerability. Contribution of Working Group II to the Fourth Assessment Report of the Intergovernmental Panel on Climate Change (pp. 273-313)
IPCC
Cambridge, UK: Cambridge University Press
Ebi et al. (2004)Kristie L. Ebi, Thomas J. Teisberg, Laurence S. Kalkstein,
Lawrence Robinson and Rodney F. Weiher (2004)
Heat Watch / Warning Systems Save Lives - Estimated Costs and Benefi ts forPhiladelphia 1995–98
American Meteorological Society, vol. 85, issue 8, pp. 1067-1073
ECA Working Group (2009)Economics of Climate Adaptation (ECA) Working Group (2009)
Shaping Climate-resilient Development: A framework for decision-making Climate Works Foundation, Global Environment Facility, European Commission,
McKinsey & Company, The Rockefeller Foundation, Standard Chartered Bank, and SwissRe
http://media.swissre.com/documents/rethinking_shaping_climate_resilent_
development_en.pdf
Elsner et al. (2008)James B. Elsner, James P. Kossin & Thomas H. Jagger (2008)
The increasing intensity of the strongest tropical cyclonesNature, vol. 455, pp. 92-95
8/8/2019 Climate Vulnerability Monitor 2010: The State of the Climate Crisis
http://slidepdf.com/reader/full/climate-vulnerability-monitor-2010-the-state-of-the-climate-crisis 269/291
Emanuel (2005)K. Emanuel (2005)
Increasing destructiveness of tropical cyclones over the past 30 years.
Nature, vol. 436, pp. 686-688
ENDA (2008)
Environmental Development Action in the Third World (ENDA) (2008)Enda Annual Report 2007 – The Challenge of renewal at institutional and policy level Dakar, Senegal: ENDA Third World/Executive Secretariat
http://www.enda.sn/ENDA%20IN%202007%20-%20ANNUAL%20REPORT%20-%20
THE%20CHALLENGE%20OF%20RENEWAL.pdf
Environment News Service (2009)Environment News Service (2009. 8 December)
2009 Global Temperature Fifth Warmest on Record Retrieved October 2010:
http://www.ens-newswire.com/ens/dec2009/2009-12-08-02.asp
Environmental Protection Agency (2010)Environmental Protection Agency (2010)
Various resources Retrieved September-October 2010:
http://www.epa.gov/climatechange/effects/agriculture.html
FAO (2010)FAO (2010)
Adaptation to climate change in agriculture, forestry and fi sheries Rome, Italy: Food and Agriculture Organization of the United Nations (FAO), United Nations
ftp://ftp.fao.org/docrep/fao/009/j9271e/j9271e.pdf
FEMA (2009)FEMA (2009, 16 September)
FEMA Grant Of $2.2 Million To Georgetown Will Reduce Frequent Flooding Through Upgrading Drainage System Retrieved October 2010:
http://www.fema.gov/news/newsrelease.fema?id=49959
Fisheries and Oceans Canada (2001)Fisheries and Oceans Canada (2001)
Marine Guide to Preventing Shoreline Erosion. Prepared by Habitat & Enhancement Branch, Pacific Region
Retrieved November 2010: www.dfo-mpo.gc.ca/Library/281618.pdf
FUND (2008)FUND (2008)
The Climate Framework for Uncertainty, Negotiation and Distribut ion (FUND),Technical Description, Version 3 .3 http://www.mi.uni-hamburg.de/FUND.5679.0.html
FUND (2009)FUND (2009)
Fund2.8n model Retrieved:
http://www.mi.uni-hamburg.de/FUND.5679.0.html
Füssel (2009)Hans-Martin Füssel (2009)
Review and Quantitative Analysis of Indices of Climate Change Exposure, Adaptive Capacity, Sensitivity, and Impacts -- Background Note to the World Development Report 2010: Development and Climate Change Geneva, Switzerland: World Bank
Garnaut (2008)
Ross Garnaut (2008)The Garnaut Climate Change Review Final Report Cambridge, UK: Cambridge University Press
8/8/2019 Climate Vulnerability Monitor 2010: The State of the Climate Crisis
http://slidepdf.com/reader/full/climate-vulnerability-monitor-2010-the-state-of-the-climate-crisis 270/291
GEF (2004)GEF (2004)
Rehabilitat ion of the Osanya Irrigation Canal and Water Reservoir for irrigation in Mande village Global Environment Facility (GEF)
http://sgp.undp.org/web/projects/6759/rehabilitation_of_the_osanya_irrigation_
canal_and_water_reservoir_for_irrigation_in_mande_village.html
GEF (2010)GEF (2010)
Maldives Integration of Climate Change Risks into the Safer Island Development Programme Global Environment Facility (GEF)
http://www.thegef.org/gef/greenline/mar10/ldcf.html
GEF / UNDP (1997)GEF/UNDP (1997)
Solar Powered Water Desalination (Mauritius)Global Environment Facility (GEF), United Nations Development Programme (UNDP),
United Nations
http://sgp.undp.org/download/SGP_Mauritius.pdf
GEF Kiribati Adaptation Project (2009)GEF (2009)
Kiribati Adaptation Project-Implementation Phase (KAP-II)Restructuring of the Project (GEF Grant TF056267)Washington D.C., US: Global Environment Facility (GEF)
Retrieved November 2010:
http://www.thegef.org/gef/sites/thegef.org/files/repository/Kiribati_06_16_09_
Adaptation_Proj_Implementation_KAP_II.pdf
GEF SGP Mauritius (2001)GEF SGP (2001)
Sustainable Agricultural Technologies for Rodrigues (Maurit ius)Global Environment Facility (GEF), United Nations Development Programme (UNDP),
United Nations
http://sgp.undp.org/web/projects/4939/additional_request_for_funding_
sustainable_agricultural_technologies_for_rodrigues.htm
GEF/NAPA Maldives (2007)GEF/NAPA (2007)
Maldives NAPA Project 2007 Global Environment Facility (GEF), United Nations Development Programme (UNDP),
United Nations
http://gefonline.org/projectDetailsSQL.cfm?projID=2353
GEF/UNDP Pakistan (2007 )GEF/UNDP (2007)
Raising Crops on Saline Soils with Saline Water (Pakistan)
Global Environment Facility (GEF), United Nations Development Programme (UNDP),United Nations
http://sgp.undp.org/web/projects/9935/raising_crops_on_saline_soils_with_saline_
water.html
GERMAN WATCH (2010)GERMANWATCH (2010)
Global Climate Risk Index – Weather-related loss events and their impacts on countries in 2008 and in long-term comparison Retrieved:
http://www.germanwatch.org/klima/cri.htm
Gething et al. (2010)Peter W. Gething, David L. Smith, Anand P. Patil, Andrew J. Tatem, Robert W. Snow,
& Simon I. Hay (2010)Climate change and the global malaria recession
Nature, vol. 465, pp. 342-345
8/8/2019 Climate Vulnerability Monitor 2010: The State of the Climate Crisis
http://slidepdf.com/reader/full/climate-vulnerability-monitor-2010-the-state-of-the-climate-crisis 271/291
Ghaffer (2006)Ghaffer, Eman Abdel (2006)
Non-Conventional Water Resources Management Cairo, Egypt: Environment and Climate Research Institute (ECRI), National Water
Research Center
http://www.iwtc.info/2006_pdf/07-4.pdf
Gilman et al. (2006)Gilman, E., H. Van Lavieren, J. Ellison, V. Jungblut, L. Wilson, F. Areki, G. Brighouse, J.
Bungitak, E. Dus, M. Henry, I. Sauni Jr., M. Kilman, E. Matthews, N. Teariki-Ruatu, S.
Tukia, K. Yuknavage (2006)
Paci fi c Island Mangroves in a Changing Climate and Rising Sea. Regional Seas Reports and Studies, No. 179 Nairobi, Kenya: United Nations Environment Programme (UNEP), United Nations
http://www.unep.org/PDF/mangrove-report.pdf
Glenn, Brown & O’Leary (1998)Edward P. Glenn, J. Jed Brown and James W. O’Leary (1998)
Irrigating Crops with Seawater
Scienti fi c American, August Issue
Global Humanitarian Forum (2009)Global Humanitarian Forum (2009)
Human Impact Report: Climate Change - The Anatomy of A Silent Crisis Geneva, Switzerland: Global Humanitarian Forum
Goklany (2009)I.M Goklany (2009)
Is climate change the “defining challenge of our age?
Energy & Environment, vol. 20, no. 3, pp.279-302.
GTZ (2009)Reliefweb/ German Technical Cooperation (GTZ) (2009, December 11)
Manual on Local Flood Early Warning Systems - Experiences from the Philippines Retrieved September 2010:
http://www.reliefweb.int/rw/rwb.nsf/db900sid/SKEA-7YMJMV?OpenDocument
Hansen (2006)Jim Hansen (2006, 19 October)
The Planet in Peril – Part I: Global warming, arctic ice melt and rising oceans will shrink
nations and change world maps
YaleGlobalOnline
Hansen (2007)James Hansen (2007)
Scientific reticence and sea-level rise
Environment Research Letters 2, April-June
Retrieved October 2010:
http://iopscience.iop.org/1748-9326/2/2/024002/fulltext
Hansen et al (2005)James Hansen, Larissa Nazarenko, Reto Ruedy, Makiko Sato, Josh Willis, Anthony
Del Genio, Dorothy Koch, Andrew Lacis, Ken Lo, Surabi Menon, Tica Novakov, Judith
Perlwitz, Gary Russell, Gavin A. Schmidt, Nicholas Tausnev (2005)
Earth’s Energy Imbalance: Confirmation and Implications
Science, vol. 308, pp. 1431-1435
Heerden (2007)Ivor Ll. van Heerden (2007)
The Failure of the New Orleans Levee System Following Hurricane Katrina and the
Pathway Forward
Public Administration Review, vol. 67, Issue Supplement, pp. 24-35
8/8/2019 Climate Vulnerability Monitor 2010: The State of the Climate Crisis
http://slidepdf.com/reader/full/climate-vulnerability-monitor-2010-the-state-of-the-climate-crisis 272/291
Hendricks & Bushnell (2009)R. C. Hendricks and D.M. Bushnell (2009)
Halophytes, Algae, and Bacteria Food and Fuel Feedstocks Nasa Technical Reports Server (NTRS)
Retrieved:
http://ntrs.nasa.gov/archive/nasa/casi.ntrs.nasa.gov/20090025461_2009023863.pdf
Hinkel (2005)J. Hinkel (2005)
DIVA: an iterative method for building modular integrated models Advances in Geosciences, vol. 4, pp. 45-50
Hinkel, Klein & Toll (2007)Nicholls, R. J., R. J. T. Klein, and R. S. J. Tol (2007)
Integrating knowledge for assessing coastal vulnerability to climate change, in:
McFadden, L., Nicholls, R.J., and Penning-Rowsell, E.C. (eds.) Managing Coastal Vulnerability: An Integrated Approach (pp. 61–78)Amsterdam, the Netherlands: Elsevier Science
Hoegh-Guldberg et al. (2007)O. Hoegh-Guldberg, P. J. Mumby, A. J. Hooten, R. S. Steneck, P. Greenfield, E. Gomez,
C. D. Harvell, P. F. Sale, A. J. Edwards, K. Caldeira, N. Knowlton, C. M. Eakin, R. Iglesias-
Prieto, N. Muthiga, R. H. Bradbury, A. Dubi and M. E. Hatziolos
Coral Reefs Under Rapid Climate Change and Ocean Acidification
Science, vol. 318, no. 5857, pp. 1737-1742
Iberia Nature (2006)Iberia Nature – Climate Change in Spain (2006)
Latest 2006 News on Climatic Change in Liberia Retrieved October 2010:
http://www.iberianature.com/material/iberiaclimatechange.html#iberia_climate_change
IFPRI (2009a)IFPRI (2009)
Climate change: Impact on agriculture and costs of adaptation Washington D.C., US: International Food Policy Research Institute
http://www.ifpri.org/publication/climate-change-impact-agriculture-and-costs-adaptation
IFPRI (2009b)IFPRI (2009)
David J. Spielman & Rajul Pandya-Lorch (eds)
Millions Fed – Proven Successes in Agricultural Development Washington D.C., US: International Food Policy Research Institute
http://www.ifpri.org/sites/default/files/publications/oc64.pdf
IFRC (2004)IFRC (2004)World Disasters Report. Focus on Community Resilience Geneva, Switzerland: International Federation of Red Cross and Red Crescent Societies
IFRC (2008)IFRC (2008, April 14)
Aid agencies warn of housing crisis as Bangladesh cyclone victims enter monsoon season Retrieved September 2010: http://www.ifrc.org/docs/news/pr08/1708.asp
IFRC (2009)IFRC (2009)
World Disasters Report. Focus on Early Warning, Early Action Geneva, Switzerland: International Federation of Red Cross and Red Crescent
Societies
IMF (2009)IMF (2009)
World Economic Outlook (2009 data and statistics)
International Monetary Fund

8/8/2019 Climate Vulnerability Monitor 2010: The State of the Climate Crisis
http://slidepdf.com/reader/full/climate-vulnerability-monitor-2010-the-state-of-the-climate-crisis 273/291
IMF (2010)IMF (2010)
World Economic Outlook (2010 data and statistics)International Monetary Fund
INCCA (2010)
Indian Network for Climate Change Assessment (2010)Climate Change and India: A 4X4 assessment - A Sectoral and Regional Analysis for 2030s New Delhi, India: INCA & Ministry of Environment and Forests, Government of India
International Alert (2007)Dan Smith & Janani Vivekananda (eds.) (2007)
A Climate of Con fl ict: The links between climate change, peace and war International Alert
London, UK: International Alert
IPCC (2001)IPCC (2001)
Third Assessment Report: Climate Change 2001Geneva, Switzerland: GRID Arendal & Intergovernmental Panel on Climate
Change (IPCC)
http://www.grida.no/publications/other/ipcc%5Ftar/?src=/climate/ipcc_tar/wg1/412.htm
IPCC (2007)IPCC (2007)
Fourth Assessment Report: Climate Change 2007 (AR4)Geneva, Switzerland: GRID Arendal & Intergovernmental Panel on Climate Change
IPCC (2010)IPCC (2010)
The 4th Internat ional Public Procurement Conference Conference held in Seoul, South Korea, hosted by the Korean Public Procurement Service
http://www.ippa.org/
IRIN (2010)UN Of fice for the Coordination of Humanitarian Affairs
IRIN Global- Humanitar ian News and Analysis (2010)Retrieved October 2010: http://www.irinnews.org/
Islam & Mechler (2007)KMN Islam, and R. Mechler (2007)
ORCHID: Pilot ing Climate Risk Screening in DFID Bangladesh. An Economic and Cost Bene fi t Analysis of Adaptation Options.Sussex, UK: Institute of Development Studies, University of Sussex
Jackson (2010)Jeremy B. C. Jackson (2010)
The future of the oceans past
Philosophical Transactions of the Royal Society B: Biological Sciences, vol. 365, no.
1558, pp. 3765-3778.
Jamison et al. (2006)Dean T. Jamison, Joel G. Breman, Anthony R. Measham, George Alleyne, Mariam
Claeson, David B. Evans, Prabhat Jha, Anne Mills, Philip Musgrove (2006)
Priorities in Health New York, U.S.: Oxford University Press
Japan National Defence Academy (2010)Japan National Defence Academy (2010)
Numerical Simulation for Male’, Hulhule and Hulhumale’ Retrieved November 2010: www.nda.ac.jp/~fujima/maldives-pdf/contents/chapter4.pdf
Jetten et al. (1997)
J. A. Patz, W. J. Martens, D. A. Focks, and T. H. Jetten. (1997)Potential changes in the distribution of dengue transmission under climate warming
Am J Trop Med Hyg, vol. 57, pp. 285–297.
8/8/2019 Climate Vulnerability Monitor 2010: The State of the Climate Crisis
http://slidepdf.com/reader/full/climate-vulnerability-monitor-2010-the-state-of-the-climate-crisis 274/291
Khazai et al. (2007)Khazai, Bijan; Ingram, Jane C.; Saah, David S (2007)
The protective role of natural and engineered defence systems in coastal hazards San Leandro, US: Spatial Informatics Group, LLC
Literature Review Report, prepared for Kaulanani Urban and Community Forestry
Program of the Dept. of Land and Natural Resources, Division of Forestry and Wildlife
and the Forest Service, U.S. Dept. of Agriculture, September 2007, DRAFT EDITION
Knutson et al. (2010)Thomas R. Knutson, John l. Mcbride, Johnny Chan, Kerry Emanuel, Greg Holland, Chris
Landsea, Isaac Held, James P. Kossin, A. K. Srivastava and Masato Sugi (2010)
Tropical cyclones and climate change
Nature Geoscience, vol. 3, pp. 157-163
Kovats & Ebi (2006)Kovats, R. Sari & Ebi, Kristie L (2006)
Heatwaves and public health in Europe
European Journal of Public Health, vol. 16, no. 6, pp. 592–599
Kron (2009)W. Kron (2009)
Flood insurance: from clients to global financial markets
Journal of Flood Risk Management, vol 2, issue 1, pp.68-75
Lashof (1989)Daniel A. Lashof (1989)
The dynamic greenhouse: Feedback processes that may influence future
concentrations of atmospheric trace gases and climatic change
Climatic Change, vol. 14 (3), pp. 213-242
LDCF/NAPA (2007-2009)LDCF/NAPA (2007-2009)
Integrating climate change risks into community-based livestock management in the Northwestern Lowlands of Eritrea LDCF/UNDP Project
United Nations Development Programme, United Nations
Legget et al. (1992)Leggett J, Pepper W J and Swart R J, (1992)
Emissions scenarios for IPCC: an update
in: J T Houghton, B A Callander and S K Varney,
Climate Change 1992. The Supplementary Report to the IPCC Scienti fi c Assessment Cambridge, UK: Cambridge University Press
Lewis III (2001)Roy R. Lewis II I (2001)
Mangrove Restoration: Costs and Bene fi ts of Successful Ecological Restoration Rome, Italy: Food and Agriculture Organization of the United Nations (FAO),United Nations
Lipp et al. (2002)E. Lipp, A. Huq, R. Colwell (2002)
Effects of global climate on infectious disease: the cholera model
Clinical Microbiology Rev, vol. 15, pp. 757–70.
Martínez & Fernández (2008)Rodrigo Martínez and Andrés Fernández (2008)
The cost of hunger: Social and economic impact of child undernutrition in Central America and the Dominican Republic (Project Document)
Economic Commission for Latin America and the Carribean (ECLAC), United Nations
World Food Programme
Santiago, Chile: United Nations
McGranahan et al. (2007)
Gordon McGranahan, Deborah Balk and Bridget Anderson (2007)The rising tide: assessing the risks of climate change and human settlements in low
elevation coastal zones
Environment and Urbanization, vol. 19, no. 1, pp. 17-37
8/8/2019 Climate Vulnerability Monitor 2010: The State of the Climate Crisis
http://slidepdf.com/reader/full/climate-vulnerability-monitor-2010-the-state-of-the-climate-crisis 275/291
McMichael et al. (2006)Anthony J McMichael, Rosalie E Woodruff, Simon Hales (2006)
Climate change and human health: present and future risks
Lancet, vol. 367, pp. 859–69
Millennium Ecosystem Assessment (2005)
Millennium Ecosystem Assessment (2005)Millennium Assessment Report : Ecosystems and Human Well-Being Washington D.C., US: World Resources Institute
http://www.maweb.org/en/index.aspx
Mirza (2003)M. Monirul Qader Mirza (2003)
Climate Change and Extreme Weather Events: Can Developing Countries adapt?
Earth Scan
Climate Policy, vol. 3, no. 3, pp. 233-248(16)
Moberg et al. (2004)A. Moberg, K. Wibjörn et al. (2004)
Highly variable Northern Hemisphere temperatures reconstructed from low- and high-
resolution proxy data
Nature, vol. 433, pp. 613-617
Mohal, Kahn & Rahman (2007)Nasreen Mohal, Zahirul Haque Khan, Nazibur Rahman (2007)
Impact of Sea-level Rise on Coastal Rivers of Bangladesh (Presented at the River Symposium 2006)
Institute of Water Modelling (IWM)
http://www.riversymposium.com/2006/index.php?element=06MOHALNasreen
Moss et al. (2001)R. H. Moss, A. L. Brenkert, and E. L. Malone (2001)
Vulnerability to Climate Change: A Quantitat ive Approach Research Report Prepared for the U.S. Department of Energy (September 2001)
Richland, US: Pacific Northwest National Laboratory
Munich Re (2010)NatCatSERVICE/Munich Re (2010)
Statistics on natural catastrophes Retrieved: http://www.munichre.com/en/reinsurance/business/non-life/georisks/
natcatservice/default.aspx
NAPA, Bangladesh (2005)Priority project no. 10 Promotion of research on drought, fl ood and saline tolerant varieties of crops http://unfccc.int/files/adaptation/napas/application/pdf/01_bang_pp.pdf
NAPA, Benin (2008)Priority project no. 5 Protection of coastal areas against sea-level rise
http://unfccc.int/files/adaptation/application/pdf/coastal_marine_e.pdf
NAPA, Bhutan (2006)Priority project no. 6 Rainwater Harvesting http://unfccc.int/files/adaptation/napas/application/pdf/03_bhut_pp.pdf
NAPA, Bhutan (2006)Priority project no. 3 Weather Forecasting System to serve farmers and agriculture http://unfccc.int/files/adaptation/napas/application/pdf/03_bhut_pp.pdf
NAPA, Bhutan (2006)Priority project no. 7 GLOF Hazard Zoning (Pilot Scheme – Chamkhar Chu Basin)http://unfccc.int/files/adaptation/napas/application/pdf/03_bhut_pp.pdf
NAPA, Burundi (2007)Priority project no.7 Popularisation of short cycle and drought resistant food crops http://unfccc.int/files/adaptation/napas/application/pdf/05_burun_pp.pdf
8/8/2019 Climate Vulnerability Monitor 2010: The State of the Climate Crisis
http://slidepdf.com/reader/full/climate-vulnerability-monitor-2010-the-state-of-the-climate-crisis 276/291
NAPA, Burundi (2007)Priority project no. 9 Capacity building to promote energy-wood saving techniques http://unfccc.int/files/adaptation/napas/application/pdf/05_burun_pp.pdf
NAPA, Burundi (2007)Priority project no. 2 Rehabilitation of Degraded Areas
http://unfccc.int/files/adaptation/application/pdf/terrestrial_ecosyst.pdf
NAPA, Cambodia (2007)Priority project no 3G Rehabilitation of Coastal Protection Infrastructure http://unfccc.int/files/adaptation/napas/application/pdf/06_camb_pp.pdf
NAPA, Cambodia (2007)Priority project 4 Community Based Agricultural Soil Conservation in Srae Ambel
District, Koh Kong Province
http://unfccc.int/files/adaptation/napas/application/pdf/06_camb_pp.pdf
NAPA, CambodiaPriority project. No. 4b Community Mangrove Restoration and Sustainable Use of Natural Resource http://unfccc.int/files/adaptation/napas/application/pdf/06_camb_pp.pdf
NAPA, Cape Verde (2007)Priority project no. 3 Integrated Protection and Management of Coastal Zones http://unfccc.int/files/adaptation/application/pdf/coastal_marine_e.pdf
NAPA, Djibuti (2006)Priority project no. 7 Restoration of protected sites through the protection of coral reefs and mangrove vegetat ion http://unfccc.int/files/adaptation/napas/application/pdf/11_djib_pp.pdf
NAPA, Eritrea (2007)Priority project no.3 Encourage Afforestation and Agroforestry through Community Forestry Initiative http://unfccc.int/files/adaptation/napas/application/pdf/12_erit_pp.pdf
NAPA, Eritrea (2007)Priority project 4 Groundwater Recharge for Irrigation Wells http://unfccc.int/files/adaptation/napas/application/pdf/12_erit_pp.pdf
NAPA, Ethiopia (2008)Priority project no. 5 Community based sustainable utilization and management of wet lands in selected parts of Ethiopia http://unfccc.int/files/adaptation/application/pdf/terrestrial_ecosyst.pdf
NAPA, Gambia (2008)Priority project no. 9 Restorat ion/ Protection of Coastal Environments http://unfccc.int/files/adaptation/application/pdf/coastal_marine_e.pdf
NAPA, Guinea Bissau (2008)Priority project no. 3 Capacity building in Prevention and Protection of Mangrove Bolanhas against High-Tide Invasion Project http://unfccc.int/files/adaptation/napas/application/pdf/15_guineab_pp.pdf
NAPA, Kiribati (2007)Priority project no. 7 Coral monitoring, restoration and stock enhancement http://unfccc.int/files/adaptation/application/pdf/coastal_marine_e.pdf
NAPA, Mauritania (2004)Priority project no 4 Introduction of 50 electric Moto-Pumps in the valley http://unfccc.int/files/adaptation/napas/application/pdf/25_maur_pp.pdf
NAPA, Niger (2006)
Priority project no. 7 Water Control http://unfccc.int/files/adaptation/napas/application/pdf/27_nig_pp.pdf
8/8/2019 Climate Vulnerability Monitor 2010: The State of the Climate Crisis
http://slidepdf.com/reader/full/climate-vulnerability-monitor-2010-the-state-of-the-climate-crisis 277/291
NAPA, Rwanda (2007)Priority project no. 1 Lands conservation and protection against erosion and fl oods at districts level of vulnerable regions to climate change http://unfccc.int/files/adaptation/application/pdf/terrestrial_ecosyst.pdf
NAPA, Senegal (2006)
Priority project no. 2 Utilisation rationnelle de l’Eau: Projet 1: Revitalisation du réseau hydrographique des bas-fonds, mares temporaires et lacs arti fi ciels en appui au programme «bassins de rétention»; Projet 2: Promotion des techniques de goutte à goutte http://unfccc.int/files/adaptation/napas/application/pdf/31_sen_pp.pdf
NAPA, Sierra Leone (2008)Priority no. 7 Development of Irrigation and drainage systems for agricultural production in the Bombali District http://unfccc.int/files/adaptation/napas/application/pdf/32_sierral_pp.pdf
NAPA, The Democratic Republic of Congo (2006)Priority Project no. 3 Biodiversity conservation and restoration of Mangroves Marine Park http://unfccc.int/files/adaptation/napas/application/pdf/10_demorc_pp.pdf
NAPA, Tuvalu (2007)Priority project no.3 Adaptation to frequent water shortages through increasing household water capacity, water collection accessories, and water conservation techniques http://unfccc.int/resource/docs/napa/tuv01.pdf
NAPA, Tuvalu (2007)Priority project no.6 Strengthening Community Disaster Preparedness and Response Potential http://unfccc.int/files/adaptation/napas/application/pdf/35_tuv_pp.pdf
NAPA, Tuvalu (2007)Priority project no. 7 Adaptation to coastal shell fi sh fi sheries resources productivity http://unfccc.int/files/adaptation/application/pdf/coastal_marine_e.pdf
NAPA, Uganda (2007)Priority project no. 1 Tree Growing Project http://unfccc.int/files/adaptation/application/pdf/terrestrial_ecosyst.pdf
NAPA, Uganda (2007)Priority project no. 7 Vectors, Pests and Disease Control Project http://unfccc.int/files/adaptation/napas/application/pdf/36_ug_pp.pdf
NAPA, Vanuatu (2007)Priority project no. 3 Community based marine resource management programmes (modern & traditional aquaculture)http://unfccc.int/files/adaptation/application/pdf/coastal_marine_e.pdf
NASA (2002)NASA (2002)
Satellite image of "2002 African fi res" part of a presentation on NASA's world wind program Retrieved September 2010:
http://en.wikipedia.org/wiki/File:2002_african_fires_nasa.png
NASA (2010)NASA (2010)
GLOBAL Land-Ocean Temperature Index in 0.01 degrees Celsius -base period: 1951-1980 Retrieved October 2010:
http://data.giss.nasa.gov/gistemp/tabledata/GLB.Ts+dSST.txt
NASA Climate (2010)NASA (2010)Global Climate Change – Key Indicators Retrieved October 2010:
http://climate.nasa.gov/keyIndicators
8/8/2019 Climate Vulnerability Monitor 2010: The State of the Climate Crisis
http://slidepdf.com/reader/full/climate-vulnerability-monitor-2010-the-state-of-the-climate-crisis 278/291
NCDC NOAA (2009)National Climatic Data Center/NESDIS/NOAA (2009)
Precipitation Anomalies Jan-Dec 2009 Retrieved October 2010:
http://www.ncdc.noaa.gov/sotc/get-file.php?report=global&file=map-prcp&byear=20
09&bmonth=1&year=2009&month=12&thumbnail=true&ext=gif
NCDC NOAA (2010)National Climatic Data Center (2010)
Various resources Retrieved August-October 2010:
ftp://ftp.ncdc.noaa.gov/pub/data/anomalies/annual.land_ocean.90S.90N.df_1901-
2000mean.dat
Nelson et al. (2009)Gerald C. Nelson, Mark W. Rosegrant, Jawoo Koo, Richard Robertson, Timothy Sulser,
Tingju Zhu, Claudia Ringler, Siwa Msangi, Amanda Palazzo, Miroslav Batka, Marilia
Magalhaes, Rowena Valmonte-Santos, Mandy Ewing, and David Lee (eds.) (2009)
Food Policy Report: Climate Change -Impact on Agriculture and Costs of Adaptat ion Washington D.C., US: International Food Policy Research Institute (IFPRI)
NERI (2010)National Environmental Research Institute (NERI Denmark)
http://www.dmu.dk/international/
NHC (2010)US National Hurricane Center
Various resources Retrieved November 2010: www.nhc.noaa.gov
Nicholls & Tol. (2007)L. McFadden, R.J. Nicholls, and E.C. Penning-Rowsell (eds.) (2007)
Managing coastal vulnerability and climate change: a national to global perspective.
In: Managing Coastal Vulnerability: An Integrated Approach (pp. 221-240)
Amsterdam, the Netherlands: Elsevier Science
Nicholls et al. (2007)R. J. Nicholls, P.P. Wong, V.R. Burkett, J.O. Codignotto, J.E. Hay, R.F. McLean, S.
Ragoonaden and C.D. Woodroffe (2007)
Coastal Systems and Low-lying Areas. In: M.L. Parry, O.F. Canziani, J.P. Palutikof, P.J.
van der Linden and C.E. Hanson, (Eds.)
Climate Change 2007: Impacts, Adaptation and Vulnerability. Contribution of Working Group II to the Fourth Assessment Report of the Intergovernmental Panel on Climate Change (pp. 315-356)
Cambridge, UK: Cambridge University Press & IPCC
NSIDC (2010)National Snow and Ice Data Center (NSIDC) (2008, June)
Glaciers
Retrieved September 2010:http://nsidc.org/sotc/glacier_balance.html
OCHA (2010)United Nations Of fice for the Coordination of Humanitarian Affairs (OCHA) (2010)
Global Food Crisis – Confronting Challenges Retrieved September 2010:
http://ochaonline.un.org/NewsInFocus/GlobalFoodTrends/ConfrontingChallenges/
tabid/4456/language/en-US/Default.aspx
OECD (2008)OECD (2008)
Economic Aspects of Adaptation to Climate Change: Costs, Bene fi ts and Policy Instruments
Retrieved September 2010: http://www.oecd.org/env/cc/ecoadaptation
OECD (2010)OECD (2010)
OECD Factbook 2010: Economic, Environmental and Social Stat istics
8/8/2019 Climate Vulnerability Monitor 2010: The State of the Climate Crisis
http://slidepdf.com/reader/full/climate-vulnerability-monitor-2010-the-state-of-the-climate-crisis 279/291
Oreskes (2004)Naomi Oreskes (2004)
Beyond the Ivory Tower: The Scientific Consensus on Climate Change
Science, vol. 306, no. 5702, p. 1686
Oxfam America (2008)Oxfam America (2008)
Adaptat ion. How climate change hurts poor communities—and how we can help Briefing Paper, published 14 April
Boston, US.: Oxfam America
http://www.oxfamamerica.org/publications/adaptation-101/?searchterm=Adaptation101
Oxfam/Green Coast (2010)Oxfam/Green Coast (2010)
Best Practice Guidelines on Restoration of Mangroves in Tsunami Affected Areas Retrieved October 2010:
http://www.wetlands.org/LinkClick.aspx?fileticket=EaD3s%2bil5Mw%3d&tabid=56
Oxfam/Tearfund (2004)Courtenay Cabot Venton and Paul Venton/ Oxfam/Tearfund (2004)
Disaster preparedness programmes in India: A cost benefi t analysis, in: Cost bene fi t analysis for community based climate and disaster risk management: Synthesis report Humanitarian Practice Network, No. 49.
London, UK: Overseas Development Institute
Pantuliano & Pavanello (2009)Sara Pantuliano and Sara Pavanello (2009)
Taking drought into account: Addressing chronic vulnerability among pastoralists in the Horn of Africa Briefing paper-HPG Policy Briefs 35
http://www.odi.org.uk/resources/details.asp?id=3591&title=drought-livelihoods-
pastoralists-humanitarian
Parry et al. (2004)M.L. Parry, C. Rosenzweig, A. Iglesias, M. Livermore, G. Fisher (2004)
Effects of Climate Change on Global Food production under SRES emissions and
socio-economic scenarios
Global Environmental Change, vol. 14, pp. 53-67.
http://www.preventionweb.net/files/1090_foodproduction.pdf
Parry et al. (2007)M.L. Parry, O.F. Canziani, J.P. Palutikof, P.J. van der Linden and C.E. Hanson (eds)(2007)
Contribution of Working Group II to the Fourth Assessment Report of the Intergovernmental Panel on Climate Change Cambridge, UK: Cambridge University Press
Parry et al. (2009)M. Parry, N. Arnell, P. Berry, D. Dodman, S. Fankhauser,
C. Hope, S. Kovats, R. Nicholls, D. Satterthwaite, R. Tif fin, T. Wheeler (2009)Assessing the costs of adaptation to climate change. A review of the UNFCCC and other recent estimates London, UK: International Institute for Environment and
Development, and Grantham Institute for Climate Change
http://www.iied.org/pubs/pdfs/11501IIED.pdf
Peduzzi (2005)Pascal Peduzzi (2005)
Is climate change increasing the frequency of hazardous events?
Environment & Poverty Times, vol. 3, p.7
Special Edition for the World Conference on Disaster Reduction January 18-22, 2005,
Kobe, Japan
http://www.grid.unep.ch/product/publication/download/article_climate_change_hazards.pdf
8/8/2019 Climate Vulnerability Monitor 2010: The State of the Climate Crisis
http://slidepdf.com/reader/full/climate-vulnerability-monitor-2010-the-state-of-the-climate-crisis 280/291
Petit et al (1999)Petit et al. (1999)
Climate and Atmospheric History of the Past 420,000 years from the
Vostok Ice Core, Antarctica
Nature, vol. 399, pp.429-436
Pielke Jnr (2007)R. Pielke Jnr. (2007)
Hurricanes and IPCC Colorado, US: Center for Science and Technology Policy Research, University of
Colorado
http://cstpr.colorado.edu/prometheus/archives/climate_change/001105final_
chapter_hurri.html
PLACE (2010)CIESIN (2010)
PLACEII model - Population, Landscape, and Climate Estimates http://sedac.ciesin.columbia.edu/place/datasets.jsp
Plummer et al. (2003)Neil Plummer, Terry Allsopp, José Antonio Lopez (2003)
Guidelines on Climate Observation Networks and Systems Geneva, Switzerland: World Meteorological Organization
Provention ConsortiumProvention Consortium
http://www.proventionconsortium.org/?pageid=26
Rawls & Turnquist (2009)Carmen G. Rawls and Mark A. Turnquist (2009)
Pre-positioning of emergency supplies for disaster response Cornell, US: School of Civil and Environmental Engineering, Cornell University
Reacher et al. (2004)M. Reacher, K. McKenzie, C. Lane, et al. (2004)
Health impacts of flooding in Lewes: a comparison of reported gastrointestinal and
other illness and mental health in flooded and non-flooded households
Commun Dis Public Health, vol. 7, pp. 39–46.
Real Instituto Elcano (2009)Elena Lopez-Gunn (2009)
Spain, Water and Climate Change in COP 15 and Beyond: Aligning Mitigation and Adaptation through Innovation (WP)
WP 65/2009 - 24/12/2009
Real Instituto Elcano
Retrieved November 2010: h ttp://www.realinstitutoelcano.org/wps/portal/rielcano_
eng/Content?WCM_GLOBAL_CONTEXT=/elcano/elcano_in/zonas_in/dt65-2009
Relief Web (2009)Relief Web (2009)WFP positioning food in Afghanistan ahead of harsh winter Retrieved September 2010:
http://www.reliefweb.int/rw/rwb.nsf/db900SID/SNAA-7X7A2P?OpenDocument
&RSS20=18-P
Resources For the Future (RFF)Resources For the Future
Adapting to Climate Change - Global Adaptation Atlas (Database)
Retrieved September 2010:
http://www.rff.org/NEWS/CLIMATEADAPTATION/Pages/international_home.aspx
Reuters (2007)Reuters (2007. 5 October)
Dengue Fever epidemic hits Caribbean, Latin America Retrieved October 2010: http://www.reuters.com/article/idUSNA5209573
8/8/2019 Climate Vulnerability Monitor 2010: The State of the Climate Crisis
http://slidepdf.com/reader/full/climate-vulnerability-monitor-2010-the-state-of-the-climate-crisis 281/291
Rheingans et al. (2006)R.D. Rheingans,J. Heylen , C. Giaquinto (2006)
Economics of rotavirus gastroenteritis and vaccination in Europe: what makes sense?
Pediatr. Infect. Dis. J. , vol. 25 (1 Suppl.), pp. 48–55.
Richardson et al (2009)
K. Richardson et al. (2009)Synthesis Report – Climate Change: Global Risks, Challenges and Decisions Copenhagen, Denmark: University of Copenhagen
Robine et al. (2008)JM. Robine, SLK. Cheung , S. Le Roy, et al. (2008)
Death toll exceeded 70000 in Europe during the summer of 2003
C R Biol, vol.331, pp. 171-78
Rodell et al. (2009)Matthew Rodell, Isabella Velicogna, & James S. Famiglietti (2009)
Satellite-based estimates of groundwater depletion in India Matthew
Nature, vol. 460, pp. 999-1002
Rogers et al. (2000)Rogers, D.J., Randolph, S.E. (2000)
The global spread of malaria in a future, warmer world
Science, vol. 289, pp. 1763–66.
Sachs (2001)Jeffrey D. Sachs (2001)
Macroeconomics and Health: investing in health for Economic Development Commission on Macroeconomics and Health
Geneva, Switzerland: World Health Organization
Schmidt (2010)Silvio Schmidt (2010)
Economic losses from tropical cyclones in the USA- An assessment of the impact of climate change and socio-economic effects Approved Dissertation (May 2010)
Berlin, Germany: Fakultät VII – Wirtschaft und Management
der Technischen Universität Berlin
Schuur et al. (2008)Edward Schur et al. (2008)
Vulnerability of Permafrost Carbon to Climate Change: Implications for the Global
Carbon Cycle
Bioscience, vol. 58, no. 8
Scienceray (2010)Scienceray (2010, April) The Sahel – Case Study (Desertification Causes, Measures,
Consequences). Retrieved [November 2010]
http://scienceray.com/biology/ecology/the-sahel-case-study-deserti fication-causes-
measures-consequences/
SEISEI
WeAdapt and Wiki Adapt
www.weadapt.org
SEMARENA (2009)Secretaría de Estado de Medio Ambiente y Recursos Naturales (SEMARENA)
and UNDP (2009)
Proyecto Cambio Climático - Segunda Comunicación Nacional Santo Domingo, República Dominicana: SEMARENA/PNUD/FMAM/UNDP
START
System for Analysis, Research & Training (START)ACCA -Advancing capacity to Support Climate Change Adaptation Retrieved October 2010:
http://start.org/programs/accca
8/8/2019 Climate Vulnerability Monitor 2010: The State of the Climate Crisis
http://slidepdf.com/reader/full/climate-vulnerability-monitor-2010-the-state-of-the-climate-crisis 282/291
Stefanski et al. (2007)Robert Stefanski, T. Rusakova, Z.Shostak, E.Zoidze, Simone Orlandini, and Nick
Holden (2007)
Applications of Meteorology to Agriculture,
in: WMO/ CAgM Guide to Agricultural Meteorological Practices (GAMP)Geneva, Switzerland: World Meteorological Organization
Stern (2006)Nicholas Stern (2006)
Stern Review on the Economics of Climate Change HM Treasury
London, UK: Cambridge University Press
Stewart et al. (2003)Mark G. Stewart, David V. Rosowsky, and Zhigang Huang (2003)
Hurricane risks and economic variability of strengthened construction
Natural Hazards Review, vol. 4, pp. 12-19
Sukhdev et. al (2008)Pavan Sukhdev et. al (2008)
The Economics of Ecosystems and Biodiversity. An interim Report European Communities
Cambridge, UK: Banson
Tanser et al. (2003)F. Tanser, BL. Sharp, D. Le Sueur (2003)
Potential effect of climate change on malaria transmission in Africa
Lancet, vol. 362, pp. 1792–98.
Tett et al.(1997 )S.F.B. Tett, T.C. Johns, J.F.B Mitchell (1997)
Global and regional variability in a coupled AOGCM
Climate Dynamics, vol. 13, pp. 303–323.
The Boston Globe (2010)The Boston Globe (2010) The Great Hurricane of 1938.Retrieved November 2010:
http://www.boston.com/news/globe/magazine/galleries/2005/0724/hurricane1938?pg=4
The Royal Society (2005)The Royal Society (2005)
A guide to facts and fi ctions about climate change Retrieved October 2010:
http://royalsociety.org/uploadedFiles/Royal_Society_Content/News_and_Issues/
Science_Issues/Climate_change/climate_facts_and_fictions.pdf
Tierney et al. (2008)Jessica E. Tierney, James M. Russell, Yongsong Huang, Jaap S. Sinninghe Damsté,
Ellen C. Hopmans, Andrew S. Cohen (2008)
Northern Hemisphere Controls on Tropical Southeast African Climate During the Past60,000 Years
Science, vol. 322, no. 5899, pp. 252-255
Tol (2002)Richard Tol (2002)
New Estimates of the Damage Costs of Climate Change, Part I: Benchmark Estimates,
and Part II: Dynamic Estimate
Environmental and Resource Economics, vol. 21 (1), pp. 47-73 & 135-60.
Toth et al. (2005)Ferenc L. Toth, Eva Hizsnyik, Jacob Park, Kathryn Saterson, Andrew Stott
(2005) Policy Synthesis for Stakeholders
in: Douglas Beard, Danielle Deane, Claudia Ringler, Detlef van Vuuren, Wang Rusong,
Antonio La Vina, Mohan Munasinghe, Otton Solis (Eds.)Millennium Assessment Report: Ecosystems and Human Well-Being (chap. 14)
Millennium Ecosystem Assessment
Washington D.C., US: World Resources Institute
8/8/2019 Climate Vulnerability Monitor 2010: The State of the Climate Crisis
http://slidepdf.com/reader/full/climate-vulnerability-monitor-2010-the-state-of-the-climate-crisis 283/291
U.S. Bureau of Reclamation (1999)U.S. Bureau of Reclamation (1999)
Integrated system for agricultural drainage management on irrigated farmland Retrieved September 2010:
http://www.calwater.ca.gov/Admin_Record/D-042807.pdf
U.S. Environmental Protection Agency (2006)U.S. Environmental Protection Agency (2006)
Excessive Heat Events Guidebook Washington D.C., US: US Environmental Protection Agency
UN (2006)UN (2006)
UN Global Survey on Early Warning Systems. An assessment of capacities, gaps and opportunities toward building a comprehensive global early warning system for all natural hazards United Nations in cooperation with ISDR Platform for the Promotion of Early Warning (PPEW)
UN (2009a)UN (2009)
World Water Development Report. Water in a Changing World (3rd eds.)
United Nations Educational Scientific and Cultural Organization (UNESCO), United
Nations
UN (2009b)UN (2009)
Global Assessment Report on Disaster Risk Reduction United Nations International Strategy for Disaster Risk Reduction (UNISDR), United Nations
UN (2010)UN (2010)
Population forecast : World Population Prospect: The 2008 Revision (Database)
United Nations
Retrieved: http://esa.un.org/unpp/index.asp?panel=1
UN StatisticsUN
Statistical Databases United Nations Statistics Division, United Nations
Retrieved: http://unstats.un.org/unsd/default.htm
UNCCD & Joint Liaison Group of the Rio Conventions (2007 )UNCCD & Joint Liaison Group of the Rio Conventions (2007)
Forests - Climate Change, Biodiversity and Land Degradation Joint Liaison Group of the Rio Conventions, United Nations Secretariat of the
Convention to Combat Desertification (UNCCD), and United Nations Framework
Convention on Climate Change (UNFCCC), United Nations
http://www.unccd.int/publicinfo/factsheets/pdf/forest_eng.pdf
UNCCD (2004)Wim G. Sombroed, El Hadji M. Sene (2004)
Degradation of Rainfed Agricultural Land, Irrigated Agricultural Land , Ranching and
Traditional Pastoral Lands, and Forest Lands, in:
Causes, general extent and physical consequences of land degradation in arid, semi- arid and dry sub-humid areas United Nations Secretariat of the Convention to Combat Desertification
(UNCCD), United Nations
Retrieved September 2010:
http://www.unccd.int/knowledge/INCDinfoSeg/partii.php)
UNCCD (2009)UNCCD (2009)
Discussion Paper: UNCCD Policy Brief on Migration
United Nations Secretariat of the Convention to Combat Desertification (UNCCD),United Nations
8/8/2019 Climate Vulnerability Monitor 2010: The State of the Climate Crisis
http://slidepdf.com/reader/full/climate-vulnerability-monitor-2010-the-state-of-the-climate-crisis 284/291
UNCCD Policy Brief (2009)UNCCD (2009)
Land: A tool for climate change adaptation (Policy Brief)United Nations Secretariat of the Convention to Combat Desertification (UNCCD),
United Nations
http://www.unccd.int/knowledge/docs/UNCCDPolicyBrief-Adaptation-final.pdf
UNDP (2007)UNDP (2007)
Human Development Report 2007/ 2008. Fighting Climate Change: Human Solidarit y in a Divided World United Nations Development Programme (UNDP), United Nations
UNDP (2008)UNDP (2008)
Empowered and Equal: Gender Equality Strategy 2008-2011New York, US: United Nations Development Programme (UNDP), Bureau for
Development Policy, United Nations
UNDP (2009)UNDP (2009)
Human Development Report 2009 – 20th Anniversary. The Real Wealth of Nations: Pathways to Human Development.New York, US: United Nations Development Programme (UNDP), United Nations
UNDP (2010)UNDP (2010) The Mil lennium Development Goals Report
UNDP/ALMUNDP
Adaptat ion Learning Mechanism (ALM)New York, US: United Nations Development Programme (UNDP), United Nations
Retrieved September 2010: www.adaptationlearning.net
UNDP/NAPA, Bangladesh (2005)UNDP (2005)
National Adaptation Programme of Action – Bangladesh. Final Report Ministry of Environment and Forest Government of the People’s Republic of
Bangladesh, United Nations Development Programme (UNDP), United Nations
http://unfccc.int/resource/docs/napa/ban01.pdf
UNEP (2002)UNEP (2002)
State of the Environment and Policy Retrospective: 1972-2002
Global Environment Outlook 3 (GEO 3)New York, US: United Nations Environment Programme (UNEP), United Nations
UNEP (2009)Richard Munang, Jian Liu and Ibrahim Thiaw (eds.) (2009)
The Role of Ecosystem Management in Climate Change Adaptation and DisasterRisk Reduction
UNEP Copenhagen Discussion Series New York, US: United Nations Environment Programme (UNEP), United Nations
UNEP (2010)UNEP (2010)
Biodiversity and Human Well-being: Facts and Figures New York, US: United Nations Environment Programme (UNEP), United Nations
Retrieved: http://www.unep.org/iyb/IBD_2010_facts.asp
UNESCO (2009)UNESCO (2009)
Best Practice Guidelines for Structural Measures and Flood Proo fi ng
The Mekong River Commission Secretariat United Nations Educational Scientific and Cultural Organization (UNESCO), United Nations
8/8/2019 Climate Vulnerability Monitor 2010: The State of the Climate Crisis
http://slidepdf.com/reader/full/climate-vulnerability-monitor-2010-the-state-of-the-climate-crisis 285/291
UNFCCCUNFCCC
National Adaptation Programmes of Action (NAPAs)United Nations Framework Convention on Climate Change (UNFCCC), United Nations
Retrieved September 2010: https://unfccc.int/cooperation_support/least_
developed_countries_portal/napa_priorities_database/items/4583.php
UNFCCC (2003)UNFCCC (2003)
Denmark’s Fourth National Communication on Climate Change Danish Ministry of the Environment and the United Nations Framework Convention on
Climate Change (UNFCCC), United Nations
UNFCCC (2009)UNFCCC (2009)
Least Developed Countries Step by Step Guide for implementing national adaptat ion programmes of action United Nations Framework Convention on Climate Change (UNFCCC), United Nations
UNFCCC LDC Expert Group & GEF (2009)UNFCCC LDC Expert Group & GEF (2009)
Step-by-step Guide for Implementing National Adaptat ion Programmes of Action Global Environment Facility (GEF), United Nations Framework Convention on Climate
Change (UNFCCC), United Nations
UNFCCC WebsiteUNFCCC
Various resources http://unfccc.int
UNISDR (2004)UNISDR (2004)
Emerging Trends in hazards, vulnerability patterns and the impact of disasters, in:
Living With Risk – A Global Review of Disaster Reduction Initiat ives (section 2)
United Nations International Strategy for Disaster Reduction, United Nations
UNISDR (2005-2015)UNISDR (2005)
Hyogo Framework for Action (HFA) 2005-2015: Building the resilience of nations and communities to disasters United Nations International Strategy for Disaster Reduction (UNISDR), United Nations
UNISDR (2007)UNISDR (2007)
Guidelines for implementing the Hyogo framework United Nations International Strategy for Disaster Reduction (UNISDR), United Nations
USAID/NASAUnited States Agency for International Development (USAID)
SERVIR (Regional Visualization and Monitoring System)Cathalac, Group on Earth Observations, NASA
www.servir.net/
Vafeidist et al. (2008)Athanasios T. Vafeidist, Robert J. Nichol Wst, Loraine McFadden &, Richard S.J. Toltt, Jochen
HinkeW , Tom Spencer, Poul S. Grashofft, Gerben Boot, and Richard J.T. Klein (2008)
New Global Coastal Database for Impact and Vulnerability Analysis to Sea-Level Rise
Journal of Coastal Research, vol. 24, no. 4, pp. 917-924.
Vermeer & Rahmstorf (2009)Martin Vermeer and Stefan Rahmstorf (2009)
Global sea-level linked to global temperature Edited by William C. Clark, Harvard University, Cambridge, MA, and approved October
26, 2009 (received for review July 15, 2009)Helsinki, Finland & Potsdam, Germany: Department of Surveying, Helsinki University
of Technology, and Potsdam Institute for Climate Impact Research
8/8/2019 Climate Vulnerability Monitor 2010: The State of the Climate Crisis
http://slidepdf.com/reader/full/climate-vulnerability-monitor-2010-the-state-of-the-climate-crisis 286/291
Waithaka et al. (2010)Jonathan Makau Nzuma, Michael Waithaka, Richard Mbithi Mulwa, Miriam Kyotalimye,
Gerald Nelson (2010)
Adapting to Climate Change in Sub-Saharan Africa - Strategies for adapting to climate change in rural Sub-Saharan Africa IFPRI Discussion Paper, 1013, July
International Food Policy Research Institute
Washington Post (2010)Washington Post (2010, August 15) In the Russian wild fi res, will Putin get burned?.Retrieved November 2010:
http://www.washingtonpost.com/wp-dyn/content/article/2010/08/13/
AR2010081302642.html
Watkiss et al. (2005)Paul Watkiss, Tom Downing, Claire Handley, Ruth Butterfield (2005)
The Impacts and Costs of Climate Change Prepared as task 1 of the project: Modelling support for Future Actions – Benefi ts and
Cost of Climate Change Policies and Measures
Final Report published September 2005
Brussels, Belgium: European Commission DG Environment
Welker (2009)Lauren Welker(2009)
The Desert i fi cation of the Gobi Desert and Its Effect on Beijing Texas, US: The University of Texas at Austin, Department of Geological Sciences
Retrieved September 2010:
http://www.geo.utexas.edu/courses/371c/project/2009/Welker_Desertification.pdf
WFP (2010)World Food Programme (2010, 13 April)
Haiti: Bracing for the Hurricane Season Retrieved September 2010:
http://www.wfp.org/stories/haiti-bracing-hurricane-season
WHO (2002)WHO (2002)
The World Health Report 2002. Reducing Risks, Promoting Healthy Life Geneva, Switzerland: World Health Organization
WHO (2003)D. Campbell-Lendrum, A. Pruss-Ustun, C. Corvalan (2003)
How much disease could climate change cause?
In: AJ. McMichael, D. Campbell-Lendrum, C. Corvalan, K.L. Ebi, AK. Githeko, JS.
Scheraga (eds.) Climate change and health: risks and responses (pp. 133–155)
Geneva, Switzerland: World Health Organization
WHO (2004)AJ. McMichael, D. Campbell–Lendrum, S. Kovats, et al. (2004), Comparative
quantification of health risks: global and regional burden of disease due to selectedmajor risk factors. In: M. Ezzati, A.D. Lopez, A. Rodgers, C. Mathers (eds.) Climate Change (pp. 1543–649).
Geneva, Switzerland: World Health Organization
WHO (2006a)Sergio Spinaci, Louis Currat, Padma Shetty, Valerie Crowell, Jenni Kehler (2006)
Tough Choices: Investing in Health for Development. Experiences from national follow- up to the Commission on Macroeconomics and Health Geneva, Switzerland: World Health Organization
http://www.who.int/macrohealth/documents/tough_choices/en/index.html
WHO (2006b)WHO (2006)
Guidelines for testing -Mosquito adulticides for indoor residual spraying and treatment of mosquito nets. Control of Neglected Tropical Diseases WHO Pesticide Evaluation Scheme Geneva, Switzerland: World Health Organization
http://whqlibdoc.who.int/hq/2006/WHO_CDS_NTD_WHOPES_GCDPP_2006.3_eng.pdf
8/8/2019 Climate Vulnerability Monitor 2010: The State of the Climate Crisis
http://slidepdf.com/reader/full/climate-vulnerability-monitor-2010-the-state-of-the-climate-crisis 287/291
WHO (2009)WHO (2009)
Global Burden of Disease Data, 2009-data retrieved from:
The Global Health Observatory (GHO)http://apps.who.int/ghodata/#”
WHO (2010)WHO (2010)
Lucien Manga, Magaran Bagayoko, Tim Meredith and Maria Neira
Overview of health considerations within National Adaptat ion Programmes of Action for climate change in least developed countries and small island states Geneva, Switzerland: World Health Organization
Retrieved September 2010:
http://www.who.int/phe/Health_in_NAPAs_final.pdf
WHO Burden of Diseases Database (2010)WHO (2010)
Global Burden of Disease Data, 2010-data retrieved from:
The Global Health Observatory (GHO)http://apps.who.int/ghodata/#
WMOWorld Meteorological Organization
http://worldweather.wmo.int/
Woodward et al. (2000)A. Woodward, A.Hales, S., Litidamu, N., Phillips, D., Martin, J. (2000)
Protecting human health in a changing world: the role of social and
economic development
Bull World Health Organ, vol. 78, pp. 1148–55.
World Bank (1996)World Bank (1996)
Handbook On Economic Analysis Of Investment Operations Operations Policy Department
Washington D.C., US: World Bank
http://rru.worldbank.org/Documents/Toolkits/Highways/pdf/82.pdf
World Bank (2005)World Bank (2005)
Bolivia Urban Infrastructure for the Poor Project Concept Sheet submitted 2006
http://www-wds.worldbank.org/servlet/WDSContentServer/WDSP/I
B/2005/08/16/000104615_20050916135737/Rendered/INDEX/
Integrated0Saf1heet010Concept0Stage.txt
World Bank (2008)Debarati Guha-Sapir and Regina Below (2008)
The quality and accuracy of disaster data: a comparative analysis of three global datasets WHO Centre for Research on the Epidemiology of Disasters, published for the
ProVention Consortium
The Disaster Management Facility, World Bank
World Bank (2009)World Bank (2009)
Philippines: Typhoons Ondoy and Pepeng: Post Disaster Needs Assessment Washington D.C., US: World Bank
http://siteresources.worldbank.org/INTPHILIPPINES/Resources/
PDNAVol1MainReport.pdf
World Bank (2010a)World Bank (2010)
World Development Report 2010: Climate and Development.Washington D.C., US: The International Bank for Reconstruction and Development /
The World Bank
http://go.worldbank.org/ZXULQ9SCC0
8/8/2019 Climate Vulnerability Monitor 2010: The State of the Climate Crisis
http://slidepdf.com/reader/full/climate-vulnerability-monitor-2010-the-state-of-the-climate-crisis 288/291
World Bank (2010b)World Bank (2010)
Data on historic population and GDP fi gures: World DataBank Retrieved August-October 2010:
http://data.worldbank.org/indicator
World Bank Development Research Group (2010)World Bank Development Research Group (2010)
Susmita Dasgupta, Mainul Huq, Zahirul Huq Khan, Manjur Murshed, Zahid Ahmed,
Nandan Mukherjee, Malik Fida Khan, Kiran Pandey (eds.)
Vulnerability of Bangladesh to Cyclones in a Changing Climate – Potential Damages
and Adaptation Cost
Policy Research Working Paper 5280 Geneva, Switzerland: World Bank Development Research Group, Environment and
Energy Team
World Resources InstituteWorld Resources Institute
Where are the World’s drylands? Retrieved September 2010:
http://www.wri.org/publication/content/8236
World Resources Institute (2005)World Resources Institute (2005)
Millennium Ecosystem Assessment 2005. Ecosystems and Human Well-being: Deserti fi cation Synthesis Washington D.C., US: World Resources Institute
WRI/CAITWorld Resources Institute
Climate Analysis Indicators Tool (CAIT)Retrieved August-September 2010:
http://cait.wri.org
WWFWorld Wildlife Foundation (WWF)
Climate Data Sections Retrieved August-October 2010:
http://www.worldwildlife.org/climate/
Zimov et al. (2006)Sergey Zimov, Edward Schuur, and F. Stuart Chapin (2006)
Climate Change: Permafrost and the Global Carbon Budget
Science, vol. 312, no. 5780, pp. 1612 – 1613

8/8/2019 Climate Vulnerability Monitor 2010: The State of the Climate Crisis
http://slidepdf.com/reader/full/climate-vulnerability-monitor-2010-the-state-of-the-climate-crisis 289/291

8/8/2019 Climate Vulnerability Monitor 2010: The State of the Climate Crisis
http://slidepdf.com/reader/full/climate-vulnerability-monitor-2010-the-state-of-the-climate-crisis 290/291
8/8/2019 Climate Vulnerability Monitor 2010: The State of the Climate Crisis
http://slidepdf.com/reader/full/climate-vulnerability-monitor-2010-the-state-of-the-climate-crisis 291/291