climatic turning point for beech and oak under climate
TRANSCRIPT
HAL Id: hal-00991411https://hal.archives-ouvertes.fr/hal-00991411
Submitted on 15 May 2014
HAL is a multi-disciplinary open accessarchive for the deposit and dissemination of sci-entific research documents, whether they are pub-lished or not. The documents may come fromteaching and research institutions in France orabroad, or from public or private research centers.
L’archive ouverte pluridisciplinaire HAL, estdestinée au dépôt et à la diffusion de documentsscientifiques de niveau recherche, publiés ou non,émanant des établissements d’enseignement et derecherche français ou étrangers, des laboratoirespublics ou privés.
Climatic turning point for beech and oak under climatechange in Central Europe
T. Mette, K. Dolos, C. Meinardus, A. Bräuning, B. Reineking, M. Blaschke,H. Pretzche, C. Beierkuhnlein, A. Gohlke, C. Wellstein
To cite this version:T. Mette, K. Dolos, C. Meinardus, A. Bräuning, B. Reineking, et al.. Climatic turning point for beechand oak under climate change in Central Europe. Ecosphere, 2013, 4 (12), 19 p. �10.1890/ES13-00115.1�. �hal-00991411�

Climatic turning point for beech and oakunder climate change in Central Europe
TOBIAS METTE,1 KLARA DOLOS,2,3 CATHRIN MEINARDUS,4 ACHIM BRAUNING,4 BJORN REINEKING,2,5
MARKUS BLASCHKE,6 HANS PRETZSCH,1 CARL BEIERKUHNLEIN,7 ANDREAS GOHLKE,7 AND CAMILLA WELLSTEIN7,8,�
1Forest Yield Science, Technical University of Munich (TUM), Freising 85354 Germany2Biogeographical Modelling, BayCEER, University of Bayreuth, Bayreuth 95440 Germany
3Institute of Geography and Geoecology, Karlsruhe Institute of Technology (KIT), Karlsruhe 76128 Germany4Institute of Geography, University of Erlangen-Nuremberg, Erlangen 91054 Germany
5UR EMGR Ecosystemes Montagnards, St-Martin-d’Heres 38402 France6Bavarian State Institute of Forestry, Freising 85354 Germany
7Biogeography, BayCEER, University of Bayreuth, Bayreuth 95440 Germany8Faculty of Science and Technology, Free University of Bozen–Bolzano, Bozen 39100 Italy
Citation: Mette, T., K. Dolos, C. Meinardus, A. Brauning, B. Reineking, M. Blaschke, H. Pretzsch, C. Beierkuhnlein, A.
Gohlke, and C. Wellstein. 2013. Climatic turning point for beech and oak under climate change in Central Europe.
Ecosphere 4(12):145. http://dx.doi.org/10.1890/ES13-00115.1
Abstract. The growth behavior of coexisting tree species under climate change is important from an
ecological, silvicultural and economic perspective. While many previous studies are concerned with
climatic limits for species occurrence, we focus on climate related shifts in interspecific competition. A
landmark for these changes in competition is the ‘climatic turning point’ (CTP): those climate conditions
under which a rank reversal between key tree species occurs. Here, we used a common type of temperate
mixed forest in Central Europe with European beech (Fagus sylvatica L.) and sessile oak (Quercus petraea
(Matt.) Liebl.) to explore the CTP under a future climate projection of increasing temperature and aridity.
We selected a dry region where the prerequisite of differential climate sensitivity in mixed beech-oak
forests was fulfilled: In-situ dendrochronological analyses demonstrated that the currently more
competitive beech was more drought sensitive than sessile oak. We then used two complementary forest
growth models, namely SILVA and LandClim, to investigate the climate induced rank-reversal in species
dominance and to quantify it as the CTP from beech to oak by simulating future forest development from
the WETTREG 2010 A1B climate projection. Utilizing two models allowed us to draw conclusions robust
against the assumptions of a particular model. Both models projected a CTP at a mean annual temperature
of 11–128C (July temperature .188C) and a precipitation sum of 500–530 mm. However, the change in tree
species composition can exhibit a time-lag of several decades depending on past stand development and
current stand structure. We conclude that the climatic turning point is a simple yet effective reference
measure to study climate related changes in interspecific competition, and confirm the importance of
competition sensitivity in climate change modeling.
Key words: climatic turning point; competitiveness; drought; Fagus sylvatica; forest growth models; LandClim; mixed
forest; Quercus petraea; SILVA; species rank reversal; tree coexistence; tree-ring analysis.
Received 1 April 2013; revised 4 September 2013; accepted 5 September 2013; final version received 22 October 2013;
published 3 December 2013. Corresponding Editor: C. Kwit.
Copyright: � 2013 Mette et al. This is an open-access article distributed under the terms of the Creative Commons
Attribution License, which permits unrestricted use, distribution, and reproduction in any medium, provided the
original author and source are credited. http://creativecommons.org/licenses/by/3.0/
� E-mail: [email protected]
v www.esajournals.org 1 December 2013 v Volume 4(12) v Article 145

INTRODUCTION
Climatic extremes are increasing in intensityand frequency and their effect on global forestbiomes are of particular interest to forest scienc-es. Precursors of a future climate posing a driergrowing season (Schar et al. 2004, Barriopedro etal. 2011, IPCC 2012) are seen already today asmain causes of changes in tree growth, tree deathand even diebacks in temperate forests aroundthe world (Gitlin et al. 2006, van Mantgem andStephenson 2007, Worrall et al. 2008, Rehfeldt etal. 2009). Especially for mixed species forestry—one of the epitomes of climate change riskmitigation—such changes in the species’ growthbehavior are most important from an ecological,silvicultural and economic perspective, and mayprecede the decline of less drought-adaptedspecies with severe ecological consequences(Carnicer et al. 2011, Hanewinkel et al. 2012).
In this study we investigate the ‘climaticturning point’ (CTP) as a measure for climaterelated changes in interspecific competition.Although the term has been used in some othercontexts, here we define it as those climaticconditions under which a rank reversal betweenkey tree species occurs with respect to theirbiomass or basal area share. So far, the concept ofrank reversal has been applied to the establish-ment phase of tree species in relation to lightconditions (Baltzer and Thomas 2007, Beaudet etal. 2007, Osada 2012) or to compare ontogeneticgrowth patterns (Boyden et al. 2009, Perez-Ramos et al. 2012). Here, we focus on howchanging climate alters species performance andthereby induces a rank reversal at the stand level.Sanchez-Gomez et al. (2008) and Gomez-Apar-icio et al. (2011) projected climate-inducedspecies rank reversals for tree species in mixedforests of Spain using statistical spatially explicitneighborhood models parameterized from Na-tional Forest Inventory data. Yet, there is no clearpicture of the competitive response of trees alonga climatic gradient of increasing temperature andaridity. Models like climatic species distributionmodels (SDMs) (e.g., Araujo and Guisan 2006,Morin et al. 2008, Czucz et al. 2011) may bestrong on species’ climatic demands but they areusually not able to represent strongly size-structured population dynamics that determinespecies balances. Yet, a change of the dominant
tree species, even if the formerly dominantspecies is still present in the understorey, hasgreat impact on the ecosystem and changesconditions for organisms at all trophic levels(Chapin 2003, Ellison et al. 2005). The search forthe CTP aims at finding the point in the gradientof a possible future climate where such rankreversals in mixed forests occur.
Identifying the CTP is not trivial due to thecomplexity in tree species’ climate-growth con-trol, competition for light and the interactionwith ontogenetic growth behavior. Particularly inlong-lived ecosystems dominated by species withlong generation periods, the slow and gradualresponse of forest structure and species compo-sition to the changing climate might remainunnoticed. The two reasons are, first, the persis-tence of adult trees and, second, that the species’regeneration success takes effect only in thefollowing generation (Sykes and Prentice 1996,Soja et al. 2007, Johnstone et al. 2010, Temperli etal. 2012). Clearly, the response of a forest tochanging climate conditions cannot simply beprojected by means of extrapolating regressionfunctions or searching climate analogies (Fuhreret al. 2006, Williams and Jackson 2007).
Here we apply the general concept of aclimatic turning point to the particular case ofmixed stands of European beech (Fagus sylvaticaL.) and sessile oak (Quercus petraea (Matt.) Liebl.).We employ an approach based on in-situ data ontree and stand growth under past and presentclimate in combination with two climate-sensi-tive dynamic forest simulation models. Thisforest type is of considerable relevance, andgrows mainly on climatic and edaphically drysites in Central Europe. Among the two species,beech is typically dominant, and the light-demanding oak can only compete under lessfavorable abiotic conditions than beech (i.e.,warm and relatively dry sites, or wet and clayeysoils or if oak is favored by silviculture).Ellenberg (2009) suggest that oak becomes morecompetitive than beech at July-temperatures.188C and precipitation ,600 mm/yr. For thechosen stands the present climate was alreadyclose to the above-mentioned limits, and climatechange scenarios of higher magnitude such as theWETTREG 2010 A1B (Kreienkamp et al. 2009)project an even stronger summer aridity in thatregion. Under such conditions, both species can
v www.esajournals.org 2 December 2013 v Volume 4(12) v Article 145
METTE ET AL.

be expected to experience a loss in productivity(Leuschner et al. 2001, Lebourgeois et al. 2005,Jump et al. 2006, Piovesan et al. 2008) and mightbe even prone to dieback (Breda et al. 2006,Michelot et al. 2012). Yet, oak is considered tosuffer less than beech due to a higher capabilityto resist adverse climatic conditions or to recoverbetter after climatic extreme events (Peterken andMountford 1996). Under drought, beech appar-ently down-regulates its photosynthesis earlierthan sessile oak to avoid cavitation (Leuschner etal. 2001, Raftoyannis and Radoglou 2002, Bredaet al. 2006). Therefore, we expected a CTP at thestudy site under climate change. We furtherargue that a CTP will depend on the past standdevelopment: Past climate conditions and forestmanagement have shaped the stand structureand species composition. This might cause atime-delayed and gradual response in long-livedecosystems with a slow generation turnover(Sykes and Prentice 1996, Temperli et al. 2012).
For the forest growth simulators we chooseSILVA (Pretzsch et al. 2002) and LandClim(Schumacher and Bugmann 2006, Schumacheret al. 2006). Although the models were devel-oped for different purposes, both have incommon that they operate on the individual treelevel—which allows changes in structural com-petition to be reproduced. In-situ data fromrepeated forest surveys and tree-ring analysis
were used to assess current tree growth andensure the validity of the forest models. Themodels were then used to project the forestdevelopment under climate change.
With this combination of empirical evidenceand modeling we investigate the following twohypotheses: (1) Projected future climate passes aclimatic turning point where a rank reversal inthe species’ dominance occurs and (2) the rankreversal exhibits a time lag due to the legacy ofpast stand development.
MATERIALS AND METHODS
Study site and current standsThe studied beech-oak forest stands were
located in southeastern Germany on the ‘Franco-nian plateau’ at an altitude of 300–400 m asl. Weused four sites of different stand age whichbelong to the Bavarian long-term experimentalplot network, and a fifth site that is part of theforest reserve of the Bavarian state forest instituteLWF (Table 1). The study sites belonging to theexperimental plot network were installed in 1995and surveyed in 1995 and 2005. The sites wereeven-aged and ranged from 27–106 years withmerchantable wood volumes of 233–323 m3/ha in1995. The basal area ratios of oak:beech:otherspecies ranged from 25:67:7 to 56:40:4, withhornbeam (Carpinus betulus L.), lime (Tilia cordata
Table 1. Stand parameters from surveys of the studied beech-oak stands near Schweinfurt by initial stand age,
site, and survey year. Exp. ¼ Experimental plot, N ¼ Stem number per hectare, H100 ¼ Upper canopy/ top
height, G¼Basal area, V¼Merchantable wood volume, dg¼Root of mean square diameter, B¼Aboveground
biomass (Schroeder et al. 1997).
SiteSurveyyear
All tree species Beech Oak Other
N(ha�1)
H100(m)
G(m2/ha)
V(m3/ha)
B(t/ha)
dg(cm)
G(m2/ha)
dg(cm)
G(m2/ha)
dg(cm)
G(m2/ha)
27 yearsExp. 1995 3160 15.7 25.2 143.6 536 11.4 6.4 9.6 17.0 11.3 1.8Exp. 2005 1751 19.9 28.4 233.2 824 15.1 9.1 14.3 18.0 11.4 1.3
54 yearsExp. 1995 1935 22.1 34.4 311.4 715 15.7 15.2 19.1 9.9 12.1 9.3Exp. 2005 1384 25.2 40.7 449.3 778 20.4 19.3 22.5 12.1 15.6 9.3
86 yearsExp. 1995 1149 24.3 30.1 316.8 561 15.4 11.2 22.7 15.4 16.3 3.5Exp. 2005 1037 26.8 36.9 443.2 636 18.5 14.2 25.7 18.8 18.6 3.9
106 yearsExp. 1995 676 27.8 25.7 323.3 422 18.8 14.4 30.9 10.4 24.9 0.9Exp. 2005 615 30.4 30.5 425.7 485 21.4 16.6 34.9 12.8 27.1 1.1
105 yearsReserve 1978 723 25.8 30.4 355.1 472 27.2 12.9 35.6 6.4 18.0 11.1Reserve 1996 531 30.5 37.0 528.1 644 34.6 18.5 42.8 7.5 22.3 11.0Reserve 2010 396 33.8 38.6 622.4 593 40.7 22.4 44.5 6.5 26.0 9.7
v www.esajournals.org 3 December 2013 v Volume 4(12) v Article 145
METTE ET AL.
P. Mill.) and maple (Acer pseudoplatanus L.)covering minor percentages. No thinning oc-curred between 1995 and 2005. The site in theforest reserve was designated in 1978 andsurveyed in 1978, 1996 and 2010. Since that timeany forest management was forbidden. In 1978,stand age was 105 years, wood volume was 311m3/ha and basal area ratio of oak:beech:otherspecies was 42:21:37 (Table 1).
For retrospective growth analyses, incrementcores were extracted in the direct vicinity of the86-year experimental site in 2009. Two cores ofeach of 15 dominant oak and beech trees weresampled at breast height. After wood surfacepreparation, ring width of each sample wasmeasured using a LINTAB linear table (Rinn2003) to a precision of 0.01 mm. The softwareTSAP-Win (Rinn 2003) was used to cross-date thering width curves visually and statistically. Thebiological age trend in the original tree-ringseries was eliminated using the dplR library v1.5.5 (Bunn 2008) in R v 2.15.1 (R DevelopmentCore Team 2012) by applying a cubic smoothingspline of 2/3 of the series length. Autoregressivemodeling was used to remove first orderautocorrelation. Residual chronologies of beechand oak were obtained by averaging the ringwidth series using a biweight robust mean (Cookand Peters 1997).
Climate dataClimate data (daily values of temperature and
precipitation for the period 1 May 1958 to 31December 2003) were obtained from a weatherstation close to the study site (DWD Station 4621‘Schweinfurt-Gartenstadt’, 50.068 N; 10.228 E; 240m asl). These data were used for the retrospectivegrowth analysis of SILVA and LandClim.
The WETTREG 2010 A1B ‘normal’ scenario forthe same climate station from 1961-2100 (Kreien-kamp et al. 2009) formed the basis for theprojections of possible future forest development.For our study only one scenario was sufficientbecause the aim was not to compare forestsuccession across a large number of scenariosbut to highlight whether there might be somedifference between the two forest simulationmodels (Bugmann 1997). For this scenario, 10realizations were available. These climate timeseries provided a climatic gradient from moder-ate temperature and soil moisture conditions in
the past and present to warmer and dryerconditions in the future, including a realistictemporal variability and autocorrelation (Appen-dix: Table A1). Compared to 1971–2000 theWETTREG scenario projects for 2071–2100 asignificant increase in the mean annual andMay-September temperatures from 9.08C to12.58C and 15.98C to 19.48C, respectively. Thegrowing season with mean temperatures above108C is thereby extended from 164 to 202 days(Fig. 1). Annual precipitation decreases from 558mm to 523 mm and summer precipitation from258 mm to 200 mm.
DefinitionsIn the present study a species was defined as
dominant if its basal area (SILVA) or above-ground biomass (LandClim) was higher than anyother species’ basal area/biomass (Pretzsch andSchutze 2009). The competitiveness of a species isindicated by the gain or loss in that species’ basalarea or biomass share. Competitiveness (andultimately dominance) results from the jointeffect of the demographic processes establish-ment, growth and mortality.
We define the climatic turning point (CTP) asthe climate where a rank reversal of the species’dominance (i.e., basal area share (SILVA) andbiomass share (LandClim)) occurs. A potentialand actual CTP were distinguished, the firstreferring to hypothesis 1, the latter to hypothesis2. The potential CTP was determined by simu-lating a forest developing ex novo, i.e., estab-lished from seed rain, under different, butstationary climate conditions derived from theWETTREG data (cf. ‘Simulations’). The actualCTP was assessed by prescribing forest succes-sion of existing stands along the projectedclimatic gradient from moderate temperatureand precipitation to warmer and dryer condi-tions (WETTREG time series). The differencebetween the potential and actual CTP is that thelatter might be superposed by the past standdevelopment.
Forest modelsIn order to identify the CTP, the two central
model requirements were climate and competi-tion sensitivity at adequate spatio-temporalscales (Bugmann 1997, Bugmann and Cramer1998, Pretzsch et al. 2008). While climate change
v www.esajournals.org 4 December 2013 v Volume 4(12) v Article 145
METTE ET AL.

modifies the growth potential of each species in a
stand, it does not translate linearly into more or
less growth. In particular, the resource light is
asymmetrically distributed and leads to size-
structured population dynamics in forests which
have to be taken into account in climate change
modeling (Gomez-Aparicio et al. 2011). Our
hypotheses implicitly include the assumption
that the direct influence of climate is not the
only factor but that also competition for light
Fig. 1. Present and future climate of the study site Schweinfurt (southeastern Germany). (a) Present climate for
the period 1971–2000 according to the DWD climate station Schweinfurt, (b) future climate from 2071-2100
according to the WETTREG 2010 A1B scenario. Hatched areas indicate moist periods; areas where the
temperature curve exceeds the precipitation curve indicate dry periods (Walter and Lieth 1967).
v www.esajournals.org 5 December 2013 v Volume 4(12) v Article 145
METTE ET AL.

plays a major role. This competition sensitivity isa strength of SILVA and LandClim.
SILVA is a single-tree based, spatially explicitforest growth model (Pretzsch et al. 2002). Thegrowth functions were statistically parameter-ized from data of long-term experimental plotsacross Central Europe. The parameterizations forbeech were based on 13,000 trees of 89 plots; theparameterizations for oak were based on 3,000trees of 37 plots. SILVA was developed as agrowth simulator for operational forest manage-ment planning of the Bavarian state forestmanagement, for educational and scientific pur-poses (Pretzsch et al. 2008). Due to its site-sensitivity, SILVA simulations have been includ-ed in the analysis of climate change effects onforest growth and the development of forestcarbon stocks under different climate and man-agement scenarios (Kohl et al. 2010, Rotzer et al.2010). Growth and mortality depend on a site(i.e., climate and soil) dependent growth poten-tial, the individual trees’ competitive situationand a stochastic component. The crown compe-tition index searches for competing crowns witha size dependent circle around the target tree.
LandClim is a spatially explicit forest land-scape model that was developed to assess theimportance of climatic effects, wildfire, andmanagement on forest dynamics (Schumacher2004, Schumacher and Bugmann 2006, Schu-macher et al. 2006). It incorporates patch levelprocesses of climate-dependent tree regeneration,growth and mortality, and landscape levelprocesses such as forest disturbances and seeddispersal. Climatic aridity causes drought stressfor tree individuals by a reduction of availablesoil water mainly determined by the differencebetween precipitation and evapotranspiration inmonthly time steps. Available soil water cannotexceed the maximum available soil water capac-ity, but can be larger than the precipitation of agiven month due to carry-over of soil water fromprevious months. The demographic rates ofindividual trees within the patches are modifiedby light availability which is determined by thenumber of larger trees in their neighborhood.Thereby, several stand generations can be simu-lated and the influence of variables changingwith time or space (such as climate and standdensity) on forest dynamics can be assessed.LandClim operates at a relatively fine scale (grid
cells of 25 3 25 m, monthly weather data), andhas been tested and adapted to the EuropeanAlps, the North American Rocky Mountains, andMediterranean forests (Schumacher et al. 2006,Colombaroli et al. 2010, Henne et al. 2011, 2013,Briner et al. 2012, Elkin et al. 2012, Temperli et al.2012). Species parameters were taken fromSchumacher (2004) and Henne et al. (2011) exceptfor an increase in the drought tolerance ofQuercus petraea from 3.0 to 3.5 to reflect theslightly higher drought tolerance than Fagussylvatica (drought tolerance ¼ 3.0) reported inthe literature (Leuschner et al. 2001, Raftoyannisand Radoglou 2002, Breda et al. 2006, Scharn-weber et al. 2011).
Model validationFor model validation SILVA was initialized
with the first survey of the experimental sites.Simulated stand development for the 1981–2020was compared to the data from the experimentalsites. The simulated basal area growth matchedthe actual basal area well, except for 10–15%underestimation in the case of the 54- and 86-year-old stands. The difference was due to anunderestimation of the increment of the ‘otherspecies’ that cluster several species with differentgrowth characteristics. The growth ratio of oak tobeech was generally estimated correctly; oakincrement was slightly overestimated in the 27-year-old stand (Appendix: Fig. A1).
LandClim was validated by comparing simu-lations with current climate (DWD data) startingfrom bare ground to the empirical stands of thecorresponding age. The empirical tree diameterdata of the five experimental sites were translat-ed into biomass using the allometric functionimplemented in LandClim (Schroeder et al.1997). As the LandClim simulations did notinclude the past silviculture which favored oak,stand biomass was dominated by beech, which ismore competitive under the current climate asshown by the empirical data and reported in theliterature (Appendix: Fig. A2).
Overall, model performance was acceptable forour purposes; a perfect match of observed data isunrealistic since stochastic environmental eventssuch as late frost or other climate hazards, insectcalamities, mast years all have a very unpredict-able pattern and are essentially smoothed in themodel parameterizations.
v www.esajournals.org 6 December 2013 v Volume 4(12) v Article 145
METTE ET AL.

Simulations of future stand dynamicsMixed beech-oak forest growth under climate
conditions from the WETTREG 2010 A1B sce-nario was simulated in order to determine thepotential CTP between both species (Table 2).Climate had to be stationary during the simulat-ed succession so that forests developed inequilibrium with climate. To create such climatescenarios the WETTREG 2010 A1B time-seriescovering the period 1961–2100 was split into 20-year periods (for each of 10 available realiza-tions). Seven climate scenarios named CLIM1,CLIM2, . . . , CLIM7 (Table 2) were generated byrepeating each 20-year time-series as often asneeded (for 150 years succession 7.5 times).
To investigate the potential CTP we simulateda forest succession uninfluenced by the past.Accordingly, SILVA was initialized with the 27-year old stand since this was the youngestavailable (Table 1). LandClim was initialized onbare ground with a beech-oak ‘global seed rain’in which beech and oak had equal shares.
For the actual CTP, beech-oak stand develop-ment was simulated with the projected WET-TREG 2010 A1B climate scenario until 2100 foreach of 10 available realizations (Table 3). Again,SILVA and LandClim were initialized differently.SILVAwas initialized with each of the forest sitesresulting in five simulated successions influencedby the legacy of past stand development. Land-Clim stands were initialized with a global seedrain in 1921. Since no climate data was available
for this time period, we used the same climateconditions for the first 40 years (1921 to 1960) asthose from 1961 to 1980. From then on theWETTREG 2010 A1B time series was used. In2000, the LandClim stand was approximately asold as the 106-year-old experimental stand andthe forest reserve (105 years) and used as startingpoint for the simulation of the ‘actual succession’under a gradually changing climate.
Forest structure and species composition wereevaluated at a stand age of 150 years. We choose150 years for the evaluation of the CTP becausethis is the upper limit for beech rotation andlower limit for oak rotation and thereby relevantfor (managed) forests in Central Europe. At thisage none of the species suffers from age-dependent mortality as the main driver of forestdynamics is competition. The time of standevaluation certainly influences the CTP. AsRohner et al. (2012) showed beech is morecompetitive in later successional stages and isable to out-compete oak in the long term byinhibition of oak regeneration by shading alsounder increased drought stress. Under morefavorable conditions for oak the rank reversal infavor of beech is postponed to a later point oftime within the succession. However, we seek noequilibrium with a hypothetical climate and/ordisturbance regime (e.g., Fyllas and Troumbis2009)—a state that SILVA is not suited forwithout a regeneration module. We attemptedto stay close to the situation of the existing forest
Table 2. Definition of simulation runs for potential climatic turning point (simulation with quasi-constant climate
conditions) by model. The SILVA model used the experimental stand in the initial age; the LandClim model
used establishment from ‘global seed rain’ in the initial age. Temperature and precipitation are given per
annum (Temp.a, Prec.a) and per growing season (Temp.v, Prec.v), i.e., May–September of a respective year.
Initial age (yr) Sim. period (yr) Final age (yr) WETTREG A1B period Temp.a (Temp.v) (8C) Prec.a (Prec.v) (mm)
SILVA27 120 147 1961–1980 [CLIM1] 8.9 (15.6) 546 (256)27 120 147 1981–2000 [CLIM2] 8.9 (15.9) 553 (251)27 120 147 2001–2020 [CLIM3] 9.3 (16.4) 561 (245)27 120 147 2021–2040 [CLIM4] 10.3 (17.2) 534 (219)27 120 147 2041–2060 [CLIM5] 11.1 (18.2) 512 (227)27 120 147 2061–2080 [CLIM6] 11.9 (19.0) 500 (200)27 120 147 2081–2100 [CLIM7] 12.6 (19.4) 516 (195)
LandClim0 150 150 1961–1980 [CLIM1] 8.9 (15.6) 546 (256)0 150 150 1981–2000 [CLIM2] 8.9 (15.9) 553 (251)0 150 150 2001–2020 [CLIM3] 9.3 (16.4) 561 (245)0 150 150 2021–2040 [CLIM4] 10.3 (17.2) 534 (219)0 150 150 2041–2060 [CLIM5] 11.1 (18.2) 512 (227)0 150 150 2061–2080 [CLIM6] 11.9 (19.0) 500 (200)0 150 150 2081–2100 [CLIM7] 12.6 (19.4) 516 (195)
v www.esajournals.org 7 December 2013 v Volume 4(12) v Article 145
METTE ET AL.

sites, be coherent with the empirical growth data,and employ relevant time horizons for todays’forests management.
While climate data were identical, SILVA andLandClim used different data aggregations andtime windows. For SILVA the temperature andprecipitation data were translated into length ofgrowing season, average temperature May–Sep-tember, temperature amplitude January–July,precipitation May–September and the Martonnearidity index, each of the parameters averagedover 20 year periods (Pretzsch 2009). In contrast,LandClim worked with monthly mean tempera-tures and precipitation sums to calculate seasonaland annual indices for water availability(drought index in Bugmann and Cramer 1998,Bugmann and Solomon 2000) and energy avail-ability (degree-day-sum in Bugmann 1994) aswell as temperature of the coldest month.
Soil descriptions for the five study sites weretranslated into the model requirements. Soilproperties influence the CTP since the availablesoil water can compensate precipitation deficien-cy for some time. Specifically, for the SILVAsimulations a low soil water availability wasassumed (0.3 on a scale between 0 and 1) andfurther reduced as the climate became warmerand drier. For LandClim, the maximum availablesoil water capacity (model parameter ‘bucketsize’) was set to 80 mm.
RESULTS
Current stand dynamicsIn all but the 106-year-old stands, beech
expanded its basal area while oak remainedunchanged or declined (Fig. 2). Beech expansionwas particularly strong in the young 27- and 86-year-old stands and in the forest reserve which
had the longest time period between surveys.Here, from 1978 to 2010, the beech basal areashare increased from 42% to 58%, partly at theexpense of oak (decline from 21% to 17%), butmainly due to the decline of other species (37% to25%).
A closer look at the 86-year-old experimentalsite emphasized the effect of stand structure onbasal area growth (DBH-distributions in Appen-dix: Fig. A3): The tree-ring analysis showed anincrease of mean DBH of dominant beech from31.6 to 37.5 cm (þ5.9 cm) and oak from 26.0 to29.8 cm (þ3.8 cm). Diameter increase of beechtrees thus exceeded oak trees by 40–60% in theupper canopy. However, the majority of beechtrees still grew in the subcanopy and wasstrongly suppressed so that, in total, the basalarea share remained unchanged (Appendix: Fig.A3).
Correlations between tree-ring indices andclimate data revealed that beech was much moresensitive to climate than oak. While oak showedsignificant positive correlations with precipita-tion during the growing period, beech tree-ringindices were positively correlated with precipi-tation during spring and the growing season aswell as during September and December of theprevious year. For beech, correlations withtemperature were negative for most monthsexcept for October of the previous year (Appen-dix: Fig. A4). In the driest summer of 2003 (100mm precipitation from May–September), beechring-width index dropped to 0.5 while that foroak only decreased to 0.7.
Future stand dynamicsPotential climatic turning point.—In almost all
scenarios, beech extended its initially low basal
Table 3. Definition of simulation runs for actual climatic turning point (continuous simulation acc. to WETTREG
scenario). For temperature and precipitation data of the WETTREG A1B time series cf. Table 2.
Model Initial age (yr)Sim.
period (yr)Final
age (yr)Simulation
span Data
SILVA 27 (experimental stand) 100 127 2001–2100 WETTREG A1B time seriesSILVA 54 (experimental stand) 100 154 2001–2100 WETTREG A1B time seriesSILVA 86 (experimental stand) 100 186 2001–2100 WETTREG A1B time seriesSILVA 106 (experimental stand) 100 206 2001–2100 WETTREG A1B time seriesSILVA 105 (forest reserve) 120 205 1981–2100 WETTREG A1B time seriesLandClim 0 (establishment from
‘global seed rain’)180 180 1921–2100 From 1921 to 1960 WETTREG A1B time
series ‘1961-1980’ was repeated twice,afterwards WETTREG A1B time series
v www.esajournals.org 8 December 2013 v Volume 4(12) v Article 145
METTE ET AL.

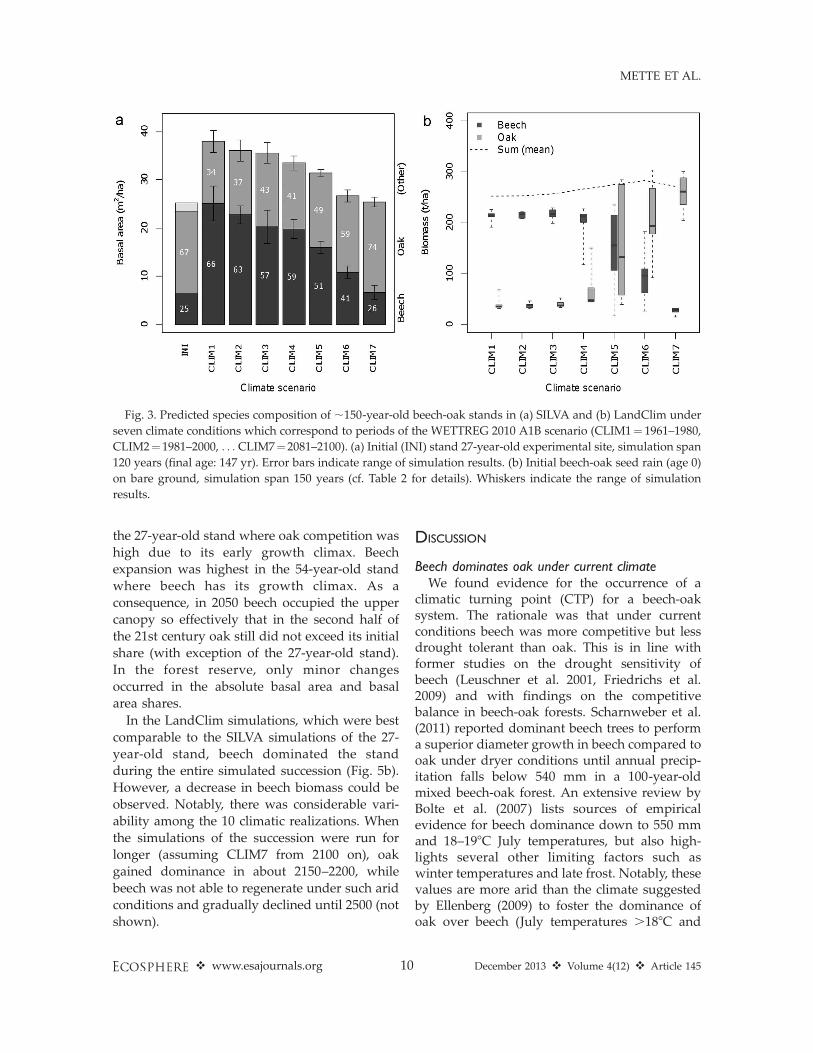
area share in SILVA simulations (Fig. 3a).However, the beech expansion decreased alongthe climatic gradient. While in CLIM6 (2061–2080) beech still slowly expanded, in CLIM7(2081–2100) beech basal area did not furtherexpand. In these last two scenarios CLIM6-7(2061–2100) beech did not reach dominance.Notably, not only species composition changed,but also the final basal area value decreased fromalmost 38 m2/ha in CLIM1 (1961–1980) to 26 m2/ha in CLIM7 (2081–2100).
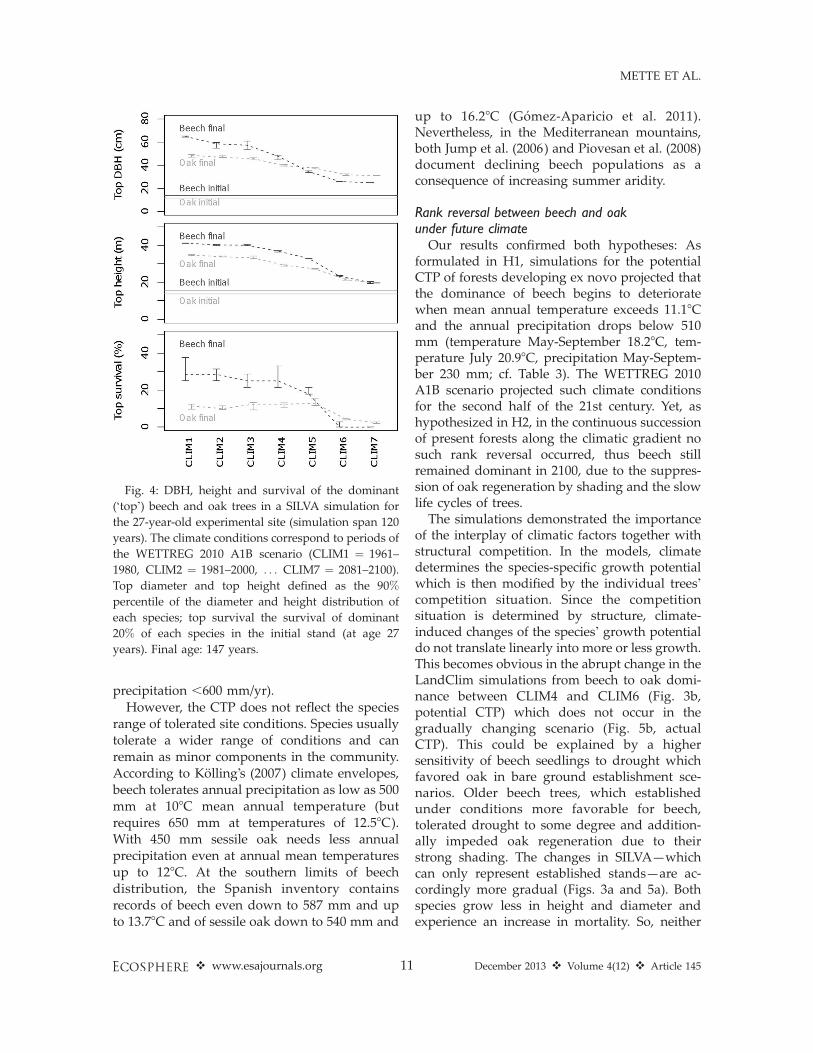
Focusing on the economically most interestingtarget trees, dominant beech trees grew higherthan oak in SILVA simulations. Oak reached onlylarger diameters in the last three scenariosCLIM5-7 (2041–2100) (Fig. 4). Both diameterand height of the dominant trees decreased withincreasing aridity. This negative climate effectwas even more apparent in the survival of theinitially dominant beech and oak trees. FromCLIM1-5 (1961–2060), more dominant beech thanoak trees survived. In CLIM6-7 (2061–2100)significant upper canopy mortality caused deathof almost all of the initially dominant beech trees.
LandClim simulations (Fig. 3b) were generallyin agreement with those of SILVA. From CLIM1-3 (1961–2020) beech dominated in all realizations,
with biomass shares of 75–89%. In CLIM4 (2021–2040) one out of 10 climate realizations resultedin oak dominance, in CLIM5 (2041–2060) alreadyfive out of 10. Finally, in CLIM6 (2061–2080) andCLIM7 (2081–2100) LandClim predicted mixedstands with a share of oak of 64% in CLIM6 and96% in CLIM7, and a share of beech of 34% inCLIM6 and 11% in CLIM7 (medians of 10realizations). Beech experienced higher mortalityand was mainly restricted to the understoryowing to its shade tolerance. Oak dominated theupper canopy, which led to a considerableincrease in the biomass of large trees above 50cm DBH: 168 t/ha in the CLIM1 (1961–1980)scenario vs. 225 t/ha in the CLIM7 (2081–2100)scenario. Consequently, total stand biomassvaried only little between the scenarios, contrast-ing with SILVA results, where basal area declinedwith progressing climate change (SILVA �34%;Fig. 3a CLIM7 vs. CLIM1).
Actual climatic turning point.—In SILVA, basalarea peaked around the year 2050 in thecontinuous WETTREG 2010 A1B climate scenario(Fig. 5a). This pattern was mainly caused bychanges in beech basal area while oak basal arearemained almost constant. The beech expansionin the first half of the 21st century was lowest in
Fig. 2. Basal area share of beech, oak and other tree species of the four experimental sites (in 1995 and 2005) and
the forest reserve (in 1978, 1996, and 2010) according to field surveys.
v www.esajournals.org 9 December 2013 v Volume 4(12) v Article 145
METTE ET AL.
the 27-year-old stand where oak competition was
high due to its early growth climax. Beech
expansion was highest in the 54-year-old stand
where beech has its growth climax. As a
consequence, in 2050 beech occupied the upper
canopy so effectively that in the second half of
the 21st century oak still did not exceed its initial
share (with exception of the 27-year-old stand).
In the forest reserve, only minor changes
occurred in the absolute basal area and basal
area shares.
In the LandClim simulations, which were best
comparable to the SILVA simulations of the 27-
year-old stand, beech dominated the stand
during the entire simulated succession (Fig. 5b).
However, a decrease in beech biomass could be
observed. Notably, there was considerable vari-
ability among the 10 climatic realizations. When
the simulations of the succession were run for
longer (assuming CLIM7 from 2100 on), oak
gained dominance in about 2150–2200, while
beech was not able to regenerate under such arid
conditions and gradually declined until 2500 (not
shown).
DISCUSSION
Beech dominates oak under current climateWe found evidence for the occurrence of a
climatic turning point (CTP) for a beech-oaksystem. The rationale was that under currentconditions beech was more competitive but lessdrought tolerant than oak. This is in line withformer studies on the drought sensitivity ofbeech (Leuschner et al. 2001, Friedrichs et al.2009) and with findings on the competitivebalance in beech-oak forests. Scharnweber et al.(2011) reported dominant beech trees to performa superior diameter growth in beech compared tooak under dryer conditions until annual precip-itation falls below 540 mm in a 100-year-oldmixed beech-oak forest. An extensive review byBolte et al. (2007) lists sources of empiricalevidence for beech dominance down to 550 mmand 18–198C July temperatures, but also high-lights several other limiting factors such aswinter temperatures and late frost. Notably, thesevalues are more arid than the climate suggestedby Ellenberg (2009) to foster the dominance ofoak over beech (July temperatures .188C and
Fig. 3. Predicted species composition of ;150-year-old beech-oak stands in (a) SILVA and (b) LandClim under
seven climate conditions which correspond to periods of the WETTREG 2010 A1B scenario (CLIM1¼ 1961–1980,
CLIM2¼1981–2000, . . . CLIM7¼2081–2100). (a) Initial (INI) stand 27-year-old experimental site, simulation span
120 years (final age: 147 yr). Error bars indicate range of simulation results. (b) Initial beech-oak seed rain (age 0)
on bare ground, simulation span 150 years (cf. Table 2 for details). Whiskers indicate the range of simulation
results.
v www.esajournals.org 10 December 2013 v Volume 4(12) v Article 145
METTE ET AL.
precipitation ,600 mm/yr).
However, the CTP does not reflect the speciesrange of tolerated site conditions. Species usuallytolerate a wider range of conditions and canremain as minor components in the community.According to Kolling’s (2007) climate envelopes,beech tolerates annual precipitation as low as 500mm at 108C mean annual temperature (butrequires 650 mm at temperatures of 12.58C).With 450 mm sessile oak needs less annualprecipitation even at annual mean temperaturesup to 128C. At the southern limits of beechdistribution, the Spanish inventory containsrecords of beech even down to 587 mm and upto 13.78C and of sessile oak down to 540 mm and
up to 16.28C (Gomez-Aparicio et al. 2011).Nevertheless, in the Mediterranean mountains,both Jump et al. (2006) and Piovesan et al. (2008)document declining beech populations as aconsequence of increasing summer aridity.
Rank reversal between beech and oakunder future climate
Our results confirmed both hypotheses: Asformulated in H1, simulations for the potentialCTP of forests developing ex novo projected thatthe dominance of beech begins to deterioratewhen mean annual temperature exceeds 11.18Cand the annual precipitation drops below 510mm (temperature May-September 18.28C, tem-perature July 20.98C, precipitation May-Septem-ber 230 mm; cf. Table 3). The WETTREG 2010A1B scenario projected such climate conditionsfor the second half of the 21st century. Yet, ashypothesized in H2, in the continuous successionof present forests along the climatic gradient nosuch rank reversal occurred, thus beech stillremained dominant in 2100, due to the suppres-sion of oak regeneration by shading and the slowlife cycles of trees.
The simulations demonstrated the importanceof the interplay of climatic factors together withstructural competition. In the models, climatedetermines the species-specific growth potentialwhich is then modified by the individual trees’competition situation. Since the competitionsituation is determined by structure, climate-induced changes of the species’ growth potentialdo not translate linearly into more or less growth.This becomes obvious in the abrupt change in theLandClim simulations from beech to oak domi-nance between CLIM4 and CLIM6 (Fig. 3b,potential CTP) which does not occur in thegradually changing scenario (Fig. 5b, actualCTP). This could be explained by a highersensitivity of beech seedlings to drought whichfavored oak in bare ground establishment sce-narios. Older beech trees, which establishedunder conditions more favorable for beech,tolerated drought to some degree and addition-ally impeded oak regeneration due to theirstrong shading. The changes in SILVA—whichcan only represent established stands—are ac-cordingly more gradual (Figs. 3a and 5a). Bothspecies grow less in height and diameter andexperience an increase in mortality. So, neither
Fig. 4: DBH, height and survival of the dominant
(‘top’) beech and oak trees in a SILVA simulation for
the 27-year-old experimental site (simulation span 120
years). The climate conditions correspond to periods of
the WETTREG 2010 A1B scenario (CLIM1 ¼ 1961–
1980, CLIM2 ¼ 1981–2000, . . . CLIM7 ¼ 2081–2100).
Top diameter and top height defined as the 90%
percentile of the diameter and height distribution of
each species; top survival the survival of dominant
20% of each species in the initial stand (at age 27
years). Final age: 147 years.
v www.esajournals.org 11 December 2013 v Volume 4(12) v Article 145
METTE ET AL.

species is a true winner of climate change, yetoak is less affected than beech. The time lag in theclimate adaption of the forest species composi-tion can be described as a legacy of the past standdevelopment.
Sykes and Prentice (1996) reported similarfindings for a study site in Sweden. Underclimate warming, beech was expected to be thelong-term replacement for spruce (in pine-spruceforests), but in simulations its dominance wasdelayed for centuries due to the persistence ofold-growth spruce stands. Under such conditionsdisturbances can initiate succession and therebyfunction as catalysts for ecosystem changefollowing climate change (Soja et al. 2007, John-stone et al. 2010). In a modelling study ofHanewinkel et al. (2012) on the economic valueof future forests a considerable decline of beechwas found, while oak remained unchanged oreven increased in their study. Indeed, the forestsimulator 4C projected a decline in both, beechand oak, with decreasing precipitation (Lasch etal. 2002), but at the same time, the range ofpossible climate projections differed to suchdegree that it remained unclear if beech andoak will actually suffer a loss in productivity at a
particular site. Increased diebacks of uppercanopy trees as simulated by SILVA, are one ofthe severest consequences of climate change andhave received high attention (Bigler et al. 2006,McDowell et al. 2008, Allen et al. 2010). Forexample, Hlasny et al. (2011) projected a diebackfor beech forests in lower altitudes of Hungaryduring the 21st century. Far-reaching conse-quences of increases in drought induced mortal-ity have been documented for forest ecosystemsof the southwestern United States (Allen andBreshears 1998): A rapid and persistent shift ofthe ecosystem boundary between semiarid pon-derosa pine forest and pinon–juniper woodlandfollowed a drought- induced dieback in the1950s. Whereas in the drought of the 1950smainly trees older than 100 years were affected,widespread tree mortality was observed acrosssize and age classes in the drought of 2000–2003in the same region (Breshears et al. 2005). Oursimulations did not show such dramatic conse-quences of climate change. However, SILVA andLandClim only regarded climate effects onestablishment, growth and mortality. In reality,major diebacks can only seldom be attributeddirectly to climate events (e.g., in McDowell et al.
Fig. 5. Predicted development of beech-oak stands under the WETTREG 2010 A1B scenario until 2100 (a) in
SILVA for five stands evaluated in 2050 and 2100 and (b) in LandClim for one stand, entire succession shown. (a)
SILVAwas initialized with four experimental sites (age 27 to 106 years in 2000), and one forest reserve (age ;105
in 1980); (b) LandClim started with beech-oak seed rain on bare ground in 1921, thus stand age is comparable
with SILVA simulations ‘106 years’ and ‘reserve’. (cf. Table 3 for details).
v www.esajournals.org 12 December 2013 v Volume 4(12) v Article 145
METTE ET AL.

2008), mostly the factors are more complex (e.g.,Bigler et al. 2006). Droughts are for example amain cause of fires that entail tree death,occasionally at large areas. Moreover, droughtsare regarded as an inciting mortality factor(sensu Manion 1981), while secondary agentstake advantage of the weakened tree defense andkill the trees in the end. For example, in theponderosa pine forest, drought weakened treedefense against cambium-feeding beetles (Den-droctonus sp. and Ips sp.), which causedadditional mortality (Allen and Breshears 1998).
Implications for managementFor more than 30 years, forest management in
Central Europe has pursued a more sustainableand stable productivity through conversion ofconiferous forest to broadleaf forest and propa-gation of species mixtures (Spiecker et al. 2004,Pretzsch et al. 2013). As climate change movedinto the focus of attention, species suitabilitydecisions had to take into account future climatetrends (Linder 2000, Bolte et al. 2009, Lindner etal. 2010). For dry and warmer sites, the decisionis between beech and oak. Temperature andprecipitation are the most commonly used factorsto guide such decisions. Our study demonstratedthat beech is currently not drought-limited insoutheastern Germany, even at the driest sites.These values remain within the climate enve-lopes of Kolling (2007) for beech existence, butfall below the typical values given for beechdominance (Bolte et al. 2007). Based on thesevalues, there is still a buffer for beech forests: onthe dryer sites in southeastern Germany at leastuntil 2050 even under ‘worst-case’ assumptionslike the WETTREG 2010 A1B scenario.
However, in view of the projected beechdecline in both SILVA and LandClim in thesecond half of the 21st century, the promotion ofoak already today seems advisable due to thesuperior resistance and resilience of oak (pedun-culate oak even more than sessile oak) to drought(Leuschner et al. 2001, Friedrichs et al. 2009,Scharnweber et al. 2011). Also the high value ofoak wood might make oak more profitable thanbeech if stand productivity decreases as project-ed. Additionally, the facilitative behavior of oakin mixed stands is a strong argument for apreferential choice of this species as stabilizingcomponent of ecosystems under climate change.
Only recently, independently of each other,Zapater et al. (2011) and Jonard et al. (2011)found evidence for hydraulic lift of oak in youngmixed beech-oak stands. This could be the causefor a lower sensitivity of beech to water scarcityin mixed beech-oak stands than in pure stands.Further, Pretzsch et al. (2012) found that growthof beech in mixture with spruce decreased lessthan in monoculture and thereby improved itscompetitive strength. This stress release bymixing is an important emergent propertyimplying that the realized climatic niche of beechin mixed stands might be wider than in purestands (Pretzsch et al. 2013).
ConclusionWe demonstrated that a rank reversal of key
forest species is to be expected under projectedclimate change, but that established forest struc-tures introduce considerable inertia in the climatechange adaption of forests. The climatic turningpoint proved a simple yet effective referencemeasure to study climate related changes ininterspecific competition. Competition sensitivi-ty—a strength of the models employed here—isneeded to account for the strongly size-struc-tured population dynamics and therefore imper-ative in climate change modelling.
ACKNOWLEDGMENTS
This study was funded by the Bavarian StateMinistry of Sciences, Research and the Arts (StMWFK)within the framework of the ‘Bavarian ClimateProgramme 2020’ as part of the joint research centre‘FORKAST’. The authors thank the German Meteoro-logical Service (DWD) for providing data and theBavarian State Ministry for Food, Agriculture andForestry Project D03 for the scientific monitoring ofstrict forest reserves. Tobias Mette and Klara Doloscontributed equally to this work.
LITERATURE CITED
Allen, C. D., et al. 2010. A global overview of droughtand heat-induced tree mortality reveals emergingclimate change risks for forests. Forest Ecology andManagement 259:660–684.
Allen, C. D., and D. D. Breshears. 1998. Drought-induced shift of a forest-woodland ecotone: Rapidlandscape response to climate variation. Proceed-ings of the National Academy of Sciences 95:14839–14842.
v www.esajournals.org 13 December 2013 v Volume 4(12) v Article 145
METTE ET AL.

Araujo, M. B., and A. Guisan. 2006. Five (or so)challenges for species distribution modelling. Jour-nal of Biogeography 33:1677–1688.
Baltzer, J. L., and S. C. Thomas. 2007. Determinants ofwhole-plant light requirements in Bornean rainforest tree saplings. Journal of Ecology 95:1208–1221.
Barriopedro, D., E. M. Fischer, J. Luterbacher, R. M.Trigo, and R. Garcia-Herrera. 2011. The hotsummer of 2010: Redrawing the temperaturerecord map of Europe. Science 332:220–224.
Beaudet, M., J. Brisson, D. Gravel, and C. Messier.2007. Effect of a major canopy disturbance on thecoexistence of Acer saccharum and Fagus grandifoliain the understorey of an old-growth forest. Journalof Ecology 95:458–467.
Bigler, C., O. U. Braker, H. Bugmann, M. Dobbertin,and A. Rigling. 2006. Drought as an incitingmortality factor in scots pine stands of the Valais,Switzerland. Ecosystems 9:330–343.
Bolte, A., T. Czajkowski, and T. Kompa. 2007. Thenorth-eastern distribution range of Europeanbeech: A review. Forestry 80:413–429.
Bolte, A., C. Ammer, M. Lof, P. Madsen, G.-J. Nabuurs,P. Schall, P. Spathelf, and J. Rock. 2009. Adaptiveforest management in Central Europe: Climatechange impacts, strategies and integrative concept.Scandinavian Journal of Forest Research 24:473–482.
Boyden, S. B., P. B. Reich, K. J. Puettmann, and T. R.Baker. 2009. Effects of density and ontogeny on sizeand growth ranks of three competing tree species.Journal of Ecology 97:277–288.
Breda, N., R. Huc, A. Granier, and E. Dreyer. 2006.Temperate forest trees and stands under severedrought: A review of ecophysiological responses,adaptation processes and long-term consequences.Annals of Forest Science 63:625–644.
Breshears, D. D., et al. 2005. Regional vegetation die-off in response to global-change-type drought.Proceedings of the National Academy of Sciences102:15144–15148.
Briner, S., C. Elkin, R. Huber, and A. Gret-Regamey.2012. Assessing the impacts of economic andclimate changes on land-use in mountain regions:A spatial dynamic modeling approach. AgricultureEcosystems and Environment 149:50–63.
Bugmann, H. 1994. On the ecology of mountainousforests in a changing climate: A simulation study.Dissertation. Swiss Federal Institute of TechnologyZurich, Zurich, Switzerland.
Bugmann, H. 1997. Sensitivity of forests in theEuropean Alps to future climatic change. ClimateResearch 8:35–44.
Bugmann, H., and W. Cramer. 1998. Improving thebehaviour of forest gap models along droughtgradients. Forest Ecology and Management
103:247–263.Bugmann, H. K. M., and A. M. Solomon. 2000.
Explaining forest composition and biomass acrossmultiple biogeographical regions. Ecological Ap-plications 10:95–114.
Bunn, A. G. 2008. A dendrochronology programlibrary in R (dplR). Dendrochronologia 26:115–124.
Carnicer, J., M. Coll, M. Ninyerola, X. Pons, G.Sanchez, and J. Penuelas. 2011. Widespread crowncondition decline, food web disruption, and am-plified tree mortality with increased climatechange-type drought. Proceedings of the NationalAcademy of Sciences 108:1474–1478.
Chapin, F. S. 2003. Effects of plant traits on ecosystemand regional processes: A conceptual frameworkfor predicting the consequences of global change.Annals of Botany 91:455–463.
Colombaroli, D., P. D. Henne, P. Kaltenrieder, E. Gobet,and W. Tinner. 2010. Species responses to fire,climate and human impact at tree line in the Alpsas evidenced by palaeo-environmental records anda dynamic simulation model. Journal of Ecology98:1346–1357.
Cook, E. R., and K. Peters. 1997. Calculating unbiasedtree-ring indices for the study of climatic andenvironmental change. Holocene 7:361–370.
Czucz, B., L. Galhidy, and C. Matyas. 2011. Presentand forecasted xeric climatic limits of beech andsessile oak distribution at low altitudes in CentralEurope. Annals of Forest Science 68:99–108.
Dalgaard, P. 2002. Introductory statistics with R.Springer, New York, New York, USA.
Elkin, C., B. Reineking, C. Bigler, and H. Bugmann.2012. Do small-grain processes matter for land-scape scale questions? Sensitivity of a forestlandscape model to the formulation of tree growthrate. Landscape Ecology 27:697–711.
Ellenberg, H. 2009. Vegetation ecology of CentralEurope. Fourth edition. Cambridge UniversityPress, Cambridge, UK.
Ellison, A. M., et al. 2005. Loss of foundation species:consequences for the structure and dynamics offorested ecosystems. Frontiers in Ecology and theEnvironment 3:479–486.
Friedrichs, D. A., V. Trouet, U. Buntgen, D. C. Frank, J.Esper, B. Neuwirth, and J. Loffler. 2009. Species-specific climate sensitivity of tree growth inCentral-West Germany. Trees 23:729–739.
Fuhrer, J., M. Beniston, A. Fischlin, C. Frei, S. Goyette,K. Jasper, and C. Pfister. 2006. Climate risks andtheir impact on agriculture and forests in Switzer-land. Pages 79–102 in H. Wanner, M. Grosjean, R.Rothlisberger, E. Xoplaki, editors. Climate variabil-ity, predictability and climate risks. Springer,Dordrecht, The Netherlands.
Fyllas, N. M., and A. Y. Troumbis. 2009. Simulatingvegetation shifts in north-eastern Mediterranean
v www.esajournals.org 14 December 2013 v Volume 4(12) v Article 145
METTE ET AL.

mountain forests under climatic change scenarios.Global Ecology and Biogeography 18:64–77.
Gitlin, A. R., C. M. Sthultz, M. A. Bowker, S. Stumpf,K. L. Paxton, K. Kennedy, A. Munoz, J. K. Bailey,and T. G. Whitham. 2006. Mortality gradientswithin and among dominant plant populations asbarometers of ecosystem change during extremedrought. Conservation Biology 20:1477–1486.
Gomez-Aparicio, L., R. Garcıa-Valdes, P. Ruız-Benito,and M. A. Zavala. 2011. Disentangling the relativeimportance of climate, size and competition on treegrowth in Iberian forests: Implications for forestmanagement under global change. Global ChangeBiology 17:2400–2414.
Hanewinkel, M., D. A. Cullmann, M. J. Schelhaas, G. J.Nabuurs, and N. E. Zimmermann. 2012. Climatechange may cause severe loss in the economicvalue of European forest land. Nature ClimateChange 3:203–207.
Henne, P. D., et al. 2011. Did soil development limitspruce (Picea abies) expansion in the Central Alpsduring the Holocene? Testing a palaeobotanicalhypothesis with a dynamic landscape model.Journal of Biogeography 38:933–949.
Henne, P. D., C. M. Elkin, B. Reineking, H. Bugmann,and W. Tinner. 2013. Impacts of changing climateand land use on vegetation dynamics in aMediterranean ecosystem: Insights from paleoecol-ogy and dynamic modeling. Landscape Ecology28:819–833.
Hlasny, T., Z. Barcza, M. Fabrika, B. Balazs, G.Churlina, J. Pajtık, R. Sedmak, and M. Turcani.2011. Climate change impacts on growth andcarbon balance of forests in Central Europe.Climate Research 47:219–236.
IPCC. 2012. Managing the risks of extreme events anddisasters to advance climate change adaption. Aspecial report of working groups I and II of theIntergovernmental Panel on Climate Change. Cam-bridge University Press, New York, New York,USA.
Johnstone, J. F., E. J. McIntire, E. J. Pedersen, G. King,and M. J. Pisaric. 2010. A sensitive slope: Estimat-ing landscape patterns of forest resilience in achanging climate. Ecosphere 1:14.
Jonard, F., F. Andre, Q. Ponette, C. Vincke, and M.Jonard. 2011. Sap flux density and stomatalconductance of European beech and common oaktrees in pure and mixed stands during the summerdrought of 2003. Journal of Hydrology 409:371–381.
Jump, A. S., J. M. Hunt, and J. Penuelas. 2006. Rapidclimate change-related growth decline at thesouthern range edge of Fagus sylvatica. GlobalChange Biology 12:2163–2174.
Kohl, M., et al. 2010. Combating the effects of climaticchange on forests by mitigation strategies. Carbon
Balance and Management 5:1–9.Kolling, C. 2007. Klimahullen fur 27 Waldbaumarten.
AFZ-DerWald 23:1242–1245.Kreienkamp, F., A. Spekat, and W. Enke. 2009.
Sensitivity studies with a statistical downscalingmethod: The role of the driving large scale model.Meteorologische Zeitschrift 18:597–606.
Lasch, P., F. W. Badeck, M. Lindner, and F. Suckow.2002. Sensitivity of simulated forest growth tochanges in climate and atmospheric CO2. Forstwis-senschaftliches Centralblatt 121:155–171.
Lebourgeois, F., N. Breda, E. Ulrich, and A. Granier.2005. Climate-tree-growth relationships of Europe-an beech (Fagus sylvatica L.) in the French Perma-nent Plot Network (RENECOFOR). Trees 19:385–401.
Leuschner, C., K. Backes, D. Hertel, F. Schipka, U.Schmitt, O. Terborg, and M. Runge. 2001. Droughtresponses at leaf, stem and fine root levels ofcompetitive Fagus sylvatica L. and Quercus petraea(Matt.) Liebl. trees in dry and wet years. ForestEcology and Management 149:33–46.
Linder, M. 2000. Developing adaptive forest manage-ment strategies to cope with climate change. TreePhysiology 20:299–307.
Lindner, M., et al. 2010. Climate change impacts,adaptive capacity, and vulnerability of Europeanforest ecosystems. Forest Ecology and Management259:698–709.
Manion, P. D. 1981. Tree disease concepts. Prentice-Hall. Englewood Cliffs, New Jersey, USA.
McDowell, N., W. T. Pockman, C. D. Allen, D. D.Breshears, N. Cobb, T. Kolb, J. Plaut, J. Sperry, A.West, D. G. Williams, and E. A. Yepez. 2008.Mechanisms of plant survival and mortality duringdrought: Why do some plants survive while otherssuccumb to drought? New Phytologist 178:719–739.
Michelot, A., N. Breda, C. Damesin, and E. Dufrene.2012. Differing growth responses to climaticvariations and soil water deficits of Fagus sylvatica,Quercus petraea and Pinus sylvestris in a temperateforest. Forest Ecology and Management 265:161–171.
Morin, X., D. Viner, and I. Chuine. 2008. Tree speciesrange shifts at a continental scale: new predictiveinsights from a process-based model. Journal ofEcology 96:784–794.
Osada, N. 2012. Crown exposure to light and treeallometry of 11 tree species in a snowy cool-temperate forest in Japan. Plant Ecology 213:783–794.
Perez-Ramos, I. M., I. R. Urbieta, M. A. Zavala, and T.Maranon. 2012. Ontogenetic conflicts and rankreversals in two Mediterranean oak species: Impli-cations for coexistence. Journal of Ecology 100:467–477.
v www.esajournals.org 15 December 2013 v Volume 4(12) v Article 145
METTE ET AL.

Peterken, G., and E. P. Mountford. 1996. Effects ofdrought on beech in Lady Park Wood, an unman-aged mixed deciduous woodland. Forestry 69:125–136.
Piovesan, G., F. Biondi, A. D. Filippo, A. Alessandrini,and M. Maugeri. 2008. Drought-driven growthreduction in old beech (Fagus sylvatica L.) forests ofthe central Apennines, Italy. Global Change Biolo-gy 14:1265–1281.
Pretzsch, H. 2009. Forest dynamics, growth, and yield.From measurement to model. Springer, Berlin,Germany.
Pretzsch, H., and G. Schutze. 2009. Transgressiveoveryielding in mixed compared with pure standsof Norway spruce and European beech in CentralEurope: Evidence on stand level and explanationon individual tree level. European Journal of ForestResearch 128:183–204.
Pretzsch, H., P. Biber, and J. Dursky. 2002. The singletree-based stand simulator SILVA: Construction,application and evaluation. Forest Ecology andManagement 162:3–21.
Pretzsch, H., R. Grote, B. Reineking, and T. H. Rotzer.2008. Models for forest ecosystem management: AEuropean perspective. Annals of Botany 101:1065–1087.
Pretzsch, H., J. Dieler, T. Seifert, and T. Rotzer. 2012.Climate effects on productivity and resource-useefficiency of Norway spruce (Picea abies L. Karst.)and European beech (Fagus sylvatica L.) in standswith different spatial mixing patterns. Trees26:1343–1360.
Pretzsch, H., K. Bielak, J. Block, A. Bruchwald, J.Dieler, H.-P. Ehrhart, U. Kohnle, J. Nagel, H.Spellmann, M. Zasada, and A. Zingg. 2013.Productivity of mixed versus pure stands of oak(Quercus petraea (Matt.) Liebl. and Quercus roburL.) and European beech (Fagus sylvatica L.) alongan ecological gradient. European Journal of ForestResearch 132:263–280.
Raftoyannis, Y., and K. Radoglou. 2002. Physiologicalresponses of beech and sessile oak in a naturalmixed stand during a dry summer. Annals ofBotany 89:723–730.
R Development Core Team. 2012. R: A language andenvironment for statistical computing. Referenceindex version 2.15.2. R Foundation for StatisticalComputing, Vienna, Austria.
Rehfeldt, G. E., D. E. Ferguson, and N. L. Crookston.2009. Aspen, climate, and sudden decline inwestern USA. Forest Ecology and Management258:2353–2364.
Rinn, R. 2003. TSAP-Win (time series analysis andpresentation for dendrochronology and relatedapplications). Version 0.53. Rinntech, Heidelberg,Germany.
Rohner, B., C. Bigler, J. Wunder, P. Brang, and H.
Bugmann. 2012. Fifty years of natural succession inSwiss forest reserves: changes in stand structureand mortality rates of oak and beech. Journal ofVegetation Science 23:892–905.
Rotzer, T., J. Dieler, T. Mette, R. Moshammer, and H.Pretzsch. 2010. Productivity and carbon dynamicsin managed Central European forests dependingon site conditions and thinning regimes. Forestry83:483–496.
Sanchez-Gomez, D., M. A. Zavala, D. B. Van Schalk-wijk, I. R. Urbieta, and F. Valladares. 2008. Rankreversals in tree growth along tree size, competi-tion and climatic gradients for four forest canopydominant species in central Spain. Annals of ForestScience 65:605.
Schar, C., P. L. Vidale, D. Luthi, C. Frei, C. Haberli,M. A. Liniger, and C. Appenzeller. 2004. The role ofincreasing temperature variability in Europeansummer heatwaves. Nature 427:332–336.
Scharnweber, T., M. Manthey, C. Criegee, A. Bauwe, C.Schroder, and M. Wilmking. 2011. Drought mat-ters: Declining precipitation influences growth ofFagus sylvatica L. and Quercus robur L. in north-eastern Germany. Forest Ecology and Management262:947–961.
Schroeder, P., S. Brown, J. Mo, R. Birdsey, and C.Cieszewski. 1997. Biomass estimation for temper-ate broadleaf forests of the United States usinginventory data. Forest Science 43:424–434.
Schumacher, S. 2004. The role of large-scale distur-bances and climate for the dynamics of forestedlandscapes in the European Alps. Dissertation.Swiss Federal Institute of Technology Zurich,Zurich, Switzerland.
Schumacher, S., and H. Bugmann. 2006. The relativeimportance of climatic effects, wildfires and man-agement for future forest landscape dynamics inthe Swiss Alps. Global Change Biology 12:1435–1450.
Schumacher, S., B. Reineking, J. Sibold, and H.Bugmann. 2006. Modeling the impact of climateand vegetation on fire regimes in mountainlandscapes. Landscape Ecology 21:539–554.
Soja, A. J., N. M. Tchebakova, N. H. F. French, M. D.Flannigan, H. H. Shugart, B. J. Stocks, A. I.Sukhinin, E. I. Parfenova, F. S. Chapin, III, andP. W. Stackhouse, Jr. 2007. Climate-induced borealforest change: Predictions versus current observa-tions. Global and Planetary Change 56:274–296.
Spiecker, H., J. Hansen, E. Klimo, J. Skovsgaard, H.Sterba, and K. von Teuffel, editors. 2004. Norwayspruce conversion: Options and consequences. EFIResearch Report 18, Brill, Leiden, The Netherlands.
Sykes, M., and C. I. Prentice. 1996. Climate change, treespecies distributions and forest dynamics: A casestudy in the mixed conifer/northern hardwoodszone of northern Europe. Climatic Change 34:161–
v www.esajournals.org 16 December 2013 v Volume 4(12) v Article 145
METTE ET AL.

177.Temperli, C., H. Bugmann, and C. Elkin. 2012.
Adaptive management for competing forest goodsand services under climate change. EcologicalApplications 22:2065–2077.
van Mantgem, P. J., and N. L. Stephenson. 2007.Apparent climatically induced increase of treemortality rates in a temperate forest. EcologyLetters 10:909–916.
Walter, H., and H. Lieth. 1967. Klimadiagramm-Weltatlas. Gustav Fischer Verlag, Jena, Germany.
Williams, J. W., and S. T. Jackson. 2007. Novel climates,
no-analog communities, and ecological surprises.Frontiers in Ecology and the Environment 5:475–482.
Worrall, J. J., L. Egeland, T. Eager, R. A. Mask, E. W.Johnson, P. A. Kemp, and W. D. Shepperd. 2008.Rapid mortality of Populus tremuloides in south-western Colorado, USA. Forest Ecology andManagement 255:686–696.
Zapater, M., C. Hossann, N. Breda, C. Brechet, D.Bonal, and A. Granier. 2011. Evidence of hydrauliclift in a young beech and oak mixed forest using18O soil water labelling. Trees 25:885–894.
SUPPLEMENTAL MATERIAL
APPENDIX
Fig. A1. Validation of SILVA vs. survey data. 10-
years basal area development of the four experimental
sites and the forest reserve. Comparison of the surveys
1995–2005 (1978–2010 in the case of the reserve) and
SILVA simulation over 10 years (30 years in the case of
the reserve) with the average climate from 1981–2000
(DWD station Schweinfurt).
Fig. A2. Validation of LandClim vs. survey data.
Simulations were run with the actual climate (DWD
data) and results were compared to the real stands. A
dominance of beech from c. 100 years onwards and
lower biomass shares of beech in young stands and are
well reproduced.
v www.esajournals.org 17 December 2013 v Volume 4(12) v Article 145
METTE ET AL.

Fig. A3. Diameter at breast height (DBH) distribu-
tion of the 86-years-old mixed beech-oak stand in 1995
and 2005. d100 ¼ average diameter of the 100
dominant trees per hectare. The DBH distribution in
the 86-year-old stand displays that the stand structure
consists of a dominant oak layer while beech mainly
forms the subcanopy. However, the beech trees in the
upper canopy layer expand stronger than oak: From
1995 to 2005, beech d100 increased from 32.58 cm to
37.98 cm (þ5.40 cm) while oak d100 only increased
from 28.02 cm to 31.96 cm (þ3.94 cm).
Table A1. Comparison of DWD and WETTREG 2010 A1B climate data for DWD weather station Schweinfurt
from 1971 to 2000. T.a ¼ mean annual temperature, T.v ¼ mean temperature May–September (vegetation
period), Prec.a ¼ annual precipitation sum, Prec.v ¼ precipitation sum May–September (vegetation period).
Mean testing with Welch’s t-test and standard deviation testing with an F-test on the ratio of the group
variances (functions t.test and var.test in R statistics, cf. Dalgaard 2002:86–89). DWD and WETTREG values
different on a 0–0.001 error level (***), 0.05–0.1 error level (�).
Metric
Mean SD
DWD WETTREG p DWD WETTREG p
T.a (8C) 9.04 9.06 0.8703 0.72 0.32 5.705e�14(***)T.v (8C) 15.95 15.97 0.875 0.87 0.42 5.506e�11(***)Prec.a (mm) 555 589 0.0886(�) 102 84 0.1276Prec.v (mm) 261 279 0.1397 63 57 0.438
v www.esajournals.org 18 December 2013 v Volume 4(12) v Article 145
METTE ET AL.

Fig. A4. Correlation coefficients for a 16-month period from June of the year prior to growth until October of
the growth year between (a) beech and (b) oak tree-ring index curves and monthly climate data from Schweinfurt
meteorological station for the period 1959–2003. Correlations significant at the p , 0.05 level are marked with an
asterisk. Climate-growth relationships for both studied species were calculated as correlation functions between
monthly climate data from Schweinfurt climate station and the dimensionless tree-ring indices as well as the raw
ring-width data. The latter include the differences in the species’ growth levels, so possible effects of tree age and
size on the impact of climate on growth have to be regarded.
v www.esajournals.org 19 December 2013 v Volume 4(12) v Article 145
METTE ET AL.