climatological aspects of south pacific tropical cyclones ... · fig. 1. area of responsibility of...
TRANSCRIPT
CLIMATE RESEARCHClim Res
Vol. 42: 223–233, 2010doi: 10.3354/cr00912
Published online September 1
1. INTRODUCTION
In terms of both numbers of people affected andoverall financial costs, cyclones remain the mostdestructive natural hazard in the tropical South Pacific.They pose an annual threat to the livelihoods of popu-lations inhabiting the scattered nations of Oceania andregularly affect the sustainability of their small-islandeconomies. In January 2003 for example, floods causedby Cyclone Ami killed 17 people and wiped out foodcrops across northern areas of Vanua Levu Island inFiji (Terry et al. 2004); in January 1 yr later CycloneHeta wrought devastation on the tiny nation of Niue,
costing over NZ$35 million (Barnett & Ellemor 2007),equivalent to approximately double the national GDP.Fortunately, not all storm events cause such severeimpacts in the South Pacific, but these examples never-theless underscore the need to maintain current scien-tific focus on understanding tropical cyclone behav-iour. Furthermore, there is mounting evidence toindicate that some cyclone characteristics (e.g. inten-sity, rainfall) in affected ocean basins are likely tochange as sea surface temperatures rise in tandemwith enhanced greenhouse conditions (e.g. Walsh &Ryan 2000, Emanuel 2004, 2005, Knutson & Tuleya2008), while recent work suggests an increasing occur-
© Inter-Research 2010 · www.int-res.com*Email: [email protected]
Climatological aspects of South Pacific tropicalcyclones, based on analysis of the RSMC-Nadi (Fiji)
regional archive
James P. Terry1,*, Gennady Gienko2
1Department of Geography, National University of Singapore, AS2, 1 Arts Link, Kent Ridge, Singapore 1175702Department of Geomatics, School of Engineering, University of Alaska Anchorage, 3211 Providence Drive, Anchorage,
Alaska 99508-4514, USA
ABSTRACT: This study analyses the regional cyclone archive for the tropical South Pacific(160° E–120° W, 0°–25° S) maintained by the designated Regional Specialized Meteorological Centrelocated at Nadi in the Fiji Islands. The historical cyclone record was examined over 4 decades fromthe 1969–1970 cyclone season to the 2007–2008 season. Cyclogenesis origins, minimum pressures,durations and track parameters (azimuth and length) of 291 individual storms were investigated.Temporal variability in separate cyclone parameters was highly variable but not necessarily match-ing on an interannual basis. Anomalous periods of cyclone behaviour can be detected in 1976, 1981,1983, 1991, 1998, 2001–2002 and 2003. Strong and significant inter-relationships are indicatedbetween storm longevity, track length and minimum sea-level pressure (MSLP) attained, and alsobetween seasonally averaged measures of latitude of cyclone origin and the strength of the SouthernOscillation Index and Multivariate ENSO Index. Yet no overall long-term linear trends were detectedin the data, with the exception of MSLP which showed a spurious decreasing trend — a problemalready highlighted in other cyclone archives. These findings suggest that the South Pacific cyclonebasin and the islands therein will continue to experience strong but irregular interannual fluctuationsin cyclone and track characteristics. Such anomalies will remain a much more dominant feature oftemporal patterns than possibly evolving changes in long-term average cyclone activity resultingfrom climate change.
KEY WORDS: Tropical cyclones · South Pacific · Historical record · RSMC-Nadi
Resale or republication not permitted without written consent of the publisher
Clim Res 42: 223–233, 2010
rence of the most intense storms (≤945 hPa) across thewider Southern Hemisphere (Kuleshov et al. 2008).
Part of the process of investigating the (possibly)evolving nature of cyclone behaviour involves an ex-amination of records of past events (e.g. Webster et al.2005). This is not without difficulties because meaning-ful interpretation of any finding must be cautious ofbias introduced by the improving reliability of histori-cal records and the continual advancements made incyclone observation technology (Klotzbach 2006,Landsea et al. 2006). Yet as long as the deficiencies inhistorical records are recognised, then there is no needto ignore outright the information that such data setsare able to provide. Historical records will thereforeremain valuable for comparison with future observa-tions, in order to assess any change in cyclone activity(Murnane 2004).
In the present study, we are among the first to exam-ine the record of cyclones in the tropical South Pacificthat is archived by the Regional Specialized Meteoro-logical Service (RSMC) operated by the Fiji Meteoro-logical Service (FMS). The historical record main-tained by the FMS includes data on all storms from1970 to 2008. Utilising this archive, GIS tools and sim-ple statistical methods were used to examine funda-mental cyclone characteristics over the last 4 decadesof observations. The principal aim of the present studywas to present information derived from the FMSrecord on cyclone origins, durations, intensities and
various other cyclone track parameters, and then todetermine the strength of any relationships betweenthese cyclone metrics. Whether or not credible trendsand temporal variability in these parameters can beidentified was also explored. The results will thus pro-vide a set of independent observations that can becompared with findings based on alternative archivesof cyclones in the study region, of which several exist.
2. STUDY AREA
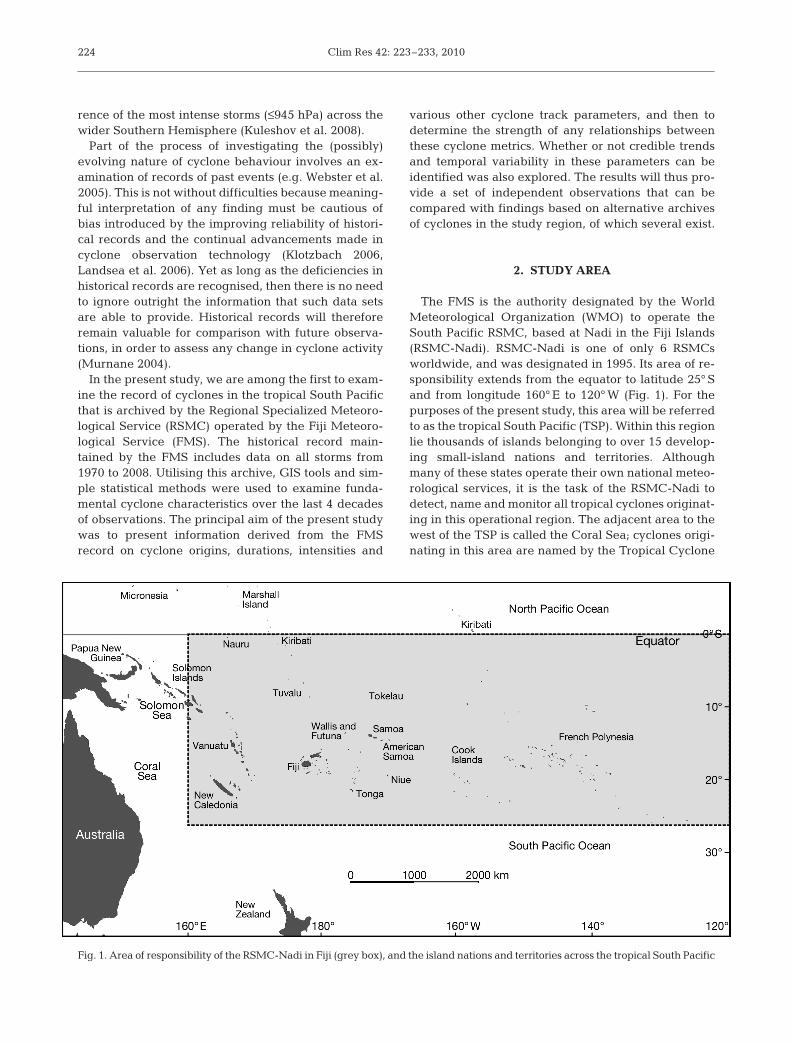
The FMS is the authority designated by the WorldMeteorological Organization (WMO) to operate theSouth Pacific RSMC, based at Nadi in the Fiji Islands(RSMC-Nadi). RSMC-Nadi is one of only 6 RSMCsworldwide, and was designated in 1995. Its area of re-sponsibility extends from the equator to latitude 25° Sand from longitude 160° E to 120° W (Fig. 1). For thepurposes of the present study, this area will be referredto as the tropical South Pacific (TSP). Within this regionlie thousands of islands belonging to over 15 develop-ing small-island nations and territories. Althoughmany of these states operate their own national meteo-rological services, it is the task of the RSMC-Nadi todetect, name and monitor all tropical cyclones originat-ing in this operational region. The adjacent area to thewest of the TSP is called the Coral Sea; cyclones origi-nating in this area are named by the Tropical Cyclone
224
Fig. 1. Area of responsibility of the RSMC-Nadi in Fiji (grey box), and the island nations and territories across the tropical South Pacific
Terry & Gienko: South Pacific tropical cyclones
Warning Centre in Brisbane, Australia (TCWC-Bris-bane), but are included in the TSP data set if they moveeast of 160° E. Similarly, the TSP data set includes in-formation on storms moving into subtropical waterssouth of 25° S, which fall under the responsibility of theTCWC in Wellington, New Zealand (TCWC-Welling-ton). The complete TSP data set is archived by the Cli-mate Services Division of the FMS.
3. METHODOLOGY
3.1 Source data
Observations of cyclones in the tropical South Pacifichave been collected for several decades by the FMS,and prior to Fiji independence in 1970 by the NewZealand Meteorological Service operating out of Nadi.Data collected during the satellite era since the late1960s have a higher degree of accuracy and reliabilitythan earlier records, so the present study utilised onlythe TSP data from 1969 onwards, when satellite obser-vations were first introduced for monitoring in the
South Pacific. The current RSMC-Nadi best track data-base for the TSP is a set of records containing thecyclone name, time stamp, position (latitude, longi-tude), sea-level pressure and wind speed recorded atfixed time intervals. While early tracking techniquesused 12 h intervals to trace cyclone positions, observa-tions since 1985 have used 6 hourly fixes to obtainmore precise positioning of storm tracks. While theessential information from 1969 until 2008 is generallycongruent (name, date, time, position, sea-level pres-sure and wind speed), various different arrangementsto store data have been used over time; Table 1 illus-trates some examples. Therefore, a decision was madeto reformat all source data into a uniform style. Thiscreated a single database containing data on 341 trop-ical storms with over 8400 individual track positionrecords, which enabled batch processing using bothuniversal programming tools and statistical analysispackages.
Data pre-processing highlighted several problemsrelated to errors in the source data. Two main types oferrors occurred, namely wrong location and missingdata. In response, several steps and iterations were
225
NAME DATE TIME POSITION MAX PPPADA 03-JAN-1970 00:00Z 16.0° S, 165.0° E) 30 997ADA 03-JAN-1970 12:00Z (16.2° S, 163.6° E) 30 997
NAME DATE TIME LAT LONG PPP MAXWALLY_1979 1980 04 02 0000 14.3 –179.5 997.0 30WALLY_1979 1980 04 02 1200 15.0 179.5 997.0 30
NAME DATE TIME LAT LONG PPP MAXVIOLET_19043 1995 03 03 0000 15.5 151.0 997.0 30VIOLET_19043 1995 03 03 0600 15.8 152.0 995.0 35
NAME DATE TIME LAT LONG PPP MAXCORA_BT_19082 1998 12 21 0000 14.0 –173.5 1002.0 25CORA_BT_19082 1998 12 21 0600 14.3 –173.8 1002.0 25
=============++++++++++++===================================NAME YYYY MM DD HHHH LAT LONG PRES W(KT) Category=========================++++++++++++=======================Tropical Depression (TD) PhaseTAM 2006 01 11 1200 14.0 179.5 997 30TAM 2006 01 11 1800 14.2 –179.6 996 30TC PhaseNamed by RSMC NadiTAM 2006 01 12 0000 14.5 –178.5 995 35TAM 2006 01 12 0600 14.8 –177.4 990 40
Table 1. Storm best track data formats in the RSMC-Nadi record: examples of header and first 2 data rows. TIME and HHHH:time for position fix; PPP and PRES: central pressure (hPa); MAX and W(KT): maximum sustained windspeed (knots); TC: tropicalcyclone; Category: TC category assigned by meteorologist on duty. Original columns containing no relevant data have beenomitted. Some TC names in records contain season (year) (example: WALLY_1979 ), some do not. Some records contain numeri-cal values with information about year/season in implicit form (example: CORA_BT_19082). Date, time and position formats arenot consistent and change through databases. The RSMC-Nadi databases contain manually inserted records such as ‘Tropical
Depression (TD) Phase’ or ‘Named by RSMC Nadi’, so filtering non-digital data is needed

Clim Res 42: 223–233, 2010
developed for data checking and correction. Consis-tency of date/time stamps and geographic coordinateswere checked automatically by programming appro-priate scripts. Random errors in geographic locations oftracks are harder to identify using automatedapproaches, so visual inspection of cyclone plots wasused to spot suspicious tracks and particular fixes.These were checked against an alternative recordmaintained by TCWC-Wellington. The most challeng-ing task involved processing cyclone tracks registeredby 2 authorities at the same time (e.g. RSMC-Nadi andTCWC-Wellington). Such situations occured whencyclones originated within one area of responsibilitybut then travelled into an adjacent area, e.g. by cross-ing 160° E or 25° S. To complete the whole tracks forsuch cyclones, records from 2 complementary data setswere cross-checked and then merged.
3.2 Defining cyclone tracks within the study area
Two criteria were used for the selection of stormtracks for analysis from the comprehensive RSMC-Nadi data set: (1) entry into the TSP study area and (2)attainment of cyclone intensity. The first criterion waseasily determined using GIS tools to filter out thosestorms that formed in the Coral or Solomon Seas butdid not cross 160° E. Fig. 2 illustrates the combinationsof possible track positions relative to the study area,showing those that were selected or filtered. For thesecond criterion, phases of tropical cyclone intensityare normally defined by sustained wind speed at eachrecorded fix along a cyclone track. While particulars ofcyclone phases and corresponding intensity classifica-tions vary for different ocean basins (see BoM 2009 fordetails), most approaches define the starting point of a
226
Fig. 2. Variations of cyclone track possibilities that are either entirely within, or that cross, the tropical South Pacific (TSP) study area, showing tracks used in the present study (left) and those filtered out (right)

Terry & Gienko: South Pacific tropical cyclones
tropical cyclone (TC phase) when the sustained windspeed reaches 34 knots (Terry 2007).
For the RSMC-Nadi data set, sustained wind speedrepresents 10 min averages and is recorded in 5 knotincrements. Thus 35 knots (the closest value to 34knots) was chosen as the threshold to identify the gen-esis for each cyclone in consideration. At lower windspeeds, a migratory storm is termed a tropical depres-sion or tropical disturbance (TD). Sections of tracks inearly or late depressional phases of a cyclone weretherefore excluded from analysis. For 150 cyclones, thefirst recorded track position already had wind speeds≥ 35 knots, the common reason being that storms oftenhave a rapid development stage and thus mature fromtheir TD to TC phase in less than the 6 h interval usedto record storm location. In these cases the cyclogene-sis position is counted as the first available record.
By analogy with the start point, the decay point oftropical cyclones should be defined when the windspeed eases below 34 knots. In practice, we decidedagainst using the mathematically closest recordedvalue (35 knots) as the threshold, as at this wind speedthe storm is still in a cyclonic phase. Instead, for stormswhich decayed within the study area, the last readingof 30 knots was used to identify the end of the cyclonetrack. Surprisingly, records of 75 cyclones finished atwind speeds of 40 knots or more at the last registeredposition. This is either because individual stormsdecayed rapidly to the TD phase in ≤ 6 h, or had movedinto open waters away from populated islands, so theRSMC-Nadi forecasters ceased formal operationaltracking. In these cases, the final registered fix of thecyclone was used to mark the end of the track.
For those storms that migrated beyond the southernboundary of the TSP area (25° S) while maintainingwind speed above 35 knots, the final track positionwas identified as the first record immediately beyond25° S. In other words, data from the region beyond25° S are excluded from analysis. There are severalreasons why this decision was made. First, virtuallyall the islands of the developing South Pacific nationsare located above 25° S, and it is in the context oftheir vulnerability to cyclones that the present studywas undertaken. Second, cyclones moving beyond25° S are entering cooler, sub-tropical waters. Transi-tion from a tropical to an extra-tropical cyclone (ETC)occurs when the strongest winds become associatedwith the development of a southerly wind flow pat-tern into a cyclone (rather than the central cycloneenvironment itself). Although many ETCs continuefurther poleward as intense systems, they increas-ingly take on characteristics of mid-latitude depres-sions (MLDs). Yet this transition between ETC- andMLD-type systems is not always easy to distinguish.Third, the area below 25° S falls under the responsi-bility of the TCWC-Wellington, which does not rou-tinely use the same set of satellite information as theRSMC-Nadi to define best tracks or make observa-tions of pressure and wind speed. Consequently, fromthe original 341 tropical storms recorded in theRSMC-Nadi archive between 1969 and 2008, 291 ofthese eventually satisfied our selection criteria ofreaching cyclone intensity and passing through theTSP area (Fig. 3). For these cyclones, observations upto the 25° S boundary were then used for furtheranalysis.
227
Fig. 3. Tracks of all 291 tropical storms that reached cyclone status and passed through the TSP study area (dashed box) betweenthe 1969–1970 and 2007–2008 cyclone seasons. Only cyclone-intensity phases of the tracks are illustrated (≥ 35 knots), i.e. early
and late tropical depression phases are not shown

Clim Res 42: 223–233, 2010
4. RESULTS AND DISCUSSION
The traditional cyclone season in the tropical SouthPacific extends for 6 mo from November to April,although some events have occurred outside thesemonths. Our data set extends across 39 cyclone sea-sons, from 1969–1970 to 2007–2008. Within this timeframe, a total of 291 cyclones passed through the TSPstudy area; the median frequency for the TSP is 7events per season. Some additional cyclone statisticsare presented in Table 2.
4.1 Variability and trends
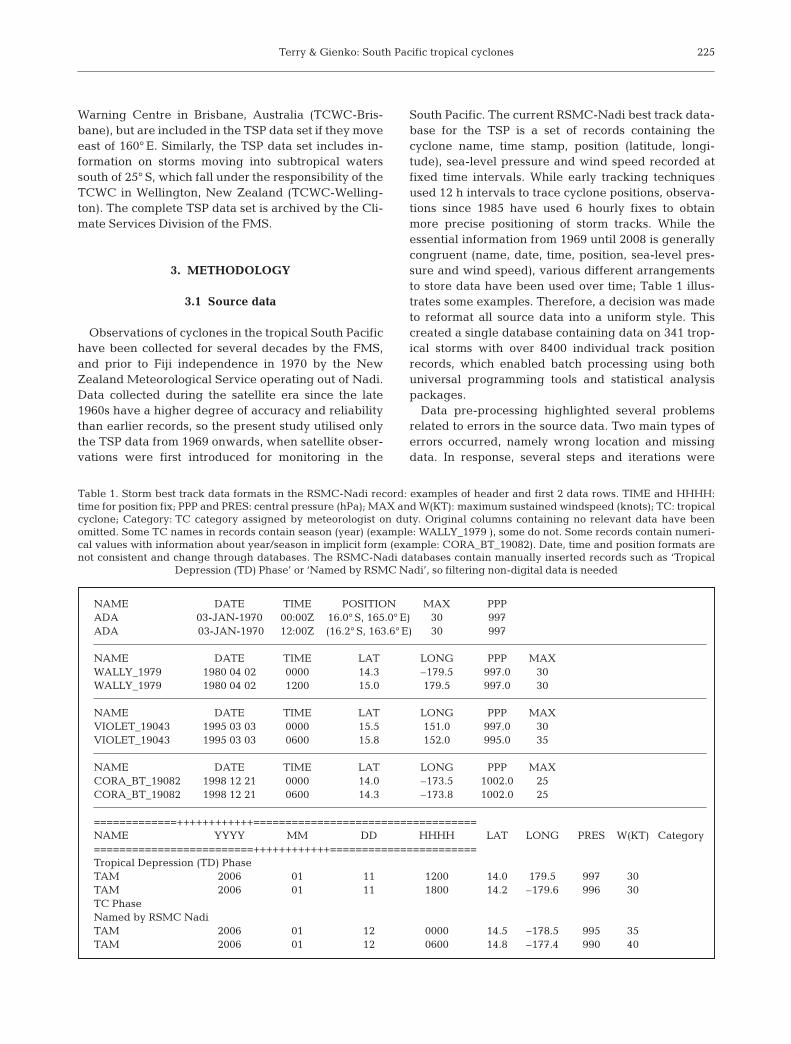
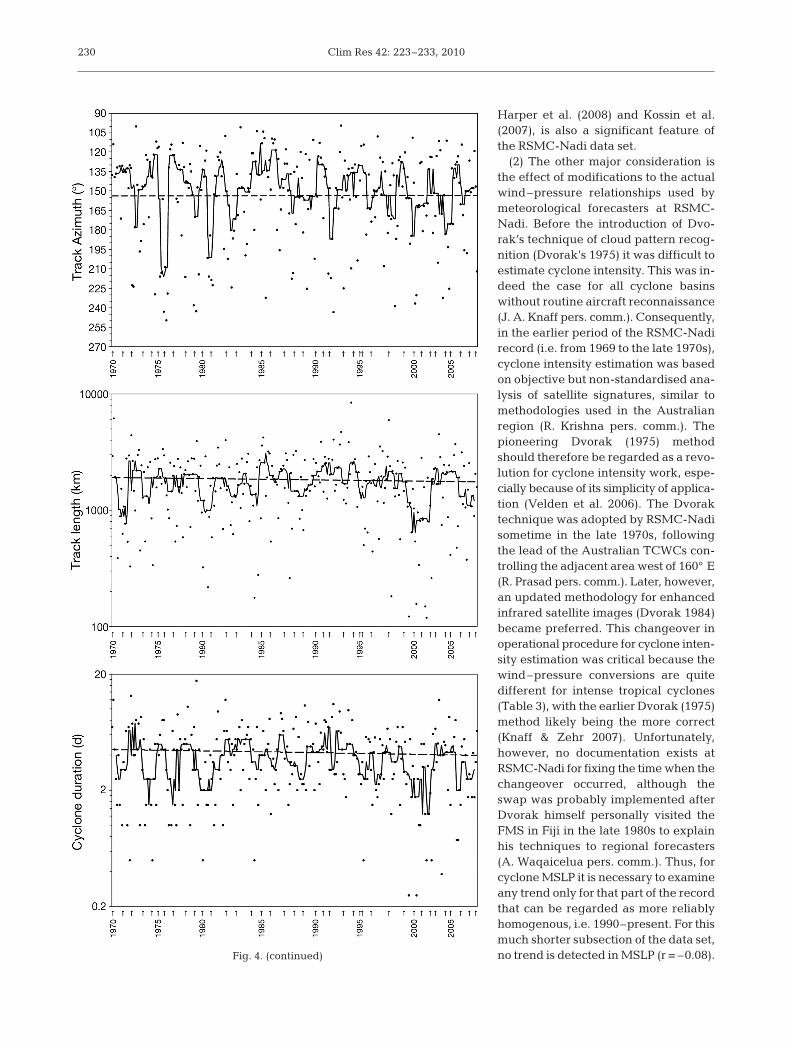
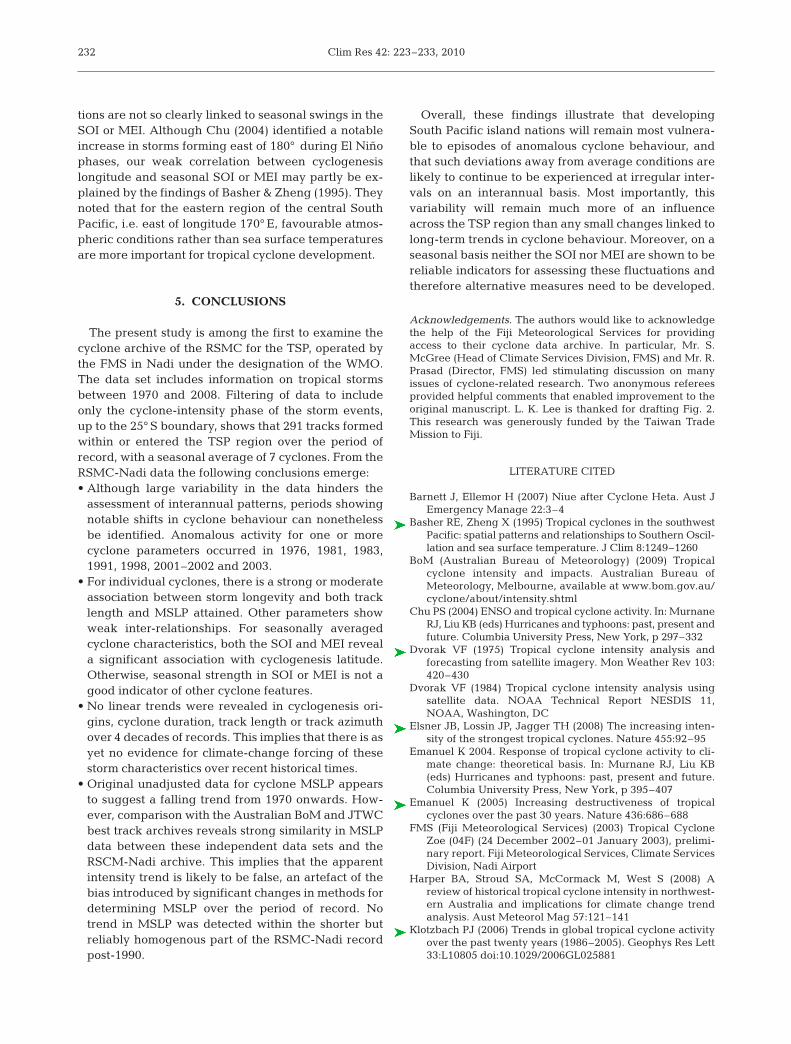
Fig. 4 illustrates all individual values of cyclone startlatitude and longitude, minimum sea-level pressure(MSLP), duration, track length and track azimuthwithin the TSP from 1970 to 2008. Since intensecyclones generally last longer than weaker systemsand are a greater threat in terms of destructive poten-tial, there is a high degree of certainty that all of themost intense storms have been captured in the record(R. Prasad pers. comm.). From Fig. 4 it is immediatelyapparent that there is very large seasonal and interan-nual variability, a problem that has already been iden-tified when attempting meaningful analysis of histori-cal data sets (Walsh 2004). Central running averages ofstorm parameters were therefore also plotted, basedon the seasonal frequency, i.e. 7 events. Running medi-ans were used in preference to running means as theyare more robust to the extreme values of some atypicalevents in the record, such as Cyclone Rewa in 1993–1994 which set unprecedented records for duration (23d) and track length (8427 km), and Cyclone Zoe in late2002 to early 2003, which plummeted to a record MSLPof 890 mb (FMS 2003). Each of the measured cycloneparameters show periods of great deviation from aver-age conditions. Of particular interest in this regard isthat although some correspondence is noticeable be-tween periods of either pronounced fluctuation or rela-
tive quiescence, there is neither a precise match indirection nor degree of variability through time. Thefollowing anomalous periods can be identified for dif-ferent parameters in the TSP area. For cyclogenesislatitude, 1991–1992 and 1998 were unusual years ofmore northerly storm origins, whereas 2000–2001experienced storm origins farther south than normal.Post-2001 appears as a phase of more steady averages.For cyclogenesis longitude, 1983 showed the largestdeviation eastwards. Track azimuth experiencedstrong swings to the west of south in 1976 and 1981.Cyclone MSLPs were exceptionally low in both 1983and 2003. Track lengths were notably longer thanusual in 1985, but both track length and cyclone dura-tion have been generally shorter than the long-termaverage since the early part of the current decade. Al-though it is beyond the scope of the present study torelate all these anomalous periods to any observedshifts in regional South Pacific climatic behaviour, thestrength of interrelationships between measured cy-clone parameters is considered in Section 4.2.
Linear trend lines have also been drawn through thedata (Fig. 4). Perhaps the most important observation isthat there is little evidence for long-term underlyingchange in the measured cyclone parameters. CycloneMSLP is apparently the single exception, which seemsto indicate a decreasing trend if plotted for the entireperiod of record (r = –0.23, p < 0.001), suggesting anestimated fall of approximately 20 mb (2%) in averagerecorded minimum cyclone pressure over the last 4decades. The question arises, however, of whether thisapparent trend is reliable. The probable answer is no;the MSLP trend based on the original RSMC-Nadi datais in all likelihood a spurious trend. There are manypotential reasons for this, but the 2 most significantinfluences are as follows.
(1) Owing to advances in available technologythrough time, there have been great strides made incyclone detection and intensity analysis. This hasundoubtedly introduced significant bias into the esti-mation of cyclone intensities and corresponding re-cords of MSLP. A valuable review of such issues fornorthern Australia cyclone data, archived by the Aus-tralian Bureau of Meteorology (BoM), has recentlybeen presented by Harper et al. (2008). They argueconvincingly that the level of so-called instrumentalbias, i.e. bias in intensity records due to improvingtools (against an assumed constant climatology), isprobably on the order of 35% underestimation ofcyclone intensity in 1969 and 10% underestimation in1980. Such effects declined in the BoM record after theregular use of geostationary meteorological satelliteimagery in the early-mid 1980s. Similarly, to addressproblems of data inconsistencies, Kossin et al. (2007)performed a reanalysis of global satellite data to create
228
Parameter Median Range
Seasonal frequency 7 2–16Start latitude (°S) 14.7 6.1–25.0Start longitude (°E) 175.0 139.2–227.3MSLP (mb) 975 890–996Duration (d) 3.75 0.25–23.0Track length (km) 1688 119–8472Track azimuth (°) 147.4 65.7–276.0
Table 2. Summary cyclone characteristics from the 1969–1970to 2007–2008 seasons within the tropical South Pacific (to25° S), derived from the RSMC-Nadi best track database.
MSLP: minimum sea-level pressure
Terry & Gienko: South Pacific tropical cyclones
a new homogenous archive. By exam-ining hurricane (cyclone) intensityfrom the homogenised record, theyreached the conclusion that some ofthe existing data sets may containspurious or inflated trends. Thus aninstrumental bias can reasonably beexpected to also afflict the RSMC-Nadi archive data, perhaps continu-ing into the mid-1990s when the useof QuikSCAT orbiting satelliteimagery became routine for windretrievals (R. Prasad pers. comm.).
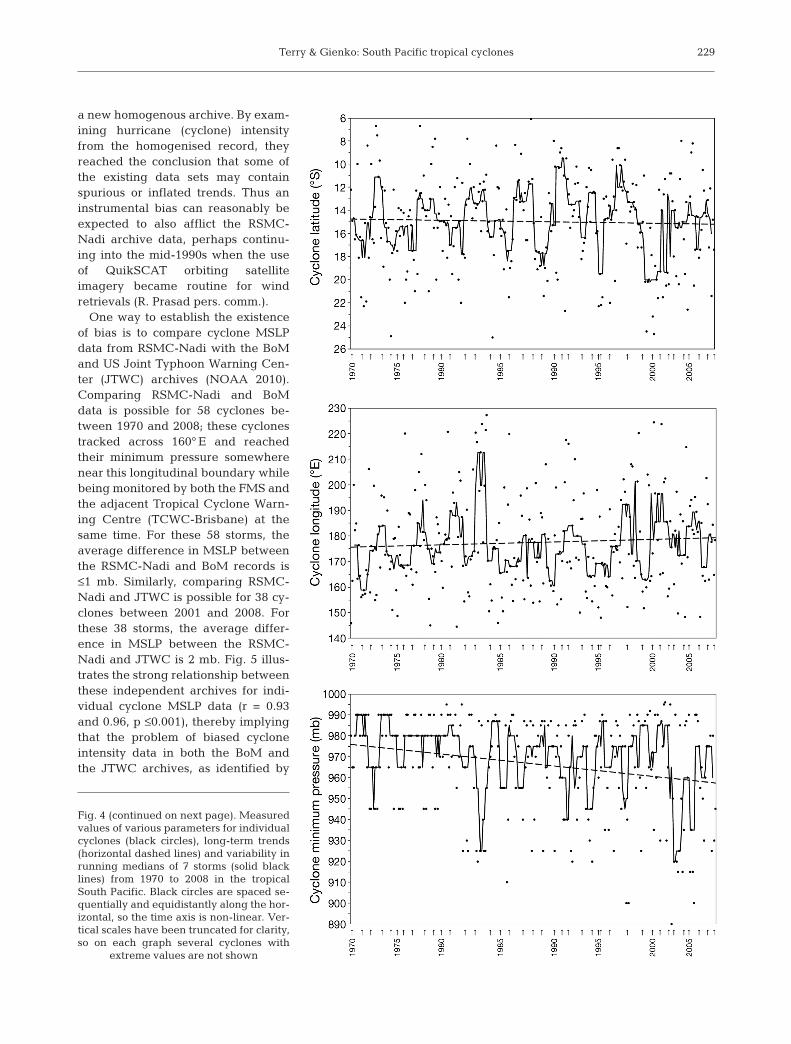
One way to establish the existenceof bias is to compare cyclone MSLPdata from RSMC-Nadi with the BoMand US Joint Typhoon Warning Cen-ter (JTWC) archives (NOAA 2010).Comparing RSMC-Nadi and BoMdata is possible for 58 cyclones be-tween 1970 and 2008; these cyclonestracked across 160° E and reachedtheir minimum pressure somewherenear this longitudinal boundary whilebeing monitored by both the FMS andthe adjacent Tropical Cyclone Warn-ing Centre (TCWC-Brisbane) at thesame time. For these 58 storms, theaverage difference in MSLP betweenthe RSMC-Nadi and BoM records is≤1 mb. Similarly, comparing RSMC-Nadi and JTWC is possible for 38 cy-clones between 2001 and 2008. Forthese 38 storms, the average differ-ence in MSLP between the RSMC-Nadi and JTWC is 2 mb. Fig. 5 illus-trates the strong relationship betweenthese independent archives for indi-vidual cyclone MSLP data (r = 0.93and 0.96, p ≤0.001), thereby implyingthat the problem of biased cycloneintensity data in both the BoM andthe JTWC archives, as identified by
229
Fig. 4 (continued on next page). Measuredvalues of various parameters for individualcyclones (black circles), long-term trends(horizontal dashed lines) and variability inrunning medians of 7 storms (solid blacklines) from 1970 to 2008 in the tropicalSouth Pacific. Black circles are spaced se-quentially and equidistantly along the hor-izontal, so the time axis is non-linear. Ver-tical scales have been truncated for clarity,so on each graph several cyclones with
extreme values are not shown
Clim Res 42: 223–233, 2010
Harper et al. (2008) and Kossin et al.(2007), is also a significant feature ofthe RSMC-Nadi data set.
(2) The other major consideration isthe effect of modifications to the actualwind–pressure relationships used bymeteorological forecasters at RSMC-Nadi. Before the introduction of Dvo-rak’s technique of cloud pattern recog-nition (Dvorak’s 1975) it was difficult toestimate cyclone intensity. This was in-deed the case for all cyclone basinswithout routine aircraft reconnaissance(J. A. Knaff pers. comm.). Consequently,in the earlier period of the RSMC-Nadirecord (i.e. from 1969 to the late 1970s),cyclone intensity estimation was basedon objective but non-standardised ana-lysis of satellite signatures, similar tomethodologies used in the Australianregion (R. Krishna pers. comm.). Thepioneering Dvorak (1975) methodshould therefore be regarded as a revo-lution for cyclone intensity work, espe-cially because of its simplicity of applica-tion (Velden et al. 2006). The Dvoraktechnique was adopted by RSMC-Nadisometime in the late 1970s, followingthe lead of the Australian TCWCs con-trolling the adjacent area west of 160° E(R. Prasad pers. comm.). Later, however,an updated methodology for enhancedinfrared satellite images (Dvorak 1984)became preferred. This changeover inoperational procedure for cyclone inten-sity estimation was critical because thewind–pressure conversions are quitedifferent for intense tropical cyclones(Table 3), with the earlier Dvorak (1975)method likely being the more correct(Knaff & Zehr 2007). Unfortunately,however, no documentation exists atRSMC-Nadi for fixing the time when thechangeover occurred, although theswap was probably implemented afterDvorak himself personally visited theFMS in Fiji in the late 1980s to explainhis techniques to regional forecasters(A. Waqaicelua pers. comm.). Thus, forcyclone MSLP it is necessary to examineany trend only for that part of the recordthat can be regarded as more reliablyhomogenous, i.e. 1990–present. For thismuch shorter subsection of the data set,no trend is detected in MSLP (r = –0.08).
230
Fig. 4. (continued)

Terry & Gienko: South Pacific tropical cyclones
Our finding therefore corroborates recent work notingthat upward trends in cyclone strength cannot be iden-tified from the JTWC best track cyclone archive (Kossinet al. 2007) and, similarly, that the most intense cyclonesin the South Pacific reveal no increase in maximum windspeed over the last 2 decades (Elsner et al. 2008).
4.2 Relationships between measured cyclonevariables
The strength of linear relationships between re-corded cyclone parameters in the RSMC-Nadi data setwas measured using simple Pearson correlation, forwhich the significance level was then determinedusing the Student’s t-statistic. Table 4 illustrates onlythose relationships that gave correlations (r) strongerthan ±0.40. As would reasonably be expected, thelength of cyclone tracks in the TSP region (to 25° S) isstrongly associated with storm duration (r = 0.83), i.e.longer-lived storms produce extended tracks. Simi-larly, MSLP shows a negative association with cycloneduration (r = –0.64 for 1990–2008), i.e. more intensesystems tend to survive longer, although no causality isimplied. Other relationships between selected cycloneparameters, such as duration, track length and latitudeof origin, all proved highly significant (p ≤ 0.001), butwere generally weak (|r | ≤ 0.57).
For the 39 cyclone seasons on record, mean values ofall the storms occurring in each season were also cal-culated. These were then correlated against the sea-sonal means of the Southern Oscillation Index (SOI)and the Multivariate ENSO Index (MEI), which in-cludes a measure of sea surface temperature (NOAA2009), averaged over the 6 mo of the TSP cyclone sea-son from November to April. As seen in Table 4, bothseasonally averaged SOI and MEI show a strong con-nection with seasonal means for the latitude of cycloneorigin (|r | = 0.69 and 0.68), but not with cyclogenesislongitude. This means that warm phases of ENSO(El Niño events) are associated with an equatorward(i.e. northward) shift in average cyclogenesis location,whereas cool phases of ENSO (La Niña events) tend togive more southerly cyclone origins. However, east-ward or westward shifts in mean cyclogenesis loca-
231
Dvorak Max. sustained Min. central pressure (hPa)CI winds (Dvorak 1975) (Dvorak 1984)number (1, 10 min.; knots)
2.0 30, 26 1003 10002.5 35, 31 999 9973.0 45, 40 994 9913.5 55, 48 988 9844.0 65, 57 981 9764.5 77, 68 973 9665.0 90, 79 964 9545.5 102, 90 954 9416.0 115, 101 942 9276.5 127, 112 929 9147.0 140, 123 915 8987.5 155, 136 900 8798.0 170, 150 884 858
Table 3. Dvorak current intensity (CI) number for tropical cy-clones, equivalent 1 and 10-minute sustained winds and com-parison minimum central pressure given by Dvorak’s (1975,1984) methodologies. Table provided by J. A. Knaff, Colorado
State University
Parameters r
Individual values (n = 291)Track length vs. duration 0.83***MSLP vs. loge durationa –0.64***MSLP vs. cyclogenesis latitudea 0.46***MSLP vs. loge track lengtha –0.57***loge duration vs. cyclogenesis latitude –0.54***loge track length vs. cyclogenesis latitude –0.48***
Seasonal mean values (n = 39)Cyclogenesis latitude vs. SOI; MEI 0.69***; –0.68***Cyclogenesis longitude vs. SOI; MEI –0.41**; 0.46**a1990–1991 to 2007–2008 data only, n = 124
Table 4. Strongest correlations between selected cycloneparameters. MSLP: minimum sea-level pressure; SOI:Southern Oscillation Index; MEI: Multivariate ENSO Index.
**p ≤ 0.01; ***p ≤ 0.001
Fig. 5. Scatter plot of minimum sea level pressure (MSLP)data for tropical cyclones recorded in the RSMC-Nadi, Aus-tralian Bureau of Meteorology (BoM) and US Joint TyphoonWarning Center (JTWC) best track archives. The graph givesan impression of the similarity or dissimilarity of the maxi-mum strength of individual cyclones recorded simultaneouslyby more than 1 centre. (d): RSMC-Nadi vs. BoM data (1970–1989, 33 storms); (s): RSMC-Nadi vs. BoM data (1990–2008,25 storms); (m): RSMC-Nadi vs. JTWC data (2001–2008, 38
storms). BoM and JTWC data are from NOAA (2010)
Clim Res 42: 223–233, 2010
tions are not so clearly linked to seasonal swings in theSOI or MEI. Although Chu (2004) identified a notableincrease in storms forming east of 180° during El Niñophases, our weak correlation between cyclogenesislongitude and seasonal SOI or MEI may partly be ex-plained by the findings of Basher & Zheng (1995). Theynoted that for the eastern region of the central SouthPacific, i.e. east of longitude 170° E, favourable atmos-pheric conditions rather than sea surface temperaturesare more important for tropical cyclone development.
5. CONCLUSIONS
The present study is among the first to examine thecyclone archive of the RSMC for the TSP, operated bythe FMS in Nadi under the designation of the WMO.The data set includes information on tropical stormsbetween 1970 and 2008. Filtering of data to includeonly the cyclone-intensity phase of the storm events,up to the 25° S boundary, shows that 291 tracks formedwithin or entered the TSP region over the period ofrecord, with a seasonal average of 7 cyclones. From theRSMC-Nadi data the following conclusions emerge:• Although large variability in the data hinders the
assessment of interannual patterns, periods showingnotable shifts in cyclone behaviour can nonethelessbe identified. Anomalous activity for one or morecyclone parameters occurred in 1976, 1981, 1983,1991, 1998, 2001–2002 and 2003.
• For individual cyclones, there is a strong or moderateassociation between storm longevity and both tracklength and MSLP attained. Other parameters showweak inter-relationships. For seasonally averagedcyclone characteristics, both the SOI and MEI reveala significant association with cyclogenesis latitude.Otherwise, seasonal strength in SOI or MEI is not agood indicator of other cyclone features.
• No linear trends were revealed in cyclogenesis ori-gins, cyclone duration, track length or track azimuthover 4 decades of records. This implies that there is asyet no evidence for climate-change forcing of thesestorm characteristics over recent historical times.
• Original unadjusted data for cyclone MSLP appearsto suggest a falling trend from 1970 onwards. How-ever, comparison with the Australian BoM and JTWCbest track archives reveals strong similarity in MSLPdata between these independent data sets and theRSCM-Nadi archive. This implies that the apparentintensity trend is likely to be false, an artefact of thebias introduced by significant changes in methods fordetermining MSLP over the period of record. Notrend in MSLP was detected within the shorter butreliably homogenous part of the RSMC-Nadi recordpost-1990.
Overall, these findings illustrate that developingSouth Pacific island nations will remain most vulnera-ble to episodes of anomalous cyclone behaviour, andthat such deviations away from average conditions arelikely to continue to be experienced at irregular inter-vals on an interannual basis. Most importantly, thisvariability will remain much more of an influenceacross the TSP region than any small changes linked tolong-term trends in cyclone behaviour. Moreover, on aseasonal basis neither the SOI nor MEI are shown to bereliable indicators for assessing these fluctuations andtherefore alternative measures need to be developed.
Acknowledgements. The authors would like to acknowledgethe help of the Fiji Meteorological Services for providingaccess to their cyclone data archive. In particular, Mr. S.McGree (Head of Climate Services Division, FMS) and Mr. R.Prasad (Director, FMS) led stimulating discussion on manyissues of cyclone-related research. Two anonymous refereesprovided helpful comments that enabled improvement to theoriginal manuscript. L. K. Lee is thanked for drafting Fig. 2.This research was generously funded by the Taiwan TradeMission to Fiji.
LITERATURE CITED
Barnett J, Ellemor H (2007) Niue after Cyclone Heta. Aust JEmergency Manage 22:3–4
Basher RE, Zheng X (1995) Tropical cyclones in the southwestPacific: spatial patterns and relationships to Southern Oscil-lation and sea surface temperature. J Clim 8:1249–1260
BoM (Australian Bureau of Meteorology) (2009) Tropicalcyclone intensity and impacts. Australian Bureau ofMeteorology, Melbourne, available at www.bom.gov.au/cyclone/about/intensity.shtml
Chu PS (2004) ENSO and tropical cyclone activity. In: MurnaneRJ, Liu KB (eds) Hurricanes and typhoons: past, present andfuture. Columbia University Press, New York, p 297–332
Dvorak VF (1975) Tropical cyclone intensity analysis andforecasting from satellite imagery. Mon Weather Rev 103:420–430
Dvorak VF (1984) Tropical cyclone intensity analysis usingsatellite data. NOAA Technical Report NESDIS 11,NOAA, Washington, DC
Elsner JB, Lossin JP, Jagger TH (2008) The increasing inten-sity of the strongest tropical cyclones. Nature 455:92–95
Emanuel K 2004. Response of tropical cyclone activity to cli-mate change: theoretical basis. In: Murnane RJ, Liu KB(eds) Hurricanes and typhoons: past, present and future.Columbia University Press, New York, p 395–407
Emanuel K (2005) Increasing destructiveness of tropicalcyclones over the past 30 years. Nature 436:686–688
FMS (Fiji Meteorological Services) (2003) Tropical CycloneZoe (04F) (24 December 2002–01 January 2003), prelimi-nary report. Fiji Meteorological Services, Climate ServicesDivision, Nadi Airport
Harper BA, Stroud SA, McCormack M, West S (2008) Areview of historical tropical cyclone intensity in northwest-ern Australia and implications for climate change trendanalysis. Aust Meteorol Mag 57:121–141
Klotzbach PJ (2006) Trends in global tropical cyclone activityover the past twenty years (1986–2005). Geophys Res Lett33:L10805 doi:10.1029/2006GL025881
232

Terry & Gienko: South Pacific tropical cyclones
Knaff JA, Zehr RM (2007) Reexamination of tropical cyclonepressure–wind relationships. Weather Forecast 22:71–88
Knutson TR, Tuleya RE (2008) Tropical cyclones and climatechange: revisiting recent studies at GFDL. In: Diaz HF,Murnane RJ (eds) Climate extremes and society. Cam-bridge University Press, Cambridge, p 120–143
Kossin JP, Knapp KR, Vimont DJ, Murnane RJ, Harper BA(2007) A globally consistent reanalysis of hurricane vari-ability and trends. Geophys Res Lett 34:L04815 doi:10.1029/2006GL028836
Kuleshov Y, Qi L, Fawcett R, Jones D (2008) On tropicalcyclone activity in the Southern Hemisphere: trends andthe ENSO connection. Geophys Res Lett 35:L14S08 doi:10.1029/2007GL032983
Landsea CW, Harper BA, Hoarau K, Knaff JA (2006) Can wedetect trends in extreme tropical cyclones? Science 313:452–454
Murnane RJ (2004) The importance of best-track data forunderstanding the past, present and future of hurricanesand typhoons. In: Murnane RJ, Liu KB (eds) Hurricanes andtyphoons: past, present and future. Columbia UniversityPress, New York, p 249–266
NOAA (2009) Multivariate ENSO Index (MEI). NOAA, Silver
Spring, MD, available at www.esrl.noaa.gov/psd/people/klaus.wolter/MEI/mei.html
NOAA (2010) International best track archive for climate stew-ardship. NOAA Satellite and Information Service and USNational Climatic Data Centre, Silver Spring, MD, avail-able at www.ncdc.noaa.gov/oa/ibtracs/index.php?name=data-access
Terry JP (2007) Tropical cyclones: climatology and impacts inthe South Pacific. Springer, New York
Terry JP, McGree S, Raj R (2004) The exceptional floods onVanua Levu Island, Fiji, during Tropical Cyclone Ami inJanuary 2003. J Nat Disaster Sci 26:27–36
Velden C, Harper B, Wells F, Beven JL and others (2006) TheDvorak tropical cyclone intensity estimation technique: asatellite-based method that has endured for over 30 years.Bull Am Meteorol Soc 87:1195–1210
Walsh KJE (2004) Tropical cyclones and climate change:unresolved issues. Clim Res 27:77–83
Walsh KJE, Ryan BF (2000) Tropical cyclone intensityincrease near Australia as a result of climate change. JClim 13:3237–3254
Webster PJ, Holland GJ, Curry JA, Chang HR (2005) Changesin tropical cyclone number, duration, and intensity in awarming environment. Science 309:1844–1846
233
Editorial responsibility: Peter Gleckler,Livermore, California, USA
Submitted: June 29, 2009; Accepted: July 20, 2010Proofs received from author(s): August 25, 2010