clinical and economic outcomes of the texas medicaid ... · clinical and economic outcomes of the...
TRANSCRIPT

Clinical and Economic Outcomes of the Texas Medicaid Medication Therapy Management (MTM) Pilot
Final Report
Submitted to the
Texas Health and Human Services Commission
Prepared by
Jamie C. Barner, Ph.D., Kenneth A. Lawson, Ph.D., Kim Roberson, R.Ph. and Tatiana Makhinova, M.S.
September 7, 2015

Medicaid MTM Pilot Program-Final Report 2
TABLE OF CONTENTS
EXECUTIVE SUMMARY………………………………………………………………………..............3
INTRODUCTION……………………………………………………………………………………………… 5
LITERATURE REVIEW……………………………………………………………………………………… 5
STUDY AIMS………………………….………………………………………………………………………..6
Objectives 1-5
METHODOLOGY…………………………………………………………………………………………….. 7
Texas Medicaid MTM Pilot Program Elements Pharmacist Providers Patient Inclusion Criteria Study Variables Data Collection and Analysis
RESULTS……………………..…………………………………………………............................... 10
1. Number and Type of Services Provided……………………………………10 2. MTM Result/Outcome and Acceptance Rate…………………………..13 3. Return on Investment and Estimated Cost Savings………………….14 4. Medicaid Claims Adherence and Costs Savings…..………….……….19
CONCLUSION……………………………………………………………………………………………….. 29
REFERENCES………………………………………………………………………………………………… 30
APPENDIX A Comprehensive Medication Review: Examples of Pharmacist Service Provision………………………………………………………………………………………. 32

Medicaid MTM Pilot Program-Final Report 3
EXECUTIVE SUMMARY H.B. 1, 82nd Legislature, Regular Session, 2011, Rider 49, directed the Health and Human Services Commission (HHSC) to implement a medication therapy management (MTM) pilot program and report on the effectiveness of the pilot to reduce adverse drug events and related medical costs for a subset of high-risk Texas Medicaid clients. HHSC contracted with The University of Texas College of Pharmacy (UT-COP) to fulfill these requirements. UT-COP subcontracted with the Texas Pharmacy Foundation for the administration of the Texas Medicaid MTM pilot program (MTM Pilot). The evaluation of the MTM Pilot aimed to determine the clinical and economic value of a community-based MTM program among Texas Medicaid recipients. Specifically, the objective was to determine if there were significant changes in resolution of medication-related problems and total healthcare costs for patients with hypertension receiving MTM services. Adult patients with hypertension and taking at least four maintenance medications were enrolled in the pilot. Trained community pharmacists collaborated with physicians and patients to establish goals for proper medication use, effective prescribing and healthy living. Pharmacists provided MTM services face-to-face or via telephone to: comprehensively review medications. They also provide patients with medication lists to share with other health care providers, develop medication action plans, intervene with patients and providers, provide referrals, document outcomes, and follow-up. Five visits were planned during the follow-up period. Medicaid claims data and participating community pharmacy MTM data were extracted. Descriptive and inferential statistics were used to address the study objectives. This report provides a summary of the MTM pilot results over the 18-month study period (April 27, 2012 to October 29, 2013) and focuses on the patient needs that precipitated the MTM intervention, the interventions that were made, and the outcomes of those interventions and cost savings. Two methods were used to assess cost savings: 1) using an algorithm created by OutcomesMTM™, which incorporates cost avoidance estimates based on the pharmacist estimates and the literature; and 2) using actual Medicaid claims for patients enrolled in the study which performed a before and after comparison of costs for certain patients enrolled in the study. For the Medicaid claims cost avoidance analysis, patients had to be continuously enrolled in Medicaid and between 18 and 63 years of age. These criteria were important to ensure complete Medicaid claims data were captured, as well as to avoid patients who may have been dually eligible for Medicare and Medicaid. At the end of the study, 29 pharmacists and 164 patients participated in the program. A total of 498 interventions were made, averaging 3.0 interventions/patient. Patient needs and pharmacist actions primarily focused on comprehensive medication reviews and resolving medication-related problems. Of the 498 pharmacist interventions, the physician/patient acceptance rate was 82.1 percent. Using an algorithm to estimate cost savings, which was developed by OutcomesMTM™, the return-on-investment (ROI) was calculated using the following formula: estimated cost savings/(pharmacists’ fees + Texas Pharmacy Foundation (TPF) administrative costs). The resulting ROI was 1.6:1. For a subset of patients who received MTM services and for whom complete Medicaid medical and prescription claims were available (N=81), there were significant mean total healthcare costs savings of $8,599.89/patient

Medicaid MTM Pilot Program-Final Report 4
resulting in total cost savings of $696,591.09. Using the same OutcomesMTM™ cost savings algorithm on this reduced dataset (N=81), ROI was 1.0:1. However, when using Medicaid claims data, cost savings (i.e., $8,599.89/patient) the ROI was 30.6:1. Cost avoidance using the Medicaid claims analysis was substantially higher than cost avoidance using the OutcomesMTM™ analysis perhaps because OutcomesMTM™ estimates are based on a decision analysis model that utilizes estimates from pharmacists and the literature rather than specific Medicaid data.

Medicaid MTM Pilot Program-Final Report 5
INTRODUCTION H.B. 1, 82nd Legislature, Regular Session, 2011, Rider 49, directed the Health and Human Services Commission (HHSC) to implement a medication therapy management (MTM) pilot program and report on the effectiveness of the pilot to reduce adverse drug events and related medical costs for a subset of high-risk Texas Medicaid clients. HHSC contracted with The University of Texas College of Pharmacy (UT-COP) to fulfill these requirements. UT-COP subcontracted with the Texas Pharmacy Foundation (TPF) for the administration of the Texas Medicaid MTM pilot program (MTM Pilot). The MTM Pilot program design and pharmacist recruitment and training were led by TPF, in collaboration with UT-COP researchers and faculty. MTM Pilot implementation (i.e., patient recruitment and enrollment and pharmacist provision of MTM services) was managed by TPF. UT-COP served as a consultant in project development and implementation, and led the program evaluation and report writing components. This report provides a literature review and summary of the MTM Pilot results for the 18-month study period (April 27, 2012 to October 29, 2013). The report outlines the patient needs that precipitated MTM intervention, the interventions that were made, and the outcome of those interventions and cost savings. LITERATURE REVIEW The Texas Medicaid program spent approximately $17.9 million on medication-related adverse drug events (ADEs) in 2009.1 Nationally, ADEs account for an estimated $177 billion annually in injury and death.2 MTM is one tool that can improve patient behaviors and outcomes, and reduce the frequency of adverse events. Several state Medicaid programs have executed MTM pilots in an effort to study the impact on clinical and economic outcomes.12 In Minnesota, a community-based MTM program produced annual cost savings of $403 per Medicaid patient.13 In Iowa, clinical outcomes were significantly improved for Medicaid patients (N=524), who were on at least four medications, without increasing total medical costs.14 In North Carolina, Medicaid beneficiaries with 12 or more medications received MTM services, which resulted in cost savings of $107 per patient per year.15 California Medicaid enrolled patients in an HIV/AIDS MTM program to improve adherence and economic outcomes. Over a three-year period, adherence increased, and there was no significant difference in total patient costs between the intervention and control groups.16 Although pharmacists were recognized as MTM providers for Medicare beneficiaries in 2005,3 studies have documented successful outcomes associated with pharmacist interventions.4-15 Inappropriate drug use and suboptimal therapy remain major challenges to optimal patient outcomes. Patients often miss doses, unilaterally stop and start therapy, create duplicate therapies by ‘doctor shopping’, or otherwise exhibit poor compliance and adherence for a myriad of reasons. These factors routinely lead to poor patient outcomes which in turn increase medical costs by precipitating the need for further evaluation, emergency department visits, hospitalizations and other costly interventions. Previous MTM programs have resulted in positive clinical and economic outcomes. The Asheville Project4 examined the impact of comprehensive medication review and patient consultations on clinical outcomes and medical costs of patients with diabetes. Clinical outcomes improved dramatically within the first 14 months. Sixty-seven percent of study participants were able to achieve a hemoglobin A1c

Medicaid MTM Pilot Program-Final Report 6
value within the normal range compared to 33 percent of patients at baseline, and 85 percent of patients exhibited at least some improvement in their A1c values. The improvement in patient A1c values correlated with a corresponding decrease in risk for retinopathy (63 percent), neuropathy (60 percent), and albuminuria (54 percent). In addition, total direct medical and indirect (sick days) costs decreased due to decreases in emergency department visits and hospitalizations. Additional Asheville studies of other disease states (asthma, hypertension, hyperlipidemia) have also shown positive outcomes when pharmacists help patients manage patients’ medications more effectively.5,6 Another study, in which a managed care organization examined ten years of MTM services, also showed positive outcomes. The authors reported 3.7 encounters per patient and a 1.3:1 return on investment for the services.7 Several medication management programs have been sponsored by the American Pharmacists Association Foundation. Project IMPACT (IMProving America’s Communities Together) included ambulatory care pharmacists in a variety of settings and disease states. Project IMPACT Hyperlipidemia showed that pharmacists had a significant impact on increasing patient (N=532) adherence to lipid therapy and in helping patients meet cholesterol goals.8 Project IMPACT Osteoporosis used pharmacists to screen patients for osteoporosis and to work collaboratively with other health care providers to manage their care. Of the patients who could be contacted for follow-up (N=305), 24 percent were initiated on therapy.9 Eighty community pharmacists across the nation participated in the Patient Self-Management Program (PSMP), which focused on providing medication management, education and monitoring to patients with diabetes. Program participants (N=256) had improved diabetes outcomes and $918 in health care costs per patient was saved (compared to projected costs).10 Similarly, the Diabetes Ten City Challenge (DTCC) improved patients’ (N=573) lipid, A1c and blood pressure levels, as well as reduced health care costs by $1,079 (compared to projected costs).11 STUDY AIMS The Texas Medicaid MTM Pilot program addresses an innovative shift in the practice of community pharmacists to help meet patient care needs and decrease total medical costs among patients suffering from chronic hypertension and taking several concurrent medications. This study aimed to determine the clinical and economic value of a community-based MTM program among Texas Medicaid beneficiaries. Objectives The primary objective was to determine the degree to which a comprehensive community-based MTM program involving patients with hypertension, physicians, and pharmacists can decrease total healthcare costs within the Texas Medicaid program. The secondary objectives were to assess resolution of medication-related problems and changes in healthcare costs. Specific objectives are listed below: For patients who received MTM services (N=164)
1. Describe the number and type of MTM services provided. 2. Describe the results/outcomes of the MTM intervention and the resolution/acceptance rate. 3. Assess return on investment using an algorithm to estimate cost savings.
For patients who received MTM services and had complete Medicaid claims data (N=81)

Medicaid MTM Pilot Program-Final Report 7
4. Determine differences in pre-to-post changes in adherence to antihypertensive and antidiabetic medications.
5. Determine if there were significant changes in total healthcare costs one year prior and one year post MTM intervention.
METHODOLOGY Texas Medicaid MTM Pilot Program Elements The MTM pilot is a wellness program designed to help build collaboration between physicians, pharmacists and patients with hypertension to address a spectrum of disease states including cardiovascular disease, diabetes and metabolic syndrome. The patient, pharmacist and other healthcare providers established goals for proper medication use, effective prescribing, and healthy living. The program was not intended to replace physician care but to be an adjunct to physician office visits. The American Pharmacists Association (APhA) and the National Association of Chain Drug Stores (NACDS) developed a framework for providing optimal MTM services in community pharmacy settings. The framework consists of five core components (shown below), which are designed to increase patient and healthcare provider communication, enhance healthcare provider collaboration, and improve medication management.17 Core Elements17 of the MTM Pilot included (see Appendix A): • Comprehensive medication reviews that included pharmacists screening for adverse drug reactions,
drug interactions, and appropriateness of therapy, also assessing medication therapy outcomes, and targeting clinical goals.
• Personal patient medical records containing a personalized list of medications (name, dose, administration, etc.) were provided to patients to be shared with all healthcare providers.
• Medication-related action plans that were individualized and may have included strategies to improve medication adherence, manage side effects, identify and avoid triggers. These plans also included personalized follow-up information for patients.
• Pharmacist interventions that included patient education on medications and basic health and lifestyle modifications as needed. In addition, pharmacists provided therapy recommendations and updates to appropriate healthcare providers when needed.
• Documentation and follow-up, which are key to facilitating communication among providers and promoting continuity of care.
Participants were targeted to receive five pharmacist consultations, which included: • An initial in-person visit for an estimated duration of 50-60 minutes focused on compiling a detailed
medication profile/medication history and performing a comprehensive medication review. After this visit, a 10-20 minute telephone meeting occurred within two weeks of the initial visit to follow up on the discussion and interventions initiated during the initial visit.
• A second in-person consultation to discuss patient education regarding adherence, compliance, and the importance of proper medication use.
• Subsequent follow-ups conducted via telephone or in-person at approximately one-month intervals.

Medicaid MTM Pilot Program-Final Report 8
Pharmacist Providers MTM Pilot providers were pharmacists in independent, chain and ambulatory care community pharmacies in Texas. Pilot sites had semi-private counseling areas and emergency facilities located within a reasonable distance. Prior to enrolling, all pharmacists received training on MTM provision. Patient Inclusion Criteria • Texas Medicaid recipients (with an enrollment goal of 150 intervention patients) • Ages of 18 to 63 • Hypertension diagnosis • Minimum of four maintenance medications • Continuous Medicaid enrollment one year prior to and one year after study enrollment (Objectives 4
and 5 only) Study Variables To determine the impact of MTM services on outcomes, a one-group pre-post intervention was utilized. The data were collected from Medicaid and community pharmacy records and included health care costs, number and type of medication-related problems, medical conditions, total number of medications, and demographics and pharmacy-related information.
Dependent Variables • Resolution/acceptance rate of MTM interventions:
o Number of interventions receiving physician and patient acceptance/total number of interventions
• Change in Total Health Care (HC) Costs from baseline to follow-up o Total HC costs 1 year pre MTM - Total HC costs 1 year post MTM
• Return on Investment o Cost savings (avoidance) / (Pharmacists’ fees + Texas Pharmacy Foundation administrative
costs)
Primary Independent Variable • MTM intervention Other Variables • Demographics Data Collection and Analysis Based on careful evaluation and review of existing systems that pharmacists use to manage and document MTM services, OutcomesMTMTM was selected because most participating pharmacists were already registered with and users of OutcomesMTMTM. This broad availability and acceptance helped to avoid additional software purchases and training time. Pharmacists were able to integrate the platform with their dispensing software, which facilitated documentation of MTM interventions and outcomes. OutcomesMTMTM is designed to guide pharmacists through the MTM process with relevant prompts and

Medicaid MTM Pilot Program-Final Report 9
recommendations to facilitate medication management. In addition, OutcomesMTMTM developed an economic model that provides a return-on-investment (ROI) or estimated cost avoidance (ECA) of pharmacists’ MTM interventions and outcomes. After meeting with a patient, the pharmacist assigned an outcome level ranging from 1-7, which corresponded to OutcomesMTM’s estimation of ECA based on the interventions provided to the patient. For Level 2, Average Wholesale Price (AWP) of the drugs involved was used. For Levels 3-6, OutcomesMTMTM used a cost-of-illness study on drug morbidity and mortality18 as the basis for the ECA values (Note: these values are updated annually based on the medical consumer price index). OutcomesMTMTM pharmacists audited the documentation and determined if the outcome level was accurate. See Table 1 for an explanation of how ECA values were derived. In addition to using OutcomesMTMTM ECA, this study also utilized Medicaid healthcare claims data to assess changes in costs 1 year pre and 1 year post-intervention, resulting in Medicaid Cost Avoidance (MCA). Because OutcomesMTMTM was chosen as the documentation software, it was used in addition to examine actual Medicaid claims data. Both are reliable methods for calculating return-on-investment. OutcomesMTMTM has the advantage of aligning a specific pharmacist intervention with a pre-specified cost-savings amount. One disadvantage of the OutcomesMTM model may be that the estimate does not adjust upward for risk (i.e., recognize that costs may be higher and differ in underserved populations). Utilizing actual Medicaid data captures actual patient costs. However, the changes in costs may not necessarily be solely due to interventions provided by pharmacists in this pilot study.

Medicaid MTM Pilot Program-Final Report 10
Table 1. Description of estimated cost avoidance used in the OutcomesMTMTM analysis
Outcome Levels Assigned by Pharmacists
Pharmacist Interventions Estimated Cost Avoidance ($)
Level 1 Improved quality of care
• Provided Comprehensive Medication Reviews (CMRs) with patient
• Provided patient education and monitoring
$0
Level 2 Avoided drug product costs
• Consulted with prescriber
• Recommended more cost-effective therapy
• Identified unnecessary
therapy • Identified excessive
dose or duration of therapy
Varies: calculated based on drug product savings using Average Wholesale Price (AWP)
Level 3 Avoided additional physician visit • Consulted with
prescriber for drug therapy problem resolution
• Consulted with patient for non-compliance
OutcomesMTMTM estimated cost savings based on cost-of-illness study18 (costs adjusted to current dollars using medical consumer price index (CPI))
Level 4 Avoided additional prescription order Level 5 Avoided emergency department visit Level 6 Avoided hospital admission Level 7 Avoided life-threatening event
RESULTS Throughout the 18-month study period (April 27, 2012 to October 29, 2013), 29 pharmacists participated and 164 patients were enrolled, which surpassed our target sample size of 150 patients. For Objectives 1-3, all patients who received MTM services (N=164) were included. Objective 1: Describe the number and type of MTM services provided The following is a summary of Objective 1 results and focuses on the patient needs that precipitated the MTM intervention and the interventions that were made.
Tables 2-4 detail intervention reasons (i.e., medication-related problems identified), pharmacists’ actions and the results (outcomes) of those actions, which were documented by the study pharmacists. For the 164 patients enrolled, 498 claims were submitted for an average of 3.0 claims per patient.

Medicaid MTM Pilot Program-Final Report 11
Among included patients, the majority had one to two pharmacist visits (72.5 percent); 35 (21.3 percent) had three or four pharmacist visits; and 10 (6.1 percent) had five to seven pharmacist visits. Intervention Reason The most frequent (35.7 percent) patient need was help with managing their complex drug therapy during a comprehensive medication review (CMR). According to the National MTM Advisory Board, a CMR is a review of all patient medications (prescription, herbal, over-the-counter) with the goals of identifying and resolving medication-related problems by engaging, educating, and empowering the patient. These encounters typically involved pharmacists reviewing patient medications and identifying and prioritizing the most important issues for intervening. See Table 2 for frequencies and below for examples of pharmacists’ documentation of patient encounters related to complex drug therapy.
Example 1: “Patient explained during CMR that he is currently being given weekly dexamethasone shots in the doctor's office. Because of the patient's diabetes, this is not recommended. Use of a steroid long term could cause the patient to experience hyperglycemia, and therefore affect his A1c, causing it to increase. Would recommend discontinuation of the injection or optimizing patient's diabetic medications if the dexamethasone injection is necessary or another medication could provide the treatment needed for the patient. Doctor accepted the above recommendation, and discontinued the dexamethasone injections. With this discontinuation of dexamethasone injections, his A1c will remain at goal (assuming continued compliance of his antidiabetic medication), and will not require either a new agent to control his diabetes or an increase in dose due to hyperglycemia that would have occurred due to long term use of the injections.” Example 2: “Met with patient in person to participate in comprehensive medication review. We discussed patient's goals and discovered convenience and comfort were patient's priorities. Patient discussed her disease states and we went through each medication in name, purpose, directions, and side effects. In total, we went through 22 medications. Currently, we are in the process of contacting the physician in order to make changes in regards to patient's insulin and duplication of medication therapy.”
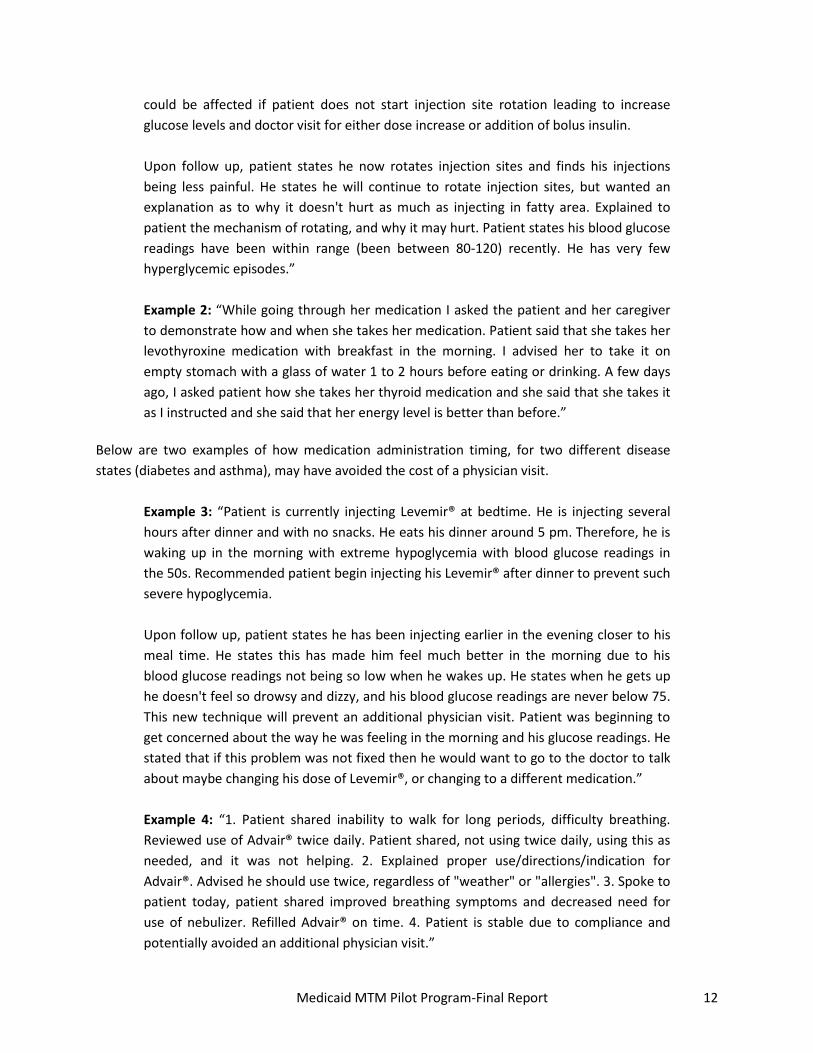
The second most frequent (18.9 percent) issue was medication timing and use of devices for administering medications. Example 1 below involves educating a patient on the importance of rotating insulin injection sites, while Example 2 below shows how timing with a medication used for a thyroid disorder helped the patient improve her energy levels.
Example 1: “Patient reported fatty area at injection site. Patient not rotating injection site for Lantus® administration. Explained importance of rotating sites to reduce risk of lipodystrophy and improve drug absorption. If lipodystrophy occurs, drug absorption
Medicaid MTM Pilot Program-Final Report 12
could be affected if patient does not start injection site rotation leading to increase glucose levels and doctor visit for either dose increase or addition of bolus insulin. Upon follow up, patient states he now rotates injection sites and finds his injections being less painful. He states he will continue to rotate injection sites, but wanted an explanation as to why it doesn't hurt as much as injecting in fatty area. Explained to patient the mechanism of rotating, and why it may hurt. Patient states his blood glucose readings have been within range (been between 80-120) recently. He has very few hyperglycemic episodes.” Example 2: “While going through her medication I asked the patient and her caregiver to demonstrate how and when she takes her medication. Patient said that she takes her levothyroxine medication with breakfast in the morning. I advised her to take it on empty stomach with a glass of water 1 to 2 hours before eating or drinking. A few days ago, I asked patient how she takes her thyroid medication and she said that she takes it as I instructed and she said that her energy level is better than before.”
Below are two examples of how medication administration timing, for two different disease states (diabetes and asthma), may have avoided the cost of a physician visit.
Example 3: “Patient is currently injecting Levemir® at bedtime. He is injecting several hours after dinner and with no snacks. He eats his dinner around 5 pm. Therefore, he is waking up in the morning with extreme hypoglycemia with blood glucose readings in the 50s. Recommended patient begin injecting his Levemir® after dinner to prevent such severe hypoglycemia. Upon follow up, patient states he has been injecting earlier in the evening closer to his meal time. He states this has made him feel much better in the morning due to his blood glucose readings not being so low when he wakes up. He states when he gets up he doesn't feel so drowsy and dizzy, and his blood glucose readings are never below 75. This new technique will prevent an additional physician visit. Patient was beginning to get concerned about the way he was feeling in the morning and his glucose readings. He stated that if this problem was not fixed then he would want to go to the doctor to talk about maybe changing his dose of Levemir®, or changing to a different medication.” Example 4: “1. Patient shared inability to walk for long periods, difficulty breathing. Reviewed use of Advair® twice daily. Patient shared, not using twice daily, using this as needed, and it was not helping. 2. Explained proper use/directions/indication for Advair®. Advised he should use twice, regardless of "weather" or "allergies". 3. Spoke to patient today, patient shared improved breathing symptoms and decreased need for use of nebulizer. Refilled Advair® on time. 4. Patient is stable due to compliance and potentially avoided an additional physician visit.”

Medicaid MTM Pilot Program-Final Report 13
The third most frequent (10.8 percent) reason for intervention was a new or change in prescription drug therapy. The vast majority of these were recommendations to add a renal protective drug to the regimens of patients who had diabetes or hypertension. This recommendation is in accordance with the American Diabetes Association guidelines, which states “All patients with diabetes and hypertension should be treated with a regimen that includes either an ACE (angiotensin converting enzyme) inhibitor or ARB (angiotensin receptor blocker).” 19 Below is an example of this type of intervention.
Example: “Patient is diabetic and is currently not taking an ACE inhibitor or ARB to provide renal protection, and to help aid in her hypertensive therapy. Patient's physician accepted the recommendation, and started the patient on valsartan/HCTZ 160/12.5 mg daily. Patient has since been taking this medication, and with this new medication prescribed by the physician via a recommendation, the patient saved herself a physician's visit and additional copay needed to see her doctor.”
Lastly, 9.6 percent of patients needed help with over-the-counter (OTC) medications. The majority of the questions pertained to multivitamins and use of acetaminophen. The patient below was educated on the negative impact of acetaminophen (Tylenol®) overuse on the liver.
Example: “Patient is currently taking OTC acetaminophen for pain. She states when she is in pain, she will take as many tablets of acetaminophen as she needs regardless of the dosing instructions indicated on the bottle. Counseled the patient on the importance of staying under 3 grams of acetaminophen daily and the possible liver toxicity that may occur from acetaminophen overdose. Upon follow up, patient stated she has been watching the amount of acetaminophen she ingests. She states that she never takes more than 6 tablets daily. She explains she now understands the importance of taking her Tylenol® correctly. Counseled patient on continuing her Tylenol® for pain, and discouraged her from any NSAID use due to her GFR (40-50 ml/min).”
Table 2. Frequency of intervention reasons a (N=498 claims; 164 patients) Intervention Reason Frequency Percent
Complex drug therapy 178 35.7 Administration/techniqueb 94 18.9 New/change prescription therapy 54 10.8 OTC therapy 48 9.6 Needs therapy 35 7.0 Underuse 20 4.0 Insufficient dose/duration 12 2.4 Unnecessary therapy 11 2.2 Drug interaction 10 2.0 Suboptimal drug selection 8 1.6 Excessive dose/duration 7 1.4 Overuse 7 1.4

Medicaid MTM Pilot Program-Final Report 14
Needs immunization 6 1.2 Adverse drug reaction 4 0.8 Cost efficacy management 4 0.8
TOTAL 498 100.0 aDocumented by study pharmacists bTime of administration or device administration technique
Pharmacists’ Actions Table 3 shows that pharmacists interacted with patients by counseling them on medication use, as well as providing them with individualized education on health and lifestyle-related issues. Almost 36 percent of the cases involved the pharmacist providing comprehensive medication reviews (CMRs), whereas 20 percent were interacting with the patients’ prescribers. Patient engagement either through consultation (24.3 percent) or education and monitoring (20.5 percent) comprised over 44 percent of pharmacist actions. All of these actions are the cornerstone of MTM interventions. Table 3. Frequency of pharmacist actionsa (N=498 claims; 164 patients)
Pharmacist Action Frequency Percent CMRb 178 35.7
Patient consultation 121 24.3
Patient education/monitoring 102 20.5
Prescriber consultation 97 19.5
TOTAL 498 100.0 aDocumented by study pharmacists bCMR- comprehensive medication review
Objective 2: Describe the results/outcomes of the MTM intervention and the resolution/acceptance
rate. Table 4 shows that the most frequent outcomes were associated with completing CMRs (30.5 percent), resolving therapeutic issues (17.7 percent) and altering patient medication administration time or device techniques (12.7 percent). Patient compliance (adherence) was the outcome for slightly over 8 percent of the interventions. All results and outcomes were documented by the pharmacists. Of the 498 problems, 409 were resolved, resulting in an 82.1 percent acceptance/resolution rate, which is much higher than previously reported overall physician acceptance rates of 50 percent.20 Of the unresolved problems (17.8 percent), some were due to patients being lost to follow-up (5.6 percent), whereas only 7.4 percent were the result of either prescriber or patient refusal.

Medicaid MTM Pilot Program-Final Report 15
Table 4. Frequency of result/outcome of MTM encounter a (N=498 claims; 164 patients)
MTM Result Frequency Percent CMRb with encounter 152 30.5
Therapeutic success (resolved/stable) 88 17.7
Altered administration/techniquec 63 12.7
Altered compliance 42 8.4
CMRb without encounter 18 3.6
Initiated new therapy 13 2.6
Discontinued therapy 8 1.6
Immunization administered 6 1.2
Altered regimen 5 1.0
Changed drug 4 0.8
Decreased dose/duration 4 0.8
Increased dose/duration 4 0.8
Initiation of cost effective therapy 2 0.4
Total Resolved 409 82.1
Three attempts/unable to reachd 28 5.6
Therapeutic failure (unresolved) 4 0.8
Pending – awaiting patient response 12 2.4
Pending – awaiting prescriber response 5 1.0
Pending- unknown 3 0.6
Prescriber refusal 20 4.0
Patient refusal 17 3.4
Total Unresolved 89 17.8
TOTAL 498 99.9e aDocumented by study pharmacists bCMR- comprehensive medication review cTime of administration or device administration technique dLost to follow-up eDid not add to 100.0 due to rounding
Objective 3: Assess return on investment using an algorithm to estimate cost savings Estimated Cost Savings Using Outcomes MTMTM
Table 5 shows the value of the MTM pilot program using the validated algorithm provided by the MTM documentation system (i.e., OutcomesMTMTM), which was described previously (Table 1). Pharmacist encounters were initially documented by the pharmacist, along with a text justification for their categorization. OutcomesMTMTM trained pharmacists reviewed the level chosen and the text to determine if the level of cost savings was justified. OutcomesMTMTM trained pharmacists either agreed with the pharmacists or they may have downgraded or upgraded the level based upon what was documented in the text provided by the study pharmacists. The levels, which were developed using the
Medicaid MTM Pilot Program-Final Report 16
OutcomesMTMTM model, were associated with an estimated cost avoidance (ECA) of additional healthcare services such as physician visits, emergency department visits or hospitalizations.
The highest percentage of pharmacists’ interventions (60.4 percent) were ultimately approved by OutcomesMTMTM pharmacists as Level 1, which was associated with improved quality of care and valued at $0 according to OutcomesMTMTM. Thus, actual cost savings may be underestimated. However, the explanations and descriptions below illustrate that although valued at $0, these Level 1 interventions are difficult to quantify but are important and meaningful to patients. Note: Study pharmacists may have initially documented their interventions at a higher level, but after auditing, they were ultimately approved by OutcomesMTMTM pharmacists as Level 1.
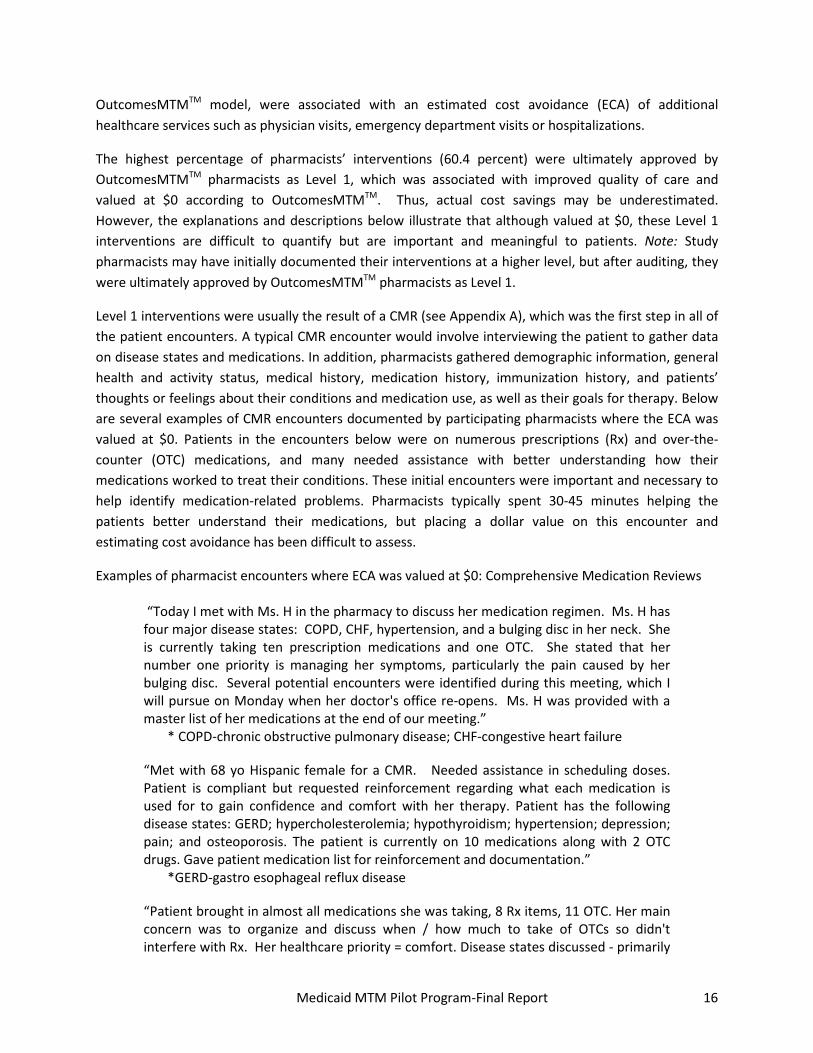
Level 1 interventions were usually the result of a CMR (see Appendix A), which was the first step in all of the patient encounters. A typical CMR encounter would involve interviewing the patient to gather data on disease states and medications. In addition, pharmacists gathered demographic information, general health and activity status, medical history, medication history, immunization history, and patients’ thoughts or feelings about their conditions and medication use, as well as their goals for therapy. Below are several examples of CMR encounters documented by participating pharmacists where the ECA was valued at $0. Patients in the encounters below were on numerous prescriptions (Rx) and over-the-counter (OTC) medications, and many needed assistance with better understanding how their medications worked to treat their conditions. These initial encounters were important and necessary to help identify medication-related problems. Pharmacists typically spent 30-45 minutes helping the patients better understand their medications, but placing a dollar value on this encounter and estimating cost avoidance has been difficult to assess.
Examples of pharmacist encounters where ECA was valued at $0: Comprehensive Medication Reviews
“Today I met with Ms. H in the pharmacy to discuss her medication regimen. Ms. H has four major disease states: COPD, CHF, hypertension, and a bulging disc in her neck. She is currently taking ten prescription medications and one OTC. She stated that her number one priority is managing her symptoms, particularly the pain caused by her bulging disc. Several potential encounters were identified during this meeting, which I will pursue on Monday when her doctor's office re-opens. Ms. H was provided with a master list of her medications at the end of our meeting.”
* COPD-chronic obstructive pulmonary disease; CHF-congestive heart failure
“Met with 68 yo Hispanic female for a CMR. Needed assistance in scheduling doses. Patient is compliant but requested reinforcement regarding what each medication is used for to gain confidence and comfort with her therapy. Patient has the following disease states: GERD; hypercholesterolemia; hypothyroidism; hypertension; depression; pain; and osteoporosis. The patient is currently on 10 medications along with 2 OTC drugs. Gave patient medication list for reinforcement and documentation.”
*GERD-gastro esophageal reflux disease
“Patient brought in almost all medications she was taking, 8 Rx items, 11 OTC. Her main concern was to organize and discuss when / how much to take of OTCs so didn't interfere with Rx. Her healthcare priority = comfort. Disease states discussed - primarily

Medicaid MTM Pilot Program-Final Report 17
focused on GI issues and hypertension. Master medication list including both RX and OTC provided. Possible DDI- will contact prescriber with recommendation. Several OTCs are duplications / unnecessary. Patient wants to talk with doctor before changing anything. Will call to discuss and schedule follow-up appointment, if needed. OTC consult needed.”
*GI-gastrointestinal; DDI-drug-drug interaction
Although the vast majority of Level 1 encounters were CMRs, other encounters focused on increasing medication adherence and identifying and resolving various adverse drug events, such as those that occur when patients have multiple doctors prescribing similar therapies (see example of pharmacist’s encounter below). Interventions such as increasing adherence rates or making recommendations that may prevent a patient from experiencing adverse effects due to duplicate therapies are beneficial to patients. However, they are not easily quantifiable in dollar amounts (i.e., ECA) because many of these issues impact quality of life and productivity.
Examples of pharmacist encounters where ECA was valued at $0: Other encounters
“I conducted a CMR face to face with MH and discovered that the patient did not have the following medications for the past 5 days: Seroquel, sertraline, glipizide, metformin and Detrol LA. She takes about 16 medications including OTC. She has about 5 major diseases. Patient and her caregiver want me to help them resolve all her medication issues such as refill request and prior authorization. I resolved her medication refill problem and prior authorization. Her blood sugar was reading over 220 and I advised her caregiver to take her to the doctor because it is not a situation I can resolve over the phone or by calling her doctor. She agreed with me and she took her to the doctor and MH was placed on Novolog 70/30 [insulin].”
Note: Pharmacist also documented that he would follow up with the patient and her doctor to make the following recommendations: weight loss program for obesity; diabetic shoe and foot care to resolve reoccurring foot fungi; and sliding scale insulin to manage diabetes. Once the pharmacist performs and documents the interventions, they could be categorized between Levels 3-6 (ECA values ranging from ~$367-$26,205-Table 5). However, the initial assessment (above) was deemed to be Level 1 ($0).
“MTM occurred face-to-face due to complex drug therapy. Patient was on multiple medications. The patient's health care priority was convenience. Patient wanted to see if she could reduce the number of medications she was taking. 13 disease states and 31 medications. At the end of the consultation, patient was recommended to stop the Lasix since she was also on furosemide 20mg. Patient was also counseled on drug interactions with hydrocodone & methadone (CNS depressant), aspirin & meloxicam (GI bleed) and losartan & K-Dur (hyperkalemia). Counseled patient about Beer’s list medications such as meloxicam, alprazolam & zolpidem. However, patient is taking the medications as needed. Lastly since patient was on multiple vitamins we recommended patient getting on Centrum in order to increase compliance. Patient was given a master med list with all the medications she was supposed to be taking. If the doctor is consulted and the medications change, patient will be given an updated med list.”

Medicaid MTM Pilot Program-Final Report 18
*CNS-central nervous system; GI-gastrointestinal
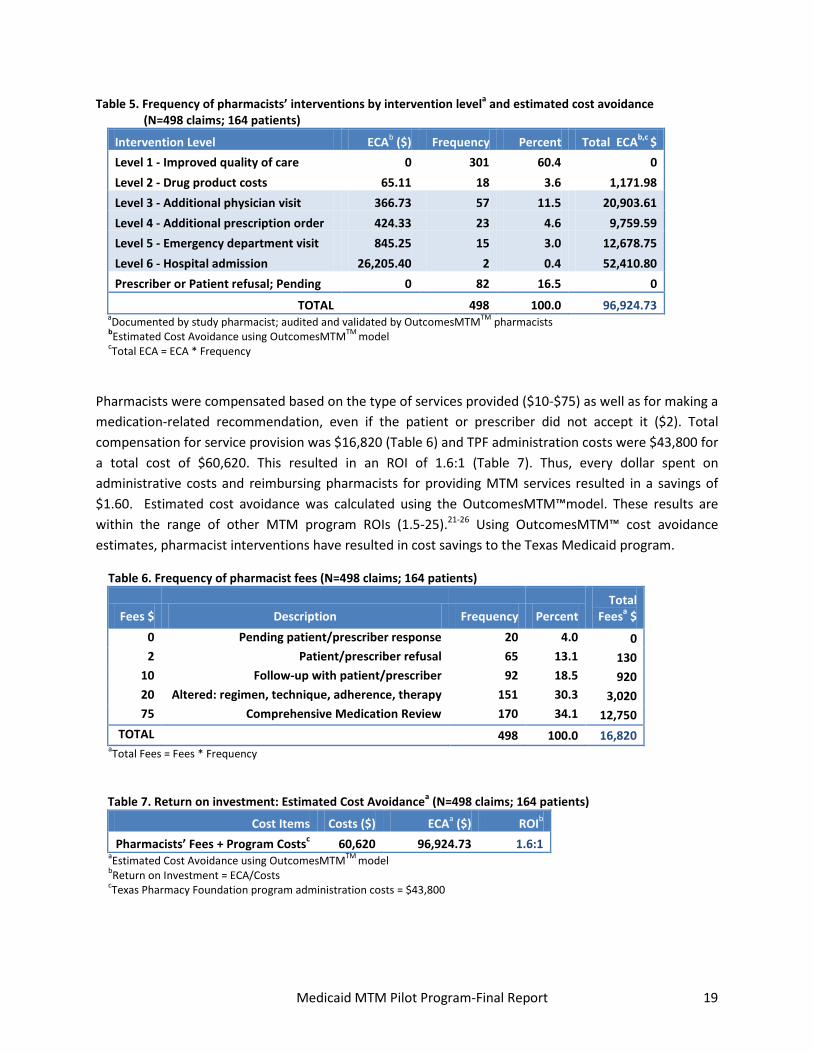
The results are very encouraging because even with valuing the majority of interventions at $0, pharmacist MTM services (Levels 1 through 6, as identified in Table 5) were estimated, using the OutcomesMTMTM model to avoid 57 physician visits, 23 additional prescriptions, 15 emergency department visits and 2 hospitalizations. The total cost avoidance of all MTM interventions was $96,925 (Table 5) for an ECA (based on Average Wholesale Price (AWP) and OutcomesMTMTM algorithm) of $195/claim submitted or $591/patient served. As mentioned previously, OutcomesMTMTM ECA for Level 2 is based on AWP of the drugs involved in the intervention. For Levels 3-6, ECAs were derived from a 1995 cost-of-illness study on drug morbidity and mortality, where inputs to the model were derived from the literature and pharmacist estimates.18 OutcomesMTMTM utilizes an updated medical consumer price index (CPI) to adjust for annual changes in cost.
Medicaid MTM Pilot Program-Final Report 19
Table 5. Frequency of pharmacists’ interventions by intervention levela and estimated cost avoidance (N=498 claims; 164 patients)
Intervention Level ECAb ($) Frequency Percent Total ECAb,c $ Level 1 - Improved quality of care 0 301 60.4 0 Level 2 - Drug product costs 65.11 18 3.6 1,171.98 Level 3 - Additional physician visit 366.73 57 11.5 20,903.61 Level 4 - Additional prescription order 424.33 23 4.6 9,759.59 Level 5 - Emergency department visit 845.25 15 3.0 12,678.75 Level 6 - Hospital admission 26,205.40 2 0.4 52,410.80 Prescriber or Patient refusal; Pending 0 82 16.5 0
TOTAL 498 100.0 96,924.73 aDocumented by study pharmacist; audited and validated by OutcomesMTMTM pharmacists bEstimated Cost Avoidance using OutcomesMTMTM model cTotal ECA = ECA * Frequency
Pharmacists were compensated based on the type of services provided ($10-$75) as well as for making a medication-related recommendation, even if the patient or prescriber did not accept it ($2). Total compensation for service provision was $16,820 (Table 6) and TPF administration costs were $43,800 for a total cost of $60,620. This resulted in an ROI of 1.6:1 (Table 7). Thus, every dollar spent on administrative costs and reimbursing pharmacists for providing MTM services resulted in a savings of $1.60. Estimated cost avoidance was calculated using the OutcomesMTM™model. These results are within the range of other MTM program ROIs (1.5-25).21-26 Using OutcomesMTM™ cost avoidance estimates, pharmacist interventions have resulted in cost savings to the Texas Medicaid program.
Table 6. Frequency of pharmacist fees (N=498 claims; 164 patients)
Fees $ Description Frequency Percent Total
Feesa $ 0 Pending patient/prescriber response 20 4.0 0 2 Patient/prescriber refusal 65 13.1 130
10 Follow-up with patient/prescriber 92 18.5 920 20 Altered: regimen, technique, adherence, therapy 151 30.3 3,020 75 Comprehensive Medication Review 170 34.1 12,750
TOTAL 498 100.0 16,820 aTotal Fees = Fees * Frequency
Table 7. Return on investment: Estimated Cost Avoidancea (N=498 claims; 164 patients)
Cost Items Costs ($) ECAa ($) ROIb Pharmacists’ Fees + Program Costsc 60,620 96,924.73 1.6:1
aEstimated Cost Avoidance using OutcomesMTMTM model bReturn on Investment = ECA/Costs cTexas Pharmacy Foundation program administration costs = $43,800

Medicaid MTM Pilot Program-Final Report 20
Demographics, Medication Adherence, Healthcare Utilization, Cost Savings and Return on Investment -Medicaid Claims Data (N=81 patients) Medicaid claims were examined and analyzed to assess changes in healthcare utilization and costs one-year pre and one-year post first MTM visit. Of the 164 patients enrolled, Texas Medicaid provided medical claims for 141 patients. Of those, 81 were continuously enrolled for the study period (inclusion criterion 5) and were less than 64 years of age at the index date. This criterion (age<64) was implemented to avoid including patients who may have turned 65 (potentially dual eligible for Medicaid and Medicare) during the follow-up period because the ability to capture Medicare healthcare claims is not available. The following is a description of the demographic characteristics and healthcare utilization analysis. Demographics Subjects who participated in the MTM pilot and had complete Medicaid claims data (N=81) were on average 50.2±9.3 years of age, predominately female (69.1%) and there was a fairly even distribution among Caucasian, African American and Hispanic participants (Tables 8-10).
Table 8. Frequency of age (N=81)
Age Group Frequency Percent ≤40 10 12.3
41-50 26 32.1
51-63 45 55.6
Mean (SD) 50.2 9.3
TOTAL 81 100.0 Table 9. Frequency of gender (N=81)
Gender Frequency Percent
Male 25 30.9
Female 56 69.1
TOTAL 81 100.0
Table 10. Frequency of race (N=81)
Race/Ethnicity Frequency Percent
Caucasian 28 34.6
African American 21 25.9
Hispanic 25 30.9
Other 7 8.6
TOTAL 81 100.0

Medicaid MTM Pilot Program-Final Report 21
Objective 4: Determine if adherence to antihypertensive and antidiabetic medications changed pre to post MTM intervention.
Medication adherence Proportion of days covered (PDC) was used to assess medication adherence changes for patients who were prescribed antihypertensive (N=64 patients) and antidiabetic (N=32 patients) medications. PDC measures the proportion of days that medications were available over the study period (i.e., 365 days). The following formula was utilized:
PDC = (Total number of days medications were available / 365 days) * 100
Both continuous and dichotomous (adherent ≥ 80 percent PDC vs. non-adherent <80 percent PDC) adherence measures were used to assess changes from pre to post MTM intervention. Paired t-tests were employed for paired continuous data to determine if differences existed between pre and post intervention group PDC mean values, and McNemar’s tests were used for paired dichotomous data to determine if differences existed in pre and post intervention group proportions of patients classified as adherent.
The results below show that there were no significant differences in adherence from pre to post MTM intervention with antihypertensive (Tables 11-12) or antidiabetic (Tables 13-14) medications. Although no differences were shown, mean adherence rates at post-index were acceptable at 71.9 percent for hypertension and 74.6 percent for diabetes. PDC measures assessed whether or not the patient had an antihypertensive or an antidiabetic medication available. This measure did not assess whether patients may have discontinued therapies such as decreasing from 3 medications to 2 medications as directed by a provider or whether the issue was due to adherence. When examining MTM encounter results/outcomes (Table 4), only 8.4 percent were changes in adherence behaviors. Thus, it is not surprising that no significant differences were observed with regard to medication adherence.

Medicaid MTM Pilot Program-Final Report 22
Table 11. Paired t-test comparison of hypertension mean medication adherence pre vs. post MTM intervention (N=64)
Hypertension Pre-index PDCa
Mean±SD
Post-index PDCa
Mean±SD
Change Mean±SD
t-valueb p-value
Adherence (continuous) 77.1% ± 27.8% 71.9% ± 30.4% -7.5%±33.7% 1.79 0.08
a PDC = Proportion of days covered b t-value: Paired t-test was run for continuous data
Table 12. McNemar test comparison of hypertension medication adherence rate
(PDC≥80%) pre vs. post MTM intervention (N=64)
Hypertension Pre-index
N (%) Post-index
N (%) Change
% S-valueb p-value
Adherence (PDC≥80%) 43 (53.1%) 39 (48.2%) 4.9% 0.7273 0.39
a PDC = Proportion of days covered bS-value: McNemar test was run for paired dichotomous data
Table 13. Paired t-test comparison of diabetes mean medication adherence pre vs. post MTM intervention (N=32)
Diabetes Pre-index PDC Mean±SD
Post-index PDC Mean±SD
Change Mean±SD
t-valueb p-value
Adherence (continuous) 67.4% ± 31.2% 74.6% ± 31.7% 8.9%±4.1% 1.24 0.22
a PDC = Proportion of days covered b t-value: Paired t-test was run for continuous data
Table 14. McNemar test comparison of diabetes medication adherence rate (PDC≥80%) pre vs. post MTM intervention (N=32)
Diabetes Pre-index N (%)
Post-index N (%)
Change %
S-valueb p-value
Adherence (PDC ≥80%) 17 (51.5%) 23 (67.6%) 16.1% 3.000 0.08
a PDC = Proportion of days covered bS-value: McNemar test was run for paired dichotomous data

Medicaid MTM Pilot Program-Final Report 23
Objective 5: Determine if there were significant changes in total healthcare costs 1 year pre vs. 1 year post MTM intervention.
Healthcare Utilization based on Medicaid Claims Data In the previous cost avoidance analysis, OutcomesMTM™ cost avoidance estimates, which were based on a cost-of-illness study, were used. Because OutcomesMTM™ estimates were based on the literature and pharmacist estimates, they were not risk-adjusted (i.e., did not account for differences in expenditures for higher risk groups, such as high-acuity patients). For this objective, two different but acceptable methods for estimating changes in costs due to interventions are presented. OutcomesMTM™ estimates were used again to calculate ROI on the smaller subset of patients (N=81) who had complete Medicaid data for the study period. Additionally, actual changes in cost one-year before (pre) and one- year following (post) the MTM intervention were assessed using Medicaid claims data for this subpopulation. Healthcare services utilization and costs were examined for the patients one year pre and one- year post intervention using Medicaid claims data. Healthcare services included physician visits, prescriptions, emergency department (ED) visits, inpatient hospital admissions, outpatient hospital visits, laboratory services, and other services (nursing, nursing facility, home health). The number of claims and costs for each type of the service were summed and the means were calculated. Depending on data normality, various statistical tests were employed to compare paired data. Table 15 shows the detailed results, while Figures 1 and 2 show the changes from pre- to post-intervention graphically. Lastly, Figure 3 shows cost changes (savings) pre to post MTM intervention. Overall total healthcare claims decreased significantly by approximately 35 claims, on average, resulting in a total mean cost savings of almost $8,600 per patient. Significant (p<0.05) decreases in both the mean number of claims and mean costs were observed for the following: physician, ED, hospital outpatient visits, as well as other (nursing, nursing facility, home health) visits. For prescription medications and inpatient hospitalizations, the results showed a significant decrease in costs only. However, for laboratory services, there were no changes in either claims or costs. Below is a summary of the individual health care services claims and cost changes pre to post MTM intervention.
Physician Visits: For both claims and costs, physician visits decreased significantly with an average of 5.4 fewer physician visits resulting in an average of $671.60 in cost savings per patient.
Prescription Claims: Although prescription claims decreased by 12, the differences were not significant. However, costs significantly decreased by an average of $603.80 per patient.
Emergency Department (ED) Visits: For both claims and costs, ED visits decreased significantly with 1.9 fewer visits resulting in an average of $108.20 in cost savings per patient.
Inpatient Hospital (IP) Visits: Although IP visits decreased, the differences were not significant. However, costs significantly decreased by an average of $3,040.10 per patient.
Outpatient Hospital (OP) Visits: For both claims and costs, OP visits decreased significantly with 2.2 fewer OP visits resulting in an average of $372.10 in cost savings per patient.
Laboratory: Although lab claims decreased by 1.1 and costs decreased by $679.30, there were no significant differences from pre to post MTM intervention.
Other: For both claims and costs, nursing, nursing facility and home health services decreased significantly with 12.3 fewer claims resulting in an average of $3,094.50 in cost savings per patient.

Medicaid MTM Pilot Program-Final Report 24
Table 15. Paired comparisons of mean of total healthcare services claims and costs per patient pre vs. post MTM intervention (N=81)
Healthcare Service Pre-index Mean±SD
Post-index Mean±SD
Change Mean±SD Statistica p-value
Physician Visits Claims 21.3±16.2 15.9±14.4 5.4±12.2 S=7.225 <0.0001 Cost $1,907.52
±$2,531.55 $1,235.92
±$1,879.34 $671.60
±$1,691.70 S=793.5 <0.0001 Prescriptions Claims 88.9±66.5 76.9±67.7 12.0±52.5 S=350 0.0996 Cost $8,126.30
±$8,143.43 $7,522.54
±$9,850.52 $603.76
±$6,652.70 S=545.5 0.0094 Emergency Department Claims 4.7±10.7 2.8±5.7 1.9±9.8 S=268 0.0267 Cost $261.93
±$667.99 $153.77
±$342.87 $108.16
±$610.70 S=281 0.0327 Hospital (inpatient) Claims 0.7±1.5 0.4±0.9 0.3±1.6 S=73.5 0.1767 Cost $4,786.36
±$11,090.97 $1,746.22
±$4,763.04 $3,040.14
±$1,648.40 S=122.5 0.0341 Hospital (outpatient) Claims 6.5±8.4 4.3±6.9 2.2±5.5 t=3.59 0.0006 Cost $806.78
±$2,080.33 $434.69
±$973.10 $372.09
±$1,502.40 S=539 0.0020 Lab Claims 6.6±7.2 5.5±6.3 1.1±5.8 S=310.5 0.0879 Cost $1,472.01
±$4,745.60 $792.71
±$1,684.46 $679.30
±$4,441.90 S=303 0.0871 Otherb Claims 38.2±44.3 25.9±30.2 12.3±26.8 t=4.14 <0.0001 Cost $10,131.18
±$13,267.17 $7,006.34
±$9,603.92 $3,124.84
±$10,006.30 S=475 0.0112 TOTAL Claims 166.9±105.2 131.7±97.5 35.2±89.5 S=705.5 0.0004 Cost $27,492.08
±$25,387.42 $18,892.19
±$21,431.00 $8,599.89
±$19,403.00 S=837.5 <0.0001 aS statistic: Wilcoxon rank-sum test was run for paired non-normally distributed data; t statistic: Paired t-test was run for normally distributed data
bOther includes: Nursing, nursing facility, home health

Medicaid MTM Pilot Program-Final Report 25
Estimated Cost Savings and Return on Investment Using OutcomesMTMTM and Medicaid Data Additional cost savings and return on investment (ROI) results were calculated using the reduced sample (N=81). Similar to the previous calculations on the full sample (Table 5), Table 16 utilized OutcomesMTMTM estimates to calculate estimated cost avoidance (ECA). Based on these calculations, pharmacists avoided $22,274.46 in expenditures because of the MTM interventions. Pharmacists’ compensation for service provision was $8,069 (Table 17) and TPF administration costs were $14,673 for a total cost of $22,742. This resulted in an ROI of 1.0:1 (Table 18) or break even. Compared to the full sample (N=164), the ROI for the reduced sample (N=81) was lower. This may have occurred because while there were two ECA values for hospital admissions in the full sample valued at $52,410.80 total (Table 5), there were no ECA values for hospital admissions in the reduced sample.
Table 19 incorporates Medicaid claims data (total costs one-year pre-intervention to one-year post intervention) to determine ‘Medicaid cost avoidance” (MCA). Based on Medicaid data (Table 15), total mean cost savings was $8,599.89 per patient from pre to post intervention (i.e., MCA). When including TPF administration costs along with pharmacists’ fees ($14,673), total costs were $22,742, resulting in an ROI of 30.6:1 showing that for every dollar spent, 30.60 was saved. While the ROIs using the OutcomesMTMTM estimates were either break even or within the range of published studies (1.5-25),21-
26 the Medicaid Cost Avoidance (using Medicaid claims) ROI was higher (30.6:1). One possible explanation for this difference may be in estimated versus actual outcomes. As mentioned previously, it is likely that the OutcomesMTM™ estimates were not risk-adjusted, which may not reflect that Medicaid-enrolled patients have a higher likelihood of using emergency departments and hospitals for primary care or because when they present for care, their conditions may be more severe than other populations. Thus, the Medicaid healthcare data used for cost estimates may reflect these patterns of utilization. Also, OutcomesMTM™ estimates were based on assessing cost avoidance for a specific pharmacist intervention, while examining all healthcare claims one year pre vs. post using Medicaid claims cannot be solely tied to specific pharmacist interventions. Lastly, approximately 60 percent of the MTM interventions were assigned Level 1 and valued at $0 (see Tables 5 and 16: Level 1 ECA) using the OutcomesMTMTM estimates. However, for slightly over one-half of these interventions, pharmacists were compensated at $75 (see Tables 6 and 17: Fees $75 Comprehensive Medication Review). This study may not have been able to quantify the ‘true’ ROI for Level 1 encounters using the OutcomesMTMTM algorithm where the fees of $75 were not counteracted with cost savings, when in fact, pharmacists documented meaningful outcomes from service provision. Thus, ROI using the OutcomesMTMTM estimates may have been underestimated.

Medicaid MTM Pilot Program-Final Report 26
Table 16. Frequency of pharmacists’ interventions by intervention levela and estimated cost avoidance (N=227 claims; 81 patients)
Intervention Level ECAb ($) Frequency Percent Total ECAb,c $ Level 1 - Improved quality of care 0 136 62.4 0 Level 2 - Drug product costs 65.11 4 1.8 260.44 Level 3 - Additional physician visit 366.73 30 13.8 11,001.90 Level 4 - Additional prescription order 424.33 14 6.4 5,940.62 Level 5 - Emergency department visit 845.25 6 2.75 5,071.50 Level 6 - Hospital admission 26,205.40 0 0 0 Prescriber or Patient refusal; Pending 0 37 12.85 0
TOTAL 227 100.0 22,274.46 aDocumented by study pharmacist; audited and validated by OutcomesMTMTM pharmacists bEstimated Cost Avoidance using OutcomesMTMTM model cTotal ECA = ECA * Frequency
Table 17. Frequency of pharmacist fees (N=227 claims; 81 patients)
Fees $ Description Frequency Percent Total
Feesa $ 2 Patient/Prescriber Refusal; Unable to reach patient 37 16.3 74
10 Follow-up with patient/prescriber 37 16.3 370 20 Altered: regimen, technique, adherence, therapy 70 30.8 1,400 75 Comprehensive Medication Review 83 36.6 6,225
TOTAL 227 100.0 8,069 aTotal Fees = Fees * Frequency
Table 18. Return on investment: OutcomesMTMTM Estimated Cost Avoidancea(N=227 claims; 81 patients)
Cost Items Costs ($) ECAa ($) ROIb Pharmacists’ Fees + Program Costsc 22,742 22,274.46 1.0:1
aEstimated Cost Avoidance using OutcomesMTMTM model bReturn on Investment = OutcomesMTMTM ECA/Costs cTexas Pharmacy Foundation program administration costs/227 claims = $14,673
Table 19. Return on investment: Medicaid Cost Avoidancea (N=227 claims; 81 patients)
Cost Items Costs ($) MCAa ($) ROIb Pharmacists’ Fees + Program Costsc 22,742 696,591.09 30.6:1
aMedicaid Cost Avoidance (Table 15)
bReturn on Investment = MCA/Costs cTexas Pharmacy Foundation program administration costs/227 claims = $14,673

Medicaid MTM Pilot Program-Final Report 27
Table 20. Return on investment: Comparison
Sample/Claims Cost
Avoidance Pharmacists’ Fees
+ Program Costs ROIa 164/498 96,924.73b 60,620 1.6:1
81/227 22,274.46c 22,742 1.0:1 81/227 696,591.09d 22,742 30.6:1
aReturn on Investment = Cost Avoidance/Pharmacists’ Fees +Texas Pharmacy Foundation program administration costs bOutcomesMTM™ Cost Avoidance N=164 patients (Table 5)
cOutcomesMTM™ Cost Avoidance N=81 patients (Table 16)
dMedicaid Cost Avoidance (Table 15)
Figure 1. Mean number of claims per patient by healthcare service pre vs. post MTM intervention (N=81)
Abbreviations: MD=physician visits; RX=prescription; ED=emergency department; HOSP=inpatient hospital; OUTPT=outpatient hospital; LAB=laboratory; OTHER=nursing, nursing facility, home health *Denotes significant (p<0.05) difference from pre to post MTM intervention
21.3
88.9
4.7 0.7
6.5 6.6
38.2
166.9
15.9
76.9
2.8 0.4 4.3 5.5
25.9
131.7
0
20
40
60
80
100
120
140
160
180
MD RX ED HOSP OUTPT LAB OTHER TOTAL
Mea
n N
umbe
r of C
laim
s
Healthcare Service
PRE
POST
* * * * *

Medicaid MTM Pilot Program-Final Report 28
Figure 2. Mean costs per patient by healthcare service pre vs. post MTM intervention (N=81)
Abbreviations: MD=physician visits; RX=prescription; ED=emergency department; HOSP=inpatient hospital; OUTPT=outpatient hospital; LAB=laboratory; OTHER=nursing, nursing facility, home health *Denotes significant (p<0.05) difference from pre to post MTM intervention
1907.52
8126.3
261.93
4786.36
806.78 1472.01
10131.18
27492.08
1235.92
7522.54
153.77
1746.22
434.69 792.71
7,006.34
18892.19
0
5000
10000
15000
20000
25000
30000
MD RX ED HOSP OUTPT LAB OTHER TOTAL
Mea
n Co
st-(D
olla
rs $
)
Healthcare Service
PRE
POST
* * * * * * *

Medicaid MTM Pilot Program-Final Report 29
Figure 3. Mean cost savings per patient by healthcare service pre vs. post MTM intervention (N=81)
Abbreviations: MD=physician visits; RX=prescription; ED=emergency department; HOSP=inpatient hospital; OUTPT=outpatient hospital; LAB=laboratory; OTHER=nursing, nursing facility, home health *Denotes significant (p<0.05) cost savings difference from pre to post MTM intervention CONCLUSION The 18-month Texas Medicaid MTM pilot pharmacists were instrumental in identifying and intervening with patients who have hypertension and are on four or more medications. This study identified that patient need and pharmacist actions have primarily focused on comprehensive medication reviews and resolving medication-related problems, which are the cornerstone of MTM. When using cost avoidance estimates based on peer reviewed literature and pharmacists’ estimates (i.e., OutcomesMTM™), the results showed that ROI calculations were lower than when using actual Medicaid claims data. ROI calculations ranged from 1.0:1 to 30.6:1 (OutcomesMTMTM, Medicaid healthcare claims, respectively). Both scenarios show break-even or positive values, which is congruent with published literature. In conclusion this study indicates that provision of MTM services to Medicaid recipients improves patient outcomes and reduces healthcare costs. It is expected that similar results could be achieved if this type of MTM program is implemented on a larger scale.
671.6 603.76 108.16
3040.14
372.09 679.3
3124.84
8599.89
0
1000
2000
3000
4000
5000
6000
7000
8000
9000
10000
MD RX ED HOSP OUTPT LAB OTHER TOTAL
Mea
n Co
st S
avin
gs (D
olla
rs $
)
Healthcare Service * * * * * * *

Medicaid MTM Pilot Program-Final Report 30
REFERENCES 1. Legislative Budget Board. Texas State Government Effectiveness and Efficiency: Selected Issues and
Recommendations. January 2011. Accessed at http://www.lbb.state.tx.us/Documents/Publications/GEER/Government%20Effectiveness%20and%20Efficiency%20Report%202011.pdf, September 29, 2012.
2. Ernst FR, Grizzle AJ. Drug-related morbidity and mortality: updating the cost-of-illness model. J Am Pharm Assoc. 2001;41:192–9.
3. United States Centers for Medicare and Medicaid Services. Medicare prescription drug benefit final rule. Accessed at http://www.cms.hhs.gov/providerupdate/regs/CMS4068F.pdf, February 21, 2005.
4. Cranor CW, Bunting BA, Christensen DB. The Asheville Project: Long-term clinical and economic outcomes of a community pharmacy diabetes care program. J Am Pharm Assoc. 2003;43:173-84.
5. Bunting BA, Cranor CW. The Asheville Project: Long-term clinical, humanistic, and economic outcomes of a community-based medication therapy management program for asthma. J Am Pharm Assoc. 2006;46:133-47.
6. Bunting BA, Smith BH, Sutherland SE. The Ashville Project: Clinical and economic outcomes of a community-based long-term medication therapy management for hypertension and dyslipidemia. J Am Pharm Assoc. 2008;48:23-31.
7. Ramalho de Oliveira D, Brummel AR, Miller DB. Medication therapy management: 10 years of experience in a large integrated health care system. J Manag Care Pharm. 2010;16(3):185-95.
8. Bluml BM, McKenney JM, Cziraky MJ. Pharmaceutical care services and results in project IMPACT: Hyperlipidemia. J Am Pharm Assoc. 2000;40:157-65.
9. Goode JK, Swiger K, Bluml BM. Regional osteoporosis screening, referral, and monitoring program in community pharmacies: Findings from project IMPACT: Osteoporosis. J Am Pharm Assoc. 2004;44:152-60.
10. Garrett DG, Bluml BM. Patient self-management program for diabetes: first-year clinical, humanistic, and economic outcomes. J Am Pharm Assoc. 2005;45(2):130-7.
11. Fera T, Bluml BM, Ellis WM. Diabetes ten city challenge: Final economic and clinical results. J Am Pharm Assoc. 2009;49:e52-e60.
12. Daigle L, Chen D. Pharmacist provider status in 11 state health programs. Accessed at www.ashp.org/DocLibrary/Advocacy/ProviderStatusPrograms.aspx, September 15, 2012.
13. Isetts BJ, Schondelmeyer SW, Artz MB, et al. Clinical and economic outcomes of medication therapy management services: The Minnesota experience. J Am Pharm Assoc. 2008;48:203-11.
14. Chrischilles EA, Carter BL, Lund BC, et al. Evaluation of the Iowa Medicaid pharmaceutical case management program. J Am Pharm Assoc. 2004;44(3):337-49.
15. Michaels NM, Jenkins GF, Pruss DL, et al. Retrospective analysis of community pharmacists' recommendations in the North Carolina Medicaid medication therapy management program. J Am Pharm Assoc. 2010;50(3):347-53.
16. Hirsch JD, Gonzales M, Rosenquist A, et al. Antiretroviral therapy adherence, medication use, and health care costs during 3 years of a community pharmacy medication therapy management program for Medi-Cal beneficiaries with HIV/AIDS. J Manag Care Pharm. 2011;17(3);213-223.
17. American Pharmacists Association and National Association of Chain Drug Stores Foundation. Medication therapy management in pharmacy practice: Core elements of an MTM service model (Version 2.0). J Am Pharm Assoc. 2008;48:341-53.
18. Johnson JA, Bootman JL. Drug-related morbidity and mortality. A cost-of-illness model. Arch Intern Med. 1995;155(18):1949-56.
19. American Diabetes Association. Hypertension management in adults with diabetes: position statement. Diabetes Care.2004;27(suppl 1):s65-s67.

Medicaid MTM Pilot Program-Final Report 31
20. Pellegrino A, Martin M, Tilton J, Touchette D. Medication therapy management services: definitions and outcomes. Drugs. 2007;69(4):393-406.
21. Bunting BA, Smith BH, Sutherland SE. The Asheville Project: clinical and economic outcomes of a community-based long-term medication therapy management program for hypertension and dyslipidemia. J Am Pharm Assoc. 2008;48(1):23-31.
22. Isetts BJ, Schondelmeyer SW, Artz MB, et al. Clinical and economic outcomes of medication therapy management services:the Minnesota experience. J Am Pharm Assoc. 2008;48(2):203-11.
23. Johannigman MJ, Leifheit M, Bellman N, Pierce T, Marriott A, Bishop C. Medication therapy management and condition care services in a community-based employer setting. Am J Health Syst Pharm. 2010;67(16):1362-67.
24. Wittayanukorn S, Westrick SC, Hansen RA, et al. Evaluation of medication therapy management services for patients with cardiovascular disease in a self-insured employer health plan. J Manag Care Pharm. 2013;19(5):385-95.
25. Moore JM, Shartle D, Faudskar L, Matlin OS, Brennan TA. Impact of a patient-centered pharmacy program and intervention in a high-risk group. J Manag Care Pharm. 2013;19(3):228-36.
26. Truong HA, Groves CN, Congdon HB, et al. Potential cost savings of medication therapy management in safety-net clinics. J Am Pharm Assoc. 2015;55(3):269-72.

Medicaid MTM Pilot Program-Final Report 32
APPENDIX A. Comprehensive Medication Review: Examples of Pharmacist Service Provision The comprehensive medication review (CMR) is a systematic process of collecting patient-specific information, assessing medication therapies to identify medication-related problems, developing a prioritized list of medication-related problems, and creating a plan to resolve them. Services include: • Interviewing the patient to gather data including demographic information, general health and
activity status, medical history, medication history, immunization history, and patients’ thoughts or feelings about their conditions and medication use
• Assessing, on the basis of all relevant clinical information available to the pharmacist, the patient’s physical and overall health status, including current and previous diseases or conditions
• Assessing the patient’s values, preferences, quality of life, and goals of therapy • Assessing cultural issues, education level, language barriers, literacy level, and other characteristics of
the patient’s communication abilities that could affect outcomes • Assessing, identifying, and prioritizing medication related problems related to:
» The clinical appropriateness of each medication being taken by the patient, including benefit versus risk
» The appropriateness of the dose and dosing regimen of each medication, including consideration of indications, contraindications, potential adverse effects, and potential problems with concomitant medications
» Therapeutic duplication or other unnecessary medications » Adherence to the therapy » Untreated diseases or conditions » Medication cost considerations » Healthcare/medication access considerations
• Developing a plan for resolving each medication related problem identified • Providing education and training on the appropriate use of medications and monitoring devices and
the importance of medication adherence and understanding treatment goals • Coaching patients to be empowered to manage their medications • Monitoring and evaluating the patient’s response to therapy, including safety and effectiveness • Communicating appropriate information to the physician or other healthcare professionals, including
consultation on the selection of medications, suggestions to address identified medication problems, updates on the patient’s progress, and recommended follow-up care